Embed Size (px)
Citation preview
Z E S Z Y T Y N A U K O W E A K A D E M I I M A R Y N A R K I W O J E N N E J S C I E N T I F I C J O U R N A L O F P O L I S H N A V A L A C A D E M Y
2016 (LVII) 1 (204)
69
DOI: 10.5604/0860889X.1202437
K r y s t y n a M a r i a N o g a , R y s z a r d S t u d a ń s k i
E S T I M A T I O N O F N A K A G A M I D I S T R I B U T I O N P A R A M E T E R S I N D E S C R I B I N G
A F A D I N G R A D I O - C O M M U N I C A T I O N C H A N N E L
ABSTRACT
This article presents a review of issues related to the estimation of Nakagami distribution parame-
ters. This distribution is often used for modeling transmission in a fading radio-communication
channel, and in addition it well approximates other distributions.
Key words:
radio-communication fading channel, envelope probability distribution, estimation of distribution
parameters.
INTRODUCTION
During transmission a radio signal experiences random variations which
are caused by interference occurring in a transmission channel. In order to de-
scribe this interference various probabilistic models are used. The main model of
a received fading radio signal is a two-parameter distribution, e.g. the Rice distribu-
tion, and the Nakagami distribution. In order to describe a fading absolute diffuse
signal a one-parameter distribution is used, e.g. the Rayleigh distribution. The Hoyt,
Weibull one sided normal distribution, the Beckman three-parameter and four
parameter distribution [14, 15] are also often used. A transmitted signal tu when
transmitted through a radio-communication channel experiences random fading
Gdynia Maritime University, Faculty of Marine Electrical Engineering, Morska 81-87 Str.,
81-225 Gdynia, Poland; e-mail: [email protected]; [email protected]
Krystyna Maria Noga, Ryszard Studański
70 Zeszyty Naukowe AMW — Scientific Journal of PNA
tk , i.e. multiplicative and additive interference tn . A signal ty received by
a receiver is a sum of a useful signal ts and additive interference tn , that is [14]
tntttrtntutktntsty o cos , (1)
where:
r(t) 0 — useful signal envelope;
(t) — useful signal instantaneous phase;
o — mean pulsation (angular frequency).
It should be remembered that a useful signal envelope depends exclusively
on fading only in the case of signals with angular modulation. In further considera-
tions we assume that all signals and interference occurring in an analogue model of
a radio-communication channel are stationary. In addition we assume slow fading
variations in comparison with the time of one elementary signal existence. Then in
mathematical transformations we can use random variations instead of stochastic
processes.
THE NAKAGAMI DISTRIBUTION
It follows from the analysis of the literature that the Nakagami distribution
and the Rice distribution are among the most often used for modeling fading [14,
15]. The Rice distribution is often used for modeling diffuse, a multipath transmis-
sion of a harmonic signal, when a dominant signal without fading occurs on one of
the paths. This distribution is often used for modeling transmission in a satellite
channel. The Nakagami distribution describes an even wider class of fading. Let the
useful signal ts be described with the dependence
tttrts o cos , (2)
In order to describe the signal envelope ts the Nakagami distribution having
the density
212 exp
2r
mr
m
mrp m
m
(3)
is used,
Estimation of Nakagami distribution parameters…
1 (204) 2016 71
where:
— mean signal power defined as
2rE ; (4)
dttta
o
a
exp1 — function gamma [2, 3];
m — depths of fading, is the inverse of the standardized variance of the useful signal
envelope square, i.e. the inverse of the standardized mean signal power.
Parameter m is calculated with the dependence
5.022
2
rEm . (5)
The Nakagami distribution is a chi distribution, in which parameter m can
also take non-integer values. The Nakagami distribution is often referred to as dis-
tribution m.
A signal having the Nakagami envelope distribution has the following mo-
ment value of the k-order [13, 15]
k
kk
mm
km
rprrE
2
0
. (6)
The Nagami distribution approximates other distributions well. We obtain
especially:
one-sided standard distribution, when m = 0.5;
the Rayleigh distribution, when m = 1;
c) the Rice distribution (Nakagami – n), when 222 a and 42
2
am
,
where a is the dominant amplitude of a determined harmonic signal, 22 is
a variance of a narrow path signal (interference) having normal distribution of
instantaneous value and mean value equal to zero, both of the signals being com-
ponents of the Rice signal. Parameters m and of the Rice distribution can be
calculated when second order moments of the envelope are known. The depend-
ence (7) makes it possible to determine parameters of the Rice distribution using
the Nakagami distribution
22222 5.02
, ammmm
mmm
a
. (7)
Krystyna Maria Noga, Ryszard Studański
72 Zeszyty Naukowe AMW — Scientific Journal of PNA
ESTIMATION OF PARAMETERS IN NAKAGAMI DISTRIBUTION
BASED ON MEASURED DATA
In a radio-communication channel deep fading occurs. Therefore, in order
to calculate parameters in the Nakagami distribution on the basis of measured data
magnitudes proportional to the envelope logarithm (expressed in decibels) are used.
It is assumed that the logarithmic envelope v(t) is determined by the dependence
w
rtv log20 , (8)
where:
r — random variable having the Nakagami distribution;
w — reference value (base for standardization).
The variable v has the Nakagami exponential distribution of probability
density [4, 15]
K
vv
K
vvm
mK
mvp
m
00 2exp2
exp2 , (9)
where:
686.8log20 eK ;
20 log10w
v .
We assume that the reference value w . Then 00 v and logarith-
mically standardized variable nv defined as
rvn log20 (10)
has the standardized Nakagami exponential distribution of density probability [4]
K
v
K
vm
mK
mvp nn
m
n
2exp
2exp
2. (11)
The mean value, root mean square value and variable variance nv can be
calculated using the dependence [4]
mmK
vE n ln2
; (12)
Estimation of Nakagami distribution parameters…
1 (204) 2016 73
mmmK
vE n'2
22 ln
2 ; (13)
mK
vVarvVar n
'2
4 , (14)
where:
x — Euler’s psi function (digamma function), i.e. derivative logarithmic gamma
function;
x' — derivative of Euler’s psi function;
x' — derivative of gamma function [2, 3].
The parameters m and in the Nakagami distribution can be calculated
using standardized moments of the Nakagami exponential distribution. The variance
determined in (14), which is not dependent on the reference value, is the most useful
for estimating the parameter m . In the expression (14) there occurs the derivative
of Euler’s psi function. Therefore, an analytical determination of the parameter m
as a solution to the equation (14) is impossible. Function m' can be approxi-
mated using the equation
BmCm ' . (15)
Constants C and B of the approximating function can be determined using
the regression method. The accurate values of the function m' for some selected
values of m can be calculated on the basis of the dependence [3]
,....3,2,112
145.05.0
,....3,2;1
1;2
5.0;6
1
12
''
1
12
''2
'2
'
Ll
L
Ll
L
L
l
L
l
(16)
After using the regression method for the values m' calculated on the
basis of the dependence (16) and for 10...,,5.0m the following values of
the approximating function parameters were obtained 2343.1B and 6645.1C ,
that is
2343.1' 6645.1 mm . (17)
Krystyna Maria Noga, Ryszard Studański
74 Zeszyty Naukowe AMW — Scientific Journal of PNA
’(m)
m
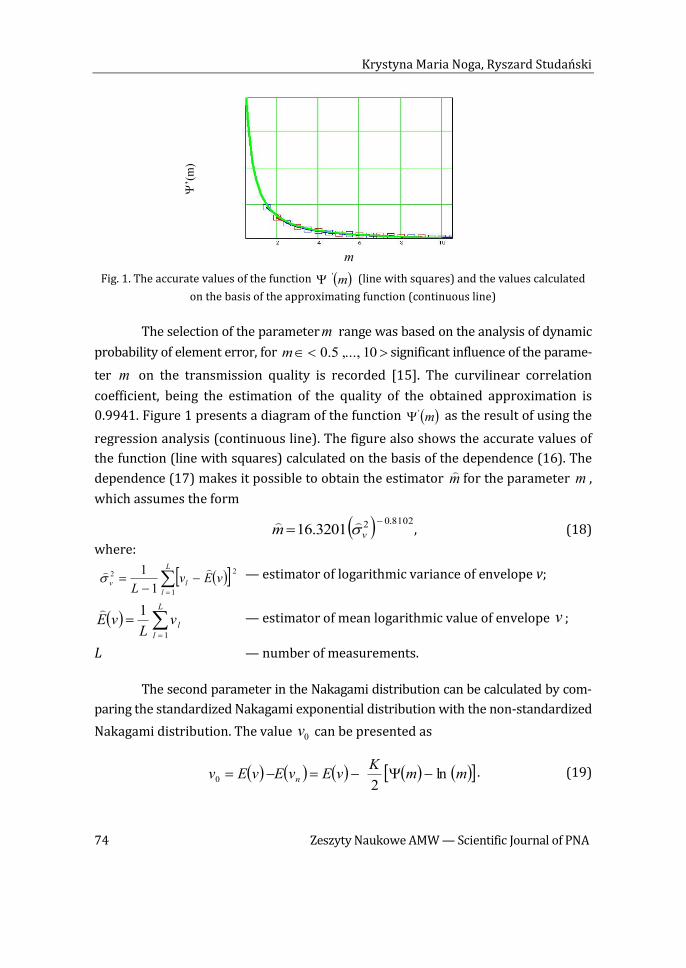
Fig. 1. The accurate values of the function m' (line with squares) and the values calculated
on the basis of the approximating function (continuous line)
The selection of the parameterm range was based on the analysis of dynamic
probability of element error, for 10,...,5.0m significant influence of the parame-
ter m on the transmission quality is recorded [15]. The curvilinear correlation
coefficient, being the estimation of the quality of the obtained approximation is
0.9941. Figure 1 presents a diagram of the function m' as the result of using the
regression analysis (continuous line). The figure also shows the accurate values of
the function (line with squares) calculated on the basis of the dependence (16). The
dependence (17) makes it possible to obtain the estimator m
for the parameter m ,
which assumes the form
8102.023201.16
vm
, (18)
where:
L
l
lv vEvL 1
22
1
1 — estimator of logarithmic variance of envelope v;
L
l
lvL
vE1
1 — estimator of mean logarithmic value of envelope v ;
L — number of measurements.
The second parameter in the Nakagami distribution can be calculated by com-
paring the standardized Nakagami exponential distribution with the non-standardized
Nakagami distribution. The value 0v can be presented as
mmK
vEvEvEv n ln2
0 . (19)
Estimation of Nakagami distribution parameters…
1 (204) 2016 75
We also use the regression method. We assume the approximation
0;ln DmDmm E . (20)
As a result of using the regression method, for the values of the function
m determined on the basis of the table [3], the following values of the approxi-
mating function parameters E = 1.0787 and D = 0.5904 were obtained. The curvi-
linear correlation coefficient is 0.9992. Taking into account the obtained result and
the equation (12) the mean value of variable nv can be written as
0787.15641.2 mvE n. (21)
Thus the value of the parameter can be calculated on the basis of the
dependence
0787.1
20 5641.2log10
mvE
wv . (22)
Using the measured data we estimate the mean value of logarithmic enve-
lopev . The estimate
of the parameter can be obtained using the following
estimator
01.02 10v
w
, (23)
where
0787.1
0 5641.2 mvEv
— estimator 0v .
The presented estimators of the Nakagami distribution parameters require
estimating the mean value and variance of envelope. Examples of somewhat different
ways, based, among others, on maximizing probability functions, were presented in
publications [1, 6–8, 11, 16, 19, 20]. For first-order approximation of function
m , i.e. mmm 2/1ln , in [7] obtained was a parameter estimator m
of the Nakagami distribution determined with the dependence
2
11m
, (24)
where
N
i
i
N
i
i rN
rN 1
2
1
2 ln11
ln .
Krystyna Maria Noga, Ryszard Studański
76 Zeszyty Naukowe AMW — Scientific Journal of PNA
And for the second-order approximation of the function m , i.e.
212/12/1ln mmmm obtained was
24
483662m
. (25)
In [1] a comparative analysis was presented for 3 different estimators of
the parameter m , which can be written as
a) for standardized estimator
224
22
znm ; where
N
i
kik r
N 1
1 , therefore 2
; (26)
b) for Tolparev-Polyakov estimator
M
MmTP
2
2
ln4
ln3
411
, where N
N
iirM1
2
; (27)
c) for Lorenz estimator
29.12
12
212
4.174.4
dBdB
dBdBLm
, where
N
i
ki
dBk r
N 1
log201
. (28)
It follows from the analysis presented in [1] that the standardized Lorenz
estimators generate similar results. The Tolparev-Polyakov estimator is convenient
for calculating where the number of measurements is small.
Another form of estimator for the parameter m in the Nakagami distribution
is presented in publications [6, 17, 18]. In order to calculate it a third-moment and
first-moment quotient was used. This quotient, after transformations and after
taking into account the dependence aaa 1 is shown as
m
m
2
1
1
3
. (29)
From the dependence (29) we obtain the following form of estimator of the
parameter m
213
21
2
tm . (30)
Estimation of Nakagami distribution parameters…
1 (204) 2016 77
In publication [6] it was shown, using numerical calculations, that the estima-
tor tm
approximates the parameter m better than the standardized estimator znm
.
In publications [6, 8, 9] further generalizations were made and another es-
timator was presented. To calculate it k order moments were used for a random
variable calculated with the dependence
pii rx , for 0;...,,2,1 pNi , (31)
k-order moment of the variable x assumes the form determined with the equation
[6, 8, 9]
p
k
pkk
mm
p
km
xE 2/
2
. (32)
Obviously for 1p we obtain a dependence for k-order of random variable
representing the Nakagami envelope, which is determined by means of the equa-
tion (6). In order to calculate the values of estimator of the parameter m the order
12 p and first order moment quotient was taken into account, that is [6]
pmxE
xE p
2
11
12
. (33)
After transformations we obtain [6]
xExEp
xEm
p 122 (34)
and a new estimator [6]
211
2
2
1
2
1
pp
pp
mp
. (35)
It follows from the analysis presented in publication [6] that the estimation
quality of the parameter m in the Nakagami distribution increases together with
the increase in the parameter p . In addition, in a special case when 5.0p we
obtain a standardized estimator, i.e. znmm
2 , and for 1p we obtain tmm
1 .
For 2p we obtain another form of estimator determined with the dependence [6]

Krystyna Maria Noga, Ryszard Studański
78 Zeszyty Naukowe AMW — Scientific Journal of PNA
2
2
1
2
5
2
2
1
4
2
1
m . (36)
It follows from the analysis of publications [6, 8, 9] that the variance of es-
timator 2
1m
needs to be verified. It must be compared with the variance of estima-
tors 1m
or tm
.
Another estimator in the Nakagami distribution was calculated using the
known quotient of moments of variable pii rx [9]
p
ba
p
ba
p
b
p
a
pba
mp
bm
p
am
222
,,
2
2
, (37)
where
ba — parameters which are integers.
It follows from the analysis presented in publication [9] that the equation
(37) can approximated using the dependence
pbappba
mp
pbaba
mp
pbabapba 2223
384
2
8
21
2
242,,
2
210
m
c
m
cc , (38)
where coefficients 210 ,, ccc depend on the values of parameters pba ,, .
For 1a and 0b obtained was another estimator m determined as [9]
pp
Ac
ccccm
,0,10
2,0,10211
2
4
, (39)
where
p
p
p
2
1
2
1
,0,1
,

Estimation of Nakagami distribution parameters…
1 (204) 2016 79
and the coefficients 210 ,, ccc , in order to facilitate the analysis, were presented in
publication [9] in the tabular form.
One more estimator was obtained after taking into account the dependence
[9]
....
32
144
4
11
1
2
1
24
2
2
2
2
2
1
mp
pp
mpm
pm
pm
p
p
G
(40)
Taking into account only the first two components of the approximating
polynomial an estimator, determined with the equation [9], was obtained
0
1
c
cm
G
G
. (41)
The presented different dependences which can be used to determine the
parameter m in the Nakagami distribution do not exhaust the broad analysis of this
issue covered in world literature. Other considerations were, among others, dis-
cussed in publications [5, 10–12, 16].
CONCLUSIONS
This article constitutes a review of the issues relating to the estimation of
the Nakagami distribution parameters. In world literature this issue has been at-
tracting interest for many years, which is shown by numerous publications. To the
article author’s knowledge, there is a lack of such considerations in the Polish litera-
ture. The presented Nakagami distribution estimator parameters can be used to
assess the transmission quality in a radio-communication fading channel. They can
also be used to design optimal receivers. At present, at the Gdynia Maritime Academy
experimental research is being carried out in the real propagation environment,
which will make it possible to estimate parameters of a radio-communication
channel and to model transmission in a radio-communication fading channel. The
aim of further investigations will also be comparative analysis of particular esti-
mators.

Krystyna Maria Noga, Ryszard Studański
80 Zeszyty Naukowe AMW — Scientific Journal of PNA
REFERENCES
[1] Abdi A., Kavesh M., Performance comparison of three different estimator for the Nakagami m parameter using Monte Carlo simulation, ‘Communications Letters’, IEEE, April 2000, Vol. 4, pp. 119–1121.
[2] Abramowitz M., Stegun I,. Handbook of Mathematical Functions, New York — Dover 1972.
[3] Antoniewicz J., Tablice funkcji dla inżynierów, PWN, Warszawa 1969 [Table of functions for engineers — available in Polish].
[4] Buch T., Messung der Verteilungs parameter der Empfangs feldstarke bei Funkwellen ausbrei-tungs untersuchungen, ‘Nachrichten Technik Elektronik’, 1982, 32, H. 6.
[5] Chen X., Liu S., Fan P., Hardware implementation on m parameter ML estimation of Nakagami m fading channel, IEEE, 2015, pp. 1395–1399.
[6] Cheng J., Beaulieu N. C., Generalized moment estimators for the Nakagami m fading parame-ter, ‘Communications Letters’, IEEE, April 2002, Vol. 6, Issue 4, pp. 144–146.
[7] Cheng J., Beaulieu N., Maximum-likelihood based estimation of the Nakagami m parameter, ‘Communications Letters’, IEEE, March 2001, Vol. 5, No. 3, pp. 101–103.
[8] Gaeddert J., Annamalai A., Further results on Nakagami m parameter estimation, ‘Communi-cations Letters’, IEEE, January 2005, Vol. 9, No. 1, pp. 22–24.
[9] Gaeddert J., Annamalai A., Further results on Nakagami m parameter estimation, IEEE, Vehicular Technology Conference, 2004, Vol. 6, pp. 4255–4259.
[10] Hadziahmetović N., Milisis M., Dokić M. A., Hadżialic M., Estimation of Nakagami distribution parameters based on signal samples corrupted with multiplicative and addative disturbances, International Symposium ELMAR 2007, Zadar, Croatia, pp. 235–238.
[11] Hadżialic M., Milisis M., Hadziahmetović N., Sarajilić A., Moment-based maximum likelihood- -based quotiential estimation of the Nakagami m fading parameter, IEEE, Vehicular Technology Conference, Spring 2007, pp. 549–553.
[12] Liu S., Fan P., Xiong K., Wang G., Novel ML estimation of m parameter of the noisy Nakagami m channel, International Worksshop on High Mobility Wireless Communications, 2014, pp. 183–193.
[13] Noga K. M., Statystyki drugiego rzędu kanału Rayleigha oraz Nakagamiego, ‘Kwartalnik Elektroniki i Telekomunikacji’, 2006, Vol. 52, No. 4, pp. 617–628 [Second-order statistics of Rayleigh and Nakagami channel — availabe in Polish].
[14] Noga K., Zaawansowane modele probabilistyczne sygnałów w kanałach z zanikami, ‘Kwartalnik Elektroniki i Telekomunikacji’, 2000, No. 1, pp. 47–62 [Advanced probabilistic models of signals in channel with fading — avalilable in Polish].
[15] Simon S. M., Alouini M. S., Digital communication over fading channel, J. Wiley & Sons, 2005.
[16] Tepedelenlioglu C., Gao P., Practical issues in the estimation of Nakagami m parameter, IEEE GLOBECOM, 2003, pp. 972–976.
[17] Wang N., Song X., Cheng J., Estimating the Nakagami m fading parameter by the generalized method of moments, IEEE, International Conference of Communications, 2011.
[18] Wang N., Song X., Cheng J., Generalized method of moments estimation of the Nakagami m fading parameter, ‘Transactions on Wireless Communications’, IEEE, September 2012, Vol. 11, No. 9, pp. 3316–3325.
[19] Young-Chai K., Alouini M. S., Estimation of Nakagami fading channel parameters with appli-cation to optimized transmitter diversity systems, IEEE, International Conference on Com-munications ICC 2001, June 2001, Vol. 6, pp. 1690–1695.
[20] Zhang Q., A note on the estimation of Nakagami m fading parameter, ‘Communications Let-ters’, IEEE, January 2002, Vol. 6, No. 6, pp. 237–238.

Estimation of Nakagami distribution parameters…
1 (204) 2016 81
E S T Y M A C J A P A R A M E T R Ó W R O Z K Ł A D U N A K A G A M I E G O
O P I S U J Ą C E G O K A N A Ł Z Z A N I K A M I
STRESZCZENIE
W artykule przedstawiono estymatory rozkładu Nakagamiego. Rozkład ten jest często stosowany
do modelowania transmisji w kanale radiokomunikacyjnym z zanikami, ponadto dobrze aproksy-
muje inne rozkłady.
Słowa kluczowe:
kanał radiokomunikacyjny z zanikami, rozkład prawdopodobieństwa obwiedni, estymacja para-
metrów rozkładu.