Embed Size (px)
Citation preview
Journal of Operation and Automation in Power Engineering
Vol. 8, No. 3, Dec. 2020, Pages: 234-244
http://joape.uma.ac.ir
Received: 22 Feb. 2020
Revised: 03 May 2020
Accepted: 10 May 2020
Corresponding author:
E-mail: [email protected] (M. Ghanbari)
Digital object identifier: 10.22098/joape.2020.6987.1508
Research Paper
2020 University of Mohaghegh Ardabili. All rights reserved.
Estimation of New Weighted Controlled Switching Overvoltage by RBFN Model
M. Hasanpour 1, M. Ghanbari 1*, V. Parvin-Darabad 1, 2
1Department of Electrical Engineering, Gorgan Branch, Islamic Azad University, Gorgan, Iran 2 Department of Electrical Engineering, Golestan University, Gorgan, Iran
Abstract- Mitigating switching overvoltages (SOVs) and conducting well-suited insulation coordination for handling
stresses are very important in UHV transmission Lines. The best strategy in the absence of arresters is controlled
switching (CS). Although elaborate works on electromagnetic transients are considered in the process of designing
transmission systems, such works are not prevalent in day-to-day operations. The power utility and/or operator have to
carefully monitor the peak values of SOVs so this values not to exceed the safe limits. In this paper, we present a novel
CS approach in dealing with EMTP/ATP environment, where trapped charge (TC) is intended to train a radial basis
function network (RBFN) meta-model that is implemented to calculate SOVs. A new weighted maximum overvoltage
factor proposed to find locations of critical failure risk due to SOVs occurred along transmission lines. Power utilities
or design engineers can benefit from the presented meta-model in designing a well-suited insulation level without
spending time for taking into account the feasible risk value. Besides, the operators can energize the lines sequentially
upon their choice; i.e., a safe and proper energization.
Keyword: Switching overvoltage, Transmission line, Controlled switching, RBFN.
1. INTRODUCTION
With regard to the undeniable role of electrical energy in
modern societies, the problem of blackouts is very
significant. Therefore, regional electricity companies
and large-scale customers have been trying to prevent
blackouts. A large part of the electrical energy is
transmitted by the transmission lines, so the importance
of transmission line protection for continuous power
transmission is crucial [1]. The investigation, control
and simulation of SOVs to achieve an appropriate
insulation coordination in both design and operation
stages require sophisticated knowledge of transmission
line transients [2]. Moreover, as the power grid
gradually develops, the study of SOVs encounters some
complexities in the design stage. In the operation stage,
it is challenging for the operator to determine the
sequence of transmission lines energization in order to
keep the SOV within the allowable limits. This
challenge has been studied in various research works.
In some studies [3-9], artificial neural networks have
been used as black boxes for equivalent nonlinear
systems and to simplify the complexities of real
systems. In Ref. [3], an artificial neural network is used
to estimate the behavior of a medium voltage feeder
against changes in temperature and humidity for the
optimal load management. In Ref. [4], an intelligent
network is used to estimate the distribution network
harmonics and thereby to reduce the number of
monitoring units as much as possible. A system for
controlled switching (CS) of high voltage circuit
breakers, which can determine the closing time of
phases with regard to the trapped charge (TC),
uncertainties of circuit breaker (CB) and the controller
circuit, as well as the pre-strike voltage, has not been
developed so far [5-9]. In Ref. [8], the most
comprehensive study on the overvoltage of conventional
CBs has been carried out. In this study, the insulation
risk has been calculated using the structural
specifications of the line and taking into account the
height profile, TC and surge arrester installation. Then,
the critical points of failure for each power grid are
predicted using an intelligent network. This study only
focuses on installing surge arresters to reduce the
overvoltage, and similar to some previous studies [5-7],
it does not account for the effective parameter of pre-
strike voltage. In Ref. [9], in accordance with [8], the
SOV of a 500 kV line has been estimated using a fuzzy-
neural network.
Various studies have also been conducted on CS
without considering the TC [10-12]. In the most
Journal of Operation and Automation in Power Engineering, Vol. 8, No. 3, Dec. 2020 235
prominent of these studies [10], CS has been roughly
performed because the closing instant is determined by
using the TC polarity. Subsequently, statistical
switching has been implemented using the
predetermined mean and standard deviation values.
However, these values must be determined based on the
circuit breaker characteristics. Reference [12] uses an
ABB F236 controller to perform CS on a transmission
line. This commercial controller is equipped with zero-
crossing of the source side waveform for the
transmission line energization. The performance of this
controller is studied for the statistical switching of CS.
However, this method cannot be used to include TC
voltage in reclosing operations.
Recent studies [13-15] have introduced new CS
methods during the reclosing of a transmission line after
short circuit faults. However, these studies do not
consider worst-case caused by the TC during reclosing.
Reference [16] proposes a new method based on the
combination of closing instant control and pre-insertion
resistor in the presence or absence of compensating
reactor. This study, similar to Ref. [10], investigates the
CS using TC polarity although to increase its
applicability, the presence of the reactor is considered.
Moreover, while combining of closing control and pre-
insertion resistor increases the reliability of the one-and-
a-half-breaker scheme, the reduction in overvoltage is
not significant enough and surge arresters are required.
The purpose of the present paper is to define a neural
network to predict the location and magnitude of
weighted SOVs during CS of CBs. Accordingly, this
artificial network can be used by employing the
structural specifications of the line and parameters of
CBs for every transmission line. In this paper,
sensitivity analyses are performed for all parameters
affecting the maximum value of SOV.
Indeed, using an intelligent network trained in the
operation stage, it is possible to determine the sequence
of high voltage lines energization. Moreover, using this
intelligent network in the design stage of a developed
grid, the optimal value of the insulation strength of the
lines can be determined at different points of the grid.
Therefore, in the process of insulation design and
operation, the trained network can be used instead of
modeling the real power grid. The main contributions of
this paper are as follows:
- Considering all parameters affecting the proposed
CS strategy, including TC and pre-strike voltage.
- Absence of disturbances due to TC fluctuations.
- Presenting the simple and accurate criterion of
weighted voltage for evaluating insulation
coordination.
- Training the radial basis function network (RBFN)
for predicting weighted voltages and using its
simple and accurate calculations.
- Determining the critical points of the transmission
line during line energization using CS.
- Ability to use the trained network during line
energization in the operation stage.
2. WEIGHTED MAXIMUM OVERVOLTAGE
Due to the randomness of the parameters affecting the
SOV amplitude, it is necessary to perform a statistical
study to obtain the maximum overvoltage amplitude
along the line. CS of circuit breakers is also no
exception to this rule and experiences uncertainty; it is
necessary to use switching statistics to investigate
overvoltages due to the closing of circuit breakers. The
statistical switching is performed through many
switching operations, for example, 100 switching
operations. The closing time determines uniform
distribution around the mean value with a standard
deviation [2]. The mean value (μ) and standard
deviation (σ) are calculated by the case peak method so
that in each switching operation, the highest peak value
and phase-to-earth or phase-to-phase overvoltages are
included in the voltage probability distribution. Each
energization yields one data point and the highest peak
as well as phase-to-earth and phase-to-phase
overvoltages. The SOV peak values of all three phase
and between phases are collected in a normal
distribution function as follows: 2
1
21( )
2
x
p x e
(1)
Where, μ and σ are, respectively, the mean and
standard deviation of SOV respectively. Deviation and
truncation values are, respectively, given by:
0.17( 1)e U (2)
1.13 0.13eU U (3)
Where, U denotes SOVs with 2% probability of being
exceeded.
2.1. Maximum overvoltage
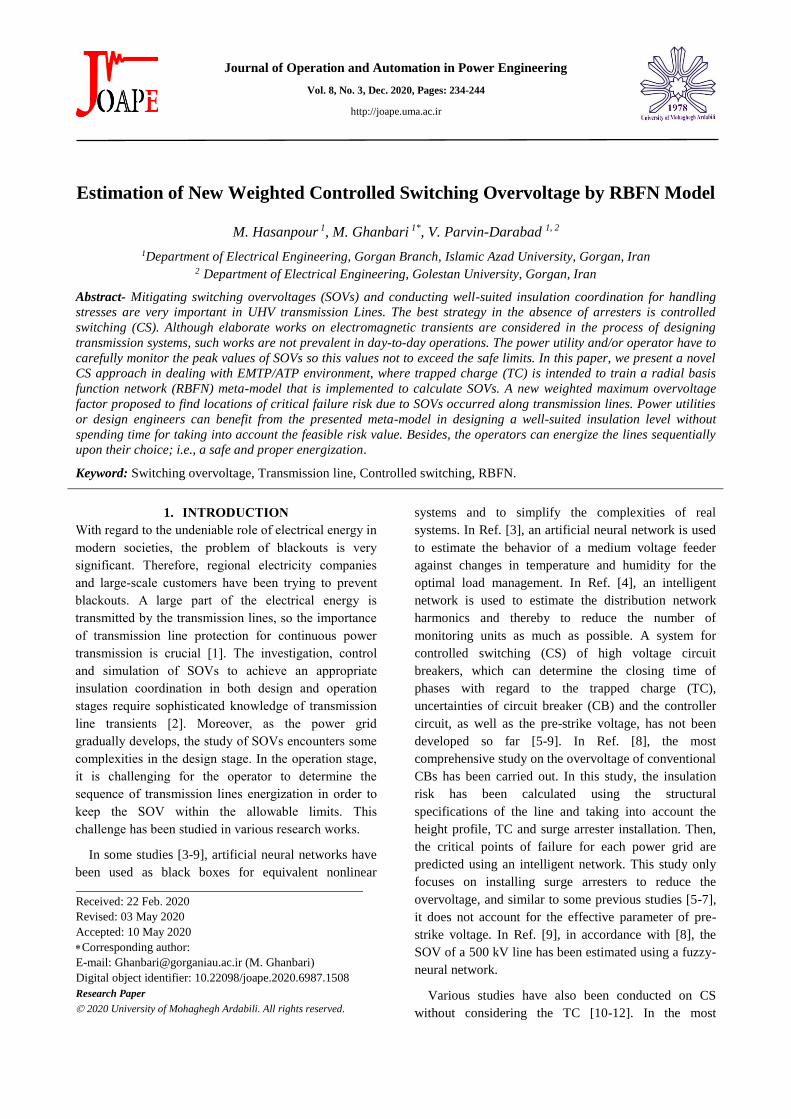
The 400 kV system under study is located in southern
Iran. The analysis is performed on a line of the system
according to the single-line diagram of Fig. 1 [7].
The label of the line implemented in the
electromagnetic transient program/ alternative transient
program (EMTP/ATP) software is SA913 as shown in
Fig. 2. The feeding substation is modeled by an AC
M. Hasanpour, M. Ghanbari, V. Parvin-Darabad: Estimation of New Weighted Controlled Switching… 236
supply. Thevenin equivalent impedance behind the
source is implemented using the “LINE RL” block.
Fig. 1. Single line diagram of the case study
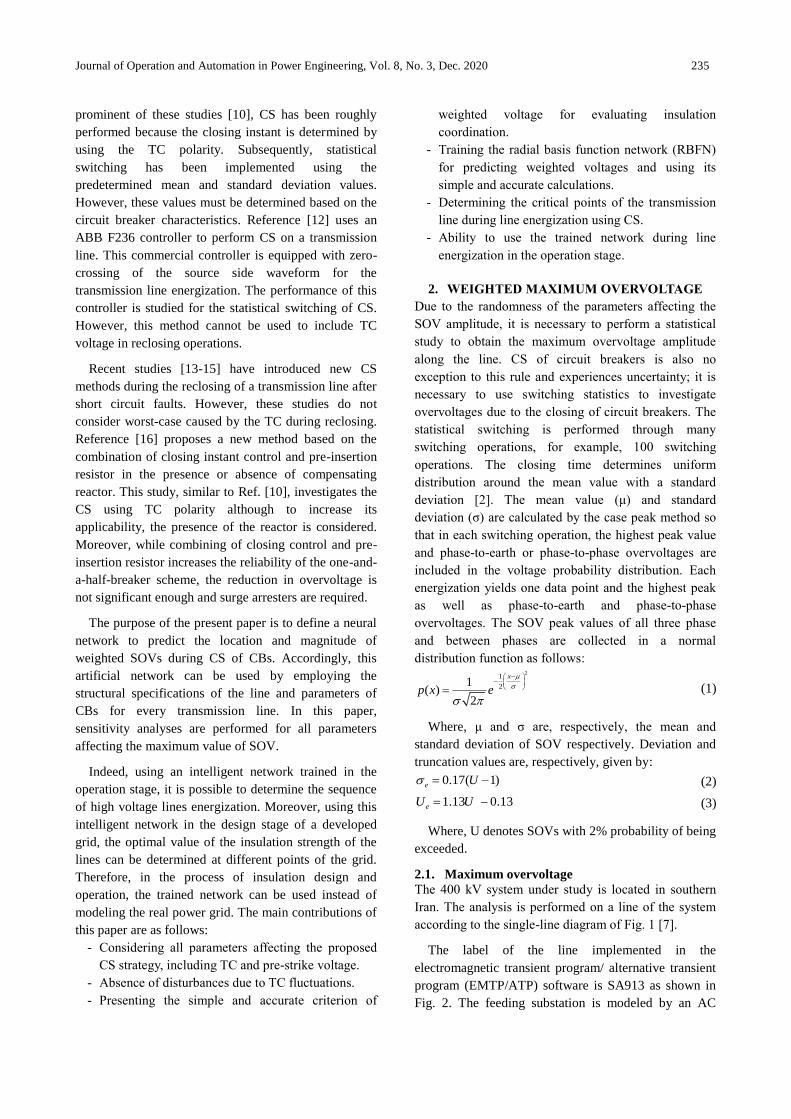
Fig. 2. ATPDraw implementation of the case study
The short-circuit impedances of substations are
calculated using the short-circuit calculations, and the
results are presented in Table 1. To implement the
feeding network in switching studies, it is necessary to
consider the receiving feeding lines up to the first
receiving substation [13]. The receiving substations are
Karkheh and Kermanshah substations that feed the line
under study through lines SA912 and SL102. Therefore,
in studying switching, the line SA913 up to the
mentioned substations has to be implemented as shown
in Fig. 2.
The statistical circuit breaker, “STAT”, is another
implemented part that makes the statistical switching
process possible. The mean and standard deviation at
the closing instant have to be determined for this CB.
The transmission line SA913 is implemented using the
“LCC” block, and finally, the default ATP current
source for TC is used to model the TC in the line.
Table 1. Impedance behind the source of substations of the
network under study [7]
Power station
Name R0 (Ω) X0 (Ω) R+ (Ω) X+ (Ω)
Source
Power (MVA)
Khoramabad 72 320 24.48 215.65 737.32
Kermanshah 30.4 88.65 2.88 32.96 1000.66
Shomal
Khuzestan 8.69 32.32 0.96 15.04 2512.69
Karkhe 7.52 32.32 0.96 14.40 2578.68
Karun 0.96 11.2 0.48 8.16 5799.35 Choghadak 2.4 14.4 1.12 15.2 3549.16
Jesfehan 0.96 8.32 .480 7.68 6732.54 Omodiyeh 7.2 24.32 0.96 10.72 3412.30
Saadatshahr 52.16 157.6 0.96 15.04 815.71
Therefore, each transmission line is modeled using
the three-bus system. The ATP software is used to
determine the statistical distribution function of
switching SOV [14]. Statistical switching is performed
by changing the switching voltage angle, which is
equivalent to changing the amplitude of the source at the
closing instant. To obtain the probability distribution
function of overvoltages, CBs must be closed at random
times [19]. The probability distribution of closing
instants includes mean and standard deviation values for
each phase. The mean values are determined using the
method proposed in this paper. Standard deviation
depends on the errors of the mechanical system and the
controller circuit. The CB in this study, which is used to
feed a 400 kV, 50 Hz transmission line, has two arc
extinguishing chambers, and its closing speed is 170
kilovolts per millisecond with a standard deviation of
0.35 milliseconds [20].
For obtaining the statistical distribution of the closing
instants of each phase, similar to the case of a random
process, it is necessary to perform statistical switching
for a number of times, for example, 100 times.
Therefore, the statistical switching tool of ATP software
is used.
After performing 100 statistical switching operations,
the ATP software calculates the maximum and
minimum of generated voltages, taking account of their
polarity, at the candidate points D0 to D9. Since the
amplitude of a destructive overvoltage may cause an
insulation failure, the largest overvoltage amplitude is
extracted.
2.2. Weight function of overvoltage
In the process of transmission line insulation
coordination, not only the generated overvoltage has a
direct effect on insulation failure of insulator strings, but
the insulation strength of each of the insulators is also
determinative. In principle, at the design stage of the
line, the insulation levels of all insulator strings in the
line are assumed to be the same.
It is assumed that the probability of disruptive
discharge of insulation is given by a normal cumulative
probability function [21]: 2
2
( )
21
( )2
V CFOVdV
P V e
(4)
where P(V) is the probability of disruptive
discharges, σ is the standard deviation and critical
flashover voltage (CFO), i.e., the voltage under which
the insulation has a 50% probability of flashover or
withstand. The CFO is determined if the basic switching
impulse insulation level (BSL) of the line is specified.
Journal of Operation and Automation in Power Engineering, Vol. 8, No. 3, Dec. 2020 237
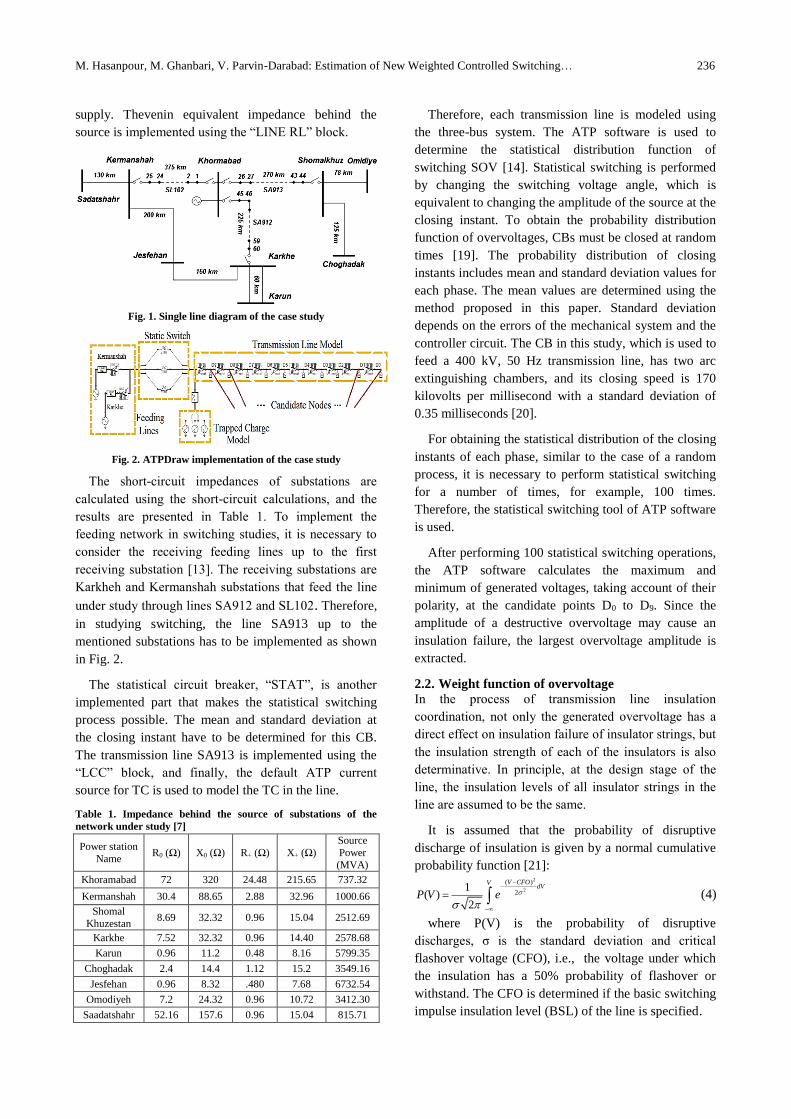
Fig. 3. Effect of increasing line height above sea level on insulation
strength (CFOn) of insulators (Vbase=342928 volts)
(1 1.28 )BSL CFOCFO
(5)
However, due to the changes in the height profile of
the line towers above sea level, the insulators installed
at higher altitudes are more vulnerable compared to
those installed at a lower altitude. At different heights of
towers with respect to sea level, the value of BSL
changes as follows [22]. ( /8.15). &m A
n sBSL BSL e (6)
Where BSLn and BSLs are the values of BSL in non-
standard and standard conditions, respectively; A (km)
is the height of the tower above sea level, and m is a
constant that is obtained as follows. Here, S is the length
of insulator string in meters, and CFOs is the standard
value of CFO.
1.250.2
500 500
s sCFO CFOm
S S
(7)
In Fig. 3, the cumulative density distribution curve of
CFO in non-standard conditions, CFOn, is shown for
different values of height. As shown in this figure, with
increasing height, the insulation strength of the insulator
string decreases.
In this paper, the weighting parameter W is proposed
to implement the level of vulnerability caused by the
height above sea level.
1/ mW (8)
Where δ and m can be calculated from (1) and (2).
The weighting coefficient W is first calculated using the
height profile of the corresponding segment of the line;
this coefficient modifies the overvoltage amplitude as
the height increases. Therefore, in vulnerable points
along the line, the overvoltages become more
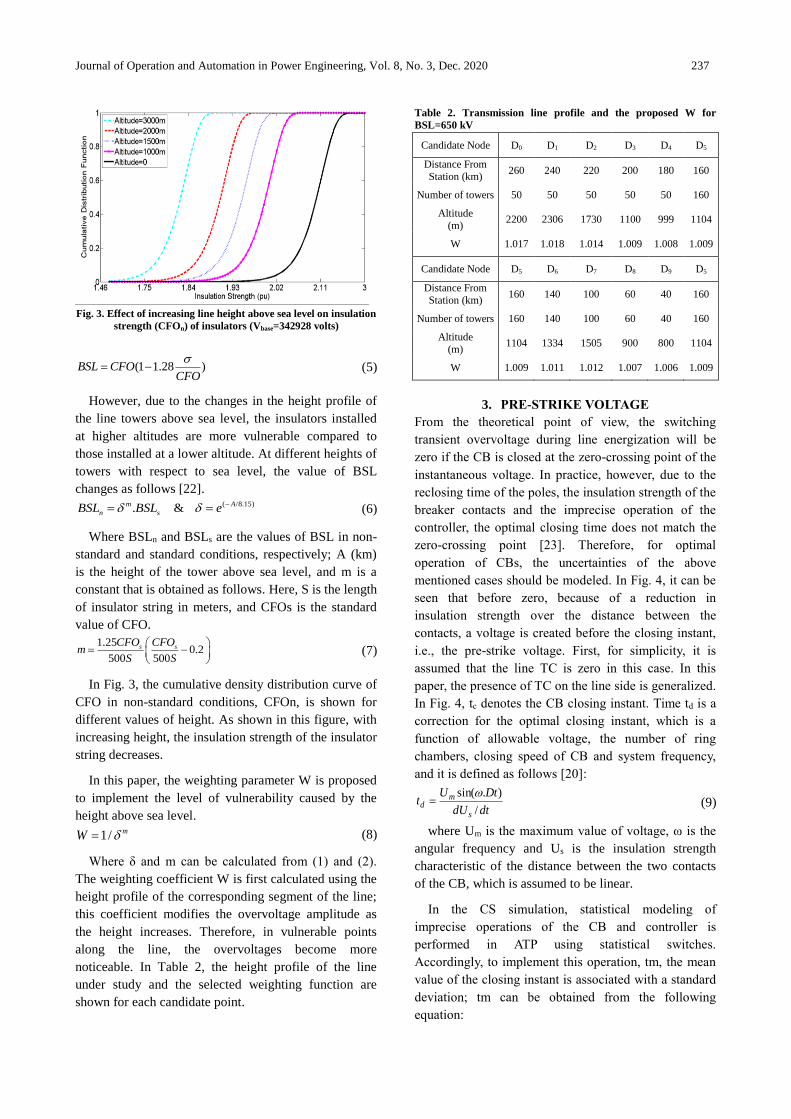
noticeable. In Table 2, the height profile of the line
under study and the selected weighting function are
shown for each candidate point.
Table 2. Transmission line profile and the proposed W for
BSL=650 kV
Candidate Node D0 D1 D2 D3 D4 D5
Distance From
Station (km) 260 240 220 200 180 160
Number of towers 50 50 50 50 50 160
Altitude
(m) 2200 2306 1730 1100 999 1104
W 1.017 1.018 1.014 1.009 1.008 1.009
Candidate Node D5 D6 D7 D8 D9 D5
Distance From
Station (km) 160 140 100 60 40 160
Number of towers 160 140 100 60 40 160
Altitude
(m) 1104 1334 1505 900 800 1104
W 1.009 1.011 1.012 1.007 1.006 1.009
3. PRE-STRIKE VOLTAGE
From the theoretical point of view, the switching
transient overvoltage during line energization will be
zero if the CB is closed at the zero-crossing point of the
instantaneous voltage. In practice, however, due to the
reclosing time of the poles, the insulation strength of the
breaker contacts and the imprecise operation of the
controller, the optimal closing time does not match the
zero-crossing point [23]. Therefore, for optimal
operation of CBs, the uncertainties of the above
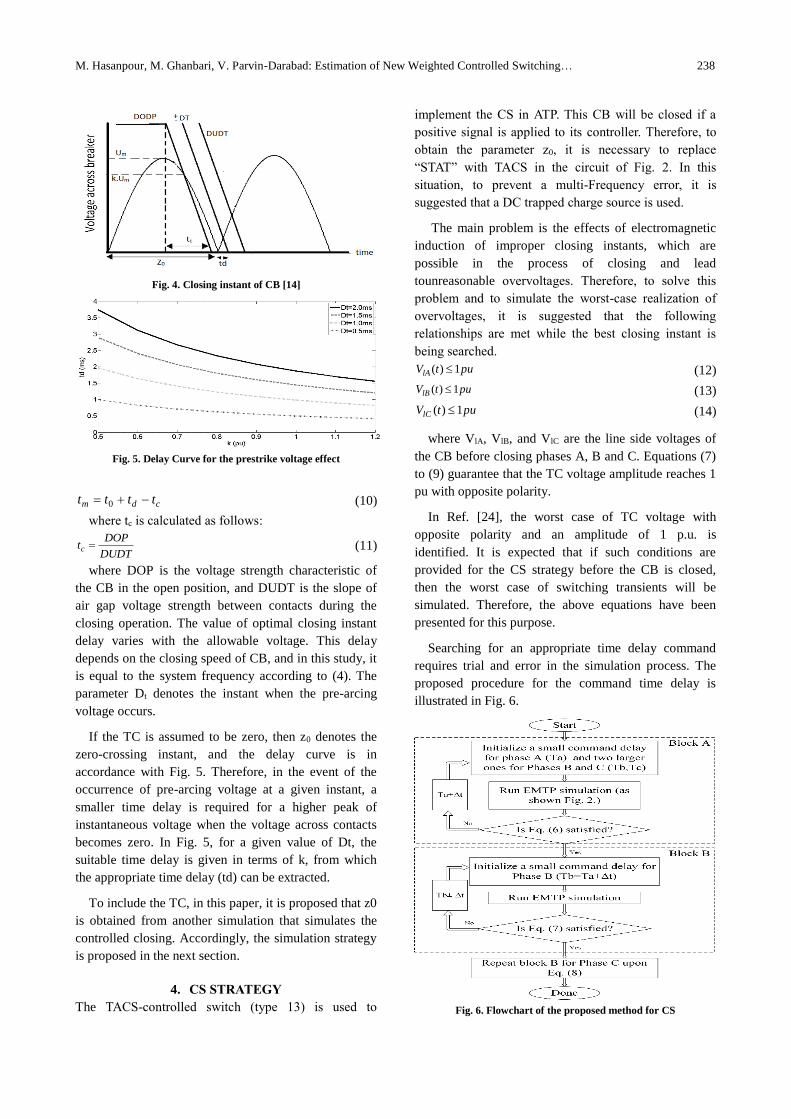
mentioned cases should be modeled. In Fig. 4, it can be
seen that before zero, because of a reduction in
insulation strength over the distance between the
contacts, a voltage is created before the closing instant,
i.e., the pre-strike voltage. First, for simplicity, it is
assumed that the line TC is zero in this case. In this
paper, the presence of TC on the line side is generalized.
In Fig. 4, tc denotes the CB closing instant. Time td is a
correction for the optimal closing instant, which is a
function of allowable voltage, the number of ring
chambers, closing speed of CB and system frequency,
and it is defined as follows [20]:
dtdU
DtUt
s
md
/
).sin(
(9)
where Um is the maximum value of voltage, ω is the
angular frequency and Us is the insulation strength
characteristic of the distance between the two contacts
of the CB, which is assumed to be linear.
In the CS simulation, statistical modeling of
imprecise operations of the CB and controller is
performed in ATP using statistical switches.
Accordingly, to implement this operation, tm, the mean
value of the closing instant is associated with a standard
deviation; tm can be obtained from the following
equation:
M. Hasanpour, M. Ghanbari, V. Parvin-Darabad: Estimation of New Weighted Controlled Switching… 238
Fig. 4. Closing instant of CB [14]
Fig. 5. Delay Curve for the prestrike voltage effect
cdm tttt 0 (10)
where tc is calculated as follows:
DUDT
DOPtc (11)
where DOP is the voltage strength characteristic of
the CB in the open position, and DUDT is the slope of
air gap voltage strength between contacts during the
closing operation. The value of optimal closing instant
delay varies with the allowable voltage. This delay
depends on the closing speed of CB, and in this study, it
is equal to the system frequency according to (4). The
parameter Dt denotes the instant when the pre-arcing
voltage occurs.
If the TC is assumed to be zero, then z0 denotes the
zero-crossing instant, and the delay curve is in
accordance with Fig. 5. Therefore, in the event of the
occurrence of pre-arcing voltage at a given instant, a
smaller time delay is required for a higher peak of
instantaneous voltage when the voltage across contacts
becomes zero. In Fig. 5, for a given value of Dt, the
suitable time delay is given in terms of k, from which
the appropriate time delay (td) can be extracted.
To include the TC, in this paper, it is proposed that z0
is obtained from another simulation that simulates the
controlled closing. Accordingly, the simulation strategy
is proposed in the next section.
4. CS STRATEGY
The TACS-controlled switch (type 13) is used to
implement the CS in ATP. This CB will be closed if a
positive signal is applied to its controller. Therefore, to
obtain the parameter z0, it is necessary to replace
“STAT” with TACS in the circuit of Fig. 2. In this
situation, to prevent a multi-Frequency error, it is
suggested that a DC trapped charge source is used.
The main problem is the effects of electromagnetic
induction of improper closing instants, which are
possible in the process of closing and lead
tounreasonable overvoltages. Therefore, to solve this
problem and to simulate the worst-case realization of
overvoltages, it is suggested that the following
relationships are met while the best closing instant is
being searched.
(12)
(13)
(14)
where VlA, VlB, and VlC are the line side voltages of
the CB before closing phases A, B and C. Equations (7)
to (9) guarantee that the TC voltage amplitude reaches 1
pu with opposite polarity.
In Ref. [24], the worst case of TC voltage with
opposite polarity and an amplitude of 1 p.u. is
identified. It is expected that if such conditions are
provided for the CS strategy before the CB is closed,
then the worst case of switching transients will be
simulated. Therefore, the above equations have been
presented for this purpose.
Searching for an appropriate time delay command
requires trial and error in the simulation process. The
proposed procedure for the command time delay is
illustrated in Fig. 6.
Fig. 6. Flowchart of the proposed method for CS
putVlA 1)(
putVlB 1)(
putVlC 1)(
Journal of Operation and Automation in Power Engineering, Vol. 8, No. 3, Dec. 2020 239
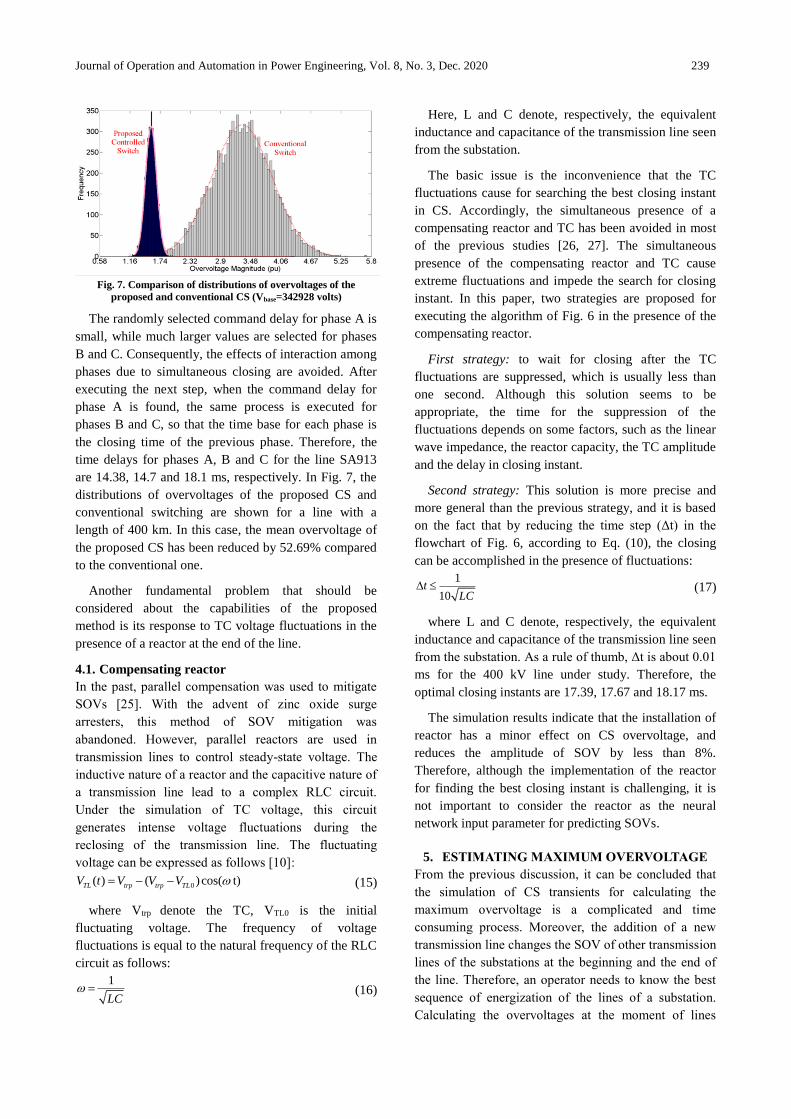
Fig. 7. Comparison of distributions of overvoltages of the
proposed and conventional CS (Vbase=342928 volts)
The randomly selected command delay for phase A is
small, while much larger values are selected for phases
B and C. Consequently, the effects of interaction among
phases due to simultaneous closing are avoided. After
executing the next step, when the command delay for
phase A is found, the same process is executed for
phases B and C, so that the time base for each phase is
the closing time of the previous phase. Therefore, the
time delays for phases A, B and C for the line SA913
are 14.38, 14.7 and 18.1 ms, respectively. In Fig. 7, the
distributions of overvoltages of the proposed CS and
conventional switching are shown for a line with a
length of 400 km. In this case, the mean overvoltage of
the proposed CS has been reduced by 52.69% compared
to the conventional one.
Another fundamental problem that should be
considered about the capabilities of the proposed
method is its response to TC voltage fluctuations in the
presence of a reactor at the end of the line.
4.1. Compensating reactor
In the past, parallel compensation was used to mitigate
SOVs [25]. With the advent of zinc oxide surge
arresters, this method of SOV mitigation was
abandoned. However, parallel reactors are used in
transmission lines to control steady-state voltage. The
inductive nature of a reactor and the capacitive nature of
a transmission line lead to a complex RLC circuit.
Under the simulation of TC voltage, this circuit
generates intense voltage fluctuations during the
reclosing of the transmission line. The fluctuating
voltage can be expressed as follows [10]:
0( ) ( ) cos( t)TL trp trp TLV t V V V (15)
where Vtrp denote the TC, VTL0 is the initial
fluctuating voltage. The frequency of voltage
fluctuations is equal to the natural frequency of the RLC
circuit as follows:
1
LC
(16)
Here, L and C denote, respectively, the equivalent
inductance and capacitance of the transmission line seen
from the substation.
The basic issue is the inconvenience that the TC
fluctuations cause for searching the best closing instant
in CS. Accordingly, the simultaneous presence of a
compensating reactor and TC has been avoided in most
of the previous studies [26, 27]. The simultaneous
presence of the compensating reactor and TC cause
extreme fluctuations and impede the search for closing
instant. In this paper, two strategies are proposed for
executing the algorithm of Fig. 6 in the presence of the
compensating reactor.
First strategy: to wait for closing after the TC
fluctuations are suppressed, which is usually less than
one second. Although this solution seems to be
appropriate, the time for the suppression of the
fluctuations depends on some factors, such as the linear
wave impedance, the reactor capacity, the TC amplitude
and the delay in closing instant.
Second strategy: This solution is more precise and
more general than the previous strategy, and it is based
on the fact that by reducing the time step (Δt) in the
flowchart of Fig. 6, according to Eq. (10), the closing
can be accomplished in the presence of fluctuations:
1
10t
LC
(17)
where L and C denote, respectively, the equivalent
inductance and capacitance of the transmission line seen
from the substation. As a rule of thumb, Δt is about 0.01
ms for the 400 kV line under study. Therefore, the
optimal closing instants are 17.39, 17.67 and 18.17 ms.
The simulation results indicate that the installation of
reactor has a minor effect on CS overvoltage, and
reduces the amplitude of SOV by less than 8%.
Therefore, although the implementation of the reactor
for finding the best closing instant is challenging, it is
not important to consider the reactor as the neural
network input parameter for predicting SOVs.
5. ESTIMATING MAXIMUM OVERVOLTAGE
From the previous discussion, it can be concluded that
the simulation of CS transients for calculating the
maximum overvoltage is a complicated and time
consuming process. Moreover, the addition of a new
transmission line changes the SOV of other transmission
lines of the substations at the beginning and the end of
the line. Therefore, an operator needs to know the best
sequence of energization of the lines of a substation.
Calculating the overvoltages at the moment of lines
M. Hasanpour, M. Ghanbari, V. Parvin-Darabad: Estimation of New Weighted Controlled Switching… 240
energization is not possible for the operator. To
overcome this challenge, in this paper, an artificial
neural network is proposed that can be replaced with the
simulation of ATP transient, and can be used to estimate
the maximum overvoltage in the operation stage or even
in the design stage. To define the proposed network, the
parameters that affect the maximum overvoltage of the
line must be identified.
5.1. Factors affecting maximum overvoltage
amplitude
These factors that depend on the network structure
include line length and the impedance behind the source
[28]. Of course, other parameters, such as the nature of
the source, the presence of arresters, etc., affect the
overvoltage amplitude of the conventional CBs, while
they do not affect the overvoltage of closing instant
control CBs [29].
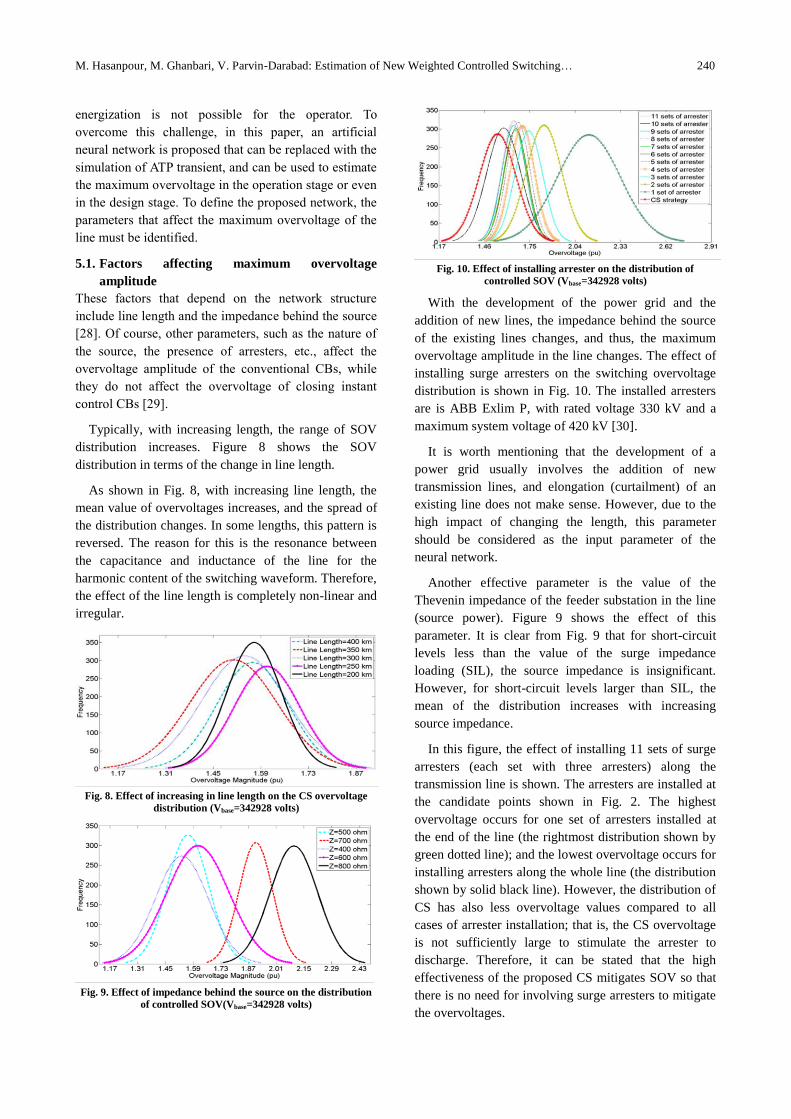
Typically, with increasing length, the range of SOV
distribution increases. Figure 8 shows the SOV
distribution in terms of the change in line length.
As shown in Fig. 8, with increasing line length, the
mean value of overvoltages increases, and the spread of
the distribution changes. In some lengths, this pattern is
reversed. The reason for this is the resonance between
the capacitance and inductance of the line for the
harmonic content of the switching waveform. Therefore,
the effect of the line length is completely non-linear and
irregular.
Fig. 8. Effect of increasing in line length on the CS overvoltage
distribution (Vbase=342928 volts)
Fig. 9. Effect of impedance behind the source on the distribution
of controlled SOV(Vbase=342928 volts)
Fig. 10. Effect of installing arrester on the distribution of
controlled SOV (Vbase=342928 volts)
With the development of the power grid and the
addition of new lines, the impedance behind the source
of the existing lines changes, and thus, the maximum
overvoltage amplitude in the line changes. The effect of
installing surge arresters on the switching overvoltage
distribution is shown in Fig. 10. The installed arresters
are is ABB Exlim P, with rated voltage 330 kV and a
maximum system voltage of 420 kV [30].
It is worth mentioning that the development of a
power grid usually involves the addition of new
transmission lines, and elongation (curtailment) of an
existing line does not make sense. However, due to the
high impact of changing the length, this parameter
should be considered as the input parameter of the
neural network.
Another effective parameter is the value of the
Thevenin impedance of the feeder substation in the line
(source power). Figure 9 shows the effect of this
parameter. It is clear from Fig. 9 that for short-circuit
levels less than the value of the surge impedance
loading (SIL), the source impedance is insignificant.
However, for short-circuit levels larger than SIL, the
mean of the distribution increases with increasing
source impedance.
In this figure, the effect of installing 11 sets of surge
arresters (each set with three arresters) along the
transmission line is shown. The arresters are installed at
the candidate points shown in Fig. 2. The highest
overvoltage occurs for one set of arresters installed at
the end of the line (the rightmost distribution shown by
green dotted line); and the lowest overvoltage occurs for
installing arresters along the whole line (the distribution
shown by solid black line). However, the distribution of
CS has also less overvoltage values compared to all
cases of arrester installation; that is, the CS overvoltage
is not sufficiently large to stimulate the arrester to
discharge. Therefore, it can be stated that the high
effectiveness of the proposed CS mitigates SOV so that
there is no need for involving surge arresters to mitigate
the overvoltages.
Journal of Operation and Automation in Power Engineering, Vol. 8, No. 3, Dec. 2020 241
5.2. Necessity of defining RBFN
ATP simulation is only considered to obtain the
statistical distribution of overvoltages [22]. The
transmission line insulation level and the height profile
can be applied to ATP outputs, so SOVs can be
calculated. The implementation of the network needs
information on power system transients and ATP
simulation. ATP, which is based on EMTP cards with
FORTRAN machine language, is not a user-friendly
environment. Statistical switching is time-consuming
and requires many iterations. Thus, the whole process is
complex, time-consuming and inconvenient. The
complexity causes serious human errors in the stage of
insulation coordination designing. Moreover, during
system operation, some transmission lines may be
indented to be re-energized after a partial outage. In the
operation stage, the operator should determine the
switching sequence, which is safe and may lead to
minor outcomes, so ATP cannot be investigated in the
operation stage.
In this paper, instead of ATP simulations, the
proposed RBFN is used. The meta-model makes it
possible for the designers to choose the insulation level
by considering the height profile easily without making
any mistake. Additionally, this model is useful for the
operators to choose proper sequence of switching
transmission lines that are fed by CS.
5.3. Radial neural network
Radial neural network or RBFN is one of the most
widely used powerful tools with a simple structure for
predicting the output of complex systems using sample
input/output data [31]. These networks are also used for
modelling and controlling nonlinear systems. The
widespread use of these networks is due to the
simplicity of their structure compared to other neural
networks, i.e., complex multilayer perceptrons. Radial
basis function (RBF) networks include a hidden layer
connected to the network output. In an RBF network,
training is essentially related to the search for multi-
dimensional levels, so by using training information, the
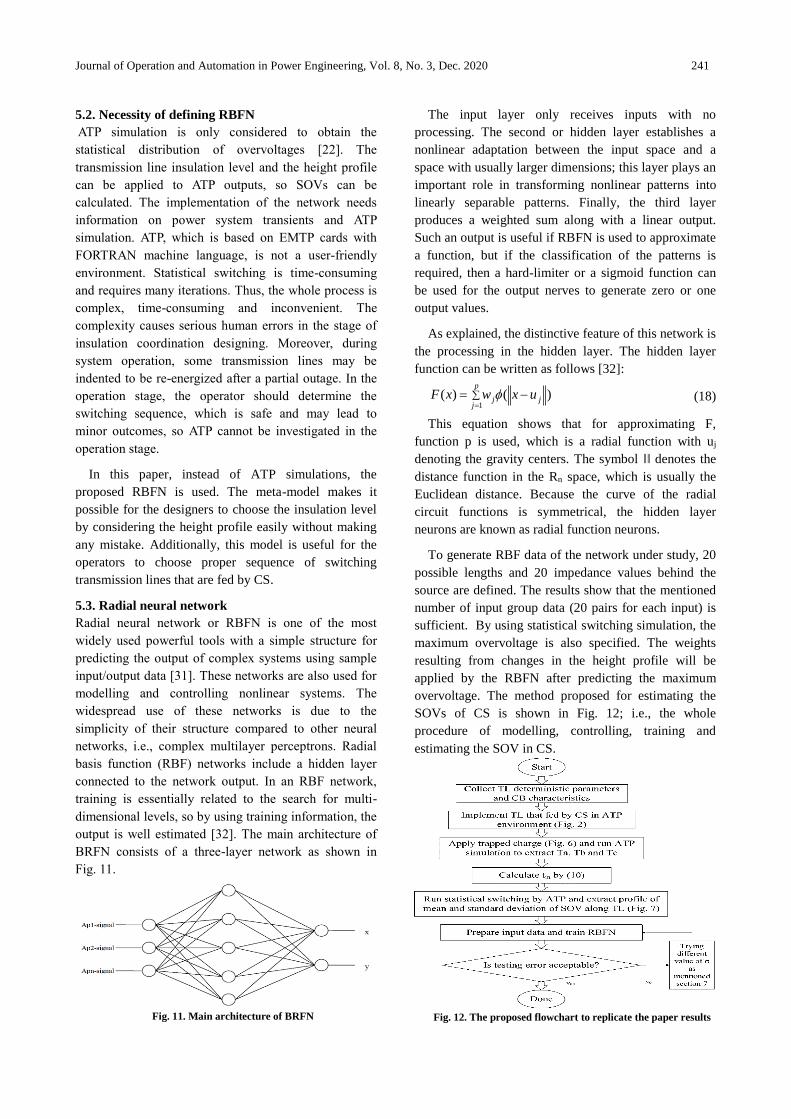
output is well estimated [32]. The main architecture of
BRFN consists of a three-layer network as shown in
Fig. 11.
Fig. 11. Main architecture of BRFN
The input layer only receives inputs with no
processing. The second or hidden layer establishes a
nonlinear adaptation between the input space and a
space with usually larger dimensions; this layer plays an
important role in transforming nonlinear patterns into
linearly separable patterns. Finally, the third layer
produces a weighted sum along with a linear output.
Such an output is useful if RBFN is used to approximate
a function, but if the classification of the patterns is
required, then a hard-limiter or a sigmoid function can
be used for the output nerves to generate zero or one
output values.
As explained, the distinctive feature of this network is
the processing in the hidden layer. The hidden layer
function can be written as follows [32]:
p
jjj uxwxF
1
)()( (18)
This equation shows that for approximating F,
function p is used, which is a radial function with uj
denoting the gravity centers. The symbol ‖‖ denotes the
distance function in the Rn space, which is usually the
Euclidean distance. Because the curve of the radial
circuit functions is symmetrical, the hidden layer
neurons are known as radial function neurons.
To generate RBF data of the network under study, 20
possible lengths and 20 impedance values behind the
source are defined. The results show that the mentioned
number of input group data (20 pairs for each input) is
sufficient. By using statistical switching simulation, the
maximum overvoltage is also specified. The weights
resulting from changes in the height profile will be
applied by the RBFN after predicting the maximum
overvoltage. The method proposed for estimating the
SOVs of CS is shown in Fig. 12; i.e., the whole
procedure of modelling, controlling, training and
estimating the SOV in CS.
Fig. 12. The proposed flowchart to replicate the paper results
M. Hasanpour, M. Ghanbari, V. Parvin-Darabad: Estimation of New Weighted Controlled Switching… 242
Table 3. Results of the proposed RBFN and ATP simulation
Name End Station Length
(km)
Source
Power
(MVA)
Max. of SOV in kV Error
(%) EMTP RBFN
SA912
Khoram
abad 225 18331.2 620.65 608.86 1.9%
Karkhe 225 3513.35 544.5 545.04 0.1%
SA913
Khoram
abad 270 6961.46 550.89 565.76 2.7%
Shomal
Kuzestan 270 3579.26 609.8 529.84 3.2%
SL102
Kermansha 375 5091.29 600.35 602.15 0.3%
Khoram
abad 375 815.71 689.54 669.54 2.9%
The flowchart in Fig. 12 is used to replicate the paper
results. As a result, the input-output data sets are
obtained by deterministic data from the network. The
intervals of line length and back impedance are
introduced in Figs. 8 and 9. The strategy of Fig. 6 is
applied to the case study of Fig. 2, and Ta, Tb and Tc are
then obtained. Next, the closing time distribution is
calculated by using Eqns. (9) – (11), and the test system
is simulated statistically in 100 switching operations.
The output of ATP is ten distribution functions of
obtained overvoltages and maximum SOVs for each
transmission line configuration.
6. SIMULATION RESULTS
Left To implement RBFN, the MATLAB software
toolbox has been used. In order to properly train RBFN
with the smallest training error, the input/output data is
normalized. The data is then displaced and normalized
in a way that the mean of data cluster becomes zero and
the variance becomes one. Sixty percent of the entire
dataset is intended for training, 20% for controlling the
training process and 20% for random testing. The goal
is to obtain zero error, and the optimal value of σ is
chosen to be 0.4. The training error is low and equal to
1.3%. In Table 3, the overvoltage values are estimated
by the RBF network and ATP simulation results are
presented. Accordingly, the RBF network can well be
used as an alternative to the SOV estimation in the
process of lines energization by using CS. As expected,
the lines energization from the point where the short-
circuit power of the source is higher imposes lower
overvoltage on the line insulators. Moreover, in the case
of future network development, the above artificial
network can easily search the resultant overvoltages and
vulnerable points.
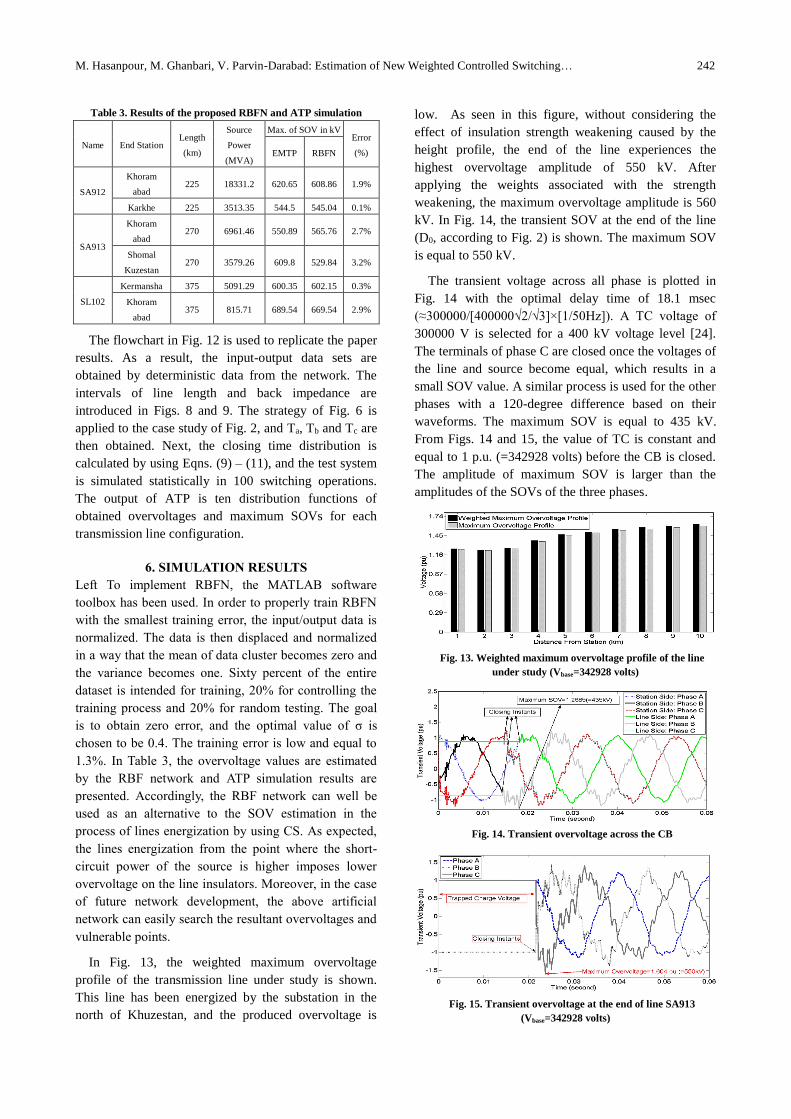
In Fig. 13, the weighted maximum overvoltage
profile of the transmission line under study is shown.
This line has been energized by the substation in the
north of Khuzestan, and the produced overvoltage is
low. As seen in this figure, without considering the
effect of insulation strength weakening caused by the
height profile, the end of the line experiences the
highest overvoltage amplitude of 550 kV. After
applying the weights associated with the strength
weakening, the maximum overvoltage amplitude is 560
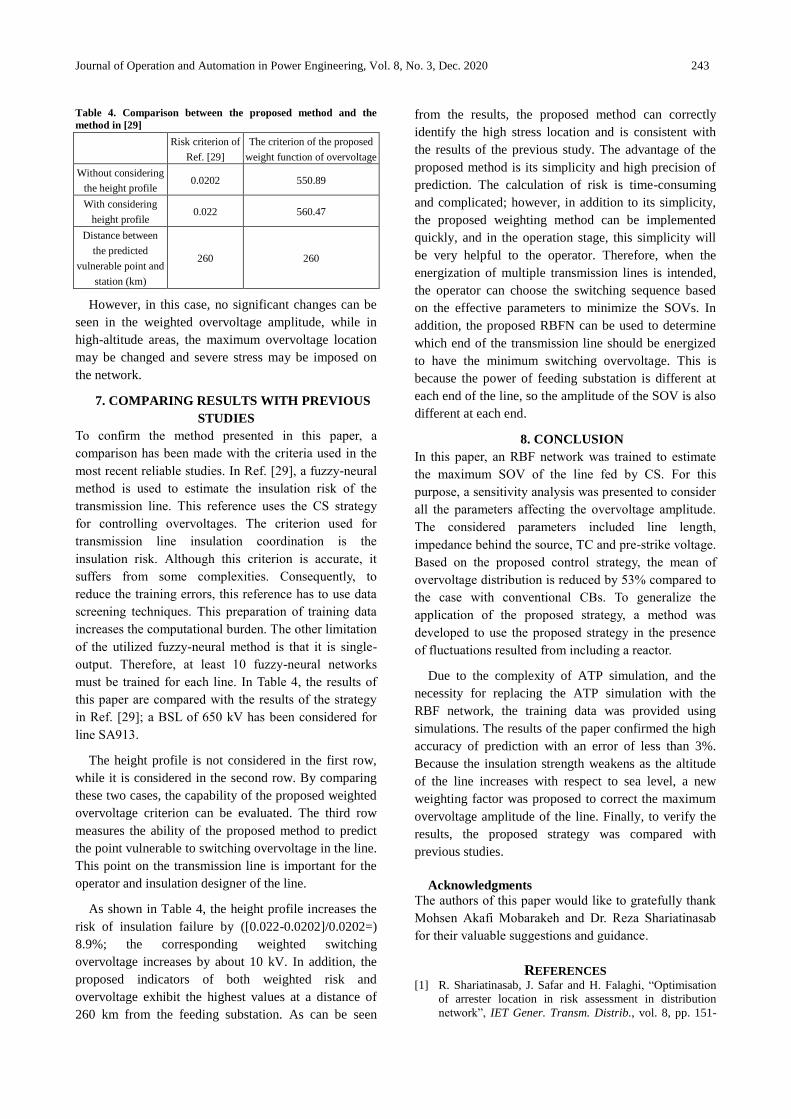
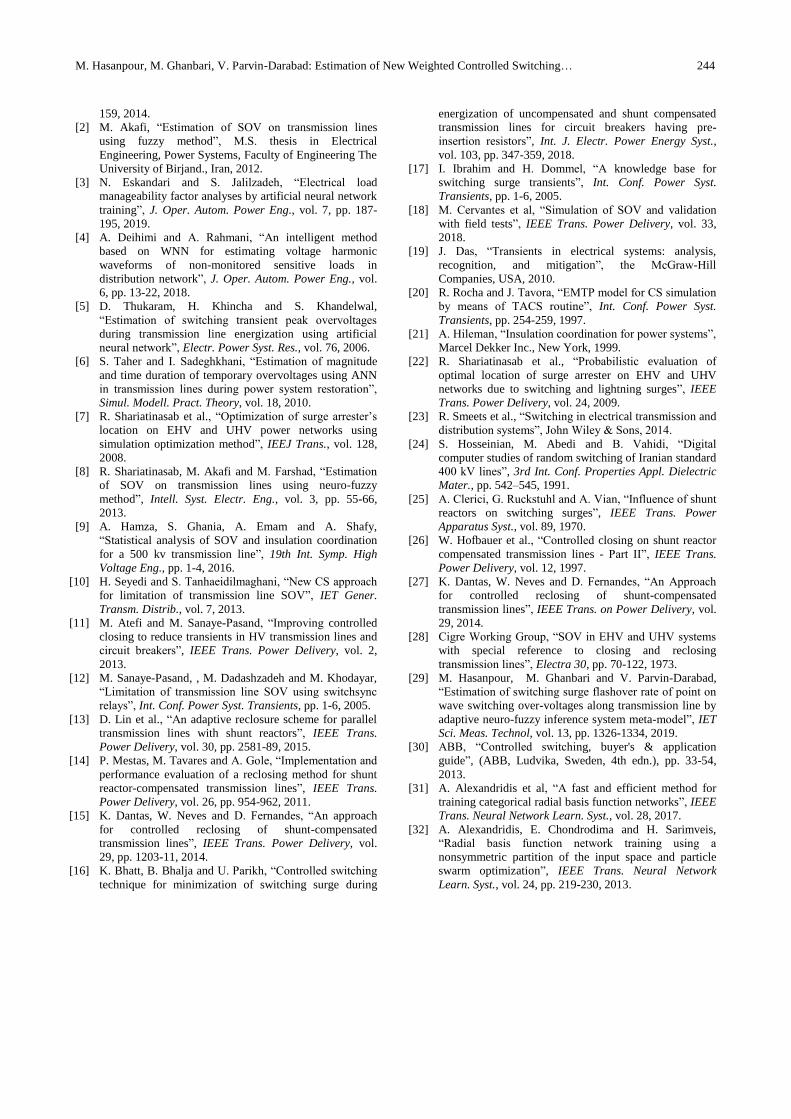
kV. In Fig. 14, the transient SOV at the end of the line
(D0, according to Fig. 2) is shown. The maximum SOV
is equal to 550 kV.
The transient voltage across all phase is plotted in
Fig. 14 with the optimal delay time of 18.1 msec
(≈300000/[400000√2/√3]×[1/50Hz]). A TC voltage of
300000 V is selected for a 400 kV voltage level [24].
The terminals of phase C are closed once the voltages of
the line and source become equal, which results in a
small SOV value. A similar process is used for the other
phases with a 120-degree difference based on their
waveforms. The maximum SOV is equal to 435 kV.
From Figs. 14 and 15, the value of TC is constant and
equal to 1 p.u. (=342928 volts) before the CB is closed.
The amplitude of maximum SOV is larger than the
amplitudes of the SOVs of the three phases.
Fig. 13. Weighted maximum overvoltage profile of the line
under study (Vbase=342928 volts)
Fig. 14. Transient overvoltage across the CB
Fig. 15. Transient overvoltage at the end of line SA913
(Vbase=342928 volts)
Journal of Operation and Automation in Power Engineering, Vol. 8, No. 3, Dec. 2020 243
Table 4. Comparison between the proposed method and the
method in [29]
Risk criterion of
Ref. [29]
The criterion of the proposed
weight function of overvoltage
Without considering
the height profile 0.0202 550.89
With considering
height profile 0.022 560.47
Distance between
the predicted
vulnerable point and
station (km)
260 260
However, in this case, no significant changes can be
seen in the weighted overvoltage amplitude, while in
high-altitude areas, the maximum overvoltage location
may be changed and severe stress may be imposed on
the network.
7. COMPARING RESULTS WITH PREVIOUS
STUDIES
To confirm the method presented in this paper, a
comparison has been made with the criteria used in the
most recent reliable studies. In Ref. [29], a fuzzy-neural
method is used to estimate the insulation risk of the
transmission line. This reference uses the CS strategy
for controlling overvoltages. The criterion used for
transmission line insulation coordination is the
insulation risk. Although this criterion is accurate, it
suffers from some complexities. Consequently, to
reduce the training errors, this reference has to use data
screening techniques. This preparation of training data
increases the computational burden. The other limitation
of the utilized fuzzy-neural method is that it is single-
output. Therefore, at least 10 fuzzy-neural networks
must be trained for each line. In Table 4, the results of
this paper are compared with the results of the strategy
in Ref. [29]; a BSL of 650 kV has been considered for
line SA913.
The height profile is not considered in the first row,
while it is considered in the second row. By comparing
these two cases, the capability of the proposed weighted
overvoltage criterion can be evaluated. The third row
measures the ability of the proposed method to predict
the point vulnerable to switching overvoltage in the line.
This point on the transmission line is important for the
operator and insulation designer of the line.
As shown in Table 4, the height profile increases the
risk of insulation failure by ([0.022-0.0202]/0.0202=)
8.9%; the corresponding weighted switching
overvoltage increases by about 10 kV. In addition, the
proposed indicators of both weighted risk and
overvoltage exhibit the highest values at a distance of
260 km from the feeding substation. As can be seen
from the results, the proposed method can correctly
identify the high stress location and is consistent with
the results of the previous study. The advantage of the
proposed method is its simplicity and high precision of
prediction. The calculation of risk is time-consuming
and complicated; however, in addition to its simplicity,
the proposed weighting method can be implemented
quickly, and in the operation stage, this simplicity will
be very helpful to the operator. Therefore, when the
energization of multiple transmission lines is intended,
the operator can choose the switching sequence based
on the effective parameters to minimize the SOVs. In
addition, the proposed RBFN can be used to determine
which end of the transmission line should be energized
to have the minimum switching overvoltage. This is
because the power of feeding substation is different at
each end of the line, so the amplitude of the SOV is also
different at each end.
8. CONCLUSION
In this paper, an RBF network was trained to estimate
the maximum SOV of the line fed by CS. For this
purpose, a sensitivity analysis was presented to consider
all the parameters affecting the overvoltage amplitude.
The considered parameters included line length,
impedance behind the source, TC and pre-strike voltage.
Based on the proposed control strategy, the mean of
overvoltage distribution is reduced by 53% compared to
the case with conventional CBs. To generalize the
application of the proposed strategy, a method was
developed to use the proposed strategy in the presence
of fluctuations resulted from including a reactor.
Due to the complexity of ATP simulation, and the
necessity for replacing the ATP simulation with the
RBF network, the training data was provided using
simulations. The results of the paper confirmed the high
accuracy of prediction with an error of less than 3%.
Because the insulation strength weakens as the altitude
of the line increases with respect to sea level, a new
weighting factor was proposed to correct the maximum
overvoltage amplitude of the line. Finally, to verify the
results, the proposed strategy was compared with
previous studies.
Acknowledgments
The authors of this paper would like to gratefully thank
Mohsen Akafi Mobarakeh and Dr. Reza Shariatinasab
for their valuable suggestions and guidance.
REFERENCES [1] R. Shariatinasab, J. Safar and H. Falaghi, “Optimisation
of arrester location in risk assessment in distribution
network”, IET Gener. Transm. Distrib., vol. 8, pp. 151-
M. Hasanpour, M. Ghanbari, V. Parvin-Darabad: Estimation of New Weighted Controlled Switching… 244
159, 2014.
[2] M. Akafi, “Estimation of SOV on transmission lines
using fuzzy method”, M.S. thesis in Electrical
Engineering, Power Systems, Faculty of Engineering The
University of Birjand., Iran, 2012.
[3] N. Eskandari and S. Jalilzadeh, “Electrical load
manageability factor analyses by artificial neural network
training”, J. Oper. Autom. Power Eng., vol. 7, pp. 187-
195, 2019.
[4] A. Deihimi and A. Rahmani, “An intelligent method
based on WNN for estimating voltage harmonic
waveforms of non-monitored sensitive loads in
distribution network”, J. Oper. Autom. Power Eng., vol.
6, pp. 13-22, 2018.
[5] D. Thukaram, H. Khincha and S. Khandelwal,
“Estimation of switching transient peak overvoltages
during transmission line energization using artificial
neural network”, Electr. Power Syst. Res., vol. 76, 2006.
[6] S. Taher and I. Sadeghkhani, “Estimation of magnitude
and time duration of temporary overvoltages using ANN
in transmission lines during power system restoration”,
Simul. Modell. Pract. Theory, vol. 18, 2010.
[7] R. Shariatinasab et al., “Optimization of surge arrester’s
location on EHV and UHV power networks using
simulation optimization method”, IEEJ Trans., vol. 128,
2008.
[8] R. Shariatinasab, M. Akafi and M. Farshad, “Estimation
of SOV on transmission lines using neuro-fuzzy
method”, Intell. Syst. Electr. Eng., vol. 3, pp. 55-66,
2013.
[9] A. Hamza, S. Ghania, A. Emam and A. Shafy,
“Statistical analysis of SOV and insulation coordination
for a 500 kv transmission line”, 19th Int. Symp. High
Voltage Eng., pp. 1-4, 2016.
[10] H. Seyedi and S. Tanhaeidilmaghani, “New CS approach
for limitation of transmission line SOV”, IET Gener.
Transm. Distrib., vol. 7, 2013.
[11] M. Atefi and M. Sanaye-Pasand, “Improving controlled
closing to reduce transients in HV transmission lines and
circuit breakers”, IEEE Trans. Power Delivery, vol. 2,
2013.
[12] M. Sanaye-Pasand, , M. Dadashzadeh and M. Khodayar,
“Limitation of transmission line SOV using switchsync
relays”, Int. Conf. Power Syst. Transients, pp. 1-6, 2005.
[13] D. Lin et al., “An adaptive reclosure scheme for parallel
transmission lines with shunt reactors”, IEEE Trans.
Power Delivery, vol. 30, pp. 2581-89, 2015.
[14] P. Mestas, M. Tavares and A. Gole, “Implementation and
performance evaluation of a reclosing method for shunt
reactor-compensated transmission lines”, IEEE Trans.
Power Delivery, vol. 26, pp. 954-962, 2011.
[15] K. Dantas, W. Neves and D. Fernandes, “An approach
for controlled reclosing of shunt-compensated
transmission lines”, IEEE Trans. Power Delivery, vol.
29, pp. 1203-11, 2014.
[16] K. Bhatt, B. Bhalja and U. Parikh, “Controlled switching
technique for minimization of switching surge during
energization of uncompensated and shunt compensated
transmission lines for circuit breakers having pre-
insertion resistors”, Int. J. Electr. Power Energy Syst.,
vol. 103, pp. 347-359, 2018.
[17] I. Ibrahim and H. Dommel, “A knowledge base for
switching surge transients”, Int. Conf. Power Syst.
Transients, pp. 1-6, 2005.
[18] M. Cervantes et al, “Simulation of SOV and validation
with field tests”, IEEE Trans. Power Delivery, vol. 33,
2018.
[19] J. Das, “Transients in electrical systems: analysis,
recognition, and mitigation”, the McGraw-Hill
Companies, USA, 2010.
[20] R. Rocha and J. Tavora, “EMTP model for CS simulation
by means of TACS routine”, Int. Conf. Power Syst.
Transients, pp. 254-259, 1997.
[21] A. Hileman, “Insulation coordination for power systems”,
Marcel Dekker Inc., New York, 1999.
[22] R. Shariatinasab et al., “Probabilistic evaluation of
optimal location of surge arrester on EHV and UHV
networks due to switching and lightning surges”, IEEE
Trans. Power Delivery, vol. 24, 2009.
[23] R. Smeets et al., “Switching in electrical transmission and
distribution systems”, John Wiley & Sons, 2014.
[24] S. Hosseinian, M. Abedi and B. Vahidi, “Digital
computer studies of random switching of Iranian standard
400 kV lines”, 3rd Int. Conf. Properties Appl. Dielectric
Mater., pp. 542–545, 1991.
[25] A. Clerici, G. Ruckstuhl and A. Vian, “Influence of shunt
reactors on switching surges”, IEEE Trans. Power
Apparatus Syst., vol. 89, 1970.
[26] W. Hofbauer et al., “Controlled closing on shunt reactor
compensated transmission lines - Part II”, IEEE Trans.
Power Delivery, vol. 12, 1997.
[27] K. Dantas, W. Neves and D. Fernandes, “An Approach
for controlled reclosing of shunt-compensated
transmission lines”, IEEE Trans. on Power Delivery, vol.
29, 2014.
[28] Cigre Working Group, “SOV in EHV and UHV systems
with special reference to closing and reclosing
transmission lines”, Electra 30, pp. 70-122, 1973.
[29] M. Hasanpour, M. Ghanbari and V. Parvin-Darabad,
“Estimation of switching surge flashover rate of point on
wave switching over-voltages along transmission line by
adaptive neuro-fuzzy inference system meta-model”, IET
Sci. Meas. Technol, vol. 13, pp. 1326-1334, 2019.
[30] ABB, “Controlled switching, buyer's & application
guide”, (ABB, Ludvika, Sweden, 4th edn.), pp. 33-54,
2013.
[31] A. Alexandridis et al, “A fast and efficient method for
training categorical radial basis function networks”, IEEE
Trans. Neural Network Learn. Syst., vol. 28, 2017.
[32] A. Alexandridis, E. Chondrodima and H. Sarimveis,
“Radial basis function network training using a
nonsymmetric partition of the input space and particle
swarm optimization”, IEEE Trans. Neural Network
Learn. Syst., vol. 24, pp. 219-230, 2013.