Embed Size (px)
Citation preview
ISSN 1062-8738, Bulletin of the Russian Academy of Sciences: Physics, 2007, Vol. 71, No. 4, pp. 448–450. © Allerton Press, Inc., 2007.Original Russian Text © A.A. Ivanov, S.P. Knurenko, A.A. Lagutin, M.I. Pravdin, A.V. Saburov, I.E. Sleptsov, 2007, published in Izvestiya Rossiiskoi Akademii Nauk. Seriya Fiz-icheskaya, 2007, Vol. 71, No. 4, pp. 467–469.
448
INTRODUCTION
In detection of the mass composition of primarycosmic rays (CRs), a promising method is based onsimultaneous analysis of the longitudinal (cascadecurve of the extensive air shower (EAS) development)and transverse (structural function of the electron,muon, and Cherenkov components) EAS development.Complex measurement of the shower characteristicsmakes it possible to reconstruct the CR mass composi-tion using special mathematical methods, for example,the method for solving inverse problems [1–3], the sim-plex method [4], etc. In [5, 6], a method for identifyingthe primary particle type was proposed, which is basedon the use of the combination of two EAS characteris-tics: the depth
X
max
of maximum shower developmentand the flux density
ρ
600
of electrons and muons at a dis-tance of 600 m from the shower core. This methodallows one to divide showers into those generated byprimary protons and iron nuclei using the data on
X
max
and
ρ
600
.
The purpose of this study is to estimate the primaryCR (PCR) mass composition in the energy range
10
17
–10
19
eV on the basis of the experimental data on the lon-gitudinal and radial EAS development obtained at theYakutsk array.
METHOD FOR ANALYSIS
To interpret the experimental data obtained at theYakutsk array, we used the bank of calculated values of
X
max
and
ρ
600
formed using the CORSIKA code (v.6.0,QGSJET model). Calculations were performed for fivetypes of primary particles (p, He, C, Si, Fe) and three
Estimation of the PCR Mass Composition in the Energy Range 10
17
–10
19
eV on the Basis of Multicomponent Analysisof the Characteristics of EASs Detected
at the Yakutsk Array
A. A. Ivanov
a
, S. P. Knurenko
a
, A. A. Lagutin
b
, M. I. Pravdin
a
, A. V. Saburov
a
, and I. E. Sleptsov
a
a
Shafer Institute of Cosmophysical Research and Aeronomy, Siberian Division, Russian Academy of Sciences, Yakutsk, 677980 Russia
b
Altai State University, ul. Dmitrova 66, Barnaul, 656099 Russiae-mail: [email protected]
Abstract
—The characteristics of longitudinal and radial extensive air shower development derived from theresults of detection of the charged particle flux and Cherenkov light in extensive air showers at the Yakutskarray. To estimate the primary cosmic ray composition, a combination of the parameters
X
max
and
ρ
600
and thedatabase simulated using the CORSIKA code (QGSJET model) for showers generated by five types of nuclei(p, He, C, Si, Fe) in the energy range
10
17
–10
19
eV were used. Application of the multicomponent method madeit possible to divide the showers into three groups (p + He), C, and (Si + Fe) and estimate their percentage. Theerror in identifying nuclei in the energy range
10
17
–10
18
eV does not exceed 30%.
DOI:
10.3103/S1062873807040028
1000
0.1 100
ρ
600
,
m
–2
X
max
,
g cm
–2
101
900
800
700
600
500
400
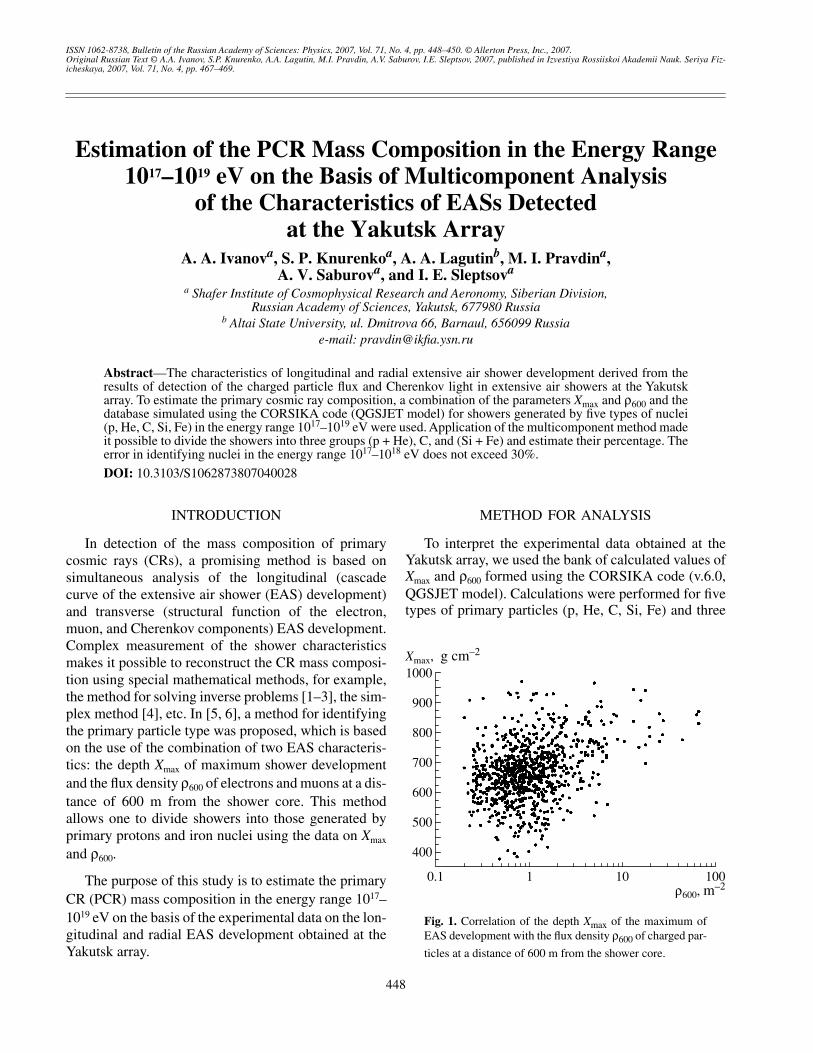
Fig. 1.
Correlation of the depth
X
max
of the maximum ofEAS development with the flux density
ρ
600
of charged par-
ticles at a distance of 600 m from the shower core.
BULLETIN OF THE RUSSIAN ACADEMY OF SCIENCES: PHYSICS
Vol. 71
No. 4
2007
ESTIMATION OF THE PCR MASS COMPOSITION IN THE ENERGY RANGE 449
primary energies:
10
17
, 10
18
, and
10
19
eV. Two-dimen-sional probability densities
F
(
X
max
,
ρ
600
)
were used afterthe procedure of experimental data standardizationthroughout the entire array (
X
max
,
ρ
600
). In the numericalimplementation of this method, the variables
τ
and
ρ
were used instead of (
X
max
,
ρ
600
):
(1)
(2)
where
σ
i
is the mean-square deviation of a quantity
i
.For each energy under consideration and different
types of primary nuclei, including those combined intothe (p + He), C, and (Si + Fe) groups, the probabilitydensity distributions
f
(
τ
,
ρ
)
were plotted. Intersection ofthe
f
(
τ
,
ρ
)
surfaces gives a line optimally separating the(p + He) and (Si + Fe) groups from C. The simulationshowed that in such partition into three groups the effi-ciency of falling of nuclei from the (p + He) and (Si +Fe) groups into zones 1 and 3 reaches 90%. In zone 2,strong mixing of showers from different types of pri-mary particles occurs and the fraction of carbon nucleiis
~50%
of all particles in this zone.
RESULTS AND DISCUSSION
Figure 1 shows the dependence of the parameter
X
max
on
ρ
600
. Here,
X
max
characterizes the maximum ofthe cascade development of an individual shower, while
ρ
600
is the particle density at the observation level. Fig-ure 1 indicates that there is a correlation between theobserved maximum of the shower development and theflux density of charged particles.
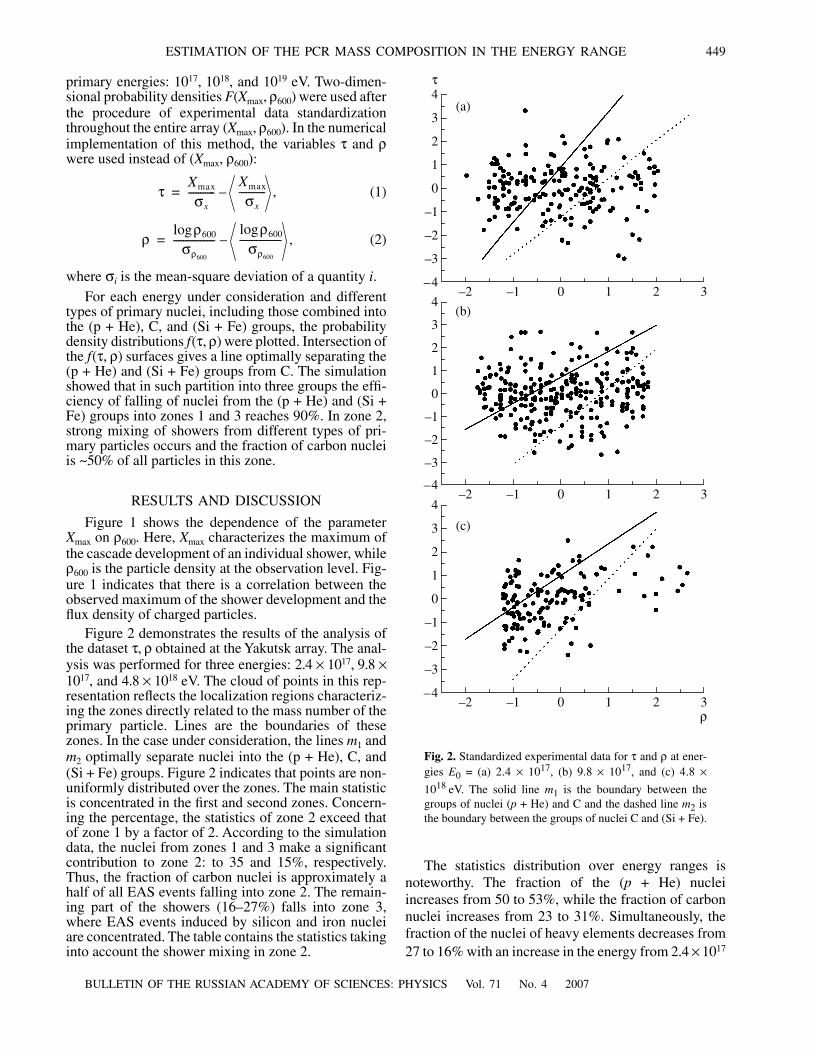
Figure 2 demonstrates the results of the analysis ofthe dataset
τ
,
ρ
obtained at the Yakutsk array. The anal-ysis was performed for three energies:
2.4
×
10
17
, 9.8
×
10
17
, and
4.8
×
10
18
eV. The cloud of points in this rep-resentation reflects the localization regions characteriz-ing the zones directly related to the mass number of theprimary particle. Lines are the boundaries of thesezones. In the case under consideration, the lines
m
1
and
m
2
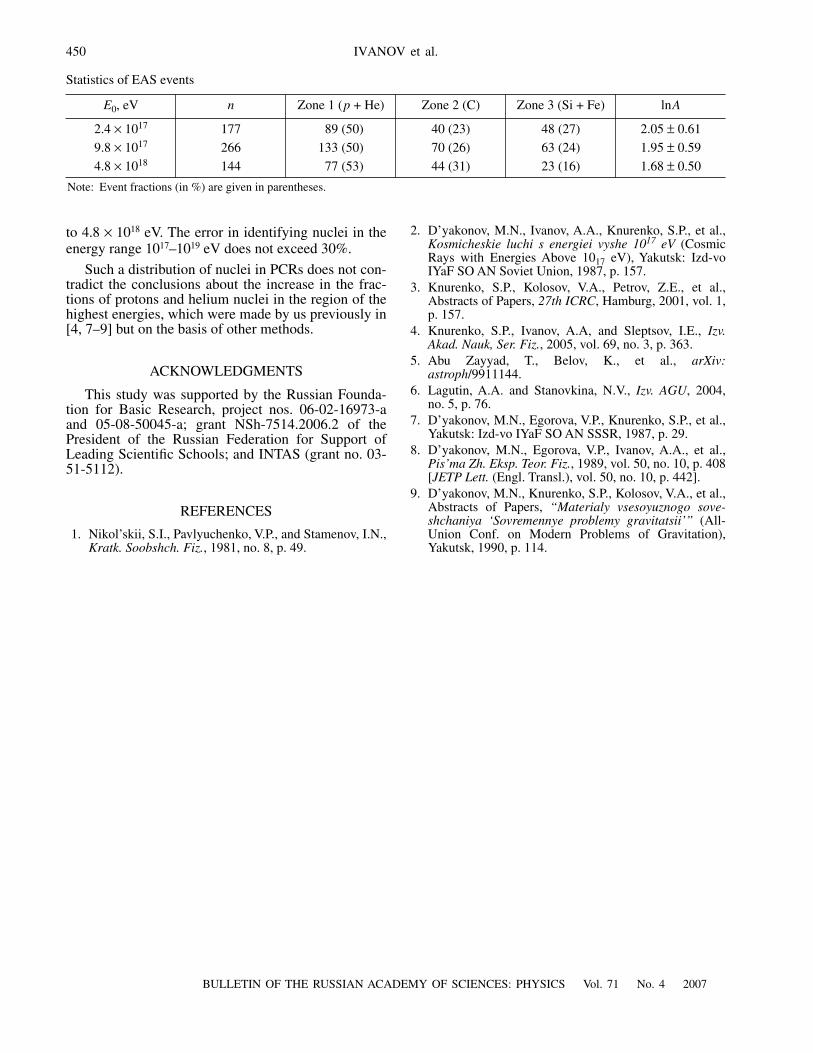
optimally separate nuclei into the (p + He), C, and(Si + Fe) groups. Figure 2 indicates that points are non-uniformly distributed over the zones. The main statisticis concentrated in the first and second zones. Concern-ing the percentage, the statistics of zone 2 exceed thatof zone 1 by a factor of 2. According to the simulationdata, the nuclei from zones 1 and 3 make a significantcontribution to zone 2: to 35 and 15%, respectively.Thus, the fraction of carbon nuclei is approximately ahalf of all EAS events falling into zone 2. The remain-ing part of the showers (16–27%) falls into zone 3,where EAS events induced by silicon and iron nucleiare concentrated. The table contains the statistics takinginto account the shower mixing in zone 2.
τXmax
σx
-----------Xmax
σx
----------- ,–=
ρρ600log
σρ600
-----------------ρ600log
σρ600
----------------- ,–=
The statistics distribution over energy ranges isnoteworthy. The fraction of the (
p
+ He) nucleiincreases from 50 to 53%, while the fraction of carbonnuclei increases from 23 to 31%. Simultaneously, thefraction of the nuclei of heavy elements decreases from27 to 16% with an increase in the energy from
2.4
×
10
17
4
3
ρ
3
2
1
0
–1
–2
–3
–4210–1–2
(c)
4
3
3
2
1
0
–1
–2
–3
–4210–1–2
(b)
4
3
3
2
1
0
–1
–2
–3
–4210–1–2
(a)
τ
Fig. 2.
Standardized experimental data for
τ
and
ρ
at ener-gies
E
0
= (a)
2.4
×
10
17, (b) 9.8 × 10¹⁷, and (c) 4.8 ×10¹⁸ eV. The solid line m1 is the boundary between thegroups of nuclei (p + He) and C and the dashed line m2 isthe boundary between the groups of nuclei C and (Si + Fe).
450
BULLETIN OF THE RUSSIAN ACADEMY OF SCIENCES: PHYSICS Vol. 71 No. 4 2007
IVANOV et al.
to 4.8 × 10¹⁸ eV. The error in identifying nuclei in theenergy range 1017–1019 eV does not exceed 30%.
Such a distribution of nuclei in PCRs does not con-tradict the conclusions about the increase in the frac-tions of protons and helium nuclei in the region of thehighest energies, which were made by us previously in[4, 7–9] but on the basis of other methods.
ACKNOWLEDGMENTS
This study was supported by the Russian Founda-tion for Basic Research, project nos. 06-02-16973-aand 05-08-50045-a; grant NSh-7514.2006.2 of thePresident of the Russian Federation for Support ofLeading Scientific Schools; and INTAS (grant no. 03-51-5112).
REFERENCES
1. Nikol’skii, S.I., Pavlyuchenko, V.P., and Stamenov, I.N.,Kratk. Soobshch. Fiz., 1981, no. 8, p. 49.
2. D’yakonov, M.N., Ivanov, A.A., Knurenko, S.P., et al.,Kosmicheskie luchi s energiei vyshe 1017 eV (CosmicRays with Energies Above 1017 eV), Yakutsk: Izd-voIYaF SO AN Soviet Union, 1987, p. 157.
3. Knurenko, S.P., Kolosov, V.A., Petrov, Z.E., et al.,Abstracts of Papers, 27th ICRC, Hamburg, 2001, vol. 1,p. 157.
4. Knurenko, S.P., Ivanov, A.A, and Sleptsov, I.E., Izv.Akad. Nauk, Ser. Fiz., 2005, vol. 69, no. 3, p. 363.
5. Abu Zayyad, T., Belov, K., et al., arXiv:astroph/9911144.
6. Lagutin, A.A. and Stanovkina, N.V., Izv. AGU, 2004,no. 5, p. 76.
7. D’yakonov, M.N., Egorova, V.P., Knurenko, S.P., et al.,Yakutsk: Izd-vo IYaF SO AN SSSR, 1987, p. 29.
8. D’yakonov, M.N., Egorova, V.P., Ivanov, A.A., et al.,Pis’ma Zh. Eksp. Teor. Fiz., 1989, vol. 50, no. 10, p. 408[JETP Lett. (Engl. Transl.), vol. 50, no. 10, p. 442].
9. D’yakonov, M.N., Knurenko, S.P., Kolosov, V.A., et al.,Abstracts of Papers, “Materialy vsesoyuznogo sove-shchaniya ‘Sovremennye problemy gravitatsii’” (All-Union Conf. on Modern Problems of Gravitation),Yakutsk, 1990, p. 114.
Statistics of EAS events
E0, eV n Zone 1 (p + He) Zone 2 (C) Zone 3 (Si + Fe) lnA
2.4 × 10¹⁷ 177 89 (50) 40 (23) 48 (27) 2.05 ± 0.61
9.8 × 10¹⁷ 266 133 (50) 70 (26) 63 (24) 1.95 ± 0.59
4.8 × 10¹⁸ 144 77 (53) 44 (31) 23 (16) 1.68 ± 0.50
Note: Event fractions (in %) are given in parentheses.