Embed Size (px)
Citation preview
Estimation of Wave Parameters from Accelerometryto Aid AUV-shore Communication
Arvind A. PereiraRobotic Embedded Systems Laboratory
University of Southern [email protected]
http://robotics.usc.edu/~ampereir
Gaurav S. SukhatmeRobotic Embedded Systems Laboratory
University of Southern [email protected]
http://robotics.usc.edu/~gaurav
Abstract—Commercial off-the-shelf autonomous underwatervehicles (AUVs) are commonly equipped with short range radios(for high bandwidth, low-cost close range operation) and satellitemodems (for low bandwidth, global operation). In a coastalobservatory it should thus be possible to exploit an AUVs’proximity to the coast to use the short range radios when vehiclesare within useful communication range of coastal base stations,and to use satellite communications otherwise. Measurements inthe coastal ocean using a Slocum glider and a network of elevated,coastal base stations show that the useful communication rangedepends strongly on two parameters 1) the distance between thevehicle and the base station, and 2) the local sea state experiencedby the vehicle. Here we describe measurements of communicationquality in a coastal setting over 206 glider surfacing events atranges between 2.4 and 16 km from the base station. The gliderwas instrumented with an accelerometer. At each surfacing, theaccelerations experienced by the glider due to the local seastate were recorded concurrently with communication quality.Analysis of these measurements provides the first evidence thatit is possible to predict communication quality from the sea stateat a vehicle’s location and the distance between the vehicle andthe nearest base station. This enables a simple, yet useful, pieceof logic that allows onboard decision making on whether thevehicle should use its short range radio or its satellite modem.We discuss how this finding enables online modification of low-level communication protocol parameters.
I. INTRODUCTION
Autonomous Underwater Vehicles (AUVs) are helpingoceanographers by improving sampling capabilities and actingas an extension to traditional ship-based methods by vastlyincreasing spatiotemporal sampling resolution. Gliders are atype of low-speed, long-range AUV that use gravity andbuoyancy for energy-efficient propulsion [1], [5], [6], [7], [11],[12]. These vehicles can be deployed unattended at sea forlong periods of time (e.g., several weeks) during which theyintermittently communicate with their operators, typically viasatellite phone (e.g., Iridium).
Networked coastal observatories are coming online [10],[14]. When operating these vehicles in coastal regions it ispossible to utilize the radio modems on these vehicles [3],[13]. This reduces operational costs while improving com-munication speeds (compared to slower satellite-based com-munication methods). However such a setup requires startupcosts related to setting up the coast base stations. A coastalcommunication framework in the Southern California Bight
(SCB)1 is discussed in our prior work [9]. In this work wereported the development of a lightweight TCP-like communi-cation protocol that performs communication between a gliderat the water surface and a network of coastal base stations(each station is equipped with a Freewave radio modem). Theprimary motivation for doing this was to lower operationalcost by reducing Iridium usage which constitutes a significantportion of operational costs for the vehicle. Our protocolallows the transfer of large files at high speed, providing animprovement of ∼24x over Iridium-based communications.This allows the gliders to spend less time at the surface thusimproving operational safety; an important consideration ina busy coastal area such as the SCB. The communicationprotocol was designed from the ground up to handle multiplegliders communicating with multiple Freewave sites - a featurewhich is not easily possible with the commercial off-the-shelfSlocum gliders.
Figure 1 (based on an earlier version in [9]) shows how aglider at the surface can use either its Iridium satellite phone tocommunicate directly with a modem connected to the shore-side glider control server or it can communicate with the servervia shore-based base stations using its Freewave radio modem.The figure also gives a logical overview of the typical data flowbetween the glider’s main computer and the communicationlogic running on the glider’s secondary computer which wehave added to the commercial off-the-shelf system.
In a typical deployment where the glider’s antenna isapproximately 30 cm above the sea surface during a surfacing,waves near the glider can cut off visibility of the shore basedantenna. However there are short periods of time when theglider may be riding the crest of a wave which is locally higherthan others, thus giving it line-of-sight (LOS) to the basestation. Since sea waves are periodic, we expect to periodicallyobtain communication between the glider and the base stationwhen the glider is at such locally elevated positions. A longterm objective of this research is to exploit the periodicity ofthese drops in LOS (and hence the link itself) to adapt packetsize to improve the link-state protocol between the glider andthe base stations.
1The SCB is the oceanic region contained within 32◦ N to 34.5◦ N and−117◦ E to −121◦ E

900MHzRadio
File-Transfer Module
Glider-Base communications
Module
Glider-console parser and
command/status module
File-Txfer via Z-
modem
Glider-Gumstix communications Module
Glider Radio Modem
Iridium Satellite
Internet
Phone Modem
Base Station with
Radio Modem and Internet
Iridium Tranceiver
Station
Glider Computer(Flight Persistor)
Gumstix
Satellite Data-Link
Slocum Gliderat Sea Surface
Status CommandsFiles
Glider-Base communications
Module
Base-Station Computer
Base to GliderServer Communications
Module
Glider-Control Server
Glider-Serverto GliderClients
Module
Central Server with Internet
Web Interface
Internet
Iridiumserial-data
FreewaveSerial Data
Fig. 1. A Block diagram depicting the communication system and the shore-based Glider Mission control server which allows users to plan missions andview the status of the glider through a web-based interface.
Fig. 2. A deployed Slocum glider. Note the nose-down posture with the tailelevated to facilitate communication. In this picture, the antenna is locatedapproximately 30 cm above the sea surface.
The Freewave modem [15] we use in the experimentsdescribed here has in-built buffering and re-transmissions toensure a reliable modem to modem link. If the link betweenthe modems drops long enough, the modems lose carrier. Inthis case it takes longer for successful communication to takeplace.
While our ultimate goal is to determine appropriate commu-nication parameters from test packets and accelerometry, herewe discuss progress in the first step towards this goal. We
BaseStation
Antenna
Ha
LOS line between antennae
Typically only height of antennae and curvature of the earth affect LOS range
Near horizon, small waves may
obstruct LOS
Communication Range
Sea surface Curvature of earth
Gliderat
Surface
Fig. 3. Schematic depiction of glider to shore line-of-sight (LOS) obstructiondue to waves. (not to scale)
present results from recent field tests to measure the impactof sea state on communications. These measurements establishthat the useful terrestrial radio communication range dependsstrongly on the vehicle to base station distance as well asthe local sea state experienced by the vehicle. Our analysissuggests that it is possible to predict communication qualityfrom the sea state at the vehicle’s location and the distancebetween the vehicle and the nearest base station. This, inturn, enables the vehicle to make a decision on whether itshould use its short range radio or its satellite modem. Wediscuss how this finding enables online modification of low-
level communication protocol parameters (e.g., packet size, inanalogy with GSM networks [8])
II. HARDWARE MODIFICATIONS AND COMMUNICATIONPROTOCOL DESIGN
In this section we describe, in brief, modifications per-formed on a commercial off-the-shelf glider to enable themto use our communication protocol as well as to collectaccelerometer data to assess the effect of sea surface condi-tions on our communication system, in a minimally intrusivemanner. Next, we describe the communication protocol usedto communicate between a glider and a base-station it iscommunicating with.
A. Hardware Modifications
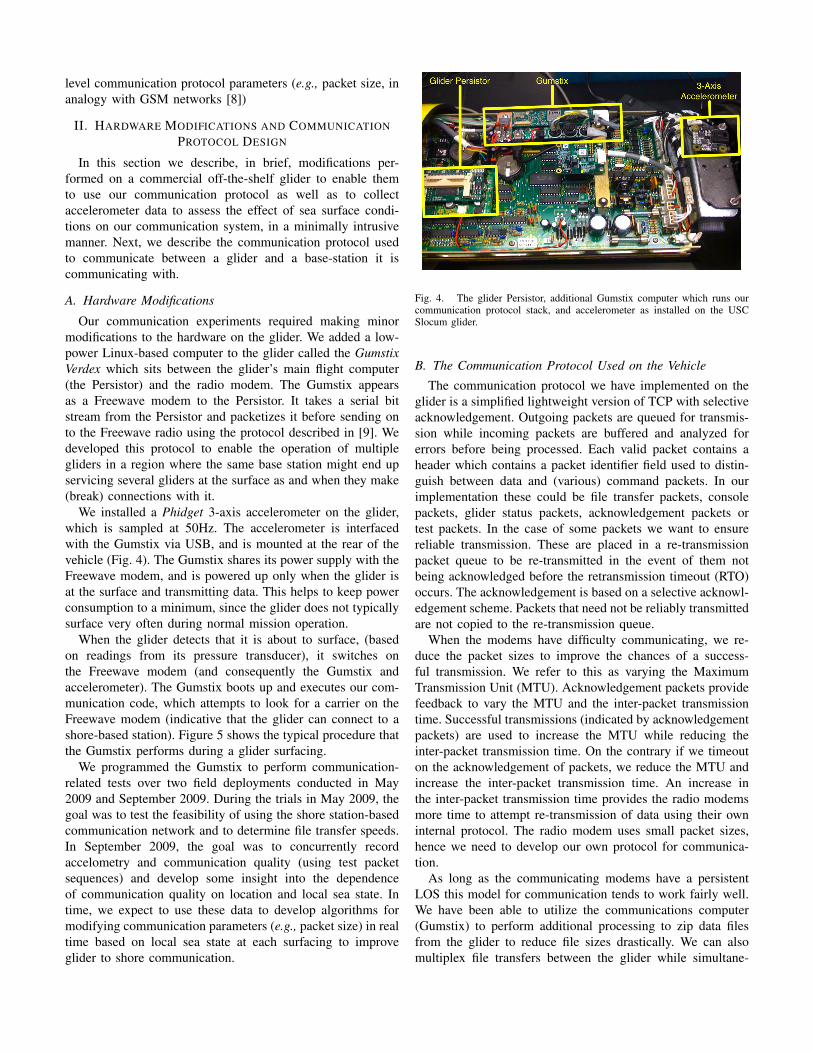
Our communication experiments required making minormodifications to the hardware on the glider. We added a low-power Linux-based computer to the glider called the GumstixVerdex which sits between the glider’s main flight computer(the Persistor) and the radio modem. The Gumstix appearsas a Freewave modem to the Persistor. It takes a serial bitstream from the Persistor and packetizes it before sending onto the Freewave radio using the protocol described in [9]. Wedeveloped this protocol to enable the operation of multiplegliders in a region where the same base station might end upservicing several gliders at the surface as and when they make(break) connections with it.
We installed a Phidget 3-axis accelerometer on the glider,which is sampled at 50Hz. The accelerometer is interfacedwith the Gumstix via USB, and is mounted at the rear of thevehicle (Fig. 4). The Gumstix shares its power supply with theFreewave modem, and is powered up only when the glider isat the surface and transmitting data. This helps to keep powerconsumption to a minimum, since the glider does not typicallysurface very often during normal mission operation.
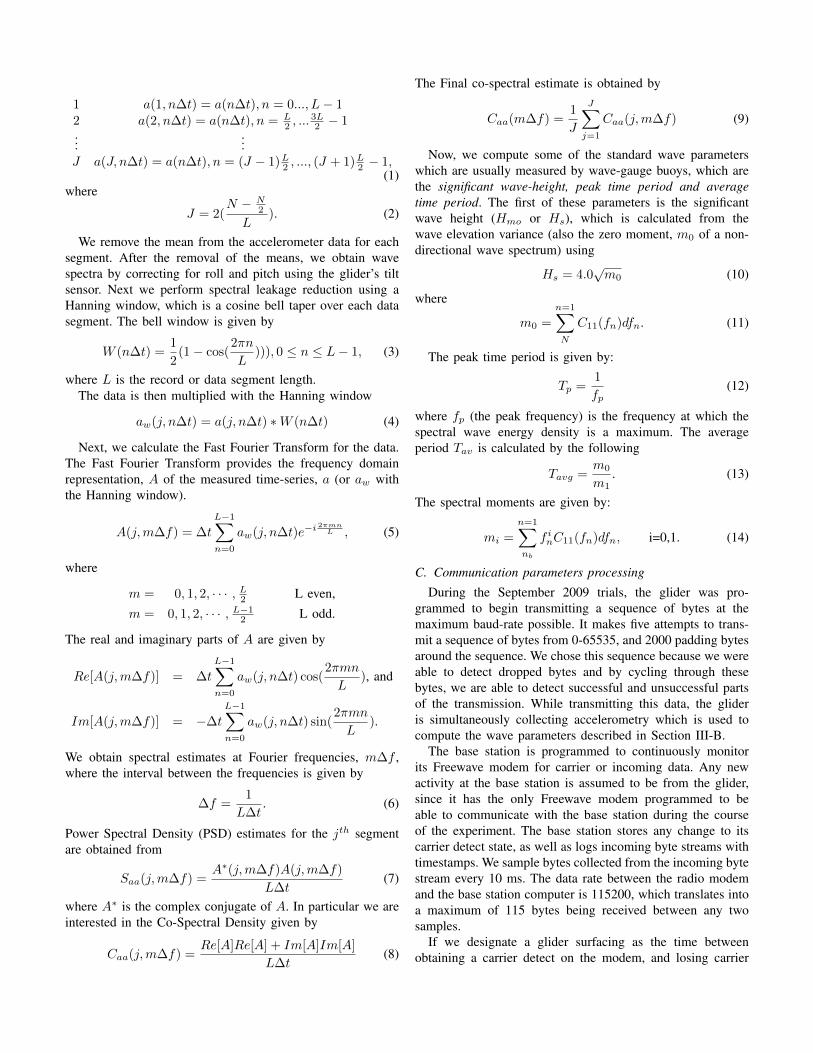
When the glider detects that it is about to surface, (basedon readings from its pressure transducer), it switches onthe Freewave modem (and consequently the Gumstix andaccelerometer). The Gumstix boots up and executes our com-munication code, which attempts to look for a carrier on theFreewave modem (indicative that the glider can connect to ashore-based station). Figure 5 shows the typical procedure thatthe Gumstix performs during a glider surfacing.
We programmed the Gumstix to perform communication-related tests over two field deployments conducted in May2009 and September 2009. During the trials in May 2009, thegoal was to test the feasibility of using the shore station-basedcommunication network and to determine file transfer speeds.In September 2009, the goal was to concurrently recordaccelometry and communication quality (using test packetsequences) and develop some insight into the dependenceof communication quality on location and local sea state. Intime, we expect to use these data to develop algorithms formodifying communication parameters (e.g., packet size) in realtime based on local sea state at each surfacing to improveglider to shore communication.
Fig. 4. The glider Persistor, additional Gumstix computer which runs ourcommunication protocol stack, and accelerometer as installed on the USCSlocum glider.
B. The Communication Protocol Used on the Vehicle
The communication protocol we have implemented on theglider is a simplified lightweight version of TCP with selectiveacknowledgement. Outgoing packets are queued for transmis-sion while incoming packets are buffered and analyzed forerrors before being processed. Each valid packet contains aheader which contains a packet identifier field used to distin-guish between data and (various) command packets. In ourimplementation these could be file transfer packets, consolepackets, glider status packets, acknowledgement packets ortest packets. In the case of some packets we want to ensurereliable transmission. These are placed in a re-transmissionpacket queue to be re-transmitted in the event of them notbeing acknowledged before the retransmission timeout (RTO)occurs. The acknowledgement is based on a selective acknowl-edgement scheme. Packets that need not be reliably transmittedare not copied to the re-transmission queue.
When the modems have difficulty communicating, we re-duce the packet sizes to improve the chances of a success-ful transmission. We refer to this as varying the MaximumTransmission Unit (MTU). Acknowledgement packets providefeedback to vary the MTU and the inter-packet transmissiontime. Successful transmissions (indicated by acknowledgementpackets) are used to increase the MTU while reducing theinter-packet transmission time. On the contrary if we timeouton the acknowledgement of packets, we reduce the MTU andincrease the inter-packet transmission time. An increase inthe inter-packet transmission time provides the radio modemsmore time to attempt re-transmission of data using their owninternal protocol. The radio modem uses small packet sizes,hence we need to develop our own protocol for communica-tion.
As long as the communicating modems have a persistentLOS this model for communication tends to work fairly well.We have been able to utilize the communications computer(Gumstix) to perform additional processing to zip data filesfrom the glider to reduce file sizes drastically. We can alsomultiplex file transfers between the glider while simultane-

ously being able to command the Gumstix to perform othertasks such as compressing data files or retrieving new filesfrom the Glider’s computer (Persistor). We point out that sincethe Gumstix is powered up along with the radio modem,(which happens only at the surface), we still require totransmit data between the glider persistor and the Gumstix.This transmission is relatively fast since there is a reliablewired data link between these two computers. After a singlefile begins transferring between the glider and a base station,subsequent files can be transferred between the glider and theGumstix in parallel with transmissions from the Gumstix tothe base stations. We have also implemented capabilities todifferentially build data files to prevent the need to initiate anew file transfer if the file was partially transmitted duringa previous data transfer attempt. This feature (which wasalready present in the glider Persistor’s Z-modem protocol)is extremely useful during file transfers.
File transfers are typically high bandwidth applicationsand tend to take up most of the bandwidth available onthe modems. To ensure fairness as well as the ability toprovide higher reliability for important packets (e.g., controlpackets) we also provide a priority field in the packet header.The packet transmitter sorts the outgoing packets based onpriority to attempt to transmit the higher priority packetsbefore the lower-priority packets. File transfer packets areusually assigned a lower priority than command packets. Thisalso provides fairness and improves the interaction with theglider during file transfers by improving the speed of therelay of these packets. As the radio modems move furtherapart, there is a natural degradation in the signal quality andconsequently a reduction in the available bandwidth betweenthe modems. Local surface waves intermittently obscure theLOS between the glider and base station radio antennae. Thisis primarily due to the glider antenna being too close to thesurface of the sea. Finally, we note that the curvature of theearth also affects the LOS and limits or reduces the bandwidthfor communication between the modems.
III. DATA COLLECTION AND PROCESSING
We tested the modified glider in the SCB during May 2009off the Santa Catalina island in California, USA. The goal wasto measure coverage and quality, i.e., to build a spatial mapof communication quality. We conducted a second set of testsduring September 2009 where the glider was modified with theaddition of the accelerometer to collect information about thesea state while concurrently measuring communication quality.This section describes the data collection and processinginvolved to compute features used to classify communicationquality based on accelerometer data.
Unlike National Data Buoy Center (NDBC) buoys whichgenerally rely on 20 minute time series at 2 Hz, we collectshorter accelerometer time series during glider surfacings. Thesurfacing event durations range between 3 and 10 minutesduring which we sample the accelerometer at 50 Hz. Theglider experiences roll, pitch and yaw at the surface due to itshydrodynamic interactions with the water. In Section III we
describe an algorithm for processing accelerometer timeseriesto obtain acceleration in the heave axis, from which waveparameters are computed using standard techniques. As refer-ence we compare these estimates with those from the nearestNDBC buoy (approximately 25 km away).
A. Data Gathering at Sea
In the course of the May 2009 tests for communication qual-ity and coverage (primarily file transfers at different surfacinglocations) we noticed significant variations in performance atcomparable glider to base station distances. This variation ledto the hypothesis that sea state was a significant factor thataffected communication quality [9].
A second set of tests were conducted in September 2009during which the glider was programmed, upon surfacing, toinitiate transmission of a special sequence of bytes (describednext), before switching back into a regular communicationwith the base stations using data packets following the com-munication protocol described in Section II. During these testsaccelerometry in all 3 axes was logged onboard the glider.
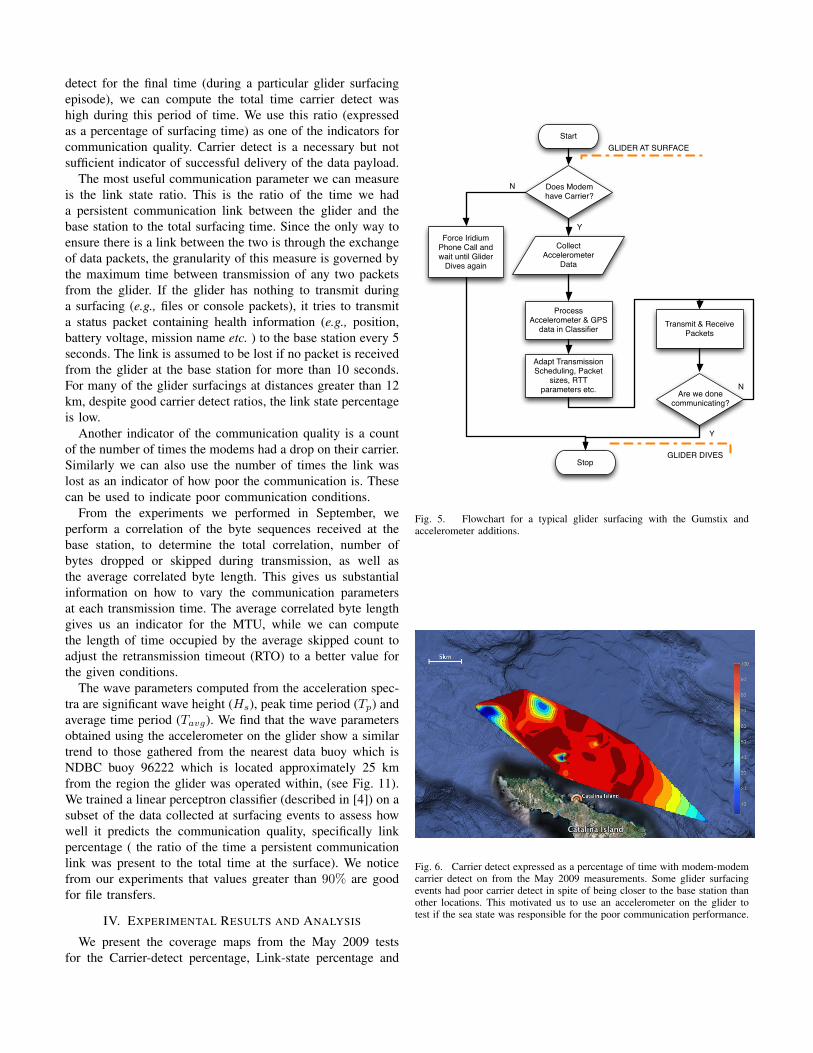
During the field trials in May 2009, we collected data tobuild a coverage map of a region around a radio modem basestation installed at a height of approximately 70 m on Catalinaisland. We collected three basic types of communicationmetrics which are shown in Figs. 6, 7, 8 and 9. These dataare interpreted in Section IV.
B. Accelerometer Data Processing Pipe-line
During the September 2009 tests, the glider collected ac-celerometer data while simultaneously transmitting test se-quences on the Freewave radio. The test sequences were de-signed to allow us to understand the quality of communicationbetween the glider and the base station at various surfacinglocations and sea states. Here we describe the steps involvedin processing the accelerometer data to arrive at the waveparameters in which we are interested. While this is a standardprocedure and is well documented in standard wave mechanicstexts for wave gauges and buoys (see [2]), we include it hereto facilitate the reader.
Our accelerometer is programmed to sample each axisif it detects a minimum acceleration of 0.025 g. Since theaccelerometer data is sampled asynchronously, we use a zero-order-hold while resampling the data at 50 Hz to obtain themeasured time-series. We smooth the data using a low-passfilter. If we call the smoothed accelerometer time-series dataas a(n∆t) where, n is the sample index and ∆t is the time-step between subsequent samples, then we segment this datainto J segments of length L. Each segment is a(j, n∆t) wherea represents the values in each segment and j is the segmentnumber. The segments are divided as shown below based onthe index j.
1 a(1, n∆t) = a(n∆t), n = 0..., L− 12 a(2, n∆t) = a(n∆t), n = L
2 , ...3L2 − 1
......
J a(J, n∆t) = a(n∆t), n = (J − 1)L2 , ..., (J + 1)L
2 − 1,(1)
where
J = 2(N − N
2
L). (2)
We remove the mean from the accelerometer data for eachsegment. After the removal of the means, we obtain wavespectra by correcting for roll and pitch using the glider’s tiltsensor. Next we perform spectral leakage reduction using aHanning window, which is a cosine bell taper over each datasegment. The bell window is given by
W (n∆t) =1
2(1− cos(
2πn
L))), 0 ≤ n ≤ L− 1, (3)
where L is the record or data segment length.The data is then multiplied with the Hanning window
aw(j, n∆t) = a(j, n∆t) ∗W (n∆t) (4)
Next, we calculate the Fast Fourier Transform for the data.The Fast Fourier Transform provides the frequency domainrepresentation, A of the measured time-series, a (or aw withthe Hanning window).
A(j,m∆f) = ∆t
L−1∑n=0
aw(j, n∆t)e−i 2πmnL , (5)
where
m = 0, 1, 2, · · · , L2 L even,
m = 0, 1, 2, · · · , L−12 L odd.
The real and imaginary parts of A are given by
Re[A(j,m∆f)] = ∆t
L−1∑n=0
aw(j, n∆t) cos(2πmn
L), and
Im[A(j,m∆f)] = −∆tL−1∑n=0
aw(j, n∆t) sin(2πmn
L).
We obtain spectral estimates at Fourier frequencies, m∆f ,where the interval between the frequencies is given by
∆f =1
L∆t. (6)
Power Spectral Density (PSD) estimates for the jth segmentare obtained from
Saa(j,m∆f) =A∗(j,m∆f)A(j,m∆f)
L∆t(7)
where A∗ is the complex conjugate of A. In particular we areinterested in the Co-Spectral Density given by
Caa(j,m∆f) =Re[A]Re[A] + Im[A]Im[A]
L∆t(8)
The Final co-spectral estimate is obtained by
Caa(m∆f) =1
J
J∑j=1
Caa(j,m∆f) (9)
Now, we compute some of the standard wave parameterswhich are usually measured by wave-gauge buoys, which arethe significant wave-height, peak time period and averagetime period. The first of these parameters is the significantwave height (Hmo or Hs), which is calculated from thewave elevation variance (also the zero moment, m0 of a non-directional wave spectrum) using
Hs = 4.0√m0 (10)
where
m0 =
n=1∑N
C11(fn)dfn. (11)
The peak time period is given by:
Tp =1
fp(12)
where fp (the peak frequency) is the frequency at which thespectral wave energy density is a maximum. The averageperiod Tav is calculated by the following
Tavg =m0
m1. (13)
The spectral moments are given by:
mi =
n=1∑nb
f inC11(fn)dfn, i=0,1. (14)
C. Communication parameters processing
During the September 2009 trials, the glider was pro-grammed to begin transmitting a sequence of bytes at themaximum baud-rate possible. It makes five attempts to trans-mit a sequence of bytes from 0-65535, and 2000 padding bytesaround the sequence. We chose this sequence because we wereable to detect dropped bytes and by cycling through thesebytes, we are able to detect successful and unsuccessful partsof the transmission. While transmitting this data, the glideris simultaneously collecting accelerometry which is used tocompute the wave parameters described in Section III-B.
The base station is programmed to continuously monitorits Freewave modem for carrier or incoming data. Any newactivity at the base station is assumed to be from the glider,since it has the only Freewave modem programmed to beable to communicate with the base station during the courseof the experiment. The base station stores any change to itscarrier detect state, as well as logs incoming byte streams withtimestamps. We sample bytes collected from the incoming bytestream every 10 ms. The data rate between the radio modemand the base station computer is 115200, which translates intoa maximum of 115 bytes being received between any twosamples.
If we designate a glider surfacing as the time betweenobtaining a carrier detect on the modem, and losing carrier
detect for the final time (during a particular glider surfacingepisode), we can compute the total time carrier detect washigh during this period of time. We use this ratio (expressedas a percentage of surfacing time) as one of the indicators forcommunication quality. Carrier detect is a necessary but notsufficient indicator of successful delivery of the data payload.
The most useful communication parameter we can measureis the link state ratio. This is the ratio of the time we hada persistent communication link between the glider and thebase station to the total surfacing time. Since the only way toensure there is a link between the two is through the exchangeof data packets, the granularity of this measure is governed bythe maximum time between transmission of any two packetsfrom the glider. If the glider has nothing to transmit duringa surfacing (e.g., files or console packets), it tries to transmita status packet containing health information (e.g., position,battery voltage, mission name etc. ) to the base station every 5seconds. The link is assumed to be lost if no packet is receivedfrom the glider at the base station for more than 10 seconds.For many of the glider surfacings at distances greater than 12km, despite good carrier detect ratios, the link state percentageis low.
Another indicator of the communication quality is a countof the number of times the modems had a drop on their carrier.Similarly we can also use the number of times the link waslost as an indicator of how poor the communication is. Thesecan be used to indicate poor communication conditions.
From the experiments we performed in September, weperform a correlation of the byte sequences received at thebase station, to determine the total correlation, number ofbytes dropped or skipped during transmission, as well asthe average correlated byte length. This gives us substantialinformation on how to vary the communication parametersat each transmission time. The average correlated byte lengthgives us an indicator for the MTU, while we can computethe length of time occupied by the average skipped count toadjust the retransmission timeout (RTO) to a better value forthe given conditions.
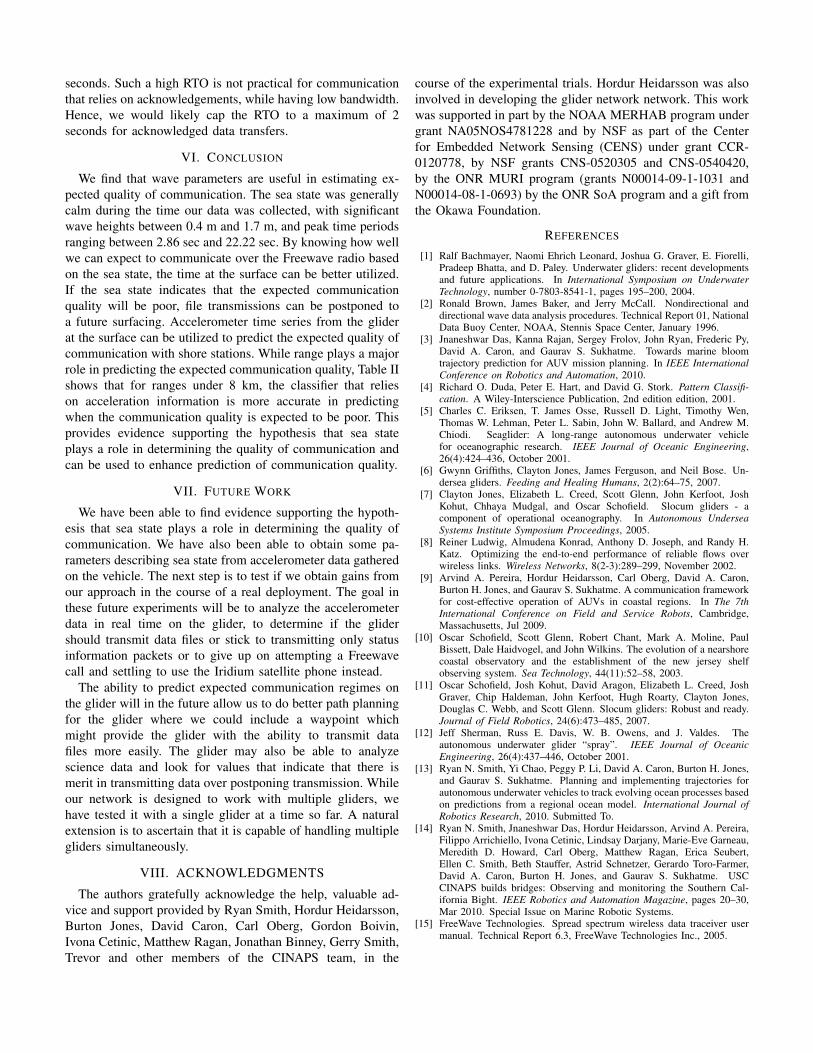
The wave parameters computed from the acceleration spec-tra are significant wave height (Hs), peak time period (Tp) andaverage time period (Tavg). We find that the wave parametersobtained using the accelerometer on the glider show a similartrend to those gathered from the nearest data buoy which isNDBC buoy 96222 which is located approximately 25 kmfrom the region the glider was operated within, (see Fig. 11).We trained a linear perceptron classifier (described in [4]) on asubset of the data collected at surfacing events to assess howwell it predicts the communication quality, specifically linkpercentage ( the ratio of the time a persistent communicationlink was present to the total time at the surface). We noticefrom our experiments that values greater than 90% are goodfor file transfers.
IV. EXPERIMENTAL RESULTS AND ANALYSIS
We present the coverage maps from the May 2009 testsfor the Carrier-detect percentage, Link-state percentage and
Start
Does Modem have Carrier?
Force Iridium Phone Call and wait until Glider
Dives again
Stop
Collect Accelerometer
Data
Process Accelerometer & GPS
data in Classifier
Adapt Transmission Scheduling, Packet
sizes, RTT parameters etc.
Transmit & Receive Packets
Are we done communicating?
N
Y
Y
N
GLIDER DIVES
GLIDER AT SURFACE
Fig. 5. Flowchart for a typical glider surfacing with the Gumstix andaccelerometer additions.
Fig. 6. Carrier detect expressed as a percentage of time with modem-modemcarrier detect on from the May 2009 measurements. Some glider surfacingevents had poor carrier detect in spite of being closer to the base station thanother locations. This motivated us to use an accelerometer on the glider totest if the sea state was responsible for the poor communication performance.
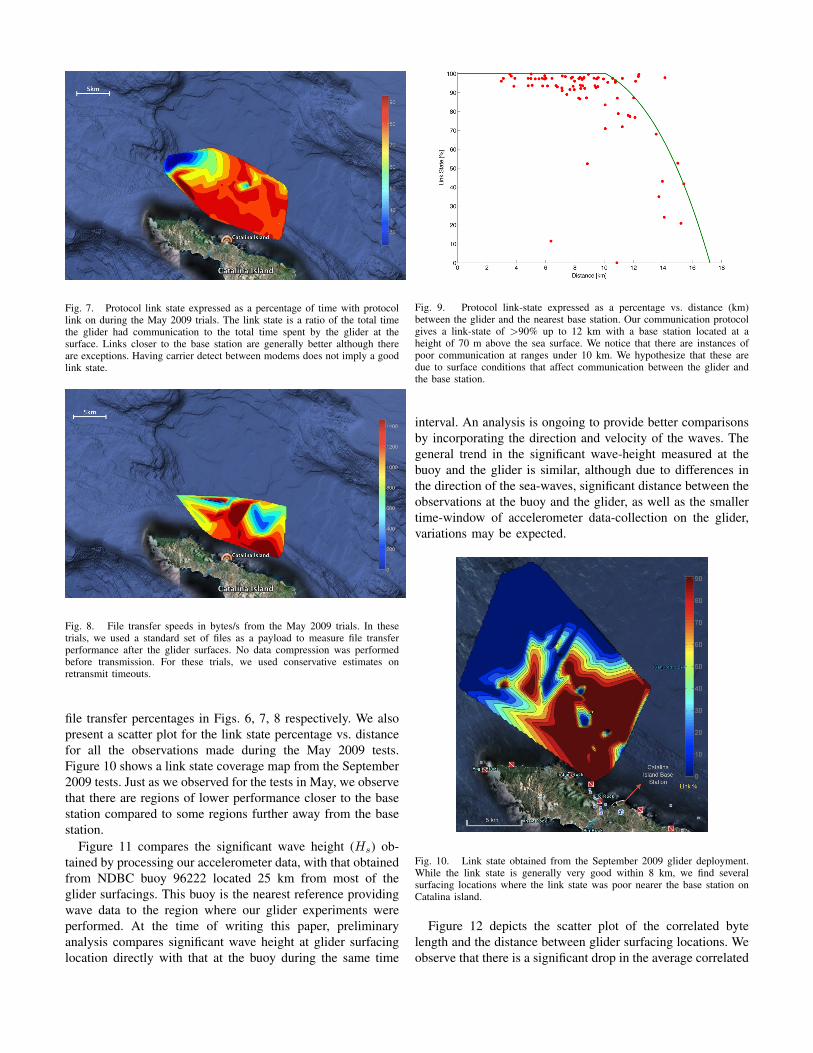
Fig. 7. Protocol link state expressed as a percentage of time with protocollink on during the May 2009 trials. The link state is a ratio of the total timethe glider had communication to the total time spent by the glider at thesurface. Links closer to the base station are generally better although thereare exceptions. Having carrier detect between modems does not imply a goodlink state.
Fig. 8. File transfer speeds in bytes/s from the May 2009 trials. In thesetrials, we used a standard set of files as a payload to measure file transferperformance after the glider surfaces. No data compression was performedbefore transmission. For these trials, we used conservative estimates onretransmit timeouts.
file transfer percentages in Figs. 6, 7, 8 respectively. We alsopresent a scatter plot for the link state percentage vs. distancefor all the observations made during the May 2009 tests.Figure 10 shows a link state coverage map from the September2009 tests. Just as we observed for the tests in May, we observethat there are regions of lower performance closer to the basestation compared to some regions further away from the basestation.
Figure 11 compares the significant wave height (Hs) ob-tained by processing our accelerometer data, with that obtainedfrom NDBC buoy 96222 located 25 km from most of theglider surfacings. This buoy is the nearest reference providingwave data to the region where our glider experiments wereperformed. At the time of writing this paper, preliminaryanalysis compares significant wave height at glider surfacinglocation directly with that at the buoy during the same time
Fig. 9. Protocol link-state expressed as a percentage vs. distance (km)between the glider and the nearest base station. Our communication protocolgives a link-state of >90% up to 12 km with a base station located at aheight of 70 m above the sea surface. We notice that there are instances ofpoor communication at ranges under 10 km. We hypothesize that these aredue to surface conditions that affect communication between the glider andthe base station.
interval. An analysis is ongoing to provide better comparisonsby incorporating the direction and velocity of the waves. Thegeneral trend in the significant wave-height measured at thebuoy and the glider is similar, although due to differences inthe direction of the sea-waves, significant distance between theobservations at the buoy and the glider, as well as the smallertime-window of accelerometer data-collection on the glider,variations may be expected.
Fig. 10. Link state obtained from the September 2009 glider deployment.While the link state is generally very good within 8 km, we find severalsurfacing locations where the link state was poor nearer the base station onCatalina island.
Figure 12 depicts the scatter plot of the correlated bytelength and the distance between glider surfacing locations. Weobserve that there is a significant drop in the average correlated
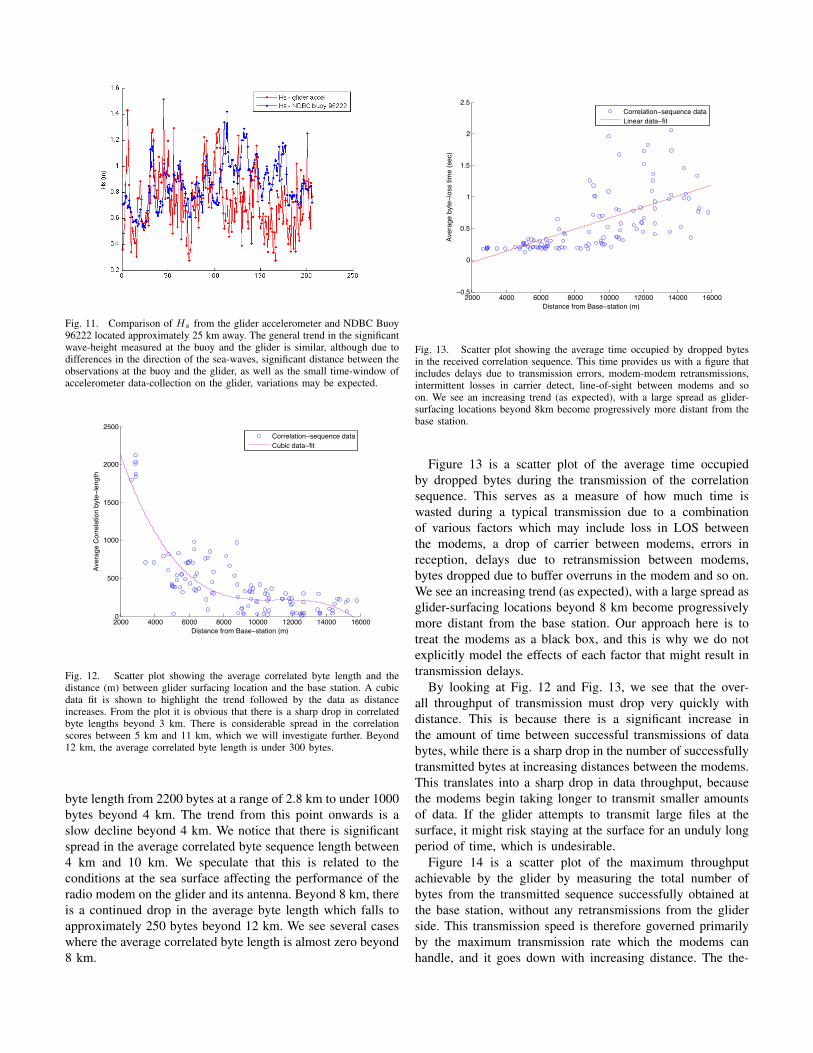
Fig. 11. Comparison of Hs from the glider accelerometer and NDBC Buoy96222 located approximately 25 km away. The general trend in the significantwave-height measured at the buoy and the glider is similar, although due todifferences in the direction of the sea-waves, significant distance between theobservations at the buoy and the glider, as well as the small time-window ofaccelerometer data-collection on the glider, variations may be expected.
2000 4000 6000 8000 10000 12000 14000 160000
500
1000
1500
2000
2500
Distance from Base−station (m)
Aver
age
Cor
rela
tion
byte−l
engt
h
Correlation−sequence dataCubic data−fit
Fig. 12. Scatter plot showing the average correlated byte length and thedistance (m) between glider surfacing location and the base station. A cubicdata fit is shown to highlight the trend followed by the data as distanceincreases. From the plot it is obvious that there is a sharp drop in correlatedbyte lengths beyond 3 km. There is considerable spread in the correlationscores between 5 km and 11 km, which we will investigate further. Beyond12 km, the average correlated byte length is under 300 bytes.
byte length from 2200 bytes at a range of 2.8 km to under 1000bytes beyond 4 km. The trend from this point onwards is aslow decline beyond 4 km. We notice that there is significantspread in the average correlated byte sequence length between4 km and 10 km. We speculate that this is related to theconditions at the sea surface affecting the performance of theradio modem on the glider and its antenna. Beyond 8 km, thereis a continued drop in the average byte length which falls toapproximately 250 bytes beyond 12 km. We see several caseswhere the average correlated byte length is almost zero beyond8 km.
2000 4000 6000 8000 10000 12000 14000 16000−0.5
0
0.5
1
1.5
2
2.5
Distance from Base−station (m)
Aver
age
byte−l
oss
time
(sec
)
Correlation−sequence dataLinear data−fit
Fig. 13. Scatter plot showing the average time occupied by dropped bytesin the received correlation sequence. This time provides us with a figure thatincludes delays due to transmission errors, modem-modem retransmissions,intermittent losses in carrier detect, line-of-sight between modems and soon. We see an increasing trend (as expected), with a large spread as glider-surfacing locations beyond 8km become progressively more distant from thebase station.
Figure 13 is a scatter plot of the average time occupiedby dropped bytes during the transmission of the correlationsequence. This serves as a measure of how much time iswasted during a typical transmission due to a combinationof various factors which may include loss in LOS betweenthe modems, a drop of carrier between modems, errors inreception, delays due to retransmission between modems,bytes dropped due to buffer overruns in the modem and so on.We see an increasing trend (as expected), with a large spread asglider-surfacing locations beyond 8 km become progressivelymore distant from the base station. Our approach here is totreat the modems as a black box, and this is why we do notexplicitly model the effects of each factor that might result intransmission delays.
By looking at Fig. 12 and Fig. 13, we see that the over-all throughput of transmission must drop very quickly withdistance. This is because there is a significant increase inthe amount of time between successful transmissions of databytes, while there is a sharp drop in the number of successfullytransmitted bytes at increasing distances between the modems.This translates into a sharp drop in data throughput, becausethe modems begin taking longer to transmit smaller amountsof data. If the glider attempts to transmit large files at thesurface, it might risk staying at the surface for an unduly longperiod of time, which is undesirable.
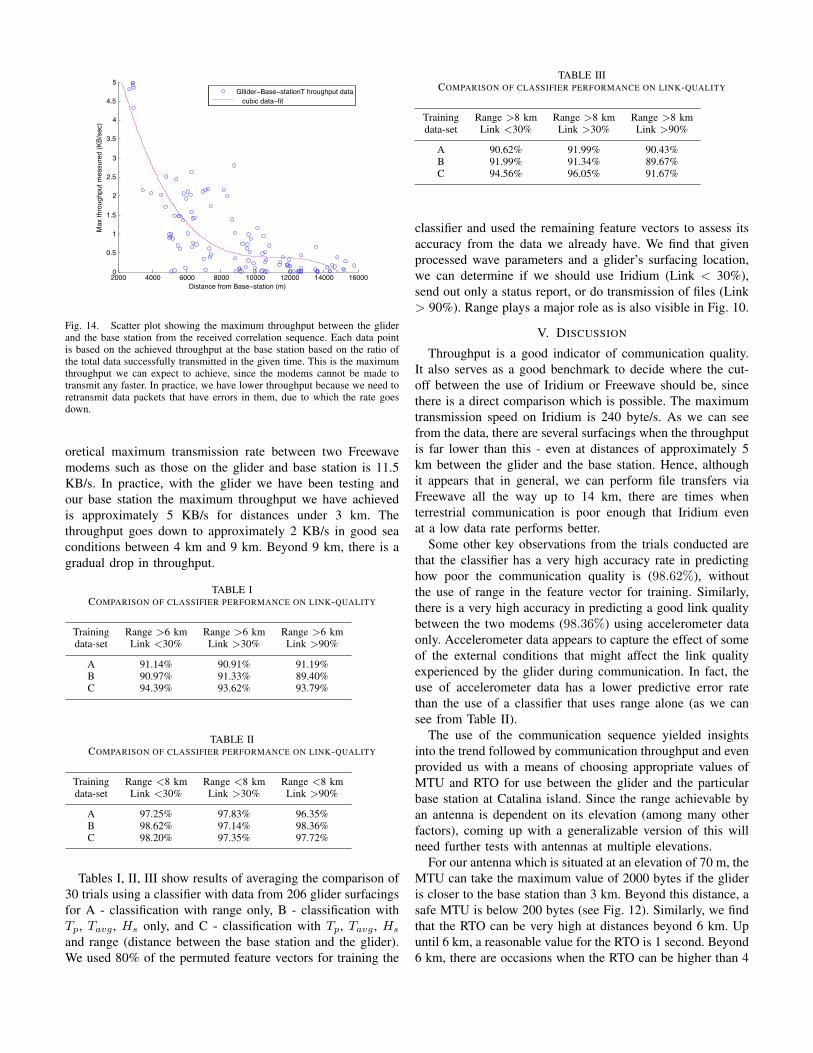
Figure 14 is a scatter plot of the maximum throughputachievable by the glider by measuring the total number ofbytes from the transmitted sequence successfully obtained atthe base station, without any retransmissions from the gliderside. This transmission speed is therefore governed primarilyby the maximum transmission rate which the modems canhandle, and it goes down with increasing distance. The the-
2000 4000 6000 8000 10000 12000 14000 160000
0.5
1
1.5
2
2.5
3
3.5
4
4.5
5
Distance from Base−station (m)
Max
thro
ughp
ut m
easu
red
(KB/
sec)
Gllider−Base−stationT hroughput data cubic data−fit
Fig. 14. Scatter plot showing the maximum throughput between the gliderand the base station from the received correlation sequence. Each data pointis based on the achieved throughput at the base station based on the ratio ofthe total data successfully transmitted in the given time. This is the maximumthroughput we can expect to achieve, since the modems cannot be made totransmit any faster. In practice, we have lower throughput because we need toretransmit data packets that have errors in them, due to which the rate goesdown.
oretical maximum transmission rate between two Freewavemodems such as those on the glider and base station is 11.5KB/s. In practice, with the glider we have been testing andour base station the maximum throughput we have achievedis approximately 5 KB/s for distances under 3 km. Thethroughput goes down to approximately 2 KB/s in good seaconditions between 4 km and 9 km. Beyond 9 km, there is agradual drop in throughput.
TABLE ICOMPARISON OF CLASSIFIER PERFORMANCE ON LINK-QUALITY
Training Range >6 km Range >6 km Range >6 kmdata-set Link <30% Link >30% Link >90%
A 91.14% 90.91% 91.19%B 90.97% 91.33% 89.40%C 94.39% 93.62% 93.79%
TABLE IICOMPARISON OF CLASSIFIER PERFORMANCE ON LINK-QUALITY
Training Range <8 km Range <8 km Range <8 kmdata-set Link <30% Link >30% Link >90%
A 97.25% 97.83% 96.35%B 98.62% 97.14% 98.36%C 98.20% 97.35% 97.72%
Tables I, II, III show results of averaging the comparison of30 trials using a classifier with data from 206 glider surfacingsfor A - classification with range only, B - classification withTp, Tavg , Hs only, and C - classification with Tp, Tavg , Hs
and range (distance between the base station and the glider).We used 80% of the permuted feature vectors for training the
TABLE IIICOMPARISON OF CLASSIFIER PERFORMANCE ON LINK-QUALITY
Training Range >8 km Range >8 km Range >8 kmdata-set Link <30% Link >30% Link >90%
A 90.62% 91.99% 90.43%B 91.99% 91.34% 89.67%C 94.56% 96.05% 91.67%
classifier and used the remaining feature vectors to assess itsaccuracy from the data we already have. We find that givenprocessed wave parameters and a glider’s surfacing location,we can determine if we should use Iridium (Link < 30%),send out only a status report, or do transmission of files (Link> 90%). Range plays a major role as is also visible in Fig. 10.
V. DISCUSSION
Throughput is a good indicator of communication quality.It also serves as a good benchmark to decide where the cut-off between the use of Iridium or Freewave should be, sincethere is a direct comparison which is possible. The maximumtransmission speed on Iridium is 240 byte/s. As we can seefrom the data, there are several surfacings when the throughputis far lower than this - even at distances of approximately 5km between the glider and the base station. Hence, althoughit appears that in general, we can perform file transfers viaFreewave all the way up to 14 km, there are times whenterrestrial communication is poor enough that Iridium evenat a low data rate performs better.
Some other key observations from the trials conducted arethat the classifier has a very high accuracy rate in predictinghow poor the communication quality is (98.62%), withoutthe use of range in the feature vector for training. Similarly,there is a very high accuracy in predicting a good link qualitybetween the two modems (98.36%) using accelerometer dataonly. Accelerometer data appears to capture the effect of someof the external conditions that might affect the link qualityexperienced by the glider during communication. In fact, theuse of accelerometer data has a lower predictive error ratethan the use of a classifier that uses range alone (as we cansee from Table II).
The use of the communication sequence yielded insightsinto the trend followed by communication throughput and evenprovided us with a means of choosing appropriate values ofMTU and RTO for use between the glider and the particularbase station at Catalina island. Since the range achievable byan antenna is dependent on its elevation (among many otherfactors), coming up with a generalizable version of this willneed further tests with antennas at multiple elevations.
For our antenna which is situated at an elevation of 70 m, theMTU can take the maximum value of 2000 bytes if the glideris closer to the base station than 3 km. Beyond this distance, asafe MTU is below 200 bytes (see Fig. 12). Similarly, we findthat the RTO can be very high at distances beyond 6 km. Upuntil 6 km, a reasonable value for the RTO is 1 second. Beyond6 km, there are occasions when the RTO can be higher than 4
seconds. Such a high RTO is not practical for communicationthat relies on acknowledgements, while having low bandwidth.Hence, we would likely cap the RTO to a maximum of 2seconds for acknowledged data transfers.
VI. CONCLUSION
We find that wave parameters are useful in estimating ex-pected quality of communication. The sea state was generallycalm during the time our data was collected, with significantwave heights between 0.4 m and 1.7 m, and peak time periodsranging between 2.86 sec and 22.22 sec. By knowing how wellwe can expect to communicate over the Freewave radio basedon the sea state, the time at the surface can be better utilized.If the sea state indicates that the expected communicationquality will be poor, file transmissions can be postponed toa future surfacing. Accelerometer time series from the gliderat the surface can be utilized to predict the expected quality ofcommunication with shore stations. While range plays a majorrole in predicting the expected communication quality, Table IIshows that for ranges under 8 km, the classifier that relieson acceleration information is more accurate in predictingwhen the communication quality is expected to be poor. Thisprovides evidence supporting the hypothesis that sea stateplays a role in determining the quality of communication andcan be used to enhance prediction of communication quality.
VII. FUTURE WORK
We have been able to find evidence supporting the hypoth-esis that sea state plays a role in determining the quality ofcommunication. We have also been able to obtain some pa-rameters describing sea state from accelerometer data gatheredon the vehicle. The next step is to test if we obtain gains fromour approach in the course of a real deployment. The goal inthese future experiments will be to analyze the accelerometerdata in real time on the glider, to determine if the glidershould transmit data files or stick to transmitting only statusinformation packets or to give up on attempting a Freewavecall and settling to use the Iridium satellite phone instead.
The ability to predict expected communication regimes onthe glider will in the future allow us to do better path planningfor the glider where we could include a waypoint whichmight provide the glider with the ability to transmit datafiles more easily. The glider may also be able to analyzescience data and look for values that indicate that there ismerit in transmitting data over postponing transmission. Whileour network is designed to work with multiple gliders, wehave tested it with a single glider at a time so far. A naturalextension is to ascertain that it is capable of handling multiplegliders simultaneously.
VIII. ACKNOWLEDGMENTS
The authors gratefully acknowledge the help, valuable ad-vice and support provided by Ryan Smith, Hordur Heidarsson,Burton Jones, David Caron, Carl Oberg, Gordon Boivin,Ivona Cetinic, Matthew Ragan, Jonathan Binney, Gerry Smith,Trevor and other members of the CINAPS team, in the
course of the experimental trials. Hordur Heidarsson was alsoinvolved in developing the glider network network. This workwas supported in part by the NOAA MERHAB program undergrant NA05NOS4781228 and by NSF as part of the Centerfor Embedded Network Sensing (CENS) under grant CCR-0120778, by NSF grants CNS-0520305 and CNS-0540420,by the ONR MURI program (grants N00014-09-1-1031 andN00014-08-1-0693) by the ONR SoA program and a gift fromthe Okawa Foundation.
REFERENCES
[1] Ralf Bachmayer, Naomi Ehrich Leonard, Joshua G. Graver, E. Fiorelli,Pradeep Bhatta, and D. Paley. Underwater gliders: recent developmentsand future applications. In International Symposium on UnderwaterTechnology, number 0-7803-8541-1, pages 195–200, 2004.
[2] Ronald Brown, James Baker, and Jerry McCall. Nondirectional anddirectional wave data analysis procedures. Technical Report 01, NationalData Buoy Center, NOAA, Stennis Space Center, January 1996.
[3] Jnaneshwar Das, Kanna Rajan, Sergey Frolov, John Ryan, Frederic Py,David A. Caron, and Gaurav S. Sukhatme. Towards marine bloomtrajectory prediction for AUV mission planning. In IEEE InternationalConference on Robotics and Automation, 2010.
[4] Richard O. Duda, Peter E. Hart, and David G. Stork. Pattern Classifi-cation. A Wiley-Interscience Publication, 2nd edition edition, 2001.
[5] Charles C. Eriksen, T. James Osse, Russell D. Light, Timothy Wen,Thomas W. Lehman, Peter L. Sabin, John W. Ballard, and Andrew M.Chiodi. Seaglider: A long-range autonomous underwater vehiclefor oceanographic research. IEEE Journal of Oceanic Engineering,26(4):424–436, October 2001.
[6] Gwynn Griffiths, Clayton Jones, James Ferguson, and Neil Bose. Un-dersea gliders. Feeding and Healing Humans, 2(2):64–75, 2007.
[7] Clayton Jones, Elizabeth L. Creed, Scott Glenn, John Kerfoot, JoshKohut, Chhaya Mudgal, and Oscar Schofield. Slocum gliders - acomponent of operational oceanography. In Autonomous UnderseaSystems Institute Symposium Proceedings, 2005.
[8] Reiner Ludwig, Almudena Konrad, Anthony D. Joseph, and Randy H.Katz. Optimizing the end-to-end performance of reliable flows overwireless links. Wireless Networks, 8(2-3):289–299, November 2002.
[9] Arvind A. Pereira, Hordur Heidarsson, Carl Oberg, David A. Caron,Burton H. Jones, and Gaurav S. Sukhatme. A communication frameworkfor cost-effective operation of AUVs in coastal regions. In The 7thInternational Conference on Field and Service Robots, Cambridge,Massachusetts, Jul 2009.
[10] Oscar Schofield, Scott Glenn, Robert Chant, Mark A. Moline, PaulBissett, Dale Haidvogel, and John Wilkins. The evolution of a nearshorecoastal observatory and the establishment of the new jersey shelfobserving system. Sea Technology, 44(11):52–58, 2003.
[11] Oscar Schofield, Josh Kohut, David Aragon, Elizabeth L. Creed, JoshGraver, Chip Haldeman, John Kerfoot, Hugh Roarty, Clayton Jones,Douglas C. Webb, and Scott Glenn. Slocum gliders: Robust and ready.Journal of Field Robotics, 24(6):473–485, 2007.
[12] Jeff Sherman, Russ E. Davis, W. B. Owens, and J. Valdes. Theautonomous underwater glider “spray”. IEEE Journal of OceanicEngineering, 26(4):437–446, October 2001.
[13] Ryan N. Smith, Yi Chao, Peggy P. Li, David A. Caron, Burton H. Jones,and Gaurav S. Sukhatme. Planning and implementing trajectories forautonomous underwater vehicles to track evolving ocean processes basedon predictions from a regional ocean model. International Journal ofRobotics Research, 2010. Submitted To.
[14] Ryan N. Smith, Jnaneshwar Das, Hordur Heidarsson, Arvind A. Pereira,Filippo Arrichiello, Ivona Cetinic, Lindsay Darjany, Marie-Eve Garneau,Meredith D. Howard, Carl Oberg, Matthew Ragan, Erica Seubert,Ellen C. Smith, Beth Stauffer, Astrid Schnetzer, Gerardo Toro-Farmer,David A. Caron, Burton H. Jones, and Gaurav S. Sukhatme. USCCINAPS builds bridges: Observing and monitoring the Southern Cal-ifornia Bight. IEEE Robotics and Automation Magazine, pages 20–30,Mar 2010. Special Issue on Marine Robotic Systems.
[15] FreeWave Technologies. Spread spectrum wireless data traceiver usermanual. Technical Report 6.3, FreeWave Technologies Inc., 2005.