Embed Size (px)
Citation preview

Estre Ambiental, Inc.Institutional Presentation
June 2018

2
Leading Waste Management Company in Brazil
Full-range of waste and environmental services for more than 31 million people
• 2017 Revenues R$ 1,365 million / Adj. EBITDA R$ 414 million (1)
• Largest waste management company in Brazil and LatAm (2)
• Environmentally progressive, transparent, with compliance focus
• Municipal customers approximately 80% of sales / C&I customers,
approximately 20% of sales
• Sole owner of largest number of regulated landfills in Brazil with 134
million cubic meters of remaining capacity (>15 years) – robust
pipeline of additional capacity
(1) Adjusted EBITDA is a non-IFRS financial measure.(2) As measured in terms of number of landfills and waste disposal volumes.
Collection Services
500+ Clients
932 vehicles on collection, sweeping, and cleaning services for 31 million people
Landfill Operations
13 Landfills
6 million tons disposed in Estre’s landfills yearly
Pipeline of 4 new landfills
BiogasPower
10 Power Units
Generating ~14 MW and with potential to
more than 80 MW
Hazardous and Medical Waste
3 Facilities
for treatment and disposal of hazardous
and medical waste
States in which we operate hold 45% of
the population with 55% of GDP

3
Attractive Growth Opportunity
Source: ABRELPE – Panorama of Solid Waste in Brazil (2016)
• 78 million tons annual of MSW
• 3% growth from 2008 to 2015
• Fragmented industry
• Favorable regulatory framework
• 47% of MSW not properly disposed of
- 6 million not collected
- 30 million sent to illegal dumps
Brazilian solid waste market
MSW volume evolution (million tons)
78 million tons
100%
TOTAL WASTE GENERATION
71 million tons
91%
COLLECTED VOLUME
PROPER DESTINATION
42 million tons
53%
36 million tons
47%
NOT PROPERLY DISPOSED
Underpenetrated Market Opportunity
Proper Destination
53%
Not Collected & Improper
Destination 47%
Significant Market Opportunity
7880797674737167
62
20122011 2015
3%
20162013 2014201020092008

4
Favorable, evolving regulatory environment
Brazil Regulatory Framework
• Government committed to sound environmental practices
• National Solid Waste Policy enacted as Federal Law in 2010
• Deadline to comply with proper solid waste destination ranges from July 2018 to July 2021 depending on size of the city
• Obligations of municipalities, industry and commerce
• Potential creation of garbage collection tax by municipalities
• Long-term contracts based on public-private partnerships
US Solid Waste Regulations
1970 National Environmental Protection Act – Creation of EPA
1976 RCRA – Resource Conservation and Recovery Act
1965 Solid Waste Disposal Act
1970 Resource Recovery Act
RCRA made open dumping illegal
1980 Solid Waste Disposal ActHazardous waste
1988 Ocean Dumping Ban Act
Reduced improper destination from 21% in 1980’s to zero
Consolidated number of landfills from 7,924 in 1988 to 1,724 in 2006
Source: Brazilian Ministry of Cities; ABRELPE – Panorama of Solid Waste in Brazil (2015); U.S. Environmental Protection Agency.

Summary Financials, excluding results from divested operations(1)
5
1.206 1.289 1.393 1.365
2014 2015 20172016
4%
191
323389 414
20152014 20172016
29%
88 76
120144
20152014 20172016
103
247 269 270
20152014 20172016
16%
25%28%28%
7%11%
6%9%
9%19% 20%19%
Revenue(R$ million)
Adj. EBITDA(2)
(R$ million)
Adj. CAPEX(3)
(R$ million)
Adj. EBITDA – Adj. CAPEX(2)(3)(4)
(R$ million)
(1) Metrics exclude the effects of the following divested operations: (i) residual Estre contracts with Petrobras related to Estre O&G operations, following the spin-off of this entity to Estre’s foundingshareholder in September 2014, (ii) sub-scale collections operations (Azaleia) following the sale of these contracts back to the original seller in May 2015, and (iii) Estrans landfill in Argentinafollowing the sale of Estre’s interest in this entity in December 2015. Estre’s and Boulevard’s management believe such presentation facilitates greater comparability between periods by isolatingEstre’s ongoing operations. Divested operations is a non-IFRS financial measure and is not representative of Estre’s discontinued operations as defined by IFRS and as will be reflected in Estre’sfinancial statements. For additional information regarding Estre’s divested operations, see the Appendix hereto.
(2) Adjusted EBITDA is a non-IFRS measure. For a reconciliation of Estre’s Adjusted EBITDA to net income (loss), see the Appendix hereto.(3) Adjusted CAPEX is a non-IFRS measure reflecting certain accounting adjustments to exclude the effects of expenditures that were not related to the acquisition of durable capital goods, such as costs
associated with internal assessments of controls, software and technology expenditures to improve internal controls systems, and non-cash accounting adjustments to property, plant and equipment.(4) Adj. EBITDA – Adj. CAPEX is a non-IFRS financial measure.
Despite over three years of economic crisis in Brazil, Estre has continued to deliver strong performance
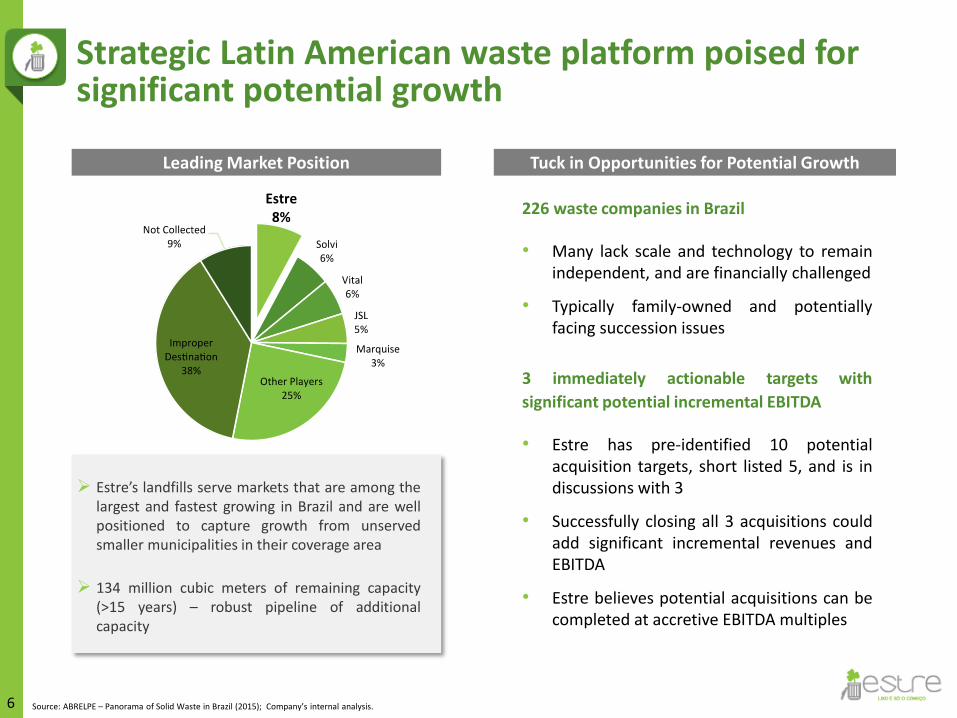
Estre’s landfills serve markets that are among thelargest and fastest growing in Brazil and are wellpositioned to capture growth from unservedsmaller municipalities in their coverage area
134 million cubic meters of remaining capacity(>15 years) – robust pipeline of additionalcapacity
6
Strategic Latin American waste platform poised for significant potential growth
Leading Market Position Tuck in Opportunities for Potential Growth
226 waste companies in Brazil
• Many lack scale and technology to remainindependent, and are financially challenged
• Typically family-owned and potentiallyfacing succession issues
3 immediately actionable targets with
significant potential incremental EBITDA
• Estre has pre-identified 10 potentialacquisition targets, short listed 5, and is indiscussions with 3
• Successfully closing all 3 acquisitions couldadd significant incremental revenues andEBITDA
• Estre believes potential acquisitions can becompleted at accretive EBITDA multiples
Source: ABRELPE – Panorama of Solid Waste in Brazil (2015); Company’s internal analysis.

7
New capital structure optimization
Post transaction leverage• Reduced post transaction leverage adds strategic
flexibility and attractive new debt terms
‒ 8 year maturity @ CDI (interbank rate) + 2%
‒ Pre-payable at any time without premium
‒ No interest payment 1st 24 months, no
amortization 1st 36 months from closing;
thereafter 10% amortization per year and
50% on final maturity date
‒ Additional US$ 90 million + 25% discount
already negotiated with debentures holders
• Disciplined focus on ROIC
Net Financial Debt Leverage (1)
4.3x
Pre-Transaction
3.3x
Post-Transaction
(1) Reflects Net Financial Debt / Adjusted EBITDA. Estimated figures based on 2017E Adj. EBITDA and Net Financial Debt. Net Financial Debt is calculated as Gross Financial Debt – Cash and Cash Equivalents. For a reconciliation of Estre’s Net Financial Debt to its indebtedness as reflected in its balance sheet, and Adjusted EBITDA to its net income (loss), see the Appendix hereto.
(2) Debentures and related debt principal amortization schedule as of December 2017; accumulated interest up to July 2019 will become principal.
PRT/PERT Amortization Schedule (R$ million)
Debentures Amortization Schedule (R$ million)
2019 2020 20212018 2023
121
41
2022 2024 2025-2029
94
42 28 44 48 46
20222018 202320202019 20242021 2025
0 0 71 143 143 143 143
784

Estre & Boulevard Business Combination
(1) Calculations assume (i) no redemptions of Boulevard shares, and (ii) that the transaction agreement will provide for a minimum cash condition of US$200 million. Shown in both R$ millions and US$millions, except for (i) price per share, which is shown in R$ and US$, and (ii) total number of shares, which is shown in millions. US$ information is presented using an exchange rate of R$3.19 to US$1.00,as reported by the Brazilian Central Bank as of Aug 14, 2017.
(2) Net Debt is calculated as Gross Debt – Cash and Cash Equivalents. Net Debt is not an IFRS financial measure. For a reconciliation of Estre’s Net Debt to its indebtedness as reflected in its balance sheet, seethe Appendix hereto.
(3) Adjusted EBITDA is a non-IFRS financial measure. For a reconciliation of Estre’s Adjusted EBITDA to net income (loss), see the Appendix hereto.(4) NTM = Next Twelve Months.(5) Ownership table excludes 5% of total shares corresponding to management’s long-term incentive plan.
Estimated pro-forma enterprise value of US$1.1 billion with US$512 million market cap (47%) and US$576 million Net Debt(2) (53%)
• Sources: US$140 million
• Uses: US$139 million debt reduction (20% discount, US$111 million cash payment) + US$29 million transaction fees and expenses
(million, except per share data)
8

9
Top Tier Governance
Majority independent board bringing mix of US and Brazilian waste management sector experience and best practices
• Primary responsibilities will include, among other things:
• Review of strategic planning
• Budget approval
• Performance monitoring
• Approval and monitoring of committed capital for new investments
• Committees of the Board of Directors:
• Audit Committee
• Compensation Committee
• Nominating and Corporate Governance Committee
• Frequency: at least 5 meetings per year
Andreas Gruson, Chairman
Robert Boucher Jr., CEO and President of Wheelabrator Technologies
Richard Burke, CEO of Advanced Disposal
John Morris Jr., SVP, Field Operations at WM
Gesner Oliveira, Partner of GO Associados
Sergio Pedreiro, CEO of Estre
Ricardo Pelúcio, CEO of Attend
Fabio Pinheiro, Diletto’s founder and former Banco Pactual’s partner
Dr. Klaus Pohle, former President of the Accounting Standards Committee of Germany
Stephen Trevor, Portfolio Manager at Avenue Capital Group
Board of Directors

10
Compliance Measures and Culture
• First waste management company in Brazil to receive international certification for internal controls and integrity policies – ISO 37001
• Brazil’s Clean Company Act 2014 – Brazil’s first anti-corruption law to hold companies responsible for their employees´ corrupt actions - is enacted
• Under new leadership beginning in 2015, Estre expanded compliance policies, investing heavily in ethical controls and integrating them as a key element to its strategy and culture
• Zero tolerance policy for non-compliance
• Anti-corruption compliance now a key factor in Estre’s compensation system
Highlights of Estre’s New Compliance Program
• Define, implement and manage compliance with the Brazilian Anticorruption Laws
• Top-down compliance policies applicable to all employees and third parties
• Whistleblower channel / hotline
• Continuous education and training
• Regular due diligence and internal testing and review
• Reporting and disciplinary measures

Appendix

12
Selected Operating and Financial Highlights
Highlights (in R$ million)2016
Restated2017 Chg.
Net Revenues 1,393 1,365 -2.0%
Growth
Operating Costs 879 843 -4.1%
% of Net Revenues 63% 62%
Net Income (361) 52 114.5%
% of Net Revenues -26% 4%
CAPEX (1)
120 144 19.7%
% of Net Revenues 9% 11%
Adjusted Operating Costs (2) 883 817 -7.4%
% of Net Revenues 63% 60%
Adjusted Operating Expenses (2) 125 134 7.4%
% of Net Revenues 9% 10%
Adjusted EBITDA (2) 386 414 7.3%
% of Net Revenues 28% 30%
Adjusted EBITDA - CAPEX 266 270 1.7%
% of Net Revenues 19% 20%
(1) CAPEX is Acquisition of PP&E as stated in Cash Flows excluding Advances to Suppliers
and including Capital contribution in subsidiaries
(2) Adjustments detailed in Table A of Annex

13
Revenues by Segment
Net Revenues (in R$ million)2016
Restated2017 Chg.
Collection & Cleaning Services 922 929 0.7%
Public 843 831 -1.5%
C&I 79 98 24.2%
Landfills 450 455 1.2%
O&G 63 26 -58.9%
Value Recovery 42 57 35.5%
Total (1) 1,393 1,365 -2.0%
(1) Considers Elimination of intersegment transactions entered into the ordinary course of
the business R$84 million (in 2016) and R$102 million (in2017)

14
Indebtedness
Indebtedness (in R$ million)2016
Restated2017 Chg.
Debentures - 1st and 2nd Issues 1,666 1,069 -35.8%
Working Capital 2 360 n.m.
Finame and Lease 24 25 3.7%
Gross Financial Debt 1,692 1,455 -14.0%
Cash and equivalents 31 85 172.5%
Net Financial Debt 1,661 1,370 -17.5%
Net Financial Debt/Adj. EBITDA 4.3 x 3.3 x -1.0 p.p.
Tax Liabilities 531 565
Total Gross Debt 2,224 2,019 -9.2%
Total Net Debt 2,193 1,934 -11.8%
Total Net Debt/Adj. EBITDA 5.7 x 4.7 x -1.0 p.p.

15
Adjusted EBITDA and Adjusted Income Statement
(1)
in R$ millionAs
PresentedAdjusted
As
PresentedAdjusted
Revenue from services rendered 1,393 - 1,393 1,365 - 1,365
Cost of services (879) (3) (1) (883) (843) 25 (1) (817)
Gross profit 514 (3) 511 523 25 548
Gross margin 36.9% 36.6% 38.3% 40.1%
Selling, general and administrative expenses (203) 39 (2) (164) (237) 81 (2) (156)
Allowance for doubtful accounts 13 - 13 (2) - (2)
Other operating expenses/income, net (78) 94 (3) 16 (30) 48 (3) 18
Share of (loss) profit of an associate 10 - 10 (1) 7 (4) 6
Operating expenses (258) 133 (125) (270) 136 (134)
Depreciation / Amortization (165) 3 (161) (137) - (137)
Related to cost of services (133) 3 (130) (111) - (111)
Related to SG&A (31) - (31) (26) - (26)
Profit before tax/finance expenses 91 133 225 116 161 277
Finance expenses (401) 75 (5) (326) (534) 214 (5) (320)
Finance income 54 0 54 110 (91) (6) 18
Loss before income and social contribution taxes (256) 208 (48) (309) 284 (25)
Current income and social contribution taxes (55) - (55) (18) - (18)
Deferred income and social contribution taxes (50) - (50) 371 (373) (7) (2)
Profit (Loss) for the year from continuing operations (361) 208 (153) 44 (89) (45)
Profit after tax from discontinued operations 0 - 0 8 0 8
Profit (Loss) for the year (361) 208 (153) 52 (89) (37)
Profit (Loss) for the year from continuing operations (361) 208 (153) 44 (89) (45)
(+) Income and social contribution taxes 105 - 105 (353) 373 (7) 20
(+) Depreciation and Amorization 165 (3) 161 137 - 137
(+) Finance expenses 401 (75) (5) 326 534 (214) (5) 320
(-) Finance income (54) 0 (54) (110) 91 (6) (18)
Accounting EBITDA 256 130 386 253 161 414
EBITDA Margin 18.4% 27.7% 18.5% 30.3%
20172016
Reversal of Non-
recurring Events
Reversal of Non-
recurring Events

16
Adjusted EBITDA and Adjusted Income Statement
(1)
(1)Disregards the effects on Costs of Services of non-reccurring expenses related to cost due to adjustments made in response to findings of internalevaluation process R$0.6 million (in 2017) and -R$3.5 million (in 2016), UTR demobilization R$1.4 million, over provision for demobilizing Somacontract R$12.0 million (in 2017), unsupport payments at Soma R$11.4 million (in 2017)
(2)Disregards the effects on SG&A of non-recurring events related to tax provisions made in association with the investigation R$11.2 million (in 2017),tax contingencies recognized in the PRT/PERT programs R53.6 million (in 2017), legal and investigation expenses R$4.7 million (in 2017), Stock option-R$7.7 million (in 2017) and R$28.9 million (in 2016), Stock grant R$3.6 million (in 2017), Shareholder bonus and reimbursement R$10.7 million (in2017), Employee termination expenses R$1.3 million (in 2017) and R$10.5 million (in 2016) and Settlement of Attend (spin-off company)'s formerCEO R$3.1 million (in 2017)
(3)Disregards the effects on (net) Other operating expenses/income of non-recurring events related to tax provisions made in association with theinvestigation R$3.1 million (in 2017) and R$ 8.7 million (in 2016), write-off of recoverable PIS/COFINS resulting from the investigation R$7.8 million(in 2017), write off of assets R$14.7 million (in 2016), other operating associatied with impairment charges R$37.2 million (in 2017) and R$44.8million (in 2016), gains and losses on sale of assets R$ 25.8 million (in 2016)
(4)Equity pickup from spin-off discontinued operations R$7.3 million (in 2017)
(5)Disregards the effects on Finance Expense of non-recurring events related to fines and penalties recognized in the PRT/PERT programs R$120 million(in 2017), Finance expenses associated with late tax payments made outside the PRT/PERT R$ 82.2 million (in 2017) and R$57.6 million (in 2016),finance expenses in tax provisions made in association with the investigation R$11.3 million (in 2017) and R$17.2 million (in 2016)
(6)Disregards the effects on Finance Income of a non-recurring event related to the a discount on downpayment associated with debt restructuring -R$91.5 million (in 2017)
(7)Disregards the effects on Deferred Income and Social Contribution Taxes of a non-recurring event related to deferred tax recognized in connectionwith PRT/PERT programs R$373.2 million (in 2017)

Disclaimer
17
Important DisclosuresThis presentation is for informational purposes only and has been prepared to provide certain background materials in relation to Estre Ambiental, Inc. (together with its subsidiaries, “Estre” or the “Company”)and for no other purpose. The information contained in this presentation does not purport to be all inclusive. The data contained herein is derived from various internal and external sources. The informationcontained in this presentation is not, and should not be assumed to be, complete and does not present all the information that investors may require or desire in considering an investment in the Company.Accordingly, it is not intended to form the basis of any investment decision or any other decision. No representation is made as to the reasonableness of the assumptions made in this presentation or the accuracyor completeness of any projections or modeling or any other information contained in this presentation. Any data on past performance or modeling contained in this presentation is no indication as to futureperformance.The Companydoes not assume any obligation to update the informationin this presentation.No securities commission or securities regulatory authority or other authority in the United States, Brazil, the Cayman Islands or any other jurisdiction has in any way passed upon the accuracy or adequacy of thispresentation.Market and Industry DataIndustry and market data used in this presentation have been obtained from third-party industry publications and sources as well as from research reports prepared for other purposes. In addition, certaininformation pertaining to Company’s market position relies in part on the Company’s internal analyses in conjunction with industry reports. The Company has independently verified the data obtained fromthese sources and cannot assure you of the data’s accuracy or completeness. This data is subject to change and cannot always be verified with complete certainty due to limits on the availability and reliability ofrawdata, the voluntary nature of the data gathering processand other limitations and uncertainties inherent in any statisticalsurvey of market or industry data.No Offeror SolicitationThis presentation and any oral statements made in connection with this presentation do not constitute or form part of any offer or invitation to sell or issue, or any solicitation of any offer to purchase or subscribefor, or a recommendation to purchase, securities of the Company, nor shall any part of it nor the fact of its dissemination form part of or be relied on in connection with any contract or investment decisionrelating thereto. No offerof securities shall be made except by means of a prospectusmeeting the requirements of Section 10of the Securities Act of 1933,as amended.Presentationof Financial Information, Including Non-IFRS Financial MeasuresThis presentation includes non-IFRS financial measures, namely adjusted EBITDA, results excluding the effects of divested operations, net debt and adjusted CAPEX, which are supplementalmeasures of performance that are neither required by, nor presented in accordance with, generally accepted accounting principles (“GAAP”) or international financial reporting standards(“IFRS”). A reconciliation of some of these non-IFRS financial measures to Estre’s financial statements is included in the Appendix hereto. Estre calculates adjusted EBITDA as net income(loss) for the period from continuing operations plus total finance expenses, net, depreciation, amortization and depletion, income tax and social contribution, as adjusted to eliminate theeffects of certain events that, in the opinion of Estre’s management, are isolated in nature and, therefore, hamper comparability across periods, including mainly (i) certain gains and lossesincurred in the context of Estre’s comprehensive financial and organizational restructuring process occurring from 2014 to 2017, including gains and losses on the sale of certain assets soldto related parties in an effort to streamline its operations, severance expenses in connection with headcount reductions and extraordinary expenses relating to its restructuring incentiveplan, and (ii) the non-cash effect of certain accounting adjustments consisting of (A) impairment expenses as a result of lower than expected returns on certain of Estre’s landfills, (B) write-offs of property, plant and equipment following a review of historical transactions with certain of Estre’s suppliers and (C) provisions established in connection with Estre’s participation in atax amnesty program in 2017, and (iii) the effects of assets divested by Estre as part of its historical corporate restructuring efforts (including its contracts with Petrobras related to EstreO&G’s divested operations, sub-scale collections operations (Azaleia), and the Estrans landfill in Argentina).

Disclaimer (continued)
18
Presentationof Financial Information, Including Non-IFRS Financial Measures(cont.)In addition, this presentation also includes certain income statement and other financial information eliminating the effects of assets divested by Estre as part of its corporate restructuring efforts. Estre believesthe presentation of these metrics provides investors with a more meaningful understanding of its results exclusive of items that it believes otherwise distort comparability between periods. Financial informationexcluding the effects of divested operationsshould not be consideredby itself or as a substitute forrevenues from services rendered or other measures of operating performanceor liquidity.This presentation also includes adjusted CAPEX measures, which diverge from similarly titled measures that will be presented in Estre’s financial statements in accordance with IFRS. Accordingly, appropriatecautionshould be exercised in placing undue reliance on these figures.Non-IFRS financial measures have significant limitations as analytical tools, including that they may not reflect (i) Estre’s cash expenditures, or future requirements, for capital expenditures or contractualcommitments; (ii) changes in, or cash requirements for, Estre’s working capital needs and (iii) Estre’s significant interest expense, or the cash requirements necessary to service interest or principal payments, onEstre’sdebts.Non-IFRS financial measures do not have a standardized meaning, and the definition of such non-IFRS financial measures used by Estre may be different from other, similarly named non-IFRS measures used byEstre’speers operating in the wastemanagement industry. Comparabilitywith other companies on the basis of the non-IFRS financialmeasures as presented herein is therefore subject to significant limitations.As a result of the above, undue reliance should not be placed on non-IFRS financial measures (or any related metric derived therefrom) as a measure of Estre's operating performance, financial position or cashflow nor should such non-IFRS financial measures (or any other non-IFRS metric derived therefrom) be considered in isolation from, or as a substitute for, financial information presented in compliance with IFRS.Neither the SECnor any other securities commissionor securities regulatory authorityhas in any waypassed upon the merits of the non-IFRS financial informationcontained in this presentation.Forward Looking StatementsCertain statements included in this presentation are not historical facts but are forward-looking statements for purposes of the safe harbor provisions under the United States Private Securities Litigation ReformAct of 1995. Forward-looking statements generally are accompanied by words such as “believe,” “may,” “will,” “estimate,” “continue,” “anticipate,” “intend,” “expect,” “should,” “would,” “plan,” “predict,”“potential,” “seem,” “seek,” “future,” “outlook,” and similar expressions that predict or indicate future events or trends or that are not statements of historical matters. These statements are based on variousassumptions and on the current expectations of Estre management and are not predictions of actual performance. These forward-looking statements are subject to a number of risks and uncertainties, includinggeneral economic, political and business conditions in Brazil; potential government interventions resulting in changes to the Brazilian economy, applicable taxes and tariffs, inflation, exchange rates, interest ratesand the regulatory environment; changes in the financial condition of Estre’s clients affecting their ability to pay for its services; the results of competitive bidding processes, which could lead to the loss of materialcontracts or curtail Estre’s expansion efforts; Estre’s history of losses; the outcome of judicial and administrative proceedings to which Estre is or may become a party or governmental investigations to which Estremay become subject that could interrupt or limit Estre’s operations, result in adverse judgments, settlements or fines and create negative publicity; changes in Estre’s clients’ preferences, prospects and thecompetitive conditions prevailing in the Brazilian waste management; and failure to realize the anticipated benefits of the recent business combination with Boulevard Acquisition Corp II. The projected revenueand adjusted EBITDA information of Estre presented herein for 2018 does not reflect the potential impact on these amounts that could result from the adoption of IFRS 9 and 15, which is required to be adoptedcommencing in 2018 and principally relate to revenue recognition. These standards are substantially identical in content and timing to GAAP ASC 606. Like nearly all companies with SEC registered shares tradedin the US, Estre is still in the process of evaluating the potential impact of these accounting changes on future reporting of its financial results and condition. No assurance can be given at this time as to whether ornot the impact of these changes will be material.]If the risks above materialize or Estre’s assumptions prove incorrect, actual results could differ materially from the results implied by these forward-looking statements. There may be additional risks that Estredoes not presently know or that Estre currently believes are immaterial that could also cause actual results to differ from those contained in the forward-looking statements. In addition, forward-lookingstatements reflect Estre’s expectations, plans or forecasts of future events and views as of the date of this presentation. Estre anticipates that subsequent events and developments will cause Estre’s assessmentsto change. However, while Estre may elect to update these forward-looking statements at some point in the future, Estre specifically disclaims any obligation to do so. These forward-looking statements shouldnot be relied upon as representing Estre’sassessments as of any date subsequent to the date of this presentation.

Estre AmbientalAv. Presidente Juscelino Kubitschek, 1830 – 3rd floorSão Paulo/SP – BRAZIL+55 11 [email protected]