Embed Size (px)
Citation preview

ET Everywhere
Advanced modeling to calculate ET and weather data

22
Micro-manages each
property based upon
weather conditions and
soil type
Smart Water Management Network
Collects data from over
27,000 stations
ET Everywhere: analyzes ET data
SmartControllerClimate Center
Weather
Stations
WeatherTRAK Central
Smart Water Network: always-on, continuous
monitoringScheduling Engine
Evapotranspiration – ET

4
ETE Overview – The ET Equation
• The Standard Reference ET (ETo) adopted by ASCE
uses the standard Penman-Montieth equation:
)339.01(
273
)(890)(408.0
2
2
U
T
eeUGR
ET
dan
o
Assumes: well irrigated Kentucky Blue Grass cut at 6
inches in sandy loam soil

5
ETE Overview – What impacts ET
• What is ET – Evapotranspiration is the amount of water evaporated from the soil or transpired by the plant
• There are four main weather parameters that affect ET
– Temperature
• Higher temperature, higher ET
– Solar Radiation
• Higher solar radiation, higher ET
– Average Wind Speed
• Higher average wind speed, usually higher ET (depends on relative humidity)
– Relative Humidity
• Lower relative humidity, higher ET
– Other parameters include: soil temperature, soil type, soil water content, plant type, plant growing cycle, …

6
ET Comparison
• Not all ‘ET’ controllers actually use accurate ET
• WeatherTRAK uses Penman Montieth Evapotranspiration (ET) /
The essential index for smart controllers
– Calculates how much water is evaporated from the soil and
transpired by the plant on a daily basis
– The Gold Standard of horticulture, agribusiness and golf courses
– Recognized as the standard by the Irrigation Association, Center
for Irrigation Technology and the American Society of Civil
Engineers
– http://www.fao.org/docrep/X0490E/x0490e06.htm

8
WeatherTRAK ET Everywhere
• ET Everywhere
–Providing daily ET values for the US for over 5 years
–Calculated over 54 billion ET values
–Utilizes redundant collection and broadcast locations
and fault tolerant infrastructure
–Data provided to
• HydroPoint, Toro and Irritrol irrigation customers in
US, Canada and Australia
• H2ouse.org water conservation alliance web site
• Private and public data feed customers
9
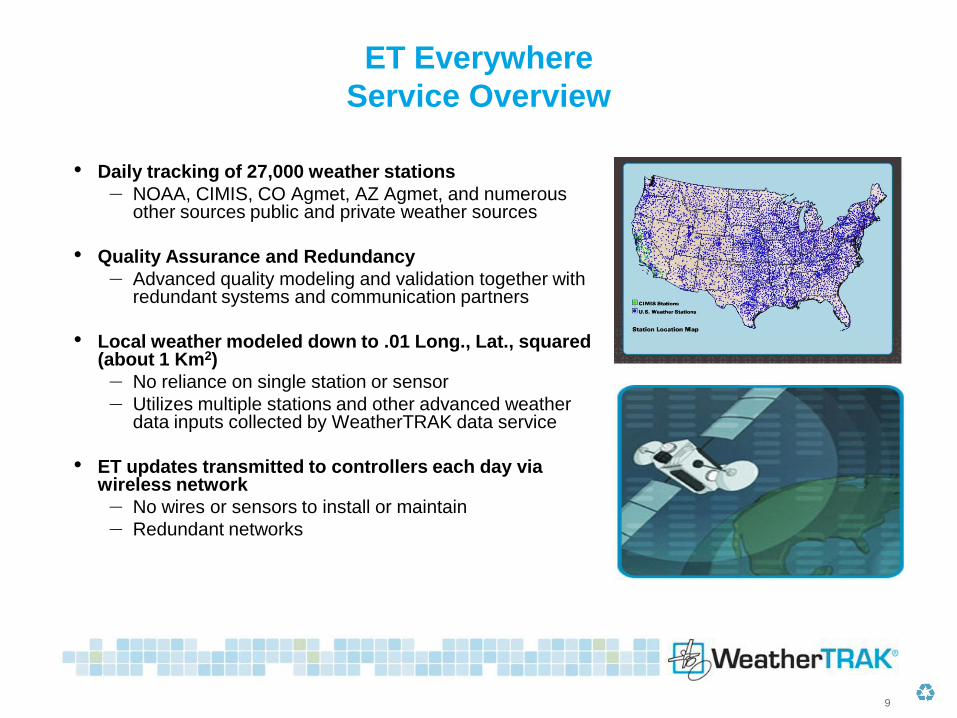
ET Everywhere
Service Overview
• Daily tracking of 27,000 weather stations
– NOAA, CIMIS, CO Agmet, AZ Agmet, and numerous other sources public and private weather sources
• Quality Assurance and Redundancy
– Advanced quality modeling and validation together with redundant systems and communication partners
• Local weather modeled down to .01 Long., Lat., squared (about 1 Km2)
– No reliance on single station or sensor
– Utilizes multiple stations and other advanced weather data inputs collected by WeatherTRAK data service
• ET updates transmitted to controllers each day via wireless network
– No wires or sensors to install or maintain
– Redundant networks

10
ET Everywhere
What we model – the weather
11
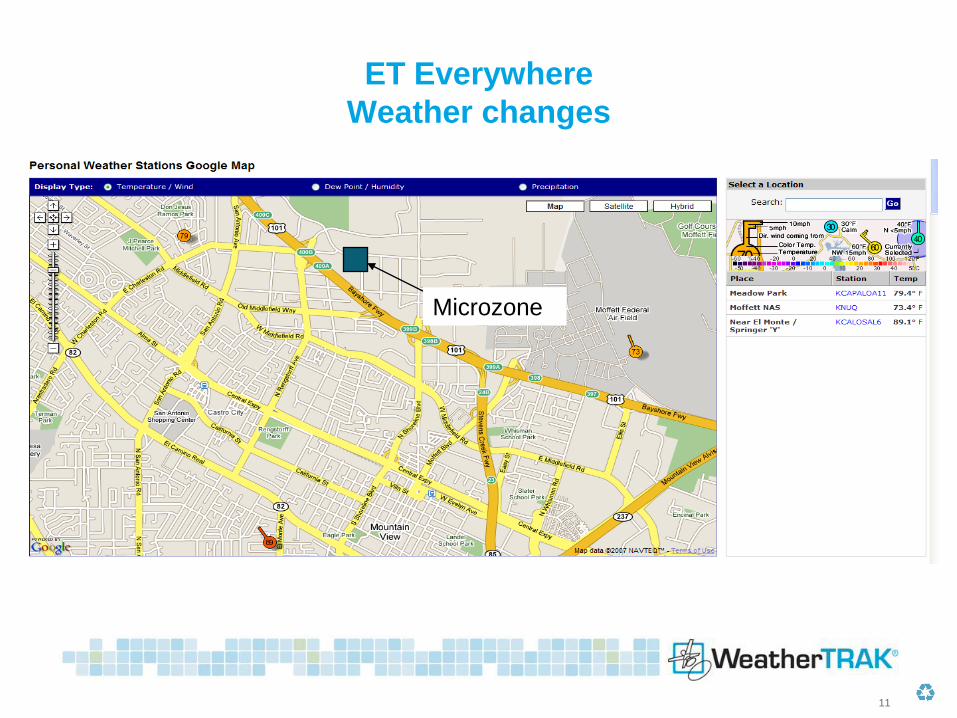
ET Everywhere
Weather changes
Microzone

12
ET Everywhere
Example Microzone (16 Million currently calculated daily)

13
ET Everywhere
How it works
• ET Everywhere uses proven WRF energy based modeling techniques, to calculate weather parameters for a given geographic area on an hourly basis
– Temperature, Wind Speed, Relative Humidity, Solar Radiation, Rain, Pressure, fluxes, …
The Weather Research and Forecasting (WRF) Model is a next-generation mesocale numerical weather prediction
system designed to serve both operational forecasting and atmospheric research needs. It features multiple
dynamical cores, a 3-dimensional variational (3DVAR) data assimilation system, and a software architecture allowing
for computational parallelism and system extensibility. WRF is suitable for a broad spectrum of applications across
scales ranging from meters to thousands of kilometers.
WRF is a collaborative partnership, principally among the National Center for Atmospheric Research (NCAR), the
National Oceanic and Atmospheric Administration (the National Centers for Environmental Prediction (NCEP) and
the Forecast Systems Laboratory (FSL), the Air Force Weather Agency (AFWA), the Naval Research Laboratory,
Oklahoma University, and the Federal Aviation Administration (FAA). WRF allows researchers the ability to conduct
simulations reflecting either real data or idealized configurations. WRF provides operational forecasting a model that
is flexible and efficient computationally, while offering the advances in physics, numerics, and data assimilation
contributed by the research community.
14
ET Everywhere
Reliable
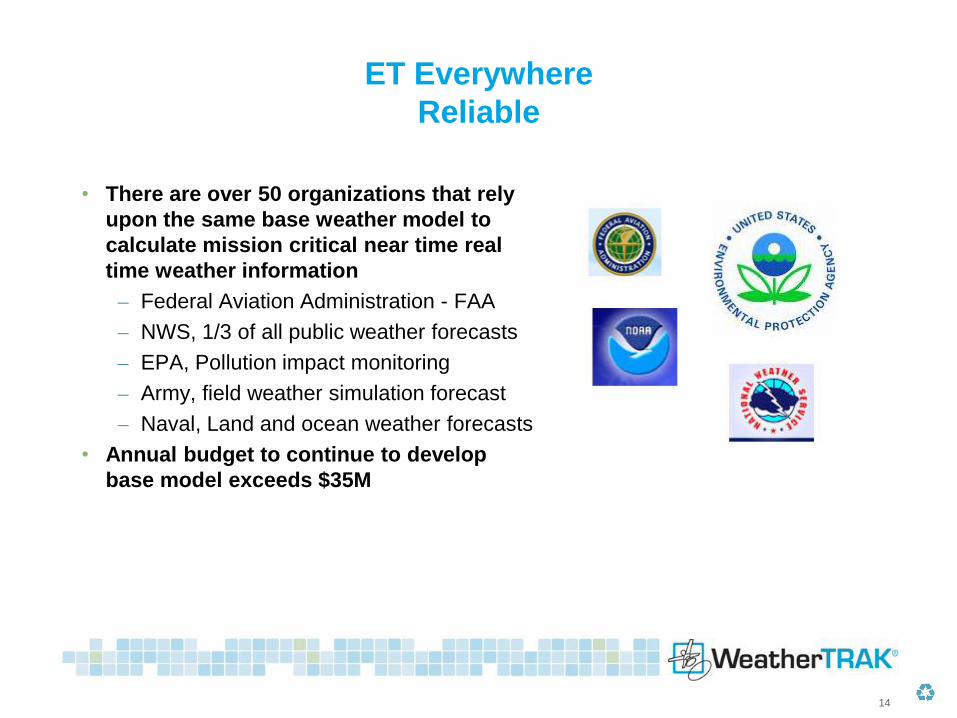
• There are over 50 organizations that rely
upon the same base weather model to
calculate mission critical near time real
time weather information
– Federal Aviation Administration - FAA
– NWS, 1/3 of all public weather forecasts
– EPA, Pollution impact monitoring
– Army, field weather simulation forecast
– Naval, Land and ocean weather forecasts
• Annual budget to continue to develop
base model exceeds $35M

15
ET Everywhere Process
Model Calculation Inputs
• Main data inputs
– Current global initialization data (NAM)
– Current validated weather observations
• Weather Station observations
• Radiosone data (upper atmosphere data)
– Topography
– Vegetation Index
• 25 vegetation categories (< 1 Km resolution) Albedo, Roughness, Moisture Availability, Emissivity, and Thermal Inertia
– Soil Index
• 17 soil categories (< 1 Km resolution) Evaporation rate, reference moisture, heat transfer conductivity
– Land Use Index
• Accounts for temperature anomalies effects based on Urban Areas

16
ET Everywhere Process
Model Calculation Infrastructure
• Calculate ET Data
– Uses modern blade based high performance computing cluster
• 2 TerraFLOPS of computing power
• 124 GB of RAM• Using Infiniband interconnect
– Make all processing cores act together faster• State of the Art Disk Disks Subsystems
– 90 Tbytes of disk space ~1.5 Million CD’s – Duplicate Datacenters for high reliability– Greener Computers – uses less power, runs cooler
• Calculate ET to Microzone resolution
• Calculates hourly ET data and sums to get daily ET

17
ET Everywhere Process
Validate and Update
• Validate Data– Weather station parameter validation
• Compare weather parameter output with weather stations observations
• Includes ET based weather stations as well as non-ET based weather stations
• Includes Satellite and Radar data sources
– Geographic based zone level trend analysis
• Perform analysis based on geographic parameters
– Local Weather patterns
– Topography
– Urban heat affect
– Deep heuristic knowledge of weather patterns and microclimate issues
18
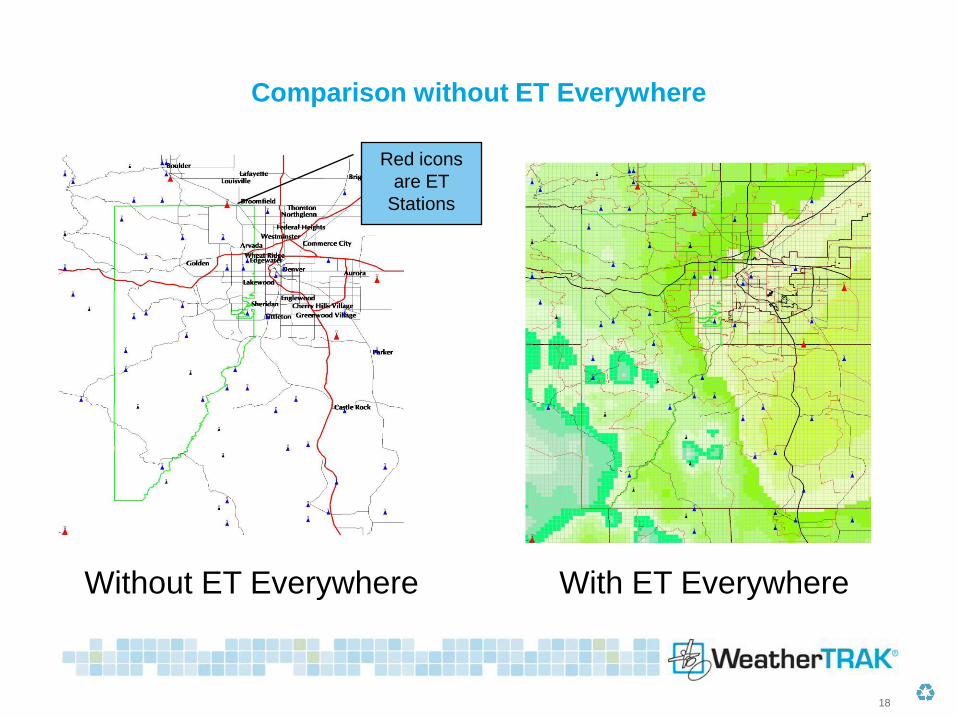
Comparison without ET Everywhere
Without ET Everywhere With ET Everywhere
Red icons
are ET
Stations

19
Daily ET Everywhere
A Day in Southern California