Embed Size (px)
Citation preview

ETA-UTP009Revision 0
Effective March 23, 2001
Measurement and Evaluationof
Magnetic Fields (EMF) andElectromagnetic Radiation
(EMI) Generated byElectric Vehicles
Prepared by
Electric Transportation Applications
Prepared by: _______________________________ Date:__________ Steven R. Ryan
Approved by: ___________________________________________________ Date: _______________ Jude M. Clark

ETA-UTP009 Revision 0
22000011 Electric Transportation Applications AAllll RRiigghhttss RReesseerrvveedd
2
TABLE OF CONTENTS
1.0 Objective 3
2.0 Purpose 3
3.0 Documentation 3
4.0 Prerequisites 4
5.0 Materials and Tools
6.0 Magnetic Field and Electromagnetic Radiation
6.1 Magnetic Field Measurement Procedure
6.2 Magnetic Field Evaluation Procedure
6.3 Magnetic Field Measurement During the
Implementation of SAE J1634 Driving Cycle
6.4 Magnetic Field Measurement During the
Three Speed Test
6.5 Measurement of Electromagnetic Radiation6.6 Determination of Radio Frequency Interference
7.0 Glossary 12?
8.0 References 13?
Appendices
Appendix A - Vehicle Metrology Setup Sheet 14?
Appendix B - Device Interference Record 15?

ETA-UTP009 Revision 0
22000011 Electric Transportation Applications AAllll RRiigghhttss RReesseerrvveedd
3
1.0 Purpose
The purpose of this procedure is to identify and record low frequency (power frequency)magnetic field (EMF) and high frequency electromagnetic radiation (EMI) from UEV.This procedure shall collect test data as specified in the requirement of this procedure.
This activity is meant to quantify results obtained while the vehicle is being tested as atotal system. Tests of specific subsystems or portions of individual subsystems areaddressed by other Test Procedures. This testing and data acquisition meets therequirements specified in the Technical Requirements.
2.0 Objective
The following are the objectives of this procedure:
2.1 Determination of maximum, minimum and average values of EMF at variouslocations inside the UEV during the SAE J1634 driving cycle.
2.2 Determination of frequency spectrum of EMF during the SAE1634 driving cycle.
2.3 Determination of EMF at driver's seat during the full acceleration mode.
2.4 Determination of EMF at passenger seats during the full acceleration mode.
2.5 Determination of EMF at rear seats during the full acceleration mode.
2.6 Determination of EMF at drivers at a constant speed of 10 mph.
2.7 Determination of EMF at passenger seats at a constant speed of 10 mph.
2.8 Determination of EMF at rear seats at a constant speed of 10 mph.
2.9 Determination of EMF at drivers seat at a constant speed of 25 mph.
2.10 Determination of EMF at passenger seats at a constant speed of 25 mph.
2.11 Determination of EMF at rear seats at a constant speed of 25 mph.
2.12 Determination of EMF at drivers seat at a constant speed of 40 mph.
2.13 Determination of EMF at passenger seats at a constant speed of 45 mph.
2.14 Determination of EMF at rear seats at a constant speed of 40 mph.
2.15 Determination of EMF at driver's seat during the deceleration mode.
2.16 Determination of EMF at passenger's seat during the deceleration mode.
2.17 Determination of EMF at rear seats during the deceleration mode.
2.18 Determination of maximum and average values for each location.
2.19 Determination of Total Harmonic Distortion (THD) of EMF for each location andeach mode of operation.
2.20 Determination of electromagnetic radiation in the frequency range of 9 kHz to 30MHz.

ETA-UTP009 Revision 0
22000011 Electric Transportation Applications AAllll RRiigghhttss RReesseerrvveedd
4
2.21 Determination of EMI on both sides of vehicle 1m away from the vehicle at aconstant speed of 10 mph.
2.22 Determination of location of maximum EMI generated from the vehicle.
2.23 Determination of EMI during the constant speed of 10, 25 and 40 mph at thatlocation.
2.24 Determination of receiving levels of AM and FM radio stations during normaldriving.
2.25 Determination of EMI interference on the operation of cellular phones.
2.26 Determination of EMI interference on operation of mobile radio scanning devices.
2.27 Determination of EMI interference on operation of citizen band radios.
2.28 Determination of EMI interference on operation of portable disc players.
2.29 Determination of EMI interference on operation of notebook computers.

ETA-UTP009 Revision 0
22000011 Electric Transportation Applications AAllll RRiigghhttss RReesseerrvveedd
5
3.0 Documentation
Documentation addressed by this procedure shall be consistent, easy to understand, easyto read, and readily reproducible. This documentation shall contain enough informationto “stand alone”; that is, be self-contained to the extent that all individuals qualified toreview it could be reasonably expected to reach a common conclusion, without the needto review additional documentation. Review and approval of test documentation shall bein accordance with ETA-UAC004, “Review of Test Results.” Storage and retention ofrecords during and following testing activities shall be completed as described inProcedure ETA-UAC001, “Control, Close-out and Storage of Documentation.”
ETA-UTP009 Revision 0
22000011 Electric Transportation Applications AAllll RRiigghhttss RReesseerrvveedd
6
4.0 Limitations and Precautions/ Initial Conditions and Prerequisites
Prior to conduct of any testing, the following initial conditions and prerequisites shall bemet. Satisfactory completion of these items shall be verified as complete and recorded onthe UEV Appropriate Test Data Sheets.
4.1 Personnel conducting testing under this procedure shall be familiar with therequirements of this procedure as evidenced by Certification by the ProgramManager or Test Manager, any applicable SAE Test Instructions, and theAdministrative Control Procedures, prior to commencing any testing activities.
4.2 All documentation required to complete the testing shall be completed, approvedand issued prior to commencing the testing it addresses.
4.3 The following data shall be collected during conduct of the various tests specifiedby this procedure.
4.3.1 X component of magnetic field versus time;
4.3.2 Y component of magnetic field versus time;
4.3.3 Z component of magnetic field versus time;
4.3.4 Battery charge/discharge current;
4.4 Overall error in recording or indicating instruments shall not exceed ±2% of themaximum value of the variable being measured. Periodic calibration shall beperformed and documented to ensure compliance with this requirement. This shallbe verifiable to the requirements of ETA-UQA001, “Quality Audits.”
4.5 A list of all instrumentation used in the test shall be identified on Appendix A,and attached to the test results. It shall include the following information
4.5.1 Manufacturer4.5.2 Model Number4.5.3 Serial Number4.5.4 Last Calibration date4.5.5 Next Calibration date
4.6. Environmental conditions during the testing shall be recorded and include, at aminimum, the following:4.6.1. Range of ambient temperature during the test;4.6.2. Air humidity.
4.7. For each test, or portion thereof, the date and starting and ending times shall berecorded.
4.8. Any deviation from the test procedure and the reason for the deviation shall beapproved in advance by the Program Manager or Test Manager as provided for inprocedure ETA-UAC002, “Control of Test Conduct.

ETA-UTP009 Revision 0
22000011 Electric Transportation Applications AAllll RRiigghhttss RReesseerrvveedd
7
4.9. Necessary measurement and monitoring equipment shall be installed in a mannerthat does not hinder vehicle operation or alter operating characteristics of thevehicle.
4.10. During testing, all surfaces, other than those normally in contact with water, shallbe dry.

ETA-UTP009 Revision 0
22000011 Electric Transportation Applications AAllll RRiigghhttss RReesseerrvveedd
8
5.0 Materials and Tools
A variety of instrumentation, materials and tools will be used in this test.
5.1 All instrumentation used in the test shall be listed on Appendix H (M&TE UsageList), attached to the test data sheets/results, and shall include the followinginformation:5.1.1 Manufacturer
5.1.2 Model Number
5.1.3 Serial Number
5.1.4 Last Calibration date
5.1.5 Next Calibration date
5.2 Any deviation from the test procedure and the reason for the deviation shall berecorded on the Appropriate Test Results Comment Sheet.
5.3 Approximate list of instrumentation to be used for this test is:5.3.1 Data acquisition system based on the LabView environment.
5.3.2 Data acquisition PCMCIA card from National Instruments installed on aportable computer.
5.3.3 Analog to digital converter.
5.3.4 Voltage divider.
5.3.5 Shunt resistor for current measurement.
5.3.6 Clamp-on current transformer.
5.3.7 Three-axis Magnetic field sensor with frequency range 0 – 9 kHz.
5.3.8 Receiving antenna – 1.0 m nominal length.
5.3.9 Scanning receiver with frequency range 9 kHz – 1000 MHz.
5.3.10 Temperature sensors.
5.3.11 Humidity sensors.
5.3.12 Portable computer.

ETA-UTP009 Revision 0
22000011 Electric Transportation Applications AAllll RRiigghhttss RReesseerrvveedd
9
6.0. Magnetic Field and Electromagnetic Radiation
6.1. Magnetic Field Measurement Procedure
Figure 1 represents the measurement circuit, which is implemented to monitor themagnetic field generated by an electric vehicle in a running mode.
Ddaaa
A Dynamometer
Magnetic FieldSensor Location
Dynamometer
Ampl. PC
Figure 1. Measurement circuit for monitoring the magnetic field
The following instrumentation is required:
• DC/AC current transformer - FLUKE Y8100 or equivalent• Three axis magnetic field sensor with a frequency range of DC to
50 kHz• LabVIEW data acquisition system and equipment
The DC/AC current probe shall have two ranges of operation - 20A and 200A. Itshall also have an amplifier with an analog output of ± 2 V for each measurementrange. This analog output is fed to the computer.
The magnetic field sensor shall contain three orthogonal mounted sensors. Eachsensor measures a corresponding component of the magnetic field and has a built-in amplifier. Each of the amplifiers provides a ± 2V analog output signal, which isalso fed to the computer. The sensor has three measurement ranges. Each axis isnormally set at the 200 milliGauss (mG) range.
Data acquisition program shall be written in LabVIEW (a virtual instrument), totake the signals from four sources (the current probe and the three components ofthe magnetic field) and perform the necessary computations. These data shall betaken in continuous snapshots, with the only delay between the snapshots beingthe time required to perform necessary calculations. Time data are sampled at arate of 21.6 kHz (this is a time interval between samples of 0.0463 ms.) Thissampling rate enables monitoring of the frequency harmonics of any parameter upto 10.8 kHz.

ETA-UTP009 Revision 0
22000011 Electric Transportation Applications AAllll RRiigghhttss RReesseerrvveedd
10
6.2. Magnetic Field Evaluation Procedure
The magnetic fields shall be measured in every seat-belted position in the vehiclein the following operational modes:
• Acceleration• Constant Speed (Cruising)• Deceleration• Charging Mode
However, in the charging mode, the fields shall be measured only in the closevicinity of the charger.
Four channels shall acquire analog signals from four sources. Each signal shallthen be corrected for the particular current probe ratio and magnetometeramplification. The signal shall then be digitized. The rms value of current shall becalculated based on the equation:
IN
i= ∑1 2 Eq. 1
The calculated rms value is then stored in the computer file.
The analog signal from each magnetic field sensor is directly proportional to themagnetic field. The DC component of the magnetic field shall be calculated foreach axis as follows:
bxdc = mean(bx)
by mean bydc = ( ) Eq. 2
bz mean bzdc = ( )
The AC components of the field shall be extracted as follows:
bx bx bxac dc= −
by by byac dc= − Eq. 3
bz bz bzac dc= −

ETA-UTP009 Revision 0
22000011 Electric Transportation Applications AAllll RRiigghhttss RReesseerrvveedd
11
The following equations shall be used to calculate the rms value of eachcomponent of the AC magnetic field:
BXN
bxac ac= ∑1 2
BYN
byac ac= ∑1 2 Eq. 4
BZN
bzac ac= ∑1 2
The total AC and DC magnetic fields shall then be calculated as follows:
B bx by bzdc dc dc dc= + +2 2 2 Eq. 5
B BX BY BZac ac ac ac= + +2 2 2 Eq. 6
Both field components shall be continuously stored in the same file with thecurrent.
The frequency spectrum of each magnetic field component shall be performed asfollows:
FFT bx
FFT by
FFT bz
ac
ac
ac
( )
( )
( )
Eq. 7

ETA-UTP009 Revision 0
22000011 Electric Transportation Applications AAllll RRiigghhttss RReesseerrvveedd
12
The frequency spectrum of the total magnetic field shall then be calculated asfollows:
FFT b FFT bx FFT by FFT bzac ac ac( ) ( ( )) ( ( )) ( ( ))= + +2 2 2 Eq. 8
Using the first harmonic in the spectrum and the rms value of the total magneticfield, the Total Harmonic Distortion (THD) of the magnetic field is calculated:
THDB B
Bac=
+2 2
2
1
1Eq. 9

ETA-UTP009 Revision 0
22000011 Electric Transportation Applications AAllll RRiigghhttss RReesseerrvveedd
13
6.3. Magnetic Field Measurement during the implementation of SAEJ1634driving cycle
This test is designed to determine the magnetic field generated by the vehicle at thedifferent modes of operations. Measurements will be made in at least one location insidethe vehicle. Data will be taken at distances of 1 ft above the seat.
6.3.1. The purpose of the magnetic field test is to:
6.3.1.1. Identify the vehicle’s magnetic field vs. time curves for each ofmeasurement locations. These curves will identify the relationshipbetween the maximum magnetic fields and mode of vehicle operation.
6.3.1.2. Determine the Total Harmonic Distortion of the magnetic field in eachmeasurement location at various modes of operations.
6.3.1.3. Capture three axis magnetic field waveforms at various modes ofoperations.
6.3.1.4. Determine average, max., min, and median values of magnetic fieldduring the test duration.
6.3.1.5. Determine frequency spectrum of magnetic field generated from thevehicle.
6.3.1.6. Determine the max. Frequency components of magnetic field.
6.3.2. This testing shall be completed subject to the initial conditions and prerequisitesstated in Section 4 of this procedure.
6.3.3. Instrument the vehicle to obtain, at a minimum, the data identified in Section 4.3.
6.3.4. Place the vehicle on the dynamometer.
6.3.5. Turn the vehicle off.
6.3.6. Start the computer data acquisition system. Data shall be stored in appropriatelynamed file in the computer – C:\UEV1\EMF Test\main file.
6.3.7. Acquire sample waveforms of three-axis magnetic field and store them in anappropriately named file in the computer – C:\UEV1\EMF Test\Waveforms\. Thiswould be a background magnetic field.
6.3.8. Record the magnetic field generated in the vehicle when the vehicle is turned offfor 2 minutes.
6.3.9. While the magnetic field data are being recorded turn on the dynamometer andrun the vehicle through the UDC SAEJ1634 cycle.
6.3.10. During the test collect magnetic field waveforms periodically.
6.3.11. At the end of SAEJ1634 driving cycle turn the vehicle off.
6.3.12. Continue collecting data for another 2 minutes.
6.3.13. Stop data collection. Record the end time test.

ETA-UTP009 Revision 0
22000011 Electric Transportation Applications AAllll RRiigghhttss RReesseerrvveedd
14
6.3.14. Calculate the average, maximum, minimum, median and standard deviation ofmagnetic field and record them in Appendix B.

ETA-UTP009 Revision 0
22000011 Electric Transportation Applications AAllll RRiigghhttss RReesseerrvveedd
15
6.4. Magnetic Field Measurement during the Three Speed Test
This test is designed to determine the magnetic field generated by the vehicle invarious modes of operation in every seat inside the vehicle. Data will be taken atdistances of 1 ft above the seat.
6.4.1. The purpose of the magnetic field test is to:
6.4.1.1. Identify the magnetic field vs. time curves for each ofmeasurement locations generated from the vehicle. These curveswill identify the relationship between the maximum magneticfields and mode of vehicle operation.
6.4.1.2. Determine location inside the vehicle that is exposed tomaximum magnetic file generated from the vehicle.
6.4.1.3. Determine the variation between vehicles speed and magneticfield generated.
6.4.1.4. Determine the Total Harmonic Distortion of the magnetic field ineach measurement location at various modes of operations.
6.4.1.5. Capture three axis magnetic field waveforms at various modes ofoperations.
6.4.1.6. Determine average, max, min, and median values of magneticfield during the test duration.
6.4.1.7. Determine frequency spectrum of magnetic field generated fromthe vehicle.
6.4.1.8. Determine the max. Frequency components of magnetic field.
6.4.2. This testing shall be completed subject to the initial conditions andprerequisites stated in Section 4 of this procedure.
6.4.3. Instrument the vehicle to obtain, at a minimum, the data identified inSection 4.3.
6.4.4. Place the vehicle on the dynamometer.
6.4.5. Place the three-axis magnetic field sensor on the passenger front seat.
6.4.6. Turn the injection key on and let the vehicle running for two minutes.
6.4.7. Start the computer data acquisition system. Data shall be stored inappropriately named file in the computer – C:\UEV1\EMF Test\Frontpassenger seat\main file.
6.4.8. Acquire sample waveforms of three-axis magnetic field and store them inan appropriately named file in the computer – C:\UEV1\EMF Test\ Frontpassenger seat \Waveforms\. This is a background magnetic field. Collectthe data for approximately 60 seconds.

ETA-UTP009 Revision 0
22000011 Electric Transportation Applications AAllll RRiigghhttss RReesseerrvveedd
16
6.4.9. After 60 seconds data collection accelerate the vehicle to the speedof 10 mph. Establish steady state condition of 10 mph (16 km/h).
6.4.10. Acquire sample waveforms of three-axis magnetic field at this speed.
6.4.11. Continue to collect data for approximately 60 seconds.
6.4.12. After 60 seconds data collection, accelerate the vehicle to the speed of 25mph. Establish steady state condition of 25 mph (40 km/h).
6.4.13. Acquire sample waveforms of three-axis magnetic field at this speed.
6.4.14. Continue to collect data for approximately 60 seconds.
6.4.15. After 60 seconds data collection accelerate the vehicle to the speed of 40mph. Establish steady state condition of 40 mph (64 km/h)..
6.4.16. Acquire sample waveforms of three-axis magnetic field at this speed.
6.4.17. Continue to collect data for approximately 60 seconds.
6.4.18. After 60 seconds at constant speed of 40 mph, decelerate rapidly and bringthe speed at 0 mph.
6.4.19. Continue to collect data for approximately 60 seconds.
6.4.20. Turn off the vehicle and stop the data collection.
6.4.21. Place the three-axis magnetic field sensor in drivers seat.
6.4.22. Turn the injection key on and let the vehicle running for two minutes.
6.4.23. Start the computer data acquisition system. Data shall be stored inappropriately named file in the computer – C:\UEV1\EMF Test\Driversseat\main file.
6.4.24. Acquire sample waveforms of three-axis magnetic field and store them inan appropriately named file in the computer – C:\UEV1\EMF Test\Drivers seat \Waveforms\. This is a background magnetic field. Collect thedata for approximately 60 seconds.
6.4.25. After 60 seconds data collection accelerate the vehicle to the speed of 10mph. Establish steady state condition of 10 mph (16 km/h).
6.4.26. Acquire sample waveforms of three-axis magnetic field at this speed.
6.4.27. Continue to collect data for approximately 60 seconds.
6.4.28. After 60 seconds data collection, accelerate the vehicle to the speed of 25mph. Establish steady state condition of 25 mph (40 km/h).
6.4.29. Acquire sample waveforms of three-axis magnetic field at this speed.
6.4.30. Continue to collect data for approximately 60 seconds.
6.4.31. After 60 seconds data collection accelerate the vehicle to the speed of 40mph. Establish steady state condition of 40 mph (64 km/h).

ETA-UTP009 Revision 0
22000011 Electric Transportation Applications AAllll RRiigghhttss RReesseerrvveedd
17
6.4.32. Acquire sample waveforms of three-axis magnetic field at this speed.
6.4.33. Continue to collect data for approximately 60 seconds.
6.4.34. After 60 seconds at constant speed of 40 mph, decelerate rapidly and bringthe speed at 0 mph.
6.4.35. Continue to collect data for approximately 60 seconds.
6.4.36. Turn off the vehicle and stop the data collection.
6.4.37. Place the three-axis magnetic field sensor in rear right seat.
6.4.38. Turn the injection key on and let the vehicle running for two minutes.
6.4.39. Start the computer data acquisition system. Data shall be stored inappropriately named file in the computer – C:\UEV1\EMF Test\RearRight seat\main file.
6.4.40. Acquire sample waveforms of three-axis magnetic field and store them inan appropriately named file in the computer – C:\UEV1\EMF Test\RearRight seat \Waveforms\. This is a background magnetic field. Collect thedata for approximately 60 seconds.
6.4.41. After 60 seconds data collection accelerate the vehicle to the speed of 10mph. Establish steady state condition of 10 mph (16 km/h).
6.4.42. Acquire sample waveforms of three-axis magnetic field at this speed.
6.4.43. Continue to collect data for approximately 60 seconds.
6.4.44. After 60 seconds data collection, accelerate the vehicle to the speed of 25mph. Establish steady state condition of 25 mph (40 km/h).
6.4.45. Acquire sample waveforms of three-axis magnetic field at this speed.
6.4.46. Continue to collect data for approximately 60 seconds.
6.4.47. After 60 seconds data collection accelerate the vehicle to the speed of 40mph. Establish steady state condition of 40 mph (64 km/h).
6.4.48. Acquire sample waveforms of three-axis magnetic field at this speed.
6.4.49. Continue to collect data for approximately 60 seconds.
6.4.50. After 60 seconds at constant speed of 40 mph, decelerate rapidly and bringthe speed at 0 mph.
6.4.51. Continue to collect data for approximately 60 seconds.
6.4.52. Turn off the vehicle and stop the data collection.
6.4.53. Place the three-axis magnetic field sensor in rear left seat.
6.4.54. Turn the injection key on and let the vehicle running for two minutes.

ETA-UTP009 Revision 0
22000011 Electric Transportation Applications AAllll RRiigghhttss RReesseerrvveedd
18
6.4.55. Start the computer data acquisition system. Data shall be stored inappropriately named file in the computer – C:\UEV1\EMF Test\Rear Leftseat\main file.
6.4.56. Acquire sample waveforms of three-axis magnetic field and store them inan appropriately named file in the computer – C:\UEV1\EMF Test\RearLeft seat \Waveforms\. This is a background magnetic field. Collect thedata for approximately 60 seconds.
6.4.57. After 60 seconds data collection accelerate the vehicle to the speed of 10mph. Establish steady state condition of 10 mph (16 km/h).
6.4.58. Acquire sample waveforms of three-axis magnetic field at this speed.
6.4.59. Continue to collect data for approximately 60 seconds.
6.4.60. After 60 seconds data collection, accelerate the vehicle to the speed of 25mph. Establish steady state condition of 25 mph (40 km/h).
6.4.61. Acquire sample waveforms of three-axis magnetic field at this speed.
6.4.62. Continue to collect data for approximately 60 seconds.
6.4.63. After 60 seconds data collection accelerate the vehicle to the speed of 40mph. Establish steady state condition of 40 mph (64 km/h).
6.4.64. Acquire sample waveforms of three-axis magnetic field at this speed.
6.4.65. Continue to collect data for approximately 60 seconds.
6.4.66. After 60 seconds at constant speed of 40 mph, decelerate rapidly and bringthe speed at 0 mph.
6.4.67. Continue to collect data for approximately 60 seconds.
6.4.68. Turn off the vehicle and stop the data collection. Record the end time test.
6.4.69. Record the calculated data on Appendix C.

ETA-UTP009 Revision 0
22000011 Electric Transportation Applications AAllll RRiigghhttss RReesseerrvveedd
19
6.5. Measurement of Electromagnetic Radiation (EMI)
This test is designed to determine the radiated magnetic and electric filedstrengths over the frequency range 9 kHz to 30 MHz. Data will be taken outsidethe vehicle at three constant speeds consistent with SAE 551.
6.5.1 The purpose of the magnetic field test is to:
6.5.1.1 Determine the EMI on four sides of the vehicle during the constantspeed of 25 mph.
6.5.1.2 Determine in which side of the vehicle occurs maximum EMIradiation.
6.5.1.3 On the side of the vehicle with higher EMI values, determine theEMI at the speeds of 10 mph.
6.5.1.4 On the side of the vehicle with higher EMI values, determine theEMI at the speeds of 40 mph
6.5.1.5 Determine the relationship between the maximum EMI and speedof vehicle.
6.5.1.6 Determine the Radiated field strengths as a function of frequency.
66..55..22 This testing shall be completed subject to the initial conditions andprerequisites stated in Section 4 of this procedure
6.5.3 Instrument the vehicle to obtain, at a minimum, the data identified inSection 4.3.
6.5.4 Measurement of EMI Radiation in front of the vehicle.
6.5.4.1 Place the antenna of 1.0-meter nominal length mounted abovethe ground plane 1.0 ±0.5 m above the ground level and 1.0 m ±0.05 m away from the nearest part of the front of the vehicle.
6.5.4.2 Establish steady state condition of 25 mph (40 km/h) in highgear.
6.5.4.3 Scan the radiated emission levels in the frequency range from 9to 30 kHz. Determine the radiated field strength as a function offrequency by plotting or graphing the data.
6.5.4.4 Determine the peak field intensity within this range and record itin the units of dBµV or dBµV/kHz.
6.5.4.5 Scan the radiated emission levels in the frequency range from 30to 60 kHz. Determine the radiated field strength as a function offrequency by plotting or graphing the data.
6.5.4.6 Determine the peak field intensity within this range and record itin the units of dBµV or dBµV/kHz.
ETA-UTP009 Revision 0
22000011 Electric Transportation Applications AAllll RRiigghhttss RReesseerrvveedd
20
6.5.4.7 Scan the radiated emission levels in the frequency range from 60to 120 kHz. Determine the radiated field strength as a function offrequency by plotting or graphing the data.
6.5.4.8 Determine the peak field intensity within this range and record itin the units of dBµV or dBµV/kHz.
6.5.4.9 Scan the radiated emission levels in the frequency range from120 to 250 kHz. Determine the radiated field strength as afunction of frequency by plotting or graphing the data.
6.5.4.10 Determine the peak field intensity within this range and record itin the units of dBµV or dBµV/kHz.
6.5.4.11 Scan the radiated emission levels in the frequency range from250 to 500 kHz. Determine the radiated field strength as afunction of frequency by plotting or graphing the data.
6.5.4.12 Determine the peak field intensity within this range and record itin the units of dBµV or dBµV/kHz.
6.5.4.13 Scan the radiated emission levels in the frequency range from500 to 1.1 MHz. Determine the radiated field strength as afunction of frequency by plotting or graphing the data.
6.5.4.14 Determine the peak field intensity within this range and record itin the units of dBµV or dBµV/kHz.
6.5.4.15 Scan the radiated emission levels in the frequency range from 1.1to 2.4 MHz. Determine the radiated field strength as a function offrequency by plotting or graphing the data.
6.5.4.16 Determine the peak field intensity within this range and record itin the units of dBµV or dBµV/kHz.
6.5.4.17 Scan the radiated emission levels in the frequency range from 2.4MHz to 5.0 MHz. Determine the radiated field strength as afunction of frequency by plotting or graphing the data.
6.5.4.18 Determine the peak field intensity within this range and record itin the units of dBµV or dBµV/kHz.
6.5.4.19 Scan the radiated emission levels in the frequency range from 5.0to 10 MHz. Determine the radiated field strength as a function offrequency by plotting or graphing the data.
6.5.4.20 Determine the peak field intensity within this range and record itin the units of dBµV or dBµV/kHz.
6.5.4.21 Scan the radiated emission levels in the frequency range from 10to 20 MHz. Determine the radiated field strength as a function offrequency by plotting or graphing the data.

ETA-UTP009 Revision 0
22000011 Electric Transportation Applications AAllll RRiigghhttss RReesseerrvveedd
21
6.5.4.22 Determine the peak field intensity within this range and record itin the units of dBµV or dBµV/kHz.
6.5.4.23 Scan the radiated emission levels in the frequency range from 20to 30 MHz. Determine the radiated field strength as a function offrequency by plotting or graphing the data.
6.5.4.24 Determine the peak field intensity within this range and record itin the units of dBµV or dBµV/kHz.
6.5.4.25 Record each reading in Appendix D.
6.5.5 Measurement of EMI Radiation on the back of the vehicle
6.5.5.1 Place the antenna of 1.0 m nominal length mounted above theground plane 1.0 ±0.5 m above the ground level and 1.0 m ± 0.05m away from the nearest part of the end of the vehicle.
6.5.5.2 Establish steady state condition of 25 mph (40 km/h) in highgear.
6.5.5.3 Scan the radiated emission levels in the frequency range from 9to 30 kHz. Determine the radiated field strength as a function offrequency by plotting or graphing the data.
6.5.5.4 Determine the peak field intensity within this range and record itin the units of dBµV or dBµV/kHz.
6.5.5.5 Scan the radiated emission levels in the frequency range from 30to 60 kHz. Determine the radiated field strength as a function offrequency by plotting or graphing the data.
6.5.5.6 Determine the peak field intensity within this range and record itin the units of dBµV or dBµV/kHz.
6.5.5.7 Scan the radiated emission levels in the frequency range from 60to 120 kHz. Determine the radiated field strength as a function offrequency by plotting or graphing the data.
6.5.5.8 Determine the peak field intensity within this range and record itin the units of dBµV or dBµV/kHz.
6.5.5.9 Scan the radiated emission levels in the frequency range from120 to 250 kHz. Determine the radiated field strength as afunction of frequency by plotting or graphing the data.
6.5.5.10 Determine the peak field intensity within this range and record itin the units of dBµV or dBµV/kHz.
6.5.5.11 Scan the radiated emission levels in the frequency range from250 to 500 kHz. Determine the radiated field strength as afunction of frequency by plotting or graphing the data.

ETA-UTP009 Revision 0
22000011 Electric Transportation Applications AAllll RRiigghhttss RReesseerrvveedd
22
6.5.5.12 Determine the peak field intensity within this range and record itin the units of dBµV or dBµV/kHz.
6.5.5.13 Scan the radiated emission levels in the frequency range from500 to 1.1 MHz. Determine the radiated field strength as afunction of frequency by plotting or graphing the data.
6.5.5.14 Determine the peak field intensity within this range and record itin the units of dBµV or dBµV/kHz.
6.5.5.15 Scan the radiated emission levels in the frequency range from 1.1to 2.4 MHz. Determine the radiated field strength as a function offrequency by plotting or graphing the data.
6.5.5.16 Determine the peak field intensity within this range and record itin the units of dBµV or dBµV/kHz.
6.5.5.17 Scan the radiated emission levels in the frequency range from 2.4MHz to 5.0 MHz. Determine the radiated field strength as afunction of frequency by plotting or graphing the data.
6.5.5.18 Determine the peak field intensity within this range and record itin the units of dBµV or dBµV/kHz.
6.5.5.19 Scan the radiated emission levels in the frequency range from 5.0to 10 MHz. Determine the radiated field strength as a function offrequency by plotting or graphing the data.
6.5.5.20 Determine the peak field intensity within this range and record itin the units of dBµV or dBµV/kHz.
6.5.5.21 Scan the radiated emission levels in the frequency range from 10to 20 MHz. Determine the radiated field strength as a function offrequency by plotting or graphing the data.
6.5.5.22 Determine the peak field intensity within this range and record itin the units of dBµV or dBµV/kHz.
6.5.5.23 Scan the radiated emission levels in the frequency range from 20to 30 MHz. Determine the radiated field strength as a function offrequency by plotting or graphing the data.
6.5.5.24 Determine the peak field intensity within this range and record itin the units of dBµV or dBµV/kHz.
6.5.5.25 Record each reading in Appendix D.
6.5.6 Measurement of EMI Radiation on the left side of the vehicle.
6.5.6.1 Place the antenna of 1.0 m nominal length mounted above theground plane 1.0 ±0.5 m above the ground level and 1.0 m ± 0.05m away from the nearest part of the left side of the vehicle.

ETA-UTP009 Revision 0
22000011 Electric Transportation Applications AAllll RRiigghhttss RReesseerrvveedd
23
6.5.6.2 Establish steady state condition of 25 mph (40 km/h) in highgear.
6.5.6.3 Scan the radiated emission levels in the frequency range from 9to 30 kHz. Determine the radiated field strength as a function offrequency by plotting or graphing the data.
6.5.6.4 Determine the peak field intensity within this range and record itin the units of dBµV or dBµV/kHz.
6.5.6.5 Scan the radiated emission levels in the frequency range from 30to 60 kHz. Determine the radiated field strength as a function offrequency by plotting or graphing the data.
6.5.6.6 Determine the peak field intensity within this range and record itin the units of dBµV or dBµV/kHz.
6.5.6.7 Scan the radiated emission levels in the frequency range from 60to 120 kHz. Determine the radiated field strength as a function offrequency by plotting or graphing the data.
6.5.6.8 Determine the peak field intensity within this range and record itin the units of dBµV or dBµV/kHz.
6.5.6.9 Scan the radiated emission levels in the frequency range from120 to 250 kHz. Determine the radiated field strength as afunction of frequency by plotting or graphing the data.
6.5.6.10 Determine the peak field intensity within this range and record itin the units of dBµV or dBµV/kHz.
6.5.6.11 Scan the radiated emission levels in the frequency range from250 to 500 kHz. Determine the radiated field strength as afunction of frequency by plotting or graphing the data.
6.5.6.12 Determine the peak field intensity within this range and record itin the units of dBµV or dBµV/kHz.
6.5.6.13 Scan the radiated emission levels in the frequency range from500 to 1.1 MHz. Determine the radiated field strength as afunction of frequency by plotting or graphing the data.
6.5.6.14 Determine the peak field intensity within this range and record itin the units of dBµV or dBµV/kHz.
6.5.6.15 Scan the radiated emission levels in the frequency range from 1.1to 2.4 MHz. Determine the radiated field strength as a function offrequency by plotting or graphing the data.
6.5.6.16 Determine the peak field intensity within this range and record itin the units of dBµV or dBµV/kHz.

ETA-UTP009 Revision 0
22000011 Electric Transportation Applications AAllll RRiigghhttss RReesseerrvveedd
24
6.5.6.17 Scan the radiated emission levels in the frequency range from 2.4MHz to 5.0 MHz. Determine the radiated field strength as afunction of frequency by plotting or graphing the data.
6.5.6.18 Determine the peak field intensity within this range and record itin the units of dBµV or dBµV/kHz.
6.5.6.19 Scan the radiated emission levels in the frequency range from 5.0to 10 MHz. Determine the radiated field strength as a function offrequency by plotting or graphing the data.
6.5.6.20 Determine the peak field intensity within this range and record itin the units of dBµV or dBµV/kHz.
6.5.6.21 Scan the radiated emission levels in the frequency range from 10to 20 MHz. Determine the radiated field strength as a function offrequency by plotting or graphing the data.
6.5.6.22 Determine the peak field intensity within this range and record itin the units of dBµV or dBµV/kHz.
6.5.6.23 Scan the radiated emission levels in the frequency range from 20to 30 MHz. Determine the radiated field strength as a function offrequency by plotting or graphing the data.
6.5.6.24 Determine the peak field intensity within this range and record itin the units of dBµV or dBµV/kHz.
6.5.6.25 Record each reading in Appendix D.
6.5.7 Measurement of EMI Radiation on the right side of the vehicle
6.5.7.1 Place the antenna of 1.0 m nominal length mounted above theground plane 1.0 ±0.5 m above the ground level and 1.0 m ± 0.05m away from the nearest part of the right side of the vehicle.
6.5.7.2 Establish steady state condition of 25 mph (40 km/h) in highgear.
6.5.7.3 Scan the radiated emission levels in the frequency range from 9to 30 kHz. Determine the radiated field strength as a function offrequency by plotting or graphing the data.
6.5.7.4 Determine the peak field intensity within this range and record itin the units of dBµV or dBµV/kHz.
6.5.7.5 Scan the radiated emission levels in the frequency range from 30to 60 kHz. Determine the radiated field strength as a function offrequency by plotting or graphing the data.
6.5.7.6 Determine the peak field intensity within this range and record itin the units of dBµV or dBµV/kHz.

ETA-UTP009 Revision 0
22000011 Electric Transportation Applications AAllll RRiigghhttss RReesseerrvveedd
25
6.5.7.7 Scan the radiated emission levels in the frequency range from 60to 120 kHz. Determine the radiated field strength as a function offrequency by plotting or graphing the data.
6.5.7.8 Determine the peak field intensity within this range and record itin the units of dBµV or dBµV/kHz.
6.5.7.9 Scan the radiated emission levels in the frequency range from120 to 250 kHz. Determine the radiated field strength as afunction of frequency by plotting or graphing the data.
6.5.7.10 Determine the peak field intensity within this range and record itin the units of dBµV or dBµV/kHz.
6.5.7.11 Scan the radiated emission levels in the frequency range from250 to 500 kHz. Determine the radiated field strength as afunction of frequency by plotting or graphing the data.
6.5.7.12 Determine the peak field intensity within this range and record itin the units of dBµV or dBµV/kHz.
6.5.7.13 Scan the radiated emission levels in the frequency range from500 to 1.1 MHz. Determine the radiated field strength as afunction of frequency by plotting or graphing the data.
6.5.7.14 Determine the peak field intensity within this range and record itin the units of dBµV or dBµV/kHz.
6.5.7.15 Scan the radiated emission levels in the frequency range from 1.1to 2.4 MHz. Determine the radiated field strength as a function offrequency by plotting or graphing the data.
6.5.7.16 Determine the peak field intensity within this range and record itin the units of dBµV or dBµV/kHz.
6.5.7.17 Scan the radiated emission levels in the frequency range from 2.4MHz to 5.0 MHz. Determine the radiated field strength as afunction of frequency by plotting or graphing the data.
6.5.7.18 Determine the peak field intensity within this range and record itin the units of dBµV or dBµV/kHz.
6.5.7.19 Scan the radiated emission levels in the frequency range from 5.0to 10 MHz. Determine the radiated field strength as a function offrequency by plotting or graphing the data.
6.5.7.20 Determine the peak field intensity within this range and record itin the units of dBµV or dBµV/kHz.
6.5.7.21 Scan the radiated emission levels in the frequency range from 10to 20 MHz. Determine the radiated field strength as a function offrequency by plotting or graphing the data.

ETA-UTP009 Revision 0
22000011 Electric Transportation Applications AAllll RRiigghhttss RReesseerrvveedd
26
6.5.7.22 Determine the peak field intensity within this range and record itin the units of dBµV or dBµV/kHz.
6.5.7.23 Scan the radiated emission levels in the frequency range from 20to 30 MHz. Determine the radiated field strength as a function offrequency by plotting or graphing the data.
6.5.7.24 Determine the peak field intensity within this range and record itin the units of dBµV or dBµV/kHz.
6.5.7.25 Record each reading in Appendix D.
6.5.8 From the data collected on 5.4., 5.5., 5.6., and 5.7 determine the side of thevehicle with the maximum EMI radiation.
6.5.9 Place the antenna on the side of the vehicle with maximum EMI radiation.
6.5.10 Measurement of EMI radiation on the side with maximum radiation duringthe steady state condition of 10 mph.
6.5.10.1 Place the antenna of 1.0 m nominal length mounted above theground plane 1.0 ±0.5 m above the ground level and 1.0 m ±0.05 m away from the nearest part of the side of the vehiclewith maximum radiation.
6.5.10.2 Establish steady state condition of 10 mph (16 km/h) in highgear.
6.5.10.3 Scan the radiated emission levels in the frequency range from 9to 30 kHz. Determine the radiated field strength as a functionof frequency by plotting or graphing the data.
6.5.10.4 Determine the peak field intensity within this range and recordit in the units of dBµV or dBµV/kHz.
6.5.10.5 Scan the radiated emission levels in the frequency range from30 to 60 kHz. Determine the radiated field strength as afunction of frequency by plotting or graphing the data.
6.5.10.6 Determine the peak field intensity within this range and recordit in the units of dBµV or dBµV/kHz.
6.5.10.7 Scan the radiated emission levels in the frequency range from60 to 120 kHz. Determine the radiated field strength as afunction of frequency by plotting or graphing the data.
6.5.10.8 Determine the peak field intensity within this range and recordit in the units of dBµV or dBµV/kHz.
6.5.10.9 Scan the radiated emission levels in the frequency range from120 to 250 kHz. Determine the radiated field strength as afunction of frequency by plotting or graphing the data.
ETA-UTP009 Revision 0
22000011 Electric Transportation Applications AAllll RRiigghhttss RReesseerrvveedd
27
6.5.10.10 Determine the peak field intensity within this range and recordit in the units of dBµV or dBµV/kHz.
6.5.10.11 Scan the radiated emission levels in the frequency range from250 to 500 kHz. Determine the radiated field strength as afunction of frequency by plotting or graphing the data.
6.5.10.12 Determine the peak field intensity within this range and recordit in the units of dBµV or dBµV/kHz.
6.5.10.13 Scan the radiated emission levels in the frequency range from500 to 1.1 MHz. Determine the radiated field strength as afunction of frequency by plotting or graphing the data.
6.5.10.14 Determine the peak field intensity within this range and recordit in the units of dBµV or dBµV/kHz.
6.5.10.15 Scan the radiated emission levels in the frequency range from1.1 to 2.4 MHz. Determine the radiated field strength as afunction of frequency by plotting or graphing the data.
6.5.10.16 Determine the peak field intensity within this range and recordit in the units of dBµV or dBµV/kHz.
6.5.10.17 Scan the radiated emission levels in the frequency range from2.4 MHz to 5.0 MHz. Determine the radiated field strength as afunction of frequency by plotting or graphing the data.
6.5.10.18 Determine the peak field intensity within this range and recordit in the units of dBµV or dBµV/kHz.
6.5.10.19 Scan the radiated emission levels in the frequency range from5.0 to 10 MHz. Determine the radiated field strength as afunction of frequency by plotting or graphing the data.
6.5.10.20 Determine the peak field intensity within this range and recordit in the units of dBµV or dBµV/kHz.
6.5.10.21 Scan the radiated emission levels in the frequency range from10 to 20 MHz. Determine the radiated field strength as afunction of frequency by plotting or graphing the data.
6.5.10.22 Determine the peak field intensity within this range and recordit in the units of dBµV or dBµV/kHz.
6.5.10.23 Scan the radiated emission levels in the frequency range from20 to 30 MHz. Determine the radiated field strength as afunction of frequency by plotting or graphing the data.
6.5.10.24 Determine the peak field intensity within this range and recordit in the units of dBµV or dBµV/kHz.
6.5.10.25 Record each reading in Appendix D.

ETA-UTP009 Revision 0
22000011 Electric Transportation Applications AAllll RRiigghhttss RReesseerrvveedd
28
6.5.11 Measurement of EMI radiation on the side with maximum radiation duringthe steady state condition of 40 mph.
6.5.11.1 Place the antenna of 1.0 m nominal length mounted above theground plane 1.0 ±0.5 m above the ground level and 1.0 m ±0.05 m away from the nearest part of the side of the vehiclewith maximum radiation.
6.5.11.2 Establish steady state condition of 40 mph (64 km/h) in highgear.
6.5.11.3 Scan the radiated emission levels in the frequency range from 9to 30 kHz. Determine the radiated field strength as a functionof frequency by plotting or graphing the data.
6.5.11.4 Determine the peak field intensity within this range and recordit in the units of dBµV or dBµV/kHz.
6.5.11.5 Scan the radiated emission levels in the frequency range from30 to 60 kHz. Determine the radiated field strength as afunction of frequency by plotting or graphing the data.
6.5.11.6 Determine the peak field intensity within this range and recordit in the units of dBµV or dBµV/kHz.
6.5.11.7 Scan the radiated emission levels in the frequency range from60 to 120 kHz. Determine the radiated field strength as afunction of frequency by plotting or graphing the data.
6.5.11.8 Determine the peak field intensity within this range and recordit in the units of dBµV or dBµV/kHz.
6.5.11.9 Scan the radiated emission levels in the frequency range from120 to 250 kHz. Determine the radiated field strength as afunction of frequency by plotting or graphing the data.
6.5.11.10 Determine the peak field intensity within this range and recordit in the units of dBµV or dBµV/kHz.
6.5.11.11 Scan the radiated emission levels in the frequency range from250 to 500 kHz. Determine the radiated field strength as afunction of frequency by plotting or graphing the data.
6.5.11.12 Determine the peak field intensity within this range and recordit in the units of dBµV or dBµV/kHz.
6.5.11.13 Scan the radiated emission levels in the frequency range from500 to 1.1 MHz. Determine the radiated field strength as afunction of frequency by plotting or graphing the data.
6.5.11.14 Determine the peak field intensity within this range and recordit in the units of dBµV or dBµV/kHz.

ETA-UTP009 Revision 0
22000011 Electric Transportation Applications AAllll RRiigghhttss RReesseerrvveedd
29
6.5.11.15 Scan the radiated emission levels in the frequency range from1.1 to 2.4 MHz. Determine the radiated field strength as afunction of frequency by plotting or graphing the data.
6.5.11.16 Determine the peak field intensity within this range and recordit in the units of dBµV or dBµV/kHz.
6.5.11.17 Scan the radiated emission levels in the frequency range from2.4 MHz to 5.0 MHz. Determine the radiated field strength as afunction of frequency by plotting or graphing the data.
6.5.11.18 Determine the peak field intensity within this range and recordit in the units of dBµV or dBµV/kHz.
6.5.11.19 Scan the radiated emission levels in the frequency range from5.0 to 10 MHz. Determine the radiated field strength as afunction of frequency by plotting or graphing the data.
6.5.11.20 Determine the peak field intensity within this range and recordit in the units of dBµV or dBµV/kHz.
6.5.11.21 Scan the radiated emission levels in the frequency range from10 to 20 MHz. Determine the radiated field strength as afunction of frequency by plotting or graphing the data.
6.5.11.22 Determine the peak field intensity within this range and recordit in the units of dBµV or dBµV/kHz.
6.5.11.23 Scan the radiated emission levels in the frequency range from20 to 30 MHz. Determine the radiated field strength as afunction of frequency by plotting or graphing the data.
6.5.11.24 Determine the peak field intensity within this range and recordit in units of dBµV or dBµV/kHz.
6.5.11.25 Record each reading in Appendix D.

ETA-UTP009 Revision 0
22000011 Electric Transportation Applications AAllll RRiigghhttss RReesseerrvveedd
30
6.6. Radio Frequency Interference
6.6.1. As vehicles are operated through their test program on the track and in“run-downs” (when the car is driven for the sole purpose of dischargingthe battery to a pre-determined State of Charge (SOC)), drivers shouldconduct random checks of the AM and FM radio bands, to determine ifradio stations which can normally be received in non electric vehicles canalso be received in the test electric vehicles. Those comments will benoted on driver comment sheets, as appropriate, for transcription at a laterdate.
6.6.2. While operating on the dynamometer in accordance with ETA-UTP003,the following devices shall be operated to determine if any interference isbeing generated from the vehicle:6.6.2.1 Cellular telephone (analog)
6.6.2.2 Mobile radio scanning over the 70 cm and 2M bands
6.6.2.3 Citizen band radio
6.6.2.4 Portable compact disc player6.6.2.5 Notebook computer
Devices and/or their antennae shall be located in a manner to maximizetheir potential for interference. [Prior to testing the initial vehicle, thesedevices shall be operated in the dynamometer with the dynamometeroperating to verify there is no background interference.]
6.6.3 Device operation and any interference noted shall be recorded onAppendix B.
6.6.4 The following devices shall be operated with the vehicle on thedynamometer to determine if the any impact on the vehicle charge systemcan be detected:
6.6.4.1 A Citizen’s Band Radio operating at the legal limit of 5 wattsoutput
6.6.4.2 Mobile radio antennae (70 cm and 2M band frequencies) operatingat 7 watts output.
6.6.4.3 A cellular telephone (analog)
6.6.4.4 Record any impact on Appendix E.

ETA-UTP009 Revision 0
22000011 Electric Transportation Applications AAllll RRiigghhttss RReesseerrvveedd
31
7.0 Glossary
7.1. Audible Noise - Noise that is considered to be within the range of normal humanhearing, nominally 20 Hz to 20,000 Hz.
7.2. Frequency Harmonic - A multiple of the fundamental or base frequency. May bealso be a sub-harmonic.
7.3. Frequency Spectrum - The entire range of frequencies being considered.
7.4. Orthogonally - Consisting of the -x, -y and -z axes (three dimensional)
7.5. Program Manager - As used in this procedure, the individual within ElectricTransportation Applications responsible for oversight of the UEV AmericaPerformance Test Program. [Subcontract organizations may have similarly titledindividuals, but they are not addressed by this procedure.]
7.6. RMS - Root Mean Squared. For sinusoidal waveforms, a value that is equal to themeasured value multiplied by 1.414 (the square root of 2). Can also be determinedby multiplying the peak value by 0.707.
7.7. Shall - Items that require adherence without deviation. Shall statements identifybinding requirements. A go, no-go criterion.
7.8. Should - Items that require adherence if at all possible. Should statements identifypreferred conditions.
7.9. Snapshot - A term given to the time frame that normally accompanies a singleevent or a number of concurrent events. Usually indicates a repetitive series ofevents is occurring or is meant to occur.
7.10. Test Director - The individual within Electric Transportation Applicationsresponsible for all testing activities associated with the UEV AmericaPerformance Test Program.
7.11. Test Director’s Log - A daily diary kept by the Test Director, Program Manager,Test Manager or Test Engineer to document major activities and decisions thatoccur during the conduct of a Performance Test Evaluation Program. This log isnormally a running commentary, utilizing timed and dated entries to document theday's activities. This log is edited to develop the Daily Test Log published withthe final report for each vehicle.
7.12. Test Engineer - The individual(s) assigned responsibility for the conduct of anygiven test. [Each contractor/subcontractor should have at least one individualfilling this position. If so, they shall be responsible for adhering to therequirements of this procedure.]

ETA-UTP009 Revision 0
22000011 Electric Transportation Applications AAllll RRiigghhttss RReesseerrvveedd
32
7.0 Glossary (continued)
7.13. Test Manager - The individual within Electric Transportation Applicationsresponsible for the implementation of the test program for any given vehicle(s)being evaluated to the requirements of the UEV America Performance TestProgram. [Subcontract organizations may have similarly titled individuals, butthey are not addressed by this procedure.]
7.14. Time Stamp - The arbitrary time zero (to) denoting the beginning of an event.

ETA-UTP009 Revision 0
22000011 Electric Transportation Applications AAllll RRiigghhttss RReesseerrvveedd
33
8.0 References
8.1 UEV America Technical Requirements
8.2 IEEE-450 1987, “Recommended Practices for Stationary Lead Acid StorageBatteries”
8.3 ETA-UAC001, Revision 0 - “Control, Close-out and Storage of Documentation”
8.4 ETA-UAC002, Revision 0 - “Control of Test Conduct”
8.5 ETA-UAC004, Revision 0 - “Review of Test Results”
8.6 ETA-UAC005, Revision 0 - “Training and Certification Requirements forPersonnel Utilizing ETA Procedures”
8.7 ETA-UAC006, Revision 0 - “Vehicle Verification”
8.8 ETA-UAC007, Revision 0 - “Control of Measuring and Test Equipment”
8.9 ETA-UQA001, Revision 0 - “Quality Audits”
8.10 ETA-UTP003, Revision 0 - “Electric Vehicle Energy Consumption and RangeTest”
8.11 ETA-UTP011, Revision 0 - “Receipt Inspection”
8.12 SAE J1634, Combined UDS-HWFET Fuel Efficiency Test

ETA-UTP009 Revision 0
22000011 Electric Transportation Applications AAllll RRiigghhttss RReesseerrvveedd
34
APPENDIX-AElectric Vehicle Metrology Setup Sheets
(Page 1 of 1)
Vehicle VIN: __________________________
Instrument/Device: Calibration Due Date: Initials / Date:Fifth Wheel S/N:
Fifth Wheel Calibrator S/N:
DAS S/N:
DAS Set-up Sheet S/N
kWh Meter S/N:
Shunt S/N:
Tire Pressure Gauge S/N:
Misc:
Misc:
Misc:
Misc:
Comments (initials/date):
Completed By:
(Printed Name) (Signature) (Date)
Reviewed By (QA):
(Printed Name) (Signature) (Date)

APPENDIX-BElectroMagnetic Field TestDuring the SAEJ1634 Cycle
Data Sheet(Page 1 of 1)
Sequence No: File No.:Time (initial): Time (final):Vehicle Temp (initial):
(°F or °C)
Vehicle Temp (final): (°F or °C)
Odometer Reading (initial): (Miles)
Odometer Reading (final): (Miles)
Sensor at Passenger Seat MaximumValue
MinimumValue
AverageValue
MedianValue
StandardDeviation
mG mG MG mG mGBackground – Vehicle offBackground – Vehicle on
SAEJ1634Background – Vehicle onBackground – Vehicle off
Vehicle on Charge
Comments (initials/date):
____________________________________________________________________________________________________________________________________________________________________________________________________________________________________________________________________________________________________________________________
Completed By:(Printed Name) (Signature ) (Date)
Reviewed By:(Printed Name) (Signature) (Date)
Approved By:(Printed Name) (Signature) (Date)

ETA-UTP009 Revision 0
2001 Electric Transportation Applications All Rights Reserved
3366
APPENDIX-CElectro Magnetic Field TestDuring the Three Speed Test
Data Sheet (Page 1 of 1)
Sequence No: File No.:Time (initial): Time (final):Vehicle Temp (initial):
(°F or °C)
Vehicle Temp (final): (°F or °C)
Odometer Reading (initial): (Miles)
Odometer Reading (final): (Miles)
Mode of Operation Drivers Seat Passenger Seat Rear Left Seat Rear Right SeatEMF THD EMF THD EMF THD EMF THDmG % mG % mG % mG %
Background – Vehicle offBackground – Vehicle on
Acceleration102540
DecelerationBackground – Vehicle onBackground – Vehicle off
Vehicle on Charge
Comments (initials/date): The reported values of magnetic field and total harmonic distortion areaverage values during the duration of the test
____________________________________________________________________________________________________________________________________________________________________________________________________________________________________________________________________________________________________________________________
Completed By:(Printed Name) (Signature ) (Date)
Reviewed By:(Printed Name) (Signature) (Date)
Approved By:(Printed Name) (Signature) (Date)

ETA-UTP009 Revision 0
2001 Electric Transportation Applications All Rights Reserved
3377
APPENDIX-DElectromagnetic Radiation Test
Data Sheet(Page 1 of 6)
Sequence No: File No.:Time (initial): Time (final):Micro Turbine Temp (initial):
(°F or °C)
Micro Turbine Temp (final): (°F or °C)
Run Time (initial): (Hours)
Run Time (final): (Hours)
Electromagnetic Radiated Levels
Sensor Location: 1 m away from the FRONT of the vehicleMode of operation of the vehicle: Constant Speed of 25 mph
FrequencyRange
Radiated level FrequencyRange
Radiated level FrequencyRange
Radiated level
kHz dBµV/kHz kHz dBµV/kHz MHz dBµV/kHz
9 – 30 0.25 – 0.5 5.0 – 10.030 – 60 0.5 – 1.1 10 – 20
60 – 120 1.1 – 2.4 20 - 30120 – 250 2.4 – 5.0
Comments (initials/date): The values of radiated field are peak values within a frequency range
___________________________________________________________________________________________________________________________________________________________________________________________________________________________________________________________________________________________________________________________________________________________________________________________________________
Completed By:(Printed Name) (Signature ) (Date)
Reviewed By:(Printed Name) (Signature) (Date)
Approved By:(Printed Name) (Signature) (Date)
ETA-UTP009 Revision 0
2001 Electric Transportation Applications All Rights Reserved
3388
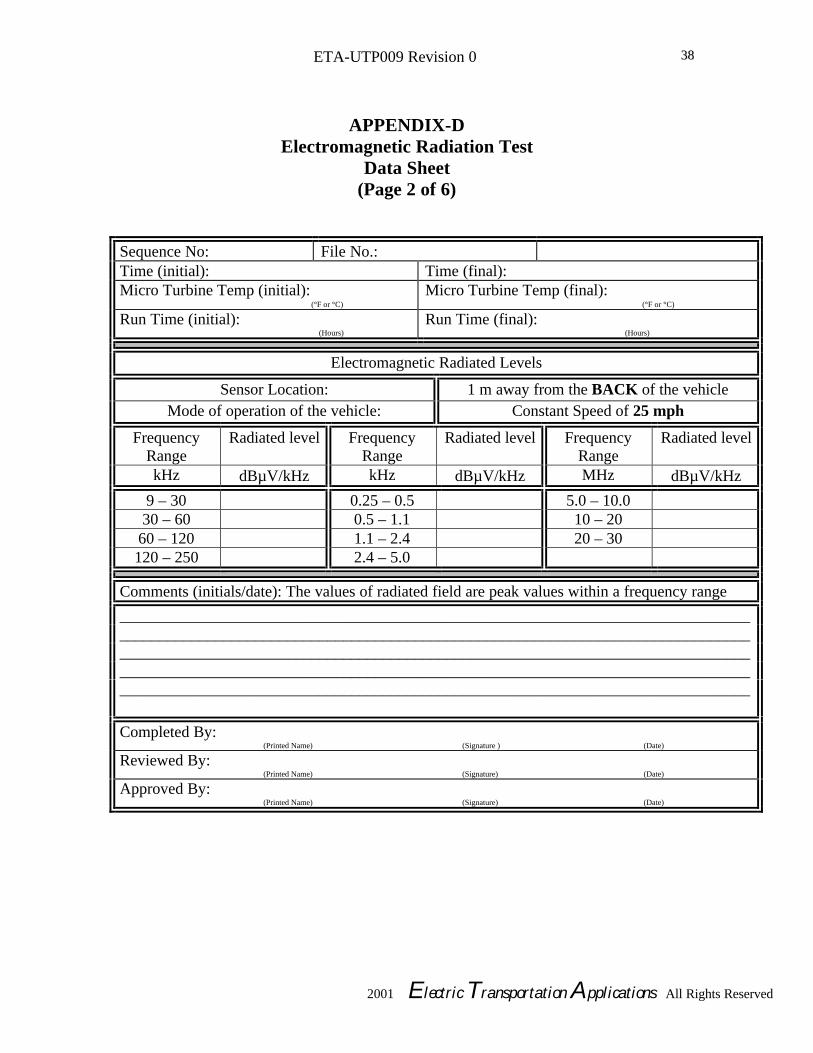
APPENDIX-DElectromagnetic Radiation Test
Data Sheet(Page 2 of 6)
Sequence No: File No.:Time (initial): Time (final):Micro Turbine Temp (initial):
(°F or °C)
Micro Turbine Temp (final): (°F or °C)
Run Time (initial): (Hours)
Run Time (final): (Hours)
Electromagnetic Radiated Levels
Sensor Location: 1 m away from the BACK of the vehicleMode of operation of the vehicle: Constant Speed of 25 mph
FrequencyRange
Radiated level FrequencyRange
Radiated level FrequencyRange
Radiated level
kHz dBµV/kHz kHz dBµV/kHz MHz dBµV/kHz
9 – 30 0.25 – 0.5 5.0 – 10.030 – 60 0.5 – 1.1 10 – 20
60 – 120 1.1 – 2.4 20 – 30120 – 250 2.4 – 5.0
Comments (initials/date): The values of radiated field are peak values within a frequency range
___________________________________________________________________________________________________________________________________________________________________________________________________________________________________________________________________________________________________________________________________________________________________________________________________________
Completed By:(Printed Name) (Signature ) (Date)
Reviewed By:(Printed Name) (Signature) (Date)
Approved By:(Printed Name) (Signature) (Date)
ETA-UTP009 Revision 0
2001 Electric Transportation Applications All Rights Reserved
3399
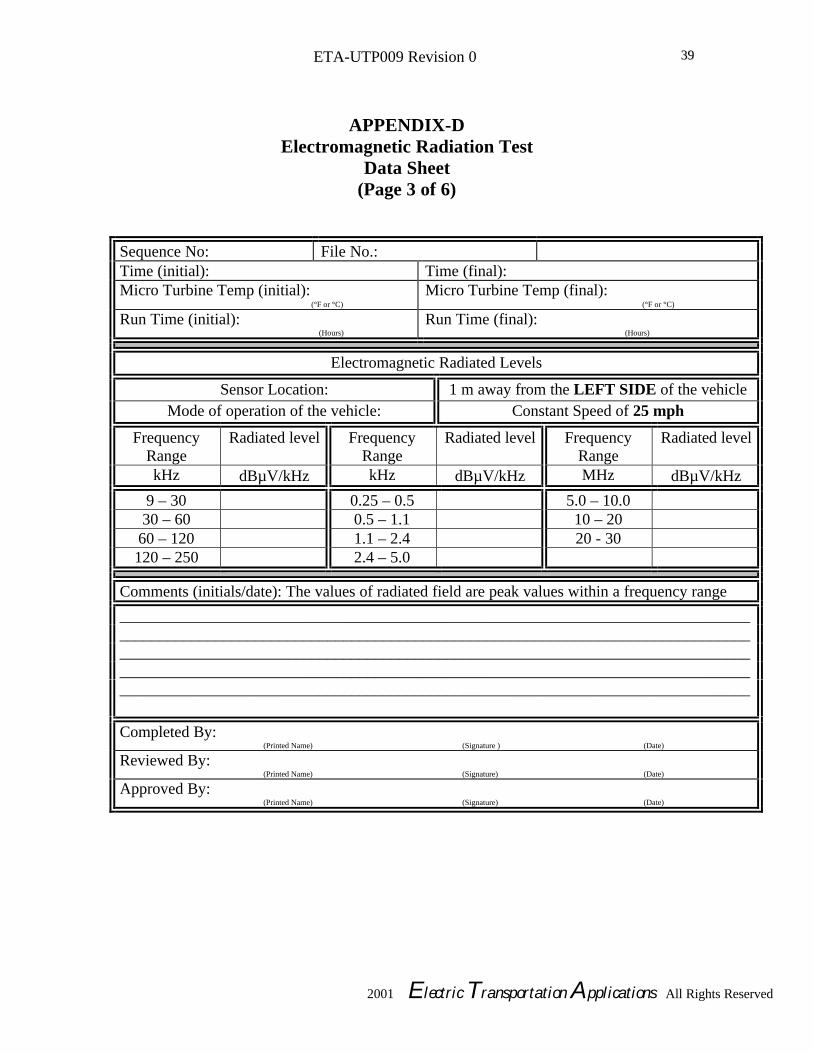
APPENDIX-DElectromagnetic Radiation Test
Data Sheet(Page 3 of 6)
Sequence No: File No.:Time (initial): Time (final):Micro Turbine Temp (initial):
(°F or °C)
Micro Turbine Temp (final): (°F or °C)
Run Time (initial): (Hours)
Run Time (final): (Hours)
Electromagnetic Radiated Levels
Sensor Location: 1 m away from the LEFT SIDE of the vehicleMode of operation of the vehicle: Constant Speed of 25 mph
FrequencyRange
Radiated level FrequencyRange
Radiated level FrequencyRange
Radiated level
kHz dBµV/kHz kHz dBµV/kHz MHz dBµV/kHz
9 – 30 0.25 – 0.5 5.0 – 10.030 – 60 0.5 – 1.1 10 – 20
60 – 120 1.1 – 2.4 20 - 30120 – 250 2.4 – 5.0
Comments (initials/date): The values of radiated field are peak values within a frequency range
___________________________________________________________________________________________________________________________________________________________________________________________________________________________________________________________________________________________________________________________________________________________________________________________________________
Completed By:(Printed Name) (Signature ) (Date)
Reviewed By:(Printed Name) (Signature) (Date)
Approved By:(Printed Name) (Signature) (Date)

ETA-UTP009 Revision 0
2001 Electric Transportation Applications All Rights Reserved
4400
APPENDIX-DElectromagnetic Radiation Test
Data Sheet(Page 4 of 6)
Sequence No: File No.:Time (initial): Time (final):Micro Turbine Temp (initial):
(°F or °C)
Micro Turbine Temp (final): (°F or °C)
Run Time (initial): (Hours)
Run Time (final): (Hours)
Electromagnetic Radiated Levels
Sensor Location: 1 m away from the RIGHT SIDE of thevehicle
Mode of operation of the vehicle: Constant Speed of 25 mph
FrequencyRange
Radiated level FrequencyRange
Radiated level FrequencyRange
Radiated level
kHz dBµV/kHz kHz dBµV/kHz MHz dBµV/kHz
9 – 30 0.25 – 0.5 5.0 – 10.030 – 60 0.5 – 1.1 10 – 20
60 – 120 1.1 – 2.4 20 - 30120 – 250 2.4 – 5.0
Comments (initials/date): The values of radiated field are peak values within a frequency range
___________________________________________________________________________________________________________________________________________________________________________________________________________________________________________________________________________________________________________________________________________________________________________________________________________
Completed By:(Printed Name) (Signature ) (Date)
Reviewed By:(Printed Name) (Signature) (Date)
Approved By:(Printed Name) (Signature) (Date)

ETA-UTP009 Revision 0
2001 Electric Transportation Applications All Rights Reserved
4411
APPENDIX-DElectromagnetic Radiation Test
Data Sheet(Page 5 of 6)
Sequence No: File No.:Time (initial): Time (final):Micro Turbine Temp (initial):
(°F or °C)
Micro Turbine Temp (final): (°F or °C)
Run Time (initial): (Hours)
Run Time (final): (Hours)
Electromagnetic Radiated Levels
Sensor Location: 1 m away from the LOCATION WITHMAXIMUM EMI of the vehicle
Mode of operation of the vehicle: Constant Speed of 10 mph
FrequencyRange
Radiated level FrequencyRange
Radiated level FrequencyRange
Radiated level
kHz dBµV/kHz kHz dBµV/kHz MHz dBµV/kHz
9 – 30 0.25 – 0.5 5.0 – 10.030 – 60 0.5 – 1.1 10 – 20
60 – 120 1.1 – 2.4 20 - 30120 – 250 2.4 – 5.0
Comments (initials/date): The values of radiated field are peak values within a frequency range
___________________________________________________________________________________________________________________________________________________________________________________________________________________________________________________________________________________________________________________________________________________________________________________________________________
Completed By:(Printed Name) (Signature ) (Date)
Reviewed By:(Printed Name) (Signature) (Date)
Approved By:(Printed Name) (Signature) (Date)

ETA-UTP009 Revision 0
2001 Electric Transportation Applications All Rights Reserved
4422
APPENDIX-DElectromagnetic Radiation Test
Data Sheet(Page 6 of 6)
Sequence No: File No.:Time (initial): Time (final):Micro Turbine Temp (initial):
(°F or °C)
Micro Turbine Temp (final): (°F or °C)
Run Time (initial): (Hours)
Run Time (final): (Hours)
Electromagnetic Radiated Levels
Sensor Location: 1 m away from the LOCATION WITHMAXIMUM EMI of the vehicle
Mode of operation of the vehicle: Constant Speed of 40 mph
FrequencyRange
Radiated level FrequencyRange
Radiated level FrequencyRange
Radiated level
kHz dBµV/kHz kHz dBµV/kHz MHz dBµV/kHz
9 – 30 0.25 – 0.5 5.0 – 10.030 – 60 0.5 – 1.1 10 – 20
60 – 120 1.1 – 2.4 20 - 30120 – 250 2.4 – 5.0
Comments (initials/date): The values of radiated field are peak values within a frequency range
___________________________________________________________________________________________________________________________________________________________________________________________________________________________________________________________________________________________________________________________________________________________________________________________________________
Completed By:(Printed Name) (Signature ) (Date)
Reviewed By:(Printed Name) (Signature) (Date)
Approved By:(Printed Name) (Signature) (Date)

ETA-UTP009 Revision 0
2001 Electric Transportation Applications All Rights Reserved
4433
APPENDIX-EDriver Interface Record
Test Data Sheet(Page 1 of 1)
VIN Number: __________________________
Radio Frequency Interference
Procedure Interference?Step: Instrument/Device: Yes: No:
6.2.1 Cellular Phone6.2.2 Mobil Radio Scanning Over the 70 cm Band6.2.2 Mobil Radio Scanning Over the 2M Band6.2.3 Citizens Band Radio6.2.4 Portable Compact Disk Player6.2.5 Notebook Computer
Comments (initials/date):
Electromagnetic Susceptibility7.1.1 A Citizen’s Band Radio Operating at 5 Watts Output7.1.2 Mobil Radio Antennae Operating at 7 Watts Output on the
70 cm BandMobil Radio Antennae Operating at 7 Watts Output on the2M Band
7.1.3 A Cellular TelephoneComments (initials/date):
Completed By:(Printed Name) (Signature) (Date)
Reviewed By:(Printed Name) (Signature) (Date)
Approved By:(Printed Name) (Signature) (Date)