Embed Size (px)
Citation preview

etawa Sundowner 2010
Steven KempSchool of Economics & Finance
Curtin UniversityChief Marker TEE Economics 2009
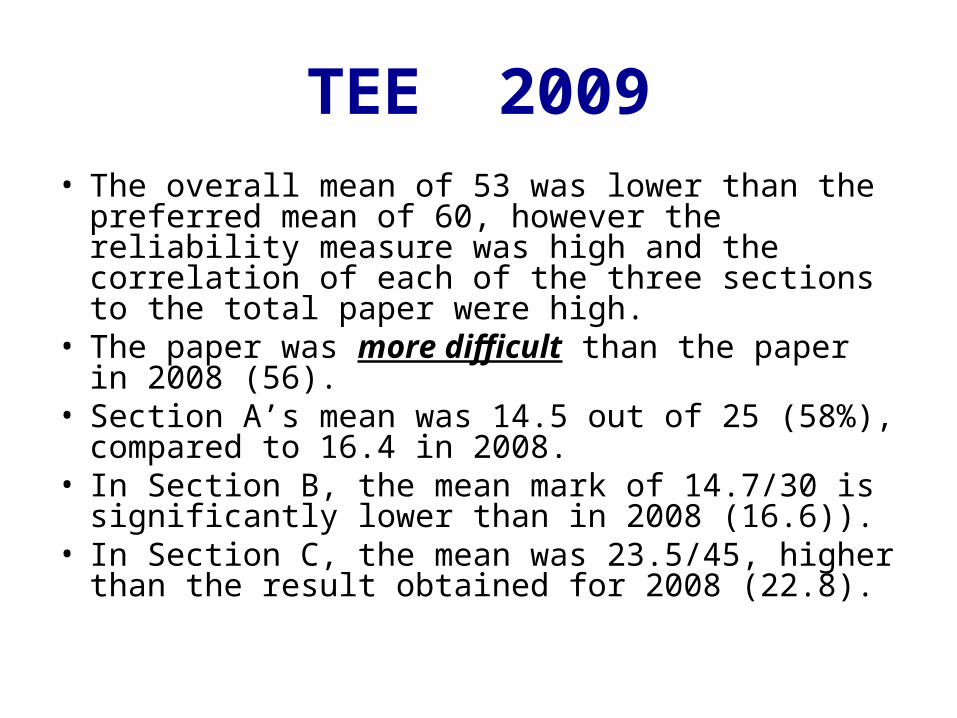
TEE 2009• The overall mean of 53 was lower than the preferred
mean of 60, however the reliability measure was high and the correlation of each of the three sections to the total paper were high.
• The paper was more difficult than the paper in 2008 (56).
• Section A’s mean was 14.5 out of 25 (58%), compared to 16.4 in 2008.
• In Section B, the mean mark of 14.7/30 is significantly lower than in 2008 (16.6)).
• In Section C, the mean was 23.5/45, higher than the result obtained for 2008 (22.8).
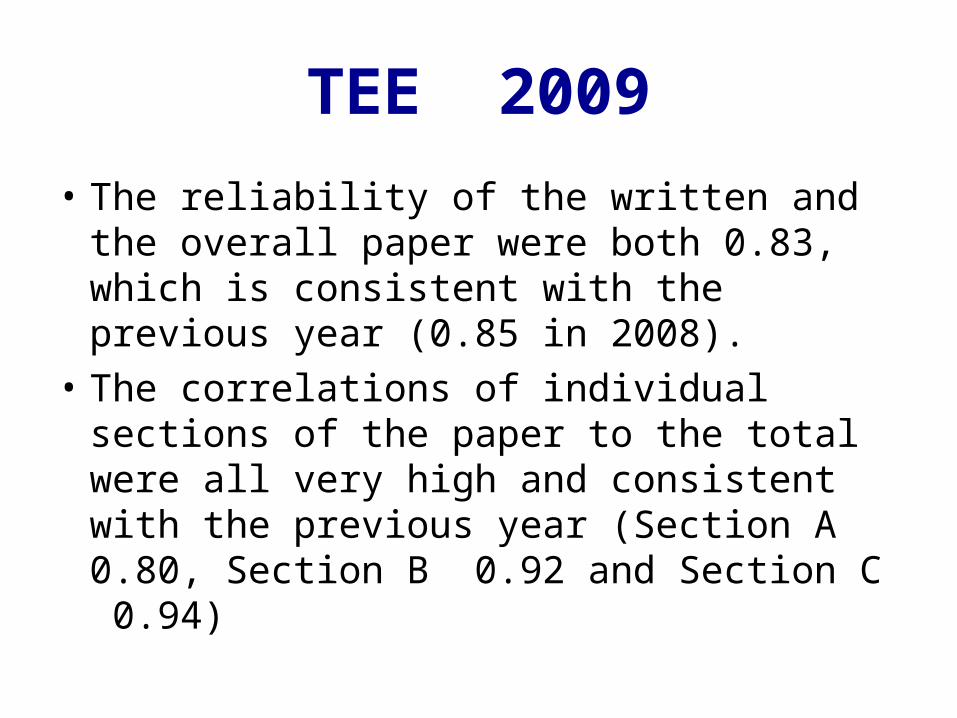
• The reliability of the written and the overall paper were both 0.83, which is consistent with the previous year (0.85 in 2008).
• The correlations of individual sections of the paper to the total were all very high and consistent with the previous year (Section A 0.80, Section B 0.92 and Section C 0.94)
TEE 2009
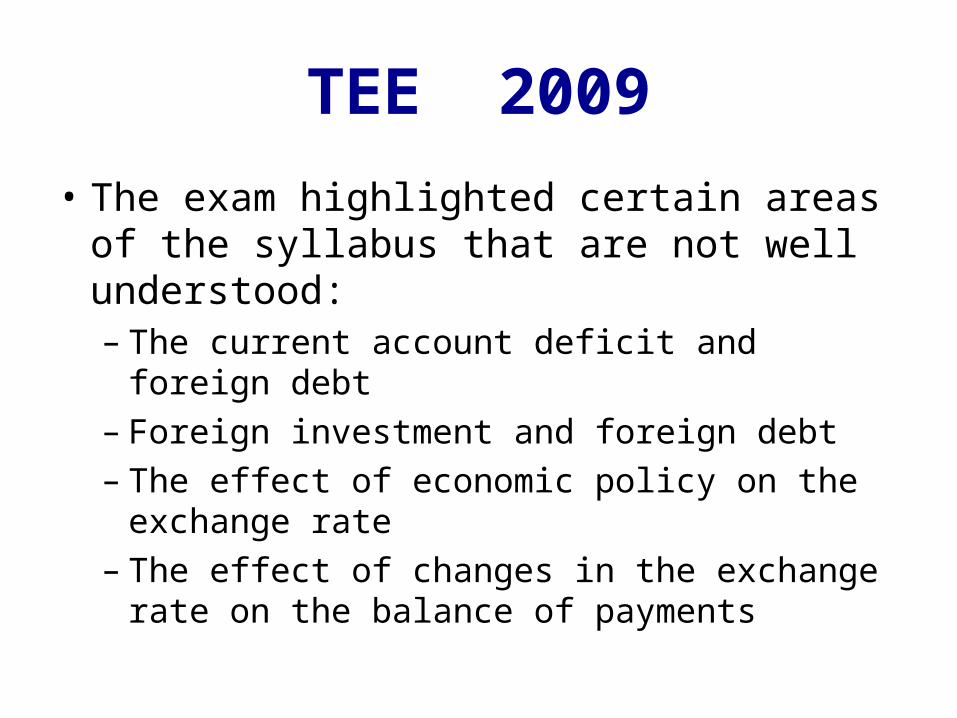
• The exam highlighted certain areas of the syllabus that are not well understood:– The current account deficit and foreign debt– Foreign investment and foreign debt– The effect of economic policy on the exchange
rate– The effect of changes in the exchange rate on the
balance of payments
TEE 2009
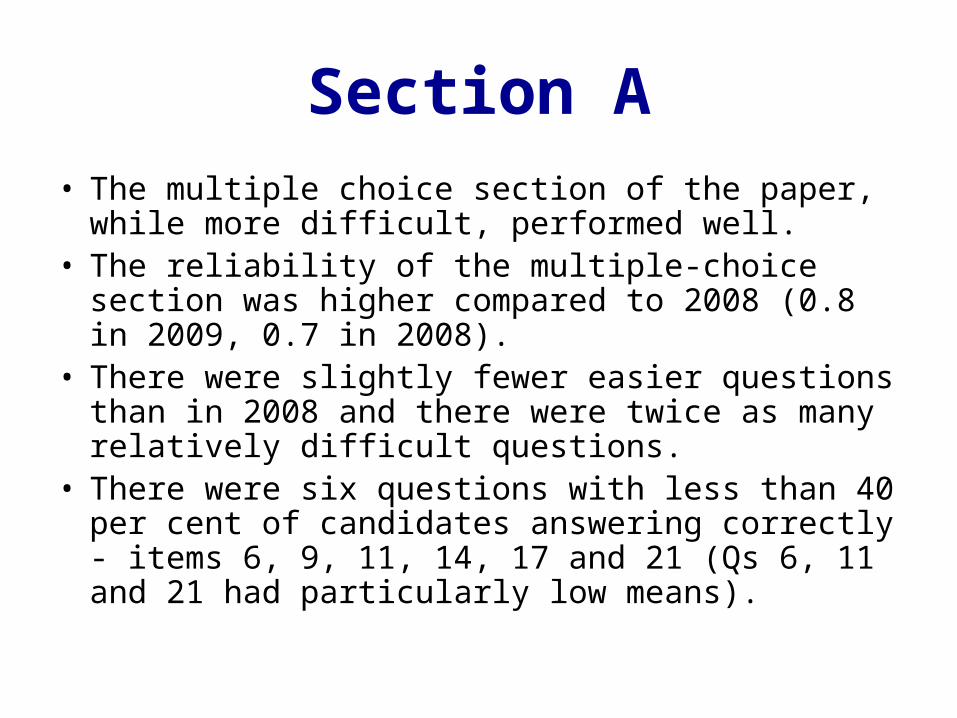
Section A• The multiple choice section of the paper, while more
difficult, performed well. • The reliability of the multiple-choice section was
higher compared to 2008 (0.8 in 2009, 0.7 in 2008). • There were slightly fewer easier questions than in
2008 and there were twice as many relatively difficult questions.
• There were six questions with less than 40 per cent of candidates answering correctly - items 6, 9, 11, 14, 17 and 21 (Qs 6, 11 and 21 had particularly low means).

6.Multi-factor productivity growth measures (a)combined growth in labour productivity and capital productivity.(b) the average growth in labour and capital productivity.(c)the rate of technological progress.(d) growth in living standards.
Section A

Multifactor Productivity• Multifactor productivity represents that part of the
growth in output that cannot be explained by growth in labour and capital inputs. Examples of MFP growth include improved production techniques, better management practices, and organisational change. (ABS)
• Whereas labor productivity measures the output per unit of labor input, MFP looks at a combination of production inputs: labor, materials, and capital.
• The multifactor productivity measure is often preferred because it’s a measure of technological change
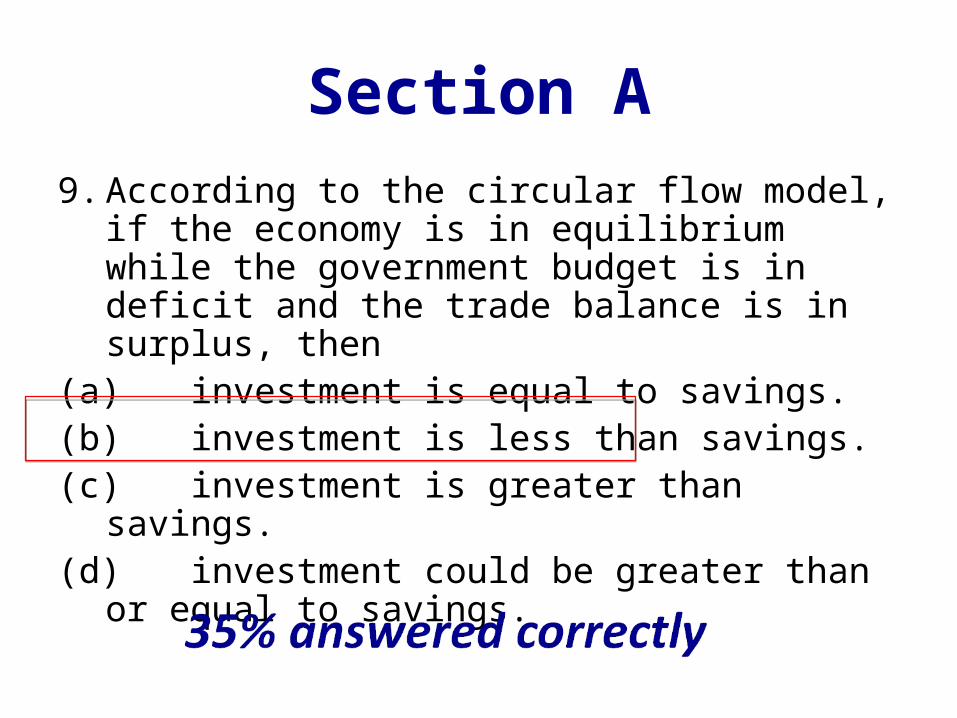
9. According to the circular flow model, if the economy is in equilibrium while the government budget is in deficit and the trade balance is in surplus, then
(a) investment is equal to savings.(b) investment is less than savings.(c) investment is greater than savings. (d) investment could be greater than or equal to
savings.
Section A
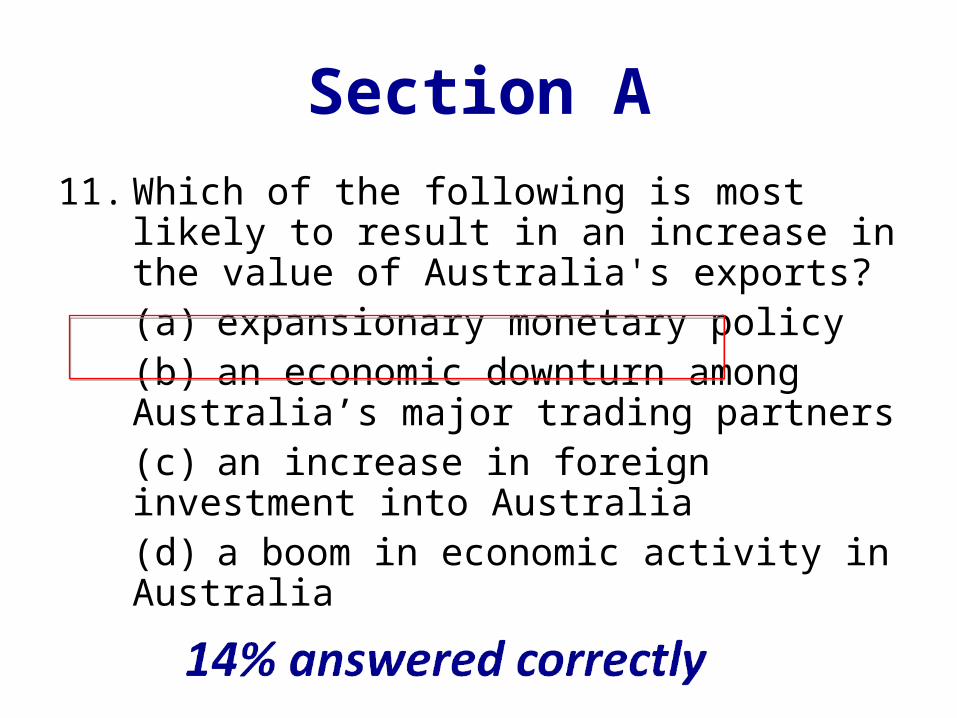
11. Which of the following is most likely to result in an increase in the value of Australia's exports?(a) expansionary monetary policy(b) an economic downturn among Australia’s major trading partners(c) an increase in foreign investment into Australia(d) a boom in economic activity in Australia
Section A
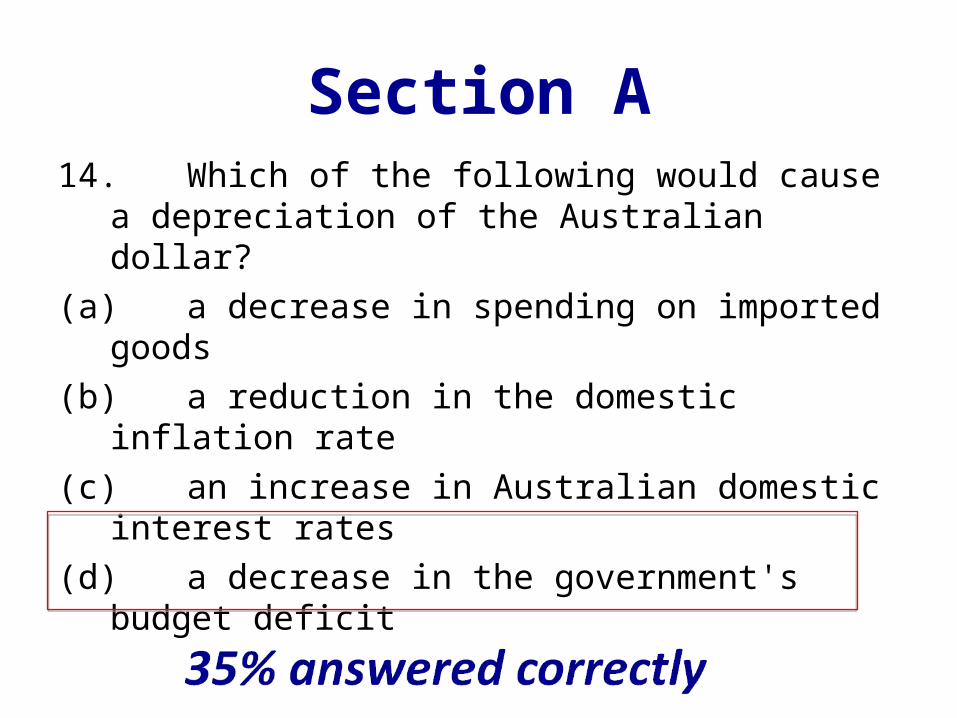
14. Which of the following would cause a depreciation of the Australian dollar?
(a) a decrease in spending on imported goods(b) a reduction in the domestic inflation rate(c) an increase in Australian domestic interest
rates(d) a decrease in the government's budget
deficit
Section A
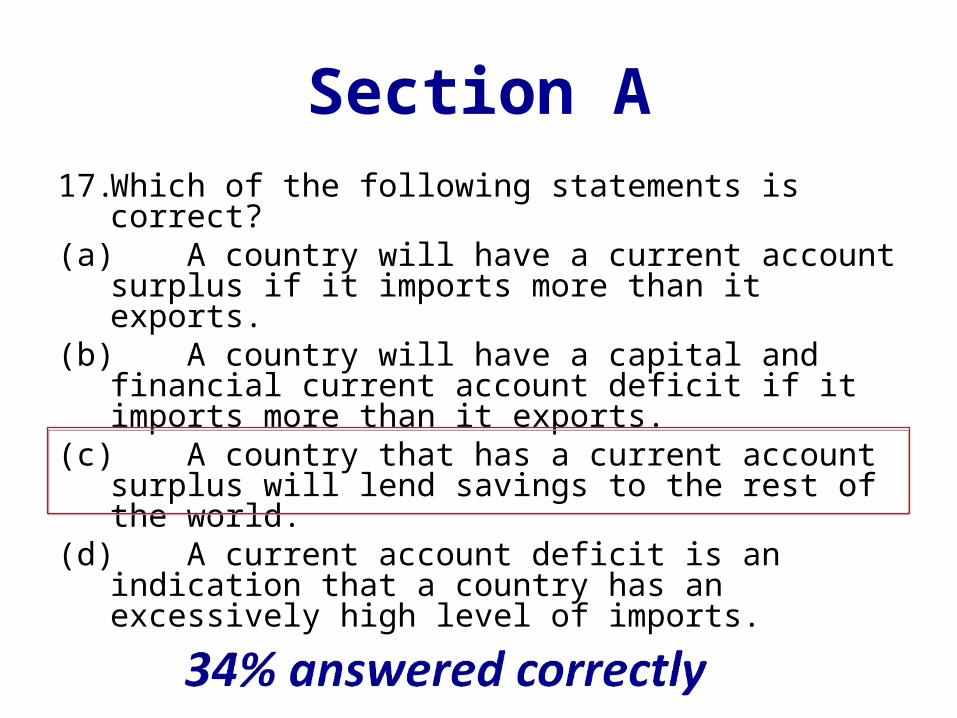
17. Which of the following statements is correct?(a) A country will have a current account surplus if
it imports more than it exports.(b) A country will have a capital and financial
current account deficit if it imports more than it exports.
(c) A country that has a current account surplus will lend savings to the rest of the world.
(d) A current account deficit is an indication that a country has an excessively high level of imports.
Section A
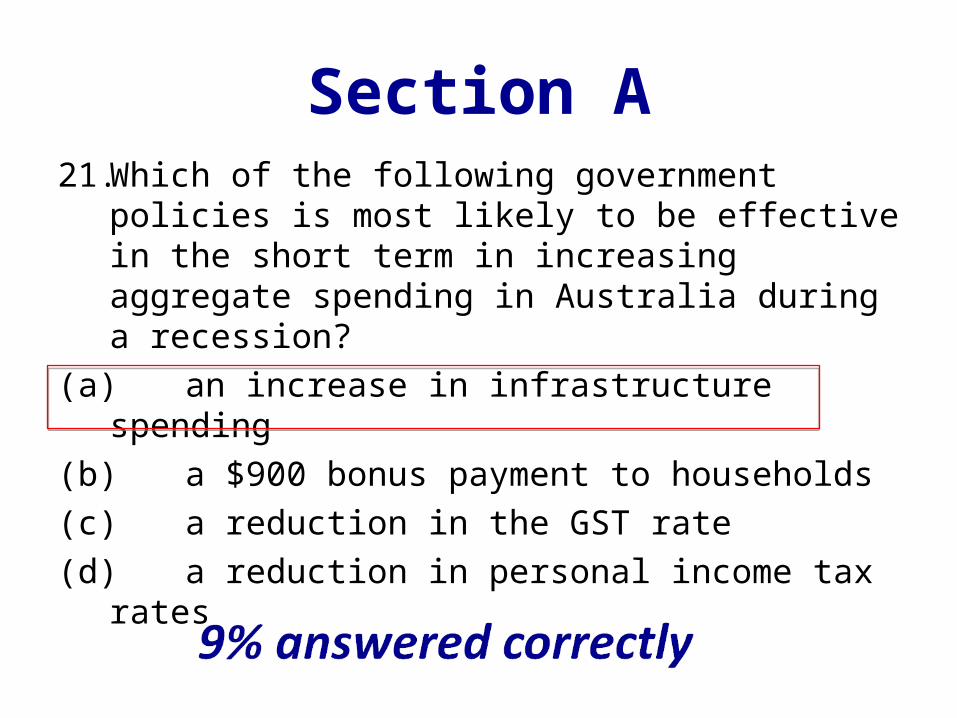
21. Which of the following government policies is most likely to be effective in the short term in increasing aggregate spending in Australia during a recession?
(a) an increase in infrastructure spending(b) a $900 bonus payment to households(c) a reduction in the GST rate(d) a reduction in personal income tax rates
Section A
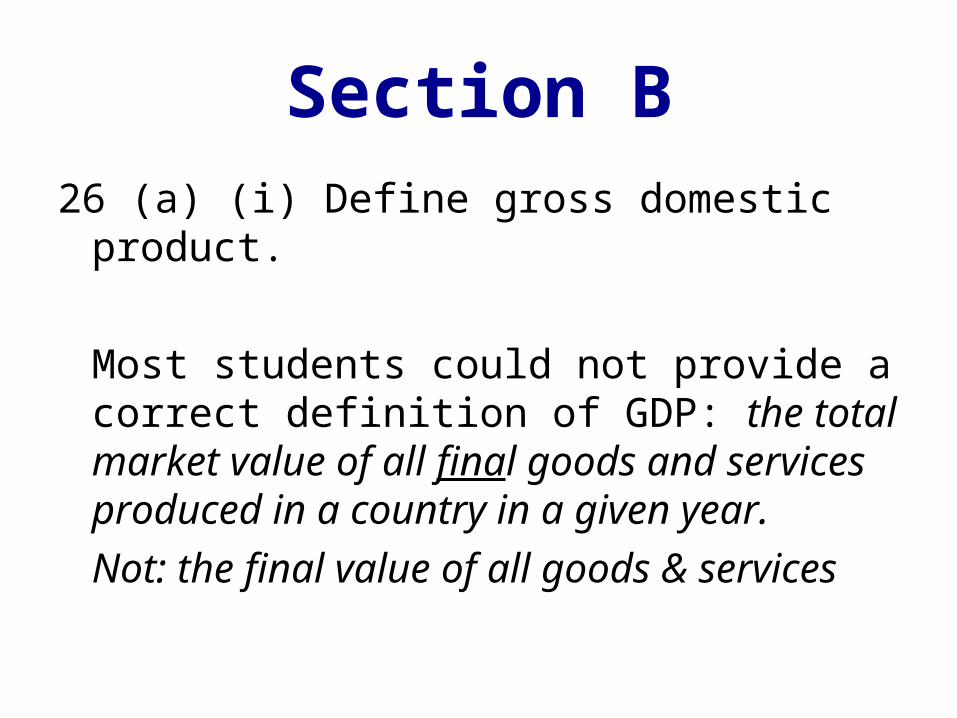
Section B26 (a) (i) Define gross domestic product.
Most students could not provide a correct definition of GDP: the total market value of all final goods and services produced in a country in a given year. Not: the final value of all goods & services
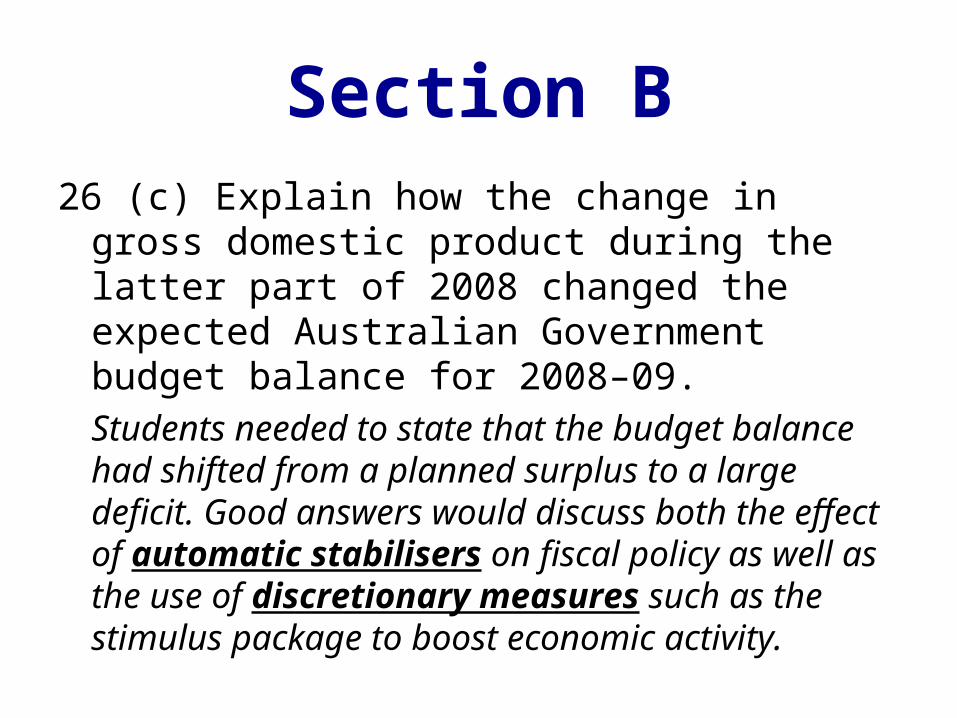
26 (c) Explain how the change in gross domestic product during the latter part of 2008 changed the expected Australian Government budget balance for 2008–09. Students needed to state that the budget balance had shifted from a planned surplus to a large deficit. Good answers would discuss both the effect of automatic stabilisers on fiscal policy as well as the use of discretionary measures such as the stimulus package to boost economic activity.
Section B
Question 27This question had the lowest mean in Section B. Students find the topic dealing with the current account deficit and foreign debt relatively difficult and do not understand the link between the two.
Section B

27 (b) What are the implications of the current account figures shown in the table for Australia's net foreign debt? (3 marks)
A current account deficit needs to be financed by an increase in foreign liabilities which can consist of either foreign debt or foreign equity. Most students incorrectly stated that an increase in the CAD will result in an increase in foreign debt – but this is not necessarily true.
Section B
27. (c) Since 2005–06, Australia's exports of mineral and energy commodities have increased significantly. Explain why there has been no improvement in the current account balance as a result.
• Increased imports (investment & consumption)• Increased net income deficit• Appreciation of the $A
Section B

2
3
4
5
6
7
8
Jan
-06
Ap
r-0
6
Jul-0
6
Oct
-06
Jan
-07
Ap
r-0
7
Jul-0
7
Oct
-07
Jan
-08
Ap
r-0
8
Jul-0
8
Oct
-08
Jan
-09
Ca
sh
Ra
te (
%)
28 (a) (i) What was the highest level the cash rate reached during 2008? (1 mark)
The highest value for the cash rate shown in the graph was 7.25%. Many students gave the answer of 7.2% which was marked incorrect.
Section B
28 (b) Describe three ways in which the interest rate changes during 2006 and 2007 were likely to impact on consumption and investment spending in Australia.
• Most students were able to achieve 2 marks by recognising that a rise in interest rates would reduce consumption and investment spending because of an increase in the cost of borrowing. The third mark was awarded for referring to the other channels of the monetary transmission mechanism such as the effect of interest rates on asset prices and wealth or the effect of a rise in interest rates on the exchange rate.
Section B
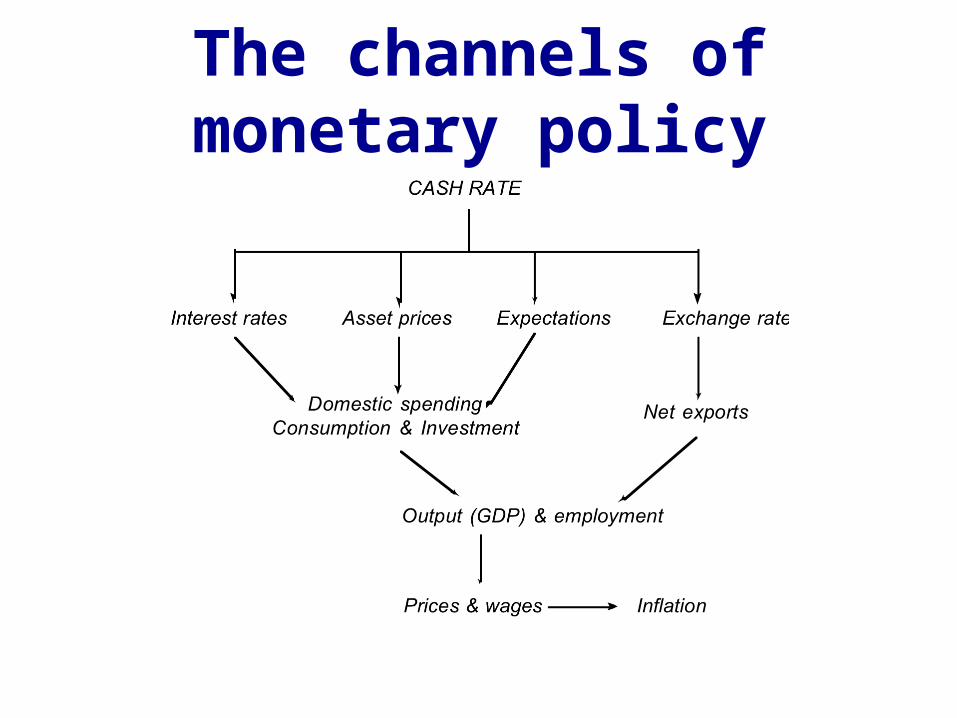
The channels of monetary policy

Section C• This section was relatively less difficult than
previous years. There was a good blend of topical and theoretical questions giving students plenty of scope to demonstrate their economic knowledge.
• Question 32 stood out as the easiest question with a mean that was 1 mark higher. Students who did not answer this question were disadvantaged.
• The most popular questions were the sectionalised questions - Qs 31, 32 and 33.

29. The global economy is beginning to pull out of a recession unprecedented in the post-World War II era. World economic growth is now projected to be about 2.5 per cent in 2010, owing mainly to public intervention.Discuss how the changing economic conditions outlined in the above extract will impact on the Australian economy.
• This was the least popular question and had the lowest mean.
Section C
30. Discuss five measures that the Australian Government can take to increase the rate of economic growth in the Australian economy.
• Many students focussed entirely on demand side measures such as expansionary fiscal and monetary policy, failing to discuss any supply side measures. The best answers provided a balanced discussion of both demand side and supply side policies.
Section C
31. (a) Outline the benefits of having high levels of foreign investment into Australia. (6 marks)
(b) Discuss the effects that a reduction in the level of foreign investment into Australia would have on Australia's balance of payments and living standards. (9 marks)
Part (a) was well answeredPart (b) . . . A dog’s breakfast
Section C
Foreign Investment/Foreign Debt
• Most foreign investment into Australia is in the form of foreign debt. Many students don’t understand this. Most students tend to argue that foreign investment is good for the economy while foreign debt is bad. They fail to see that foreign investment in the form of borrowing adds to Australia’s foreign debt. They tend to see foreign investment as equity investment but this only accounts for between 10-15%
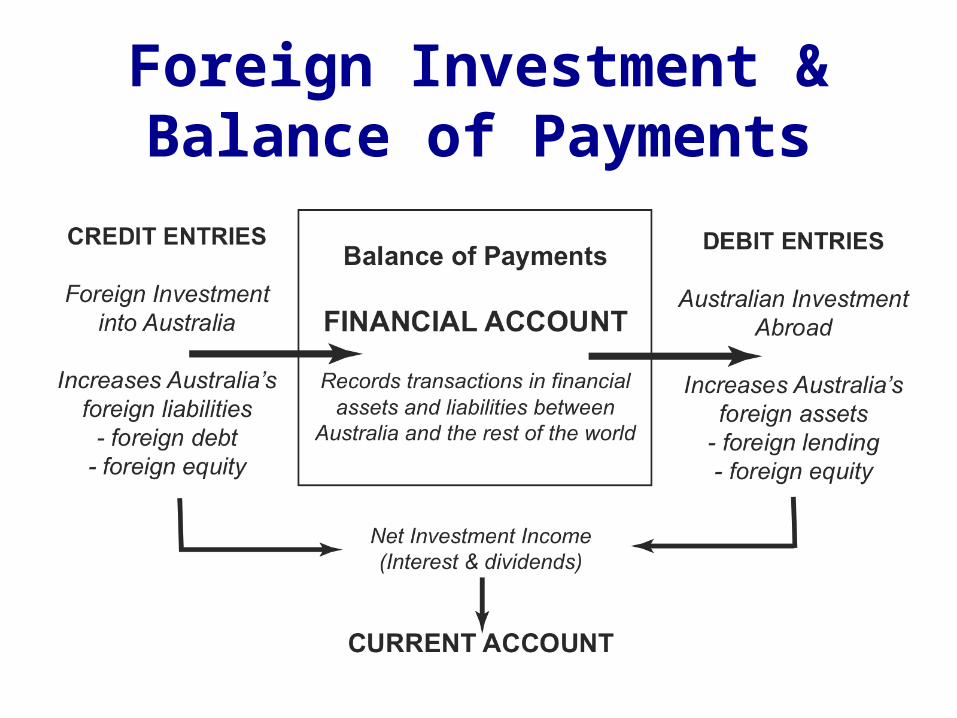
Foreign Investment & Balance of Payments
• Did you know . . .
• A large proportion of Australia’s foreign debt is due within a very short period.
• In 2008, 37 per cent of loans were due within 90 days and 48 per cent were due within a year.
Foreign Investment/Foreign Debt

32. (a) Outline the major macroeconomic objectives of
government. 6 marks(b) Using examples, explain how these macroeconomic
objectives may sometimes complement one another, while at other times they may conflict with one another. 9 marksVery popular & the only question in section C recording a satisfactory average (57%)
Section C

Q. 32Major macro objectives• Economic growth• Full employment• Price stabilityNote: external balance is not an objective
• In 2004, Glenn Stevens restated the RBA’s view as thus: ‘… the current account is not, and should not, be an objective of monetary policy’
Section C
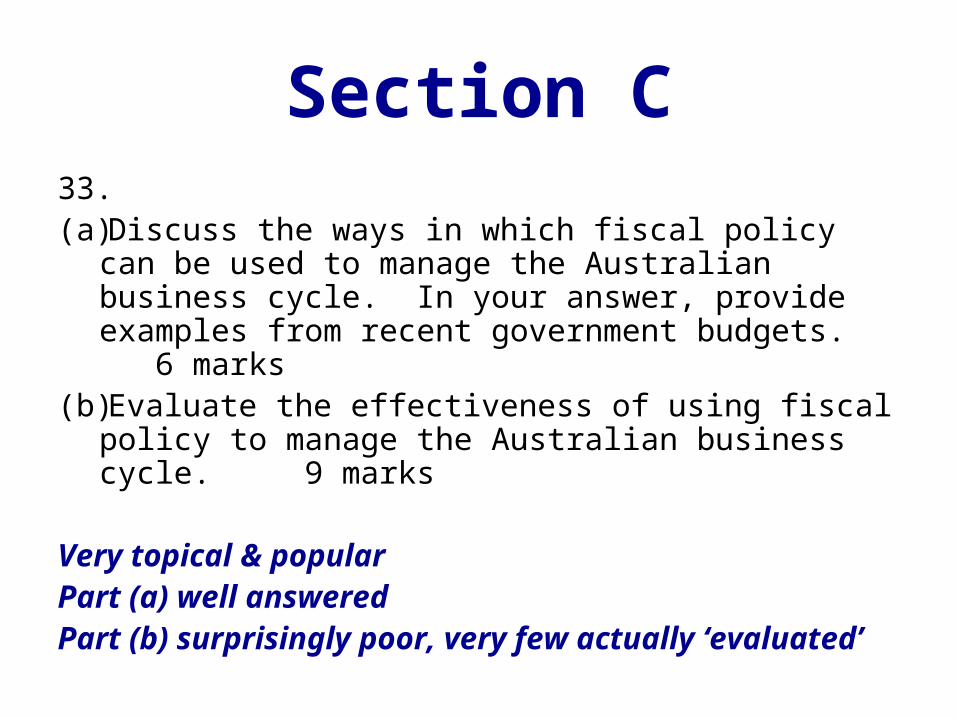
33. (a) Discuss the ways in which fiscal policy can be used to
manage the Australian business cycle. In your answer, provide examples from recent government budgets. 6 marks
(b) Evaluate the effectiveness of using fiscal policy to manage the Australian business cycle. 9 marks
Very topical & popularPart (a) well answeredPart (b) surprisingly poor, very few actually ‘evaluated’
Section C

Unit 3AAustralia & the Global
Economy

Unit 3A• Global Markets
– International competitiveness– Multinational businesses– Globalisation
• Extent• Determinants• Effects• Arguments for & against
Unit 3A• Other New Stuff
– Sources of comparative advantage– Gains from trade using D & S– Role of WTO & trade agreements– The current account, foreign liabilities,
foreign debt & foreign investment

Free Trade & ProtectionACCI welcomes textiles and car tariff reductions
The Australian Chamber of Commerce and Industry (ACCI), has welcomed the import tariff reductions which commence today. Tariffs applying to passenger motor vehicles and parts components will be cut from 10% to 5%. Overall tariffs applying to Textiles, clothing and footwear (TCF) goods will also be cut, with tariffs for clothing reduced from 17.5% to 10%, and tariffs for textiles and footwear reduced from 10% to 5%. These tariff cuts are good news for Australian businesses and consumers, and will help to stimulate domestic demand. Lower tariffs mean lower input prices for Australian businesses and of course lower prices for consumers. It is estimated that a reduction in Australia’s automotive tariffs from 10% to 5% could provide net benefits to the economy of around $500 million a year. (January 04, 2010)
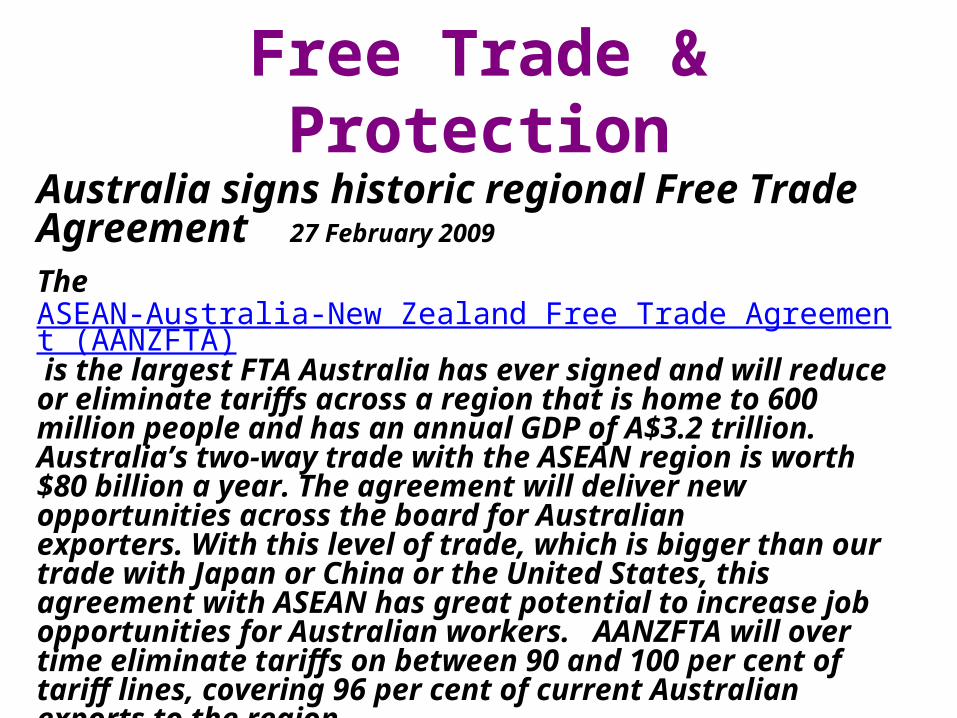
Free Trade & ProtectionAustralia signs historic regional Free Trade Agreement 27 February 2009
The ASEAN-Australia-New Zealand Free Trade Agreement (AANZFTA) is the largest FTA Australia has ever signed and will reduce or eliminate tariffs across a region that is home to 600 million people and has an annual GDP of A$3.2 trillion. Australia’s two-way trade with the ASEAN region is worth $80 billion a year. The agreement will deliver new opportunities across the board for Australian exporters. With this level of trade, which is bigger than our trade with Japan or China or the United States, this agreement with ASEAN has great potential to increase job opportunities for Australian workers. AANZFTA will over time eliminate tariffs on between 90 and 100 per cent of tariff lines, covering 96 per cent of current Australian exports to the region.

Unit 3BMacroeconomics & Policy

Unit 3B• Aggregate demand curve• Aggregate supply curve• Use the AD/AS model to explain the business
cycle• Economic Policy – fiscal, monetary & micro-
reform status quo

•The AD/AS Model
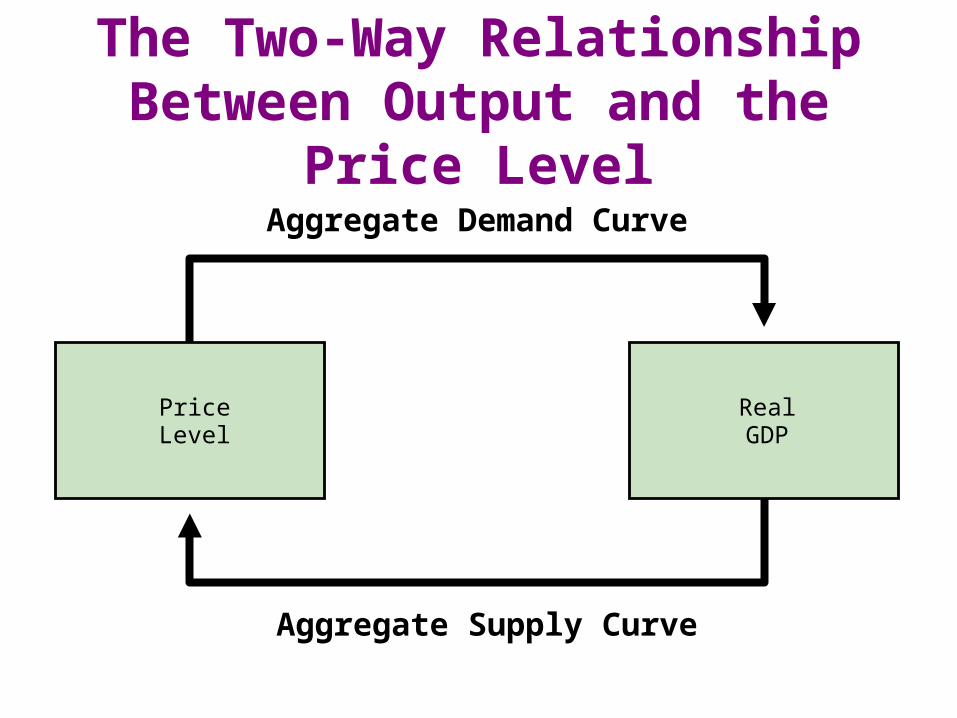
The Two-Way Relationship Between Output and the Price Level
PriceLevel
RealGDP
Aggregate Demand Curve
Aggregate Supply Curve
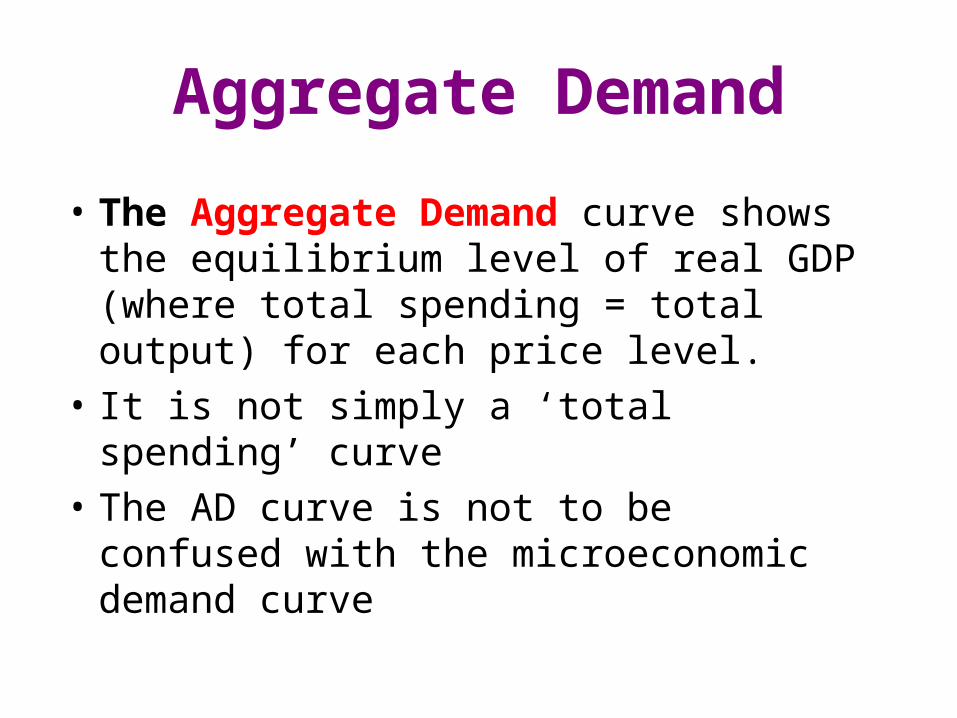
Aggregate Demand
• The Aggregate Demand curve shows the equilibrium level of real GDP (where total spending = total output) for each price level.
• It is not simply a ‘total spending’ curve• The AD curve is not to be confused with the
microeconomic demand curve
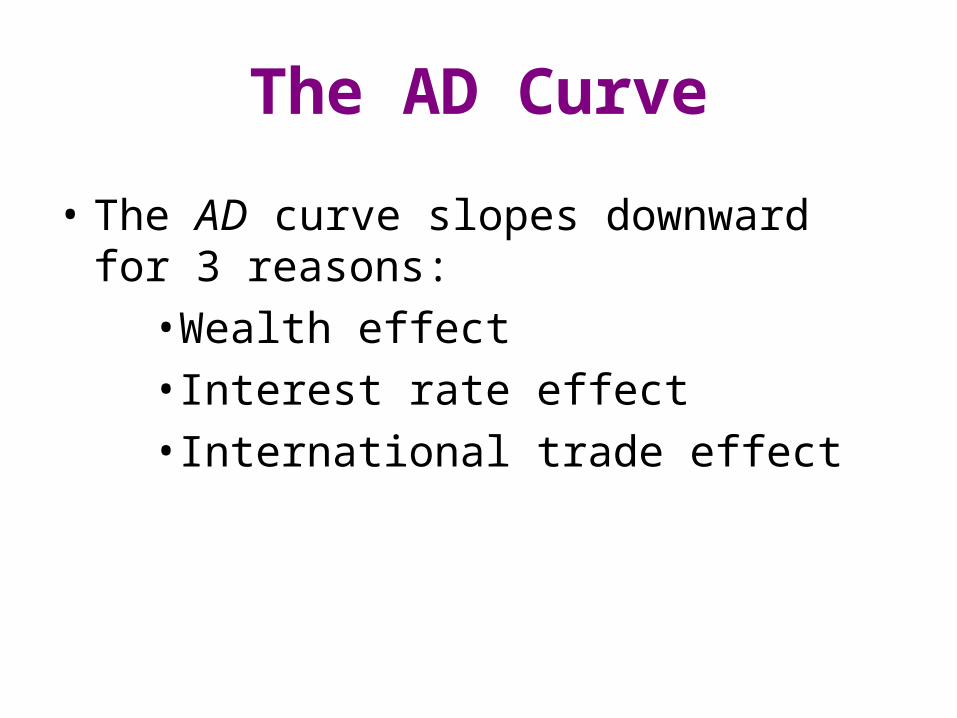
The AD Curve
• The AD curve slopes downward for 3 reasons:• Wealth effect• Interest rate effect• International trade effect
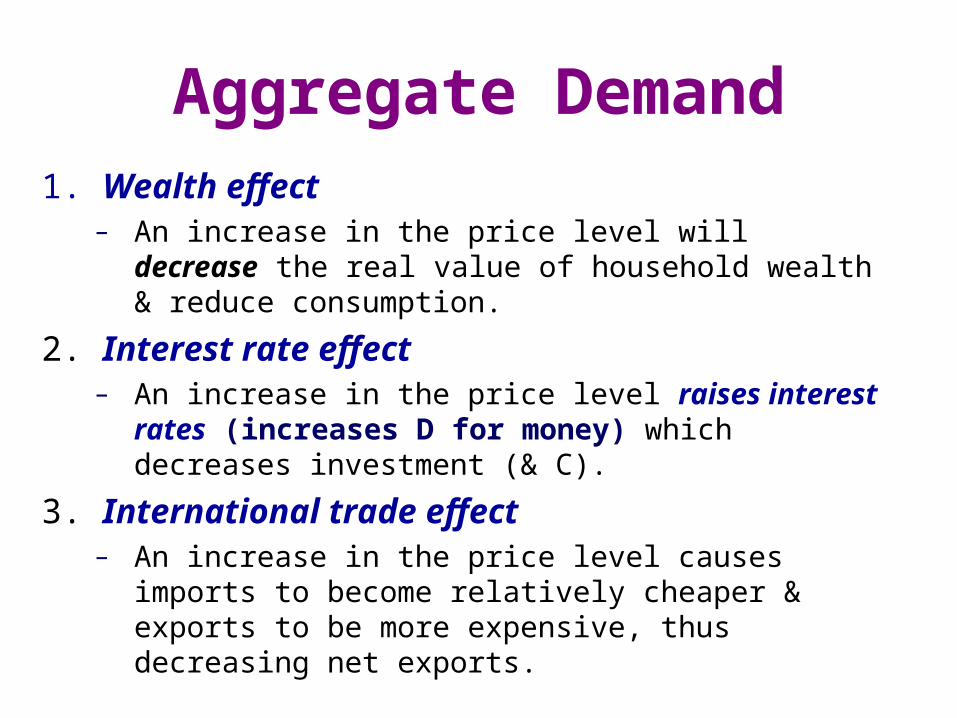
Aggregate Demand1. Wealth effect
– An increase in the price level will decrease the real value of household wealth & reduce consumption.
2. Interest rate effect– An increase in the price level raises interest rates
(increases D for money) which decreases investment (& C).
3. International trade effect– An increase in the price level causes imports to become
relatively cheaper & exports to be more expensive, thus decreasing net exports.
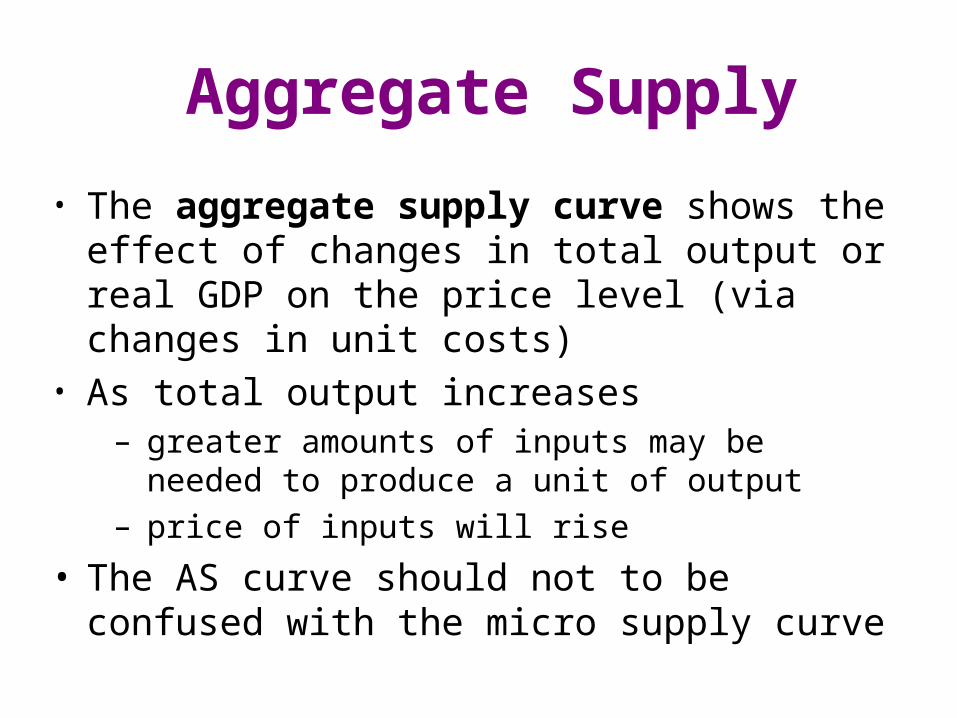
Aggregate Supply
• The aggregate supply curve shows the effect of changes in total output or real GDP on the price level (via changes in unit costs)
• As total output increases – greater amounts of inputs may be needed to
produce a unit of output – price of inputs will rise
• The AS curve should not to be confused with the micro supply curve
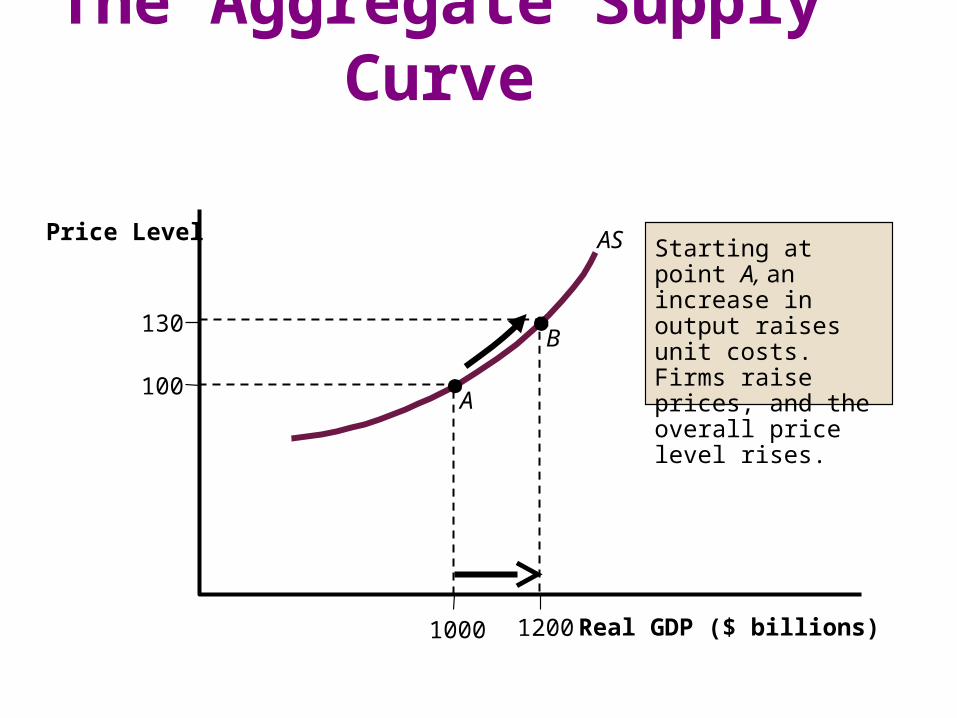
The Aggregate Supply Curve
Price Level
Real GDP ($ billions)
130
100
AS
12001000
A
B
Starting at point A, an increase in output raises unit costs. Firms raise prices, and the overall price level rises.

2010 Exam Paper• Section A Multiple Choice
– 24 questions (24 marks)
• Section B Data Interpretation– 3 compulsory questions x 12 marks (36 marks)
• Section C Extended Writing– 2 questions x 20 marks (40 marks)
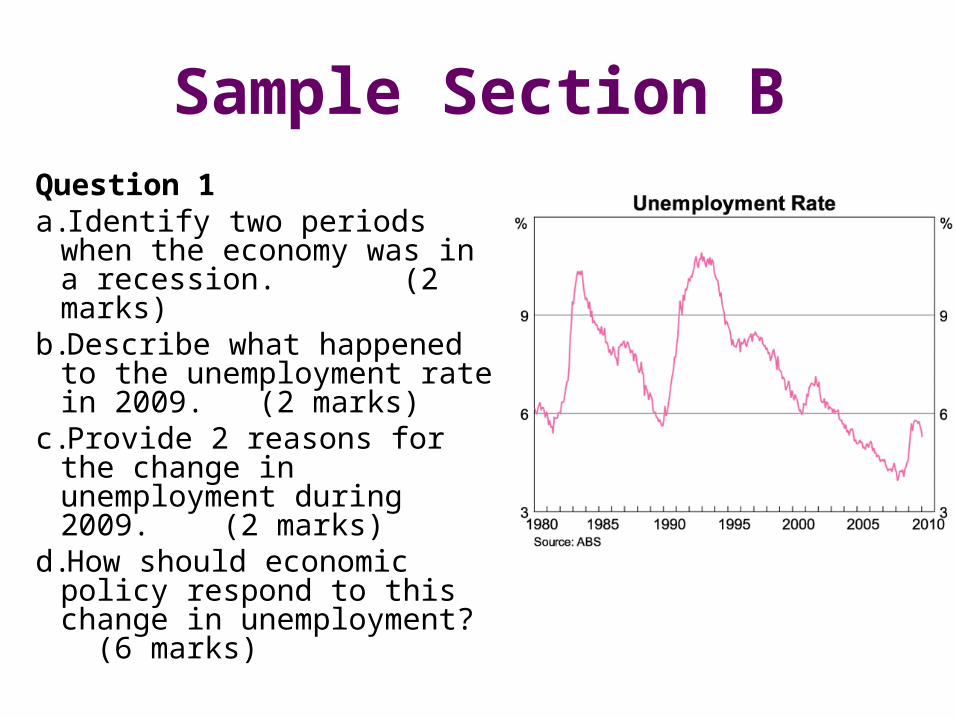
Sample Section BQuestion 1a. Identify two periods when the
economy was in a recession. (2 marks)
b.Describe what happened to the unemployment rate in 2009. (2 marks)
c. Provide 2 reasons for the change in unemployment during 2009. (2 marks)
d.How should economic policy respond to this change in unemployment? (6 marks)
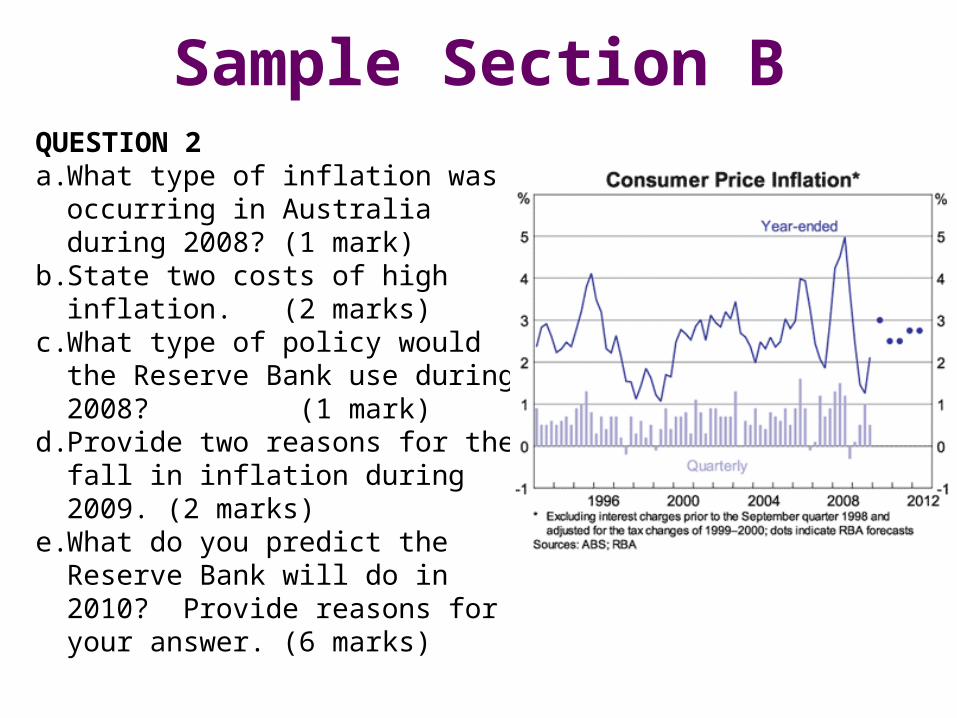
Sample Section BQUESTION 2a. What type of inflation was
occurring in Australia during 2008? (1 mark)
b. State two costs of high inflation. (2 marks)
c. What type of policy would the Reserve Bank use during 2008? (1 mark)
d. Provide two reasons for the fall in inflation during 2009. (2 marks)
e. What do you predict the Reserve Bank will do in 2010? Provide reasons for your answer. (6 marks)

Sample Section C1. Globalisation has become an important force in world
economics. Write an essay on the meaning of globalisation, the factors contributing to its emergence as an economic force and its impact on the Australian economy. (20 marks)
2. The World Trade Organisation (WTO) referred to the concept of comparative advantage as ‘arguably the single most powerful insight in economics’.a. Explain the principle of comparative advantage and its sources. How does it differ from absolute advantage? Explain why the WTO believes it is such a powerful concept. (8 marks)
b. Demonstrate, with appropriate models, how a country can gain from both exports and imports. (12 marks)
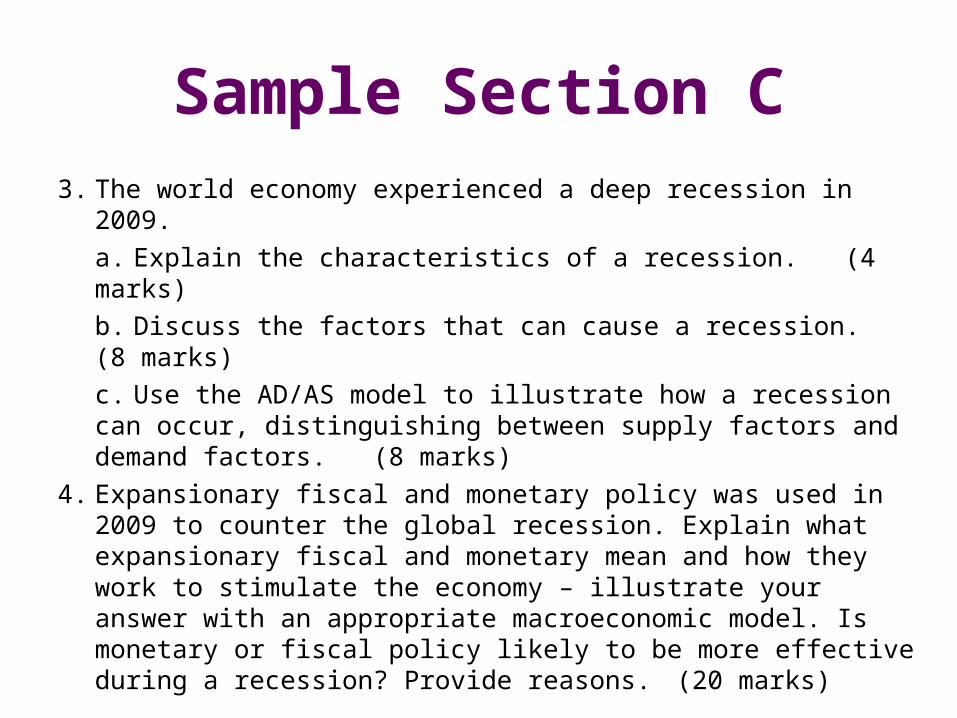
Sample Section C3. The world economy experienced a deep recession in 2009.
a. Explain the characteristics of a recession. (4 marks)b. Discuss the factors that can cause a recession. (8 marks) c. Use the AD/AS model to illustrate how a recession can occur, distinguishing between supply factors and demand factors. (8 marks)
4. Expansionary fiscal and monetary policy was used in 2009 to counter the global recession. Explain what expansionary fiscal and monetary mean and how they work to stimulate the economy – illustrate your answer with an appropriate macroeconomic model. Is monetary or fiscal policy likely to be more effective during a recession? Provide reasons.(20 marks)


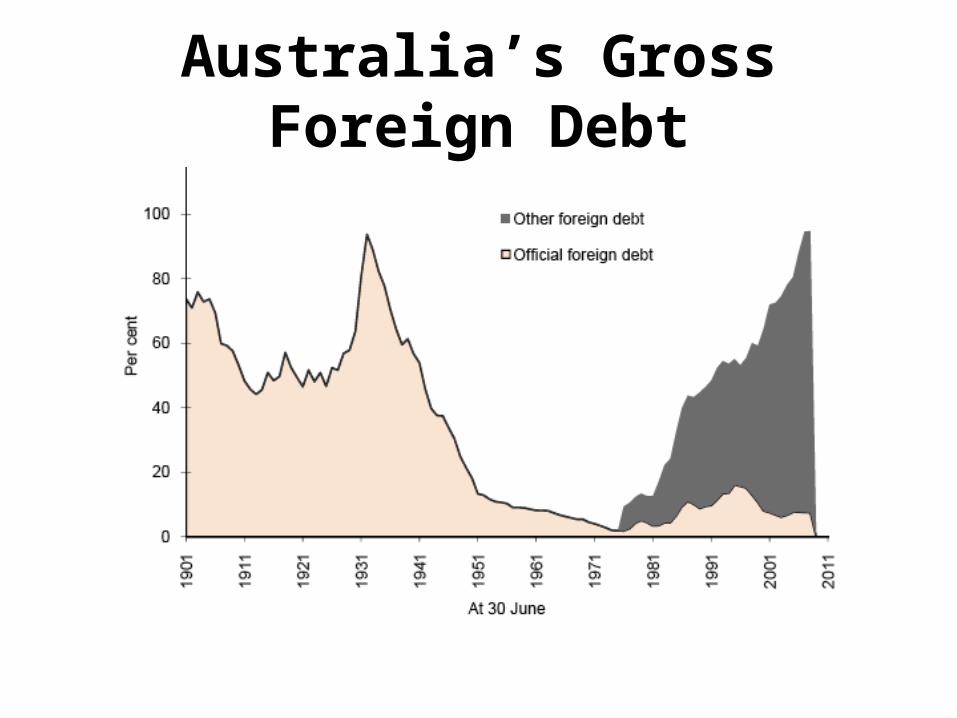
Australia’s Gross Foreign Debt
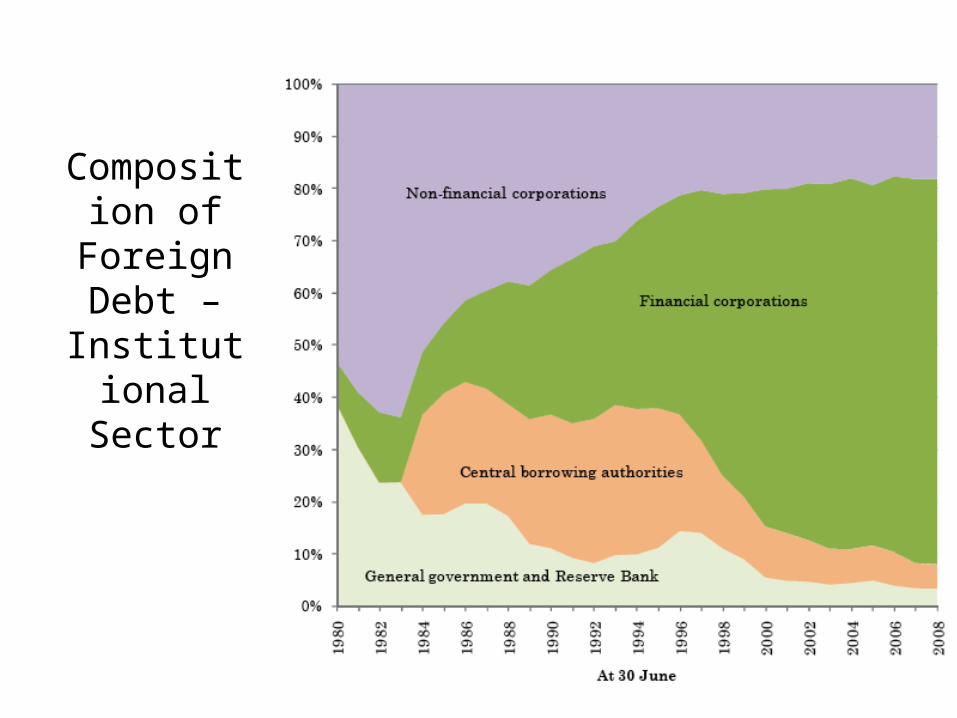
Composition of Foreign
Debt – Institutional
Sector
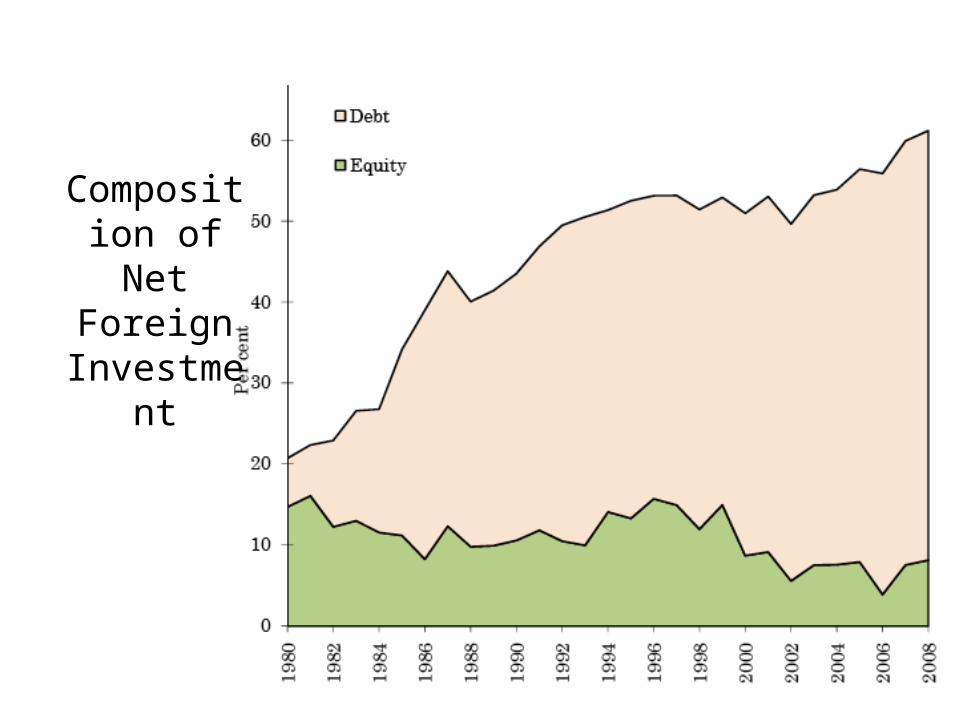
Composition of Net
Foreign Investment
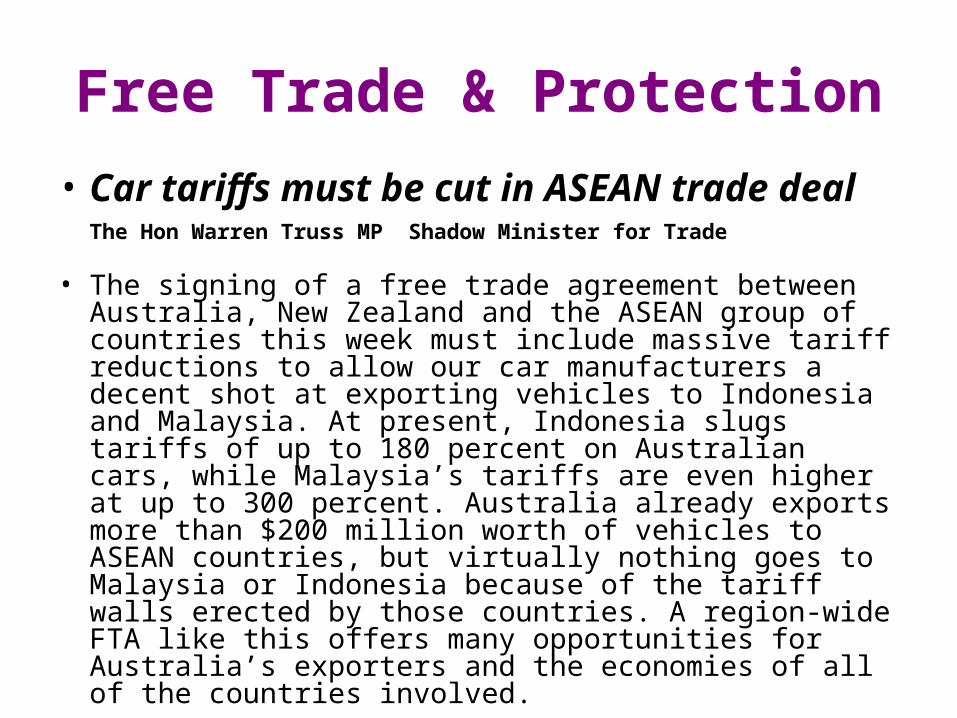
Free Trade & Protection
• Car tariffs must be cut in ASEAN trade dealThe Hon Warren Truss MP Shadow Minister for Trade
• The signing of a free trade agreement between Australia, New Zealand and the ASEAN group of countries this week must include massive tariff reductions to allow our car manufacturers a decent shot at exporting vehicles to Indonesia and Malaysia. At present, Indonesia slugs tariffs of up to 180 percent on Australian cars, while Malaysia’s tariffs are even higher at up to 300 percent. Australia already exports more than $200 million worth of vehicles to ASEAN countries, but virtually nothing goes to Malaysia or Indonesia because of the tariff walls erected by those countries. A region-wide FTA like this offers many opportunities for Australia’s exporters and the economies of all of the countries involved.