Embed Size (px)
Citation preview

Veterans Advisory Board The purpose and establishment of the Veteran’s Advisory Board is to advise the
Board of County Commissioners on the needs of local indigent veterans, the resources available to local indigent veterans, and the programs that could benefit the needs of local indigent veterans and their families.
* = Action Item
BOARD MEETING
DATE: September 8, 2021 TIME: 5:30 pm
LOCATION: Online ________________________________________________________________
Join Zoom Meeting Topic: Kitsap County VAB Meeting Meeting ID: 872 9855 0007 Passcode: 737889 Phone: 1-253-215-8782
A G E N D A
1. Call to Order Boyd Lee
2. Online Announcement Peggy Roy
3. Introductions and welcome to visitors Boyd Lee
4. Approval of Agenda* VAB
5. Approval of Minutes for August 11, 2021 * VAB
6. Guest Speaker Joel Adamson, Homes of Compassion
7. Reports• Veterans Assistance Fund (documents provided in packet)
• Committee Reports (Five Minutes Each)• Tiny Houses – Clive• Veterans Garden – Dennis, Howe Management Farm plan• Public Affairs Officer – Joe• Military Appreciation – Joe• Social Media – Brian• Veterans Day - Bob• Women’s Resource Group – Peggy• Suicide Prevention – Rick, Dan
1. Virtual Suicide Prevention Event

• Veteran Education – Tatiane• CBOC - Peggy
8. Old Business –• Fall Stand Down update• Flag for Andy, shadowbox, & presentation, Rick Raymond• VSO list update, Rick Becker• November 2021 Draft Agenda, Events, 2022 Work Plan• Calendar of Events
9. New Business –• VAB Roster – additional info to add (branch of service & nationally recognized
veteran service organization)
10. Public Comment
11. Good of the Order/Announcements
12. Next meeting time and place – October 13, 2021; 5:30 via Zoom or in person
13. Adjourn
VAB Events 2021 July 14 - 1730, VAB monthly meeting, speaker Tammy Todd, VA Clinic Silverdale July 31 – 1000 – 1300, meet at Veteran’s Garden, The Howe Farm in Port Orchard; bring garden tools & be prepared to weed. August 11 – 1730, VAB monthly meeting, speaker Kirsten Jewel, Housing & Homelessness September 8 - 1730, VAB monthly meeting, speaker Joel Adamson, Homes of Compassion September 10 - 1830- 2000; World Suicide Prevention - Canx September 25 - Fall Stand Down; 1000 - 1400 Grab & Go September 25 - Military Appreciation Day, Kitsap County Fairgrounds Pavilion – Postponed March 2022 October TBD - Veterans Garden working party October 13 – 1730, monthly VAB meeting, November 6 - 0900 - 1300, VAB Retreat (no monthly meeting) November 11, Veterans Day Kitsap County Fairgrounds Pavilion December 8 - 1730, VAB monthly meeting January 12, 2022 - 1730, VAB monthly meeting January 2022 - begin Run to Tahoma planning meetings
Page 1 of 3
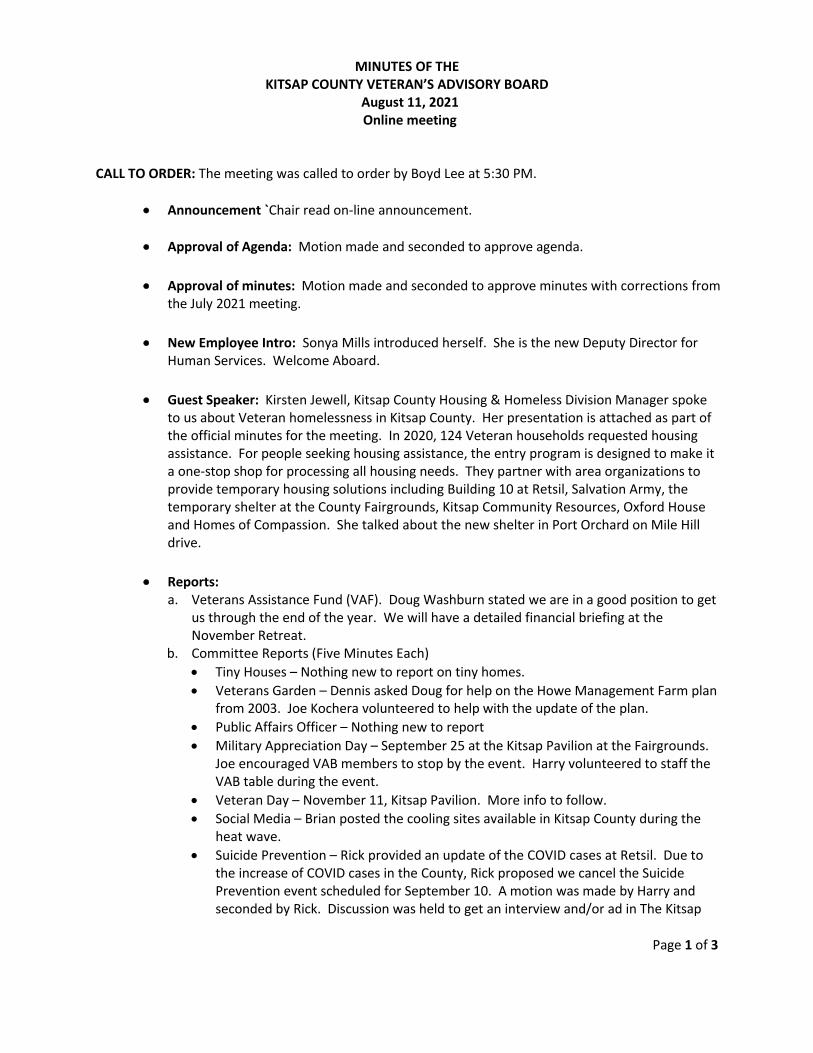
MINUTES OF THE KITSAP COUNTY VETERAN’S ADVISORY BOARD
August 11, 2021 Online meeting
CALL TO ORDER: The meeting was called to order by Boyd Lee at 5:30 PM.
• Announcement `Chair read on-line announcement.
• Approval of Agenda: Motion made and seconded to approve agenda.
• Approval of minutes: Motion made and seconded to approve minutes with corrections fromthe July 2021 meeting.
• New Employee Intro: Sonya Mills introduced herself. She is the new Deputy Director forHuman Services. Welcome Aboard.
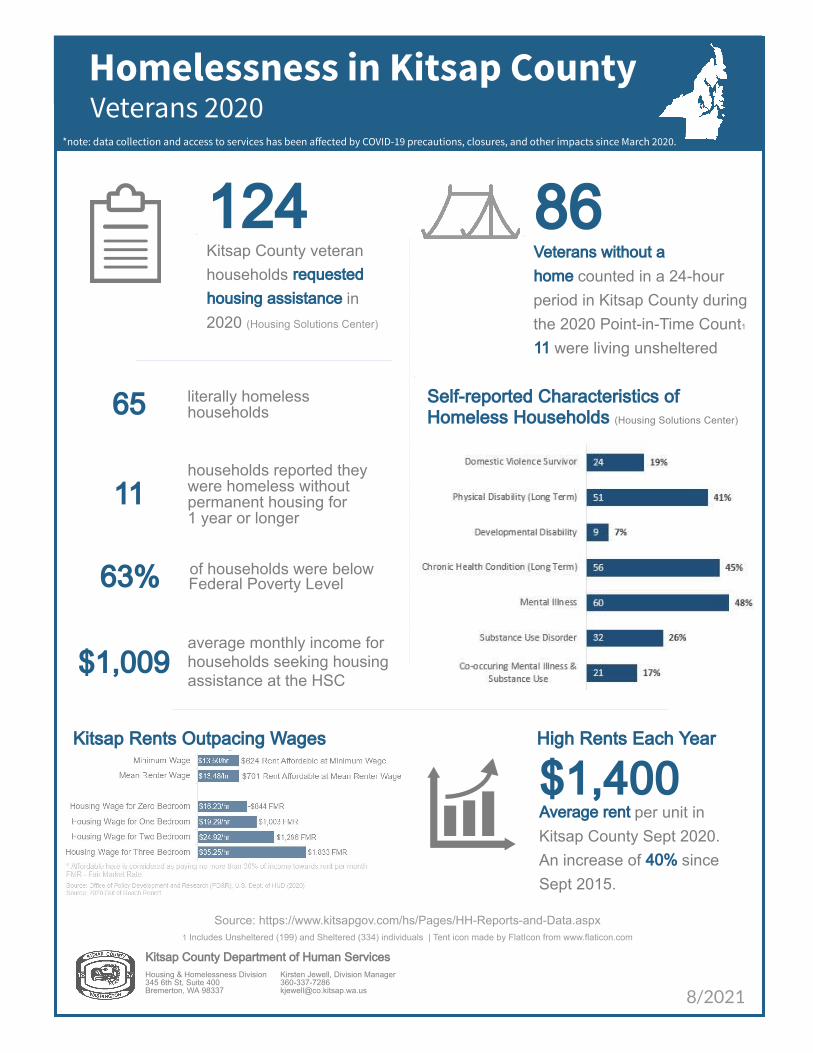
• Guest Speaker: Kirsten Jewell, Kitsap County Housing & Homeless Division Manager spoketo us about Veteran homelessness in Kitsap County. Her presentation is attached as part ofthe official minutes for the meeting. In 2020, 124 Veteran households requested housingassistance. For people seeking housing assistance, the entry program is designed to make ita one-stop shop for processing all housing needs. They partner with area organizations toprovide temporary housing solutions including Building 10 at Retsil, Salvation Army, thetemporary shelter at the County Fairgrounds, Kitsap Community Resources, Oxford Houseand Homes of Compassion. She talked about the new shelter in Port Orchard on Mile Hilldrive.
• Reports:a. Veterans Assistance Fund (VAF). Doug Washburn stated we are in a good position to get
us through the end of the year. We will have a detailed financial briefing at theNovember Retreat.
b. Committee Reports (Five Minutes Each)• Tiny Houses – Nothing new to report on tiny homes.• Veterans Garden – Dennis asked Doug for help on the Howe Management Farm plan
from 2003. Joe Kochera volunteered to help with the update of the plan.• Public Affairs Officer – Nothing new to report• Military Appreciation Day – September 25 at the Kitsap Pavilion at the Fairgrounds.
Joe encouraged VAB members to stop by the event. Harry volunteered to staff theVAB table during the event.
• Veteran Day – November 11, Kitsap Pavilion. More info to follow.• Social Media – Brian posted the cooling sites available in Kitsap County during the
heat wave.• Suicide Prevention – Rick provided an update of the COVID cases at Retsil. Due to
the increase of COVID cases in the County, Rick proposed we cancel the SuicidePrevention event scheduled for September 10. A motion was made by Harry andseconded by Rick. Discussion was held to get an interview and/or ad in The Kitsap

Page 2 of 3
Sun to address Suicide Prevention. Joe made a motion and seconded by George to approve a ½ page ad. I will work with Sonya to come up with an ad for the paper.
• Veteran Education – Nothing new to report• Women’s Resource Group – Nothing new to report• CBOC – Peggy reported from the monthly CBOC Board meeting. The Leadership was
in attendance. They discussed the clinic growth three new providers have beenadded since the end of May and beginning of June. The plan is to add two moreprovides in September. Another pharmacists and social worker have been added.An area of concern is the Community Care initiative. This is where a contract withTriWest has been created to connect a Veteran to specialty care needs in the area ifthe CBOC is unable to provide the service especially nontraditional medicaltreatment such as herbalist, acupuncture, etc.. Another area of concern is the callcenter service. Veterans often get different answers to inquiries depending on whoanswers the phone. The call center service is typically performed by contractservices and they are not as familiar with issues and keeping current on Veteransupport. The Leadership team asked to Board members to focus on several areas; 1.Transportation from Silverdale to Seattle and American Lake; 2. What would behelpful to have in the clinic, i.e. specialist; and 3. Feedback on telehealth/videovisits.
• Old Business:• Fall Stand Down – September 25, 1000-1400 at the Sheridan Community Center.
The VAB has responsibility for the sign in table at the front door. Discussed volunteers needed. Anticipate needing six volunteers for the 1000-1200 shift and four for the 1200-1400 shift. Volunteers should contact Peggy. Motion was made by Joe, seconded by George to donate $10K for the Stand Down with an additional$10K later if needed.
• November 2021 Retreat – in the next couple of weeks, Peggy will send out the draft agenda, calendar of events, and work plan for 2022.
• Calendar of events for 2021. Reviewed the calendar
• New Business:• In person meetings – Peggy will research potential locations suggested by Board
members in preparation of in-person meetings.
Good of the Order/Announcements: None
Next meeting: September 8, 2021 at 5:30 pm. Chair will send out Zoom information
ADJOURNMENT: Meeting adjourned at 6:55 PM
Page 3 of 3
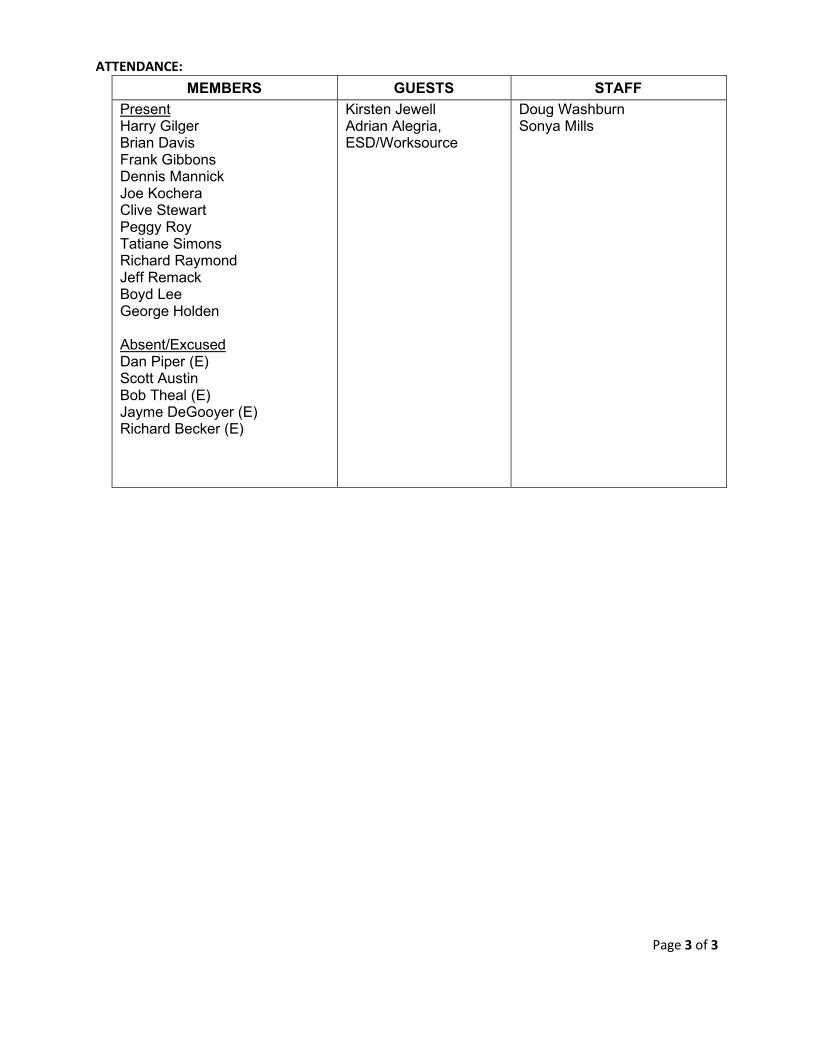
ATTENDANCE: MEMBERS GUESTS STAFF
Present Harry Gilger Brian Davis Frank Gibbons Dennis Mannick Joe Kochera Clive Stewart Peggy Roy Tatiane Simons Richard Raymond Jeff Remack Boyd Lee George Holden Absent/Excused Dan Piper (E) Scott Austin Bob Theal (E) Jayme DeGooyer (E) Richard Becker (E)
Kirsten Jewell Adrian Alegria, ESD/Worksource
Doug Washburn Sonya Mills
Kitsap County Department of Human Services
Housing & Homelessness Division
345 6th St, Suite 400
Bremerton, WA 98337
Homelessness in Kitsap County
Source: https://www.kitsapgov.com/hs/Pages/HH-Reports-and-Data.aspx
1 Includes Unsheltered (199) and Sheltered (334) individuals | Tent icon made by FlatIcon from www.flaticon.com
86Veterans without a
home counted in a 24-hour
period in Kitsap County during
the 2020 Point-in-Time Count1
11 were living unsheltered
124Kitsap County veteran
households requested
housing assistance in
2020 (Housing Solutions Center)
65literally homeless
households
$1,009average monthly income for
households seeking housing
assistance at the HSC
11
households reported they
were homeless without
permanent housing for
1 year or longer
63%of households were below
Federal Poverty Level
$803
Fair Market Rate in 2017
for a 1-bedroom rental in
Kitsap County
Kirsten Jewell, Division Manager
360-337-7286
8/2021
$1,400Average rent per unit in
Kitsap County Sept 2020.
An increase of 40% since
Sept 2015.
Kitsap Rents Outpacing Wages High Rents Each Year
Veterans 2020*note: data collection and access to services has been affected by COVID-19 precautions, closures, and other impacts since March 2020.
Self-reported Characteristics of
Homeless Households (Housing Solutions Center)
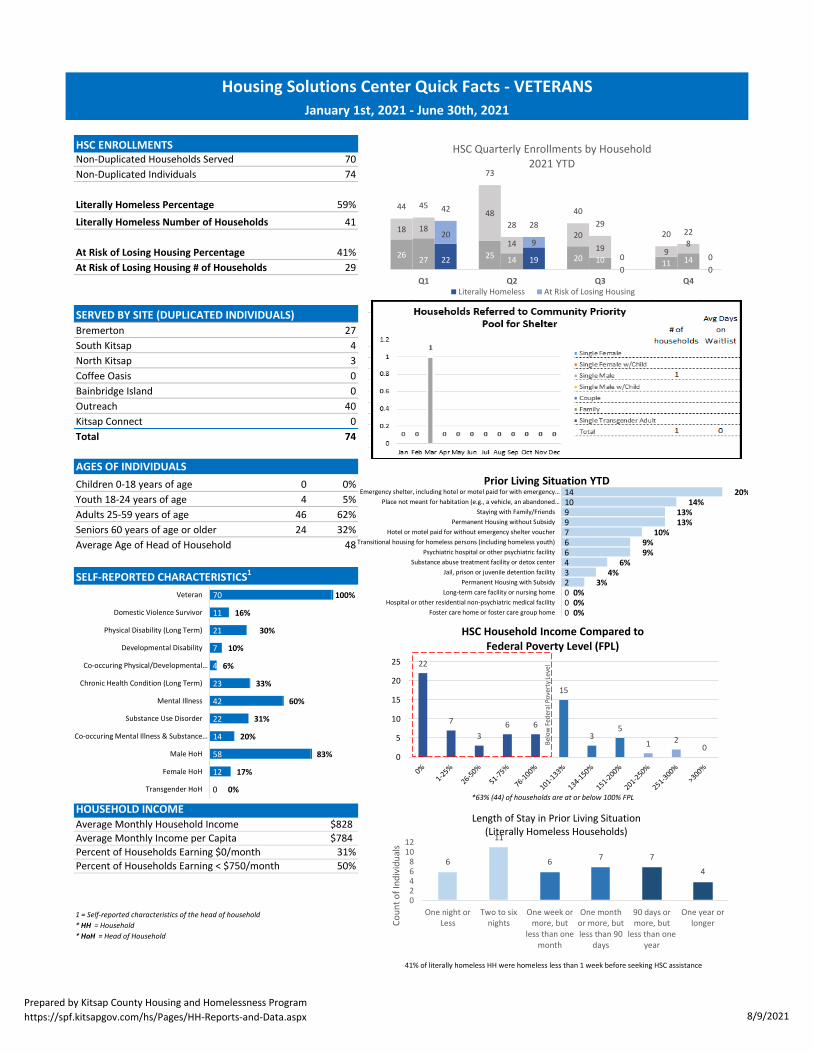
HSC ENROLLMENTSNon‐Duplicated Households Served 70Non‐Duplicated Individuals 74
Literally Homeless Percentage 59%Literally Homeless Number of Households 41
At Risk of Losing Housing Percentage 41%At Risk of Losing Housing # of Households 29
SERVED BY SITE (DUPLICATED INDIVIDUALS)
Bremerton 27 South Kitsap 4North Kitsap 3Coffee Oasis 0Bainbridge Island 0Outreach 40Kitsap Connect 0Total 74
AGES OF INDIVIDUALS
Children 0‐18 years of age 0 0%Youth 18‐24 years of age 4 5%Adults 25‐59 years of age 46 62%Seniors 60 years of age or older 24 32%Average Age of Head of Household 48
SELF‐REPORTED CHARACTERISTICS1
Veteran 3% / 6 HHDomestic Violence 33% / 62 HHPhysical Disability (Long Term) 11% / 21 HHDevelopmental Disability 8% / 15 HH
Mental Illness 40% / 74 HHSubstance Use Disorder 14% / 27 HH
Male HoH* 39% / 72 HHFemale HoH* 60% / 113 HHTransgender HoH* 1% / 2 HH
HOUSEHOLD INCOMEAverage Monthly Household Income $828 Family Size Annual Monthly Count Avg. Monthly Income
Average Monthly Income per Capita $784 1 $12,140 $1,012 64 $760Percent of Households Earning $0/month 31% 2 $16,460 $1,372 4 $746Percent of Households Earning < $750/month 50% 3 $20,780 $1,732 0
4 $25,100 $2,092 05 $29,420 $2,452 2 $3,1816 $33,740 $2,812 07 $38,060 $3,172 08 $42,380 $3,532 0
1 = Self‐reported characteristics of the head of household
*HH = Household
*HoH = Head of Household
*63% (44) of households are at or below 100% FPL
2018 Federal P
ove
rty Leve En
rolle
d Households
41% of literally homeless HH were homeless less than 1 week before seeking HSC assistance
Co‐occuring Mental Illness & Substance Use
9% / 17 HH
Co‐occuring Physical/Developmental Disability
2% / 4 HH
Housing Solutions Center Quick Facts ‐ VETERANSJanuary 1st, 2021 ‐ June 30th, 2021
22
7
36 6
15
35
1 20
0
5
10
15
20
25
HSC Household Income Compared toFederal Poverty Level (FPL)
Below Fed
eral Pov
erty Level
70
11
21
7
4
23
42
22
14
58
12
0
100%
16%
30%
10%
6%
33%
60%
31%
20%
83%
17%
0%
Veteran
Domestic Violence Survivor
Physical Disability (Long Term)
Developmental Disability
Co‐occuring Physical/Developmental…
Chronic Health Condition (Long Term)
Mental Illness
Substance Use Disorder
Co‐occuring Mental Illness & Substance…
Male HoH
Female HoH
Transgender HoH
141099766432000
20%14%
13%13%
10%9%9%
6%4%
3%0%0%0%
Emergency shelter, including hotel or motel paid for with emergency…Place not meant for habitation (e.g., a vehicle, an abandoned…
Staying with Family/FriendsPermanent Housing without Subsidy
Hotel or motel paid for without emergency shelter voucherTransitional housing for homeless persons (including homeless youth)
Psychiatric hospital or other psychiatric facilitySubstance abuse treatment facility or detox center
Jail, prison or juvenile detention facilityPermanent Housing with Subsidy
Long‐term care facility or nursing homeHospital or other residential non‐psychiatric medical facility
Foster care home or foster care group home
Prior Living Situation YTD
26 27 22 25 14 19 20 100
11 140
18 1820
48
14 920
19
0
98
0
44 45 42
73
28 2840
29
0
20 22
0
Q1 Q2 Q3 Q4
HSC Quarterly Enrollments by Household2021 YTD
Literally Homeless At Risk of Losing Housing
6
11
6 7 7
4
02468
1012
One night orLess
Two to sixnights
One week ormore, but
less than onemonth
One monthor more, butless than 90
days
90 days ormore, but
less than oneyear
One year orlongerCo
unt o
f Ind
ividua
ls
Length of Stay in Prior Living Situation(Literally Homeless Households)
Prepared by Kitsap County Housing and Homelessness Programhttps://spf.kitsapgov.com/hs/Pages/HH‐Reports‐and‐Data.aspx 8/9/2021
All Client Households
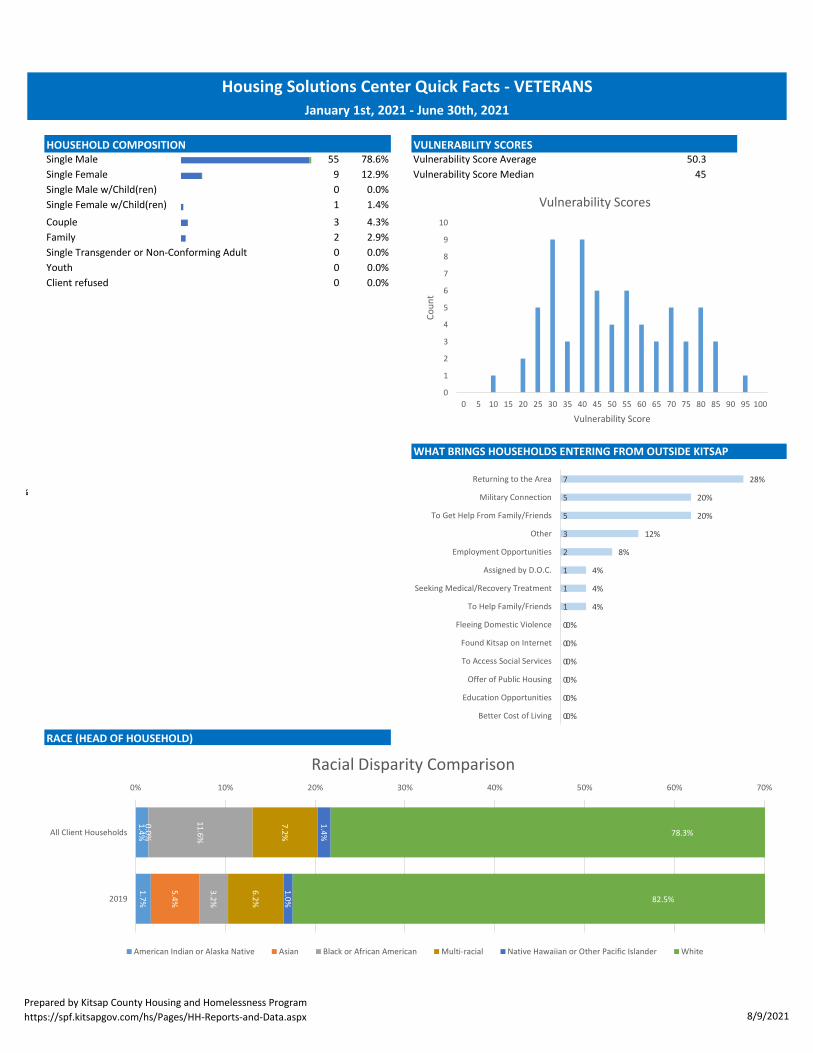
Single Male 55 78.6% Vulnerability Score Average 50.3Single Female 9 12.9% Vulnerability Score Median 45Single Male w/Child(ren) 0 0.0%Single Female w/Child(ren) 1 1.4%Couple 3 4.3%Family 2 2.9%Single Transgender or Non‐Conforming Adult 0 0.0%Youth 0 0.0%Client refused 0 0.0%
C‐C‐C‐C‐C‐C‐C‐C‐C‐C‐C‐C‐C‐C‐C‐C‐C‐C‐C‐
RACE (HEAD OF HOUSEHOLD)
January 1st, 2021 ‐ June 30th, 2021
Housing Solutions Center Quick Facts ‐ VETERANS
HOUSEHOLD COMPOSITION VULNERABILITY SCORES
WHAT BRINGS HOUSEHOLDS ENTERING FROM OUTSIDE KITSAP
%
0
1
2
3
4
5
6
7
8
9
10
0 5 10 15 20 25 30 35 40 45 50 55 60 65 70 75 80 85 90 95 100
Coun
tVulnerability Score
Vulnerability Scores
1.4%1.7%
0.0%
5.4%
11.6%3.2%
7.2%
6.2%
1.4%
1.0%
78.3%
82.5%
0% 10% 20% 30% 40% 50% 60% 70%
All Client Households
2019
Racial Disparity Comparison
American Indian or Alaska Native Asian Black or African American Multi‐racial Native Hawaiian or Other Pacific Islander White
7
5
5
3
2
1
1
1
0
0
0
0
0
0
28%
20%
20%
12%
8%
4%
4%
4%
0%
0%
0%
0%
0%
0%
Returning to the Area
Military Connection
To Get Help From Family/Friends
Other
Employment Opportunities
Assigned by D.O.C.
Seeking Medical/Recovery Treatment
To Help Family/Friends
Fleeing Domestic Violence
Found Kitsap on Internet
To Access Social Services
Offer of Public Housing
Education Opportunities
Better Cost of Living
Prepared by Kitsap County Housing and Homelessness Programhttps://spf.kitsapgov.com/hs/Pages/HH‐Reports‐and‐Data.aspx 8/9/2021
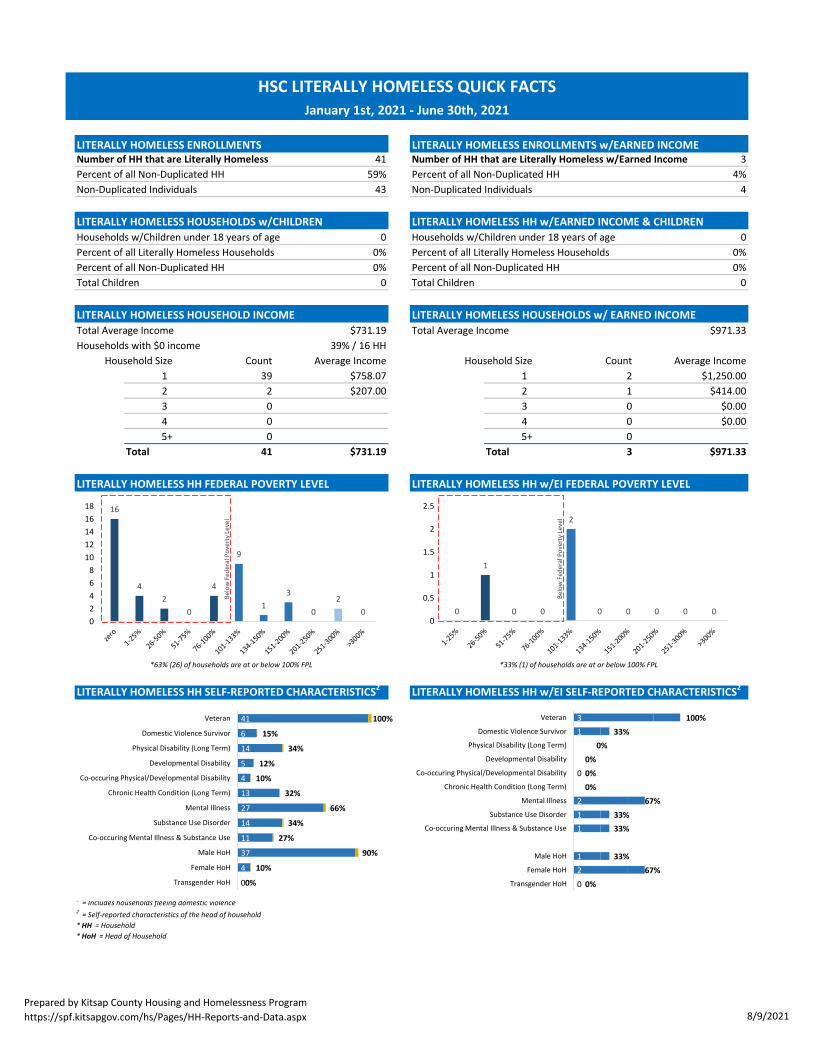
Number of HH that are Literally Homeless 41 Number of HH that are Literally Homeless w/Earned Income 3Percent of all Non‐Duplicated HH 59% Percent of all Non‐Duplicated HH 4%Non‐Duplicated Individuals 43 Non‐Duplicated Individuals 4
Households w/Children under 18 years of age 0 Households w/Children under 18 years of age 0Percent of all Literally Homeless Households 0% Percent of all Literally Homeless Households 0%Percent of all Non‐Duplicated HH 0% Percent of all Non‐Duplicated HH 0%Total Children 0 Total Children 0
Total Average Income $731.19 Total Average IncomeHouseholds with $0 income 39% / 16 HH
Household Size Count Average Income Household Size Count Average Income1 39 $758.07 1 22 2 $207.00 2 13 0 3 04 0 4 05+ 0 5+ 0
Total 41 $731.19 Total 3
Veteran 8% / 4 HH Veteran 0% / 0 HHDomestic Violence 32% / 16 HH Domestic Violence 43% / 6 HHPhysical Disability (Long Term) 12% / 6 HH Physical Disability (Long Term) 0% / 0 HHDevelopmental Disability 14% / 7 HH Developmental Disability 7% / 1 HHCo‐occuring Physical/Developmental Co‐occuring Physical/DevelopmentalDisability DisabilityMental Illness 40% / 20 HH Mental Illness 21% / 3 HHSubstance Use Disorder 20% / 10 HH Substance Use Disorder 7% / 1 HHCo‐occuring Mental Illness & Co‐occuring Mental Illness &Substance Use Substance UseMale HoH* 58% / 29 HH Male HoH* 50% / 7 HHFemale HoH* 42% / 21 HH Female HoH* 50% / 7 HH
0% / 0 HH Transgender HoH* 0% / 0 HH
1 HH
1 = Includes households fleeing domestic violence2 = Self‐reported characteristics of the head of household
*HH = Household
*HoH = Head of Household
0 HH
16% / 8 HH 7% /
2% / 1 HH 0% /
LITERALLY HOMELESS HH SELF‐REPORTED CHARACTERISTICS2 LITERALLY HOMELESS HH w/EI SELF‐REPORTED CHARACTERISTICS2
*63% (26) of households are at or below 100% FPL *33% (1) of households are at or below 100% FPL
$971.33
LITERALLY HOMELESS HH FEDERAL POVERTY LEVEL LITERALLY HOMELESS HH w/EI FEDERAL POVERTY LEVEL
$971.33
$1,250.00$414.00
$0.00$0.00
LITERALLY HOMELESS HOUSEHOLDS w/CHILDREN LITERALLY HOMELESS HH w/EARNED INCOME & CHILDREN
LITERALLY HOMELESS HOUSEHOLD INCOME LITERALLY HOMELESS HOUSEHOLDS w/ EARNED INCOME
LITERALLY HOMELESS ENROLLMENTS LITERALLY HOMELESS ENROLLMENTS w/EARNED INCOME
HSC LITERALLY HOMELESS QUICK FACTSJanuary 1st, 2021 ‐ June 30th, 2021
310000211
120
100%
33%
0%
0%
0%
0%
67%
33%
33%
33%
67%
0%
Veteran
Domestic Violence Survivor
Physical Disability (Long Term)
Developmental Disability
Co‐occuring Physical/Developmental Disability
Chronic Health Condition (Long Term)
Mental Illness
Substance Use Disorder
Co‐occuring Mental Illness & Substance Use
Male HoH
Female HoH
Transgender HoH
41
6
14
5
4
13
27
14
11
37
4
0
100%
15%
34%
12%
10%
32%
66%
34%
27%
90%
10%
0%
Veteran
Domestic Violence Survivor
Physical Disability (Long Term)
Developmental Disability
Co‐occuring Physical/Developmental Disability
Chronic Health Condition (Long Term)
Mental Illness
Substance Use Disorder
Co‐occuring Mental Illness & Substance Use
Male HoH
Female HoH
Transgender HoH
16
42
0
4
9
13
02
002468
1012141618
Below Fed
eral Pov
erty Level
0
1
0 0
2
0 0 0 0 00
0.5
1
1.5
2
2.5
Below Fed
eral Pov
erty Level
Prepared by Kitsap County Housing and Homelessness Programhttps://spf.kitsapgov.com/hs/Pages/HH‐Reports‐and‐Data.aspx 8/9/2021
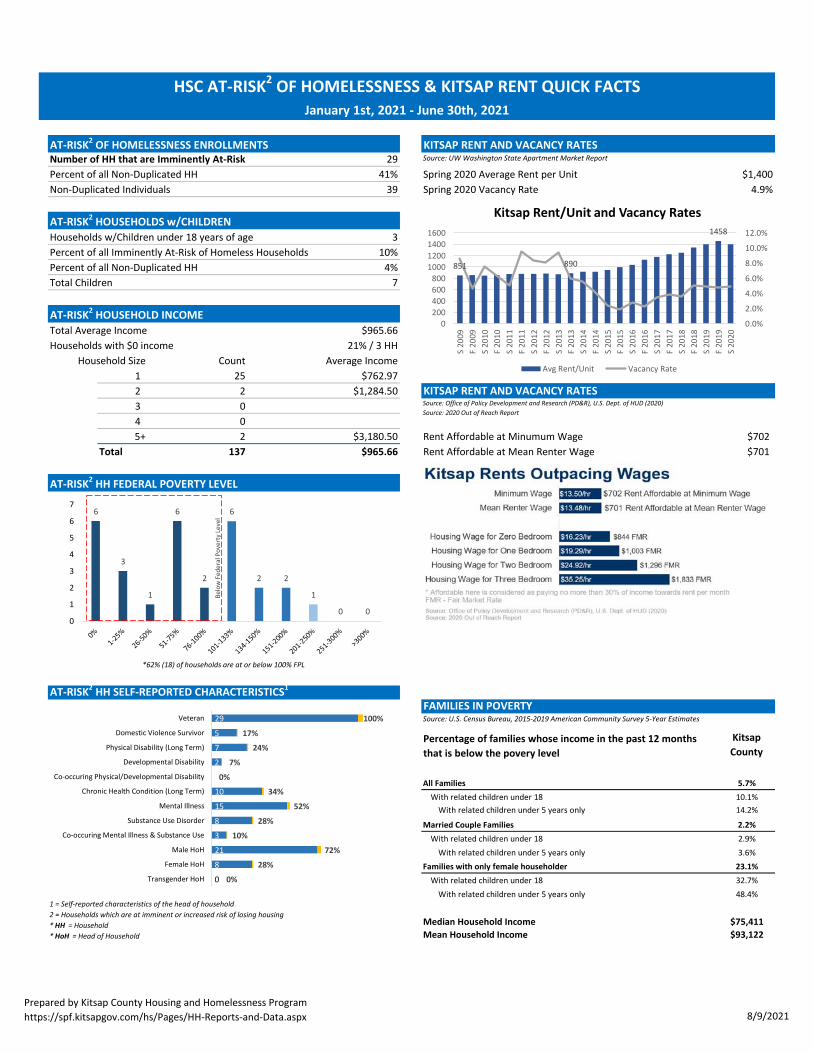
Number of HH that are Imminently At‐Risk 29 Source: UW Washington State Apartment Market Report
Percent of all Non‐Duplicated HH 41% Spring 2020 Average Rent per Unit $1,400Non‐Duplicated Individuals 39 Spring 2020 Vacancy Rate 4.9%
Households w/Children under 18 years of age 3Percent of all Imminently At‐Risk of Homeless Households 10%Percent of all Non‐Duplicated HH 4%Total Children 7
Total Average Income $965.66Households with $0 income 21% / 3 HH
Household Size Count Average Income1 25 $762.972 2 $1,284.503 04 05+ 2 $3,180.50 Rent Affordable at Minumum Wage $702
Total 137 $965.66 Rent Affordable at Mean Renter Wage $701
Source: U.S. Census Bureau, 2015‐2019 American Community Survey 5‐Year Estimates
All Families 5.7%
With related children under 18 10.1%With related children under 5 years only 14.2%
Married Couple Families 2.2%
With related children under 18 2.9%With related children under 5 years only 3.6%
Families with only female householder 23.1%
With related children under 18 32.7%With related children under 5 years only 48.4%
Median Household Income $75,411
Mean Household Income $93,122
1 = Self‐reported characteristics of the head of household
2 = Households which are at imminent or increased risk of losing housing
*HH = Household
*HoH = Head of Household
FAMILIES IN POVERTY
Kitsap
CountyPercentage of families whose income in the past 12 months
that is below the povery level
AT‐RISK2 HH SELF‐REPORTED CHARACTERISTICS1
*62% (18) of households are at or below 100% FPL
AT‐RISK2 HH FEDERAL POVERTY LEVEL
KITSAP RENT AND VACANCY RATESSource: Office of Policy Development and Research (PD&R), U.S. Dept. of HUD (2020)
Source: 2020 Out of Reach Report
AT‐RISK2 HOUSEHOLDS w/CHILDREN
AT‐RISK2 HOUSEHOLD INCOME
AT‐RISK2 OF HOMELESSNESS ENROLLMENTS KITSAP RENT AND VACANCY RATES
January 1st, 2021 ‐ June 30th, 2021
HSC AT‐RISK2 OF HOMELESSNESS & KITSAP RENT QUICK FACTS
29
5
7
2
0
10
15
8
3
21
8
0
100%
17%
24%
7%
0%
34%
52%
28%
10%
72%
28%
0%
Veteran
Domestic Violence Survivor
Physical Disability (Long Term)
Developmental Disability
Co‐occuring Physical/Developmental Disability
Chronic Health Condition (Long Term)
Mental Illness
Substance Use Disorder
Co‐occuring Mental Illness & Substance Use
Male HoH
Female HoH
Transgender HoH
6
3
1
6
2
6
2 2
1
0 00
1
2
3
4
5
6
7
Below Fed
eral Pov
erty Level
851 890
1458
0.0%
2.0%
4.0%
6.0%
8.0%
10.0%
12.0%
0200400600800
1000120014001600
S 20
09F 20
09S 20
10F 20
10S 20
11F 20
11S 20
12F 20
12S 20
13F 20
13S 20
14F 20
14S 20
15F 20
15S 20
16F 20
16S 20
17F 20
17S 20
18F 20
18S 20
19F 20
19S 20
20
Kitsap Rent/Unit and Vacancy Rates
Avg Rent/Unit Vacancy Rate
Prepared by Kitsap County Housing and Homelessness Programhttps://spf.kitsapgov.com/hs/Pages/HH‐Reports‐and‐Data.aspx 8/9/2021
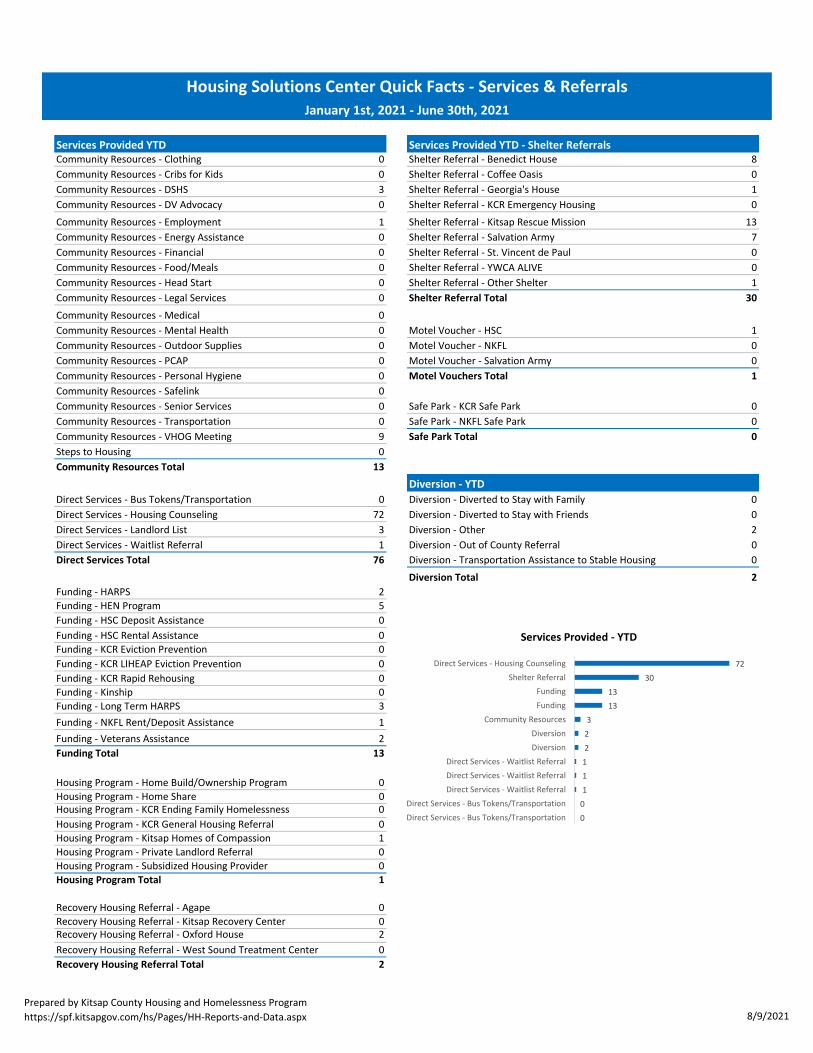
Community Resources ‐ Clothing 0 Shelter Referral ‐ Benedict House 8Community Resources ‐ Cribs for Kids 0 Shelter Referral ‐ Coffee Oasis 0Community Resources ‐ DSHS 3 Shelter Referral ‐ Georgia's House 1Community Resources ‐ DV Advocacy 0 Shelter Referral ‐ KCR Emergency Housing 0Community Resources ‐ Employment 1 Shelter Referral ‐ Kitsap Rescue Mission 13Community Resources ‐ Energy Assistance 0 Shelter Referral ‐ Salvation Army 7Community Resources ‐ Financial 0 Shelter Referral ‐ St. Vincent de Paul 0Community Resources ‐ Food/Meals 0 Shelter Referral ‐ YWCA ALIVE 0Community Resources ‐ Head Start 0 Shelter Referral ‐ Other Shelter 1Community Resources ‐ Legal Services 0 Shelter Referral Total 30
Community Resources ‐ Medical 0Community Resources ‐ Mental Health 0 Motel Voucher ‐ HSC 1Community Resources ‐ Outdoor Supplies 0 Motel Voucher ‐ NKFL 0Community Resources ‐ PCAP 0 Motel Voucher ‐ Salvation Army 0Community Resources ‐ Personal Hygiene 0 Motel Vouchers Total 1
Community Resources ‐ Safelink 0Community Resources ‐ Senior Services 0 Safe Park ‐ KCR Safe Park 0Community Resources ‐ Transportation 0 Safe Park ‐ NKFL Safe Park 0Community Resources ‐ VHOG Meeting 9 Safe Park Total 0
Steps to Housing 0Community Resources Total 13
Direct Services ‐ Bus Tokens/Transportation 0 Diversion ‐ Diverted to Stay with Family 0Direct Services ‐ Housing Counseling 72 Diversion ‐ Diverted to Stay with Friends 0Direct Services ‐ Landlord List 3 Diversion ‐ Other 2Direct Services ‐ Waitlist Referral 1 Diversion ‐ Out of County Referral 0Direct Services Total 76 Diversion ‐ Transportation Assistance to Stable Housing 0
Diversion Total 2
Funding ‐ HARPS 2Funding ‐ HEN Program 5Funding ‐ HSC Deposit Assistance 0Funding ‐ HSC Rental Assistance 0Funding ‐ KCR Eviction Prevention 0 Direct Serv 72 1 Direct Servic 72Funding ‐ KCR LIHEAP Eviction Prevention 0 Shelter Ref 30 2 Shelter Refe 30Funding ‐ KCR Rapid Rehousing 0 Direct Serv 3 3 Funding 13Funding ‐ Kinship 0 Funding 13 4 Funding 13Funding ‐ Long Term HARPS 3 Communit 13 5 Community 3Funding ‐ NKFL Rent/Deposit Assistance 1 Direct Serv 1 6 Diversion 2Funding ‐ Veterans Assistance 2 Direct Serv 0 7 Diversion 2Funding Total 13 Diversion 2 8 Direct Servic 1
Housing Pr 1 9 Direct Servic 1Housing Program ‐ Home Build/Ownership Program 0 Recovery H 2 10 Direct Servic 1Housing Program ‐ Home Share 0 Safe Park 0 11 Direct Servic 0Housing Program ‐ KCR Ending Family Homelessness 0 Motel Vou 1 12 Direct Servic 0Housing Program ‐ KCR General Housing Referral 0Housing Program ‐ Kitsap Homes of Compassion 1Housing Program ‐ Private Landlord Referral 0Housing Program ‐ Subsidized Housing Provider 0Housing Program Total 1
Recovery Housing Referral ‐ Agape 0Recovery Housing Referral ‐ Kitsap Recovery Center 0Recovery Housing Referral ‐ Oxford House 2Recovery Housing Referral ‐ West Sound Treatment Center 0Recovery Housing Referral Total 2
Diversion ‐ YTD
Services Provided YTD Services Provided YTD ‐ Shelter Referrals
January 1st, 2021 ‐ June 30th, 2021
Housing Solutions Center Quick Facts ‐ Services & Referrals
7230
1313
32211100
Direct Services ‐ Housing CounselingShelter Referral
FundingFunding
Community ResourcesDiversionDiversion
Direct Services ‐ Waitlist ReferralDirect Services ‐ Waitlist ReferralDirect Services ‐ Waitlist Referral
Direct Services ‐ Bus Tokens/TransportationDirect Services ‐ Bus Tokens/Transportation
Services Provided ‐ YTD
Prepared by Kitsap County Housing and Homelessness Programhttps://spf.kitsapgov.com/hs/Pages/HH‐Reports‐and‐Data.aspx 8/9/2021
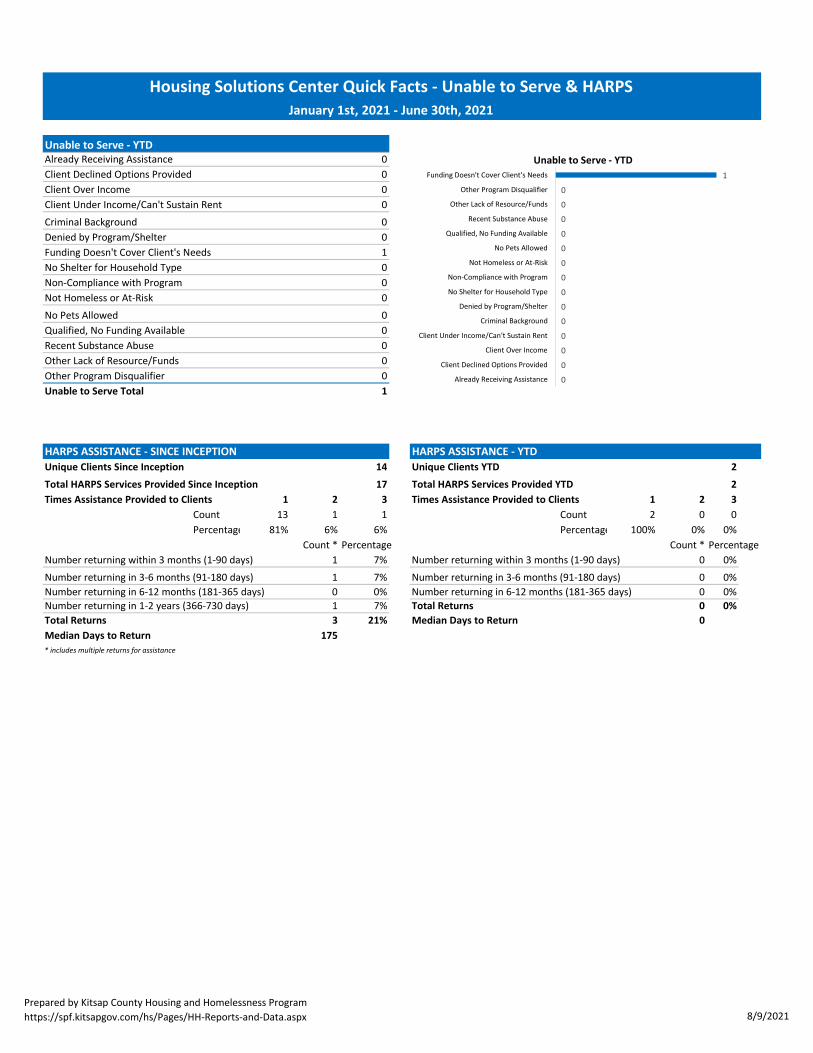
Already Receiving Assistance 0 ### 1 1.0007 Funding Do 1Client Declined Options Provided 0 ### 2 0.0015 Other Prog 0Client Over Income 0 ### 3 0.0014 Other Lack 0Client Under Income/Can't Sustain Rent 0 ### 4 0.0013 Recent Sub 0Criminal Background 0 ### 5 0.0012 Qualified, N 0Denied by Program/Shelter 0 ### 6 0.0011 No Pets All 0Funding Doesn't Cover Client's Needs 1 ### 7 0.001 Not Homel 0No Shelter for Household Type 0 ### 8 0.0009 Non‐Comp 0Non‐Compliance with Program 0 ### 9 0.0008 No Shelter 0Not Homeless or At‐Risk 0 ### 10 0.0006 Denied by 0No Pets Allowed 0 ### 11 0.0005 Criminal Ba 0Qualified, No Funding Available 0 ### 12 0.0004 Client Und 0Recent Substance Abuse 0 ### 13 0.0003 Client Over 0Other Lack of Resource/Funds 0 ### 14 0.0002 Client Decl 0Other Program Disqualifier 0 ### 15 0.0001 Already Re 0Unable to Serve Total 1
HARPS ASSISTANCE ‐ SINCE INCEPTION HARPS ASSISTANCE ‐ YTD
Unique Clients Since Inception 14 Unique Clients YTD 2
Total HARPS Services Provided Since Inception 17 Total HARPS Services Provided YTD 2
Times Assistance Provided to Clients 1 2 3 Times Assistance Provided to Clients 1 2 3
Count 13 1 1 Count 2 0 0Percentage 81% 6% 6% Percentage 100% 0% 0%
Count * Percentage Count * PercentageNumber returning within 3 months (1‐90 days) 1 7% Number returning within 3 months (1‐90 days) 0 0%Number returning in 3‐6 months (91‐180 days) 1 7% Number returning in 3‐6 months (91‐180 days) 0 0%Number returning in 6‐12 months (181‐365 days) 0 0% Number returning in 6‐12 months (181‐365 days) 0 0%Number returning in 1‐2 years (366‐730 days) 1 7% Total Returns 0 0%
Total Returns 3 21% Median Days to Return 0
Median Days to Return 175
* includes multiple returns for assistance
Unable to Serve ‐ YTD
January 1st, 2021 ‐ June 30th, 2021
Housing Solutions Center Quick Facts ‐ Unable to Serve & HARPS
1
0
0
0
0
0
0
0
0
0
0
0
0
0
0
Funding Doesn't Cover Client's Needs
Other Program Disqualifier
Other Lack of Resource/Funds
Recent Substance Abuse
Qualified, No Funding Available
No Pets Allowed
Not Homeless or At‐Risk
Non‐Compliance with Program
No Shelter for Household Type
Denied by Program/Shelter
Criminal Background
Client Under Income/Can't Sustain Rent
Client Over Income
Client Declined Options Provided
Already Receiving Assistance
Unable to Serve ‐ YTD
Prepared by Kitsap County Housing and Homelessness Programhttps://spf.kitsapgov.com/hs/Pages/HH‐Reports‐and‐Data.aspx 8/9/2021
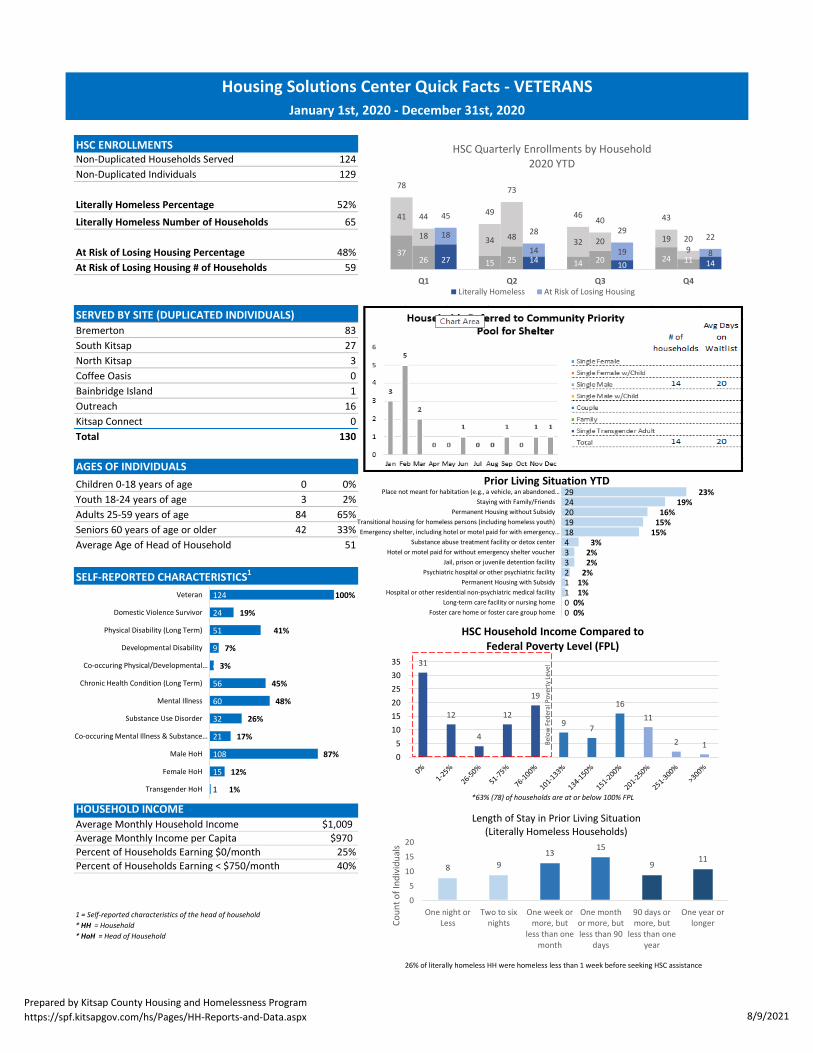
HSC ENROLLMENTSNon‐Duplicated Households Served 124Non‐Duplicated Individuals 129
Literally Homeless Percentage 52%Literally Homeless Number of Households 65
At Risk of Losing Housing Percentage 48%At Risk of Losing Housing # of Households 59
SERVED BY SITE (DUPLICATED INDIVIDUALS)
Bremerton 83 South Kitsap 27North Kitsap 3Coffee Oasis 0Bainbridge Island 1Outreach 16Kitsap Connect 0Total 130
AGES OF INDIVIDUALS
Children 0‐18 years of age 0 0%Youth 18‐24 years of age 3 2%Adults 25‐59 years of age 84 65%Seniors 60 years of age or older 42 33%Average Age of Head of Household 51
SELF‐REPORTED CHARACTERISTICS1
Veteran 3% / 6 HHDomestic Violence 33% / 62 HHPhysical Disability (Long Term) 11% / 21 HHDevelopmental Disability 8% / 15 HH
Mental Illness 40% / 74 HHSubstance Use Disorder 14% / 27 HH
Male HoH* 39% / 72 HHFemale HoH* 60% / 113 HHTransgender HoH* 1% / 2 HH
HOUSEHOLD INCOMEAverage Monthly Household Income $1,009 Family Size Annual Monthly Count Avg. Monthly Income
Average Monthly Income per Capita $970 1 $12,140 $1,012 108 $925Percent of Households Earning $0/month 25% 2 $16,460 $1,372 10 $1,349Percent of Households Earning < $750/month 40% 3 $20,780 $1,732 3 $1,600
4 $25,100 $2,092 05 $29,420 $2,452 2 $2,1206 $33,740 $2,812 1 $2,6807 $38,060 $3,172 08 $42,380 $3,532 0
1 = Self‐reported characteristics of the head of household
*HH = Household
*HoH = Head of Household
*63% (78) of households are at or below 100% FPL
2018 Federal P
ove
rty Leve En
rolle
d Households
26% of literally homeless HH were homeless less than 1 week before seeking HSC assistance
Co‐occuring Mental Illness & Substance Use
9% / 17 HH
Co‐occuring Physical/Developmental Disability
2% / 4 HH
Housing Solutions Center Quick Facts ‐ VETERANSJanuary 1st, 2020 ‐ December 31st, 2020
31
12
4
12
19
9 7
1611
2 105
101520253035
HSC Household Income Compared toFederal Poverty Level (FPL)
Below Fed
eral Pov
erty Level
124
24
51
9
4
56
60
32
21
108
15
1
100%
19%
41%
7%
3%
45%
48%
26%
17%
87%
12%
1%
Veteran
Domestic Violence Survivor
Physical Disability (Long Term)
Developmental Disability
Co‐occuring Physical/Developmental…
Chronic Health Condition (Long Term)
Mental Illness
Substance Use Disorder
Co‐occuring Mental Illness & Substance…
Male HoH
Female HoH
Transgender HoH
292420191843321100
23%19%
16%15%15%
3%2%2%2%1%1%0%0%
Place not meant for habitation (e.g., a vehicle, an abandoned…Staying with Family/Friends
Permanent Housing without SubsidyTransitional housing for homeless persons (including homeless youth)Emergency shelter, including hotel or motel paid for with emergency…
Substance abuse treatment facility or detox centerHotel or motel paid for without emergency shelter voucher
Jail, prison or juvenile detention facilityPsychiatric hospital or other psychiatric facility
Permanent Housing with SubsidyHospital or other residential non‐psychiatric medical facility
Long‐term care facility or nursing homeFoster care home or foster care group home
Prior Living Situation YTD
3726 27 15 25 14 14 20 10
24 11 14
41
18 18 34 4814
32 2019
199 8
78
44 45 49
73
28
46 4029
43
20 22
Q1 Q2 Q3 Q4
HSC Quarterly Enrollments by Household2020 YTD
Literally Homeless At Risk of Losing Housing
8 913
15
911
0
5
10
15
20
One night orLess
Two to sixnights
One week ormore, but
less than onemonth
One monthor more, butless than 90
days
90 days ormore, but
less than oneyear
One year orlongerCo
unt o
f Ind
ividua
ls
Length of Stay in Prior Living Situation(Literally Homeless Households)
Prepared by Kitsap County Housing and Homelessness Programhttps://spf.kitsapgov.com/hs/Pages/HH‐Reports‐and‐Data.aspx 8/9/2021
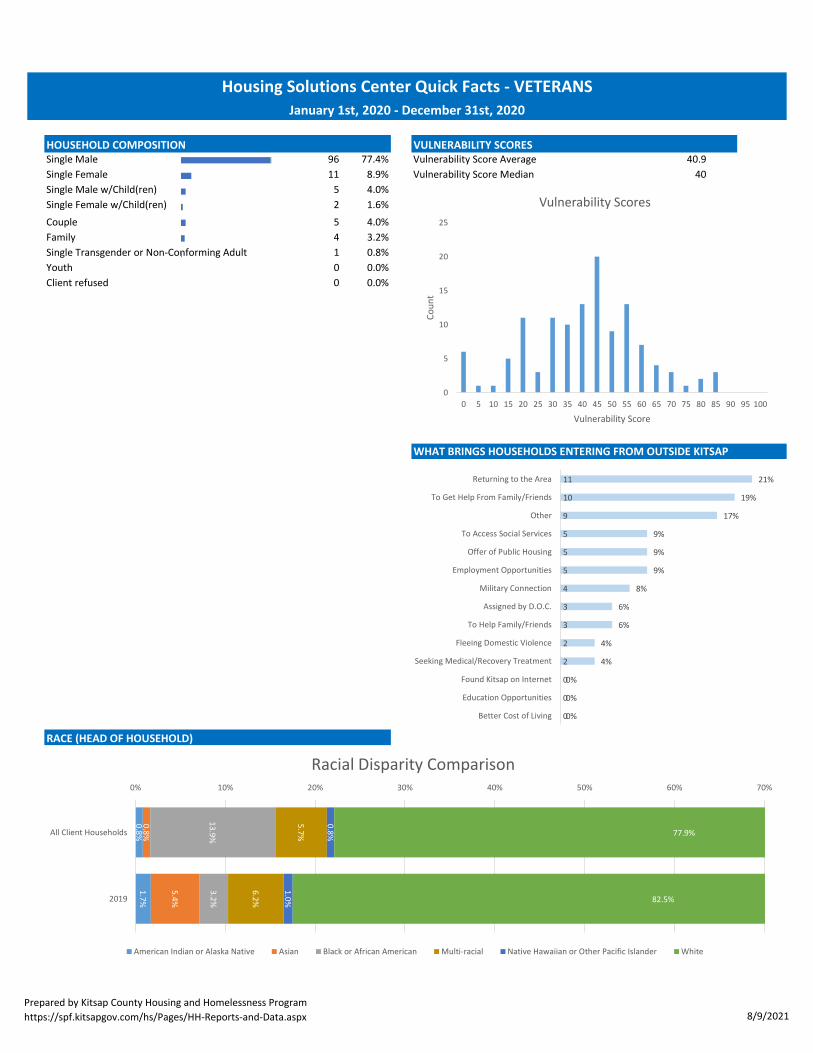
All Client Households
Single Male 96 77.4% Vulnerability Score Average 40.9Single Female 11 8.9% Vulnerability Score Median 40Single Male w/Child(ren) 5 4.0%Single Female w/Child(ren) 2 1.6%Couple 5 4.0%Family 4 3.2%Single Transgender or Non‐Conforming Adult 1 0.8%Youth 0 0.0%Client refused 0 0.0%
C‐C‐C‐C‐C‐C‐C‐C‐C‐C‐C‐C‐C‐C‐C‐C‐C‐C‐C‐
RACE (HEAD OF HOUSEHOLD)
January 1st, 2020 ‐ December 31st, 2020
Housing Solutions Center Quick Facts ‐ VETERANS
HOUSEHOLD COMPOSITION VULNERABILITY SCORES
WHAT BRINGS HOUSEHOLDS ENTERING FROM OUTSIDE KITSAP
0
5
10
15
20
25
0 5 10 15 20 25 30 35 40 45 50 55 60 65 70 75 80 85 90 95 100
Coun
tVulnerability Score
Vulnerability Scores
0.8%1.7%
0.8%
5.4%
13.9%3.2%
5.7%
6.2%
0.8%
1.0%
77.9%
82.5%
0% 10% 20% 30% 40% 50% 60% 70%
All Client Households
2019
Racial Disparity Comparison
American Indian or Alaska Native Asian Black or African American Multi‐racial Native Hawaiian or Other Pacific Islander White
11
10
9
5
5
5
4
3
3
2
2
0
0
0
21%
19%
17%
9%
9%
9%
8%
6%
6%
4%
4%
0%
0%
0%
Returning to the Area
To Get Help From Family/Friends
Other
To Access Social Services
Offer of Public Housing
Employment Opportunities
Military Connection
Assigned by D.O.C.
To Help Family/Friends
Fleeing Domestic Violence
Seeking Medical/Recovery Treatment
Found Kitsap on Internet
Education Opportunities
Better Cost of Living
Prepared by Kitsap County Housing and Homelessness Programhttps://spf.kitsapgov.com/hs/Pages/HH‐Reports‐and‐Data.aspx 8/9/2021

Number of HH that are Literally Homeless 65 Number of HH that are Literally Homeless w/Earned Income 7Percent of all Non‐Duplicated HH 52% Percent of all Non‐Duplicated HH 6%Non‐Duplicated Individuals 73 Non‐Duplicated Individuals 7
Households w/Children under 18 years of age 1 Households w/Children under 18 years of age 0Percent of all Literally Homeless Households 2% Percent of all Literally Homeless Households 0%Percent of all Non‐Duplicated HH 1% Percent of all Non‐Duplicated HH 0%Total Children 3 Total Children 0
Total Average Income $820.75 Total Average IncomeHouseholds with $0 income 34% / 22 HH
Household Size Count Average Income Household Size Count Average Income1 61 $804.06 1 72 2 $1,050.50 2 03 1 $0.00 3 04 0 4 05+ 1 $2,200.00 5+ 0
Total 65 $820.75 Total 7
Veteran 8% / 4 HH Veteran 0% / 0 HHDomestic Violence 32% / 16 HH Domestic Violence 43% / 6 HHPhysical Disability (Long Term) 12% / 6 HH Physical Disability (Long Term) 0% / 0 HHDevelopmental Disability 14% / 7 HH Developmental Disability 7% / 1 HHCo‐occuring Physical/Developmental Co‐occuring Physical/DevelopmentalDisability DisabilityMental Illness 40% / 20 HH Mental Illness 21% / 3 HHSubstance Use Disorder 20% / 10 HH Substance Use Disorder 7% / 1 HHCo‐occuring Mental Illness & Co‐occuring Mental Illness &Substance Use Substance UseMale HoH* 58% / 29 HH Male HoH* 50% / 7 HHFemale HoH* 42% / 21 HH Female HoH* 50% / 7 HH
0% / 0 HH Transgender HoH* 0% / 0 HH
1 HH
1 = Includes households fleeing domestic violence2 = Self‐reported characteristics of the head of household
*HH = Household
*HoH = Head of Household
0 HH
16% / 8 HH 7% /
2% / 1 HH 0% /
LITERALLY HOMELESS HH SELF‐REPORTED CHARACTERISTICS2 LITERALLY HOMELESS HH w/EI SELF‐REPORTED CHARACTERISTICS2
*69% (45) of households are at or below 100% FPL *14% (1) of households are at or below 100% FPL
$1,800.00
LITERALLY HOMELESS HH FEDERAL POVERTY LEVEL LITERALLY HOMELESS HH w/EI FEDERAL POVERTY LEVEL
$1,800.00
$1,800.00$0.00$0.00$0.00
LITERALLY HOMELESS HOUSEHOLDS w/CHILDREN LITERALLY HOMELESS HH w/EARNED INCOME & CHILDREN
LITERALLY HOMELESS HOUSEHOLD INCOME LITERALLY HOMELESS HOUSEHOLDS w/ EARNED INCOME
LITERALLY HOMELESS ENROLLMENTS LITERALLY HOMELESS ENROLLMENTS w/EARNED INCOME
HSC LITERALLY HOMELESS QUICK FACTSJanuary 1st, 2020 ‐ December 31st, 2020
710100121
700
100%
14%
0%
14%
0%
0%
14%
29%
14%
100%
0%
0%
Veteran
Domestic Violence Survivor
Physical Disability (Long Term)
Developmental Disability
Co‐occuring Physical/Developmental Disability
Chronic Health Condition (Long Term)
Mental Illness
Substance Use Disorder
Co‐occuring Mental Illness & Substance Use
Male HoH
Female HoH
Transgender HoH
65
15
27
2
1
28
31
18
11
57
8
0
100%
23%
42%
3%
2%
43%
48%
28%
17%
88%
12%
0%
Veteran
Domestic Violence Survivor
Physical Disability (Long Term)
Developmental Disability
Co‐occuring Physical/Developmental Disability
Chronic Health Condition (Long Term)
Mental Illness
Substance Use Disorder
Co‐occuring Mental Illness & Substance Use
Male HoH
Female HoH
Transgender HoH
22
6
2
69
53
64
20
0
5
10
15
20
25
Below Fed
eral Pov
erty Level
1
0 0 0 0
1
2 2
1
00
0.5
1
1.5
2
2.5
Below Fed
eral Pov
erty Level
Prepared by Kitsap County Housing and Homelessness Programhttps://spf.kitsapgov.com/hs/Pages/HH‐Reports‐and‐Data.aspx 8/9/2021
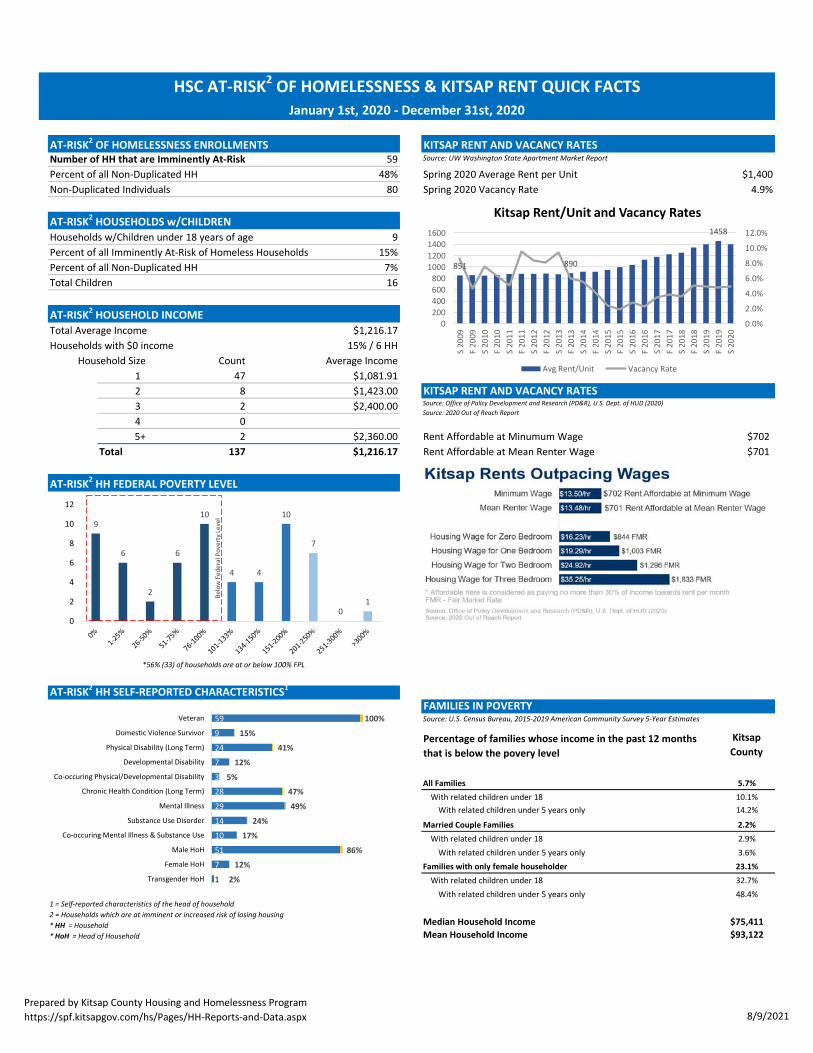
Number of HH that are Imminently At‐Risk 59 Source: UW Washington State Apartment Market Report
Percent of all Non‐Duplicated HH 48% Spring 2020 Average Rent per Unit $1,400Non‐Duplicated Individuals 80 Spring 2020 Vacancy Rate 4.9%
Households w/Children under 18 years of age 9Percent of all Imminently At‐Risk of Homeless Households 15%Percent of all Non‐Duplicated HH 7%Total Children 16
Total Average Income $1,216.17Households with $0 income 15% / 6 HH
Household Size Count Average Income1 47 $1,081.912 8 $1,423.003 2 $2,400.004 05+ 2 $2,360.00 Rent Affordable at Minumum Wage $702
Total 137 $1,216.17 Rent Affordable at Mean Renter Wage $701
Source: U.S. Census Bureau, 2015‐2019 American Community Survey 5‐Year Estimates
All Families 5.7%
With related children under 18 10.1%With related children under 5 years only 14.2%
Married Couple Families 2.2%
With related children under 18 2.9%With related children under 5 years only 3.6%
Families with only female householder 23.1%
With related children under 18 32.7%With related children under 5 years only 48.4%
Median Household Income $75,411
Mean Household Income $93,122
1 = Self‐reported characteristics of the head of household
2 = Households which are at imminent or increased risk of losing housing
*HH = Household
*HoH = Head of Household
FAMILIES IN POVERTY
Kitsap
CountyPercentage of families whose income in the past 12 months
that is below the povery level
AT‐RISK2 HH SELF‐REPORTED CHARACTERISTICS1
*56% (33) of households are at or below 100% FPL
AT‐RISK2 HH FEDERAL POVERTY LEVEL
KITSAP RENT AND VACANCY RATESSource: Office of Policy Development and Research (PD&R), U.S. Dept. of HUD (2020)
Source: 2020 Out of Reach Report
AT‐RISK2 HOUSEHOLDS w/CHILDREN
AT‐RISK2 HOUSEHOLD INCOME
AT‐RISK2 OF HOMELESSNESS ENROLLMENTS KITSAP RENT AND VACANCY RATES
January 1st, 2020 ‐ December 31st, 2020
HSC AT‐RISK2 OF HOMELESSNESS & KITSAP RENT QUICK FACTS
59
9
24
7
3
28
29
14
10
51
7
1
100%
15%
41%
12%
5%
47%
49%
24%
17%
86%
12%
2%
Veteran
Domestic Violence Survivor
Physical Disability (Long Term)
Developmental Disability
Co‐occuring Physical/Developmental Disability
Chronic Health Condition (Long Term)
Mental Illness
Substance Use Disorder
Co‐occuring Mental Illness & Substance Use
Male HoH
Female HoH
Transgender HoH
9
6
2
6
10
4 4
10
7
01
0
2
4
6
8
10
12
Below Fed
eral Pov
erty Level
851 890
1458
0.0%
2.0%
4.0%
6.0%
8.0%
10.0%
12.0%
0200400600800
1000120014001600
S 20
09F 20
09S 20
10F 20
10S 20
11F 20
11S 20
12F 20
12S 20
13F 20
13S 20
14F 20
14S 20
15F 20
15S 20
16F 20
16S 20
17F 20
17S 20
18F 20
18S 20
19F 20
19S 20
20
Kitsap Rent/Unit and Vacancy Rates
Avg Rent/Unit Vacancy Rate
Prepared by Kitsap County Housing and Homelessness Programhttps://spf.kitsapgov.com/hs/Pages/HH‐Reports‐and‐Data.aspx 8/9/2021
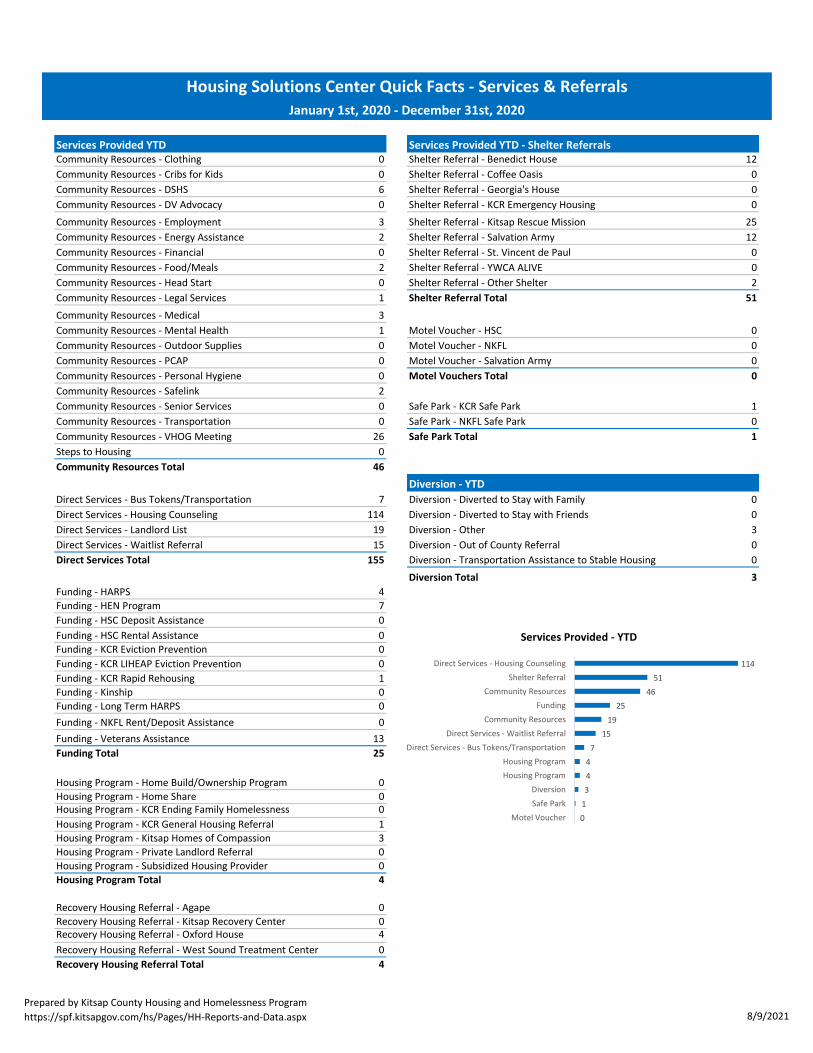
Community Resources ‐ Clothing 0 Shelter Referral ‐ Benedict House 12Community Resources ‐ Cribs for Kids 0 Shelter Referral ‐ Coffee Oasis 0Community Resources ‐ DSHS 6 Shelter Referral ‐ Georgia's House 0Community Resources ‐ DV Advocacy 0 Shelter Referral ‐ KCR Emergency Housing 0Community Resources ‐ Employment 3 Shelter Referral ‐ Kitsap Rescue Mission 25Community Resources ‐ Energy Assistance 2 Shelter Referral ‐ Salvation Army 12Community Resources ‐ Financial 0 Shelter Referral ‐ St. Vincent de Paul 0Community Resources ‐ Food/Meals 2 Shelter Referral ‐ YWCA ALIVE 0Community Resources ‐ Head Start 0 Shelter Referral ‐ Other Shelter 2Community Resources ‐ Legal Services 1 Shelter Referral Total 51
Community Resources ‐ Medical 3Community Resources ‐ Mental Health 1 Motel Voucher ‐ HSC 0Community Resources ‐ Outdoor Supplies 0 Motel Voucher ‐ NKFL 0Community Resources ‐ PCAP 0 Motel Voucher ‐ Salvation Army 0Community Resources ‐ Personal Hygiene 0 Motel Vouchers Total 0
Community Resources ‐ Safelink 2Community Resources ‐ Senior Services 0 Safe Park ‐ KCR Safe Park 1Community Resources ‐ Transportation 0 Safe Park ‐ NKFL Safe Park 0Community Resources ‐ VHOG Meeting 26 Safe Park Total 1
Steps to Housing 0Community Resources Total 46
Direct Services ‐ Bus Tokens/Transportation 7 Diversion ‐ Diverted to Stay with Family 0Direct Services ‐ Housing Counseling 114 Diversion ‐ Diverted to Stay with Friends 0Direct Services ‐ Landlord List 19 Diversion ‐ Other 3Direct Services ‐ Waitlist Referral 15 Diversion ‐ Out of County Referral 0Direct Services Total 155 Diversion ‐ Transportation Assistance to Stable Housing 0
Diversion Total 3
Funding ‐ HARPS 4Funding ‐ HEN Program 7Funding ‐ HSC Deposit Assistance 0Funding ‐ HSC Rental Assistance 0Funding ‐ KCR Eviction Prevention 0 Direct Serv 114 1 Direct Servic 114Funding ‐ KCR LIHEAP Eviction Prevention 0 Shelter Ref 51 2 Shelter Refe 51Funding ‐ KCR Rapid Rehousing 1 Direct Serv 19 3 Community 46Funding ‐ Kinship 0 Funding 25 4 Funding 25Funding ‐ Long Term HARPS 0 Communit 46 5 Community 19Funding ‐ NKFL Rent/Deposit Assistance 0 Direct Serv 15 6 Direct Servic 15Funding ‐ Veterans Assistance 13 Direct Serv 7 7 Direct Servic 7Funding Total 25 Diversion 3 8 Housing Pro 4
Housing Pr 4 9 Housing Pro 4Housing Program ‐ Home Build/Ownership Program 0 Recovery H 4 10 Diversion 3Housing Program ‐ Home Share 0 Safe Park 1 11 Safe Park 1Housing Program ‐ KCR Ending Family Homelessness 0 Motel Vou 0 12 Motel Vouch 0Housing Program ‐ KCR General Housing Referral 1Housing Program ‐ Kitsap Homes of Compassion 3Housing Program ‐ Private Landlord Referral 0Housing Program ‐ Subsidized Housing Provider 0Housing Program Total 4
Recovery Housing Referral ‐ Agape 0Recovery Housing Referral ‐ Kitsap Recovery Center 0Recovery Housing Referral ‐ Oxford House 4Recovery Housing Referral ‐ West Sound Treatment Center 0Recovery Housing Referral Total 4
Diversion ‐ YTD
Services Provided YTD Services Provided YTD ‐ Shelter Referrals
January 1st, 2020 ‐ December 31st, 2020
Housing Solutions Center Quick Facts ‐ Services & Referrals
11451
4625
1915
744310
Direct Services ‐ Housing CounselingShelter Referral
Community ResourcesFunding
Community ResourcesDirect Services ‐ Waitlist Referral
Direct Services ‐ Bus Tokens/TransportationHousing ProgramHousing Program
DiversionSafe Park
Motel Voucher
Services Provided ‐ YTD
Prepared by Kitsap County Housing and Homelessness Programhttps://spf.kitsapgov.com/hs/Pages/HH‐Reports‐and‐Data.aspx 8/9/2021
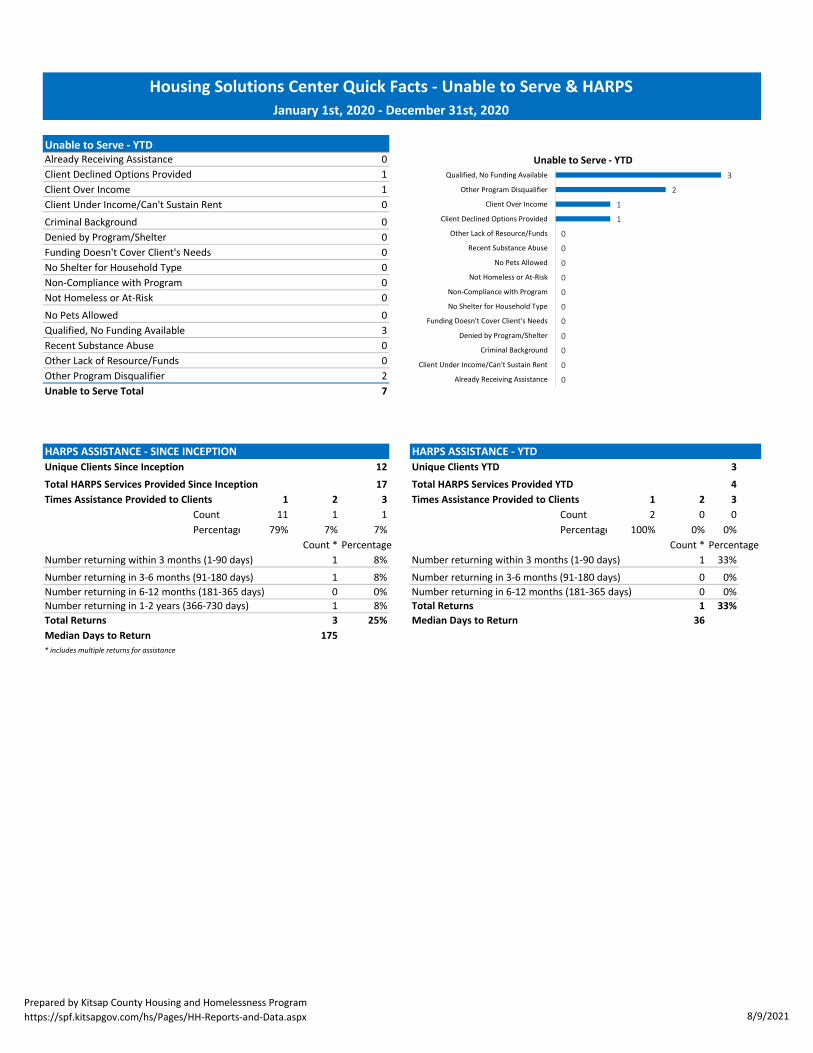
Already Receiving Assistance 0 ### 1 3.0012 Qualified, N 3Client Declined Options Provided 1 ### 2 2.0015 Other Prog 2Client Over Income 1 ### 3 1.0003 Client Over 1Client Under Income/Can't Sustain Rent 0 ### 4 1.0002 Client Decl 1Criminal Background 0 ### 5 0.0014 Other Lack 0Denied by Program/Shelter 0 ### 6 0.0013 Recent Sub 0Funding Doesn't Cover Client's Needs 0 ### 7 0.0011 No Pets All 0No Shelter for Household Type 0 ### 8 0.001 Not Homel 0Non‐Compliance with Program 0 ### 9 0.0009 Non‐Comp 0Not Homeless or At‐Risk 0 ### 10 0.0008 No Shelter 0No Pets Allowed 0 ### 11 0.0007 Funding Do 0Qualified, No Funding Available 3 ### 12 0.0006 Denied by 0Recent Substance Abuse 0 ### 13 0.0005 Criminal Ba 0Other Lack of Resource/Funds 0 ### 14 0.0004 Client Und 0Other Program Disqualifier 2 ### 15 0.0001 Already Re 0Unable to Serve Total 7
HARPS ASSISTANCE ‐ SINCE INCEPTION HARPS ASSISTANCE ‐ YTD
Unique Clients Since Inception 12 Unique Clients YTD 3
Total HARPS Services Provided Since Inception 17 Total HARPS Services Provided YTD 4
Times Assistance Provided to Clients 1 2 3 Times Assistance Provided to Clients 1 2 3
Count 11 1 1 Count 2 0 0Percentage 79% 7% 7% Percentage 100% 0% 0%
Count * Percentage Count * PercentageNumber returning within 3 months (1‐90 days) 1 8% Number returning within 3 months (1‐90 days) 1 33%Number returning in 3‐6 months (91‐180 days) 1 8% Number returning in 3‐6 months (91‐180 days) 0 0%Number returning in 6‐12 months (181‐365 days) 0 0% Number returning in 6‐12 months (181‐365 days) 0 0%Number returning in 1‐2 years (366‐730 days) 1 8% Total Returns 1 33%
Total Returns 3 25% Median Days to Return 36
Median Days to Return 175
* includes multiple returns for assistance
Unable to Serve ‐ YTD
January 1st, 2020 ‐ December 31st, 2020
Housing Solutions Center Quick Facts ‐ Unable to Serve & HARPS
3
2
1
1
0
0
0
0
0
0
0
0
0
0
0
Qualified, No Funding Available
Other Program Disqualifier
Client Over Income
Client Declined Options Provided
Other Lack of Resource/Funds
Recent Substance Abuse
No Pets Allowed
Not Homeless or At‐Risk
Non‐Compliance with Program
No Shelter for Household Type
Funding Doesn't Cover Client's Needs
Denied by Program/Shelter
Criminal Background
Client Under Income/Can't Sustain Rent
Already Receiving Assistance
Unable to Serve ‐ YTD
Prepared by Kitsap County Housing and Homelessness Programhttps://spf.kitsapgov.com/hs/Pages/HH‐Reports‐and‐Data.aspx 8/9/2021
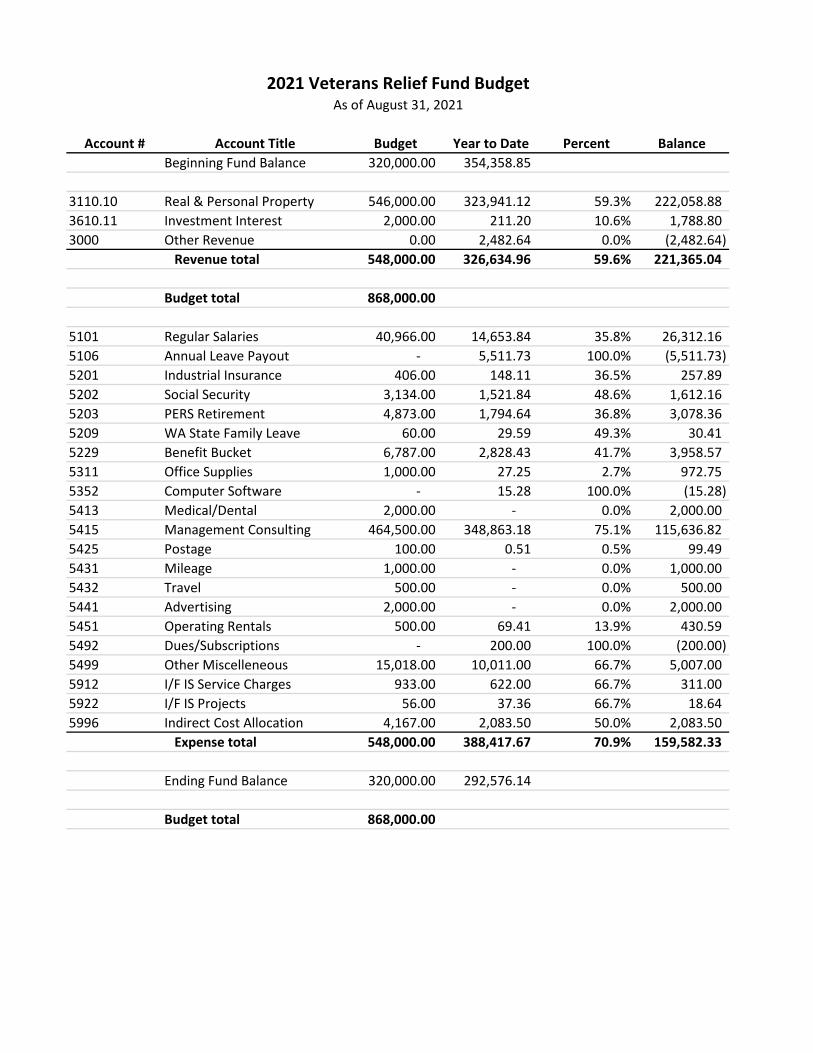
Account # Account Title Budget Year to Date Percent BalanceBeginning Fund Balance 320,000.00 354,358.85
3110.10 Real & Personal Property 546,000.00 323,941.12 59.3% 222,058.88 3610.11 Investment Interest 2,000.00 211.20 10.6% 1,788.80 3000 Other Revenue 0.00 2,482.64 0.0% (2,482.64)
Revenue total 548,000.00 326,634.96 59.6% 221,365.04
Budget total 868,000.00
5101 Regular Salaries 40,966.00 14,653.84 35.8% 26,312.16 5106 Annual Leave Payout - 5,511.73 100.0% (5,511.73) 5201 Industrial Insurance 406.00 148.11 36.5% 257.89 5202 Social Security 3,134.00 1,521.84 48.6% 1,612.16 5203 PERS Retirement 4,873.00 1,794.64 36.8% 3,078.36 5209 WA State Family Leave 60.00 29.59 49.3% 30.41 5229 Benefit Bucket 6,787.00 2,828.43 41.7% 3,958.57 5311 Office Supplies 1,000.00 27.25 2.7% 972.75 5352 Computer Software - 15.28 100.0% (15.28) 5413 Medical/Dental 2,000.00 - 0.0% 2,000.00 5415 Management Consulting 464,500.00 348,863.18 75.1% 115,636.82 5425 Postage 100.00 0.51 0.5% 99.49 5431 Mileage 1,000.00 - 0.0% 1,000.00 5432 Travel 500.00 - 0.0% 500.00 5441 Advertising 2,000.00 - 0.0% 2,000.00 5451 Operating Rentals 500.00 69.41 13.9% 430.59 5492 Dues/Subscriptions - 200.00 100.0% (200.00) 5499 Other Miscelleneous 15,018.00 10,011.00 66.7% 5,007.00 5912 I/F IS Service Charges 933.00 622.00 66.7% 311.00 5922 I/F IS Projects 56.00 37.36 66.7% 18.64 5996 Indirect Cost Allocation 4,167.00 2,083.50 50.0% 2,083.50
Expense total 548,000.00 388,417.67 70.9% 159,582.33
Ending Fund Balance 320,000.00 292,576.14
Budget total 868,000.00
2021 Veterans Relief Fund BudgetAs of August 31, 2021
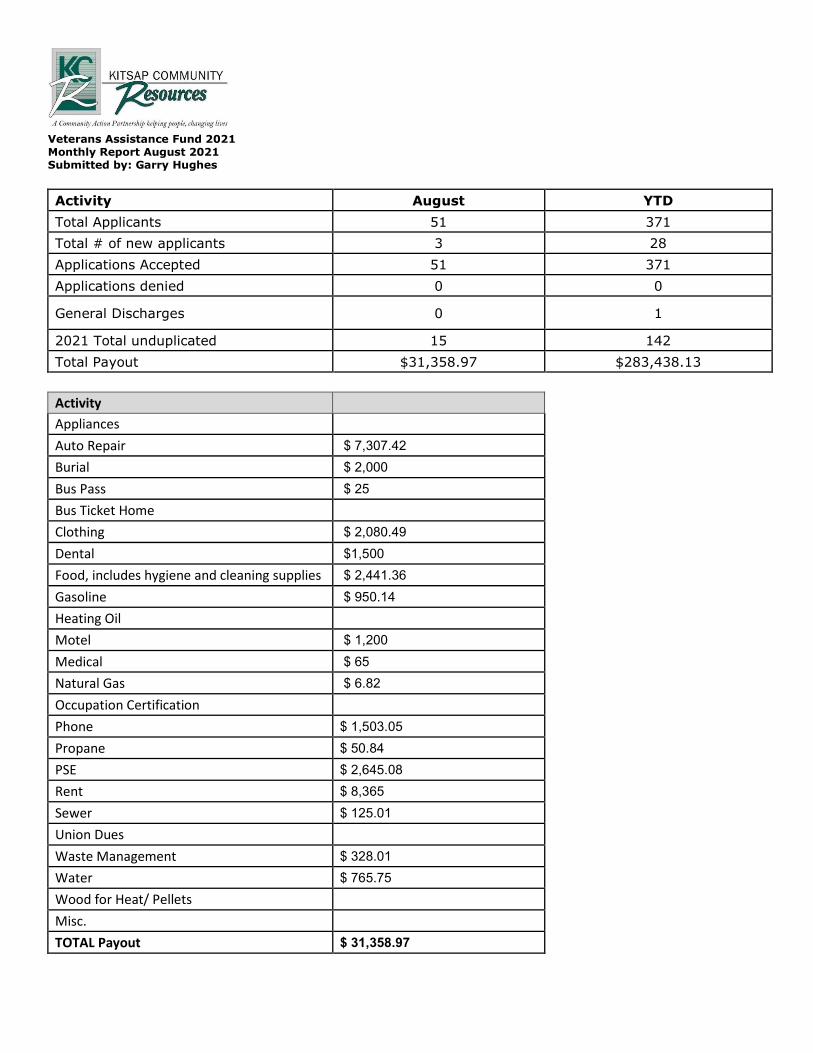
Veterans Assistance Fund 2021 Monthly Report August 2021 Submitted by: Garry Hughes Activity August YTD Total Applicants 51 371 Total # of new applicants 3 28 Applications Accepted 51 371 Applications denied 0 0
General Discharges 0 1
2021 Total unduplicated 15 142 Total Payout $31,358.97 $283,438.13
Activity
Appliances
Auto Repair $ 7,307.42 Burial $ 2,000 Bus Pass $ 25 Bus Ticket Home Clothing $ 2,080.49 Dental $1,500 Food, includes hygiene and cleaning supplies $ 2,441.36 Gasoline $ 950.14 Heating Oil
Motel $ 1,200 Medical $ 65 Natural Gas $ 6.82 Occupation Certification Phone $ 1,503.05 Propane $ 50.84 PSE $ 2,645.08 Rent $ 8,365 Sewer $ 125.01 Union Dues Waste Management $ 328.01 Water $ 765.75 Wood for Heat/ Pellets
Misc. TOTAL Payout $ 31,358.97
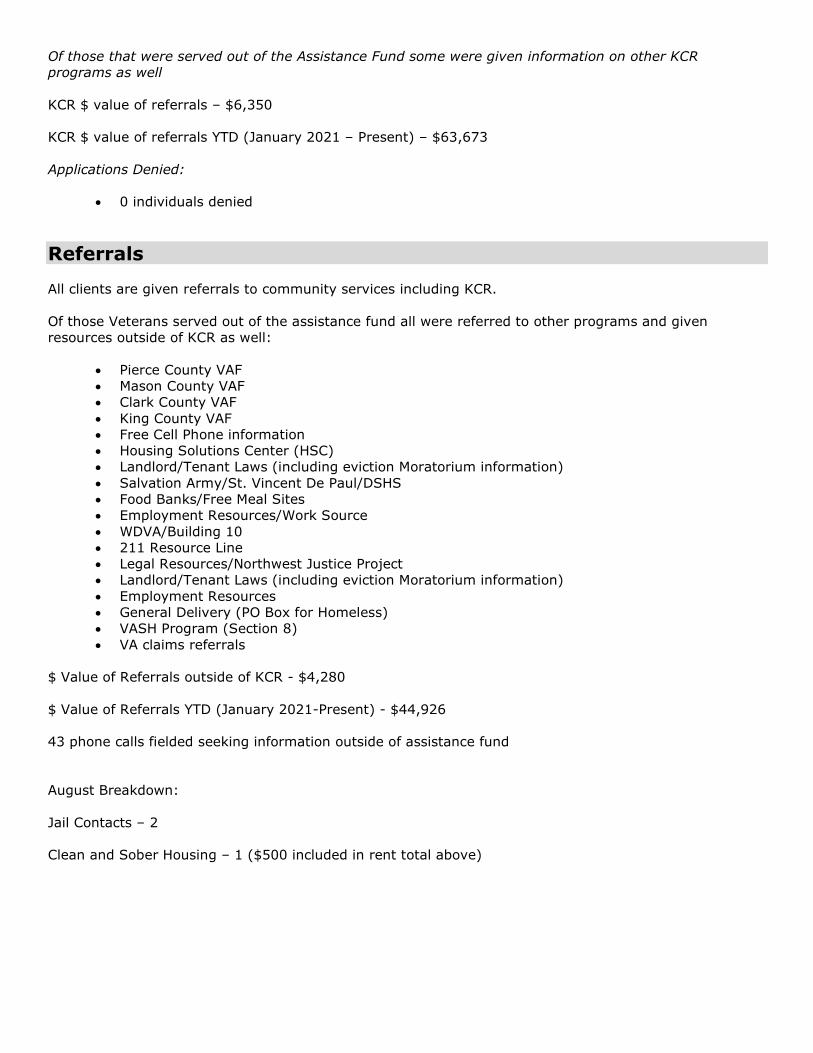
Of those that were served out of the Assistance Fund some were given information on other KCR programs as well KCR $ value of referrals – $6,350 KCR $ value of referrals YTD (January 2021 – Present) – $63,673 Applications Denied:
• 0 individuals denied
Referrals All clients are given referrals to community services including KCR. Of those Veterans served out of the assistance fund all were referred to other programs and given resources outside of KCR as well:
• Pierce County VAF • Mason County VAF • Clark County VAF • King County VAF • Free Cell Phone information • Housing Solutions Center (HSC) • Landlord/Tenant Laws (including eviction Moratorium information) • Salvation Army/St. Vincent De Paul/DSHS • Food Banks/Free Meal Sites • Employment Resources/Work Source • WDVA/Building 10 • 211 Resource Line • Legal Resources/Northwest Justice Project • Landlord/Tenant Laws (including eviction Moratorium information) • Employment Resources • General Delivery (PO Box for Homeless) • VASH Program (Section 8) • VA claims referrals
$ Value of Referrals outside of KCR - $4,280 $ Value of Referrals YTD (January 2021-Present) - $44,926 43 phone calls fielded seeking information outside of assistance fund August Breakdown: Jail Contacts – 2 Clean and Sober Housing – 1 ($500 included in rent total above)
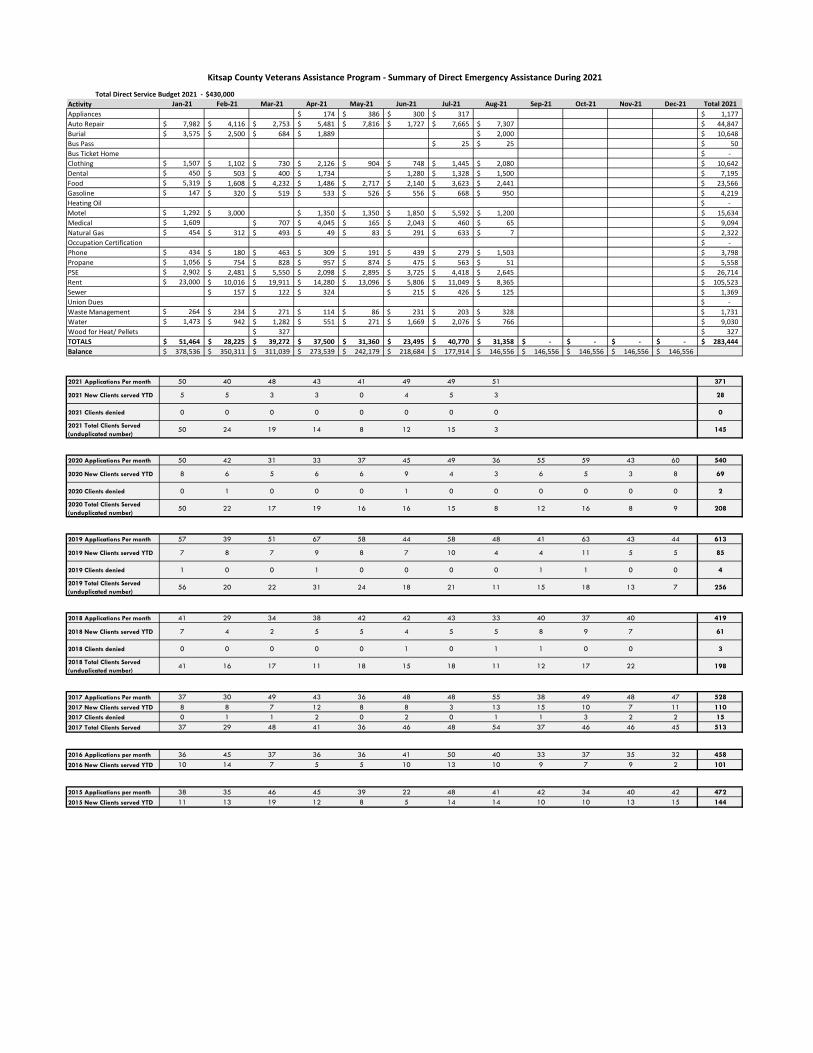
$430,000Activity Jan-21 Feb-21 Mar-21 Apr-21 May-21 Jun-21 Jul-21 Aug-21 Sep-21 Oct-21 Nov-21 Dec-21 Total 2021Appliances 174$ 386$ 300$ 317$ 1,177$ Auto Repair 7,982$ 4,116$ 2,753$ 5,481$ 7,816$ 1,727$ 7,665$ 7,307$ 44,847$ Burial 3,575$ 2,500$ 684$ 1,889$ 2,000$ 10,648$ Bus Pass 25$ 25$ 50$ Bus Ticket Home -$ Clothing 1,507$ 1,102$ 730$ 2,126$ 904$ 748$ 1,445$ 2,080$ 10,642$ Dental 450$ 503$ 400$ 1,734$ 1,280$ 1,328$ 1,500$ 7,195$ Food 5,319$ 1,608$ 4,232$ 1,486$ 2,717$ 2,140$ 3,623$ 2,441$ 23,566$ Gasoline 147$ 320$ 519$ 533$ 526$ 556$ 668$ 950$ 4,219$ Heating Oil -$ Motel 1,292$ 3,000$ 1,350$ 1,350$ 1,850$ 5,592$ 1,200$ 15,634$ Medical 1,609$ 707$ 4,045$ 165$ 2,043$ 460$ 65$ 9,094$ Natural Gas 454$ 312$ 493$ 49$ 83$ 291$ 633$ 7$ 2,322$ Occupation Certification -$ Phone 434$ 180$ 463$ 309$ 191$ 439$ 279$ 1,503$ 3,798$ Propane 1,056$ 754$ 828$ 957$ 874$ 475$ 563$ 51$ 5,558$ PSE 2,902$ 2,481$ 5,550$ 2,098$ 2,895$ 3,725$ 4,418$ 2,645$ 26,714$ Rent 23,000$ 10,016$ 19,911$ 14,280$ 13,096$ 5,806$ 11,049$ 8,365$ 105,523$ Sewer 157$ 122$ 324$ 215$ 426$ 125$ 1,369$ Union Dues -$ Waste Management 264$ 234$ 271$ 114$ 86$ 231$ 203$ 328$ 1,731$ Water 1,473$ 942$ 1,282$ 551$ 271$ 1,669$ 2,076$ 766$ 9,030$ Wood for Heat/ Pellets 327$ 327$ TOTALS 51,464$ 28,225$ 39,272$ 37,500$ 31,360$ 23,495$ 40,770$ 31,358$ -$ -$ -$ -$ 283,444$ Balance 378,536$ 350,311$ 311,039$ 273,539$ 242,179$ 218,684$ 177,914$ 146,556$ 146,556$ 146,556$ 146,556$ 146,556$
2021 Applications Per month 50 40 48 43 41 49 49 51 371
2021 New Clients served YTD 5 5 3 3 0 4 5 3 28
2021 Clients denied 0 0 0 0 0 0 0 0 0
2021 Total Clients Served (unduplicated number)
50 24 19 14 8 12 15 3 145
2020 Applications Per month 50 42 31 33 37 45 49 36 55 59 43 60 540
2020 New Clients served YTD 8 6 5 6 6 9 4 3 6 5 3 8 69
2020 Clients denied 0 1 0 0 0 1 0 0 0 0 0 0 2
2020 Total Clients Served (unduplicated number)
50 22 17 19 16 16 15 8 12 16 8 9 208
2019 Applications Per month 57 39 51 67 58 44 58 48 41 63 43 44 613
2019 New Clients served YTD 7 8 7 9 8 7 10 4 4 11 5 5 85
2019 Clients denied 1 0 0 1 0 0 0 0 1 1 0 0 4
2019 Total Clients Served (unduplicated number)
56 20 22 31 24 18 21 11 15 18 13 7 256
2018 Applications Per month 41 29 34 38 42 42 43 33 40 37 40 419
2018 New Clients served YTD 7 4 2 5 5 4 5 5 8 9 7 61
2018 Clients denied 0 0 0 0 0 1 0 1 1 0 0 3
2018 Total Clients Served (unduplicated number)
41 16 17 11 18 15 18 11 12 17 22 198
2017 Applications Per month 37 30 49 43 36 48 48 55 38 49 48 47 5282017 New Clients served YTD 8 8 7 12 8 8 3 13 15 10 7 11 1102017 Clients denied 0 1 1 2 0 2 0 1 1 3 2 2 152017 Total Clients Served 37 29 48 41 36 46 48 54 37 46 46 45 513
2016 Applications per month 36 45 37 36 36 41 50 40 33 37 35 32 4582016 New Clients served YTD 10 14 7 5 5 10 13 10 9 7 9 2 101
2015 Applications per month 38 35 46 45 39 22 48 41 42 34 40 42 4722015 New Clients served YTD 11 13 19 12 8 5 14 14 10 10 13 15 144
Kitsap County Veterans Assistance Program - Summary of Direct Emergency Assistance During 2021
Total Direct Service Budget 2021 -