Embed Size (px)
Citation preview

Ethernet for the ATLAS SecondLevelTrigger
by
Franklin Saka
Royal Holloway College,PhysicsDepartment
University of London
2001
Thesissubmittedin accordance with therequirementsof
theUniversityof Londonfor thedegree of
Doctorof Philosophy

Abstract
In preparation for building the ATLAS second level trigger, various networks andprotocols
arebeing investigated. Advancement in EthernetLAN technology hasseenthe speedincrease
from 10 Mbit/s to 100Mbit/s and1 Gigabit/s. Thereareorganisations looking at takingEthernet
speedseven higher to 10 Gigabit/s. Theprice of 100 Mbit/s Ethernet hasfallen rapidly sinceits
introduction. Gigabit Ethernet pricesarealso foll owing the samepattern asproductsare taken
up by customerswishing to staywith theEthernettechnology but requiring higher speeds to run
the latestapplications. Theprice/performance/longevity anduniversality featuresof Ethernethas
madeit aninterestingtechnology for theATLAS second level trigger network.
Theaim of this work is to assessthetechnology in thecontext of theATLAS trigger anddata
acquisition system.Weinvestigatethetechnology andits implications. Weassesstheperformance
of contemporary, commodity, off-the-shelf Ethernetswitches/networks and interconnects. The
results of the performanceanalysis areusedto build switch models suchthat large ATLAS-like
networks canbe simulated andstudied. Finally, we thenlook at the feasibility andprospectfor
Ethernet in theATLAS second level triggerbasedoncurrentproductsandestimatesof thestateof
thetechnology in 2005, whenATLAS is scheduledto comeon line.
2

Acknowledgements
I would like to thankmy supervisors,JohnStrongandBob Dobinson for theopportunity to carry
out the work presented in this thesis, for their guidanceandadvice. I would also like to thank
the membersof the ATLAS community, Marcel Boosten, Krzysztof Korcyl, Stefan Haas,David
Thornley, RogerHeely, Marc Dobson, Brian Martin andother past andpresent membersof Bob
Dobinson’s group at CERNwith whomI waslucky enoughto work.
I amalsograteful to: PPARCfor funding thisPhD;my industrial sponsorsSGS-Thompson,in
particularthoseI workedwith (Gajinder Panesar andNeil Richards) for their helpandfriendship;
CERNandtheESPRIT projectsARCHES(projectno. 20693) andSWIFT.
I would like expressmy appreciation to: Antonia Dura “bueno paella” Martinez who was
therethrough the sleeplessnights (Graciaspor haber tenido paciencia); to Celestino “Celestial
Casanova” Canosa,wedid it Tino! Thanksalsoto Stefano“Teti” Caruso,Gabriela Susana“Chia-
paschica” Garcia,Teresa“belle potosina” Segovia, Micheal“you guys” Pragassen, Uma“Bala...
umski” Shanker, andRoy “jock strap”Gomezandall my other dearfriendsfor makingthejourney
moreinteresting.
Finally, to Ophelia, Sheila, Kelvin, Adil andtherestof my family, thank you for your contin-
uedencouragementsandsupport. To David, Maxwell, RachelandNatalie,I hopeyouwill achieve
anequivalentandmorein theyears to come.
This oneis dedicatedto my mother Evelyn who saw it all from thestart.Cheersmum.
3

4

Contents
1 Intr oduction 11
1.1 Physicsbackground . . . . . . . . . . . . . . . . . . . . . . . . . . . . . . . . . 12
1.2 TheATLAS Trigger/DAQ system . . . . . . . . . . . . . . . . . . . . . . . . . 12
1.3 Thelevel-2 trigger . . . . . . . . . . . . . . . . . . . . . . . . . . . . . . . . . 15
1.4 ThesisAim . . . . . . . . . . . . . . . . . . . . . . . . . . . . . . . . . . . . . 16
1.5 ThesisOutline . . . . . . . . . . . . . . . . . . . . . . . . . . . . . . . . . . . . 16
1.6 Context . . . . . . . . . . . . . . . . . . . . . . . . . . . . . . . . . . . . . . . 17
1.7 Contribution . . . . . . . . . . . . . . . . . . . . . . . . . . . . . . . . . . . . . 17
2 Requirementsfor the ATLAS secondlevel trigger 19
2.1 GeneralRequirements . . . . . . . . . . . . . . . . . . . . . . . . . . . . . . . 20
3 A Review of the Ethernet technology 25
3.1 Introduction . . . . . . . . . . . . . . . . . . . . . . . . . . . . . . . . . . . . . 26
3.2 History of Ethernet . . . . . . . . . . . . . . . . . . . . . . . . . . . . . . . . . 26
3.3 TheEthernettechnology . . . . . . . . . . . . . . . . . . . . . . . . . . . . . . 27
3.3.1 Relation to OSI referencemodel . . . . . . . . . . . . . . . . . . . . . . 28
3.3.2 Frameformat . . . . . . . . . . . . . . . . . . . . . . . . . . . . . . . . 29
3.3.3 Broadcastandmulticast . . . . . . . . . . . . . . . . . . . . . . . . . . 31
3.3.4 TheCSMA/CD protocol . . . . . . . . . . . . . . . . . . . . . . . . . . 31
3.3.5 Full andHalf duplex . . . . . . . . . . . . . . . . . . . . . . . . . . . . 32
3.3.6 Flow control . . . . . . . . . . . . . . . . . . . . . . . . . . . . . . . . 32
3.3.7 Current transmissionrates . . . . . . . . . . . . . . . . . . . . . . . . . 33
3.4 Connecting multiple Ethernet segments . . . . . . . . . . . . . . . . . . . . . . 34
3.4.1 Routers . . . . . . . . . . . . . . . . . . . . . . . . . . . . . . . . . . . 34
5

3.4.2 Repeatersandhubs . . . . . . . . . . . . . . . . . . . . . . . . . . . . . 35
3.4.3 Switchesandbridges . . . . . . . . . . . . . . . . . . . . . . . . . . . . 35
3.5 TheEthernetswitchStandards . . . . . . . . . . . . . . . . . . . . . . . . . . . 36
3.5.1 TheBridgeStandard . . . . . . . . . . . . . . . . . . . . . . . . . . . . 36
3.5.2 Virtual LANs (VLANs) . . . . . . . . . . . . . . . . . . . . . . . . . . 37
3.5.3 Quality of service (QoS) . . . . . . . . . . . . . . . . . . . . . . . . . . 38
3.5.4 Trunking . . . . . . . . . . . . . . . . . . . . . . . . . . . . . . . . . . 39
3.5.5 Higher layerswitching . . . . . . . . . . . . . . . . . . . . . . . . . . . 39
3.5.6 Switchmanagement . . . . . . . . . . . . . . . . . . . . . . . . . . . . 39
3.6 Reasonsfor Ethernet . . . . . . . . . . . . . . . . . . . . . . . . . . . . . . . . 40
3.7 Conclusion . . . . . . . . . . . . . . . . . . . . . . . . . . . . . . . . . . . . . 41
4 Network interfacing Performanceissues 43
4.1 Introduction . . . . . . . . . . . . . . . . . . . . . . . . . . . . . . . . . . . . . 44
4.2 Themeasurementsetup . . . . . . . . . . . . . . . . . . . . . . . . . . . . . . . 45
4.3 Thecomms1 measurementprocedures . . . . . . . . . . . . . . . . . . . . . . 46
4.4 TCP/IP protocol . . . . . . . . . . . . . . . . . . . . . . . . . . . . . . . . . . . 47
4.4.1 A brief introduction to TCP/IP . . . . . . . . . . . . . . . . . . . . . . . 47
4.4.2 Results with thedefault setup using FastEthernet. . . . . . . . . . . . . 50
4.4.3 Delayedacknowledgement disabled . . . . . . . . . . . . . . . . . . . . 55
4.4.4 Naglealgorithm anddelayed acknowledgement disabled . . . . . . . . . 55
4.4.5 A parameterisedmodelof TCP/IPcomms1 communication . . . . . . . 56
4.4.6 Effectsof thesocket sizeon theend-to-end latency . . . . . . . . . . . . 61
4.4.7 Results of CPUusage of comms1 with TCP . . . . . . . . . . . . . . . 62
4.4.8 Raw Ethernet . . . . . . . . . . . . . . . . . . . . . . . . . . . . . . . . 66
4.4.9 A parameterisedmodelof theCPUload . . . . . . . . . . . . . . . . . . 67
4.4.10 Conclusions for ATLAS . . . . . . . . . . . . . . . . . . . . . . . . . . 67
4.4.11 GigabitEthernet comparedwith FastEthernet. . . . . . . . . . . . . . . 68
4.4.12 Effectsof theprocessorspeed . . . . . . . . . . . . . . . . . . . . . . . 71
4.5 TCP/IP andATLAS . . . . . . . . . . . . . . . . . . . . . . . . . . . . . . . . . 72
4.5.1 Decision Latency . . . . . . . . . . . . . . . . . . . . . . . . . . . . . . 72
4.5.2 Request-responserateandCPUload . . . . . . . . . . . . . . . . . . . 73
4.5.3 Conclusionfor ATLAS . . . . . . . . . . . . . . . . . . . . . . . . . . . 75
6

4.6 MESH . . . . . . . . . . . . . . . . . . . . . . . . . . . . . . . . . . . . . . . . 76
4.6.1 MESHcomms1 performance . . . . . . . . . . . . . . . . . . . . . . . 76
4.6.2 Scalability in MESH . . . . . . . . . . . . . . . . . . . . . . . . . . . . 79
4.7 Conclusion . . . . . . . . . . . . . . . . . . . . . . . . . . . . . . . . . . . . . 81
4.8 Furtherwork . . . . . . . . . . . . . . . . . . . . . . . . . . . . . . . . . . . . 81
5 Ethernet Network topologiesand possibleenhancementsfor ATLAS 83
5.1 Introduction . . . . . . . . . . . . . . . . . . . . . . . . . . . . . . . . . . . . . 84
5.2 Scalablenetworks with standardEthernet . . . . . . . . . . . . . . . . . . . . . 84
5.3 Constructing arbitrary network architectureswith Ethernet . . . . . . . . . . . . 87
5.3.1 TheSpanning TreeAlgorithm . . . . . . . . . . . . . . . . . . . . . . . 87
5.3.2 Learning andtheForwarding table . . . . . . . . . . . . . . . . . . . . 88
5.3.3 BroadcastandMulticast for arbitrary networks . . . . . . . . . . . . . . 89
5.3.4 PathRedundancy . . . . . . . . . . . . . . . . . . . . . . . . . . . . . . 92
5.4 Outlook . . . . . . . . . . . . . . . . . . . . . . . . . . . . . . . . . . . . . . . 93
5.5 Conclusions . . . . . . . . . . . . . . . . . . . . . . . . . . . . . . . . . . . . . 94
6 The Ethernet testbedmeasurement software and clock synchronisation 97
6.1 Introduction . . . . . . . . . . . . . . . . . . . . . . . . . . . . . . . . . . . . . 98
6.2 Goals . . . . . . . . . . . . . . . . . . . . . . . . . . . . . . . . . . . . . . . . 98
6.2.1 An example measurement . . . . . . . . . . . . . . . . . . . . . . . . . 99
6.3 Designdecisions . . . . . . . . . . . . . . . . . . . . . . . . . . . . . . . . . . 100
6.3.1 Testbedsetup . . . . . . . . . . . . . . . . . . . . . . . . . . . . . . . . 100
6.3.2 TheTraffic Generator program . . . . . . . . . . . . . . . . . . . . . . . 101
6.3.3 Theusageof MESHin theETB software . . . . . . . . . . . . . . . . . 101
6.4 synchronising PCclocks . . . . . . . . . . . . . . . . . . . . . . . . . . . . . . 104
6.4.1 Method . . . . . . . . . . . . . . . . . . . . . . . . . . . . . . . . . . . 104
6.4.2 Factorsaffecting synchronisationaccuracy . . . . . . . . . . . . . . . . 105
6.4.3 Clock drift andskew . . . . . . . . . . . . . . . . . . . . . . . . . . . . 106
6.4.4 Temperature dependency on thesynchronisation . . . . . . . . . . . . . 109
6.4.5 Integrating clock synchronisation andmeasurements . . . . . . . . . . . 110
6.4.6 Conditionsfor bestsynchronisation . . . . . . . . . . . . . . . . . . . . 110
6.4.7 Summaryof clock accuracy . . . . . . . . . . . . . . . . . . . . . . . . 112
7

6.5 Measurementsprocedure . . . . . . . . . . . . . . . . . . . . . . . . . . . . . . 114
6.5.1 Configurationfiles . . . . . . . . . . . . . . . . . . . . . . . . . . . . . 114
6.5.2 Thetransmitter andreceiver . . . . . . . . . . . . . . . . . . . . . . . . 117
6.6 Considerations in using ETB . . . . . . . . . . . . . . . . . . . . . . . . . . . . 122
6.7 Possibleimprovements . . . . . . . . . . . . . . . . . . . . . . . . . . . . . . . 123
6.8 Strengths andlimitationsof ETB . . . . . . . . . . . . . . . . . . . . . . . . . 123
6.9 Commercialtesters . . . . . . . . . . . . . . . . . . . . . . . . . . . . . . . . . 124
6.10 PriceComparison . . . . . . . . . . . . . . . . . . . . . . . . . . . . . . . . . . 125
6.11 Conclusions . . . . . . . . . . . . . . . . . . . . . . . . . . . . . . . . . . . . . 126
7 Analysis of testbedmeasurements 127
7.1 Introduction . . . . . . . . . . . . . . . . . . . . . . . . . . . . . . . . . . . . . 128
7.2 Contemporary Ethernet switcharchitectures . . . . . . . . . . . . . . . . . . . . 128
7.2.1 Operating modes . . . . . . . . . . . . . . . . . . . . . . . . . . . . . . 129
7.2.2 Switching Fabrics. . . . . . . . . . . . . . . . . . . . . . . . . . . . . . 130
7.2.3 Buffering . . . . . . . . . . . . . . . . . . . . . . . . . . . . . . . . . . 132
7.3 Modelling approach. . . . . . . . . . . . . . . . . . . . . . . . . . . . . . . . . 132
7.4 Switchmodelling . . . . . . . . . . . . . . . . . . . . . . . . . . . . . . . . . . 134
7.4.1 Introduction . . . . . . . . . . . . . . . . . . . . . . . . . . . . . . . . . 134
7.4.2 Theparameterisedmodel . . . . . . . . . . . . . . . . . . . . . . . . . . 134
7.4.3 Principlesof operationof theparameterisedmodel . . . . . . . . . . . . 136
7.5 Conclusion . . . . . . . . . . . . . . . . . . . . . . . . . . . . . . . . . . . . . 138
7.6 Characterising Ethernet switchesandmeasuring modelparameters. . . . . . . . 138
7.6.1 End-to-EndLatency (Comms1) . . . . . . . . . . . . . . . . . . . . . . 138
7.6.2 Basicstreaming . . . . . . . . . . . . . . . . . . . . . . . . . . . . . . 141
7.6.3 Testingtheswitching fabricarchitecture . . . . . . . . . . . . . . . . . 142
7.6.4 Testingbroadcastsandmulticast . . . . . . . . . . . . . . . . . . . . . 147
7.6.5 Assessingthesizesof theinput andoutput buffers . . . . . . . . . . . . 148
7.6.6 Testingquality of service (QoS)andVLAN features . . . . . . . . . . . 150
7.6.7 Multi -switchmeasurements . . . . . . . . . . . . . . . . . . . . . . . . 153
7.6.8 Saturating Gigabit links . . . . . . . . . . . . . . . . . . . . . . . . . . 156
7.7 Conclusions . . . . . . . . . . . . . . . . . . . . . . . . . . . . . . . . . . . . . 159
8

8 Parameters for contemporary Ethernet switches 161
8.1 Introduction . . . . . . . . . . . . . . . . . . . . . . . . . . . . . . . . . . . . . 162
8.2 Validation of theparameterised model . . . . . . . . . . . . . . . . . . . . . . . 162
8.2.1 Parameters for theTurboswitch 2000 . . . . . . . . . . . . . . . . . . . 162
8.2.2 Testingtheparameterisation on theIntel 550T. . . . . . . . . . . . . . . 166
8.3 Conclusions . . . . . . . . . . . . . . . . . . . . . . . . . . . . . . . . . . . . . 168
8.4 Performance andparametersof contemporaryEthernet switches . . . . . . . . . 170
8.4.1 Switchestested . . . . . . . . . . . . . . . . . . . . . . . . . . . . . . . 170
8.4.2 BroadcastandMulticast . . . . . . . . . . . . . . . . . . . . . . . . . . 173
8.4.3 Trunking on theTitan T4 . . . . . . . . . . . . . . . . . . . . . . . . . . 174
8.4.4 Jumboframes. . . . . . . . . . . . . . . . . . . . . . . . . . . . . . . . 175
8.4.5 Switchmanagement . . . . . . . . . . . . . . . . . . . . . . . . . . . . 175
8.5 Conclusions . . . . . . . . . . . . . . . . . . . . . . . . . . . . . . . . . . . . . 176
9 Conclusions 177
9.1 Achievements . . . . . . . . . . . . . . . . . . . . . . . . . . . . . . . . . . . . 178
9.2 Considerations in using Ethernet for theATLAS LVL2 trigger/DAQ network . . 178
9.2.1 Nodes . . . . . . . . . . . . . . . . . . . . . . . . . . . . . . . . . . . . 179
9.2.2 Competing technologies . . . . . . . . . . . . . . . . . . . . . . . . . . 184
9.2.3 Futurework . . . . . . . . . . . . . . . . . . . . . . . . . . . . . . . . . 185
9.2.4 Summaryandconclusions . . . . . . . . . . . . . . . . . . . . . . . . . 185
9.3 Outlook . . . . . . . . . . . . . . . . . . . . . . . . . . . . . . . . . . . . . . . 185
A Glossary of networking terms 189
B MESH Overview 193
C The architecture of a contemporary Ethernet switch 197
C.1 Introduction . . . . . . . . . . . . . . . . . . . . . . . . . . . . . . . . . . . . . 198
C.2 TheCPUmodule . . . . . . . . . . . . . . . . . . . . . . . . . . . . . . . . . . 198
C.3 TheCAM andLogic module . . . . . . . . . . . . . . . . . . . . . . . . . . . . 200
C.4 TheMatrix Module . . . . . . . . . . . . . . . . . . . . . . . . . . . . . . . . . 202
C.5 TheI/O modules . . . . . . . . . . . . . . . . . . . . . . . . . . . . . . . . . . 202
C.6 Theswitchoperation . . . . . . . . . . . . . . . . . . . . . . . . . . . . . . . . 203
9

C.7 Frameordering . . . . . . . . . . . . . . . . . . . . . . . . . . . . . . . . . . . 205
C.8 Addressaging andpacket lifetime . . . . . . . . . . . . . . . . . . . . . . . . . 207
C.9 Conclusions . . . . . . . . . . . . . . . . . . . . . . . . . . . . . . . . . . . . . 207
D A full description of the parameters for modelling switches 209
10

List of Tables
3.1 Network diameteror maximumdistancesfor threeflavoursof Ethernetonvarious
media . . . . . . . . . . . . . . . . . . . . . . . . . . . . . . . . . . . . . . . . 27
4.1 A comparisonof theMESHandTCP/IPoverheadsperbyteandfixedoverheads 77
4.2 A comparisonof theMESHandTCP/IPfixedCPUoverheadandfixedCPUover-
headperping-pong . . . . . . . . . . . . . . . . . . . . . . . . . . . . . . . . . 78
6.1 Thedeviation in clocks for FastandGigabitEthernetasa function of thewarmup
time. In microsecondsperminute. . . . . . . . . . . . . . . . . . . . . . . . . . 113
6.2 Thelist of commands for theconfiguration of theETB nodes. . . . . . . . . . . 114
6.3 An example synchronisationresult asstoredin global clocks file for six nodes. . 116
6.4 Thecommandsfor measurementinitialisation. . . . . . . . . . . . . . . . . . . 117
6.5 An example of theoutput of anETB transmitter. . . . . . . . . . . . . . . . . . 118
6.6 An exampleof theanETB receiver output. This shows thatnode 0 wastransmit-
ting to node1 framesof 250bytes. Theachievedthroughput was24.24MBytes/s
andtheaveragelatency was9782 � s. . . . . . . . . . . . . . . . . . . . . . . . 121
8.1 Model parameters for the Turboswitch 2000Ethernet switches. The parameters
obtained from the ping-pongmeasurementaremarked with�
. The parameters
obtainedfrom thevendorsaremarkedwith�
. Theparametersobtainedfrom the
streaming measurement are marked with�
(the maximumbandwidth for 1500
Bytesis given). . . . . . . . . . . . . . . . . . . . . . . . . . . . . . . . . . . . 163
8.2 Model parameters for the Intel 550T Ethernet switches. Theparametersobtained
from the ping-pongmeasurementaremarked with�
. The parametersobtained
from thestreamingmeasurementaremarkedwith�
(themaximumbandwidth for
1500Bytesis given). NA impliesnot applicable. . . . . . . . . . . . . . . . . . 169
11

8.3 Model parametersfor various Ethernet switches. The parametersobtained from
the ping-pong measurementaremarked with�
. The parametersobtained from
thevendorsaremarkedwith�
. Theparametersobtainedfrom thestreamingmea-
surement aremarked with�
(the maximumbandwidth for 1500 Bytesis given).
NA=not applicable. . . . . . . . . . . . . . . . . . . . . . . . . . . . . . . . . . 171
12

List of Figures
1.1 A schematic of theATLAS detector. . . . . . . . . . . . . . . . . . . . . . . . . 13
1.2 TheThreelevelsof theATLAS trigger/DAQ . . . . . . . . . . . . . . . . . . . 14
1.3 TheproposedLVL2 architecture. . . . . . . . . . . . . . . . . . . . . . . . . . 15
2.1 Thesetupof theATLAS LVL2 trigger network. . . . . . . . . . . . . . . . . . . 23
3.1 Thehistory of theEthernet technology . . . . . . . . . . . . . . . . . . . . . . . 27
3.2 An illustration of a segmentor collision domain . . . . . . . . . . . . . . . . . . 28
3.3 Ethernetandhow it fits into theOSI 7 layermodel. . . . . . . . . . . . . . . . . 29
3.4 Theformatof theoriginal EthernetFrame. . . . . . . . . . . . . . . . . . . . . 30
3.5 Theformatof thenew EthernetFramewith support for VLA Ns andeightpriority
levels. . . . . . . . . . . . . . . . . . . . . . . . . . . . . . . . . . . . . . . . . 30
3.6 Theformatof thefull duplex Ethernet pauseframe. . . . . . . . . . . . . . . . . 33
3.7 An illustration of a hub. . . . . . . . . . . . . . . . . . . . . . . . . . . . . . . . 35
3.8 A network with two segments connectedby a Bridge. . . . . . . . . . . . . . . . 37
3.9 Thecostof FastandGigabitEthernet NICs andswitchesasa function of time. . . 41
4.1 ThePCsystemarchitecture. . . . . . . . . . . . . . . . . . . . . . . . . . . . . 44
4.2 An illustration of theprotocolsin relation to eachother. . . . . . . . . . . . . . 45
4.3 Thecomms1 setup. . . . . . . . . . . . . . . . . . . . . . . . . . . . . . . . . 47
4.4 Themodelof theTCP/IPprotocol. . . . . . . . . . . . . . . . . . . . . . . . . 48
4.5 Comms1 underTCP/IP. The default setup: CPU = Pentium233 MHz; MMX
OS=Linux2.0.27 . . . . . . . . . . . . . . . . . . . . . . . . . . . . . . . . . . 51
4.6 An illustration of the comms1 exerciseinvolving the exchange of oneTCPseg-
ments(not to scale). . . . . . . . . . . . . . . . . . . . . . . . . . . . . . . . . 52
13

4.7 An illustration of the comms1 exerciseinvolving the exchangeof two TCPseg-
ments(not to scale). . . . . . . . . . . . . . . . . . . . . . . . . . . . . . . . . 53
4.8 An illustrationof thecomms1 exerciseinvolving theexchangeof threeTCPseg-
ments(not to scale). . . . . . . . . . . . . . . . . . . . . . . . . . . . . . . . . 54
4.9 Comms1 under TCP/IP: CPU= Pentium200 MHz MMX: Naglealgorithm on:
Delayedacknowledgementdisabled: Socket size= 64 kBytesOS=Linux2.0.27 . 56
4.10 Measurementagainstparameterisedmodel. Comms1 underTCP/IP: CPU= Pen-
tium 200 MHz MMX: Naglealgorithm disabled: Delayedack disabled: Socket
size= 64 kBytes. OS=Linux2.0.27. . . . . . . . . . . . . . . . . . . . . . . . . 57
4.11 Theflow of themessage in thecomms1 exercise. . . . . . . . . . . . . . . . . . 58
4.12 Comms1 underTCP/IPfor varioussocketsizes: Delayed ackoff: Naglealgorithm
disabled: CPU = Pentium200 MHz MMX: Socket size= 64 kBytesOS=Linux
2.0.27 . . . . . . . . . . . . . . . . . . . . . . . . . . . . . . . . . . . . . . . . 61
4.13 Comms1 under TCP/IPwith CPU load measured: Delayedack disabled: CPU
= Pentium 200 MHz MMX: Naglealgorithm disabled: Socket size= 64 kBytes
OS=Linux2.0.27 . . . . . . . . . . . . . . . . . . . . . . . . . . . . . . . . . . 63
4.14 CPUusage from comms1 under TCP/IPwith CPUloadmeasured: Delayedack
disabled: CPU= Pentium 200MHz MMX: Naglealgorithmdisabled: Socketsize
= 64 kBytesOS=Linux2.0.27 . . . . . . . . . . . . . . . . . . . . . . . . . . . 64
4.15 A modelof theCPUidle andbusytime during thecomms1 measurements. . . . 64
4.16 Comms1 underTCP/IPandraw Ethernet socketswith CPUloadmeasured: CPU
= Pentium200 MHz MMX: Naglealgorithm disabled: Delayed ack on: Socket
size= 64 kBytesOS=Linux2.0.27 . . . . . . . . . . . . . . . . . . . . . . . . . 64
4.17 Themagnification of Figure4.16(b). Thelatency from comms1 underTCP/IPand
raw Ethernet socketswith CPUloadmeasured: CPU= Pentium200MHz MMX:
Naglealgorithm disabled: Delayed ack on: Socket size= 64 kBytes: OS=Linux
2.0.27 . . . . . . . . . . . . . . . . . . . . . . . . . . . . . . . . . . . . . . . . 65
4.18 Comms1 under TCP/IP and raw Ethernetsockets: CPU = Pentium 200 MHz
MMX: Naglealgorithm disabled:Delayedackon: Socketsize= 64kBytesOS=Linux
2.0.27 . . . . . . . . . . . . . . . . . . . . . . . . . . . . . . . . . . . . . . . . 65
14

4.19 Comms1 under TCP/IP for Fast and Gigabit Ethernet: Delayed ack on: CPU
usagemeasured: CPU = Pentium400 MHz: Naglealgorithm disabled: Socket
size= 64 kBytesOS=Linux2.2.14 . . . . . . . . . . . . . . . . . . . . . . . . . 70
4.20 CPUloadfor comms1 under TCP/IPfor FastandGigabitEthernet: Delayedack
on: CPUusagemeasured: CPU= Pentium400MHz: Naglealgorithm disabled:
Socket size= 64 kBytesOS=Linux2.2.14 . . . . . . . . . . . . . . . . . . . . . 70
4.21 Theeffect on thefixedlatency overhead whenchangingtheCPUspeed. . . . . . 71
4.22 Themodifiedcomms1 setupto allow themeasurementof Request-responserate
andtheclient CPUload. . . . . . . . . . . . . . . . . . . . . . . . . . . . . . . 73
4.23 Request-responserateagainst CPUfor FastandGigabitEthernet on400MHz PC.
OS=Linux2.2.14 . . . . . . . . . . . . . . . . . . . . . . . . . . . . . . . . . . 74
4.24 TheMeasured request-responserateagainst CPUloadfor various processorspeeds 74
4.25 Extrapolationof theminimumframe(Figure4.24)to 100% CPUload . . . . . . 74
4.26 The relationship between the TCP/IP request-response rate and CPU speedat
100%loadfor minimumandmaximumframesizes . . . . . . . . . . . . . . . . 74
4.27 Comms1 underMESHandTCP/IPfor FastandGigabitEthernet: CPU= Pentium
400MHz: OS=Linux2.2.14 . . . . . . . . . . . . . . . . . . . . . . . . . . . . 78
4.28 CPUload for comms1 under MESH andTCP/IP for FastandGigabit Ethernet:
CPU= Pentium400MHz: OS=Linux2.2.14 . . . . . . . . . . . . . . . . . . . 79
4.29 CPUloadfor comms1 underMESH.Modelvs. Measurementfor FastandGigabit
Ethernet: CPU= Pentium400MHz: OS=Linux2.2.14 . . . . . . . . . . . . . . 79
4.30 Fast and Gigabit EthernetCPU load for MESH and TCP/IP for the minimum
and maximum frame lengths. CPU = Pentium400 MHz: OS=Linux 2.2.14.
T=TCP/IP, M=MESH, FE=FastEthernet, GE=GigabitEthernet, minf=minimum
frame,maxf=maximum frame. . . . . . . . . . . . . . . . . . . . . . . . . . . . 80
4.31 The change in the maximumMESH CPU load for comms1. FastandGigabit
Ethernet. OS=Linux2.2.14. . . . . . . . . . . . . . . . . . . . . . . . . . . . . 80
5.1 A treelike topology. Notethata nodecanbeattachedto any of theswitches. . . 85
5.2 Connecting thesametypeof Ethernet switcheswithout being limited by a single
link doesnot increasenumberof ports. . . . . . . . . . . . . . . . . . . . . . . 85
5.3 A link blockeddueto a slow receiver. . . . . . . . . . . . . . . . . . . . . . . . 86
5.4 TheEthernetbasedATLAS trigger/DAQ network . . . . . . . . . . . . . . . . . 87
15

5.5 An example of oneloop pathin theClosnetwork, shown by thebold lines. Each
squarerepresentsa switch. . . . . . . . . . . . . . . . . . . . . . . . . . . . . . 89
5.6 Broadcast ashandled by a modifiedClos network. In this simplenetwork, only
stationsA andC areallowed to broadcastin order to avoid looping frames.The
bold linesshowthedirection of thebroadcastframe. . . . . . . . . . . . . . . . 90
5.7 A broadcasttreeusing VLAN s in a Clos network. In this network, only switch
ports belonging to VLA N b areallowed to forward broadcasts. The bold lines
show thedirection of thebroadcastframe. . . . . . . . . . . . . . . . . . . . . . 91
6.1 ThePCsusedfor theLVL2 testbed at CERN. . . . . . . . . . . . . . . . . . . . 99
6.2 Performanceobtainedfrom streaming6 FEnodesto asingle Gigabitnodethrough
the BATM Titan T4. The limits of the receiving Gigabit nodeis reached before
thelimits of theswitch. . . . . . . . . . . . . . . . . . . . . . . . . . . . . . . . 100
6.3 Thesetupof theEthernetmeasurementtestbed . . . . . . . . . . . . . . . . . . 101
6.4 Unidirectional streaming for Fast and Gigabit Ethernetusing MESH and UDP.
CPU=400 MHz; OS=Linux2.2.14 . . . . . . . . . . . . . . . . . . . . . . . . . 103
6.5 How wesynchroniseclockson PCs. . . . . . . . . . . . . . . . . . . . . . . . . 105
6.6 A normalisedhistogramof half theround trip time through a switch . . . . . . . 107
6.7 Themeanvalue of theround trip time. . . . . . . . . . . . . . . . . . . . . . . . 107
6.8 Thestandarddeviationof theround trip time. . . . . . . . . . . . . . . . . . . . 107
6.9 How thegradient of two monitornode deviate from 1 . . . . . . . . . . . . . . . 108
6.10 Theerror in thepredictedtime for differentwarmup times. . . . . . . . . . . . . 109
6.11 Theeffect on thedrift whenthePCsidepanelsareremoved . . . . . . . . . . . 109
6.12 Themeasurementtechnique . . . . . . . . . . . . . . . . . . . . . . . . . . . . 110
6.13 Standarddeviationin gradient. . . . . . . . . . . . . . . . . . . . . . . . . . . . 111
6.14 Error in thepredictedtime over 5 minute intervals. . . . . . . . . . . . . . . . . 111
6.15 Variationin thesleeptime betweenping-pongs. . . . . . . . . . . . . . . . . . . 112
6.16 Error in thepredictedtime over 5 minsfor varying time between ping-pongs. . . 112
6.17 Therangeof thenumberof pointsthat canbeusedto make thebest line fit. . . . 113
6.18 A flow diagramillustrating thesynchronisation, measurementandtraffic genera-
tion in ETB. . . . . . . . . . . . . . . . . . . . . . . . . . . . . . . . . . . . . 115
6.19 Theframeformatof ETB software. . . . . . . . . . . . . . . . . . . . . . . . . 118
16

6.20 A comparisonof thetransmit andreceive inter-packet time histogramwhensend-
ing framesof 1500bytesat 240 � s inter-packet time . . . . . . . . . . . . . . . . 121
6.21 A histogramof theend-to-endlatency whensending framesof 1500bytes at 240
� s inter-packet time . . . . . . . . . . . . . . . . . . . . . . . . . . . . . . . . . 121
7.1 Thetypical architecture of anEthernetswitch . . . . . . . . . . . . . . . . . . . 129
7.2 Thecrossbar switcharchitecture . . . . . . . . . . . . . . . . . . . . . . . . . . 131
7.3 Thesharedbuffer switcharchitecture . . . . . . . . . . . . . . . . . . . . . . . . 131
7.4 Thesharedbusswitcharchitecture . . . . . . . . . . . . . . . . . . . . . . . . . 131
7.5 Theinteraction between modelling andmeasurementactivity. . . . . . . . . . . 133
7.6 Theparameterisedmodel: Intra module communication. . . . . . . . . . . . . . 135
7.7 Theparameterisedmodel: Inter module communication. . . . . . . . . . . . . . 135
7.8 An exampleplot of the comms1 measurement.ThePCoverhead,i.e. the direct
connection overheadshould besubtractedto leave theswitchport-to-port latency. 139
7.9 Portto port latency for variousGigabitEthernet switches . . . . . . . . . . . . . 140
7.10 Theexpectedresult from streaming . . . . . . . . . . . . . . . . . . . . . . . . 141
7.11 Resultsfrom unidirectional streaming throughvariousGigabitEthernet switches 142
7.12 Typical plot of loadagainst latency for systematicandrandom traffic. Thelatency
hererefersto theend-to-endlatency from onePCinto another. . . . . . . . . . . 144
7.13 Relationship betweenthe ping-pong, the basicstreaming andstreaming with the
systematic traffic pattern. . . . . . . . . . . . . . . . . . . . . . . . . . . . . . . 145
7.14 Typical plot of offeredloadagainstacceptedload. If flow control worksproperly,
wecannot offer moreloadthanwecanaccept. . . . . . . . . . . . . . . . . . . . 145
7.15 Typical plot of offeredloadagainst lost framerate.For switcheswhereflow con-
trol worksproperly, we should observe no losses. . . . . . . . . . . . . . . . . . 145
7.16 Thesetupto discover themaximumthroughput to andfrom thebackplane . . . . 146
7.17 An example setup to test the priority, rateand latency distribution of broadcast
framescompared to unicastframes . . . . . . . . . . . . . . . . . . . . . . . . . 149
7.18 Investigatinginput andoutput buffer sizes. . . . . . . . . . . . . . . . . . . . . . 150
7.19 FastEthernet priority teston the BATM Titan T4. High and low priority nodes
streaming to a single node. . . . . . . . . . . . . . . . . . . . . . . . . . . . . . 152
7.20 TestingVLANs on a switch. Nodes1 and2 areconnectedto portson VLAN a,
nodes3 VLA N b andnode4 on VLAN a andb. . . . . . . . . . . . . . . . . . . 153
17

7.21 End-to-end latency throughmultiple Titan T4 GigabitEthernetports. . . . . . . . 154
7.22 A setupto testtrunking. Trunkedlinks areusedto connect two Ethernet switches 155
7.23 Loopingback framesto saturatea Gigabit link . . . . . . . . . . . . . . . . . . . 158
7.24 Exampleresults comparing a loopbackanda non-loopback measurementon the
BATM Titan T4. . . . . . . . . . . . . . . . . . . . . . . . . . . . . . . . . . . . 158
8.1 Theend-to-endlatency for direct connection andthroughtheTurboswitch 2000 . 164
8.2 Thethroughput obtainedfor unidirectional streaming with two nodesthrough the
Turboswitch 2000 . . . . . . . . . . . . . . . . . . . . . . . . . . . . . . . . . . 165
8.3 The minimum inter-packet time obtained for unidirectional streaming with two
nodesthroughtheTurboswitch 2000 . . . . . . . . . . . . . . . . . . . . . . . . 165
8.4 TheTurboswitch 2000 results from the3111setup to discoveraccessinto andout
of a module . . . . . . . . . . . . . . . . . . . . . . . . . . . . . . . . . . . . . 165
8.5 Randomtraffic for 3111 setup through the Turboswitch 2000. Traffic is inter-
moduleonly. . . . . . . . . . . . . . . . . . . . . . . . . . . . . . . . . . . . . 165
8.6 Histogram of latenciesfor variousloads (asa percentageof theFastEthernet link
rate).3111configurationrandom traffic. Model against measurements.. . . . . . 166
8.7 The results of the bidirectional streaming tests on the Intel 500T switch. This
shows thattheup to four FastEthernet nodes cancommunicatesat thefull link rate.167
8.8 Investigatingthebuffer sizein theIntel 550Tswitch. . . . . . . . . . . . . . . . 168
8.9 Theperformanceof theIntel 550TFastEthernetswitchwith randomtraffic. Model
againstmeasurements. . . . . . . . . . . . . . . . . . . . . . . . . . . . . . . . 169
8.10 A picture of theBATM titan T4 . . . . . . . . . . . . . . . . . . . . . . . . . . . 170
8.11 TheFoundryBigIron 4000switch. . . . . . . . . . . . . . . . . . . . . . . . . . 170
8.12 Portto port latency for broadcastpackets.Obtained from comms1 . . . . . . . . 174
8.13 Theframerateobtainedwhenstreaming broadcastpacketsthrough theTitan T4 . 174
B.1 Thetransmitandreceive cyclesin MESH(Source: Boosten[10]) . . . . . . . . 195
C.1 Thearchitectureof theTurboswitch 2000. . . . . . . . . . . . . . . . . . . . . . 198
C.2 Theformatof thecontrol packet from theCAM/logic module. . . . . . . . . . . 200
C.3 An illustration of two modulesof theTurboswitch 2000 andtheirconnection to the
backplane. The shaded areas show wherepackets canqueuein the switch when
transferringfrom module1 to module2. . . . . . . . . . . . . . . . . . . . . . . 204
18

19
C.4 A simplifiedflow diagramshowing theoperationof theTurboswitch 2000. . . . 206

20 Chapter0.

Chapter 1
Intr oduction
21

22 Chapter 1. Introduction
1.1 Physicsbackground
Experimentswith theelectronpositroncollider(LEP)haveshown usthatnew physicsandanswers
to someof themostprofoundquestionsof our time, lie at energiesaround 1 TeV.
The large hadron collider (LHC) is an accelerator which brings protons or ions into head-on
collisionsat higher energies thanever achieved before. LHC experimentsarebeing designedto
look for theoretically predictedphenomena. However, they mustalso be flexible enough to be
preparedfor new physics.
TheLHC will bebuilt astride theFranco-Swissborder westof Geneva. ATLAS is oneof four
experimentsat theLHC. Its conceptwasfirst presentedin 1994andit is expectedto beoperational
from 2005 for a periodof at least 20 years. Oneof themaingoalsof ATLAS is to understandthe
mechanism of electroweaksymmetrybreaking (thesearchfor oneor moreHiggsbosons) andthe
search for new physics beyond the standardmodel. In addition, precision measurementswill be
performedfor thestandardmodelprocesses(e.g. themassesof theW boson andof thetop quark
and the proton structure)and for new particles (properties of the Higgs boson(s),propertiesof
supersymmetricparticles).
In keeping with CERN’s cost-effective strategy of building on previous investments, it is
designedto usethe 27-kilometreLEP tunnel, and be fed by existing particle sourcesand pre-
accelerators.
The LHC is a remarkably versatile accelerator. It can collide proton beamswith energies
around7-on-7TeVandbeamcrossingpointsof unsurpassedbrightness,providingtheexperiments
with high interaction rates. It can also collide beamsof heavy ions suchas lead with a total
collisionenergyin excessof 1,250TeV. Joint LHC/LEP operation althoughoriginally envisaged
hassincebeendropped.
1.2 The ATLAS Trigger/DAQ system
TheATLAS detector (aschematic of which is shown in Figure1.1),is expectedto produceimages
of 1 to 2 MByte at a frequency of 40 MHz, thus a rateof 40 to 80 TeraBytes/s. However not all
thecollisionsproduceinterestingphysics andwarrant further analysis.
Thetrigger’s taskis to select themostinterestingcollisionsor eventsfor further analysis,but
no morethantheamount thatcanbetransferred to permanentstorage.
TheATLAS detector’s trigger anddataacquisition system(Trigger/DAQ) hasbeenorganised

1.2TheATLAS Trigger/DAQ system 23
Figure1.1: A schematicof theATLAS detector.
into three levelsasshownin Figure1.2.� Level-1 (LVL1) consistsof purpose-builthardware. It actson reducedgranularity datafrom
a subsetof the detectors. The beamsof particles cross eachother every 25 ns or at a fre-
quency of 40 MHz. TheLVL1 trigger identifies events containing interesting information.
Information on these events, including the numberof signatures, their type and position
in the detector aregathered to form regions of interest (RoI). The RoIs arepassed to the
next level at a reducedrateof 75 kHz (thesystemis beingdesignedto support a maximum
reduced rate of 100 kHz). As illustrated in the Figure 1.2, LVL1 actson the muon and
calorimeterbut not on the inner-tracking information. The initi al ratecanbereducedade-
quately without the inner-tracking information. The decision latency for the LVL1 trigger
is 2 � s. During this time,all thedetector dataarestored in pipelined memories. If theevent
is accepted, all the dataaretransferredto the readout buffers (ROBs) wherethe dataare
storedduringlevel-2 processing.� As mentionedabove,thelevel-2 (LVL2) trigger receivesimagesidentified asinteresting by
LVL1 at thefrequency of 75kHz (maximum of 100kHz). Furtheranalysisof thecollisions
at LVL2, reducesthe event frequency to 1 kHz for the next level. The analysis usesfull
granularity, full-precision datafrom the inner-tracking, calorimetersandmuon detectors.

24 Chapter 1. Introduction
CALO MUON TRACKINGInteraction rate ~1 GHz
Bunch crossing rate 40 MHz
LEVEL 1 TRIGGER75/100 KHz
~2 s
LEVEL 2 TRIGGER~ 1 KHz~1-10 ms
EVENT FILTER10-100 Hz
~1 s
Data recording~10-100 MBytes/s
Regions of interest
Pipeline memories
Derandomizers
Readout drivers (RODs)
Readout buffers (ROBs)
Full-event buffers and processor sub-farms
EVENT BUILDER ~1-10 GBytes/s
µ
Figure1.2: TheThreelevelsof theATLAS trigger/DAQ

1.3Thelevel-2 trigger 25
LVL2 usesdata from regions of sub-detectors which according to theRoI information, are
expectedto contain interestingdata.
� Level-3 (LVL3) trigger, alsoknown asthe Event Filter or EF makesthe final decision on
whetherto reject or store the event for off-line analysis. Accepted eventsfrom LVL2 are
forwarded to LVL3 processors via the event builder. At this point, a full reconstruction of
the event is possible with a decision time of up to 1 s. The storagerate is up to 100 Hz
giving a throughput of up to 100MBytes/s to tape.Thefull eventdataareused at this level.
1.3 The level-2 trigger
Theproposedarchitecture chosenfor study[2] is shown in Figure1.3.
...
...
Network
Detector Data
SupervisorFarm
RoI BuilderROB1
ROB2
ROBn
PROC 1 PROC 2 PROC n
Level 1 trigger
ROB = Readout BufferPROC = Processor
Figure1.3: TheproposedLVL2 architecture.
An RoI builder receives RoI information fragments from the LVL1 processors. TheseRoI
fragmentsareorganisedandformatted into a record for eachevent.TheRoI builder then transfers
the recordto a selected supervisor processor. The supervisor processor allocates the event to a
LVL2 processor andforwards the RoI record to the processor. The processorcollects the event
fragmentsfrom theROBs,processesthemandsendsthedecisionto thesupervisor. Thesupervisor
receives the decision anddecides whetherto discard, processfurther or accept the event. The
supervisor updatesthetrigger statistics andmulticaststhedecisionto theROBs.

26 Chapter 1. Introduction
TheLVL2 trigger is estimatedto require aprocessingpower of ���� MIPS[2]. Theeventfilter
hassimilar processing requirements.
Efforts aremadeto include asmuchflexibil ity aspossible in the trigger designto allow for
upgradesandto cope with unpredicteddemands.
An intensestudy into the LVL2 system hasbeenundertaken [1][2]. A pre-requisite was to
build the LVL2 systemfrom commodity off-the-shelf products. Thusa network of workstations
(NOWs) approachwasproposedto provide the processingrequirements. Theadvantagesof this
approachare;� No developmentcosts andperiods.� Inexpensive dueto competing vendors.� Easyto obtain.� Widely supported.� Hascontinuity andlong lifetime dueto installed base in industry.
1.4 ThesisAim
This thesis dealsspecifically with theATLASLVL2 trigger. Thefocusis illustratedby theshaded
region of Figure 1.3. We assessthe suitability of the Ethernet technology as a solution to the
ATLAS LVL2 trigger network. Therefore our concernis with thenodes andprotocolsconnecting
to thenetwork, thenetwork interfacecards andthenetwork itself.
1.5 ThesisOutlin e
Following this introduction, Chapter2 summarisesthe requirementsof the ATLAS detector and
more specifically the LVL2 trigger system. Theserequirementsaresummarisedin the current
ATLAS HLT, DAQ andDCS TechnicalProposal [1]. Chapter 3 is a brief look at the Ethernet
technology andstandardsandthereasonswhy it is beingconsidered for theATLAS trigger/DAQ
network.
Chapter 4 is an examination of the hostperformanceusing Ethernet network interfacecards
(NIC) andvarious protocols.
In Chapter 5, we examinethe architectureof Ethernet switchesandwhat would be the ideal
configurationfor a high performanceparallel application like theATLAS LVL2.
In Chapters6 we develop and analyse a flexible and cost effective tool to characterisethe
performanceof Ethernet switches. In Chapter 7 we present themeasurementsperformedwith the

1.6Context 27
tool andtheanalysis thatled to thedevelopmentof theparameterised modelof Ethernetswitches.
We describe themodelparameters,themeasurementsrequired to obtain theparametersandother
measurementsto allow a morecompletecharacterisation of contemporary Ethernet switches.
In Chapter8 wepresent avalidationof theparameterisedmodelandgivetheparameterswhich
allow contemporary Ethernetswitchesfrom variousmanufacturersto besimulatedandcompared.
Chapter 9 contains a summaryof the conclusionspresentedthroughout the thesis anda look
at thefuture.
1.6 Context
Funding for this project wasawardedthrougha Co-operative Awardsin ScienceandEngineering
(CASE)studentship form theParticlePhysicsandAstronomy Research Council (PPARC) in col-
laborationwith SGS-ThompsonMicroelectronics. Partial funding alsocamefrom theEU project
SWIFT.
Theactual work wascarriedoutmostlyatCERN andpartly atSGS-Thomson.CERN’spolicy
on industrial collaboration encouraged our involvement in theEU projectsMacrame,SWIFTand
ARCHES.
The work hasbeen useful to CERN in understanding Ethernetswitchesand networks and
allowing modelsto be built for analysis of the ATLAS trigger/DAQ network. It hasalso been
useful to our industrialcollaborator, whichsupplied its switches,in helpingprovetheperformance
of their product by a third party. Someof the SWIFT project’s objectiveshave beenmet by the
work presentedhere.
Thework presentedherehasalsopavedtheway for anotherprojectbuilding anEthernetpro-
tocol analyserandperformancetester. Theideaspresentedherearebeing usedandthebottlenecks
revealedherearebeing overcomeby othernovel techniques.
1.7 Contrib ution
The author’s original contributionsareChapters 4, 5, 6, and8. Chapter7 is a collaborative ef-
fort wherethe author provided the necessaryinformationto allow the modelsto be constructed.
Thustheresults from themodelling arenot completely theauthor’s work. Chapter9 containsthe
conclusionsfrom this work.
Thecontributionsmadeto theATLASproject have been;

28 Chapter 1. Introduction
� Settingup thetestbedfor theATLAS LVL2 framework software.� Assessment of theEthernettechnology specifically for ATLASLVL2 trigger/DAQ network.
� Defininga methodology andwriting thesoftwarefor assessing theperformanceof anEth-
ernetswitchwith theATLAS trigger/DAQ in mind.� Assessment of protocolsandNIC issuesaffecting network performancein order to achieve
thebest performancefor theATLAS trigger/DAQ.� Providing analysis of currentEthernetswitchesarchitecturesto aidmodelling of theATLAS
trigger/DAQ network
� Providing input (network and host performance) for the modelling of the ATLAS trig-
ger/DAQ network (architecturesandmethodology)
� Collaboratingsuccessfully with membersof theATLAS community andindustrial partners.
The issues highlighted in this thesis will have to be further addressedby the ATLAS trig-
ger/DAQ community. Thenext majormilestone is thesubmissionof theTechnical design report
scheduledfor June2002.
Chapter 2
Requirementsfor the ATLAS second
level trigger
29

30 Chapter 2. Requirementsfor theATLAS second level trigger
2.1 General Requirements
Thechallengesof constructing anexperimentlike ATLAS arehugeandcomplex, requiring multi-
disciplinary effort. Giventhetime scale of ATLAS,many issuesarestill incompleteor uncertain
in their detail. Theaimof this section is to presentthepartsof theLVL2 requirementsinfluencing
theproblemsdealtwith in this thesis.
At thestartof thework presentedhere, a studyby theATLAS communitycalledtheDemon-
strator Program[2] wasnearing its end.Its results which directly influencedthis work are:
� Increasedconfidencethataffordablecommercial networkswouldbeableto handle thetraf-
fic in a single network - a total of a several GBytes/samongabout 1000ports.� Standardcommercial processors(especially PCs)werefavoured for the LVL2 processing,
ratherthanVME-basedsystems, sincethey offer a betterprice/performanceratio.� Sequential processing steps andsequential selection offersadvantagessuchasreducednet-
work bandwidth andprocessorload.� Controlmessagesshould pass via thesamenetwork asthedata.� TheLVL2 Supervisorshould passthefull eventcontrol for eacheventto a singleprocessor
in thefarm.
Thefindingsof theDemonstrator Program wereusedin thenext stageof theATLAS program,
thesocalledPilot project1 [1]. Theprincipal aimswereto producea validatedLVL2 architecture
andto investigatelikely technologiesfor its implementation. Thework for the Pilot project was
dividedinto three mainareas: functionalcomponents,testbedsandsystemdesign.
� The functional componentscovered optimisedcomponentsfor the supervisor, the ROB
complex, networks andprocessors.� Testbedscovered the developmentof the Reference or framework software, a prototype
implementationof thecomplete LVL2 process andtheconstruction anduseof moderately
largeapplication testbedsto usethis software.� Finally, systemdesign coveredmodelling activitiesandan integration activity to consider
theissuesrelatedto how theLVL2 system integrateswith other subsystemsandtherequire-
mentsit hasto meet.
Thework presentedin this thesistoucheson all threepoints,specifically, theLVL2 nodesand
network. Thefindings influenced the testbedsetup andthemodelling. Thereis anaim for some1Thepilot projecttook placein theperiodfrom early1998to mid 2000.

2.1GeneralRequirements 31
degree of commonality within the detector. Commonsoftware and hardware componentsare
encouraged to guaranteemaximumuniformity throughout ATLAS andadapted wherenecessary
to theparticular detectorrequirements.
TheLVL2 trigger/DAQ application is require to run at 75 kHz imageprocessingrate,but be
scalable to 100kHz. Thefollowing is a list of theindicative performancerequirements identified
in thepaper model[4].� At 100 kHz with an imagesize of 1-2 MBytes, the network throughput would be up to
������ ����������������� 200GBytes/s.Theuseof theRoI guidancemeansaround 5%of the
imagewill beanalysedby theLVL2 processors.This brings theaverage network capacity
to 5 to 10 GBytes/s.This will bemostly in the direction from theROBsto the processors
dueto therequest-responsenatureof traffic patterns.� On average,anevent is spread over 75 buffers. Eachof these buffershold on average660
to 1320 bytesof theevent. Thisgivesaneventsizeof around ������������ 50to 100kBytes.
� Thetotal numberof ROBsis around 1700, thereforetheaverageROB throughput will beof
theorder of ��������� �!� �"���� 2.9to 5.9MBytes/s.
– With 1700ROBsand75ROBs/event,therateperROBmustbe ����#�$��� � �%���&�!� �"���� 4.4
kHz.– The maximumROB rate is 12 kHz [4], corresponding to a maximumthroughput of
7.9 to 15.8MBytes/s.
� All processorsmustbeableto access all ROBsandvice versa.� EachROB hasthesameprobability of beingaccessed,thereforewe wanta uniform band-
width acrossthenetwork.� Therearea minimumof 550processors[46] in theLVL2 network. Themaximumrateper
processoris therefore ')(*'��+���,�-��� �"��.�������� 13.6kHz. This corresponds to a throughput
of 9.0 to 18.0MBytes/s.� TheLVL2 acceptrateis 1 to 2 kHz. This implies a rateof 1 to 4 GBytes/sto LVL3. This
meansthatthepeaknetwork throughputwill be ���0/1'2� 14 GBytes/s.
Thetrigger/DAQ usesa sequential selection strategy. Performing theLVL2 processing of the
inner detector after the initial confirmation of theLVL1 trigger reducestheaverage latency com-
pared to processing in parallel, even though the latency for someeventsincreases.Furthermore
morecomplex algorithmswhich canonly berun at lower ratesandrequire sequential strategy can
beusedfor sometypesof eventsin LVL2. Someof thesealgorithmsuseRoIscoming from LVL2
processing.

32 Chapter 2. Requirementsfor theATLAS second level trigger
The ROBs receive the accepted events of the LVL1 trigger from the front end electronics.
TheROBsareused asthedatasourcesfor theLVL2 processorsandtheeventbuilder. Thebasic
operationof a ROB is asfollows;
� Dataarereceivedinto theROB from thedetectorsacross readout links with abandwidth of
up to 160MByte/sandat anaverage rateof up to 100kHz.� Selecteddataarerequestedfrom thebuffersby theLVL2 system atamaximumrateof about
14kHzfor any givenbuffer.� Final LVL2 decisions are passed back to the ROB so that memoryoccupied by rejected
eventscanbecleared.
To reduce messagehandling overheads, it is more efficient to pass the decisions back in
groups of 20 or moredecisions. The useof multicast andbroadcastin this casemay also
reduce themessagehandling overheads.� Datafor acceptedevents arepasseddownstreamfor processing by theeventfilter.
TheATLAS LVL2 trigger is shownin Figure2.1. The network for the ATLAS trigger/DAQ
is required to be scalable, fault tolerant, be upgradable, cost effective andhave a long lifetime
in termsof usability and supportability . The architecture should aim to usecommodity items
(processors,operating system(OS)andnetwork hardware)wherever possible.
� Scalability: Futurerequirementsof thetriggermayevolveto requiremoreprocessors/computing
power, ROBsor simply network throughput. Thenetwork mustbescalable to providethese
requirements.� Fault tolerance:This is animportantissue for theATLAS trigger. Faulty linksandswitches
should bedetectedandthetraffic rerouteduntil they have been repaired. Ideally this should
beautomaticandbuilt into thenetwork.� Reliability: Packetsshould not be lost. Contention mustbe dealt with in a mannerwhich
avoids packet loss. Unicast,broadcastandmulticast areall very important to the perfor-
manceof theLVL2 trigger.
– Latency: The characteristics of the trigger latency needto be known andunderstood
in order to choosemoreeffectively thesizeof thebuffers in thesystem.
– Throughput: Therequiredthroughput mustbesupported.

2.1GeneralRequirements 33
~1700 buffers. Distributed 1 MByte image.
Buffer BufferBufferBuffer Buffer
Processor Processor Processor Processor Processor
BIG SWITCH
~550 processors analyse data from buffers
Figure2.1: Thesetup of theATLAS LVL2 triggernetwork.

34 Chapter 2. Requirementsfor theATLAS second level trigger

Chapter 3
A Review of the Ethernet technology
35

36 Chapter3. A Review of theEthernet technology
3.1 Intr oduction
Therearea number of network technologies being lookedat aspossible solutionsto theATLAS
LVL2 triggernetwork. At thestartof thisproject, thethreemaintechnologieswereSCI,ATM and
Ethernet. WefocusontheEthernettechnology. In thisChapter, wereview theEthernettechnology
andstandards.
3.2 History of Ethernet
Ethernet is a medium-independent local areanetwork (LAN) technology. Its developmentstarted
in 1972at Xerox PARC by a teamled by Dr. RobertM. Metcalfe. It wasdesignedto support
research on the “office of the future”. The Ethernet technology was based on a packet radio
technology calledAloha,developedat theUniversityof Hawaii. Originally calledAlto Aloha net,
it wasusedto link Xerox Altos (oneof the world’s first personalworkstations with a graphical
interface)to oneanother, to servers andto printers. It ran at 2.94 Mbit/s. In May 22 1973, the
word Ethernet wasusedin a memoto describe the project. This dateis known asthe birthday
of Ethernet. Thechange in thenamewasmeantto clarify that thesystemcould run over various
media,support any computer andalsoto highlight the significant improvementsover the Aloha
system.
Formalspecifications for Ethernet werepublished in 1980by a DEC,Intel andXerox consor-
tium thatcreatedtheDIX standard.In 1985, Ethernet becameanIEEE(Institute of Electrical and
Electronic Engineers) standardknown asIEEE 802.3. All Ethernet equipmentsince1985 have
beenbuilt according to theIEEE802.3standard.Developments in technology have led to periodic
updatesin theIEEE802.3 standards.
In the1990s,theboom in data networking, theincreasein popularity of the Internet andnew
applications requiring higher throughput led to the developmentof the 100 Mbit/s FastEthernet
andthe 1000 Mbit/s Gigabit Ethernet standards. Table3.1 showsthe three flavoursof Ethernet
currently in usetoday andthevariety of mediaon which they canrun.
Thestill increasingdemandfor bandwidth is leading to a new 10 Gbit/s802.3ae standardde-
velopedby the10GigabitEthernetAlliance1. Thealliancewasfoundedby thenetworking indus-
try leaders(3Com,CiscoSystems,ExtremeNetworks,Intel, NortelNetworks,SunMicrosystems,
andWorld Wide Packets)to develop thestandard,andto promote interoperability among10 Gi-
1The10 GigabitEthernetAlliance http://www.10gea.org

3.3TheEthernet technology 37
Medium GigabitEthernet FastEthernet 10 Mbit/s Ethernet
Rate 1000 Mbit/s 100Mbit/s 10 Mbit/s
CAT 5 UTP 100m (min) 100m 100m
Coaxial cable. 25 m 100m 500m
Multimode fibre. 260-550m 412m 2 Km
Singlemodefibre 3-5 Km 20 Km 25 Km
Table 3.1: Network diameter or maximumdistancesfor threeflavours of Ethernet on various
media
gabitEthernetproducts.Theexpecteddatefor thereleaseof thestandardis 2002. Thehistory of
theEthernet developmentis summarised in Figure3.1.
354657 34589 354457 354459 34548 7:5:7
;< =?>A@ B?>C<D < EFBHGIEF@ GIJ D EI< J KCBL ;;;NMIOFPQ R
;< =?>A@ B?>C<GI>CST>CU KAVXW,>CB?< Y E D <;< =?>A@ B?>C<GI>CST>CU KAVXW,>CB?<Z J [FEF\IJ <;< =?>C@ BH>A<GX>ASF>AU KCVIW,>CB?<
] O Z J [FEF\IJ <;< =H>A@ B?>C<GI>ASF>AU KAVIW^>ABH<
Y E D <_;< =?>C@ B?>C<D < EFBHGIEF@ GIJ D EI< J KCBL ;;;NMFOFPQ RF`Z J [TEI\FJ <_;< =?>C@ B?>C<D < EFBHGIEF@ GIJ D EI< J KCBL ;;;NMFOIP5Q RIa
] O Z J [FEF\IJ <_;< =?>A@ B?>C<D < EIB?GIEI@ GXJ D EI< J KABL ;;5;"MFOFPQ RFEI>
b_J W,>cd>CST>CU KCVIW,>CB?<_KCe D f J < g =?J B?[EIB?GhB?> f W^>AGXJ E
Figure3.1: Thehistory of theEthernet technology
In order to distinguishbetween thedifferentEthernet technologies, in what follows, we refer
to the 10 Mbit/s Ethernet as traditional Ethernet, 100 Mbit/s as FastEthernet and 1000 Mbit/s
Ethernet asGigabitEthernet. Theword Ethernet is used asa generic namefor theabove,applied
to all thetechnologieswith Ethernetaspartof thename.
3.3 The Ethernet technology
Originally, all nodesattachedto a traditional Ethernet were connectedto a shared mediumas
shown in Figure3.2. Both Ethernet andpureAloha technologies do not require central switch-
ing. Datatransmittedarereadable by everyone. All nodesmustbecontinuously listeningon the
mediumandchecking eachpacket to seeif its destinationcorrespondsto thenode’saddress.Thus
theintelligence is in theendnodesandnot thenetwork.
Ethernetprovideswhatis known asabesteffort datadelivery. Thereis noguaranteeof reliable
datadelivery. Thisapproachkeepsthecomplexity andcostsdown. ThePhysical Layeris carefully

38 Chapter3. A Review of theEthernet technology
i
j
k
l
m
n�oqprts�u�vws�u&x?yzv
Figure3.2: An illustrationof a segmentor collision domain
engineeredto produce a system that normally deliversdatavery well. However, errorsarestill
possible.
It is up to the high-level protocol that is sending data over the network to make surethat the
dataarecorrectly receivedat thedestination computer. High-level network protocolscando this
by establishing a reliable datatransport service using sequencenumbers andacknowledgement
mechanismsin thepackets thatthey sendover Ethernet.
3.3.1 Relation to OSI referencemodel
The International Telecommunications Union (ITU) and International Standards organisation’s
(ISO) OpenSystemsInterconnect(OSI) 7 layer referencemodelis a referenceby which protocol
standardscanbetaught anddeveloped. Its sevenlayers are;
{ Physical(Layer1): This is theinterfacebetween thephysical medium(fibre,cable)andthe
network device. It definesthetransmissionof data acrossthephysical medium.{ DataLink (Layer2): This layeris responsiblefor accessto thePhysicalLayerandfor error
detection, correctionandretransmission.{ Network (Layer 3): This layer providesrouting of packetsacrossthe network. It is inde-
pendent of thenetwork technology used.{ Transport (Layer 4): This layer provides reliable transfer of databetweenend-points. It
definesa connectionoriented or connectionlessconnection. It hidesthe lower layer com-
plexiti esfrom theupper layers.{ Session(Layer5): This layer establishesandmaintains a session or connection. It provides
thecontrol of communications betweentheapplication layers.{ Presentation (Layer6): This layerensuresthat thecoding systembetweentheapplications
arethe same.It encodesanddecodesbinary datafor transportanddealswith the correct

3.3TheEthernet technology 39
formatting of data.� Application (Layer7): This layer is theprogramusedto communicate.
Figure 3.3 shows how Ethernet relates to the OSI 7 layer reference model. The DataLink
Layeris dividedinto two: theMediaAccessControl (MAC) andanoptionalMAC control layer.
|N}~}T� �T�T�A�*�T�X���H�~�X�F� ��C� �*�T�X��� �X�F� �T�X����� �_� � }_� � ����� �*�&� �T��� �A�H� ���T� ���H���� �T�T�A��
���¡ � �T� ��� �h�_� ¢F� �~� �� �£ �?¤ � �¥ }~} � � ��� ��� �_�
¦#� ¤T�T�§|"� �X�F�,¨ �?�I� � � �h© ¦ | ¨hª¦ | ¨)¨ �X�I� � � �h© �X}T� �T�?��A� ª « � �,� � � � �
¬C"®)¯d° ±C² ³ ¬C~"®z¯�° ±C² ³ ¬C~~"®z¯d° ±C² ³
´¡µF¶*·C¸ ¹ ´µI¶*·C¸ º ·C» ¼?½ ·C» ¼?½´µI¶*·C¸ ¹~¾ ´µI¶*·C¸ º~¾ ´µI¶*·C¸ ¿�¾´¡µF¶*·C¸ ¹À�·CÁX ÃHÄ À�·CÁX ÃHÄ À�·CÁI Ã?Ä À�·CÁX ÃHÄ À�·CÁX ÃHÄ À�·CÁX ÃHÄ À�·CÁI Ã?Ä À�·CÁX ÃHÄ
Figure3.3: Ethernet andhow it fits into theOSI7 layer model.
Computersattachedto anEthernet cansendapplicationdatato oneanother usingahigh-level
protocol software suchasNetBIOS,Novell’s IPX, Appletalk or the TCP/IPprotocol suiteused
on the worldwide Internet. Ethernet andthe higher level protocolsareindependent entities that
cooperateto deliver databetween computers.
3.3.2 Frame format
Figure3.4 illustratestheEthernet frameformat.Thefirst sevenoctetsareknownasthepreamble.
It is sent to initiate thetransferandalsoinform othernodesonthesharedmediumthatthemedium
or link is busy. Its valuein hexadecimalis 55:55:55:55:55:55:55. Following thesevenoctets,aone
octet startof framedelimiter (SFD)is then sentto announcethestart of theframe.Thevalueof the
SFDin hexadecimalis a5. After the startof the frame,there is the destination addressfoll owed
by the sourceaddress. The source anddestinationaddressfields areboth six octetslong. The
type field of two octets is next. This signifiesthe typeof frame(or higher layer protocol packet)
being sent,or in somecases (wherethevalueis lessthan1500 decimal), the length of the frame.
After the type field, there is a datafield. This canbebetween46 and1500octets. Datalessthan
minimumof 46 octetsarepaddedwith zeros. Thehigher layer protocol packetsarecarried in this

40 Chapter3. A Review of theEthernet technology
field of Ethernetframes.Finally at theendof the frame,there is the framechecksequencefield.
This is a four octetfield providing a sequencecheck for the integrity of the frame. Thereis also
a minimuminter-framegapwhich correspondsto 12 octets. This givesa total length of 84 octets
for theminimumanda maximumof 1538octets.
7 octets 1 octet 6 octets 6 octets 2 octets 46-1500 octets 4 octets 12 octets
Preamble DestinationAddress
Source Address
Length/Type
DataFramecheck
sequence
Start of frame
delimiter
Interframe gap
Figure3.4: Theformatof theoriginal Ethernet Frame.
2 octets 2 octets
Userpriority
CanonicalFormat
Indicator(CFI)
VLAN Identifier
3 bits 1 bit 12 bits
7 octets 1 octet 6 octets 6 octets 2 octets 42-1500 octets 4 octets 12 octets
PreambleDestination
AddressSource Address Data
Framecheck
sequence
Start of frame
delimiter
Interframe gap
Type=0x8100
Tag controlInformation
(TCI)
Length/Type
Figure 3.5: The format of the new Ethernet Framewith support for VLANs andeight priority
levels.
Figure3.5 shows the new Ethernet frameformat. This is the sameas the original Ethernet
frameformatof Figure3.4 with theexception of a reducedminimumdatasizeandanextra four
octets composedof a two octets Priority/VLAN field anda two octetstype field. The type field
must be set to 8100 hexadecimal to signify this new format. The format hasa 12-bits VLAN
identifier (VID) field and three bits priority field. Thereis a onebit field called the Canonical
FormatIndicatoror CFI. It indicateswhether MAC Addressespresent in the framedatafield are
in canonical formator not. In canonical format, theleastsignificantbit of eachoctetof thestandard
hexadecimalrepresentation of theaddressrepresents theleast significantbit of thecorresponding
octet of thecanonical format of the address.In non-canonical format, themostsignificantbit of
eachoctet of the standard hexadecimalrepresentation representsthe leastsignificant bit of the
corresponding octet of the canonical format of the address.This is used to indicatefor instance
Token ring encapsulation. Theminimumframelength including the inter-packet gapstaysat 84
bytes andthemaximumincreasesto 1542 bytes.
As eachEthernet frame is sentonto the shared medium,all Ethernet interfaceslook at the
6-octet destination address. The interfacescompare the destination addressof the frame with

3.3TheEthernet technology 41
their own address.TheEthernet interfacewith thesameaddressasthedestination address in the
framewill readin theentire frameanddeliver it to thehigher layer protocols. All other network
interfaceswill stop reading the framewhen they discover that the destination addressdoesnot
matchtheir own address.
3.3.3 Broadcastand multicast
A multicastaddressallows a single Ethernet frameto be received by a group of nodes. Ethernet
NICs can be set to respond to one or more multicast addresses. A node assigned a multicast
addressis said to have joined a multicastgroupcorresponding to that address. A single packet
sent to the multicast addressassignedto that group will then be received by all nodes in that
group. A multicast addresshasthe first transmitted bit of the addressfield set to 1, andhasthe
form x1:xx:xx:xx:xx:xx.
Thebroadcastaddresswhich is the48-bit addressof all ones(i.e. ff:f f:f f:f f:ff:f f in hexadeci-
mal), is aspecial caseof themulticastaddress.Setupof theNIC is notnecessaryfor thebroadcast.
Ethernet interfaces thatseea framewith this destination addresswill readtheframein anddeliver
it to the networking software on the computer. The multicast is targetedto a specific group of
nodes whereasthebroadcastif targetedfor every node.
3.3.4 The CSMA/CD protocol
Nodesconnectedon a traditional Ethernetareconnectedon a sharedmedium. This is alsoknown
asa segmentor a collision domain. Signalsaretransmittedserially, onebit at a time andreachto
every attachednode.
In thepureAloha protocol,anyonecantransmitat any time. A nodewantingto transmit does
so. If another node is currently transmitting, a collision occurs. A collision is detected whena
sender does not receive the signal that it sentout. If a collision is detected, the sender waits a
random time, known asthebackoff, before retransmitting. This leadsto poorefficiency in heavy
loads.
Ethernet improved on this by using the Carrier SenseMultipl e AccessCollision Detection
(CSMA/CD) protocol. To senddataa nodefirst listens to the channel to determine if anyone is
transmitting (carrier sense). Whenthechannel is idle any node maytransmit (multiple access). A
nodetransmits its datain theform of anEthernet frame,or packet. If acollisionis detectedby the
transmitting nodes(collisiondetection), they stoptransmitting andwait a random time (backoff)

42 Chapter3. A Review of theEthernet technology
beforeretransmitting. After eachframetransmission,all nodesonthenetwork wishingto transmit
mustcontendequally to transmit thenext packet. This ensuresfair accessto thenetwork andthat
no single nodecanlock out another. Accessto thesharedmediumis determinedby themedium
access control (MAC) embedded in the Ethernetnetwork interfacecard (NIC) located in each
node.
Thebackoff time increasesexponentially after eachcollision. After 16 consecutive collisions
for agiventransmissionattempt, theinterfacefinally discardstheEthernetpacket. Thiscanhappen
if theEthernet link is overloadedfor a fairly long period of time,or is broken in someway.
Table3.1 shows the network diameteror maximumdistanceover the various media. These
distancesaredueto the roundtrip timesof the minimumpacket size. Theround trip time is the
time it takes for a signal to get from oneendof the link andback. If therearetwo nodesA and
B, at either end of the link, the worst casecondition is that onenode, B for example, startsto
transmit just asthetransmissionsignal from theother node (in this casenode A), reaches it. This
will causeacollision. In order for nodeA to detectthecollision,it muststill betransmittingwhen
thesignal from B getsto it. Otherwisetheframeis assumedby A to have been correctly sent out.
This criteriasetsthemaximumsegmentlength for eachmedium in CSMA/CD mode.
3.3.5 Full and Half duplex
Half-duplex modeEthernetis another namefor the original Ethernetmodeof operation which
usesthe CSMA/CD mediaaccessprotocol. Full-duplex Ethernet is basedon switchesanddoes
notuseCSMA/CD.In full- duplex mode,datacanbereceivedat thesametimethatit is sent. Since
thereis no way of detecting collisionsthis way, full -duplex moderequiresthatonly a single node
is connectedto eachcollisiondomain.Thusfull-duplex Ethernet links donotdependonthesignal
round trip times,but only on theattenuation of thesignal in themedium.
3.3.6 Flow control
TheIEEE802.3xfull duplex flow control mechanismworksby sending whatis knownasaPause
packet as shown in Figure 3.6. The pause packet is a MAC control frame. That meansit is
restricted to theMAC level, it is not passedup to thehigher layers. Thedestination addressfield
of the pausepacket is set to the multicast address01:80:C2:00:00:01. Thus all NICs must be
ableto receive packetswith this destination address. The type field of two octets is set to 8808
hexadecimal.TheMAC opcodefield which comesafterthetypefield is setto 0001hexadecimal.

3.3TheEthernet technology 43
Following the opcode there is a two octet control parameter. This containsan unsigned integer
telling the receiving nodehow long to inhibit its transmission. The time is measured in pause
quanta,whereaquanta is 512bit times.For FastEthernet, this is 5.12 � sandfor GigabitEthernet
0.512 � s. After the control parameter, thereare 42 octets transmitted as zeros to achieve the
minimum Ethernetframelength. All other fields in the pause frameareset in the sameway as
normalframes. Thepausepacketsareonly applicableto full duplex point to point links.
2 octets 2 octets7 octets 1 octet 6 octets 6 octets 2 octets 42 octets 4 octets 12 octets
PreambleSource Address
Framecheck
sequence
Start of frame
delimiter
Interframe gap
DestinationAddress=
01:80:C2:00:00:01
MAC Control
Type=0x8808
MAC opcode=0001
Controlparameter
Reserved(transmitted as
zeros)
Figure3.6: Theformatof thefull duplex Ethernetpauseframe.
Therealsoexistsaflow control techniqueknown asbackpressurefor half duplex mode.Back-
pressureis assertedon a port by emittinga sequenceof patternsof theform of theEthernetframe
preamble. This stops other nodesfrom sending frames. The disadvantage with backpressure is
that if enabled,all othernodeson thesamesegmentcannot sendframesbetweenthemselvesor to
other nodeson other segments.
3.3.7 Curr ent transmissionrates
TheCSMA/CD mediumaccess protocol andtheformatof theEthernetframeareidentical for all
Ethernet mediavarieties,nomatteratwhatspeedthey operate. However, theindividual 10-Mbit/s
and100-Mbit/s mediavarietieseachusedifferentcomponents,asindicatedin Figure3.3.
Theoperation for 10 Mbit/s Ethernetis described in the IEEE 802.3standard. At this speed,
onebit time is 100 ns. The FastEthernetstandardIEEE 802.3uis the standardfor operating at
the line speed of 100 Mbit/s. Onebit time is 10 ns. TheGigabit Ethernet standardIEEE 802.3z
supportsoperation at1000Mbit/s datarates. Onebit time is 1 ns.MostdeployedGigabitEthernet
systemsarerunning in full duplex mode.Someswitchmanufacturers do not evenimplement half
duplex option on their switches.
In Figure3.3,therearevariousPhysical Layertypesshown. Examplesare10BASE-T, 100BASE-
TX and 1000BASE-SX. The first part of the notation implies the rate of the link. The BASE
implies baseband,meaningonly onesignal on the link at once(time division multiplexing), as
opposedto broadbandwheremultiple signals areon the wire at once(frequency division multi-
plexing). Thelastpartdescribesthemediumtype. For 10 Mbit/s, “T” and“F” standfor twisted-
pair andfibre optic. Thereexistsalso“5” for thick coaxial cable, indicatinga maximumsegment

44 Chapter3. A Review of theEthernet technology
length of 500 metresand“2” for thin coax indicating 185 meter(roundedup) maximumlength
segments. For FastEthernet, thereexists “TX” implying twisted-pair segments and“FX” imply-
ing fibre optic segment type. The “TX” and“FX” mediumstandardsarecollectively known as
100BASE-X. Therealsoexists “T4” segmenttypewhich is a twisted-pair segmenttype thatuses
four pairsof telephone-gradetwisted-pair wire. Thetwisted-pair segmenttypeis themostwidely
usedtoday for making network connections to the desktop. Gigabit Ethernethastwo Physical
Layertypes, “SX” implying thefibreoptic mediumandtherecently developed“T” which implies
twisted-pair.
The “TX” and“FX” mediastandardsused in FastEthernet areboth adopted from physical
mediastandardsoriginally developedby the AmericanNational Standards Institute for theFibre
DistributedDataInterface(FDDI) LAN standard(ANSI standardX3T9.5). TheGigabitEthernet
fibre Physical Layersignalling borrowsfrom the ANSI Fibre Channel standard. Theavailability
of these provenstandardsreduceddevelopmenttime andalsohelps to drive down thecostof the
components.
3.4 Connecting multiple Ethernet segments
Thereareanumberof Ethernet devices to connecttogethermultipleEthernetsegments. Theseare
routers,repeaters,hubs,bridgesandswitches.
3.4.1 Routers
RoutersareLayer3 devicesthatenable switching from oneLayer2 technologyto another. Packets
arerouted according to their Layer3 information.
In orderto forwardapacket,a routersearchesits forwardingdatabasefor theLayer3 destina-
tion addressandtheoutput port. Therouter changesthedestinationMAC addressof thepacket to
theMAC address of thenext network equipmentin line to thedestination. This could beanother
router, aswitchor thedestinationnode.Routersoffer firewallsandsupport multiple pathsbetween
nodes. They do not automatically forwardbroadcastsandthushelpcreateseparatebroadcastdo-
mainsandreduceperformanceproblemscaused by a large broadcast rate. This allows complex
but stable networks to bedesigned.

3.4Connecting multiple Ethernet segments 45
3.4.2 Repeatersand hubs
In providing longer segmentor collision domains,Ethernet repeatersweredeveloped.A repeater
is a half duplex, signal amplifying andre-timing device. Strategically placed in the network, it
cleansandstrengthensthesignal attenuatedby travelling throughthephysical medium.Repeaters
blindly regenerateall datafrom oneof its ports to another. Thereis no decoding to worry about,
therefore repeaters are very fast. All nodesattached to the repeater are on the samecollision
domain.
1986 saw the introduction of star-wired 10BASE-T hubswith twistedpair wiring. A hub is
simply a multiport repeater, usedto providemultiple connection pointsfor nodes. Hubsoperate
logically asasharedbusasshown in Figure3.7.Theconnectionsareonthesamecollision domain
eventhough themediasegmentsmaybephysically connectedin a starpattern.
Å ÆÈÇtÉ�ÊËÍÌ0ÊËhÎFÏ.Ì
Ð Ñ Ò Ó Ô
Õ Ï.Ö
Figure3.7: An illustrationof a hub.
Thedisadvantageof repeatersandhubsis thatthey arewasteful of bandwidth sinceeverything
is copied to all portsexcept theincoming port. Repeatersandhubs areOSILayer1 devices.
3.4.3 Switchesand bridges
Ethernet bridgeshaveover timeevolvedinto switchesor switching hubs. Bridgesandswitchesare
an improvement over theoriginal sharedmedium modelbecausethey have addedintelligenceto
provideafiltering mechanismto ensure that only packetsdestinedfor theappropriatesegment are
forwardedto thosesegments. Switchescanalsooperatein full duplex mode.They canalsosend
andreceivemultiple packetssimultaneously. Theround trip timing rulesfor eachLAN stopat the
switch port. This meansa large number of individual EthernetLAN segments canbe connected
together. Switchesmayalsoallow the linking of segments running at differentspeeds.Datacan
besentfrom a node running at 10 Mbit/s acrosstheswitchto another running at 1000Mbit/s.
46 Chapter3. A Review of theEthernet technology
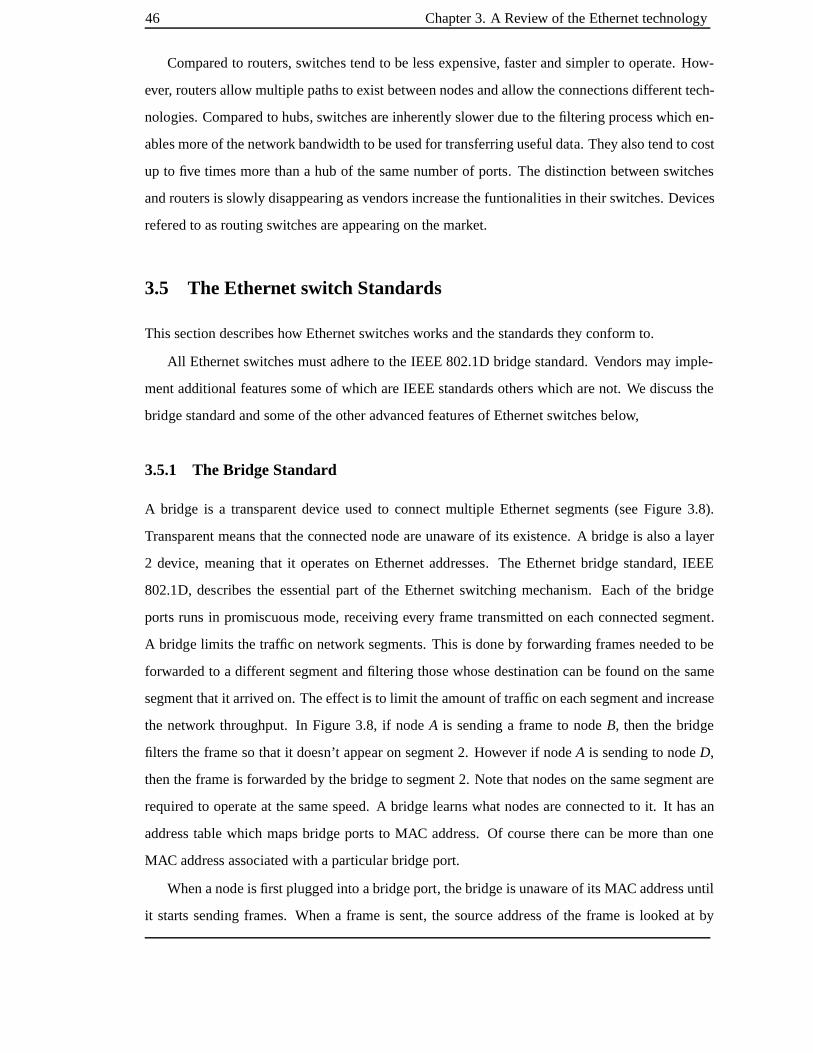
Comparedto routers, switches tendto be lessexpensive, faster andsimpler to operate. How-
ever, routersallow multiple paths to exist between nodesandallow theconnectionsdifferent tech-
nologies.Comparedto hubs, switchesareinherently slower dueto thefiltering processwhich en-
ablesmoreof thenetwork bandwidth to beusedfor transferring useful data. They alsotendto cost
up to five timesmorethana hub of thesamenumberof ports. Thedistinction between switches
androutersis slowly disappearing asvendors increasethefuntionalities in their switches.Devices
referedto asrouting switchesareappearingon themarket.
3.5 The Ethernet switch Standards
This section describeshow Ethernetswitchesworksandthestandardsthey conform to.
All Ethernet switchesmustadhere to the IEEE 802.1D bridge standard. Vendorsmay imple-
mentadditional featuressomeof which areIEEE standardsothers which arenot. We discussthe
bridgestandardandsomeof theotheradvancedfeaturesof Ethernet switchesbelow,
3.5.1 The Bridge Standard
A bridge is a transparent device usedto connect multiple Ethernet segments(seeFigure 3.8).
Transparentmeansthat theconnectednodeareunawareof its existence.A bridge is alsoa layer
2 device, meaningthat it operateson Ethernetaddresses. The Ethernet bridge standard, IEEE
802.1D, describesthe essential part of the Ethernet switching mechanism. Eachof the bridge
ports runsin promiscuousmode,receiving every frametransmittedon eachconnectedsegment.
A bridge limits the traffic on network segments. This is done by forwarding framesneededto be
forwarded to a differentsegmentandfiltering those whosedestination canbe found on the same
segmentthatit arrivedon. Theeffect is to limit theamountof traffic oneachsegmentandincrease
the network throughput. In Figure3.8, if nodeA is sending a frameto nodeB, thenthe bridge
filters the framesothat it doesn’t appear on segment2. However if nodeA is sending to node D,
thentheframeis forwardedby thebridgeto segment2. Notethatnodeson thesamesegment are
required to operateat the samespeed. A bridge learns what nodesareconnectedto it. It hasan
addresstable which mapsbridge ports to MAC address. Of coursetherecanbe morethanone
MAC addressassociatedwith a particular bridgeport.
Whenanode is first pluggedinto abridgeport, thebridgeis unawareof its MAC addressuntil
it startssending frames. Whena frameis sent, the source addressof the frameis looked at by

3.5TheEthernet switchStandards 47
×
Ø
Ù
Ú
×0Û Ü~ÝßÞáà
â à.Þáã à.äÍå�æ â à.Þáã à.äÍå%ç
×�Û è.éÈÝëê éÈì"å%Ýßè.ã éÈÜ~ä
í
Figure3.8: A network with two segments connectedby a Bridge.
thebridge in order to learntheMAC addressof thenodeconnectedto thatport. Prior to this, all
framesdestinedfor thataddressarebroadcast to all ports. Bridgesusethespanning treealgorithm
to detect andclose loops which would otherwise cause packets to continuously loop round the
network. Thespanning treealgorithm is discussedfuther in Section5.3.1.
Whenbridgeswerefirst introduced, they tended to be softwarebased. As a result the speed
at which they forwarded framesdependedon the bridge CPU. Ethernet switches have evolved
from bridgesandtherefore incorporate thebridgestandards.Furthermore,theinternalstructureof
Ethernet switchesmeansthatthey areableto receiveandforward multiple framessimultaneously.
3.5.2 Virtual LANs (VLANs)
As illustratedin Figure3.8, bridges andswitches do not limit broadcastsso that broadcastsare
received by all nodesin the network. Broadcastframesarelimited to broadcastdomains. For a
large network, broadcastscantake up a significant amount of the useful bandwidth. Broadcasts
canbestoppedby adding routers becauserouters do not forwardbroadcasts, however routersadd
latency and have lessbandwidth. Also, in a large network, for reasons of security or easeof
management,network administrators maynot wantcertain nodesexchangingdata. Virtual LANs
or VLAN smaybeusedasasolution to both of theseproblems.VLAN s(IEEE802.1Q)areaway
of providing smallernetworks within a LAN by segmenting the networks, suchthat traffic from

48 Chapter3. A Review of theEthernet technology
certain groups of nodes arelimited to certain partsof thenetwork. VLANs canbe thought of as
a way of providing multiple broadcastdomains. TheIEEE 802.1Q standarddefines VLA Ns that
operateover a singlespanningtree. This meansa VLA N is definedby a subset of thetopology of
thespanning treeuponwhich it operates.
In anetwork with VLANs, only nodesof thesameVLAN membership areallowedto commu-
nicate with unicast,multicast or broadcasttraffic. However, nodesmaybelong to morethanone
VLAN, that is VLAN s canoverlap. Thereareseveralwaysin which VLAN membership canbe
defined; by theswitchport, by theMAC addressor by Layer3 informationsuch astheIP address.
To definea port basedVLAN in a switch, eachswitch port is assigneda VLAN numberor
membership. Whena packet arrivesat the switch port, the VLAN of the packet is noted. If the
destination port is in the sameVLA N, the packet is forwarded. Otherwiseit is dropped. If the
frameneedsto bebroadcast,it is broadcastto all ports in thesameVLA N.
Address basedVLANs aredefinedby instructing theswitchaboutwhich MACsaddressesto
put into which VLAN s. Theswitchwould thenonly forward framesif thesource anddestination
MAC addresseswerein the sameVLA N. Similarly, VLANs based on Layer 3 andhigher layer
requirestheconfiguration of which field to basetheVLAN filtering.
The framebasedVLAN allows VLAN s to spanmultiple switchessinceit allows the VLAN
information to be encoded in the frame. The VLAN identification (VID) is 12-bits of the tag
control information (seeSection3.3.2 and Figure 3.5) and allows 4093 private VLANs to be
defined. Thereare three reserved VIDs values, 0 which implies a null VLAN , 1 which is the
default VID andFFF. A framewith a tag control information is known asa tagged framed. A
switchcanbeinstructedto adda tagcontrol information field to a framewhenit enterstheswitch
suchthatwhenit is transmittedon theoutput port, theVID canbeusedto identify which VLAN
it belongsto. Conversely, a switchcanstrip the tagcontrol informationbeforesending theframe
to the output port. This is to ensure that network equipmentwhich doesnot understandthe tag
control informationcanaccept theframe.
VLANs provides improved manageability, security and increasedperformanceby limiting
unwantedtraffic over thenetwork.
3.5.3 Quality of service (QoS)
TheIEEE 802.1p Quality Of Serviceusesa threebit field (seeFigure3.5) to assign a priority to
the frame.Eight priorities canbeassignedto theframe.Thepriority field is found insidethetag

3.5TheEthernet switchStandards 49
control informationfield. Somevendors alsoimplement a port based priority system wherebya
switchport is assigneda priority. Thusall packets from nodes attachedto that port will have the
samepriority. The802.1pstandarddoesnot specify themodelfor deciding which packets to send
next. This is up to thevendor. The802.1pstandardis beingmergedwith 802.1Dstandard.
3.5.4 Trunkin g
Link aggregation(IEEE 802.3ad) which is alsoknown asclusteringor trunking wasstandardised
in May 2000. This is a way of grouping links from multiple ports into a single aggregatelink.
Theeffective throughput of this aggregatelink is thethecombinedthroughput of theindependent
links. In order to retain framesequenceintegrity, a flow of packets betweenany two nodes (a
conversation) flowing acrossthe trunked link canonly usea single link of the trunk. This means
the effective throughput of any conversation is limited by the speed of oneof the trunked links.
Broadcastontrunkedlinksarehandled likeotherframessuchthatthey arenotsentmultiple times
to thesamedestination.
Trunking offers load balancing wherebya conversation canbe moved from a congestedlink
of a trunk to anotherlink in thesametrunk. This is alsousedto support link redundancy whereall
conversationson a disabledlink arereroutedto a different link within thesametrunk.
3.5.5 Higher layer switching
Currently, nostandardsexist but vendorshaverecognised amarket needandareintroducing higher
layer switching featuresin their switches. Thesefeaturesallow theswitchesto look deeper into the
framebefore makingtheswitching decisions.No consistentdefinitionsexist andasa result, their
implementations arevaried. Thesefeaturesarereferedto asIP switching, Layer3 switching and
evenLayer4 switching. Somevendors claim to offer thefull routing protocolsin their switches.
3.5.6 Switch management
Thereareno IEEE standardsfor managing switches. Most vendorsprovide software which uses
the SimpleNetwork ManagementProtocol(SNMP) to collect device level Ethernet information
andto control theswitch. SNMPusesManagementInformationBase(MIB) structuresto record
statistics suchas collision count, packets transmitted or received, error ratesand other device
level information.Additional information is collectedby RemoteMONitoring (RMON) agentsto
aggregatethestatisticsfor presentation via a network management application.

50 Chapter3. A Review of theEthernet technology
The management interfacegenerally comesin two forms, a serial connection to a VT100
terminal andmanagementapplicationsoftware. In thesecond case,there is a trendtowardsweb
browserbased managementsoftware. The clearadvantagewith this is the increasedportability
andlocation independenceofferedby theweb.
3.6 Reasonsfor Ethernet
Thereasonswhy we areconsidering Ethernetasa solution to theATLAS LVL2 network are;
� Price: Comparedto other technologiesbeing considered for the ATLAS LVL2 network,
Ethernetis very price competitive both in termsof initial outlay andthecostof ownership.
Historically, pricesof Ethernetcomponentshave fallenrapidly whencomponentsconform-
ing to new standard are introduced(SeeFigure3.9). This trend is predicted to continue.
GigabitEthernet’s designdrewheavilyon PHY of X3.230FibreChannel project. This im-
plies the Fibre Channel PHY componentscanbe usedfor GE driving down costsfurther.
� Volume: Ethernet hasa hugeinstalled base. 83%of installednetwork connections in 1996
wereEthernet [6]. It hasbecomesoubiquitous thattoday personal computersaresoldwith
anEthernet NIC asstandard. Ethernet continuesto enjoy large salevolume,adding to the
pricereductions.
� Simplicity: Ethernet is relatively simpleto install comparedto thealternative technologies.
It alsoofferseasymigration to higher performancelevels.
� Managementtools: Therearemanagementandtrouble shooting tools available. Ethernet
switchesalsosupport “hot swap”, wherebynodescanbeconnectedanddisconnectedwith-
out having to power off. This is a highly convenient feature asadding andremoving nodes
from thenetwork neednot interrupt everyone elseon thenetwork.
� Performance increase: Ethernet currently runsat threedifferent speeds. 10 Mbit/s, 100
Mbit/s (FastEthernet) and1000Mbit/s (Gigabit Ethernet). 10 Gigabit per second is cur-
rently under developmentandfurthermore,thereis a move towards 40 Gigabitpersecond.
� Reliability : Ethernet hubsandswitcheshavebecomeincreasingly reliable.
� Incr easedfunctionality : New featuresarebeingaddedto Ethernetto support new applica-
tionsanddatatypes(QoS,VLAN tagging Trunking, seeSection 3.5).

3.7Conclusion 51
1995 1996 1997 1998 1999 20000
500
1000
1500
2000
2500
Year
Uni
t cos
t
Gigabit Ethernet switch portGigabit Ethernet NIC Fast Ethernet switch port Fast Ethernet NIC
Figure3.9: Thecostof FastandGigabitEth-
ernet NICsandswitchesasafunctionof time.
� Lifetime: The lifetime of theATLAS equipmentis greater thana decade. We have confi-
dencein the longevity of Ethernetdueto the installed baseanddevelopmentsin the tech-
nology to meetthedemandsof new applications.
Ethernet andPCarea commodityapproachto theATLAS trigger/DAQ.
3.7 Conclusion
In this section, we have introducedtheEthernet technology andoutlinedthe reasons why it is of
interestto ATLAS.
TraditionalEthernetprovidesbesteffort model.Its intelligenceis mostlyin thenodes,making
Ethernet simple. SwitchedEthernetis evolving to support QoS,VLANs, multicast congestion
control andweb-basedmanagementasmoreintelligenceis addedto thenetwork.
Thewidespreadpopularity of Ethernet ensuresthatthereis a large market for Ethernet equip-
ment,which alsohelpskeepthetechnology competitively priced.
For ATLAS, 100Mbit/s Ethernet andhigherspeedsareof interest.Also, only switchedEther-
netsareof interestdueto therequirementsimposed by ATLAS. ThereforetheCSMA/CDprotocol
is of no interest.
Thepotential for theadded flexibility dueto theevolving standardsandemerging higher layer
switching functionality compared to simpleswitching hubsis of interest for the ATLAS trigger
system. In the following chapters,we look at FastandGigabit Ethernet running in full duplex
mode.

52 Chapter3. A Review of theEthernet technology

Chapter 4
Network interfacing Performanceissues
53

54 Chapter4. Network interfacingPerformanceissues
4.1 Intr oduction
In this chapter, we look atEthernetnetwork interfacesandissuesaffecting their performance. It is
importantto understand theperformanceof theendnodessuchthatanassessmentof theprotocol
overheadscanbe madeandthe endnodescanbe characterised for the modelling of the ATLAS
LVL2 trigger system.
Figure4.1 shows a simplified representation of the PC systemarchitecture. The CPU is at-
tached to main memoryvia a memorybus. The PCI bus connects to the memorybus via a PCI
bridge andthe network interfacecardor NIC is connectedto the PCI bus. On our systems,the
memorybusis 64-bit running at 66 MHz andthePCIbusis 32-bit running at 33 MHz.
CPU
Memorycontroller
PCI-bus 32-bit 33 MHz
Memory bus64-bit 66/100 MHz
NIC
PCIBridge
Memory
Figure4.1: ThePCsystem architecture.
Welook attheperformanceof theTCP/IPprotocol implementationsunder theLinux operating
system(OS)andMESH [11] [12] [13], a low overheadmessaging andscheduling library written
under theLinux OSrunning onPCswith theATLAS LVL2 application in mind. An illustration of
thelayering of thesecommunicationinterfaces is shown in Figure4.2. In theLinux OS,processes
runeitherattheuserlevel or atthekernel level. Userapplicationsaccessthenetwork via thekernel
socket interfaces. The socket interfacesaccessthe protocols at the required levels shownin the
figure.TCPapplicationsusetheSOCK STREAM, UDPapplicationsusetheSOCK DGRAM, IP
applicationsuseSOCK RAW andraw EthernetapplicationsusetheSOCK PACKET interface.
MESH is a userlevel processwith its own driver. It bypassesthe kernel to access the NIC
hardware.MESHalsohasits own schedulerto schedule therunning of MESHapplications.

4.2Themeasurementsetup 55
KernelSpace
Userspace
NICHardware
MESH
NICdriver
IP
TCP UDP
MESHdriver
SOCK_STREAM SOCK_DGRAM SOCK_RAW SOCK_PACKET
TCPapp
UDPapp
IPapp
RawEthernet
app
MESHapp
TCP/IP Stack
Socketinterfaces
MESHapp
MESHapp
Figure4.2: An illustrationof theprotocolsin relation to eachother.
We look in detail at thecomms1 or ping-pong[16] benchmarkbecausethetraffic pattern re-
sembles thatof theATLAS LVL2 request-response pattern andhence we candraw someconclu-
sionsabouttheperformancefor ATLAS. FastandGigabitEthernetresults arepresented. Wecon-
centrateon Linux becauseof its significantly betterperformancecompared to Windows NT [23]
andthefreeavailability of theLinux source codeto aid understanding.
TheATLAS triggerDAQ requirescomputationaswell ascommunications. In thesemeasure-
ments,wemeasuretheCPUloading during communications to giveanideaof theCPUpower left
for running theLVL2 software andtrigger algorithms.
4.2 The measurementsetup
The setup for the measurementshereconsistedof two PCsdirectly connectedvia Fastor Giga-
bit Ethernet. We use100Base-TXFastEthernet (copper cableswith RJ45connectors) and the
1000Base-SXGigabit Ethernet(multi-modefibre optic cablesandconnectors). For Network in-
terface cards(NICs or adapters), we useIntel EtherExpress Pro 100 [36] for the FastEthernet
measurementsandtheAlteon ACENICGigabitEthernet NICs [37] for GigabitEthernet.
The two PCswerecompletely isolatedfrom any other networks. All unnecessary processes
(such asscreen blanking andscreensavers, moving themouse) weredisabledto avoid generating

56 Chapter4. Network interfacingPerformanceissues
any extra CPU load or usageoverheadsand to maintaina steady background stateduring the
measurements.The Linux OS wasbooted into single-user text modefor minimum OS setupto
minimisetheCPUoverhead. We usedversions2.0.27and2.2.14.
ThePCsused rangedfrom 166MHz to 600MHz Pentiummachines.Themainmemorysize
was32 MBytes or above. In eachof the measurements,we usedpairs of PCsof the sametype
connectedtogetherandrunning thesameoperating systemto assurea symmetricsetup.We used
IP version4 andEthernet frameswithout VLAN tags.
4.3 The comms1 measurementprocedures
Comms1 or ping-pong is a simple message exchange betweena client anda server (SeeFig-
ure 4.3). We distinguish betweenmessageanddata. The message is the userinformationto be
transmitted whereasthe datacorresponds to the informationencapsulated by the protocol. The
client setsup a message andsends it in its entirety to theserver. Theserver receivesthecomplete
message andsendsit backto the client. The time for the sendandreceive (the roundtrip time)
is measured on the client PC (we do not include the message setting up time by the application
since we areinterestedin the communications only. For TCP, we do not include the connection
setup time). Half of the roundtrip value is taken in orderto obtain elapsed time (or latency) in
sending themessage oneway. It is this that we plot in our graphs.Knowing themessagesizeand
theelapsed time, the throughputcanbecalculated. This throughput representsthenon-pipelined
throughput, that is, thereis only onepacket going through thesystemat any time.
Evenin thissetup,asinglecomms1 measurementcouldincludeextratimedueto theoperating
system scheduling. Thus in order to get the communications performancea typical application
would receive,each measurementwasrepeated1000timesandtheaverageis taken.
TheCPUusagemeasurementsareobtainedby simply implementing a threadcounting func-
tion at the client. This counter is initially calibratedto find out how fast it can count without
any otherthreadsrunning. Thecommunications threadis raisedto a higher priority suchthat the
counting thread will only be run whentheprocessoris not processingany communications, thus
giving a count per second valuelessthanthe initial calibratedmeasurement. From this, we can
deducethepercentageof theCPUtime usedin thecommunication.

4.4TCP/IP protocol 57
Server
ClientTime
Computation
Communication
CommunicationThread 1
Thread 1
Thread 2
Transmit
Transmit
Receive
Receive
Figure4.3: Thecomms1 setup.
4.4 TCP/IP protocol
4.4.1 A brief intr oduction to TCP/IP
TCP/IP(Transmission Control Protocol/InternetProtocol) protocol is widely available andsup-
ported by all commercial operating systems. The Transmission Control Protocol or TCP[14] is
a reliable connection-orientedstreamprotocol. It guaranteesdelivery with packetsin thecorrect
sequenceandalso provides an error correction mechanism. TCP sits on top of IP, the Internet
Protocol [15]. IP is a connectionlessunreliable packet protocol. It provideserror detecting and
the addressing function of the Internet. However IP doesnot guaranteedelivery or provide flow
control. The TCP/IPprotocol suite includesUDP, ICMP, ARP, RARP andIGMP [18] [19]. A
TCP/IP protocol stack is an implementation of the protocol suite. Here we look at the Linux
implementation. We are looking specifically at TCP because it hasall the featuresrequired by
theATLAS trigger/DAQ systemsuchasguaranteeddelivery of dataandflow control. Dueto its
pervasiveness, it is natural to askif TCP/IPcansupport theATLAS trigger/DAQ application.
TCPwasdevelopedin thelate1960sandhasbeenevolvingeversince. It wasdesignedto build
aninterconnection of networks thatprovideuniversal communication servicesandto interconnect
different physical networks to form what appearsto the user to be one large network. TCP/IP
wasdesignedbefore theadventof theOSI 7-layer model. Its designis basedon four layers(See
Figure4.4):
î Thenetwork interfaceor datalink layer. TCP/IPdoesnot specify any protocol here.Exam-
ple protocolsthatcanbeusedareEthernet,Tokenring, FDDI, ATM etc.î Thenetwork or Internet layer. This layer handlestherouting of packets.TheIP protocol is
a network layer protocol thatprovidesa connectionlessunreliable protocol. TheIP header

58 Chapter4. Network interfacingPerformanceissues
is usually its minimumof 20 bytes.
î The transport layer. This layer managesthe transport of data. Thereare two transport
layer protocols provided in the TCP/IP suite. They arethe Transmission Control Protocol
(TCP)andtheUserDatagram Protocol(UDP).TCPis aconnectionorientedprotocol which
provides a reliable flow of databetween hosts. It therefore requires a connection setup.
The TCP header size is usually 20 bytes. UDP is a connectionlessunreliable protocol.
Applications using UDP have to provide their own flow control andpacket lossdetection
andrecovery mechanism.TheUDPheader is eightbytes.
î Theapplication layer. This layer is theprogram/software which usestheTCP/IPfor com-
munication. The interfacebetweenthe application and the transport layer is definedby
socketsandport numbers. To theuserapplication, thesocketactslike aFIFOto which data
arewrittenandareemptiedoutby theprotocol. Theportnumberis used to identify theuser
application. CommonTCP/IP applications areTelnet (remotelogin), FTP (File Transfer
Protocol) andSNMP(SimpleNetwork ManagementProtocol). Our measuring application
runsat this layer.
Application (Telnet ftp etc.)
TCP UDP
IP
ICMP ARP RARP IGMP
Ethernet, Token ring, FDDI, ATM, x.25 etc
Application
Transport
Internetwork
Network interfaceor data link(Hardware)
Figure4.4: Themodelof theTCP/IPprotocol.
In opening a TCP/IPsocket for communications, there arevarious optionswhich canbe set.
Theseoptionscomeunder theheader of “socket options.” Thesocket sizeis oneof these options.

4.4TCP/IP protocol 59
It refersto theavailablebuffer space for sending andreceiving datafrom thepeernode. Thesend
andreceive socket buffers canbesetindependently.
Sliding window and sequencenumber
To guaranteethe delivery of packets,TCP uses the Sliding Window algorithm to effect a flow
control. Packetssentfrom a TCPnodehave in theheader a window size. Thewindow sizetells
thepeerTCPnodehow many bytesof datatheoriginating nodeis preparedto receive. Thissystem
ensuresthat the peernodedoes not overload the buffers of the originating node. Every window
sizeof datamustbe acknowledgedto confirm delivery. Thereis alsoa sequencenumberin the
TCPheader to identify packet loss. The applicationcancontrol the initi al TCPwindow sizeby
changing thesocket size. Thewindow sizeadvertisedby theTCPprotocol to a peer will depend
on the receive buffer available since buffer spacemaybe taken up by datastill to be readby the
application.
Maximum segmentsizeand maximum transmission unit
TCPsendsdata in chunksknown assegments. Themaximumsegmentsize(MSS)dependsonthe
maximumtransmissionunit (MTU) of theunderlying link layerprotocol. For Ethernet, theMTU
correspondsto themaximumamountof datathatcanbeput into aframewhichis 1500bytes. This
meansthemaximumsegment sizefor TCP/IPrunning ontopof Ethernet is 1460bytes, takinginto
account theTCPandIP headers.
Delayed acknowledgements
TCP usesan acknowledgement schemeto ensure that packets have beendelivered. Acknowl-
edgementsareencoded into the TCP header. This allows the acknowledgement to be attached
(piggybacked) to the usermessages heading in the opposite direction. If thereis no user data
heading in theoppositedirection, a TCPheader is sentwith theacknowledgement encoded.
To helpavoid congestion causedby multiple smallpacketsin thenetwork, acknowledgements
aredeferred until the hostTCP is readyto transmitdata(suchthat it canbe piggybacked) or a
second segment(in a stream of full sizedsegments) hasbeenreceived by the host TCP. When
acknowledgements aredeferred, a timeout of lessthan 500 ms [20] is usedafter which the ac-
knowledgementis sent.According to Stevens[18], the timer which goesoff relative to whenthe

60 Chapter4. Network interfacingPerformanceissues
kernel wasbootedandmostimplementationsof TCP/IP haveacknowledgementsdelayedby up to
200ms.
Naglealgorithm
Another congestion avoidanceoptimisation found in TCP/IP implementations is known as the
Naglealgorithm. It wasproposedby JohnNaglein 1984[17]. It is a way of reducing congestion
in a network caused by sending many small packets. As dataarrives from the user to TCP for
transmission, theTCPlayer inhibits thesending of new segments until all previously transmitted
datahave beenacknowledged.While waiting for the acknowledgements to come,the usercan
sendmore datato TCP for transmission. When the acknowledgement finally arrives, the next
segmentto besent could bebigger dueto theadditionalsendsby theuser. No timer is employed
with this algorithm, however when the segment reaches the MSS, the data is senteven if the
acknowledgement hasnot arrived.
The TCP/IPprotocol is very complex. We have describedabove only the points which re-
occur in this text. Readerswishing to know more,such ashow TCPrecoversfrom packet loss,are
referredto [18], [19], [14] and[15].
4.4.2 Resultswith the default setupusing FastEthernet
The results shown in Figure 4.5 were obtained from measurementson two 233 MHz Pentium
processors. Figure4.5(a)shows the non-pipelined throughput (asdescribed in section 4.3) and
Figure 4.5(b) the latency plot both measured against the message size. Theseresults wereob-
tained from measurementsrun on the default setupof the Linux OS, that is, without explicitly
specifying any TCP options. This default setup hasboth the Nagle algorithm and the delayed
acknowledgement enabled.
Notethattheplotsin Figure4.5arefrom thesameresults. Takingthereciprocal of thelatency
axis of Figure4.5(b) andmultiplying it by the messagesizewill give the plot in Figure4.5(a).
Plotting theresults in these two formsemphasisethefeaturesthat wewould like to discuss.
1. Thefirst part of thegraphsis themessagefrom zeroto 1460 bytes. In Figure4.5(a)we see
thatthethroughput risesto amaximumof justover6 MBytes/sfor adatasizeof 1460bytes.
Theform in Figure4.5(b) of this range (zeroto 1460) is linear andrising with themessage
size,althoughit is not visible dueto thescale (Seethenext section for plotsof this range).

4.4TCP/IP protocol 61
0 2000 4000 6000 8000 10000 12000 140000
2
4
6
8
10
12
Message size. Bytes
Th
rou
gh
pu
t. M
Byte
s/s
Throughput obtained in Comms 1. Nagle on. 64K socket
(a) Throughput
0 2000 4000 6000 8000 10000 12000 140000
10
20
30
40
50
60
70
80
90
100
Message size. Bytes
Latency obtained in Comms 1. Nagle on. 64K socket
La
ten
cy.
ms
(b) Latency
Figure 4.5: Comms1 under TCP/IP. The default setup: CPU = Pentium233 MHz; MMX
OS=Linux2.0.27
2. The second part of the graphs is the messagesizes which aremultiples of 1460bytes. At
thesepoints, themessage sizefits into full sized TCPsegments. we seea low latency and
high throughput compared to theother partsof thegraphs.
3. The third part of the graphs is the region from 1461 to 2919 bytesmessage size. In this
region the messagerequires two TCP segmentto transmit. The half roundtrip latency is
around 95 ms,corresponding to a throughput of nearzero.
4. Thefourth partof thegraphsis theregionwherethemessagesizeis greater than2920bytes,
not includingthemultiplesof 1460bytes. In this region, themessagesrequire threeor more
TCPsegments to transmit. The latency fluctuateswithin a bandfrom 5 msto 12 ms. The
throughputrises becausethelatency is fixedwithin thesaidbandwhile themessage sizeis
increasing.
The exchangeof messagesbetween the client andserver when the usermessage fits into a
single TCPsegmentis illustratedin Figure4.6. To begin with, the client sendsa message. The
serverTCPreceivesthemessageandschedulesanacknowledgement to besent.Sincetheserver’s
responseis immediate, the acknowledgement is piggybacked onto the responsemessage. At the
client side, the message is received and as in the caseof the server, the acknowledgement is
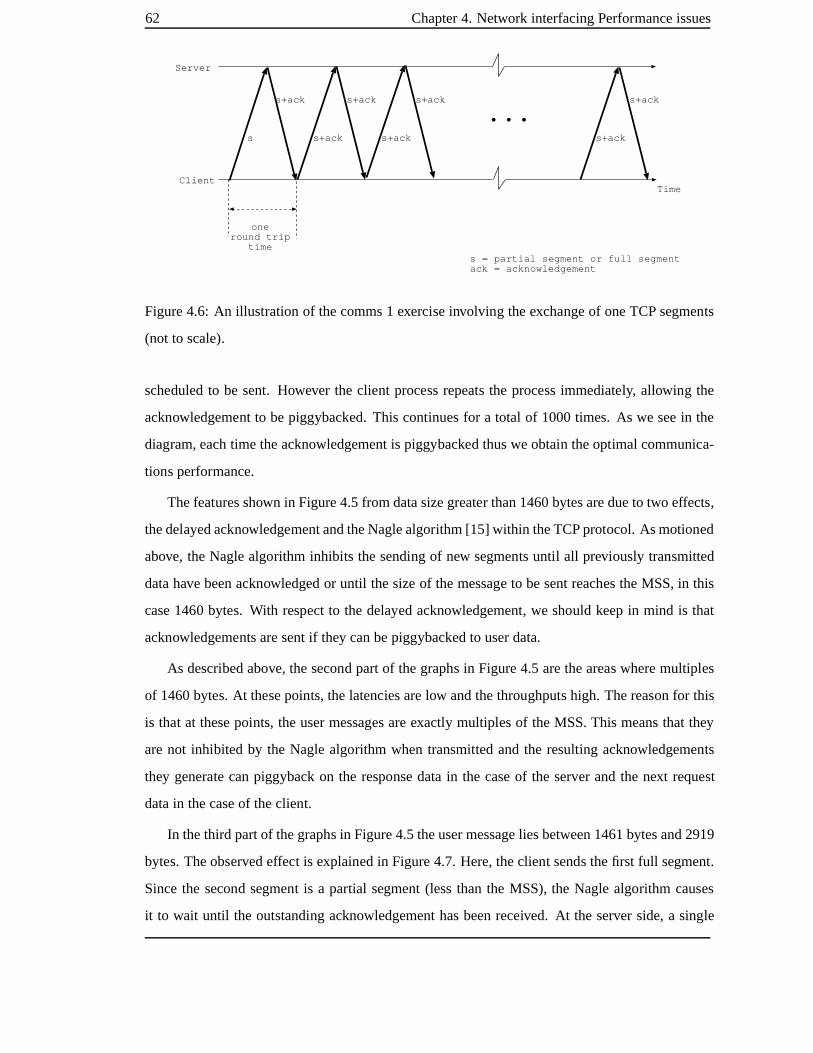
62 Chapter4. Network interfacingPerformanceissues
s
s+ack
Client
Server
Time
oneround trip
time
s+ack s+ack s+ack
s+ack s+ack s+ack
...
s = partial segment or full segmentack = acknowledgement
Figure4.6: An illustrationof thecomms1 exerciseinvolving theexchangeof oneTCPsegments
(not to scale).
scheduledto be sent. However the client processrepeats the processimmediately, allowing the
acknowledgement to bepiggybacked. This continuesfor a total of 1000times. As we seein the
diagram,eachtime theacknowledgementis piggybacked thuswe obtain theoptimal communica-
tions performance.
Thefeaturesshown in Figure4.5from datasizegreater than1460bytesaredueto two effects,
thedelayedacknowledgementandtheNaglealgorithm [15] within theTCPprotocol. As motioned
above, the Naglealgorithm inhibits the sending of new segments until all previously transmitted
datahave beenacknowledgedor until thesizeof themessage to besentreachestheMSS,in this
case1460 bytes. With respect to the delayed acknowledgement, we should keepin mind is that
acknowledgementsaresentif they canbepiggybackedto userdata.
As describedabove, thesecond partof thegraphs in Figure4.5 aretheareas wheremultiples
of 1460bytes. At thesepoints, thelatenciesarelow andthethroughputs high. Thereason for this
is that at thesepoints, the usermessagesareexactly multiplesof theMSS.This meansthat they
arenot inhibited by the Naglealgorithm whentransmitted andthe resulting acknowledgements
they generate canpiggybackon the responsedatain the caseof the server andthe next request
datain thecaseof theclient.
In thethird partof thegraphsin Figure4.5theusermessageliesbetween1461bytesand2919
bytes. Theobservedeffect is explainedin Figure4.7. Here,theclient sends thefirst full segment.
Sincethe second segment is a partial segment(lessthanthe MSS), the Naglealgorithm causes
it to wait until the outstanding acknowledgementhasbeenreceived. At the server side,a single

4.4TCP/IP protocol 63
oneround trip
time
Client delayedack timer
Server delayedack timer
p = partial segmentF = full segmentack = acknowledgement
F
ack
Client
Server
Time
F+ack
p
...p
ack F
ack F+ack
p
p
ackF+ack
ack
100 ms
100 ms 100 ms
100 ms
100 ms
100 ms
oneround trip
time
Figure4.7: An illustrationof thecomms1 exercise involving theexchangeof two TCPsegments
(not to scale).
segmentis receivedandsincetherearenosegmentsbeingreturnedto theclient to piggybackonto
anda second segmentis not received,theacknowledgement is delayeduntil theserver’s delayed
acknowledgement timerfires.Whenthishappens,theacknowledgementis sentandthentheclient
sends theremaining partial segment.
The server sends the first segment of the responsewith an acknowledgementpiggybacked
on it. Again since the second segment is a partial segment, the Nagle algorithm causes it to
be delayed until the outstanding acknowledgement hasbeen received. As with the server, the
delayed acknowledgementtimer fires before the acknowledgement is sent. This seriesof events
continuesfor thetotal of 1000 timeswhich is thenumber of timesthemeasurementis performed.
In Figure4.7we illustratea single roundtrip time. This containstwo delayedacknowledgements
eachof which firesat intervalsof 100ms.Onedueto theserver andother dueto theclient. Thus
in Figure4.5(b), thehalf roundtrip time plot for themessagesizebetween1461bytesand2919
bytes shows a latency near 100ms.
The fourth part of the graphs in Figure 4.5 is the region wherethe message size is greater
than2920bytes, not including themultiplesof 1460bytes.We believe that theobserved feature
arealsodueto thecombination of the delayed acknowledgementsandtheNaglealgorithm. The
key point to remember hereis that thedelayedacknowledgementtimer goes off relative to when
the kernel wasbooted anddoesnot whena packet wasreceived. With this in mind, Figure4.8

64 Chapter4. Network interfacingPerformanceissues
1st round trip
time
Client delayedack timer
Server delayedack timer
p = partial segmentF = full segmentack = acknowledgement
F
ack
Client
Server
Time
F+ack
p
p
ackF
Fack F+ack
p
p
ackF
Fack
F+ack
ack F+ack
p
p
ackF
Fack
2ndround trip
time
3rdround trip
time
F+ackack
Figure4.8: An illustrationof thecomms1 exerciseinvolving theexchangeof threeTCPsegments
(not to scale).
shows threedifferent scenarios for measurementof the round trip time for a messagespanning
threesegments.
In thefirst case, thedelayedacknowledgementtimersdonotfire for both client andserver. The
client sends two full segments andtheNaglealgorithm causesthelastsegment(which is a partial
segment) to wait for anacknowledgement. Whenthetwo segments arereceivedat theserver, the
acknowledgement packet is sentimmediately. Whentheclient receivestheacknowledgement, the
lastsegmentis sent.A similar sequenceof eventsoccur astheserver sends theresponsemessage
backto theclient.
In thesecond case,thedelayedacknowledgement timer fireseitherfor theclient or theserver.
Thecase illustratedin Figure4.8 showsthe delayed acknowledgement timer firing at the server.
The reason for this is that sincethe delayed acknowledgement timer goes off relative to when
thekernel wasbooted it canfire at theserver whenthefirst segment is received. This causesthe
acknowledgement to be sentout. Therefore whenthe second full segmentarrives,andacknowl-
edgementis not sentout until thedelayedacknowledgementtimer firesagain.
The third caseis whereboth the client and the server delayed acknowledgementtimer fires
during themessage exchange.
Further work needs to beperformedin order to better understandthebehaviour of TCPwhen
themessage sizeis three segmentsor larger. Results by Rochez[26] for comms1 underwindows
NT aresimilar to thoseof Figure4.5.

4.4TCP/IP protocol 65
Conclusionfor ATLAS
Most of the ATLAS LVL2 messagesfrom ROBs to the processors will spanonly a single TCP
segment, but the average fragmentsizefrom the SCTis 1600 bytesandfrom the calorimetersit
is 1800bytes [4]. In these cases,theobservedbehaviour with thedefault setup(thecombination
of thedelayedacknowledgement andtheNaglealgorithm) would have theeffect of increasingthe
delays in thecommunications betweentheROBsandprocessors.In thenext section, we disable
thedelayedacknowledgementto seehow thebehaviour changes.
4.4.3 Delayedacknowledgement disabled
Figure 4.9 shows the measurement(on two 200 MHz Pentium processors) repeated, but with
the delayed acknowledgement disabled. That is, acknowledgements aresent immediately TCP
segments arereceived. Notethat theNaglealgorithm is still enabled. Thefeaturesobservedwith
Figure4.5,whensending two or moreTCPsegments areno longer visible.
The downward spikesin the Figure4.9(b) representsmessage sizes corresponding to whole
numbers of TCPsegments andhenceminimumtransit latency of thecomms1 measurement.The
length of thespikesin microsecondsis theextratimeadded to thepacket latency astheclient waits
for theacknowledgements.Therefore thelength of thespikescorresponds to thetime it takes the
acknowledgement packet to go from the server to the client. Sincethe TCP acknowledgement
comesin aTCPheader, this should beapproximately thetime to sendtheminimumTCPsegment
which is 107.3 ï s from Figure4.9(b). Theactual length of thespike is 133.1 ï s on average.This
leavesanoverhead of 25.9 ï s. We expectedtheacknowledgement to take lessthan100 ï s since
theapplicationis not involved.
We areuncertain whatthis extra time is dueto. A possibility could bethatsending a data-less
acknowledgement couldrequire moreprocessingtime thansending a piggybackedacknowledge-
ment,andthus delaying thesending of thepacket which follows theacknowledgement.
4.4.4 Naglealgorithm and delayed acknowledgementdisabled
With thedelayed acknowledgementandNaglealgorithm off, theresulting throughputcurveshows
only featurescorresponding to theEthernet frameboundariesasshownin Figure4.10.Thefigure
also hasa plot of a parameterisedmodel of the communication. The model showsvery good
agreementwith themeasurements.Themodelis explainedin thenext section.

66 Chapter4. Network interfacingPerformanceissues
0 2000 4000 6000 8000 10000 12000 140000
2
4
6
8
10
12
Message Size. Bytes
Th
rou
gh
pu
t M
Byte
s/s
ec
Throughput obtained in Comms 1. Nagle on. Delayed ack off
(a) Throughput
0 2000 4000 6000 8000 10000 12000 140000
200
400
600
800
1000
1200
1400
1600
Message Size. Bytes
La
ten
cy. u
se
cs
Latency obtained in Comms 1. Nagle on. Delayed ack off
(b) Latency
Figure4.9: Comms1 under TCP/IP:CPU= Pentium200 MHz MMX: Naglealgorithm on: De-
layed acknowledgement disabled: Socket size= 64 kBytesOS=Linux2.0.27
Conclusionfor ATLAS
Fromtheseresults,thebestconfigurationof theend-nodes,in termsof communication, for ATLAS
LVL2-lik e traffic is with boththeNaglealgorithm andthedelayedacknowledgementdisabled.
However, these results do not take the CPUload into account. Later in this chapter, we will
look at theCPUperformance.
4.4.5 A parameterisedmodelof TCP/IP comms1 communication
Valuesfr om the measurements
In Figure4.10(b), there arefour distinct featureswe model.
1. Theoffsetfrom thelatency axis.Thistellsusthefixedoverheador theminimumoverhead in
sending a TCPsegment.Theactual valuerequiresextrapolation from 1460to six message
bytesdue to the minimum andmaximumpacket size restrictions of Ethernet. The value
obtainedis 107.3 ï s.
2. Theareafrom a message sizeof six to 1460bytes, or thesingle segmentarea. In this area,
only a single TCPsegmentandEthernet frameis sent.Thegradientobtainedfor this area
is 0.1092 ï s/byte.

4.4TCP/IP protocol 67
0 2000 4000 6000 8000 10000 12000 140000
2
4
6
8
10
12TCP/IP comms 1 with Fast Ethernet. Meas vs model. 64k socket.
Message size. Bytes
Th
rou
gh
pu
t. M
Byte
s/s
Measuredmodelled
(a) Throughput
0 2000 4000 6000 8000 10000 12000 140000
200
400
600
800
1000
1200
1400
Message size. Bytes
La
ten
cy.
us
TCP/IP comms 1 with Fast Ethernet. Meas vs model. 64k socket.
Measuredmodelled
(b) Latency
Figure4.10:Measurementagainstparameterisedmodel.Comms1 underTCP/IP: CPU= Pentium
200 MHz MMX: Nagle algorithm disabled: Delayedack disabled: Socket size = 64 kBytes.
OS=Linux2.0.27
Thusin theregion of 0 to 1460 bytes, themodelhastheform;
ð�ñòôóöõz÷?ø�õ&ùú"ûýüþø�õ.ÿ�÷�� (4.1)
Where û is themessagesize,ð ñò is half theroundtrip time.
3. Everysubsequent areaof size1460 bytesfrom messagesize1461is themulti-segmentarea.
In theseareas, multiple segments aresent, thusadvantagecanbe taken of the pipelining
effect. Thegradient measured hereis 0.0454ï s/byte.
4. Theheight betweenthesubsequentmulti-segmentareas asdescribedin item 3. This is the
overhead TCP/IPsuffersin sending an extra TCPsegment. We measurethis to be 55 ï s.
Thelink time for sending theminimumEthernet framesizeis 6.72 ï s (includingtheinter-
packet time). This is only 12%of thetotal time. this meanstherestof thetime is dueto the
nodeoverhead(protocol, PCIbus, driver andNIC).
For themulti-segmentregions, themodelis of theform
ð ñòôó ð ñò���� ü ��� ü õz÷Aõ � � � û (4.2)
ð ñò��� is half theround trip time from thepreviousfull segment size.

68 Chapter4. Network interfacingPerformanceissues
Protocol Driver
App
NIC
SendInterrupt
Link
NIC
ReceiveInterrupt ProtocolDriver
AppUserspace
Kernelspace
NIC
Link Layer
Send Receive
End-to-end latency
PCI transfer PCI transfer
Figure4.11:Theflow of themessagein thecomms1 exercise.
The model
We modeltheflow of thedata(of thefirst 1460bytes) for theping-pongasshown in Figure4.11.
This shows a simplified message flow from application transmissionto application reception. A
summaryof theflow is asfollows. Themessagetransferbeginswith theapplicationwrite to the
protocol (in this caseTCP/IP).The protocol packs the datawith the right headers andcalls the
NIC driver. Note that the Ethernet source address,destination addressandtype field areadded
by theprotocol before thedriver is called. Thedriver sends thepacket to theNIC which addsthe
Ethernet CRCandsendsthepacketonthelink. TheNIC generatesaninterruptafterthesuccessful
send.
At thereceiverside,theNIC readstheframefrom thelink, copiesit into mainmemoryvia the
PCI busandnotifiesthedriver. Thedriver runsandpasses thepacket to theprotocol, which then
passesthepacket to theapplication afterremoving theprotocol headers.
For our parameterisedmodel,we definethefollowing asoverheadsashaving a fixedcompo-
nentanda data sizedependentcomponent:î The protocol overhead: the fixed overheadis definedas ��� �� seconds, which accountsfor
the protocol setup time andin addition the rateis definedas � �� �� bytes/s,which accounts
for any datacopies.This makestheprotocol overhead equalto �� �� ü � û�� ���� ���� , where û is
thedata size.î The PCI transfer: the fixed overhead is definedas ������ seconds, which accounts for the
arbitrationandsetup time. Therateis definedas ������� bytes/s. We areusing32-bit 33 MHz
PCI, thustherateis 132MBytes/s.
We alsodefinethe link rateas � �"!�# . For FastEthernet this is 12.5MBytes/s. We definethe
following asconstants:î Theapplicationoverhead �$ seconds.This is a systemcall.
4.4TCP/IP protocol 69
î Thedriver overhead �% �& seconds.î TheNIC overheads ! ��� seconds.î Thereceive interrupt �� ! � seconds.
At variouspoints,theprotocol payloadchangesdueto theoverheadsintroducedby theproto-
cols. Thuswe definethefoll owing:î û bytes:Theusermessage sizeat theapplication level.î(' bytes: Theextra overheadincurredby theTCP/IPprotocol. This is madeup of theTCP
andIP headersandequals40 Bytes.î*) bytes: Theoverhead dueto theEthernet framingasthepacket is transferredover thePCI
bus.This is theEthernet destination address, thesourceaddressandtheEthernet typefield.
Thevalueis 14Bytes.Wedonot includetheEthernetCRCwhich is addedandremovedby
theNIC (seethelink overhead + ).î + bytes: The extra overheadon the framesdue to the link transfer. This is the preamble,
startof framedelimiter andtheCRCfield. Thisequals12bytes. Theinter-packetgapis not
addedsincewe areconsidering a single frametransfers.
Theendto endlatency or half theround trip time for thedatacanbewritten as;
ð ñòôó $ ü ,�� �� ü û� �� �� ü �% �& ü ,����� ü û�ü ' ü )
� ����� ü ! �-� ü û�ü ' ü ) ü +�.�"!�#
ü ! �-� ü û�ü ' ü )� ����� ü ,���/� ü 0� ! � ü �% �& ü û
� �� �� ü ,�� �� ü $ (4.3)
ð ñòôó ú"û� �� �� ü ú
� �1���� û�ü ' ü ) � ü û�ü ' ü ) ü +
�.�"!�#üôú � �$ ü �� �� ü �% �& ü �1��� ü ! �-� � ü � ! � (4.4)
We re-arrangetheequation in theform of Equation 4.1
ð ñò óöû � ú���� �� ü ú
������� ü ø�.�"!�# � ü ú �
' ü )�����/� � ü
' ü ) ü +�2��!3#
üôú � $ ü ,�� �� ü �% �& ü ,�1��� ü ! �-�4� ü 0� ! � (4.5)
If we substitute thenumbers above for our system into Equation 4.5,it becomes:
ð ñòôóöû � ú� �� �� ü ú
ø��ú ü øø�ú!÷ � � ü ú �
� õ0üþø �ø��ú � ü
� õ0üþø � ü ø�úø�ú!÷ �
ü-ú � �$ ü �� �� ü �% �& ü ����� ü ! ��� � ü � ! � (4.6)
70 Chapter4. Network interfacingPerformanceissues
ð�ñò-óöû � ú�5�� �� ü ø � ÿ
ø�6 � õ � ü� ø�õõ76úø�6 � õ � ü ú � $ ü ,�� �� ü �% �& ü ,����� ü ! ���4� ü 0� ! � (4.7)
Comparing equation 4.7and4.1,we getthefollowing;
ú���� �� ü ø � ÿ
ø�6 � õ óöõz÷?ø�õ&ùú (4.8)
This solvesto give �8�� �� ó ø � ú!÷ � MBytes/s.Our system hasa 64-bit 66 MHz memorybuswhich
yields 528MBytes/s. This impliesthattheprotocol performsmultiple copies.
Comparing equation 4.7and4.1,we alsoget:
� ø�õõ76úø�6 � õ � ü ú � �$ ü �� �� ü �% �& ü �1��� ü ! �-� � ü � ! � ó ø�õ.ÿ�÷�� (4.9)
Measurementsdone by Boosten [12] on a 200MHz systemrevealsthat thesystemcall over-
head, 0$ is 8 ï s,theinterruptoverhead, � ! � is 18 ï sandtheNIC sendandreceive overheads, ! �-�are10.5 ï seach. Substituting these valuesinto Equation4.9,weget:
� ø�õõ76úø�6 � õ � ü ú ��9 ü ,�� �� ü �% �& ü ,�1��� üþø�õz÷ � � üþø 9 ó ø�õ.ÿ�÷�� (4.10)
This solvesto give
,�� �� ü �% �& ü ,���/� ó ú��!÷?ø ï s (4.11)
An oftensuggestedoptimisation of TCP/IPis moving theprotocol onto theNIC. FromEqua-
tion 4.5weseethatmoving theTCP/IP protocolonto theNIC will savethetransferof theprotocol
overheadsacrossthePCI bus ú � ' ü ) � � �:�1��� which corresponds to 0.8 ï s in the total fixedover-
headof 107.3 ï s. Wecanalsoseethateliminatingthedatacopying will reducethedatadependent
overheadby ú7� �;�� �� ó õz÷Aõ)ø � õ ï s perbyte. This is not significant for FastEthernet wherethelink
time for theminimumframesize(42 databytes) is 5.76 ï s. For GigabitEthernet wherethe link
time for theminimumpacket 0.576 ï s, this would bea worthwhile reduction.
Theabove argumentdoes not take into account the fixed processingoverhead of the TCP/IP
protocol which would movedfrom thehost CPUto theNIC. FromEquation 4.11this could bea
maximumof 23.1 ï s (but it is likely to bemuchless).
Limitatio n of model
Theabove parameterisedmodelappliesonly for singleTCPsegment communication. In making
this model,we have madea numberof assumptions. We have assumedtime symmetryin trans-
mitting andreceiving, that is, the elapsedtime in eachlayer of Figure4.11 is assumed to be the
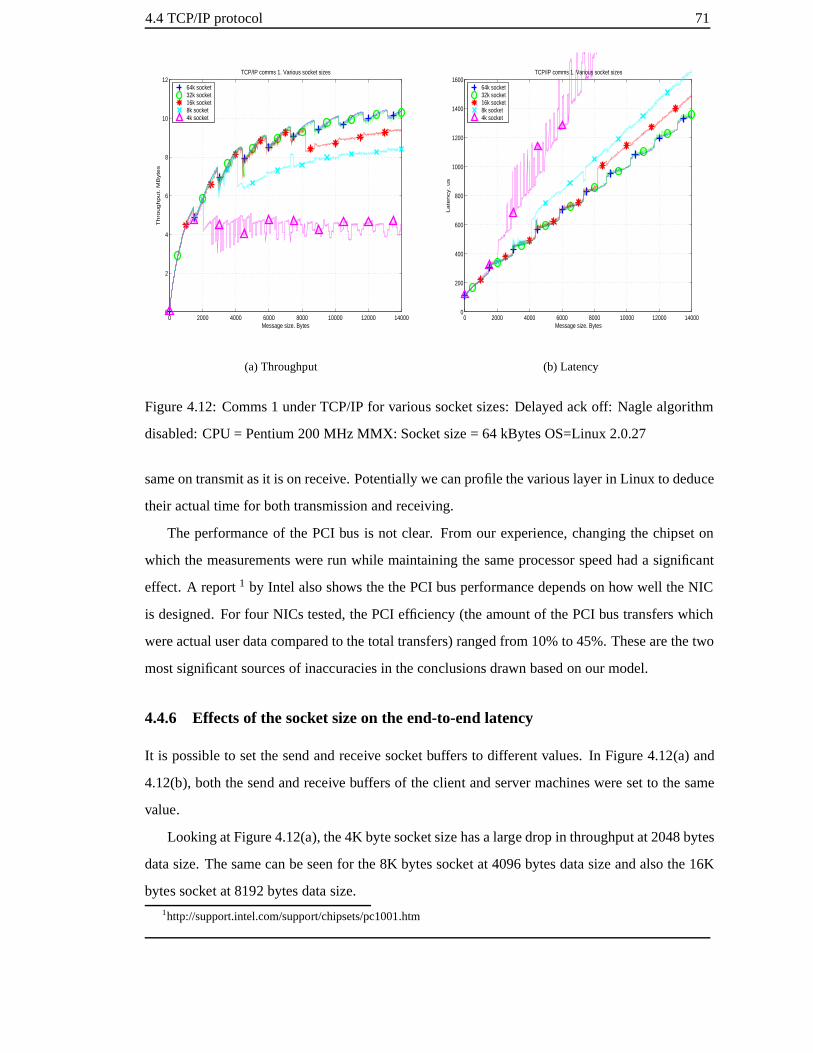
4.4TCP/IP protocol 71
0 2000 4000 6000 8000 10000 12000 140000
2
4
6
8
10
12
Message size. Bytes
Th
rou
gh
pu
t. M
Byte
s
TCP/IP comms 1. Various socket sizes
64k socket32k socket16k socket8k socket 4k socket
(a) Throughput
0 2000 4000 6000 8000 10000 12000 140000
200
400
600
800
1000
1200
1400
1600
Message size. Bytes
La
ten
cy.
us
TCP/IP comms 1. Various socket sizes
64k socket32k socket16k socket8k socket 4k socket
(b) Latency
Figure4.12: Comms1 under TCP/IPfor various socket sizes: Delayedackoff: Naglealgorithm
disabled: CPU= Pentium200MHz MMX: Socket size= 64 kBytesOS=Linux2.0.27
sameontransmitasit is onreceive. Potentially wecanprofile thevariouslayerin Linux to deduce
their actual time for both transmissionandreceiving.
The performanceof the PCI bus is not clear. From our experience,changing the chipseton
which the measurements wererun while maintaining the sameprocessorspeedhada significant
effect. A report1 by Intel alsoshows thethePCI busperformancedependson how well theNIC
is designed. For four NICs tested, thePCI efficiency (theamount of thePCI bus transferswhich
wereactual user datacompared to thetotal transfers)ranged from 10%to 45%.Thesearethetwo
mostsignificant sourcesof inaccuraciesin theconclusionsdrawn basedon our model.
4.4.6 Effects of the socket sizeon the end-to-end latency
It is possible to setthe sendandreceive socket buffers to differentvalues. In Figure4.12(a) and
4.12(b), both thesend andreceive buffers of theclient andserver machinesweresetto thesame
value.
Looking atFigure4.12(a), the4K bytesocketsizehasalargedropin throughput at2048bytes
datasize.Thesamecanbeseenfor the8K bytessocket at 4096bytesdatasizeandalsothe16K
bytes socket at 8192 bytesdatasize.1http://support.intel.com/support/chipsets/pc1001.htm

72 Chapter4. Network interfacingPerformanceissues
Thesocketsizeis relatedto theTCPwindow size.TCPusesthewindow sizeto tell theremote
hosthow muchbuffer spaceit hasavailableto receivedata.Thisavoids theremotehostfrom over-
flowing thebuffers of the local host. Fromtheresults shownin Figure4.12,this implementation
of TCPsetsthewindow sizeto half thesocket size.
The latency increasesby 133 ï s at a datasize equivalent to half the socket size. This is
equivalent to the time it takes to sendan acknowledgement. The latency is due to the fact that
transmitted datamustbe acknowledged before new datacanbe transmitted. In the latest Linux
kernel (2.4.x),thesocket sizecorresponds directly to thewindow size.
Conclusionsfor ATLAS
We have seenherethat thebigger thesocket size, thebetter theperformancesincemoredatacan
be received beforean acknowledgement is transmitted. In the caseof ATLAS wherethereare
around 1700 connections pernode,we cannot useanarbitrarily large socket sizes.
The optimum is to tunethe socket size is the product of bandwidth andthe round trip time,
alsoknown asthebandwidth delayproduct. This givesthenumber of bytesthatcanbestored in
the connection betweenthe client andserver. With this setting the link canbe fully utilised in a
oneway transmission.
4.4.7 Resultsof CPU usageof comms1 with TCP
The measurementswere repeated, but this time we useda low priority thread to measurethe
CPU load asdescribed in Section4.3. The results for the latency andthroughput areshownin
Figure4.13. Theplot of theCPUload is shown in Figure4.14. Note that for thesingle segment
region, themeasurementsof Figure4.13have not changedwhencompared to Figure4.10.
TheCPUloadfor a single segment(messagesizeof up to 1460bytes)reachesa maximumof
60%. Figure4.15shows a crude modelof the CPUbusy andidle timeson the client andserver
during theping-pongmeasurement(it does not take into account the interrupt dueto sending). It
shows thatwhenoneCPUis busy, theotheris idle. Furthermorethereis anoverlapwhenneither
processoris busy. This is due to the extra time the message spends being sentfrom one node
to the other. We label this time the minimum I/O time and it is dueto the PCI bus, NICs send
andreceive partsof the protocol andthe link. Therefore we expect the CPUusage to be always
below50%(wheretheprocessorsarethesameat eitherends). This is true if the interrupt dueto
sending is lessthan theminimumI/O time. This is the casesincethe interrupt dueto sending is

4.4TCP/IP protocol 73
0 2000 4000 6000 8000 10000 12000 140000
2
4
6
8
10
12Throughput obtained in comms 1 exercise. 64k socket size. Nagle off. With CPU usage
Th
rou
gh
pu
t. M
Byte
s/s
Message size. Bytes
(a) Throughput
0 2000 4000 6000 8000 10000 12000 140000
1000
2000
3000
4000
5000
6000
7000Latency obtained in comms 1 exercise. 64k socket size. Nagle off. With CPU usage
Message size. Bytes
La
ten
cy.
use
cs
(b) Latency
Figure4.13: Comms1 under TCP/IPwith CPU load measured: Delayedack disabled: CPU =
Pentium200MHz MMX: Naglealgorithm disabled: Socket size= 64 kBytes OS=Linux2.0.27
18 ï s andthe NIC sendandreceive overhead aloneis 21 ï s. Figure4.14clearly shows that the
maximumCPUload is around 60%. We attributethis to theextra work in sending andreceiving
theacknowledgement which is sentimmediately on receipt of a packet.
Comparing theCPUloadmeasurementsof Figure4.14with thelatency andthroughput mea-
surementsof Figure4.13, we seethat for multiple TCPsegments, the latency andthe CPUload
fluctuate randomly. We alsoseethat thegenerally, thecommunications performancedropsasthe
CPUloaddrops. Fromthis,wecanconcludethattheOSis not switching fastenoughbetween the
CPUload measuring threadandcommunicationsthread, thus giving moreCPUtime to the load
measuring thread (note thatin thismeasurement,theserverhasno loadmeasuring thread,sowhat
we seehereis dueto theclient’s loadmeasuring thread).
We suspect that this behaviouris dueto thenumber of packetssent andreceivedby theclient
node. The scenario is as foll ows. Whenan outgoing ping messageof a singlesegment is sent
from theclient to theserver, theserver generatesanacknowledgementandsendsit immediately.
Whenthereturning pong messageis ready to besent, it sendsthatalso. Whensending messages
spanningtwo or moresegments,theserversendsanacknowledgement for eachincomingsegment.
This effectively doublesthenumber of packetssentandreceivedpersecond.
To prove this, we reduce the numberof packetsper seconds by re-enabling the delayed ac-

74 Chapter4. Network interfacingPerformanceissues
0 2000 4000 6000 8000 10000 12000 140000
10
20
30
40
50
60
70
Per
cent
age
CP
U u
sage
CPU usage obtained in comms 1 exercise. 64k socket size. Nagle off
Message size. Bytes
Figure 4.14: CPU usagefrom comms1 un-
der TCP/IP with CPU load measured: De-
layedackdisabled: CPU= Pentium200MHz
MMX: Naglealgorithmdisabled: Socket size
= 64 kBytes OS=Linux2.0.27
Idle
Minimum I/O time = Link time + 2(PCI + NIC) time
Idle
Idle
Idle
Busy
Busy
Busy
Busy
ClientCPU
ServerCPU
Idle
Idle
Time
Figure 4.15: A model of the CPU idle and
busytimeduring thecomms1 measurements.
0 1000 2000 3000 4000 5000 6000 7000 8000 9000 100000
2
4
6
8
10
12
Message size. Bytes
Thr
ough
put.
MB
ytes
/s
Comms 1. Raw Ethernet sockets vs. TCP/IP. kv2.0.27. 200 MHz
TCP/IP Raw Ethernet
(a) Throughput
0 1000 2000 3000 4000 5000 6000 7000 8000 9000 100000
500
1000
1500
2000
2500
3000
3500
4000
4500
Message size. Bytes
Late
ncy.
use
cs
Comms 1. Raw Ethernet sockets vs. TCP/IP. kv2.0.27. 200 MHz
TCP/IP Raw Ethernet
(b) Latency
Figure4.16: Comms1 under TCP/IPandraw Ethernetsocketswith CPU load measured: CPU
= Pentium200MHz MMX: Naglealgorithm disabled: Delayedackon: Socket size= 64 kBytes
OS=Linux2.0.27

4.4TCP/IP protocol 75
0 500 1000 1500
60
80
100
120
140
160
180
200
220
240
260
Message size. Bytes
Late
ncy.
use
cs
Comms 1. Raw Ethernet sockets vs. TCP/IP. kv2.0.27. 200 MHz
TCP/IP Raw Ethernet
Figure4.17: Themagnification of Figure4.16(b). The latency from comms1 underTCP/IP and
raw Ethernet socketswith CPUload measured:CPU= Pentium200MHz MMX: Naglealgorithm
disabled: Delayedackon: Socket size= 64 kBytes: OS=Linux2.0.27
0 1000 2000 3000 4000 5000 6000 7000 8000 9000 100000
10
20
30
40
50
60
Message size. Bytes
Per
cent
age
CP
U u
sage
Comms 1. Raw Ethernet sockets vs. TCP/IP. kv2.0.27. 200 MHz
TCP/IP Raw Ethernet
(a) Singleandmultiple segments
0 500 1000 150020
25
30
35
40
45
Message size. Bytes
Per
cent
age
CP
U u
sage
Comms 1. Raw Ethernet sockets vs. TCP/IP. kv2.0.27. 200 MHz
TCP/IP Raw Ethernet TCP/IP model Raw Ethernet model
(b) Singlesegmentonly
Figure4.18:Comms1 underTCP/IP andraw Ethernetsockets:CPU= Pentium200MHz MMX:
Naglealgorithm disabled: Delayedackon: Socket size= 64 kBytesOS=Linux2.0.27

76 Chapter4. Network interfacingPerformanceissues
knowledgements (theacknowledgements aretherefore piggybacked)andstill with theCPUmea-
suring thread enabled. Theresults areshown in Figure4.16. Also plotted in Figure4.16arethe
results of thecomms1 measurementon raw Ethernet SOCK PACKET interface,that is bypassing
the TCP/IPstack(SeeFigure4.2). Comparingthe TCP curve of Figure4.16 with Figure4.13,
although thereis still a lot of randomness,thereis improvementin the communications perfor-
mance.This shows that reducing the packet ratehelps the performancesince the OS scheduler
switches at a lower ratebetweenthreads.
Conclusionfor ATLAS
For the ATLAS trigger system, a computation is required on the processing nodestherefore we
cannot avoid theuseof multiplethreads.Reducing themaximumdatasizeis notasolution because
datacanbe coming in from multiple sources andwill cause the sameeffects. For ATLAS, the
behaviour of this version of theLinux scheduler (kernel version 2.0.27) is not ideal. A statement
on suitability for ATLAS cannot be madewithout consideringhow this behaviour changeswith
the CPUspeed andrelating it to the likely processorspeed to be used in the LVL2 system. The
effect on theperformanceof theTCP/IPcommunicationswith respect to CPUspeedis looked at
later in this chapter.
We canconcludethat thedelayedacknowledgement in theabsenceon theNaglealgorithm is
notdetrimental to thecomms1 performance. Furthermore,thedelayedacknowledgement reduces
theloadon theCPU.
4.4.8 Raw Ethernet
Bypassing the TCP/IPprotocol and using raw Ethernet SOCK PACKET interfacegives us the
curvelabelled“Raw Ethernet” in Figure4.16.With theSOCK PACKET interface,theapplication
using theinterfacemustsupply apre-formatedEthernetframe(with thesourceandanddestination
address,the type field and the data. The CRC is done by the NIC) for transmission. Thus for
messageswhich spanmultiple Ethernet frames,theapplicationmustperform thepacketisation.
Figure4.16shows that the raw Ethernet curveshave lessrandomnessfor messages spanning
multiple EthernetframesthanTCP. This demonstrates that theperformancelossdueto switching
between thread depends on how much processing time the protocol uses. It also demonstrates
the TCP/IP overhead is around 40 ï s. This is seenmore clearly in Figure 4.17. Under these
conditions, for TCP/IP, Equation 4.1becomes

4.4TCP/IP protocol 77
ð ñòôóþõz÷?ø�õ ��� ûýüöø�õ � ÷�� (4.12)
For raw Ethernet,Equation 4.1becomes
ð ñòôóþõz÷?ø�õ76ù"û ü<6ú!÷ � (4.13)
for raw Ethernet sockets. Figure4.18showstheCPUload obtainedfrom thecomms1 measure-
ment. In Figure4.18(b), we alsoshowthe measurementsagainsta parameterised modelof the
CPUloadfor messages limited to a singlesegment.Themodelis describedbelow.
4.4.9 A parameterisedmodelof the CPU load
Giventhebehaviourof this implementation of TCP/IP, wemodeltheCPUloador usagefor single
segmentmessages.
TheCPUload is ameasureof how hardtheCPUworksduring thecommunications. It depends
onthesendsandreceives(ping-pongs)it doeseach second. Thenumberof ping-pongspersecond
is thereciprocal of theround trip time (twice theend-to-end latencyð ñò ). WemodeltheCPUload
assomefixedvalue plusa valuedependent on thenumber of ping-pongs persecond.
=?>A@ ��B $ % óDC B ü øú ð0ñò
E C � �4� (4.14)
Where C B is thefixedvalue independent of thenumberof ping-pongspersecond. C B therefore
representsloadin setting up theping-pongmeasurement.ð ñò is theend-to-endlatency. C � �F� is the
CPUload per ping-pong. We have the value ofð ñò from the ping-pongmeasurement.To obtain
the values of C B and C � �4� we selectedtwo message sizesandsolved two simultaneous equations
based on themeasured latency andCPUload onFigure4.17andFigure4.18(b). For TCP/IP, C B is
14.0%and C � �4� % is��� ù�õ E ø�õ �HG %s.For raw Ethernet C B is also14.0%and C � �4� is �&ÿ � õ E ø�õ �HG %s.
Thereforewhencomparedto raw Ethernet, theTCP/IPprotocolhasanextra loadof 49%perping-
pong.
4.4.10 Conclusionsfor ATLAS
TCP/IPhasa 49%larger overheadperping-pong than raw Ethernet. However, raw Ethernet does
nothaveadaptivecongestioncontrol, lossdetectionandrecovery. For ATLAS,usingraw Ethernet
implies relying solely on the underlying Etherneterror detection andflow control mechanismor

78 Chapter4. Network interfacingPerformanceissues
building somedegreeof error and lossdetection andrecovery protocol on top of raw Ethernet.
In the latter case,the performanceis not guaranteed to bebetter thanTCP/IP. Thepotential gain
would have to beweighedagainst othercosts suchastheextra developmentandmaintenance.
4.4.11 Gigabit Ethernet compared with FastEthernet
Sofar wehave lookedat theperformanceunder FastEthernet. In thissection wecompareTCP/IP
comms1 performanceunderFastandGigabitEthernet.
For theGigabitEthernet tests,weusetheAlteon ACENIC.At Gigabitrates, framescanarrive
into the NIC at ø�÷ � 9�9 E ø�õ G packets/s. If an interrupt wasto be sentto the CPU for eacharriv-
ing frame,the CPUwould be constantly dealing with interrupts,leading to the situation seenin
Section4.4.7andFigure4.13.Recallthat thesetupusedto producetheplotswaswith theNagle
algorithm and more importantly the delayed acknowledgement both disabled. This meantthat
for every segmentreceived,a separateacknowledgement is sent. Therefore for eachsegment of
datasentby a host, thereare four interruptsgenerated. At the sender, thereis an interrupt due
to the transmissionof the segment. Thereare two interrupts at the receiver, the first when the
packet is receivedandasecond whentheacknowledgement is sent.Finally, there is aninterruptat
thesender whentheacknowledgement is received. The load of dealing with theseinterruptsand
scheduling a computationprocessis whatled to theshapeobservedin Figure4.13.
To helpincreasethecommunicationsperformanceby reducing thenumberof interrupts,most
current generation NICs have what is known as“interrupt mitigation”. In the Alteon ACENIC,
this is referredas“coalesce-interrupts”. It allows theuserto regulate how many framesto collect
on the NIC before transmitting on the link or raising an interrupt andpassing it to the CPU.For
these tests, the coalesceinterrupts feature wassetsuchthat a single packet triggered a sendor
receive. This avoid inaccurateroundtrip time measurements.
Figure4.19shows thethroughputandend-to-end latency plotsagainstmessagesizefor Giga-
bit EthernetandFastEthernet. Themeasurementswereperformedusing theLinux kernel version
2.2.14on 400 MHz processors. No drivers areavailable for the ACENIC underLinux version
2.0.x. Also shown arethelinesof bestfit. Unlike thepreviousplots for thekernel version2.0.27,
thereis a lot of fluctuationsfor bothFastandGigabitEthernetatsmallmessagesizes.Weattribute
this to the change in the OSfrom Linux kernel version 2.0.27to 2.2.14. Ignoring thesefluctua-
tions, thegradient of the line of bestfit is 0.0879 for theFastEthernet line (FE) with anintercept
at 80.2 ï s. For theGigabitEthernet(FE) line, thegradient is 0.0259 with aninterceptat 91.2 ï s.

4.4TCP/IP protocol 79
Therefore theequivalentof Equation 4.1 for FastEthernet is
ð�ñòôóþõz÷Aõ 9 ÿ�ù"û ü 9 õz÷Cú (4.15)
The differencesbetween Equation 4.1 andEquation 4.15 is dueto the different CPUspeeds
andkernel change.For GigabitEthernet theequation is:
ð ñòôóþõz÷Aõ&ú � ù"û ü ùzø�÷Cú (4.16)
Thedifferencebetweenthe gradient of the FastandGigabit Ethernet is attributedto the link
rateandthedifferencein theinterceptsto theNICswith thedifferentdrivers.
Comparing theFastEthernetTCP/IPcurvesof theLinux kernel version 2.0.27(Figure4.17)
and2.2.14(Figure4.19(b)), we seethat therearemorefluctuationsat thesmallmessage sizes for
thenewerkernel (version 2.2.14)thanfor theold. Betweenthesetwo kernel versions,thechanges
which could accountfor thesefluctuationsaretheNIC driver, thescheduler andtheTCP/IP stack
itself.
TheCPUloadis shownin Figure4.20.Themodelled FastEthernet reachesa CPUutilisation
of 45%andmodelledGigabitEthernetreaches40%.For GigabitEthernetmeasurement,themaxi-
mumCPUloaddoesnot increasefrom amessagesizeof 500bytesto zerobytes.In Figure4.19(b)
we alsonotethat thelatency does not decreasefrom a message size500bytesto zerobytes.This
mustbeclearly dueto theinterrupt mitigation(sinceahigher rateis achievedby theFastEthernet
NIC) limiti ng therateof interruptandhence thenumber of sendandreceivesto around 10000per
second.
FromEquation 4.14,thevaluefor C B is 4.0%for GigabitEthernetand5.7%for FastEthernet.
Thevalueof C � �4� is 6 � ÿÿ E ø�õ �HG %sfor GigabitEthernet and 6ú � � E ø�õ �HG %sfor FastEthernet.
Conclusionsfor ATLAS
For applicationswith arequest-responselike communicationsandwith messagesizesin therange
shown in Figures 4.19 and 4.20, the host sendand receive latency dominate the link latency.
Therefore in this range, thereis no greatadvantages in usingGigabitEthernet over FastEthernet
whenweconsiderthatthecurrent costtheGigabitEthernet NIC is five thatof FastEthernet.
Testson Gigabit Ethernet underWindows NT 4.0 showed an increasein the fixed latency
overheadof atleast 21%comparedto Linux. Wemeasured160 ï sona233MHz NT PCcompared
with 132 ï son a 200MHz Linux PC.

80 Chapter4. Network interfacingPerformanceissues
0 500 1000 15000
2
4
6
8
10
12
Message size. Bytes
Th
rou
gh
pu
t. M
Byte
s/s
FE and GE comms 1. 400 MHz. kver 2.2.14
GE FE GE modelledFE modelled
(a) Throughput
0 500 1000 15000
50
100
150
200
250
300FE and GE comms 1. 400 MHz. kver 2.2.14
Message size. Bytes
La
ten
cy.
use
cs
GE FE GE modelledFE modelled
(b) Latency
Figure4.19: Comms1 underTCP/IP for FastandGigabit Ethernet: Delayedack on: CPU us-
agemeasured: CPU = Pentium400 MHz: Naglealgorithm disabled: Socket size = 64 kBytes
OS=Linux2.2.14
0 500 1000 150015
20
25
30
35
40
45
50
Message size. Bytes
Per
cent
age
CP
U u
sage
FE and GE comms 1. 400 MHz. kver 2.2.14
GE FE GE modelledFE modelled
Figure4.20: CPU load for comms1 under TCP/IPfor FastandGigabit Ethernet: Delayed ack
on: CPUusagemeasured: CPU= Pentium 400MHz: Naglealgorithm disabled: Socket size= 64
kBytesOS=Linux2.2.14

4.4TCP/IP protocol 81
100 200 300 400 500 600 70050
60
70
80
90
100
110
120
130
140
CPU speed. MHz
Com
ms
1 fix
ed o
verh
ead.
use
cs
Comms 1 fixed overhead for various CPU speeds
FE kernel 2.0.27FE kernel 2.2.14GE kernel 2.2.14
Figure4.21:Theeffect on thefixedlatency overheadwhenchanging theCPUspeed.
4.4.12 Effects of the processorspeed
Looking at Figure4.15,we canseethat increasingthe CPUspeed on both the client andserver
hosts will reduce thebusy time. This will have oneof two possibleeffects depending on how the
busy time comparesto theidle time.
1. If the busy time doesnot decreasesignificantly compared with the idle time as the CPU
speedincreasestheobservedCPUloadwill decreasewhile theend-to-end latency will re-
mainfairly constant.This is anindicationthat wearelimited by theI/O.
2. If the busy time decreasessignificantly compared with the idle time, then the numberof
ping-pongswill increase. The effect is that the CPU load observed will remainconstant
while theend-to-endlatency will decrease.This is an indication thatwe arelimited by the
software. It cannot reachtheI/O limit.
Theperformancecomparisonof TCP/IP running on variousspeedprocessors, three different
kernelsversionsof Linux andFastandGigabitEthernetaresummarisedin Figure4.21. Theplot is
of theCPUspeedagainstfixedlatency overhead.Weseefirstly that theolder2.0.27version of the
Linux kernel performsbetter thanthenewer2.2.14. Thiscouldbetheeffectof optimisationsmade
in areassuchastheschedulerof theLinux kernel version2.2.14deteriorating thecommunications
performanceor simply, thecommunicationscode(for example theNIC driver andTCP/IPstack)
is lesswell optimised in Linux version 2.2.14thanin 2.0.27. We alsoseethat the performance
of theGigabitEthernet is consistently worsethanthatof FastEthernet. This mustbebecauseof
higher overheadin theNIC andthedriver.
Wecanconcludethattheprotocolcannot reachtheI/O limit. Thedifferencebetweentwo PCs
running at different speedsis not simply theclock speed of themachines.Thearchitecture of the

82 Chapter4. Network interfacingPerformanceissues
chipschanges.For example, thecachesizeandthenumberof pipelinestagesin theprocessormay
change.Furthermoreon themotherboarditself, thePCIchipset maychange.Wehaveseenduring
our teststhatdifferentchipsetshave different performance.In light of this andthelimited number
of points in Figure4.21,it is difficult to concludeany morefrom thefigure. We comebackto the
issue of CPUspeedeffects in Sections4.5.2and4.6.2.
4.5 TCP/IP and ATLAS
4.5.1 DecisionLatency
Therequired average decision time for the ATLAS LVL2 trigger/DAQ is 10 ms. If TCP/IPis to
beused,theend-to-endlatency for 1 kByteson a 400MHz processoraccording to Equation 4.15
and4.16is 170.2 ï s for FastEthernetand117.7 ï s for GigabitEthernet. If weassumetherequest
sizeto betheminimumpacket size(althoughit is likely to bemore),thenthe requesttakes82.2
and 91.2 ï s for Fast Ethernet and Gigabit Ethernet respectively. Collecting 1 kBytes from 16
ROBs if donein parallel will be dominated by the latencies in getting the responsesasthey will
arrive at thedestination serially. Thetime taken will beapproximately
collection time óJI7K�L3M�K1N1O +QP O�K�R:CTSôü � ø�6 E responselatency � (4.17)
This gives2.8 ms for FastEthernetand2.0 ms for Gigabit Ethernet. With the requirement
of the averageLVL2 decision time of 10 ms, this leaves around 7 ms for any network latency
andrunning the LVL2 algorithm on the processor. Overlapping of event processingreducesthis
latency. However, it is alsonecessaryto account for queueingandcongestionin thenetwork. For
a full TRT scan, messageswill berequestedandreceivedfrom 256ROBs.
An unresolved issueis the scalability of TCP/IP. We do not know how TCP/IPperformance
suffers asthe number of connections increase.Given our observations in Section4.4.7,this im-
plementationof TCP/IPdoesnot scalewell with a high frequency of packetspersecond. This is
moredueto the OS than to TCP/IP. The effects of the TCP acknowledgements with increasing
number of connections hasalsonot beenlookedat.
Thusit is not clear thatTCP/IP will beableto meettheATLASLVL2 requirements.

4.5TCP/IP andATLAS 83
4.5.2 Request-responserate and CPU load
Running the LVL2 algorithm requires CPU power. We have seenthat up to 45% of the CPU
power canbe spent on communication. Herewe expandon this to look at the request-response
rateagainst theCPUusage.
Server
ClientTime
Computation
Communication
CommunicationThread 1
Thread 1
Thread 2
Transmit
Transmit
Receive
Receive
Pause
Figure4.22:Themodifiedcomms1 setup to allow themeasurementof Request-responserateand
theclient CPUload.
We modify thecomms1 measurementby firstly fixing thesizeof themessage. We alsoput a
pauseof varying length between theserver’sreceiveandtransmit timeasillustratedin Figure4.22.
The delay is implemented in the form of a tight loop to enable us to control the pausewith mi-
crosecondprecision andultimatelyto control therequest-responserate.As before, theCPUload
is measuredat theclient host.
Figure 4.23 shows the request-responserateagainst client’s CPU load for FastandGigabit
Ethernet, using theminimumandmaximumEthernet framelengthson 400MHz processors. No-
tice that for eachcase,themaximumrequest-responseratecorrespondsto theminimumpauseat
theserver. Thefigureshows thatfor agivenrequest-responserate,theclient’s CPUloadis almost
thesamefor FastandGigabitEthernet. Thisshowsthatthereis little dependency of theCPUload
on thelink technology.
The work donein [28] hasshown that based purely on the network (that is: no processing
time is accounted for), at least550 processorsare required to meetthe average ATLAS LVL2
throughput at 75 kHz, otherwise thenetwork becomesunstable. From[4], thecombinedrequest
rate to the LVL2 ROBs is 6114 kHz. Using theseresult, the average LVL2 processorrequest-

84 Chapter4. Network interfacingPerformanceissues
0 1000 2000 3000 4000 5000 60000
5
10
15
20
25
30
35
40
45
Request−Response/s
Clie
nt’s
% C
PU
usa
ge
Direct comms 1. 400 MHz. Kernel 2.2.14
GE TCP/IP 6B GE TCP/IP 1460BFE TCP/IP 6B FE TCP/IP 1460B
Figure 4.23: Request-response rate against
CPU for Fast and Gigabit Etherneton 400
MHz PC.OS=Linux2.2.14
0 1000 2000 3000 4000 5000 6000 7000 8000 90000
5
10
15
20
25
30
35
40
45
50FE comms 1. TCP/IP min frame size. Kv 2.2.14
Request−response/s
Clie
nt’s
%C
PU
load
200 MHz400 MHz450 MHz600 MHz
Figure4.24: The Measured request-response
rate againstCPU load for various processor
speeds
responserateis 6114/550=11000Hz. TheworstcaseLVL2 ROB request-responserateis 12050
Hz [4].
Figure4.24showsthemaximumrequest-responserate(minimum Ethernet framesize)against
theclient’sCPUloadasmeasuredonfour differentprocessorspeeds. In eachcase,boththeclient’s
andserver’s CPUwerethesamespeed. TheFastEthernet results arepresentedhere. Figure4.25
shows the extrapolation of this to 100% CPU usage. This shows that we can reach a request-
responserateof 11 kHz to 12 kHz using a processorof around 300MHz at 100%saturation.
0 0.2 0.4 0.6 0.8 1 1.2 1.4 1.6 1.8 2
x 104
0
10
20
30
40
50
60
70
80
90
100FE comms 1. TCP/IP min frame size. Kv 2.2.14
Request−response/s
Clie
nt’s
%C
PU
load
200 MHz400 MHz450 MHz600 MHz
Figure 4.25: Extrapolation of the minimum
frame(Figure 4.24)to 100% CPUload
200 250 300 350 400 450 500 550 6000.5
1
1.5
2x 10
4
CPU speed. MHz
Req
uest
−re
spon
se/s
Request response rate at 100% CPU load
Min frame sizeMax frame size
Figure 4.26: The relationship between the
TCP/IPrequest-responserateandCPUspeed
at 100% load for minimum and maximum
framesizes

4.5TCP/IP andATLAS 85
In Figure4.26,weshow therelationshipbetween theCPUspeedandtherequest-response for
theminimumandthemaximumframesizes.A request-response rateof 12 kHz is reachedfor the
maximumframesizeat around 600MHz processorspeedat 100%CPUload.
4.5.3 Conclusionfor ATLAS
TheTCP/IPprotocol wasdesignedasarobustgeneral purposeprotocol. It is in wide usetodayas
the protocol for the Internet. It works especially well on thedesktop wherethe usercantolerate
latenciesof theorder of millisecondsandabove.
Therehave been enhancementssinceits introduction to improve its general performancein a
variety of situations,mainly for WAN application. As we have seenhere,a combinationof these
enhancements canprove disastrousin termsof network performancefor an application with the
traffic pattern similar to theATLAS request-responsemodel.
If TCP/IPis to beconsidered for theATLAS LVL2 trigger network, careful attention mustbe
paid to the implementation detail of the protocol version used. Specifically, theNaglealgorithm
should bedisabledandthedelayedacknowledgement enabled to reduceCPUoverhead causedby
data-lessacknowledgements.
Theimplementationof TCP/IPunder Linux hasrevealedtheaveragecollection latency of 2.8
ms for FastEthernet and2.0 ms for Gigabit Ethernet on a 400 MHz CPUfor the ATLAS LVL2
system.However, this latency doesnot includethenetwork latency.
We have alsoseenthat a fastpacket ratecandegrade thecommunicationperformancein the
presenceof a second thread. A solution couldbetheuseof a real-time scheduling systemwhere
thedelivery of incoming packets is boundedin time.
TCP posses other problems for ATLAS. TCP is a connection oriented protocol and hence
requires any two communicating nodes to have a connection. A connection on a node takes up
resourceslike buffers and CPU time to manage it. In the LVL2 system, eachprocessormust
connectto 1700 ROBsandviceversa. Wehavenotstudiedtheeffectontheperformanceof anode
on supporting 1700connections. Alternatively, connections could be madeany time a message
needs to besent andtorn down afterthetransfer. Theproblem with this scenario is thateachTCP
connection takesthreeTCPsegmentsanda disconnection takesfour (sincea TCPconnectionis
full- duplex). This will increasethelatency permessage.
T/TCPor TCPfor transaction[25] reducesthetimefor transmitting amessagevia TCP. Rather
thansetting up a connection, sending the datathenclosing down the connection, this is all done

86 Chapter4. Network interfacingPerformanceissues
with three packets. Oneto initi atethe connection, onefor the actualmessage anda final packet
to closethe connection. Currently, the implementation of TCP/IPunder Linux doesn’t support
T/TCP.
Theperformanceof theTCP/IPstackdependson its implementation. Thenormalimplemen-
tation is in theOSkernel, thustheperformanceof TCP/IPis tied to theOSperformance.In order
to truly assesstheperformanceof theTCP/IP protocol, it will benecessaryto abstract it from the
kernel.
Themeasurementscarriedout haveshownthat:î for todaysCPUs,theoverheadperrequest-responseis high.î thereis unpredictability in thelatency dueto theLinux OS.î thescalability of many connections is a concern.
Therearea numberof waysthattheperformanceof TCP/IP maybeimproved.î FasterCPUsexecuting thecommunicationsfaster,î SMPsystemsincreasingtheamount of processortime dedicatedto communications.î Betterimplementation of theprotocol stackandtheoperatingsystem.î IntelligentNICs off loading someof theprotocol processing from theprocessor.
4.6 MESH
Wehave shown abovethat thereareissueswith TCP/IP which have to beresolvedfor theATLAS
LVL2 system where low-latency high-throughput communication and scheduling are required.
Boosten [10] hasshown that on 200MHz Pentium,a Linux system call requires8 ï s of overhead
and18-20 ï s for an interrupt. He alsomeasured a context switch time of 12 ï s (which includes
a systemcall). Theseareexpensive becausethey involve the CPU switching between user and
kernel space. In addition aninterrupt requirestheCPUregistersto besavedandoftenrequire the
invocation of the OS scheduler. MESH wasdevelopedto overcome these communications and
scheduling overheads.An overview of MESHis givenin Appendix B.
4.6.1 MESH comms1 performance
Thecomms1 performanceof MESH comparedwith Ethernetis shown in Figure4.27and4.28.
The figuresshowboth FastandGigabit Etherneton 400 MHz processors. From the end-to-end
latency plot shown in Figure4.27(b), we seethat theMESH linesarevery stableat low message
sizescompared to the TCP/IP plots. This implies that MESH performancedoesnot suffer with

4.6MESH 87
high packet rates. Thereare two reasons for this. Firstly, ratherthanusing interrupts to detect
thearrival of packetsMESH usespolling at 10 ï s intervals.Secondly, MESH is a single process
running in user space (seeFigure4.2). It is MESH’s own lightweight userthread that switches
between MESHthreadsandnot theOSscheduler.
Theequationdescribing theline of MESHwith FastEthernet in Figure4.27(b) is
ð ñòôóþõz÷Aõ 9 õ&ú"û ü ú 9 ÷Aõ (4.18)
Theequation of MESHwith GigabitEthernet is givenby
ð ñòôóþõz÷Aõ&ú��ú"û ü ú�6!÷Cù (4.19)
Theseresults together with thosefor TCP/IP aresummarisedin Table4.1. TheOverheadper
bytecorrespondsto thegradientandthefixedsoftwareoverheadcorrespondsto thefixedoverhead
with the link overhead andtheNIC send andreceive overhead subtracted.Thevaluesof theNIC
sendandreceive overheadareobtainedfrom [10]. They are10.5 ï s for bothFastEthernet send
andreceive and6.1 ï s for Gigabit Ethernet sendand10.5 ï s Gigabit Ethernetreceive. The link
overhead is the link time for the minimum Ethernet packet. This is 5.76 for FastEthernet and
0.576for GigabitEthernet. ThefixedsoftwareoverheadthereforeincludesthePCIoverhead.
Description FastEthernet GigabitEthernet
Overhead per byte.U s/byte
Fixed software overhead.U s Overheadperbyte U s/byte Fixed software overhead.U sTCP 0.0879 53.44 0.0259 74.02
MESH 0.0802 1.24 0.0232 9.42
Table4.1: A comparisonof theMESHandTCP/IPoverheadsperbyteandfixedoverheads
Figure 4.28 shows the MESH CPU load and the model CPU load. The model is basedon
Equation 4.14.For FastEthernet, C B is 2.0%and C � �4� is� � ú E ø�õ �HG %. For GigabitEthernet, C B is
1.0%and C � �4� is ú�6�� E ø�õ �HG %. A summaryof thesevalueandhow they compareto FastEthernet
is givenin Table4.2.
From Equation 4.17,we calculate the average collection time for MESH is 1.8 ms for Fast
Ethernet and829 ï sfor GigabitEthernet. Figure4.30showstherequest-responserateagainst CPU
load for MESH andTCP/IPperformedon the same400 MHz processors. The MESH lines are
labelled MFE for FastEthernet andMGE for GigabitEthernet. As before, we plot theminimum
andmaximumframesizes.

88 Chapter4. Network interfacingPerformanceissues
Description FastEthernet GigabitEthernet
FixedCPUoverhead V"W . % CPU overhead per ping-
pong V�X Y"Y . %s
FixedCPUoverhead V�W . % CPU overhead per ping-
pong V�X Y"Y . %s
TCP 5.7 6243ZT[�\^]�_ 4.0 6577Z`[�\a]/_MESH 2.0 452Z`[b\c]�_ 1.0 263Z`[b\^]�_
Table4.2: A comparison of theMESH andTCP/IP fixedCPUoverheadandfixedCPUoverhead
perping-pong
0 500 1000 15000
5
10
15
20
25
Th
rou
gh
pu
t. M
Byte
s/s
Message size. Bytes
Comms 1 MESH and TCP. FE and GE. 400 MHz kver 2.2.14
TCP GE TCP FE MESH GEMESH FE
(a) Throughput
0 500 1000 15000
50
100
150
200
250
Message size. Bytes
La
ten
cy.
use
cs
Comms 1 MESH and TCP. FE and GE. 400 MHz kver 2.2.14
TCP GE TCP FE MESH GEMESH FE
(b) Latency
Figure4.27: Comms1 under MESH andTCP/IP for FastandGigabitEthernet: CPU= Pentium
400MHz: OS=Linux2.2.14

4.6MESH 89
0 500 1000 15000
5
10
15
20
25
30
35
40
45
Message size. Bytes
%C
PU
load
Comms 1 MESH and TCP. FE and GE. 400 MHz kver 2.2.14
TCP GE TCP FE MESH GEMESH FE
Figure 4.28: CPU load for comms1 under
MESH andTCP/IPfor FastandGigabitEth-
ernet: CPU= Pentium400 MHz: OS=Linux
2.2.14
0 500 1000 15003
4
5
6
7
8
9
10
Message size. Bytes
%C
PU
load
Comms 1 MESH. FE and GE. 400 MHz kver 2.2.14
MESH GE MESH FE Model GEModel FE
Figure 4.29: CPU load for comms1 under
MESH. Model vs. Measurementfor Fastand
Gigabit Ethernet: CPU= Pentium400 MHz:
OS=Linux2.2.14
Weseefrom theMESH curvesthatfor GigabitEthernet,weareable to reach12000 requests-
responses/s: the raterequired by the ATLAS LVL2 trigger processors.For FastEthernet we are
unable to reachthis ratefor themaximumframesizedueto thelimitationsof thelink speed.
We concludethat MESH hasdramatically lower CPU utili sationthan TCP/IP andis ableto
reachthe performancerequired by theATLAS LVL2 system at very low CPUutilisation (5% or
less).
FromFigure4.30,it canbeenseenthatthereis nomessagesizedependentoverhead for MESH
since the curvesfor the minimum andmaximumframesoverlap. This is dueto the fact that the
only copy in theMESHcommunicationshappensbetweentheNIC andmainmemory.
4.6.2 Scalability in MESH
In order to testthescalability of MESHwith CPUspeed,we lookedat thefixedoverheadaswith
TCP/IP. For both FastandGigabit Ethernet, we noticedthat the fixed overhead hardly changed
with the CPU speed. This leadsus to believe that with MESH we areapproaching the limit of
the NICs. Therefore we looked at the maximumCPUload asa function of CPUspeed. This is
plotted in Figure4.31. This shows that for both FastandGigabit Ethernet, the maximumCPU
loaddecreasesastheCPUspeedincreases.Thisplot clearly requiresmorepointsbeforeany other
concreteconclusions canbedrawn.

90 Chapter4. Network interfacingPerformanceissues
0 0.5 1 1.5 2 2.5 3 3.5 4
x 104
0
5
10
15
20
25
30
35
40
45
Request−Response rate per second%
CP
U u
sage
MFEmaxf MGEmaxf
MFEminf
MGEminf
TFEmaxf
TGEmaxf
TFEminf
TGEminf
Figure4.30: FastandGigabit Ethernet CPU load for MESH andTCP/IPfor the minimum and
maximumframelengths. CPU = Pentium400 MHz: OS=Linux 2.2.14. T=TCP/IP, M=MESH,
FE=FastEthernet,GE=GigabitEthernet,minf=minimum frame,maxf=maximum frame.
400 450 500 550 600 650 7003
4
5
6
7
8
9
10
CPU speed. MHz
Max
% C
PU
usa
ge
Comms 1 MESH. FE and GE. kver 2.2.14
MESH GEMESH FE
Figure 4.31: The change in the maximumMESH CPU load for comms1. Fast and Gigabit
Ethernet. OS=Linux2.2.14.

4.7Conclusion 91
4.7 Conclusion
We have shownin this chapter theperformanceof theLinux implementations (in thekernel ver-
sions 2.0.27and2.2.14)of the TCP/IPstack. We have looked at ways in which to get the best
performancefor ATLAS with TCP/IP. We have producedmodels describing the performanceof
TCP/IPas a function of the message size for both Fastand Gigabit Ethernet. The models de-
scribe thenon-pipelined throughput, theend-to-end latency andCPUload.Weconcludedthatthis
implementationof TCP/IPis inadequatefor theATLAS LVL2 systemon today’s processors.
MESH(MEssaging andScHeduling system)hashigh I/O performanceobtainedby usingop-
timiseddriversandscheduling. It hasbetterperformancethanTCP/IPbothin termsof end-to-end
latency andCPU load. We have presentedthe MESH performanceandcompared it to TCP/IP.
MESH unlike TCP/IPdoes not have guaranteedpacket delivery, flow control or packet fragmen-
tation. It uses theflow control providedby thelower layer protocol.
Wehavealsoseenthattheimplementation of theprotocolandindeedtheOSplayanimportant
role. Linux usesan interrupt basedsystem for communication. The consequence is that the
processorcanbelive locked,that is thesystembecomesunresponsive asit spendsa considerable
amount of time servicing interrupts caused by the incoming packets. An example reported by
Poltrack [30] achieved a maximumthroughput of 647 Mbit/s but at the cost of CPU usage of
81.5%. As a result of this potential problem, Gigabit EthernetNICs have interrupt mitigation to
limit thenumberof interruptspersecond generated. MESH is notaffected by thisproblem.It uses
a polling system, so the application programmercandecide how often to poll for newly arrived
packets.Dueto thespeedof GigabitEthernet andfuture networking technologies,integrating the
NIC moretightly to the CPU/Memorysubsystemwill remove the bottleneck andallow full link
utili sation. Signsarethatsuch a system is being developed2.
4.8 Further work
MESHis ableto deliveron theperformance, but by itself it doesnotguaranteedeliveryof packets
or flow control. It relieson theflow control of theunderlying layers. Furtherwork is required in
makingMESH moresuitablefor ATLAS.
We have looked in detail at one implementation of TCP/IP. The performanceis tied very
strongly to the operating system,the way incoming packets aredetected andthe scheduling be-
2http://www.infinibandta.org/home.php3

92 Chapter4. Network interfacingPerformanceissues
tweenprocesses.Furtherwork needs to be done on the TCP/IP performanceon other operating
systembefore generalisation on its performancecanbemade.

Chapter 5
Ethernet Network topologiesand
possible enhancementsfor ATLAS
93

94 Chapter5. EthernetNetwork topologies andpossible enhancements for ATLAS
5.1 Intr oduction
Two factors affecting network performancearethenetwork topology andsize. TheATLAS trig-
ger/DAQ systemrequiresanetwork supporting overathousandnodes.Thecurrent IEEEstandards
for Ethernet donot inhibit thebuildingof largescalableEthernetnetworks,however, ensuring scal-
ability meansusing higher link speedsandthe topologiesarelimited to a tree-like topology (see
Figure5.1). In the treetopology, network performanceis limited to the performanceof the root
switchandredundantlinks arenot supportedexcept in theform of Ethernettrunkedlinks.
In this chapter, we look at thestrategiesthatwecanuseshould thestandardEthernet topology
prove inadequate for theATLAS trigger/DAQ system.
The discussionsin this chapter arebasedon experienceswith real Ethernetswitches andthe
IEEEEthernet standards.We look at thestandardEthernettopology, thenwe identify thefeatures
of Ethernetswitchesinhibiting the construction of non-standard scalableEthernet networks and
presentpossiblesolutions.
5.2 Scalablenetworks with standard Ethernet
UsingEthernet equipmentconforming to thestandards,andwith thestandardconfiguration, what
sort of scalable network can we build? By scalable, we meanthat we are not limited by the
throughput of any link, with increasingnetwork size.For example, givena collection of sayeight
port switches, what sort of scalablenetworks canbe built? In order to connect these switches
in a scalable way, half the links will be dedicatedto the endnodesandhalf will be dedicatedto
connection betweenswitches. SeeFigure5.2. Furthermore, theEthernet standardlimits usto the
treearchitecturein which the scalability of the network dependson the performanceof the root
switchrepresented by switchA in Figure5.1.
For aneight port switch, if we arenot to be limited by any link (avoiding higher link speeds
and using trunking), then no matterhow we connect multiples of these switches, we can only
connecteightnodes asillustratedin Figure5.2. Thusthescalability dependson thespeed of the
fastest links.
A potential problem with Ethernet is in the casewherenodesareconnected via at leasttwo
switches with flow control enabled. It is possible for communicationbetweentwo nodesto block
a shared link usedby multiple nodes. This is illustratedin Figure5.3. In Figure5.3, nodeb1 is
unable to receive at the rateat which nodea1 is sending. This eventually leads to the buffers of

5.2Scalablenetworkswith standardEthernet 95
Key
Switch
Node
A
B C
D E F G H I
. . . . . . . . . . . . . . . . . .
Figure5.1: A treelike topology. Notethata nodecanbeattachedto any of theswitches.
(a) A single 8 port switch. (b) Two 8 port switches
connected in a scalable way using trunked links.
(c) Three 8 port switchesconnected in a scalable wayusing trunked links.
Figure5.2: Connecting thesametypeof Ethernetswitches without being limited by a singlelink
doesnot increasenumberof ports.

96 Chapter5. EthernetNetwork topologies andpossible enhancements for ATLAS
b1 b2 b3 b4 b5
Switch A
Switch B
a1 a2 a3 a4 a5
Figure5.3: A link blockeddueto a slow receiver.
both switch A andB being filled. Subsequently, packetsareagedandthrownaway andalsothe
useful bandwidth of the link betweenswitch A andB is dramatically reduced. This results in a
detrimentaleffectonall communicationsfrom othernodesonswitchA to nodesonswitchB. This
kind of problemis normally solvedby thehigher layerprotocol like TCP, wherethereceivingend
advertisesthemaximumnumber of bytes it is preparedto receive.
Theflow control strategy adoptedby thevendor is important here. On oneswitch we tested,
wewereableto bring thesystem to ahalt asdescribedabove. Two otherswitcheswetested threw
packetsaway if the destination nodecould not receive themfastenough, therefore avoiding the
blockedlink situation.This is of evenmoreconcernfor theeventfilter wherethetraffic patternis
morelike streaming thanrequest-response.
An exampleof the ATLAS LVL2 trigger/DAQ network architecturebasedon current Ether-
net technology is shown in Figure5.4. This hasa central Gigabit Ethernet switch of 224 ports.
The processors andROBsareconnectedto the central switch via otherswitcheswhich we term
“concentrating switches”. Therearefiveconcentrating switches for theprocessors, eachof which
has128 FastEthernet links, connecting550 processors. Eachconcentrating switch alsohas12
trunkedGigabitEthernet links to thecentral switch.Connecting around1700 ROBsto thecentral
switch are14 concentrating switches. Eachof theseswitcheshaseight trunked GigabitEthernet
connecting it to thecentral switch.

5.3Constructing arbitrary network architectures with Ethernet 97
224 port GE switch
128 FE + 12 GE ports switch
~550 Processors
~1700 Read Out Buffers (ROBs)
8 trunkedGE links
12 trunked GE links
128 FE links
128 FE links
Figure5.4: TheEthernetbased ATLAS trigger/DAQ network
5.3 Constructing arbitrary network architectureswith Ethernet
We would like to build a suitable network to meetthe needson theATLAS trigger/DAQ. In this
section we identify the constraints in building arbitrary networks topologies with off-the-shelf
Ethernet switches andpresent solutionsto theseconstraints.
5.3.1 The SpanningTreeAlgorithm
Two of themaingoalsof thespanning treealgorithm (specified in theBridgestandarddocument
IEEE 802.1D) areto automatically detectandshutdown loops within thenetwork andto provide
redundantpathswhich canbeactivateduponfailure. Loopsin Ethernet networks areundesirable
becausethey canallow framesto keepgoing around thenetwork. Figure5.5showsa threestage
Closnetwork madeup from six switches with anexampleof sucha loop. Trunksof two links are
usedto connect theswitches. Thebold lines in thefigure identifies a loop in the network. If we
have a broadcastframethen it is possible for the frameto endlesslycirculate the network by the
loopsuchasthat indicatedby thebold lines. This is becauseateachswitch,theframeis forwarded
to all ports. Of coursein theClosnetwork shown, moreloopscanbeidentified whichwill forward
the framein the sameway. As a result, a looping broadcastframecould effectively consumeall
availablebandwidth.
Furthermore,removing loopsfrom thenetwork ensuresthatthereis only asinglepathbetween

98 Chapter5. EthernetNetwork topologies andpossible enhancements for ATLAS
any two nodesin thenetwork. Theeffect is thatframesequenceintegrity is ensured,thatis, frames
arereceivedin thecorrect order. Sincethespanning treealgorithm candynamicallyroute around
faulty links, loops arepurposelybuilt into Ethernet networks.
In an Ethernet switch, trunked or aggregatelinks coexist with the spanning treealgorithm.
Trunked links arerecognisedasa single link andnot multiple pathsbetweentwo nodes.
The spanning tree algorithm works by sending a ‘hello’ packet to all ports at a fixed user
specified interval.Thesepacketsareignoredby thenodes, but areacknowledged by otherswitches
andBridgesin thenetwork. Theswitchescanorganisethemselveslogically in ahierarchical order
anddisable links to avoid loops. Theuserspecifiedintervalsareof theorder of a few seconds.As
a result, thespanningtreepacketshave no noticeableimpacton theperformanceof theswitch.
In a network, if arbitrary topologiesare to be possible, thenwe mustensure that loops are
permittedto exist in thenetwork. Modification 1: Multiple arbitrary topologiesarepossible with
thespanning treedisabled.
We were able to disable the Spanning Tree algorithm in the switches we tested. In some
switches, switching off the spanning treeis an option in the management software. In onecase
however, we neededtheassistanceof theswitchmanufacturer becauseit required directaccessto
theswitchsoftware.Theactual processwaseasy asthespanning treealgorithm wasimplemented
asa singlemodulein thesoftware.
Potentially, loopsareonly a dangerwhenframesarebroadcast.Frameswhich arebroadcast
areframeswith broadcastandmulticastaddressesin the destination field andframeswith desti-
nation addresseswhich arenot recognised by theswitch. In thelatter case,theuserhasno control
unlessstatic entries or very long ageingtimesareput into theforwarding table.
Wewereunableto find asimplewayto makethespanningtreework only onbroadcastframes,
soit would have to beswitchedoff.
5.3.2 Learning and the Forwarding table
An Ethernet switch forwarding table, alsoknown asAddresstable, content addressable memory
(CAM) table or Filtering Database,holds theMAC address of thenodesconnectedto theswitch
andtheswitchport to which thenodeis connected. Whentheswitchis first powered on,theCAM
table is empty. The CAM is updated automatically by a processcalled Learning. The learning
processis documentedin theBridgestandard(IEEE802.1D).
TheLearning process worksby examining the source MAC addressof eachincoming frame

5.3Constructing arbitrary network architectures with Ethernet 99
d:efTgihkjHlnmporq�lns7e tuejvq�fTewo�q�lns�e d:efTgihkjHlnmporq�lxs�e
y
z
{
|
}
~
Figure 5.5: An example of one loop path in the Clos network, shown by the bold lines. Each
square representsa switch.
andassociating that source MAC addresswith the switch port on which the framearrived. The
CAM is thenupdatedaccordingly. All futureframesdestinedfor thatMAC addresswill besent to
thatassociatedport. Unknown addressesarebroadcast. That is, broadcasthappenin thenetwork
even if the hostsdo not sendbroadcastframes. A port/MAC addressassociation or CAM table
entrywill beremovedaftera specified time haselapsed (calledtheAgeing Time. Typically 300s.
The minimum value is 10sandthe maximum1000000s). This is to allow for the possibilit y of
machinesbeing removedfrom thenetwork.
In order to have arbitrary topologies,theability to switchoff learning andageing andto enter
permanententries into theCAM tableis a desirable featurebecausebroadcastof unknown MAC
addresseswill effectively be disabled. Theseareprovided for by most FastEthernet switches.
Permanent CAM table entries comesunder theheading of “Static Entries” in theBridgestandard
document(IEEE 802.1D).This meansyou canhave complete control of labelling your network.
Staticentrieseffectively disables learning. All theswitcheswe testedsupport this. Modification
2: Learning mustbedisabled andstaticentriesput into theswitchforwarding table
5.3.3 Broadcastand Multicast for arbitrary networks
Oncethe spanning treealgorithm hasbeendisabled, thereis no longer an automatic mechanism
to shutoff loops in thenetwork. This meansif loopsarepresent in thenetwork it will bepossible
for broadcastframesto loop roundthe network indefinitely asdescribedin Section5.3.1. If the
network is a well labelled network, i.e. the addressesof the attachednodeshave beenstatically

100 Chapter5. EthernetNetwork topologies andpossible enhancements for ATLAS
enteredinto theforwarding table(seeSection5.3.2)andthemulticastgroupshavebeensetup,then
loops in the network should not be a problem. If staticentries werenot put into the forwarding
table, the forwarding tables would be continuously updated due to the learning processas the
broadcastframescould arriveat thesameswitchon different ports. In Figure5.5,if A is to senda
broadcast,thenF for instancewill receive thesamebroadcaston at leasttwo separate ports.
In orderto stopframeslooping around thenetwork indefinitely, wemustconstructabroadcast
tree.Thatis, certain portsin thenetwork should bestoppedfrom sending broadcastframe.In this
way, we canstill sendbroadcastswhich will reachall nodes,but broadcastframeswill not loop
around the network ascertain switch ports will be prevented from forwarding broadcastframes.
Figure5.7 shows a broadcasttree for a simple three stage Clos network. Only switchesA and
C have multiple broadcastports. Eachnode in the network canstill receive thebroadcastframe.
Modification 3: A broadcasttreemustbe constructedin orderto stopbroadcastframeslooping
around thenetwork.
d:efTgihkjHlnmporq�lxs�e tuejHq�fTeworq�lns7e d�e1fTgihkjHlnmporq�lns�e
y
z
{
|
}
~
Figure5.6: Broadcastashandledby amodifiedClosnetwork. In thissimplenetwork, only stations
A and C are allowed to broadcast in order to avoid looping frames. The bold lines show the
direction of thebroadcastframe.
A broadcasttr ee with the Turboswitch 2000
We wereableto create a broadcasttreein oneof theswitches we tested(theNetwiz Turboswitch
2000) using a proprietary “subneting” feature. This feature allowedus to restrict broadcaststo
a specifiednumberof ports by defining those ports to be in the samesubnet. Someportswere
specified to bein morethatonesubnet, thus allowing broadcastto besent betweensubnets.Uni-

5.3Constructing arbitrary network architectures with Ethernet 101
���1fTq�����2�������i�1jHm�����1fTq�����2�������ilnjH���
�we4�H�
d:efTgihkjHlnmporq�lns7e tuejHq�fTeworq�lns7e d�e1fTgihkjHlnmporq�lxs�e
y
z
{
|
}
~
Figure5.7: A broadcast treeusing VLANs in a Closnetwork. In this network, only switchports
belongingto VLAN b areallowedto forwardbroadcasts. Thebold linesshow thedirection of the
broadcastframe.
castswerenot restrictedby thesubnetting. This canbeusedto form a broadcasttreeasshown in
Figure5.7. Wesuccessfully setup a broadcasttreeandtested that it worked.
Broadcast tr ees with VLANs
VLANs canbe used to createa broadcasttree. In Section3.5.2,we saw that oneway in which
VLANs work is by limiting the flow of traffic to groups of switch ports belonging to the same
VLANs. Wealsoknow thattheportscanbelongto multiple VLAN s.
Figure5.7shows how a broadcasttreeusingVLA Ns maylook. We definetwo types of ports:
those belonging to VLAN u (for unicast) andthose belonging to VLANs u andb (for unicast and
broadcast). Portsbelonging only to VLAN u cansendandreceive unicastframes,but canreceive
but not sendbroadcastpacketsout of theswitch. Portsbelongingto bothVLAN u andb cansend
andreceive unicast andbroadcastframes.
Sinceall portsbelongto theunicastaddress,all thelinks in thenetwork canbeused to transfer
unicastframes.Only portsbelongingto boththeVLANs u andb canbeusedto forwardbroadcast
frames.

102 Chapter5. EthernetNetwork topologies andpossible enhancements for ATLAS
For thissystemto work, all thenodesconnected to thenetwork should beconnectedonswitch
portssetto both VLAN su andb. Thenodesarealsorequired to tagbroadcastpacketswith VLAN
b andunicast packetswith VLAN u whentransmitting. Broadcast packetstaggedwith VLAN u
would still loop around thenetwork andunicastpacketstagged with b will be limited to thelinks
selectedfor broadcasts.
It is easy to seehow this methodcanbe extended to provide multiple broadcasttrees or as
a different way of setting up multicastgroups. We have not tested this methodof setting up a
broadcasttree,but thereis nothing in thestandardsto prevent it from beingdone.
5.3.4 Path Redundancy
One of the advantagesof network topologies suchas the Clos is the multiple pathsor routes
availablefor a packet going from onepoint in the network to another. Ethernet networks allow
only asingle pathbetween any two nodesin thenetwork. As mentionedin Section 5.3.1,switching
off the spanning treemeanswe no longer have useof the adaptive routing around faulty links.
Furthermorethe useof staticCAM entries (for our well-labelled network) to direct the pathof
framesmeansthatthere is alwaysonly a single routebetween any two nodes.
A way to obtain pathredundancy is asfoll ows. Multipl e unicast addressescanbeassignedto
eachNIC in the sameway that multicast addressesareassignedto NICs. We have tried this on
our two NICs, theIntel EtherExpressPro100FastEthernet NIC andtheAlteon ACENICGigabit
Ethernet NIC. On boththeseNICs,we wereableto assign multiple unicastaddressesandreceive
packetssoaddressed.A range of Ethernetaddressescanbeassignedto eachnodeandtheswitch
forwarding tablescanbesetup suchthatfor eachaddressbelonging to eachnode,adifferentpath
is taken through the network. (This methodcanbe taken to anextremeby setting eachEthernet
NIC into promiscuousmodein which all packetswhich arrive at theNIC arereceivedandsentto
thehigher layers irrespective of thedestination addresson thepacket).
A sender canbe modifiedsuchthat whensending to a particular node, it usesthe rangeof
Ethernet addresseswhich correspondto thatnode. To ensure fair arbitration, theaddressselection
could bedone in a round robin fashion for instance.
Thedisadvantage with this methodis thatalthoughmultiple paths exists, there is still no way
to automatically reroutepacket whena pathbecomes disabled. Trunking or link aggregationcan
coexist with the architecture described above to provide link redundancy and adaptive routing
around faulty links. The useof trunking meansthe bandwidth of the links between switches is

5.4Outlook 103
increased. An alternative is to develop a higher layer functionality in the nodes to detect and
transmit around deadlinks by usinga differentdestinationaddress.
A further disadvantage is the lossof framesequenceintegrity. For the ATLAS trigger/DAQ
system,if messagescouldberestrictedto fit into oneframe,thenthis should not bea problem. If
not,a field couldbeencodedinto thetypefield of eachframeor inside theframeitself which can
thenbeusedfor framesequenceintegrity.
Modification 4: Assigning multiple unicastaddressesto a NIC canhelp to allow a greater
choice of topologies in an Ethernetnetwork. This can be doneby setting up multiple unicast
addressesasif they weremulticastaddresseson theNIC.
Modification 5: Multiple NICs canbepluggedinto a host. This hasthesameadvantagesas
modification 4, but with addedredundancy in thehardware. This raises thecostof eachnodeand
impliesanincreasednumberof network ports. Multiple NICs in asingle nodeis standardpractice
in connectinga single nodeto multiple networks, thusthe methodwill work. We alsonote that
this hasbeentried in theBeowulf project1.
5.4 Outlook
Sincethe begining of this work, the Ethernet standards have been evolving. In this section, we
mentionsbriefly someof therecent, upcoming andotherfeaturesbeing consideredwhich should
further increasetheflexibility of Ethernet 2.
Extensions to IEEE 802.1D: In thelatest extensionsto theIEEE 802.1D standard,provisions
have beenput into placeto allow a node to dynamically registraterandde-register from a mul-
ticast group(GMRP, GARPMulticast Registration Protocol) anda VLAN group (GVRP, GARP
VLAN Registration Protocol) by useof a protocol called GARP(GenericAttribute Registration
Protocol). This makesnetwork configuration of theseattributeseasier andwithout the needfor
manualintervention.
Multiple spanning treesper VLA N (IEEE 802.1s): The standardIEEE 802.1Q specifies ex-
plicitly that is does not exclude thefuture extension of thestandardto includeVLANs over mul-
tiple spanning trees. This would bea significant extension since it would meantheability to use
multiple links betweenswitches(without theuseof trunking), greatly increasingthearchitectural
1TheBeowulf Project.http://www.beowulf.org2A document describing some of these developments can be found at
http://www.us.anritsu.com/downloads/files/musthave.pdf

104 Chapter5. EthernetNetwork topologies andpossible enhancements for ATLAS
flexibili ty of Ethernet.
Fasterspanning tree reconfiguration (IEEE 802.1w): In light of today’s networking speeds,
the spanning treeprotocol reconfiguration time of many secondscanberather slow. Theaim of
the IEEE 802.1wstandard is to providea spanning treeprotocol that canreconfigurewithin 100
ms.
10 Gigabit Ethernet (IEEE 802.3ae): It hasbeenmetioned already in Chapter3 that devel-
opment of the 10 Gigabit per secondsEthernet is well under way. Products areexpected on the
market by thebegining of 2002. 40 Gigabitpersecond Ethernet arealsobeingdiscussed.
5.5 Conclusions
The standardscurrently adheredto by Ethernet switchesallow the building of large networks of
a tree-like topology, but theability to build networks of othertopologies is attractive becausewe
canbuild in redundancy andscalability .
Looking at realEthernet switches andtheEthernet standard,wehavepointedout how wecan
constructarbitrary networkssuch astheClosfrom Ethernetswitches. Ourstudieshaveshown that
in order thatEthernet switchescanbeusedto build arbitrarynetworks,thefoll owing arerequired;
1. Provide permanentCAM tablesanddisable learning: Theability to setup permanent CAM
/ Filtering tableentriesanddisable learning is alreadyprovidedfor in thestandards(IEEE
802.1D)andtherefore incorporated in all Ethernet switches.
2. Switchingoff the spanning tree: In Ethernetnetworks, it is not possible to have multiple
pathsor loops between any two nodes. The spanning tree algorithm is used to find and
removeloopsby disabling certainports. To build arbitrarynetworks,loopsmustbeallowed,
thereforethespanning treeshould bedisabled.This canbedoneon mostswitches we have
seen.
3. Constructing a broadcasttree: Oncethe spanning treehasbeenremoved, multiple paths
canexist in thenetwork. A broadcasttreemustbeconstructedto allow broadcaststo reach
all node in the network and avoid the prospect of broadcast frame looping the network
indefinitely. This is moredifficult to do since there is no provision for it in the Ethernet
standards.We have shown heretwo methods, to do this.
As aconsequenceof switching off thespanning treealgorithm andhavingfixedrouting tables,
we canno longer take advantageof theredundantpaths of a particular network topology. Frames

5.5Conclusions 105
cannot bererouted if a link goesdown. To resolve this, trunking canbeusedto provide multiple
links betweenswitches.This providesredundantlinks andalsoincreasesthebandwidth between
switches.
Another way to obtain link redundancy and increasedbandwidth betweenendpoints in the
network is by assigning a rangeof unicast Ethernet addressesto eachnode. EachNIC canbeset
to promiscuousmodeor the assignedaddressescanbe registeredin the sameway asmulticast
addresses.Multipl e paths canthen be programmedinto the network for reaching the samedes-
tination by useof the extra addressesgive to eachnode. This however doesnot give automatic
re-routing around broken links. Overall, the changesrequired to enable arbitrary networks to be
built with commodity Ethernet switchesarenon-trivial andtime consuming. It is also likely to
require a uniqueapproachfor eachswitch.
TheATLAS trigger/DAQ system hasover a thousandnodes. Manually entering theaddresses
of over a thousandnodes into the forwarding tableof eachswitch in the system andgetting it
correct will be extremely tedious and time consuming. For ATLAS, we would like to adhere
as much aspossible to the Ethernet standard. Thesestandardsareevolving andwhat we have
highlighted herearefeaturesadvantageousto ATLAS andhigh performanceparallel computing.
New featuressuch astrunking maymeanwe canstick to theEthernet standardsif a large enough
root/central switchcanbebought.

106 Chapter5. EthernetNetwork topologies andpossible enhancements for ATLAS

Chapter 6
The Ethernet testbedmeasurement
software and clock synchronisation
107

108 Chapter 6. TheEthernet testbedmeasurementsoftwareandclock synchronisation
6.1 Intr oduction
Thearchitecture, performanceandworkingsof Ethernet switchesneedto beunderstood in order
to make informeddecisionson the ATLAS LVL2 trigger network construction. Given the large
market, it is clearthat therewill bevariationsin products from differentvendors. Vendors make
trade-offs betweentheperformanceandthecostof theirproducts.Wemustunderstandtheperfor-
manceandarchitectural differencesandtheimplicationsfor theATLAS LVL2 triggernetwork.
To understand andcharacterise Ethernet switches, we have to perform measurementsunder
controlled conditions. In this chapter, we present the Ethernet testbed switch characterisation
software (ETB) usedto characteriseEthernetswitchesandnetworks.
Theresultsproducedwith ETB alsoserveasinput to themodellingof theATLAS second level
trigger network. In order to build the model,we required a detailed characterisationof Ethernet
switches andendnodes. Assessmentof the endnodeperformancewith MESH andTCP/IPhas
beenpresentedin Chapter 4.
The basic idea with ETB is to characterise switches by generating and transmitting traffic
streamsthrough theswitch,thenexamining thereceivedstreams.
In Chapter 7 we present the approachwe usein modelling Ethernet switches. This chapter
containsthemeasurementsrequiredto characterisea switchor network.
6.2 Goals
With ETB, we want to measure the transmit andreceive throughputs, the lost framerateandthe
packet end-to-endlatency, all asa function of the traffic load andtype. Thuswe needto beable
to control the rateat which we transmit the packets. We alsoneedto be able to distinguish the
received streams whena nodereceives from more thanone transmitter at the sametime. This
allows usto observe how differentstreamsareaffected by thenetwork architecture andhow this
changeswhenpriorities areused.
In achieving theseaims,we considered:
� The cost. Comparedwith the costof buying a commercial tester, this methodmustbe as
costeffective aspossible. Seesections6.9and6.10for a comparative costanalysis.
� The availability of a large number of PCsat no extra cost. We had access to the LVL2
testbed PCs(SeeFigure6.1) beingusedto testtheATLAS framework software. Up to 32
machines wereavailableto us.

6.2Goals 109
� Also available wastheIntel FastEthernetNIC [36] andAlteonACENIC GigabitNIC [37].
� Requirement of accuracy in theswitchmodelof 5 to 10 %.� TheavailableOS,protocol andI/O softwareandourknowledgeof their performance(TCP/IP,
raw Ethernet andMESH).
Figure6.1: ThePCsusedfor theLVL2 testbedat CERN.
6.2.1 An examplemeasurement
In Figure6.2,we show theresults of anexamplemeasurementwith ETB. For this measurement,
six FastEthernet nodes streamedfixed sizemessages to a single Gigabit Ethernet nodeat fixed
intervals(systematically) througha switch.TheswitchwastheBATM Titan T4.
Figure6.2showstheacceptedthroughput against theend-to-endlatency for 46,512, 1024 and
1500Bytes.Because thetraffic is systematic, thelatency remainsconstantuntil asaturation point
is reached,whenthelatency risessharply.
In thiscase, thesaturation point is dueto thelimitation in thereceivingGigabitEthernet node,
andnot the switch. Using ETB with varying traffic patterns andconfiguration of the nodes,we
candiscover variousdetails about theswitch(SeeSection7.6).

110 Chapter 6. TheEthernet testbedmeasurementsoftwareandclock synchronisation
0 10 20 30 40 50 60 70 800
50
100
150
200
250
300
Accepted traffic. MBytes/s
Ave
rage
end
to e
nd la
tenc
y. u
secs
7nodes. 6FE to 1GE. systematic traffic. Titan flwcntrl on
1500B1024B512B 46B
Figure 6.2: Performance obtained from
streaming6 FEnodesto asingle Gigabitnode
throughtheBATM TitanT4. Thelimits of the
receiving Gigabit node is reachedbefore the
limits of theswitch.
Thepowerof ETB comesfrom theability of synchronisemultiplePCandusethemto produce
multiple traffic generators andconsumerswith varying traffic patterns. This enablesus to testa
multitudeof scenarios of traffic patternsloadin a single switchunit or network.
6.3 Designdecisions
6.3.1 Testbedsetup
Thesetupof thetestbedis shown in Figure6.3.Thissetupwasdecidedupon based ontheavailable
hardwareandsoftwarementionedabove. It hasa numberof features.Eachnode surrounding the
switchunder testhastwo NICs, A andB. This implementationof MESH cannot berun sharing a
NIC with otherprotocols. NIC A (running at 10 Mbit/s) is usedto connect thenodes to the local
CERNnetwork using the network file system(NFS) to allow a userto control theconfiguration,
starting andstopping of measurementsandcollecting theresults from thenodes.NIC B (running
at 100 or 1000Mbit/s) is usedfor the testing. Only testing traffic wasallowedfrom NIC B such
that other traffic did not interfere with the measurement traffic. The advantageof this setupis
that it givesthe userremoteaccessto all nodesfrom a control terminal connected to the CERN
network. NFSprovideda convenientway to share databetweenthe nodes in the testbedvia the
10 Mbit/s connections.

6.3Designdecisions 111
During measurements,traffic on NIC A waskept to a minimumandthenodeswerededicated
to running themeasurementssuchthatmaximumCPUtime wasgivento themeasurements.
Hub Fast Ethernet or Gigabit Switch
Control(TCP/IP)
A A A A
A A A A
B B B B
B B B B
1 2 3 4
5 6 7 8
10Mbit/s connection.
100Mbit/sor 1Gbit/s connection.
PC with two NICs
A = NIC running at 10Mbit/sB = NIC running at 100Mbit/s or 1Gbit/s
Figure6.3: Thesetup of theEthernet measurementtestbed
6.3.2 The Traffic Generator program
A traffic generatorprogramwasinitially developedfor theMacrame project [29] [31]. This pro-
gramwastakenandadapted to produceoutputssuitablefor ETB.
The traffic generator program is a stand-alone program. It generates binary files of traffic
patterns for eachtransmitter in the system. The pattern file contains a list of packet descriptors,
eachhasa destination node number, a sourcenode number, a message sizein bytes andan inter-
packet time in microseconds.
Via the input to the traffic generatorprogram, the useris able to specify the datasize, the
destinationsandthetraffic patterns.Thetypesof traffic patternsof interestare:
� Systematic. Theinter-packet time is constant.
� Random.Theinter-packet time is random exponentially about a mean.
In both cases, the destination addresscanbeconstant,or uniformly-randomdistributed. The
systemis flexible enough to support other traffic patterns.

112 Chapter 6. TheEthernet testbedmeasurementsoftwareandclock synchronisation
6.3.3 The usageof MESH in the ETB software
The MESH Libraries [11] [12] [13] weredevelopedfor ATLAS to optimise the communication
andscheduling of theavailablenetwork connection andprocessing power in a node.
MESH waschosenastheplatform for the ETB software rather thanTCP/IP or raw Ethernet
for a number of reasons. Firstly, TCPrecoversfrom packet losstransparently which makesany
attempt to measure network packet loss difficult. Secondly, MESH hassuperior performance
compared to TCP/IP (seeSection 4.6) andUDP/IP (seebelow), it enables us to generatehigher
rate traffic. Thirdly, raw Ethernetand TCP/IP usesthe OS scheduler whereas MESH usesits
own light-weightschedulerwhich hasbeenshown to providesbetter resolution on timing packet
arrivals. SeeSection4.6.
Streamingperformanceof MESH
As a demonstration of the superior performanceof MESH, we performeda streaming measure-
ment. Thestreaming measurementis aimedat finding themaximumrateat which messagescan
be sentout. The setupis the sameasthat illustratedin Figure4.3. The client setsup a message
of a fixeddata sizeandstreamsthesamemessage repeatedly asfastaspossible to theserver. The
server continuously readsthe messagessent by the client. The server records the time it started
receivingthemessages, thenumberof messages receivedandthetime it stoppedreceiving. From
this, thereceive rateof theserver canbecalculated. Theresults areshown in Figure6.4.
The throughput obtained is different from that of Chapter4 becauseherewe take advantage
of the pipelining effect. That is the maximumthroughput achievablewhenmultiple packetsare
sentat thesametime. Figure6.4(a)shows theachievedthroughput against messagesizefor UDP
andMESH. Figure6.4(b) shows theachievedframerateagainst messagesize.WeuseUDPrather
thanTCP/IPbecauseTCP/IPis a streaming protocol andhencemultiple sendsof smallmessages
may get concatenated into a single big packet. For testing networks and switches, this is not
a desired effect. We believe TCP cannot achieve higher throughput than UDP since UDP is a
simpler protocol andhaslessoverhead.
For FastEthernet,weareableto reach thetheoretical rateat100bytesfor MESHand250bytes
for UDP. For GigabitEthernet,we arenot ableto reachthetheoretical throughput for either UDP
or MESH. We reach a maximumthroughputof around 71 MBytes/sfor MESH and45 MBytes/s
for UDP. Webelievethatthis limitation is dueto thePCIbusandthereceivepartof theNIC driver.
Our measurementshave shown thatwe cansend at a higher ratethanwe canreceive. According

6.3Designdecisions 113
to Pike [30], thePCI busrequest, busgrantandarbitrationreducesthepacket transferbandwidth
by asmuchas30%of thetotal busbandwidth. This impliesa maximumthroughput of around 92
MBytes/sfor a 33 MHz 32-bit PCIbus.
For the curve representing streaming over Gigabit Ethernet, the odd shape for messagesizes
between 500and1000bytesfor bothMESH andUDP canbeattributedto thecurrent version of
the Alteon NIC firmware. We areusing version 12.4.11.The previousversion gave a smoother
shape. The results showthat MESH performs muchbetter thanUDP for both FastandGigabit
Ethernet.
0 500 1000 150010
−1
100
101
102
Message size. Bytes
Thr
ough
put.
MB
ytes
/s
GE TheoreticalGE MESH GE UDP FE TheoreticalFE MESH FE UDP
(a) Throughput
0 500 1000 1500
104
105
106
107
Fra
me
rate
. Fra
mes
/s
Message Size. Bytes
GE theoreticalGE MESH GE UDP FE TheoreticalFE MESH FE UDP
(b) Framerate
Figure 6.4: Unidirectional streaming for Fast and Gigabit Ethernetusing MESH and UDP.
CPU=400MHz; OS=Linux2.2.14
MESH ports
WhenusingMESH, Ethernetframesaretransmittedandreceivedon MESH ports. Thesearethe
MESHendpoint communicationentities.A MESHport is uniqueto eachnodeandmultiple ports
canbesetup pernode. Local portsbelong to the local node. All otherportsareremote.This is
similar to the ideathat a network addresscanbe local or remoteto any node andeachnode can
have multiple addresses.An Ethernetframehasthefirst four bytesin theuserdataareareserved
for MESHportnumbers. Two bytesfor thesourceportandtwo bytesfor thedestinationport. The
framesizeis encodedin thetype/length field of theEthernetframe.
In ETB,eachnodehastwo localports: aport for measurementsandaport for synchronisation.
Thisallowsthetwo differenttypesof traffic to bedistinguished.Furthermore,whenmeasurements
114 Chapter 6. TheEthernet testbedmeasurementsoftwareandclock synchronisation
are taking place, no other traffic is senton the control interface. This helpsin obtaining more
accurateresults for theswitch/network undertest.
For theETB software,wearemoreinterestedin performancethanminimisingCPUusage. As
suchwe do not make a single PC serve asmorethan onetraffic source/sink in order to achieve
maximumperformancepernode.
A detailed evaluation of MESH including theCPUloading, thelimitationsof thedriver, NIC
andPCIbusaswell asits usein theprototype LVL2 triggeris presentedin [11] [12] and[13].
6.4 synchronising PC clocks
6.4.1 Method
A requirementin ETB wasto be ableto make unidirectional end-to-end latency measurements.
On a single node, the local PCclock wasaccurateenoughto do measurementslocally. However,
if we need to do latency measurementsacrossmorethanonenode,we require a global clock or a
systemby which theclocks on thenodescould besynchronised.
We arelooking for accuracy in in the region of a few microsecondsin synchronising the PC
clocks. SimpleNetwork Time Protocol(SNTP) is a commonway to synchronise clocks, but it
only gives1 to 50 msgranularity [32].
Thereareanumberof other possiblemethods. An effectiveonewouldbeto removethecrystal
from thePCsandconnect thePCsto a single crystal or clock generator. For this to work, all the
PCswould have to be the same( samemotherboardandCPU).We would like to be ableto use
differentPCs.
Another possible methodwould beto build hardware which canbepluggedinto thePCsand
usedto distribute a global clock. This will require extra cabling in connecting the PCandsome
hardwareeffort.
In our chosen method,we sendEthernet framesthrough the network/switch under test to
synchroniseclocks. The ideais illustratedin Figure6.5. Oneof the PC’s local clock is usedas
themasteror global clock. This PCis knownastheglobal node. All otherPC’s local clocks are
monitor clocks. ThesePCsareknown asmonitor nodes. Theglobal node selects a monitor node
to synchronisewith. It sends a packet to themonitor node,noting its starttime � �T� . Themonitor
nodewill return the packet immediately, stamping it with its current local time � ��� . Whenthe
global node receivesthe returnedpacket, it notes its endtime � �F� . Theglobal nodecancalculate

6.4synchronising PCclocks 115
���F� ó�� ���T�u�����T�T�,��� . In an ideal situation, �^�F� ó ���5� . By repeating this many times,we build a
tableof �/�F� and ����� values which areusedfor a straight line fit of theform:
���F� óJ �������¢¡ (6.1)
Where ¡ theoffset or skew and is thegradient or drift. FromEquation 6.1,all future andpast
values of themonitor’s local clock �£��� canbeconvertedto theglobal time.
time
Global node Monitor node
tmc
tgs
tge
tgc
Figure 6.5: How we synchronise clocks on
PCs.
In practice, thePC’s clock valuesare64-bit long. To avoid wrap-arounds during thecalcula-
tions, theiniti al valuesof theclock aretaken andall subsequent values areoffsets from theiniti al
values. Therefore Equation 6.1becomes;
���F�¥¤¦���4§�¨3§ óJ ©� ����� ¤¦����§�¨§/���¢¡ (6.2)
Where ���F§b¨3§ is the initial time of theglobal nodeand ��� §�¨3§ is theinitial time of themonitornode.
We make two important assumptions here. The time taken for a single frame to traverse the
network/switchbetween two ports is constantin thecasewhereno otherframesarepresentin the
network/switch. This is a valid assumptionsincebetweenany two ports, frameswill alwaystake
thesamepathandfurthermore,in theabsenceof other frames,no queueingoccurs to slow down
theframe.Also, mostswitchesdo their switching in hardware andthereforehave a fixedlatency.
Our second assumption is that theclocks have a linear relationship. That is, thedrift is constant.
How truethis assumptionis andtheconsequencesfor thesynchronisationhavebeenlooked at.

116 Chapter 6. TheEthernet testbedmeasurementsoftwareandclock synchronisation
6.4.2 Factorsaffecting synchronisationaccuracy
Thereareseveral factorsaffecting theaccuracy we canget from the clock synchronisation using
themethodoutlined. They areasfollows:� The system usedin reading the PC’s local clock is a MESH function call. This readsa
special 64-bit register containing the numberof ticks since the PC was turned on. The
numberof ticks is incrementedevery CPUclock tick. For a 200MHz PentiumII, a clock
tick happens200million timesevery second, that is onetick every five nanoseconds.� Themaximumvaluea64-bit registercanholdis ª ÷�«3¬: ª õF®�¯ . Thiscorrespondsto 9.2234e+10
seconds,or 3177years.Wewill notwraparoundthiscounterduring thelifetimeof thetests.
� On our slowestPCs(200 MHz), doing onemillion calls to readthis register takes 0.0753
secondsimplying 75.3ns/call. Thereforeabout 16clockcyclesareneededto readtheclock.
� Thespecification of thePCcrystal is 100partspermillion overatemperaturerangeof -50to
100degreesCelsius. Wedonotexpectto runtheclocksat theextremitiesof thetemperature
range. Our mainconcernis how muchtheclocksdrift with respectto eachother.
Thesynchronisationproceduredescribedabovehasotherproblems.Firstly, wecannotbesure
that theprocessasillustratedin Figure6.5 is assymmetric asillustrated. Secondly, theround trip
time (RTT) or the differencebetween�a�`� and ���F� is variable becausealthough we areusingthe
MESHenvironment, wecanstill beaffectedby thescheduling of theLinux operating system.
Figure6.6(a)showsthenormalisedhistogramof thehalf theRTT between a global node and
two monitor nodeacrossa switch. The bin size of is 1 ° s. Thus Figure 6.6(a) representsthe
probability of half the RTT beinga certain value. The distribution is similar for the two nodes.
Themeasurementsrun for abouta minute.With a majority taking about 100microseconds, there
are therefore approximately 600 000 entries. Plots of the sameform are observed for directly
connectednodes,but shiftedin thelatency axisby (15 ° s) anamountcorresponding to theswitch
storeandforward for 100 bytes. This shows that the switchonly adds a fixed latency during the
synchronisation.
FromFigure6.6(b), we notethatmostof theresults lie in therange of 49 to 55 ° s. However
a few arerecordedwith asmuchas200 ° s latency. Thesehigh latenciescanbeattributedto the
OS.In order to combatthis, we decided to accept only theRTT values which lie within 5% of the
minimum. We repeated themeasurementover a period of 7200seconds,plotting the meanRTT
andstandarddeviation after every minuteof ping-pong.Theseareplotted in Figures6.7and6.8.
Themeanchangesby 0.7 ° s andthestandarddeviation is alwayslessthan0.25 ° s.

6.4synchronising PCclocks 117
0 20 40 60 80 100 120 140 160 180 20010
−5
10−4
10−3
10−2
10−1
100
Latency. us
Pro
babi
lity
for
half
the
roun
d tr
ip ti
me.
Global clock Synchronization Through Netwiz switch. Same module. All pingpongs.
Synchronising with node 1Synchronising with node 2
(a)Theprobabilityof half theroundtrip timebe-
ing acertainvalue.
45 50 55 60 65 7010
−5
10−4
10−3
10−2
10−1
100
Latency. us
Pro
babi
lity
for
half
the
roun
d tr
ip ti
me.
Global clock Synchronization Through Netwiz switch. Same module. All pingpongs.
Synchronising with node 1Synchronising with node 2
(b) Magnificationof (a)
Figure6.6: A normalisedhistogramof half theround trip time through a switch
0 1000 2000 3000 4000 5000 6000 7000 800096.9
97
97.1
97.2
97.3
97.4
97.5
97.6
97.7
Time. Seconds
Mea
n. u
secs
Synchronising with 100 bytes Data size, through Netwiz switch. Same slot
Synchronising with node 1Synchronising with node 2
Figure6.7: Themeanvalue of the roundtrip
time.
0 1000 2000 3000 4000 5000 6000 7000 80000.05
0.1
0.15
0.2
0.25
Time. Seconds
Sta
ndar
d de
viat
ion.
use
cs
Synchronising with 100 bytes Data size, through Netwiz switch. Same slot
Synchronising with node 1Synchronising with node 2
Figure 6.8: The standard deviation of the
roundtrip time.

118 Chapter 6. TheEthernet testbedmeasurementsoftwareandclock synchronisation
6.4.3 Clock drift and skew
The drift of the monitor clock with respect to the global clock given by the gradient, , of the
straight line fit betweenthetwo clocks. It shows how muchoneclock variesin time with respect
to another. Figure6.9(a) shows thedrift of oneof themonitorclocksagainst theglobal clock over
aperiod of 7200 seconds.As thedrift is small, ª5¤ hasbeenplottedto highlight thedifference.
A similar graph is obtained for the second monitor node,showing a similar change in from 0
to 1500secondsandthereaftera fairly constantvalue. The initial change is dueprimarily to the
processorsheatingup during thesynchronisationprocessseeSection 6.4.4.Theskew or intercept
( ¡ from Equation 6.2),is anindicationof how well synchronisedtheclocksstartedoff. It doesnot
indicateany dependenceon thewarmup process,seeFigure6.9(b).
0 1000 2000 3000 4000 5000 6000 7000 80001.47
1.475
1.48
1.485
1.49
1.495
1.5
1.505x 10
−5
Time. Seconds
Gra
dien
t − 1
Synchronising with 100 bytes Data size, through switch A. Same slot
Synchronising with node 1
(a) Thedeviation of thegradient from 1 for node
1.
0 1000 2000 3000 4000 5000 6000 7000 8000−1
−0.5
0
0.5
1
1.5
Time. Seconds
Inte
rcep
t. us
Synchronising with 100 bytes Data size, through switch A. Same slot
Synchronising with node 1
(b) Thevariationin theintercept
Figure6.9: How thegradient of two monitornode deviate from 1
In orderto find out the effective error in the synchronisation for a given point in Figure6.9,
we calculate the predicted time at eachpoint andsubtract the real time. Figure6.10 showsthe
error plotted at various times in the synchronisation process. Eachcurve representsthe error
in the predicted time asa function of the time after synchronisationfor a given warm up time.
The deviationsaregreatest for the smallest warm up times. For a warm up period greater than
1500seconds,anerrorof ± 2.5 ° s canbeobtainedup to 400secondsaftersynchronisation. The
maximumdeviation we found was1.23 ° s per minute for a warm up time of 1500seconds or
greater. Thusto staywithin our goal of 5 ° s accuracy, themeasurementsmustnot lastmorethan
4 minutes afterthesynchronisationphase.

6.4synchronising PCclocks 119
0 100 200 300 400 500 600 700 800−5
0
5
10
15
20
Time. Seconds
Err
or in
the
pred
icte
d tim
e. u
s
Synchronising with 100 bytes Data size, through Netwiz switch. Same slot
time = 107stime = 725stime = 1562stime = 2635stime = 3931stime = 5003s
Figure6.10: The error in the predicted time
for differentwarmup times.
0 1000 2000 3000 4000 5000 6000 7000 80001.42
1.44
1.46
1.48
1.5
1.52
1.54
1.56
1.58x 10
−5
Time. Seconds
Gra
dien
t − 1
Synchronising with 100 bytes Data size, through Netwiz switch. Same slot
Synchronising with node 1
Figure6.11: Theeffect on thedrift whenthe
PCsidepanels areremoved
6.4.4 Temperaturedependencyon the synchronisation
We knew that the temperaturehasa big effect on themeasurements. In orderto getsomeideaof
the effect, we performedthe synchronisation andafter 6000seconds,we removed the PC’s side
panels of both themonitor andtheglobal nodeandthesynchronisationcontinued. Theresulting
effect on thedrift is shownin Figure6.11.This shows thattheclock crystalsarevery sensitive to
temperaturechange.
Up to this point a complete synchronisationphasewascompletedfor onenode before being
startedon thenext. This will not scalevery well asthenumber of nodes in thesystem increases.
To avoid this, thecalibrationshould bedonewith all nodesconcurrently suchthatall thePCsare
continuously working.
Synchronisingall nodesconcurrently meanstheglobal nodedoesaping-pongwith all thePCs
in turn in a round robin fashion. Theresult is, apart from the global node,all PCsin the system
do the sameamountof work throughout the synchronisation process,thusmaintaining a stable
temperatureandhence drift throughout thesynchronisation process.
We alsoimproved the synchronisation processby accepting the points which hadthe widest
separationin time. Thisgivesagreateraccuracy whencalculating theline of bestfit. Theaccuracy
of thesynchronisation processis quantified below in Section6.4.6.

120 Chapter 6. TheEthernet testbedmeasurementsoftwareandclock synchronisation
6.4.5 Integrating clock synchronisationand measurements
To integratethe synchronisation system andthe measurements, our chosen method is illustrated
in Figure6.12.Thisshows anillustrationof theclock drift. Thesynchronisationis startedandthe
systemwarmsto a stablestateafter1500secondswhenthefirst measurementscanbemade.The
system returns to the synchronisation stateafter a measurementand subsequent measurements
can be madewithout the needfor waiting another 1500 seconds. Thereis always at leastone
synchronisationbetween measurementsto allow for changesin conditionsbetween measurements
to betaken into account for themeasurementsthatfollow.
SynchronisationTime
Synchronisation start
1st Measurement
(n-1)thmeasurements
and synchronisations
2nd Measurement
nth Measurement
Figure6.12:Themeasurementtechnique
6.4.6 Conditions for bestsynchronisation
We would like to know the conditions (valueof the ETB variables)in which we canachieve the
bestsynchronisation. Thesevariablesarethe length of time to do the ping-pongs or synchroni-
sation time, the numberof ping-pongs per secondsandthenumberof points to useto derive the
straight line fit.
Varying the synchronisation time
In this test,wevariedthetimeto synchronise,while keeping thenumber of ping-pongspersecond
constant andthe numberof points (selectedto derive the line of bestfit) fixed at 20. Theaim is
to find out theminimumtime to synchronise. Theresults areshown in Figures6.13and6.14. In
both these figures,we rejected the first 1500secondsof synchronisation. Figure6.13shows the

6.4synchronising PCclocks 121
standarddeviation in theclock drift against thesynchronisationtime. Figure6.14shows theerror
in thepredictedtime over five minute intervals. That is theerror is calculatedby taking thesyn-
chronisation result andpredicting the time 5 minutesin the future thencomparing theprediction
with theactual time. Theplotsshown areof theform expectedbecauseasthesynchronisation time
increases,thenumberof ping-pongs increase.This increasesthechancesof obtaining ping-pongs
with the minimum RTT andalso increasesthe spread between points. Both help in achieving a
moreaccurate line of bestfit. Fromthefigures, tensecondssynchronisation time is theoptimum.
0 5 10 15 20 25 300
0.2
0.4
0.6
0.8
1
1.2
1.4
1.6
1.8x 10
−7
Synchronisation time. s
Sta
ndar
d di
viat
ion
of (
grad
ient
− 1
)
Accuracy of synchronisation with varying synchronisation time. 2nodes.
Figure6.13:Standard deviation in gradient.
0 5 10 15 20 25 300
1
2
3
4
5
6
7
8
Err
or in
pre
dict
ed ti
me
over
five
min
s. u
s/m
in
Synchronisation time. s
Accuracy of synchronisation with varying synchronisation time. 2nodes.
Figure6.14: Error in the predicted time over
5 minuteintervals.
Varying the number of ping-pongsper second
Fixing the time to do a ping-pong to 10 seconds and keeping the numberof points (selected
to derive the line of bestfit) at 20, we vary the number of ping-pongs per second by pausing
or sleeping between ping-pongs. This is equivalent to increasing the number of nodes in the
system. Figure6.15shows the standarddeviation in the drift andFigure6.16shows the error in
thepredictedtime.
We seefrom the graphs that thereis littl e influence from the sleeptime until we get a sleep
time of 100,000 ° s whenthereis a clearrise in the standarddeviation in the drift andthe error.
This enables us to work out how many nodes we canhave in the network before inaccuraciesin
synchronisationstartto appear.
Theformula for themaximumnumberof nodespossible in thesystemis thus:
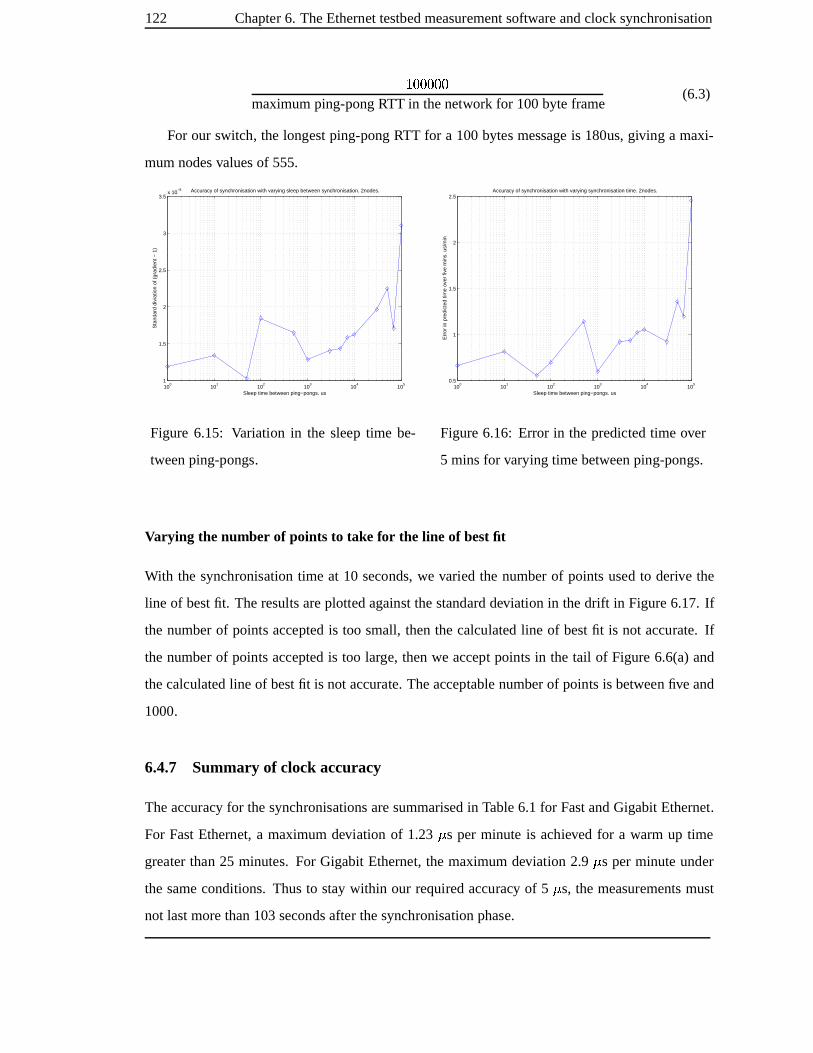
122 Chapter 6. TheEthernet testbedmeasurementsoftwareandclock synchronisation
ª õõõõõmaximumping-pongRTT in thenetwork for 100byteframe
(6.3)
For our switch, the longestping-pongRTT for a 100bytes messageis 180us,giving a maxi-
mumnodesvaluesof 555.
100
101
102
103
104
105
1
1.5
2
2.5
3
3.5x 10
−8
Sleep time between ping−pongs. us
Sta
ndar
d di
viat
ion
of (
grad
ient
− 1
)
Accuracy of synchronisation with varying sleep between synchronisation. 2nodes.
Figure 6.15: Variation in the sleep time be-
tweenping-pongs.
100
101
102
103
104
105
0.5
1
1.5
2
2.5
Sleep time between ping−pongs. us
Err
or in
pre
dict
ed ti
me
over
five
min
s. u
s/m
in
Accuracy of synchronisation with varying synchronisation time. 2nodes.
Figure6.16: Error in the predicted time over
5 minsfor varying time betweenping-pongs.
Varying the number of points to take for the line of bestfit
With the synchronisation time at 10 seconds,we varied the numberof pointsused to derive the
line of bestfit. Theresults areplottedagainst thestandarddeviation in thedrift in Figure6.17. If
the numberof points acceptedis too small, thenthe calculatedline of bestfit is not accurate. If
the number of points acceptedis too large, thenwe accept points in the tail of Figure6.6(a)and
thecalculatedline of bestfit is not accurate. Theacceptablenumberof points is between five and
1000.
6.4.7 Summary of clock accuracy
Theaccuracy for thesynchronisationsaresummarisedin Table6.1 for FastandGigabitEthernet.
For FastEthernet, a maximumdeviation of 1.23 ° s per minute is achieved for a warm up time
greater than 25 minutes. For Gigabit Ethernet, the maximumdeviation 2.9 ° s per minuteunder
the sameconditions. Thusto staywithin our required accuracy of 5 ° s, the measurementsmust
not lastmorethan103secondsafter thesynchronisation phase.

6.4synchronising PCclocks 123
100
101
102
103
104
10−10
10−8
10−6
10−4
10−2
100
102
Number of points accepted
stan
dard
dev
iatio
n of
gra
dien
t−1
Number of points to use in performing best line fit
Figure6.17:Therangeof thenumberof pointsthat canbeusedto make thebest line fit.
Warmup time 2mins 15mins 25mins 45mins 65mins 85mins
FastEthernet 10.2 4.5 0.36 0.26 1.23 0.39
GigabitEthernet 20.4 5.3 1.5 2.9 3.1 2.9
Table6.1: Thedeviationin clocks for FastandGigabitEthernet asafunctionof thewarmuptime.
In microsecondsperminute.

124 Chapter 6. TheEthernet testbedmeasurementsoftwareandclock synchronisation
6.5 Measurementsprocedure
6.5.1 Configuration files
Therearethree distinct phasesin theETB program; A synchronisation phase, a traffic generating
phase anda measurementphaseasillustratedin theflow diagramof Figure6.18.
Two configuration files supplied by the userareaddressesandconfiguration. The addresses
file containsa list of EthernetMAC addressesof the nodesin the test-bed. The first node in the
addresslist is usedastheglobal clock, to which all otherclock values aretranslated.
Theconfigurationfile containsalist of commandswhichdefinetheconfiguration of eachnode.
Thelist of possible commands andtheir types areexplainedin Table6.2.
Command Type Default Comments
time spread integer 5000 ² s Thenumber of microseconds to histogramsover.
bin size integer 1 ² s Thesizeof eachbin in thehistograms.
all latency record on/off off Recordthelatency of eachincomingpacket andits sourcein afile calledlatency0x
where0x denotesthedestination node. Usedmainly for debugging/analysis.
total pingpongs integer 100000 The maximumnumberof ping-pongsto do before deriving the global clock. If
time tospend pp is reached first the actual numberof ping-pongs donemay be
less. If setto zero, only throughput measurementsaremade.
time tospend pp integer 10 s The maximumtime to spend doing ping-pongsbeforederiving the global clock.
Theactual time maybelessdueto total pingpongs beingreached.
POINTSREQUIRED FOR BEST FIT integer 20 Thenumber of ping-pongsselectedto calculateglobal clock formula.
inter pingpong time integer 0 ² s Time to pausebetweenping-pongs. Usedmainly for debugging/analysis.
link negotiation on/off off Autonegotiation.
intelduplex full/half full TheIntel ExtherExpressPro100NIC flow control. Intel only.
alteonflowcontrol on/off on TheAlteon ACENIC flow control. ACENIC only.
alteon macaddr MAC address disabled Override theprogrammedMAC address.Theformat is six hex valueseparatedby
colons.
alteonrmaxbd integer 1 The numberof Ethernetframesto collect on the ACENIC before sending to the
higherlayers. ACENIConly.
alteon rct integer 0 ² s The maximumtime to wait whenreceiving alteon rmaxbdEthernet framesfrom
thelink before sending to thehigher layers. ACENIConly.
alteon smaxbd integer 1 The numberof Ethernet framesto collect on the ACENIC beforetransmitting on
thelink. ACENIC only.
alteon sct integer 0 ² s The maximumtime to wait whencollectingalteon smaxbdframesbefore trans-
mitting on thelink. ACENIC only.
Table6.2: Thelist of commandsfor theconfigurationof theETB nodes.

6.5Measurementsprocedure 125
User supplies addressesfile into <dir>
Start ETB./etb <dir>
User supplies cofigurationfile into <dir>
Start measurementreceive thread
Start synchronisation’stransmit and receive threads
Do max ping-pongs for max timeas specified in configuration
Write synchronisation resultsinto <dir>/global_clocks_file
Write last synchronisationresults in <dir>/global_clocks
Is there a start flag
Is there a stop flag
End
Load <dir>/measurement_iniand glocbal_clocks
Zero receive threadstatistics
Start transmit thread
Load traffic patternfrom <dir>
Transmit traffic
Wait 1 s to synchronise start
Is the result period up
Update results
Is the measurementperiod up
Copy final results
Wait 5 s for all nodesto stop transmitting
End transmit thread
End measurements
Write final resultsin <dir>
results
Yes
No
No
Yes
Yes
No
No
Yes
Start
User supplies<dir>/measurement_ini file
User suppliespattern file
Generate traffic patterninto <dir>
Traffic generator
Measurements
Synchronisation
global_clocks_file
global_clocks
Figure6.18: A flow diagramillustrating thesynchronisation,measurement andtraffic generation
in ETB.

126 Chapter 6. TheEthernet testbedmeasurementsoftwareandclock synchronisation
Oncestarted, ETB synchronisescontinuously until the usersupplies the startflag. This is a
flag which initi atesthemeasurements.
During thesynchronisationprocess,a file called“global clocks file” is created. At theendof
eachsynchronisation phase, anentryis addedto it this file.
Themaximumtimeto spend synchronising andthethemaximumnumberof ping-pongsto do
before producinganentrycanbespecified by theuserin the“configuration” file.
An exampleof a single entry in theglobal clocks file with six 200MHz PCin the testbedis
shown in Table6.3. Node0’s local clock is usedastheglobal clock.
node intercept ³(clock ticks)
slope ´ yinitial µ ¶£· ¸k·(clock ticks)
xiniti al µ ¹`· ¸k·(clock ticks)
points used exec time (sec-
onds)
mean( º s) std dev sync no
0 0 1.00000000 0 0 0 0.0000 0.00 0.00 00134
1 172704 0.99999344 7661912854849 7661265889201 19 1506 107.48 4.29 00134
2 180495 1.00000318 7661913573733 7660653769405 19 1506 99.84 2.81 00134
3 180315 0.99999374 7661914290107 7660080619675 19 1506 107.39 2.76 00134
4 174542 1.00001515 7661915007648 7655667807040 19 1506 99.78 2.50 00134
5 176559 0.99999994 7661915718370 7655188789017 19 1506 107.12 2.62 00134
6 177244 1.00000485 7661916429692 7654484025599 19 1506 106.46 26.68 00134
Table6.3: An examplesynchronisationresultasstored in global clocks file for six nodes.
In Table6.3,Thefirst column(node) is thenodenumbered.Thesecond column(intercept)is
the intercept for thestraight line fit. Thethird column (slope) is theslopeof the line. Thefourth
(yinitial) andfifth (xinitial) columnsare the initi al y andx values, that is the initial global and
local times.Thesixth column(points used)is thenumber of pointsusedin obtaining thebestline
fit. The seventhcolumn (exec time) is the time after the startof the synchronisationprocessin
which theresults wereobtained. Theeighth (mean)andninth (std dev) columnsarethemeanand
standarddeviation of the points usedto produceline of bestfit. The tenth column(sync no) is
theentry number since thestartof thesynchronisationprocess.In theabove,we have 134entries
since thestart of thesynchronisation.
Oncethe startflag is initiated,the last entry in global clocks file is copied into a file called
global clocks. This is usedfor themeasurementsthatfollow.
Themeasurementsstart by all nodes reading the“global clocks” file. Next, theuser supplied
initi alisation file “measurementini” is read. This file is a list of five commands: max run time,

6.5Measurementsprocedure 127
vlan, priority, cfi andextra string. Thecommandandtheir argumentsareexplainedtheTable6.4.
Command Type Default Comments
max run time Integer None Thelengthof time to run themeasurementsfor in seconds.Thenode nameis normally setto all in this case.
vlan Integer 0 The 8-bit VLAN identifier of the VLAN tag control information field. All packets leaving the nodewill have
this VLA N value.
priority Integer 0 The 3-bit userpriority of the VLAN tag control informationfield. All packets leaving the nodewill have this
priority
cfi Integer 0 The1-bit canonical format indicator (CFI) of the VLA N tagcontrol informationfield. All packetsleaving the
node will have this CFI value
extra string String extra string An extra sting printedwith theresults to helpwith theanalysis.
Table6.4: Thecommandsfor measurementinitialisation.
6.5.2 The transmitter and receiver
MESH threadsareusedfor implementing the transmitter andreceiver. In making the measure-
ments,we require a steady state. That is, we have to allow enough time such thatall transmitting
nodes in the system are sending at the requested rate and the target nodesare receiving. The
steady stateallowsany erroneousmeasurementsdueto theasynchronoussystem startup andstop-
ping to be discarded. During the first few secondsandthe last few seconds of the measurement
time, no measurementsaretaken. Theasynchronousstartups may be dueto delays in accessing
files via NFS(all node accesstheconfigurationfiles andtraffic patternson NFS. They alsowrite
their results in thesamedirectory) andto a lesser extent, theuseof PCsof differing speedsin the
testbed.
In performing theactual measurementsof transmit andreceive throughput, framerateetc,the
results arecalculatedevery results period of threesecondsandaveragedover thewholemeasure-
mentperiod.
The transmit ter
Thetransmitthread is startedafter theglobal clocks have beenread. Eachnode’s transmit thread
starts by reading the traffic patterns. The global clock node (node 0) sendsto all nodesa time
whenthey should all begin transmission.
Thepacketsaretransmittedaccording to thetraffic patternfile. If theendof thetraffic pattern
file is reached, then thesequenceis startedagainfrom thetop of thefile. Eachpacket transmitted

128 Chapter 6. TheEthernet testbedmeasurementsoftwareandclock synchronisation
hasthe64-bit sequencenumberandtimestampenteredinto thedataareaof thepacket. If wecount
theMESHcontrol informationoverhead(sourceanddestinationportnumbers)of four bytes, then
thereare20-bytesof useful datain eachpacket. This is accountedfor in the calculation of the
results, but it doesnot affect the measurementsfor the minimumpacket sizesincethe minimum
datafield of anEthernetframeis 46 bytes. Figure6.19shows theformatof theETB framewhich
is encapsulatedin thedatafield of theEthernet Frame.
2 octets 2 octet 8 octets 26-1500 octets
MESHdestination
port
Sequencenumber
DataMESHsourceport
8 octets
Timestamp
Figure6.19:Theframeformatof ETB software.
Thetime stampedinto eachpacket is thenode’s local clock time.
The receiver reads the time stampin the received packet and its own local time when the
framewasreceived. It is able to convert both timesto the global time usingthe information in
global clocks andcalculatestheend-to-endlatency.
Every measurement period (threeseconds), the results are calculatedand at the end of the
measurement,the averageof the calculatedresults aresaved to a file called“sn0x.tx”, where0x
corresponds to thenodenumberof the transmitter. An exampleof theoutput of the transmitting
thread is shownin Table6.5.
NoOf
Nodes
Frame
Size
(Bytes)
Tx Node Throughput
(MBytes/s)
Frame
Rate
(frames/s)
Run Bytes
(Bytes/run)
Run
Frames
(frames/run)
Total
Bytes
(Bytes)
Total
Frames
(frames)
Extra
String
6 250 0 37.69 150741.33 113056000 452224 452332250 1809329 test run
Table6.5: An exampleof theoutput of anETB transmitter.
Themeaning of thevariousfieldsin Table6.5are;» NoOfNodes:Numberof nodein thenetwork. Obtained from thenumberof MAC addresses
in theaddressesfile.» FrameSize:Thesizeof theframesthisnode is transmitting. If multiplesizesareused, then
this is thesizeof thelastframetransmitted.» TxNode: Thenode numberof thetransmitter.» Thr oughput: This is calculated by looking at the number of bytes sentby the transmit
threaddivided by themeasurementperiod.» FrameRate: Thetransmit framerateis thenumberof framespersecond transmitted.

6.5Measurementsprocedure 129
» RunBytes: Thenumberof bytessentin themeasurementperiod.» RunFrames: Thenumberof framessentin themeasurementperiod.» TotalBytes: Thetotal number of bytes sent.» ExtraString: Theextra string argumentin themeasurementini file.
At the endof the measurementperiod, the transmitting threadendsand the nodes return to
synchronising until the next “start” flag. Thereis always at least one synchronisationprocess
between eachmeasurementcycle.
The receiver
The receive thread is started after the “configuration” file is readandbefore the synchronisation
processstarts. Thereceivedstatisticsareiniti alisedto zeroat thestartof every measurement.
Whena packet comesinto thenode, thereceive thread identifieswhich sourceport it camein
on. Thentherelevantvariablesandstatistic areupdatedasfollows:
1. Thenumberof bytesandframesreceivedin thecurrent results period is updated.
2. The lost framerate is checked. The sequencenumberin the frameshould increment for
eachframereceivedfrom a particular port.
3. A histogramentryof lostpacketsis madepersendnodeif there is apacket loss.Theresults
arestoredin the files named“histogramclos from 0x to 0y” where0x is the transmitting
nodeand0y the receiving node. Subsequentbins in this histogramcorresponds to an in-
creasing numberof consecutive losses. If thereare no losses, no file is produced. The
width of the histogramand its bin size is controlled by the “time spread” and“bin size”
commandsin “configuration”.
4. The number of received overflows is checked. In MESH, if a receiver is unable to accept
packets fastenough from its port, then packets destined for its port arediscardedso that
otherportsdo not suffer asa result. Eachport hasa received overflow telling how many
packets destinedfor that port have beenthrown away. This tells us that ETB wasunable
to keepup with the receive rate. Thuswe do not assign these losses to thedevice/network
undertest.
5. Thetimeof arrival is notedassoonasthepacket is received. Thepacket’send-to-endlatency
is calculatedbased on thesourceanddestination node numbersandtheglobal clocks file.
6. Threehistogramfilesof theform histogram type from 0x to 0y areproduced.Where0x is
thesourcenode and0y is thedestinationnode andtypeis thetype of histogram.

130 Chapter 6. TheEthernet testbedmeasurementsoftwareandclock synchronisation
» histogram txip from 0x to 0y: A histogramof the inter-packet timesassent by the
transmitter thread,thatis, whenthetransmitterthread scheduledthepacket to besent.
This is achieved by looking at the differencebetweenthe timestampof subsequent
packets received from a particular source. It tells us the traffic pattern we actually
sent,which canbecomparedto whatwasaskedto besent.Only timestampsbetween
subsequentpacketswhereno packet losses occurredarehistogrammed. Lost packets
would artificially increaseinter-packet times.
» histogram rxip from 0x to 0y: A histogramof the inter-packet timesas received at
thereceiver. This is achievedby noting thethetime betweenarrivals of theincoming
packets. This canbe compared with the transmittedinter-packet time to observe the
effectcaused by theswitch/network in betweenthenodes.An exampleof thereceived
inter-packet time histogramhistogram rxip from 0x to 0y, compared to the transmit
inter-packet time histogramhistogramtxip from 0x to 0y, is shownin Figure 6.20.
Theconditions for this weretwo nodesdirectly connectedandonesending framesof
1500bytesatafixedinter-packettimeof 240 ¼ s. Thetransmit inter-packetdistribution
is fairly narrowat the requestedtime of 240 ¼ s. The receive inter-packet time hasa
main peak at ¼ s andtwo smallerpeaks, one10 ¼ s eachsideof the main peak. The
reasonfor thesmallerpeaks is dueto thepoll mechanismby which MESHdetectsthe
arrival of a packet. Thetime betweenpolls is 10 ¼ s, therefore is a packet arrivesjust
after a poll, it will be detected 10 ¼ s later. This in turn causesthe inter-packet time
betweenthis packet andthenext to be10 ¼ s lessthanit should.
» histogram measfrom 0x to 0y: The histogramof the end-to-endlatency. It is pro-
ducedby recording the end-to-endlatenciesof each packet. An exampleof this his-
togramis shownin Figure6.21. The conditions wereasabove. The main peakis at
150 ¼ s. As above, theinter-poll time of 10 ¼ s is thereason for thesecondpeakat 160
¼ s.
Thewidth andbin sizefor thesehistogramsarecontrolledby the“time spread” and“bin size”
commandsin “configuration”.
7. Thesourcenodenumber, thedestinationnodenumber, themessagesizeandthelatency are
recodedperpacket andstoredin files named“latency0x” if all latency record is enabledin
the“configuration” file. 0x represents thereceiving node number.
Oncethe relevant variables andstatistic areupdated,the received packet is discarded. After

6.5Measurementsprocedure 131
210 220 230 240 250 260 270
10−3
10−2
10−1
100
Pro
babi
lity
Inter−packet time. us
1500 bytes. 240 us inter−packet time
Transmit inter−packet timeReceieve inter−packet time
Figure 6.20: A comparison of the transmit
andreceive inter-packet time histogramwhen
sending framesof 1500bytesat 240 ¼ s inter-
packet time
140 150 160 170 180 190 200
10−3
10−2
10−1
100
Latency. us
Pro
babi
lity
1500 bytes. 240 us inter−packet time
Figure 6.21: A histogram of the end-to-end
latency whensending framesof 1500bytesat
240 ¼ s inter-packet time
every results period, the results arecalculated. At the endof the measurementperiod, thecalcu-
latedresults areaveraged andstored to files named“sn0x.rx” wherethe 0x is the nodenumber.
An exampleof theoutput of thereceivingthreadis shown in Table6.6:
NoOf
Nodes
Frame
Size
(Bytes)
Rx Node Tx
NodeNr
Throughput
(MBytes/s)
Frame
Rate
(frames/s)
LostFrame
Rate
(frames/s)
Average
Latency
( ² s)
TotLost
Frames
(frames)
Rx Over-
flows
(frames)
TotRec
Frames
(frames)
Extra
String
6 250 1 0 24.24 96956.67 47965.33 9782 444719 0 1096954 test run
6 0 1 1 0.00 0.00 0.00 0 0 0 0 test run
6 0 1 2 0.00 0.00 0.00 0 0 0 0 test run
6 0 1 3 0.00 0.00 0.00 0 0 0 0 test run
6 0 1 4 0.00 0.00 0.00 0 0 0 0 test run
6 0 1 5 0.00 0.00 0.00 0 0 0 0 test run
Table6.6: An exampleof theanETB receiver output. This showsthatnode0 wastransmittingto
node1 framesof 250bytes. Theachievedthroughput was24.24MBytes/sandtheaveragelatency
was9782 ¼ s.
Themeaning of thefieldsin thetable are;
» NoOfNodes:Numberof nodein thenetwork. Obtained from thenumberof MAC addresses
in theaddressesfile.» FrameSize:Thesizeof theframesbeingreceived.

132 Chapter 6. TheEthernet testbedmeasurementsoftwareandclock synchronisation
» RxNode: Thenode numberwhich is receiving.» TxNodeNr: Thesendnodenumber.» Thr oughput:Thereceive throughput is the number of bytesreceived divided by the mea-
surement period.» FrameRate: The numberof framesper second received. This is calculated by looking
at the numberof framesreceived in the measurementperiod anddividing the numberof
framesby thetime.» LostFrameRate: Thenumber of frameslost dividedby themeasurementperiod.» AverageLatency: Theaverageend-to-endlatency of theframesreceived.» TotLostFrames: Thetotal number of frameslost during all measurements.» RxOverflows: Thenumber of frameslost dueto insufficient buffer spacein the software.
This is a featureof thecurrent implementationof MESH.» TotRecFrames:Thetotal numberof framesreceived.» ExtraString: Theextra string argumentin themeasurementini file.
In Table6.6,thereceivingnodewasnode 1 andonly node 0 wastransmitting.
Broadcasts,multicasts and unknown MAC addresses
Therearea numberof MAC addressesto which eachnodein thetestbed will respond. Thelocal
MACunicastaddress,thebroadcastaddress,ff:f f:f f:ff:f f:f f, andamulticastaddress,01:00:00:00:40:3d.
Therearealsoother addressesusedfor testing theswitch/network’s reaction to unknown Ethernet
addresses.
A MESHport is setup for eachof theseaddresses.Thuseachnodecantransmit to theseports
or receive from them.Whentransmitting, thelocal port is alwaysused asthesender. As a result,
thereceivingnodecanalwaysidentify thesender.
At the receiver, no distinction is madein displaying the results asto whether the packet was
sentto thelocal, broadcast,multicastor other port. Thischoicewasmadein orderto makereading
theresults easier ratherthan overwhelming theuser.
6.6 Considerationsin using ETB
We have beenableto obtain quite accurate synchronisationof PCclocks. However, the OScan
addarbitrary delays in theend-to-endpacket latenciesdueto interruptsandscheduling points. To
counter this, thenodes should beaslightly loadedaspossible.

6.7Possibleimprovements 133
To useETB to do any measurementsof switch performance,analysis of the nodebehaviour
whendirectly connectedis necessary. Thisallowstheeffectsof thenodesto befactorised out from
the switch or network. ETB producesthe transmittedandreceive inter-packet time histograms.
Whendoing simulations,thesehistogramscanbeusedasthedistribution presentedto theswitch.
Thehistogramstake into account theeffectsof theOS.
6.7 Possibleimpr ovements
To further improve the synchronisationprocess, the synchronisation just after the measurement
could becombinedwith thesynchronisationresults beforethemeasurementto obtain moreaccu-
rateend-to-endlatencies.
Synchronisation using different packet sizeshasnot beendone. We do not believe that this
would make any differenceto theresults since a majority of theerror is dueto theOSscheduling
of otherprocesses.
Support for TCP/IPcould be addedto ETB suchthat testson Layer 3 switching could be
performed.However, theextra processingwould cause theperformanceof ETB to suffer.
6.8 Strengthsand limitations of ETB
Currently, the price for a PC (400MHz with 128 MBytes RAM, 8 Gigabytehard disk and an
Ethernet card)is $500. Thepricefor anIntel EtherExpressPro100is $80. Thusfor anETB Fast
Ethernet port, thecostis $600.
Thepriceof theAlteonACENIC[37] is $1500. Thusthecostof anETB Gigabitport is $2000.
This price is dominatedby thecostof theNIC. A cloneof theACENIC, theNetgear GA620[38]
costs $500 and brings the cost of an ETB Gigabit port to $1000. For our tests, the cost was
effectively zerosincewe hadaccessto the PCsusedfor testing the ATLAS framework software
equippedwith thenecessaryIntel FastEthernetNICs andsix PCswith theAlteon GigabitNICs.
A summaryof thepossible measurementsthat canbedonewith ETB are:
» Throughput. Both send andreceive throughput canbecalculated simultaneously.» Latencies. Histogramsof thetransmitandreceive inter-packet timesandEnd-to-endLaten-
ciescanbeproducedto anaccuracy of a few microseconds.
» Packet loss. Measurementsof thepacket losscanbeobtained.
» Broadcast andmulticast frames.We cansendandreceive broadcastandmulticast frames.

134 Chapter 6. TheEthernet testbedmeasurementsoftwareandclock synchronisation
» Pointto point, point to multi-point, multi-point to point andmulti-point to multi-point com-
municationscanbeperformed.» Oversizedpackets(up to 4 kBytesfor FastEthernet and9 kBytes for GigabitEthernet) can
beused.
Thereareanumber of limitation, giventhatthetestsarecarriedoutusing softwarein thePCs.
They are:» Saturating a Gigabit link is difficult dueto thecombination of thePCIbus,thePCmemory,
thesoftware overheadandtheEthernetNIC. It requirestricks such astheloop-backtestor
usingmultiple nodesthrough a primaryswitch. SeeSection 7.6.8.» Thereis nocentral globalclock, soawayof synchronisingthePCclockshasbeendeveloped
to obtain oneway latenciesthroughtheswitch[39].» Our latency measurementsinclude the time the framespends in the NIC, but this canbe
factorisedout by direct measurements.» A steady statemustbe reachedbeforemeasurementscanbe taken. Measurementson the
initial “ramp up” of traffic cannot beobtained.» We arelimited by thenumber of PCsandEthernet NICs available for theGigabitandFast
Ethernet. This limits thenumberof portswe cantestsimultaneously.» Differentspecification PCsmayhaveaninfluence on node behaviour.» Maximumframerateis ½�¾ õõõ frames/sof a theoretical ¿0Àn¾ÂÁ õõõ frames/s for FastEthernet
and ½ õõõõ frames/sfrom a theoretical ¿ ÷ Àn¾Äé¿ õFÅ frames/s for GigabitEthernet.
We make oneassumption aboutthe switch under test. With only oneuserframetransmitted
through the switch, the latency suffered by the framebetweenspecificports is constant. This is
necessaryto make theclock synchronisationwork.
6.9 Commercial testers
Thereexist testhousessuchasMier1, Tolly2 andUniversity of New Hampshire Inter-Operability
Lab3 whotestcommercial switches.Theequipmentusedby thesetesthousestendsto bespecially
built testers from companiessuch asIxiacom4 andNetcom5. ThesetestersuseASICsto transmit
andreceive framesat full GigabitEthernet line speed.1http://www.mier.com2http://www.tolly.com3http://www.iol.unh.edu4http://www.ixiacom.com5http://www.netcomsystems.com

6.10PriceComparison 135
Most of these testers areintendedto support a range of technologies,not just Ethernet. Due
to their architecture, they arecapable of performing measurementson cross-technology switches.
Capabilities which maybefound on commercial testersinclude;
» Stresstesting.» Performance measurements.
– Perport wire speed transmitandreceive.– Real-timelatency on a packet by packet basis.– QoSmeasurement.– Displaysresults in real-time.– Userdefinable preamble, addressesandpayloads.
» Troubleshooting.» Illegal frames.» Testsfor Ethernet, ATM, packet over SONET, Framerelayandtoken ring.» TCPaswell asEthernet modes
Not all commercial testers offer all theabovecapabilities.
An exampleof thesetestersis theIxiacom’sIXIA 1600. This is hasa16slotchassiswhichcan
host64 FastEthernet portsor 32 Gigabit Ethernet ports. 256 chassis canbe connectedtogether
with a clock accuracy of 40 nanoseconds.
Oneof Netcom’sproducts,Smartbits6000, is asix slotchassis whichcanhost 96FastEthernet
ports or 24 Gigabit Ethernet ports. Eight chassis can be connected together to simulate large
networks.
6.10 Price Comparison
Thecapabilitiesof thecommercial testersdonotcomecheap. For theIXIA 1600,thechassis costs
of theorder of $8,500, theFastEthernetmodule(four ports)is $8,500 andtheGigabitmodule(two
ports) $16,000. The 16 slot chassisthusprovidesfor a 64 port FastEthernettesterat $144,500
($2,300 perport) or a 32 port Gigabit testerat $265,000($8,300perport).
The price of NetcomsystemsSmartbits6000 testeris $18,200 for the chassis, $30,400 for
eachFastEthernet module (16ports)and$24,300 for eachGigabitmodule(four ports). Theprice
perport is thus$2,100for FastEthernetand$7,000 for GigabitEthernet. OtherGigabitEthernet
testers includethe following; Hewlett-Packard’s LAN Internet Advisor, ableto testoneport full
duplex or 2 ports in half duplex costs$50,000. Network Associates’ Gigabit Sniffer can also
136 Chapter 6. TheEthernet testbedmeasurementsoftwareandclock synchronisation
testoneport full duplex or 2 ports in half duplex. This costs $38,000. Wandel andGoltermann
Technologiessell theirDominoGigabitfor $41,000. Two arerequiredto testtwo portsfull duplex.
Our PCsystem is a factor four timeslessexpensive for FastEthernet ports anda factor seven
timeslessexpensive for Gigabit Ethernet ports. As the PCscanbe usedfor otherpurposes,it is
feasible to borrow themand the hardwarecost is simply the costof the extra NIC, makingour
FastEthernet tester 25 timeslessexpensive andour GigabitEthernettestera factor 14 timesless
expensive thancommercial systems.
6.11 Conclusions
Theaim of developing anEthernet testbed(ETB) hasbeenmetandat a competitive price.
ETB is enabling the investigation of commodity Ethernet switches. It usesa farm of PCsto
testswitchesby sending messagesthroughthemandextracting theachievedthroughputs, latency
distributions,andprobability of a message arriving. Suchcharacteristics arerequired to examine
thesuitability of Ethernet for theATLAS LVL2 trigger.
To date, eight different Ethernet switches with up to 32 nodes have beentestedwith ETB.
It hasbeencalculatedthat the system will support up to 166 nodes beforedeterioration in the
results is observed. This limit is dueto the synchronisationtechniqueused here. A higher limit
(aswell asmoreaccuratelatency measurements)couldbeachievedif a moreaccuratemethodof
synchronisationsuchasa global clock could beimplemented.
TheETB is capable of streaming at thefull FastEthernet link rate.ThisallowsFEswitchesto
betestedunder demanding conditions. With GigabitEthernet, wecanreach71MBytes/sunidirec-
tionally outof apotential 125MBytes/s. Bidirectionalstreamingprovesto beaproblemdueto the
arbitrationmechanismof thePCI bus. Onestreamcancause thePCI busto lock temporarily into
transmitting or receiving causing unfair distribution in the link bandwidth between the transmit
andreceive threads on eachnode.

Chapter 7
Analysis of testbedmeasurements
137

138 Chapter 7. Analysis of testbedmeasurements
7.1 Intr oduction
Construction of the full sizeATLAS trigger network for performancetesting purposeswould be
ideal, though impractical andexpensiveatthisearlystage. Modelling andsimulationarenecessary
precursorsin assessing the performanceof the network using Ethernet technology. Modelling
will increaseconfidence that the system will work as predicted before the system components
arepurchased. Modelling alsoprovidesus with a tool by which the systemsbottleneckscanbe
identified andpossiblealternative networking strategiesinvestigated.
Networks consisting of a layeredstructure of smallerswitch units mustbestudied since it is
unlikely that a single switchwith over 2500portswill beavailable.Thusto assess thescalability
and performanceof sucha structure we evaluatesingle commodity Ethernet switch units. We
modeltheirbehaviour with theaimof simulating thewholeATLAStriggernetwork asanarrayof
switches.
This work is the natural stepafter the PaperModel [4] andprovidesmodelsof the ATLAS
LVL2 system which aretechnology specificandcansimulate thetransientbehaviour.
In what follows, we present a brief description of the architecture of contemporary Ethernet
switches, our modelling approach, a description of the switch modelling and a description of
the measurementmethodology usedto characteriseEthernet switchesandextract the necessary
informationfor themodelsto berealised.
The modelling is not the work of the author, however the author played wasresponsible for
understanding andconfiguration of the switches, performing numerous measurementsandanal-
ysis andtook a high profile role in discussions which allowed the construction, calibrations and
verification of themodels.
7.2 Contemporary Ethernet switch architectures
Figure7.1 shows simplified representationsof multi-port switches. The Switch of Figure7.1(a)
hasfour portsandaswitchfabric or backplane.TheCPUattachedto theswitchis usedto manage
the switch. It is usedto run the SNMP server to allow configuration suchasVLANs, port pri-
oritiesandport speeds. Switcheswhich canbesoconfiguredareknown as“managedswitches”.
Switcheswithout CPUshave fixedconfigurationsandareknown as“unmanagedswitches” Most
contemporary switchesarehierarchical. They have a layeredswitching structureasshownin Fig-
ure7.1(b). Theswitchingunitscanbecascadedto increasetheswitchportdensity. Thecascading

7.2Contemporary Ethernetswitcharchitectures 139
requiresa second level of switching. Switchmanufacturersusethis architecture to provide mod-
ule based switcheswherea chassis holds the backplaneandCPUunits. Modules containing the
switchportscanbepurchasedseparatelyto plug into thebackplane. Customerscanthereforeplan
their networks to allow for growth.Thesemodular andhierarchical switchesalsoallow switching
between different speeds,10,100and1000 Mbit/s Ethernet.
Switching Fabric
CPU
Port1
Port2
Port3
Port4
(a) Simpleswitcharchitecture
Local switch
Port1
Port2
Port3
Port4
Local switch
CPU
Port5
Port6
Port7
Port8
Backplane switch
(b) Cascadedswitcharchitecture
Figure7.1: Thetypical architecture of anEthernet switch
7.2.1 Operating modes
The switches canoperate in two modes. The first is known asstoreand forward. This means
whena framescomesin on the input port, thewhole frameis stored before beingswitched to its
destination port. As a resultof this store, theframesuffersa latency proportional to its sizebefore
being transmittedto thedestinationport. Theadvantagesof storeandforward are:
» It allows transfer betweendifferent mediaspeeds. For examplegoing from 100 Mbit/s to
1000Mbit/s andvice versa.» Buffering in theswitchhelps to improve network performanceandis particularly important
in dealingwith transientcongestion. With buffering, framescanbestored whenthenetwork
is congested. Without buffering, they arecertainly dropped.» Theswitchcandiscard corruptedframesbefore forwarding themto thedestinationport.
Thesecond way in which a switchcanoperateis in cut-through mode.This modeswitchesa
frameto its destination portassoonasthedestinationaddressis known,while still receiving from
theinput port. Thustheframesuffersminimaldelay in going throughtheswitch.Thecut-through
switching modeis lesspopular becauseit is not possible to switch betweendifferent Ethernet

140 Chapter 7. Analysis of testbedmeasurements
speeds. It also allows corrupted framesto be transmitted. A modecalled interim cut through
exists wherebyat least the first 512-bits arestored before switching. This avoids the forwarding
of runt 1 frames.It is possible for a switch to operatein both cut-through andstoreandforward
modes.Equally valid is a modewheretheframeis bufferedfirst if thedestinationport is blocked,
otherwisetheoperationis cut-through.
7.2.2 Switching Fabrics
Contemporary Ethernet switcheshave oneor a mixture of switching fabric architectures. These
fabric aretypically thecrossbar, theshared buffer andthesharedbus.An exampleof thecrossbar
fabric is shown in Figure7.2. In a crossbar fabric, each port cancommunicatewith anotherport
at thesametime without affecting theperformanceof theotherports. Framesswitchedthrough a
crossbarfabric have to pass throughtwo buffer, theinput andoutput. If eachlink of theswitching
fabric runsat thesamerateasthe incoming port speed or higher, then theswitchshould benon-
blocking. By non-blocking, wemeanthat for all datasizes,pairsof nodescommunicatingthrough
theswitchcanreachthefull link ratewith all ports of theswitchactive.
A sharedbuffer switcharchitecture is shownin Figure7.3. Typically, theperformanceof this
typeof switch is limited by thespeedof thesharedbuffer. An advantageof this typeof switch is
thattheframespassthroughasinglebuffer in beingforwardedto their destination, thusproviding
alowerlatency throughthefabric comparedto theothermethods. A problemwith thisarchitecture
is that scalability dependson how fastthe memorycanbe madeto run. An n-port non-blocking
switchrequiresthememoryto run at 2n à thespeedof a singleport.
In a shared bus as shownin Figure 7.4, the buffers are distributed to the ports. All ports
communicatevia theswitching bus. It hastheobvious advantageof having memorieswhich can
berun at a slower speed thanthat of thesharedbuffer. Thedisadvantage is thata framenormally
requirestwo storeandforwardsfrom sourceport to destination port andtheperformancedepends
on the speedof the bus. The shared buffer architecture tendsto be moreexpensive thanthe bus
based architecture due to the faster memoryrequirement. Also, only one pair of ports can be
communicatingatany onetime. However, if thebuscanrunatn timesthenumberof ports,where
n is therateof a single port, thentheswitchshould benon-blocking.
1runt framesareframeswhich aresmallerthanthelegalEthernetsize.

7.2Contemporary Ethernetswitcharchitectures 141
Input
Output
Port 4
Buffer
Port 3
Buffer
Port 2
Buffer
Port 1Networkprocessor
Buffer
Networkprocessor
Networkprocessor
Networkprocessor
Port 1
Buffer
Port 2
Buffer
Port 3
Buffer
Port 4
BufferNetworkprocessor
Networkprocessor
Networkprocessor
Networkprocessor
Figure7.2: Thecrossbarswitcharchitecture
Port1
Port2
Port3
Port4
Shared bufferNetworkprocessor
Figure7.3: Theshared buffer switcharchitecture
Shared bus
Port 1
Buffer
Port 4
Buffer
Port 3
Buffer
Port 2
BufferNetworkprocessor
Networkprocessor
Networkprocessor
Networkprocessor
Figure7.4: Thesharedbusswitcharchitecture

142 Chapter 7. Analysis of testbedmeasurements
7.2.3 Buffer ing
As we have seen,buffers maybesharedfor all ports or distributed. In general, themorebuffersa
framehasto go throughto get from its input to its destination port, thegreater the latency. For a
storeandforwardoperation, shared buffers would usually addonestoreandforward latency to a
framewhile distributedbuffer would normally haveat leasttwo.
Buffershelp to increasethroughput andutil isation. Therearethreetypesof buffering. Input,
output andcentral buffering. Theshared buffer switcharchitecture of Figure7.3 is anexampleof
central buffering.
Input buffering allows for accessto the switch fabric. It alsoallows for head-of-li ne (HOL)
blocking to be resolved. Outputbuffering matchesthe switch fabric link speed with the output
port’s line speed. Managing the buffer queues allow quality of service (QoS) and congestion
control to beimplemented.Thearchitecture of a realswitch is presentedin Appendix C.
7.3 Modelling approach
Theapproachfollowedis illustratedin Figure7.5. Thefirst stage wasto selecta switch.Thetype
of Ethernetswitchselectedwasahierarchical storeandforward switch.Thehierarchicalstructure
simply meansit is built in a cascadedmodular fashion with a chassis asdescribed in Section7.2.
Thereasonswhy this typeof switchwaschosenwasbecausethestoreandforward nature allows
thecascadingof switchesof differentspeedsto form largenetworks,aprerequisitefor theATLAS
LVL2 system. It alsohappensto bethemostpopular design for contemporary Ethernetswitches.
Next, we obtained asmuch information on the specification of the switch aspossible, then
constructed a detailed model.Unfortunatelythespecifications arenot alwaysaccurateor aremis-
leading, incompleteor simplyunavailable. Someasurementsarealsonecessaryto characterisethe
switch. Results from thedetailed modelarecompared to themeasurementsin various configura-
tions to ensure thattheswitchhasbeenaccurately modelled. If themodelis not satisfactory, then
refinements aremadeuntil it is.
Onecannot always obtain the depthof information about a switch to allow a detailed model
to beconstructed. Constructing anaccuratedetailedmodelis alsotime consuminganddueto the
resulting detail, slow to run. We thereforemoved to a parameterisedmodel. Detailedmodelling
of theswitchwasnot repeated.
Analysis of the detailed model revealed critical parameters. Thesecritical parameterswere

7.3Modelling approach 143
usedto simplify the modelof the switch andcreate a vendor independent parameterised model.
Themodellingof otherswitchesof thesameclassandtype is doneby obtainingtheparametersof
thatswitchandsubstituting theminto themodel.Beinga simplifiedmodel, onecannot expect to
getanexactmatchof themodelto themeasured results. We aimedfor anaccuracy between5 to
10%of themeasurement.
Theparameterisedmodelof theswitchcanbeusedto modellargersystemsupto thefull scale
ATLAStrigger/DAQ systemwheremodelsof other componentscanbeaddedandtheperformance
of thefull systemexamined.
Create detailed model
Is the model satisfactory?
Decide on choice of measurements
Make measurementsRefine model based on measurements
Simplification (Extract critical parameters)
Create parameterised modelbased on measurements
and detailed model
Is the parameterised modelsatisfactory?
Design measurements aimed at collecting critical
parameters
Make measurements
No Yes
Yes
No
Select the switch type
Obtain the switcharchitecture and spec.
Detailed model
Parameterised model
End
Figure7.5: Theinteractionbetweenmodelling andmeasurement activity.

144 Chapter 7. Analysis of testbedmeasurements
7.4 Switch modelling
7.4.1 Intr oduction
We basedour detailedmodelon theTurboswitch 2000 from Netwiz. A description of it is given
in Appendix C. A network simulator called OPNET [42] was selected as the modelling tool.
OPNET is a discrete eventsimulationtool specifically for simulatingnetworks. It hasimplemen-
tationsof various link layer protocols including Ethernet. This includednodes, links, MACsand
switches. Theseimplementationsweregeneric, unrealistic andlatency wasincurred only in the
links; they modelled ideal systems. Even so, the environment wasuseful becauseit gave us the
basic framework suchthatwecould focusonmodelling theparameterised Ethernetswitch.At the
timeof writing, thereis nosupport for thelatest IEEEstandardssuchasflow control, trunking and
VLANs. It is possiblethatthese will beaddedin thefuture.
The level of detail providedby OPNET causes modelling large network to beslow andtime
consuming.At a laterstage, themodelwasported to Ptolemy[43], amoregeneralmodelling tool.
Ptolemyis faster but hadlessfeatures. It is alsothe modelling tool adoptedby othermodelling
effort within ATLAS. Thetwo tier approachto modelling alsoprovideda way to cross checkthe
modelsduring development.
7.4.2 The parameterisedmodel
Therearethreeobjectivesfor theparameterised switchmodelling. They are;
1. Produceaflexible modelwhichcanaccommodatefuturechangesanddevelopmentsof IEEE
802.3standards.
2. Producea simplified modelwhich executes fasterthan a modelwith many details.
3. Produceamodelwhich canbeeasilymodifiedto simulateswitches from differentvendors.
Theseobjectivesfacilitate the modelling of larger networks with tensof switches andthou-
sands of nodes. They alsoimply thatwe canhave a tool to modeldevices from different vendors
by simply altering key parameters. A detailed modelwasconstructedbasedon the description
givenin Appendix C. Measurementson therealswitchwerecomparedwith thesimulation results
of the detailed model. Oncewe were satisfied that the detailed model sufficiently represented
the real switch,we beganparameterising the model. Theaim wasto find out whatvariablesand
characteristics definedtheworking andperformanceof theswitch.

7.4Switchmodelling 145
Module
BufferManager
Inputbuffer P1
Outputbuffer P2
BufferManager
MACMAC
P8P5
P1 = Input buffer length (#frames)P2 = Output buffer length (#frames)P5 = Max Intra-module throughput (MBytes/s)P8 = Intra module transfer bandwidth (MBytes/s)P10 = Intra module fixed overhead (not shown)
Figure7.6: Theparameterisedmodel: Intra modulecommunication.
Output ModuleInput Module
BufferManager
Inputbuffer P1
Outputbuffer P2
BufferManager
BackplaneP6
P7 P7P3 P4
MACMAC
Output ModuleInput Module
BufferManager
Inputbuffer P1
Outputbuffer P2
BufferManager
BackplaneP6
P7 P7P3 P4
MACMAC
P1 = Input buffer length (#frames)P2 = Output buffer length (#frames)P3 = Max To backplane throughput (MBytes/s)P4 = Max from backplane throughput (MBytes/s)P6 = Max backplane throughput (MBytes/s)P7 = inter-module transfer bandwidth (MBytes/s)P9 = Inter module fixed overhead (not shown)
Figure7.7: Theparameterisedmodel: Inter modulecommunication.

146 Chapter 7. Analysis of testbedmeasurements
Theparameterisedmodelis based on themodular structureshown in Figure7.6and7.7. The
performancedefiningfeaturesof the switch wereidentified asthe list of parametersbelow. Full
description of these parametersis givenin Appendix D.
1. ParameterP1: Thelength of theinput buffer in themodulein frames.
2. ParameterP2: Thelength of theoutput buffer in themodule in frames.
3. ParameterP3: The maximumthroughput for the traffic passing from the module to the
backplanein theinter-module transfersin MBytes/s.
4. ParameterP4: Themaximumthroughput for thetraffic from thebackplaneto themodulein
theinter-module transfersin MBytes/s.
5. ParameterP5: Themaximumthroughputfor theintra-moduletraffic in MBytes/s.
6. ParameterP6: Themaximumthroughputof thebackplanein MBytes/s.
7. ParameterP7: Thebandwidth requiredfor a single frametransfer in theinter-modulecom-
municationsin MBytes/s.
8. ParameterP8: Thebandwidth required for a single frametransfer in theintra-modulecom-
municationsin MBytes/s.
9. ParameterP9: Thefixed overhead in framelatency introducedby the switch for the inter-
moduletransfer in microseconds.
10. ParameterP10: Fixed overheadin frame latency introduced by the switch for the intra-
moduletransfer in microseconds.
7.4.3 Principles of operation of the parameterisedmodel
Theoperationof theparameterisedmodelis basedon calculations usingparameters representing
buffering andtransfer resourcesin theswitch.
Whentheframearrivesattheswitchacheckis madeto seewhetherthereareenoughresources
to buffer the frame (if the current count of framesbuffered in the buffer doesnot exceedthe
parameterP1). If thecheckis negativetheframeis dropped.Thereis noflow control in thecurrent
implementation. Oncetheframeis bufferedin theinput buffer thecurrent count of bufferedframes
in thesourcemodule is increasedandtherouting decision is made.
Depending whether it is an intra or inter-moduletransfer thecorresponding parameter, P9or
P10,is usedto modelthefixedoverheadtime for taking therouting decision. Currently there are
4 types of transfers: inter-module unicast, inter-modulemulticast, intra-moduleunicast andintra-
modulemulticast (broadcastis implemented in the sameway asmulticast). The type of transfer
defineswhich resourceswill be necessaryto start the transfer. In case of unicaststhe resources

7.4Switchmodelling 147
for a single frame transfer from the input buffer of the source module to the output buffer of
the destination module will be necessary. In caseof multicasts, resourcesfor multiple transfers
between andinside themoduleswill benecessary.
The frame transfer is seenas a request to provide the bandwidth needed to commence the
transfer: in theinter-moduletransferstherequestedbandwidth is representedby theparameterP7
and for the intra-moduletransfers the requestedbandwidth is representedby the parameter P8.
Framescurrently beingtransferred occupy somepartof thethroughput representedby parameters
P3, P4 and P6 for the inter-module transfers and P5 for the intra-module transfers. The time
for which they occupy a resource is known asthe occupancy time. Together with evaluation of
the transfer resourcesanother checkis madeto verify if thereis enough buffering capacity in
the output buffer of the destinationmodule. If the available throughput is larger or equalto the
requestedbandwidth andthereis bufferingavailablethe frametransfercanstart. Newly inserted
framesreduce the available throughput by a fraction corresponding to the parameter P7 or P8
depending whetherthey are inter or intra-moduletransfers. Also, the current countof buffered
framesin theoutput buffer is incremented.
Oncethe resourceshave beengranted,calculations aremadeto get theoccupancy time. The
occupancy timeis calculatedastheframesizedivided by P7or P8.It is usedto evaluatehow much
throughput is availableatany point in time. If theavailablethroughput requestedby aframeis less
thanthatavailable,it waitsuntil thenecessaryresourcesbecomeavailable (whenanother frame’s
transfer finishes). If therearemoreframeswaiting for resourcesit is up to thebuffer manager to
decidewhich framewill betransferrednext. Thebuffer managermayimplement differentpolicies
to take decisions: theframewaiting thelongest time, thehighest priority frameetc.
When the framearrivesat the output buffer of the destinationmoduleit frees the allocated
transfer andbuffering resourcesin theinput buffer of thesourcemodule. It is then up to theoutput
buffer manager to decide which framefrom the output buffer will be sentout next on Ethernet.
Similar to the operation of the input buffer manager, the output buffer manager can implement
different policies when making its decision. When the frame finally leaves the switch via the
MAC, thecurrent count of bufferedframesin theoutput buffer is decremented.Theallocationof
resourcesfor the multicastandbroadcastmight be different from the singleframetransfer. The
policy of handling the multicast andbroadcastis strongly bound to the switch andwe have not
found any generalisation there. Currently the modelcreates a copy of the multicast (broadcast)
framefor eachremotemodulehousingat least onedestinationport.

148 Chapter 7. Analysis of testbedmeasurements
Theperformanceof theparameterised modelcomparedto thatof a realswitchon which it is
based is givenin Section8.2.
7.5 Conclusion
Analysing results from a setof communicationmeasurementswe wereableto identify the likely
internal structureof any Ethernetswitch. With thehelpfrom thevendor weconstructed a detailed
modelof theswitch. It helpedusto identify key parameters contributing to theframelatency and
thethroughput whentraversingtheswitchandthusdevelope a parameterisedmodel.
Theparameterised modelapplies to theclassof switchescharacterisedasmodular: theswitch
is composedof modulescommunicating by a backplaneandof the store-and-forward type(with
two stagesof buffering frames:in thesource andin thedestinationmodules).
Further work is beingdoneon theparameterised model. Featuressuchastrunking, priorities
andVLANs arebeing added. A validation of theparameterised modelis presentedin Section8.2.
7.6 Characterising Ethernet switchesand measuringmodel param-
eters
In this section, we present themeasurementmethodology usedto assess theperformanceof com-
modity off–the–shelf Ethernet switches andalso extract the necessary information to allow the
modelsto berealised. The limitationsof theETB software(described in Chapter6) waskept in
mind in designingthesemeasurements.
For the measurementsdescribed below, measurementsof directly connectednodesarealso
madeto obtain theoverheadsintroduced by thePC(PCI,NIC, operating systemandmeasurement
software) andtheperformancelimits. Thesecanthenbefactorisedout of themeasurementswith
theswitches.
7.6.1 End-to-End Latency (Comms1)
Thecomms1 or ping-pongmeasurementprocedureis asdescribedin Section 4.3. It is madeby
sending a frameof a fixedsizefrom onenodeto another andgetting thereceiving node to return
theframe.Thesending node cancalculatethetime it took to sendandreceive themessage. Half
of this time is assumed to betheend-to-end latency. This is repeatedfor a rangeof messagesizes

7.6Characterising Ethernetswitchesandmeasuring modelparameters 149
to obtain a plot of message sizeagainst latency. Examplesof the expectedresults oncethe PC
overhead hasbeenremoved, areshownin Figure7.8. Therearetwo lines, a solid anda dotted
line. Both showinglatency asfunction of the messagesize. This is becauseasthe message size
grows, it takesa longertime to store before forwarding it.
Message size
Latency
46-bytes
Minimum latency
Zero lengthlatency
1500 bytes
Slope indicating asingle store and
forward.
Slope indicatingmultiple store and
forwards.
Figure 7.8: An exampleplot of the comms1 measurement. The PC overhead, i.e. the direct
connection overhead should besubtractedto leave theswitchport-to-port latency.
Sinceit is possibleto havemorethanonelevel of switchingin aswitch, thisshould berepeated
to discover if different pairsof portshave different levels of switching between them. The solid
andthe dottedlines in Figure7.8 reflectthe singleandmultiple storeandforward performance.
Theping-pongmeasurementtells usthefollowing.
» The end-to-end latency gives the switch port to port latency. It tells us if the switch is
operating in cut through modeor storeandforward. If the switch is in store andforward
mode,thiswill tell usthenumberof levelsof switching, thatis if thereareoneor morestore
and forwards. The numberof storeand forwards and the switch layout will show which
combination of ports switch locally (intra module)and which switch via the backplane
(inter-module).» It alsotells us themaximumthroughputachievable(from thegradient of themessage size
versuslatency plot) without taking advantageof thepipelining effect.
For the parameterised model, the reciprocal of the gradients of the lines in Figure 7.8 in
MByte/s gives the bandwidth reserved for switching a single frame. This corresponds to
ParameterP8 from Section7.4.2 if it is intra-moduleswitching andparameter P7 if it is

150 Chapter 7. Analysis of testbedmeasurements
inter-moduleswitching.
– Theminimummessagesizedependentoverheadshouldbe0.08us/byteor 12.5MBytes/s
for FastEthernet and0.008us/byte or 125 MBytes/sfor Gigabit Ethernetfor a store
andforwardswitch.
» We canobtain the non-messagesizedependent overhead. This is the zero length latency
asshown in Figure7.8. It is interpreted asthe processing overheadrequired to make the
routing decision. This corresponds to ParameterP10from Section7.4.2for intra-module
switching andparameter P9for inter-moduleswitching.
This is alsoanindication of theminimumamount of memoryaswitchneeds. For example,
a switchof Æ portsrequiresat least ÆÇà minimumlatency à link speedbytesof memory.
Examplesof these measurementsaregiven in Figure7.9. This shows theswitchport-to-port
latency (results of thedirect connection have beensubtracted) for four GigabitEthernet switches.
Theresults for four switchesareshown:theCisco4003, theCisco4192G,theCisco6509andthe
Xylan OmniswitchSR9.Theplot showsthattheCiscoswitchesoperatein cut-through modesince
theirgradientsarelessthanthatof asinglestoreandforwardataGigabitrate(0.008¼ s/byte). The
Xylan OmniswitchSR9hasagradientof 0.025¼ s/byte,whichcorrespondsto aswitchport-to-port
rateof 40 MBytes/s. This suggest multiple store andforwards. Thefixedoverhead for theCisco
switches are1 ¼ s andfor Xylan Omniswitchit is 8 ¼ s. Further examplesof these measurements
aregivenin Figure8.1of Section 8.2.1.
0 500 1000 15000
10
20
30
40
50
60
Message size. Bytes
Late
ncy.
us
Port to port latencies for various Gigabit Ethernet switches
Cisco4003 Cisco4192G Cisco6509 XylanOmniSR9
Figure7.9: Port to port latency for variousGigabitEthernet switches
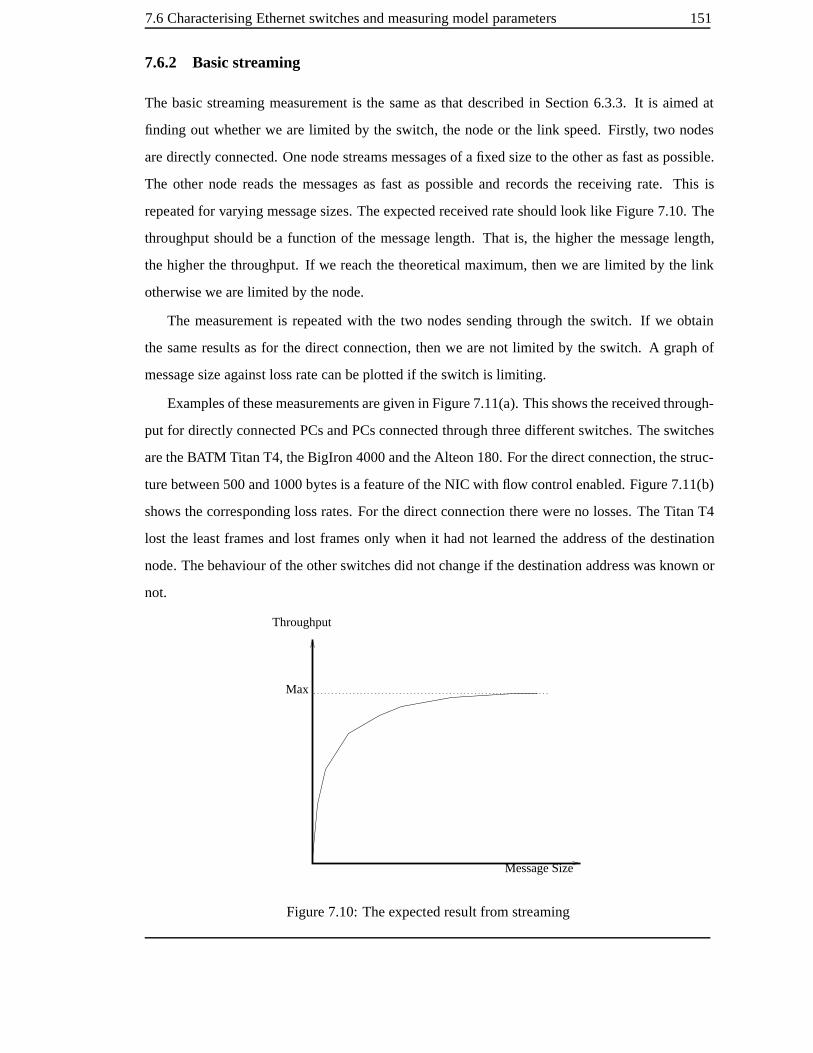
7.6Characterising Ethernetswitchesandmeasuring modelparameters 151
7.6.2 Basicstreaming
The basic streamingmeasurement is the sameasthat described in Section6.3.3. It is aimedat
finding out whetherwe arelimited by the switch, the nodeor the link speed. Firstly, two nodes
aredirectly connected.Onenodestreamsmessagesof a fixedsizeto theother asfastaspossible.
The other nodereads the messages as fast as possible and records the receiving rate. This is
repeatedfor varying message sizes. Theexpectedreceivedrateshould look like Figure7.10.The
throughput should be a function of the message length. That is, the higher the messagelength,
the higher the throughput. If we reachthe theoretical maximum,thenwe arelimited by the link
otherwisewe arelimited by thenode.
The measurement is repeatedwith the two nodessending through the switch. If we obtain
the sameresults asfor the direct connection, thenwe arenot limited by the switch. A graph of
message sizeagainst lossratecanbeplottedif theswitchis limiting.
Examplesof thesemeasurementsaregivenin Figure7.11(a). Thisshowsthereceivedthrough-
put for directly connectedPCsandPCsconnectedthrough threedifferent switches. Theswitches
aretheBATM TitanT4, theBigIron 4000andtheAlteon180.For thedirect connection, thestruc-
turebetween 500and1000bytes is a featureof theNIC with flow control enabled. Figure7.11(b)
shows thecorresponding lossrates. For thedirect connectiontherewereno losses. TheTitan T4
lost the least framesandlost framesonly whenit hadnot learned the addressof the destination
node. Thebehaviour of theother switchesdid not changeif thedestinationaddresswasknown or
not.
Message Size
Throughput
Max
Figure7.10:Theexpectedresult from streaming

152 Chapter 7. Analysis of testbedmeasurements
0 500 1000 15000
10
20
30
40
50
60
70
80
Message size. Bytes
Thr
ough
put.
MB
ytes
/s
Unidirectional streaming for various Gigabit Ethernet switches
Direct Titan T4 BigIron 4000Alteon 180
(a) receivedrate
0 500 1000 15000
0.01
0.02
0.03
0.04
0.05
0.06
0.07
0.08
0.09
0.1
Message size. Bytes
Lost
fram
e ra
te. F
ram
es/s
Unidirectional streaming for various Gigabit Ethernet switches
Titan T4 BigIron 4000Alteon 180
(b) Thelossrate
Figure7.11:Resultsfrom unidirectional streamingthrough variousGigabitEthernet switches
Framelossis clearly linkedto theimplementationof theIEEE802.3xstandardin theswitches.
The throughput measured at the receiver for the BigIron 4000 is equal to that of the direct con-
nection. This suggestto us that theBigIron 4000reacts to receivedflow control framesfrom the
destination node,but it does not sendflow control framesto the source node, insteadit discards
the framesthat it cannot send. TheAlteon 180shows signs that it doessendflow control frames
slowing down the sender, but not enough to avoid lost frames. This is evident in the fact that it
losseslessframesthanthe BigIron 4000. Secondly, in Figure7.11(b)in the region of message
sizearound1000 bytes, thereceivedrateis above thereceivedratefor directconnection, implying
the lack of flow control packets. Finally, above 1000bytes, we get to a position whereno losses
aredetected.This is becausesufficient flow control packetsaresentby theswitchto avoid packet
loss.
7.6.3 Testingthe switching fabric architectur e
The traffic types
To testtheswitching fabric, multiple streaming nodesareused.Thenodescanbe asked to send
at a specified rateto any numberof destination addresses. The time betweenpackets canbe set
asconstantor random. Thedestinationaddresscanalsobechosento beconstantor random. We
definetwo traffic typesfor our measurements.Thesystematicandrandom traffic patterns.
» Thesystematictraffic pattern correspondsto a situation whereevery source node transmits

7.6Characterising Ethernetswitchesandmeasuring modelparameters 153
to a single,uniquedestination node. Thesourcestransmit at a constantrate,that is thetime
betweensubsequent framesis fixed.
Sincethere is a single paththrough theswitch for eachstream of traffic, this type of traffic
is free of contention and thus queues do not build up until saturation is reached. When
saturation doesoccur, it maybein thenodes or in theswitch. Therefore themaximumrate
for directly connectednodemustbeestablished.
If theswitchis non-blocking, thentheaveragelatenciesshould beconstantasthetransmis-
sionloadincrease,up to thelimit of thenodesor of thelink speed.» In therandom traffic pattern(seesection 6.3.2),theinter-packet timesareexponentially dis-
tributedabout a mean.Also, eachnode cansend to all theothernodes in a random manner.
Therandom traffic pattern is usedasa way of crosschecking how well the parameterised
switchmodelagrees with themeasurementson therealsystem.
In both casesthe load is increasedby decreasing the meanvalue of the distribution while
keeping the framesizeconstant.For thepurposeof discovering theswitcharchitecture, only the
systematictraffic pattern is of interest. It allows us to seethe limits of the switch performance
sharply.
The intra- moduleand inter-module transfer rate
Testingfor the maximumintra-moduletransfer rate tells us if all nodes in a modulecan com-
municate betweenthemselvesat the full link rates. Thesetup consistsof populating all theports
of a moduleon a switch andsending traffic of fixed message sizes in the systematicfashion as
describedabovebidirectionally between pairsof nodes. Thecombined receivedthroughputof the
nodes is the intra-module transfer rate. For a non-blocking switch, all the nodeswill be able to
reachthefull line rate.This correspondsto theparameterP5of Section7.4.2.
Theinter-moduletransfer rateis testedby selecting two moduleson theswitch.Bothmodules
arepopulated with nodes. The systematicstreamingpattern is usedsuchthat eachof the traffic
streamscrosses thebackplane,that is eachnode sendsto a nodein a differentmodule.
If limits arefound in the inter-module transfer rate,thenthe measurementdescribed in Sec-
tion 7.6.3mustbeperformedto determine the moduleaccessratesto the backplane. Theaccess
from themoduleto thebackplane is parameter P3of Section7.4.2andtheaccess from theback-
plane to themoduleis parameter P4of Section7.4.2.

154 Chapter 7. Analysis of testbedmeasurements
A comparison of the systematic and the random traffic should look like Figure 7.12 which
showsaplot of theloadacceptedby theswitchagainst theend-to-endlatency for agivenmessage
size. The latency T asillustratedin Figure7.12should correspondto that obtained for theping-
pong measurement at that messagesize. For a non-blocking switch, the throughput indicated
by point L should be the sumof the maximumthroughput achieved by the nodesfor the chosen
message size. This is illustratedin Figure 7.13 wherethe relationship betweenthe ping-pong
measurementandthestreamingmeasurementsis shown.
Random traffic Systematic traffic
T
L
Latency
Accepted load
Figure7.12: Typical plot of load against latency for systematic andrandom traffic. The latency
hererefers to theend-to-end latency from onePCinto another.
Thepoint L for thesystematiccasecanbedueto three things.
1. The limit on the PC. If the PC is not powerful enough to saturate the link, then what is
observedis theeffect dueto saturation in thePCs.ThePCsmaynot beableto saturatethe
link dueto a combination of internal PCI bus,theNIC or theMESHsoftware. Thelimit of
thePCscanbeobtainedfrom thebasic streaming testsfor directly connectedPC.
2. The limit on the link. We know the link speed from the technology standard. Taking the
overheadsinto account, this speedcanbecalculated.
3. The limit on the switch. If we don’t reach the limit of the PC or that of the link thenthe
limit L correspondsto theswitchlimit.
Theresults canbere-plottedasshownin Figure7.14.This shows theamount of traffic gener-
atedor offered by thenodesagainst theamountof traffic receivedor acceptedthrough theswitch.
A straight line of gradient one implies everything sentby the nodes is deliveredby the switch.
Thehorizontalpartof thegraph will bevisible if framesarelost. A plot of framelossagainstthe

7.6Characterising Ethernetswitchesandmeasuring modelparameters 155
Accepted load
End
-to-
end-
late
ncy
Message Size
T
Hal
f rou
nd tr
ip la
tenc
y
Random traffic Systematic traffic
LT
hrou
ghpu
t
L
Message Size
T
x
x
Streaming with measurement software for message size xComms 1 exercise
Streaming exercise
Figure 7.13: Relationship betweenthe ping-pong, the basicstreaming and streaming with the
systematictraffic pattern.

156 Chapter 7. Analysis of testbedmeasurements
Accepted
L
L
load
Offered load
Visible if flow control does not work.
Figure 7.14: Typical plot of offered load
against accepted load. If flow control works
properly, we cannot offer moreload thanwe
canaccept.
L
Lost frame rate
Offered load
This should be zero unless switch/softwarelooses packets
Visible if flow control does not work.
Figure 7.15: Typical plot of offered load
against lost frame rate. For switches where
flow control works properly, we should ob-
serve no losses.
offered load from the nodes canbe madeasshownin Figure7.15. We will be ableto seeif the
switchloses framesat low loads andhigh loads for a fixedmessagesize.
Measuring module access to and fr om the backplane
In hierarchical based switching, thebackplaneswitching fabriccapacity is important, but theca-
pacity of the links connecting themodulesto thebackplaneis alsoan issue. This limitation may
be different depending on whetherwe areconsidering traffic from the backplaneor traffic to the
backplane.
In order to assesstheaccess to andfrom thebackplaneweusethesetupshown if Figure7.16.
This showsa switchof Æ modules and È ports permodule.
For accessto the backplane,the ideais to saturatethe links from a moduleto the backplane
without saturating the links from the backplaneto the module. The nodeson the samemodule
(a1 to a3) transmit asfastasthey canto nodes on different modules (b1 to b3). The numberof
transmitterson module 1 (a1 to a3) arechosen suchthat their combined transmissionratescan
saturatetheaccess to thebackplane. At theotherend( b1 to b3), we musthave enough nodesto
absorb all thetraffic being transmitted.Thenodescommunicatein pairs, that is, a1 sendto b1, a2
sends to b2 etc. Thecombined receivedrateon nodesb1 to b3 is themaximumthroughput to the
backplane. This corresponds to parameterP3of Section7.4.2.
For accessfrom thebackplane, theideais to saturate thelinks to amodulefrom thebackplane
without saturating the links from the moduleto the backplane. Therolesof the transmittersand

7.6Characterising Ethernetswitchesandmeasuring modelparameters 157
Switch
Module1
Module2
Module3
Module4
Modulen
Port0
Port1
Port2
Portm
Port0
Port1
Port2
Portm
Port0
Port1
Port2
Portm
Port0
Port1
Port2
Portm
Port0
Port1
Port2
Portm
...
...
...
...
......
......
......
b1 b2 b3
a3
a2
a1
Figure7.16:Thesetup to discover themaximumthroughputto andfrom thebackplane
receiversarereversed. This correspondsto parameter P4of Section 7.4.2.
Dueto thevarying number of ports andmodulesperswitch, it maynot alwaysbepossible to
perform this testasdescribed. For instance,for a switchwith oneport permodule, accessto and
from thebackplanewill bethesame.Examplesof thesemeasurementsaregivenin Section8.2.1.
The maximum backplanethr oughput
Themaximumbackplanethroughputis themaximumratethatcanbetransmittedacrosstheswitch
backplane. Thequotedvalueby thevendor maynot beachievabledueto theswitcharchitecture.
For example,for theTurboswitch 2000(seeAppendix C), thebackplanehas128x128links,each
running at 40 Mbit/s, giving a total backplanebandwidth of 5.1 Gbit/s. In fact only 120 out of
128 links canbeusedfor transferof userdata,giving a potential maximumbackplaneutilisation
of 4.8Gbit/s. This measurementaimsto find out themaximumachievablebackplanethroughput.
To determine this, all portsof the switch areloaded. Traffic is sentsystematically between pairs
of nodessuchthat the traffic streamspassthrough the backplaneof the switch. All the traffic is
inter-module. Thetotal receivedthroughput corresponds to themaximumbackplanethroughput.

158 Chapter 7. Analysis of testbedmeasurements
This may be limited by accessto andfrom the backplane(i.e. the backplanemay be capableof
more,but the architecture limits the accessible throughput) or by the capacity of the backplane
itself (i.e. thebackplaneis thelimit). For a non-blocking switch, all nodes will reachtheline rate
for bothsendandreceive.
The maximum achievable backplane throughput corresponds to the parameterP6 of Sec-
tion 7.4.2.
7.6.4 Testingbroadcastsand multicast
Broadcastsandmulticastframesarerequired to appear on multiple portsof an Ethernetswitch.
As a result they may be handled differently from unicast frames. We would like to know the
following.» Do thebroadcastandmulticastframessuffer morelatency than unicast frame?» Do all nodes receivebroadcasts?» Are therates or throughputsdifferentfrom theunicastframes?» Are frame losses any different from unicast frames? Does the flow control propagate
through the switch for broadcasttraffic, that is doesthe internal flow control slow down
thebroadcasting node?
Thesametestsperformedwith theunicastframescanbeperformedusing broadcastandmulti-
castframesto seeif theswitchsupportsthemwithout degradationin theforwarding performance.
1. The first test is the ping-pong test. The modification hereis that the client broadcastits
requestandtheserver’sresponseis alsoabroadcast. As beforethis is donewith andwithout
theswitch. This will tell ustheswitchport-to-port latency for broadcastframes.
2. If the broadcastping-pong test is shownto have the samelatenciesas the unicast, then
this measurementcanbeusedto find out how broadcastandunicast areprioritisedagainst
one another. The setup for this test is shown in Figure 7.17. It requires at least three
nodeson theswitch. Onenodewill actasthebroadcastnode, theotherwill be theunicast
nodeandthe third will be receiving from both transmitting nodes. The average latencies,
numberof framesreceivedandthe lossrates of theunicast andbroadcastcanbe lookedat
on thereceiver andcompared. For high transmissionrates, arebroadcastfamesdroppedin
preferenceto unicastframesor vice versa?
3. The next test is to usetwo nodes, onenode broadcasting asfastaspossible andthe other
receiving asfastaspossibleasin thebasicunicast streaming case(Section 7.6.2).This will
revealthesamethingsasin thebasicunicaststreaming case,but for broadcastframes.

7.6Characterising Ethernetswitchesandmeasuring modelparameters 159
4. With multiple nodesconnectedto the switch andonenode broadcasting at its maximum
rate,we would like to seeif all nodesreceive thebroadcast.
5. If the basic streaming with broadcast showsno frame losses, then we can perform the
following test to confirm that flow control is propagatedfor broadcasttraffic. Using the
samesetup asabove but with two nodesbroadcasting at thefull rate(suchthatsaturation is
reached), we canexaminethereceive rates to seeif any packetsarelost.
Broadcast node Unicast node
Node receives broadcast and unicast
Switch
Figure7.17: An examplesetupto testthepriority, rateandlatency distribution of broadcastframes
comparedto unicast frames
Examplesof thebroadcastmeasurementsaregivenin Section8.2.1.
7.6.5 Assessingthe sizesof the input and output buffers
Trying to measuretheinput andoutput buffer sizesis difficult. In general, we have to rely on the
vendor’s information on thesizeof thebuffersin their switch.
If packet aging canbeturnedoff, a way to assestheinput andoutput bufferssizesof a switch
is illustratedin Figure7.18. Theswitch is programmedwith staticroutesfor theattachednodes,
A, B andC. Flow control mustbeenabledbetweennodeA andtheswitchsuchthatno packetsare
lost on that link. NodeA is blockedfrom receiving suchthat theswitchstorespackets destinedto
it in theport a output buffer. Themeasurementstarts with nodeB sending to nodeA. Sincenode

160 Chapter 7. Analysis of testbedmeasurements
A is blockedfrom receiving, theoutput buffers at port a andtheinput buffers at port b will fill up.
Oncethey arefilled up, frameswill be lost betweennodeB andtheswitchport b. Whennode A
is re-enabledto receive packets,it canexaminethesequencenumbers of theincoming packets to
seeif they aresequential. Thelastnumberbeforethesequencebreaks will indicatethecombined
input andoutput buffers availablefor storing packets.
In the second phaseof the measurement, the samesetupis repeated but with a third node,
nodeC connectedto theswitch. As before, flow control is enabled betweenonly nodeA andthe
switch andnodeA is blocked from receiving. NodeB sendssequencenumbered framesto node
A. Within a few seconds, the output buffers of port a andthe input buffersof port b will be full
andsubsequent framesfrom nodeB will be dropped. NodeC alsostartstransmitting sequenced
numbered framesto nodeA. This will causethe input port c to be filled up. Framesfrom node
C will thus occupy only the input buffer of port c. When node A is re-enabledto receive, all
the framesin the switch buffers from node B will be forwarded to node A sincethey arrived in
the switch first. Thenthe framesfrom node C will be forwardedto nodeA. Again by analysing
the sequencenumberof the framesreceived at nodeA from nodeC, the last numberbefore the
sequencebreakswill indicate theinput buffer sizeof port c. Assuming thebuffer sizesareshared
equally betweenportsandgiventhatwe know thecombined input andoutput buffer size,we can
calculatetheoutput buffer size.
A potentialproblem with this methodis that framesmayreachtheagelimit andbediscarded
by theswitch.Therefore theframeaging should bedisabled in theswitchasmentionedabove.
This is specifically for the distributed memoryswitch architecture. For the shared memory
architecture switch, there is no distinction betweenports andtheir buffers. The input andoutput
buffering correspondto parametersP1andP2of Section7.4.2.
7.6.6 Testingquality of service (QoS)and VLAN features
Quality of serviceandVLA Nshavebeen introducedinto Ethernet with anew frameformatwhich
extends the standardEthernet packet by four bytes (IEEE 802.3p). With the new frameformat,
Thereareeight priority levels (threebits) and4093 privateVLANs (12 bits) possible. A switch
canalsoimplement priorities andVLAN s basedon its ports andMAC addresses.

7.6Characterising Ethernetswitchesandmeasuring modelparameters 161
Port b Port c
Port a
Flow controlenabled
Flow controldisabled
Flow controldisabled
Switch
NodeA
NodeB
NodeC
Figure7.18: Investigating input andoutput buffer sizes.
FramesPrioritis ation
Prioritisationis usedto mark packetswith a level of urgency suchthat high urgency packets are
servicedbefore low urgency packets. Theurgency or priority canbebased on the framessource
or destinationEthernet address, the TOS field in an encapsulated IP packet or the IP source or
destination address.Thenew Ethernet frameformatalsohasthreebits reservedfor eight levelsof
priority to beassigned.
As mentionedin 3.5.3,theEthernetstandarddoesnot specify theserviceratefor thedifferent
priorities. Furthermore, switches may support as little as two priority levels. The numberof
priority classesis normally givenby thevendor (theIEEEstandard802.1pgivestherecommended
way in which vendors should split priorities in their switchesbased on the numberof available
classes),however theservicerateof eachpriority levelsis not alwaysobvious.
The priority feature is testedin a similar way as the broadcastand multicast frames. See
Section7.6.4, item 2. For a two priority system,one transmitter is configured to transmit high
priority packetsandthe other low priority packets,but at the samerate. The latency of the high
andlow priority packetsareexaminedat thereceiver for varying loads.Theexpectedresult should
show that for low loads, the low and high priorities will show the samelatencies. For higher
loads wherewe begin to reachthe limitations due to the receiver, the link rate or the switch
capacity, we expect to seehigh priorities maintainlow end-to-endlatency while thelow priorities

162 Chapter 7. Analysis of testbedmeasurements
latencies grow. The corresponding throughput for high priority should increasewhile the low
priority throughputdecreases.
An exampleof thepriority results is shown in Figure7.19. Themeasurementwasperformed
on the BATM Titan T4 (via the FastEthernet ports) which hastwo levels of priority, high and
low. TheFigure7.19(a) show theinter-packet time(andhencetheofferedload)plotted against the
end-to-endlatency. Figure7.19(b) showstheinter-packet timeagainst theacceptedthroughput for
thesamemeasurement.A packet sizeof 1500 byteswasused. Thehigh andlow prioritiesachieve
thesameaverage end-to-endlatency until an inter-packet time of 248 É s. This corresponds to an
offered rateof 6 MBytes/sfrom eachof thesources,corresponding to saturationof thereceiving
nodelink. At this point, the high priority packet mustwait at mostthe time to transmita single
1500bytepacket. This is thereason for thejump in thelatency of thehigh priority traffic between
248to 140 É s inter-packet time. Within this region, thehigh priority packet have a constantend-
to-end latency. However, the end-to-endlatency for the low priority traffic increasesasthe high
priority traffic takesup morebandwidth. Below an inter-packet time of 140 É s, thehigh priority
traffic saturatesandits latency grows above 100 ms. At this point the ratio of the throughput of
thehigh priority compared to thelow priority is 89%to 11%,a valueconfirmedby thevendor.
100 200 300 400 500 600 700 800 900 100010
2
103
104
105
106
107
Inter−packet time. us
End
−to
−en
d la
tenc
y. u
s
Hi vs. Low priority. Titan T4. sys. FE ports
Low priority High priority
(a)Theend-to-end latency
100 200 300 400 500 600 700 800 900 10001
2
3
4
5
6
7
8
9
10
11
Thr
ough
put.
MB
ytes
/s
Inter−packet−time. us
Hi vs. Low priority. Titan T4. sys. FE ports
Low priorityHigh priority
(b) Thethroughput
Figure 7.19: Fast Ethernet priority test on the BATM Titan T4. High and low priority nodes
streaming to a single node.
Thesamemeasurementandsetupcanbeusedto testgreater than two priority classes,but with
anothertransmitterfor eachnew priority class.

7.6Characterising Ethernetswitchesandmeasuring modelparameters 163
VLAN
TheVLA N is a featureavailable in Ethernetswitchesusedto manage bandwidth moreefficiently
in networks. It doesthis by providing a way of segmenting networks suchthat certain typesof
traffic arelimited to a certain partof thenetwork.
The support of VLANs can be tested by segmenting the network and observing if unicast,
broadcastandmulticast framescancrossthe VLA N. This will require a setupsuchasthat illus-
trated in Figure7.20. In this setup, nodes1 and2 areconnectedto portson VLAN a, nodes 3
VLAN b andnode4 on VLA N a andb. Nodes2 and3 transmit broadcast,multicastandunicast
framesto nodes 1 and4. Thereceivedframesareanalysedon all nodes. Node1 should seeonly
framesfrom node2. Node4 should seeframesfrom node 2 and3. Nodes2 and3 should not
receive any frames.
Wewouldalsoliketo testtheability of theswitchto addandstripVLAN tags(this is necessary
if the loop-backtestof Section7.6.8is to beperformed). This testrequiresonly two of nodes in
the setupof Figure7.20, for example nodes3 and4. The switch port connectingnode 3 should
besetto anuntaggedVLAN port andtheswitchport connecting node 4 should besetto a tagged
VLAN port. Node3 canthensend unicast framesin theclassical formatto node4. Analysisof the
receivedframeson node4 should showthat the frameshave thenew frameformat with a VLAN
corresponding to the VLAN of the port to which node3 is attached. Node4 thensends packets
with VLAN tag b to node3. Analysisof the received traffic on node 3 should showframesent
from node4 but without their VLAN tags.
7.6.7 Multi-switch measurements
Thenext stepis to look at nodesconnected via multiple switches. This testis to discover whether
the switch latencies increase linearly and the maximumratesarenot degraded whencascaded.
Also of concernis theperformanceof theimplementation of theIEEE802.3adtrunking standard.
Cascadedswitches
To test the cascaded switches, multiple switches are connectedtogether and traffic sentacross
them. the ping-pongmeasurements(Section 7.6.1)should berepeatedto find out theend-to-end
latenciesandto seehow they compare with thesingle switchmeasurements.
The basicstreaming testcanbe doneunidirectionally andbidirectionally to seefirstly if the

164 Chapter 7. Analysis of testbedmeasurements
VLAN a VLAN b
Switch
Node2
Node3
VLAN aand b
Node4
VLAN a
Node1
Figure7.20:TestingVLA Nsonaswitch. Nodes1 and2 areconnectedto portsonVLAN a, nodes
3 VLAN b andnode4 on VLAN a andb.
results agree with that of measurementson a single switch. Secondly, to discover how well the
switchto switchflow control works, theframelosswill belookedat in thecaseswheretheswitch
is saturated. Theperlink andthepermodule ratesshould alsobelookedat.
For thesemulti-switch tests, we will be looking for the maximumthroughput that can be
achieved, the framelossandthe end-to-end latency. The end-to-endlatency at low transmission
ratesshould beconsistent with theping-pongresults.
An exampleof the end-to-end latency acrossmultiple switches are shownin Figure 7.21.
Theseresultswereobtainedfrom theping-pongmeasurements.They havetheresultsof thedirect
connection subtractedto leave thelatency of going throughtheswitches.Theseresults showthat
thelatency increaseslinearly (thestore andforwardtime) asthenumber of switches increases.
Trunking
TheIEEE 802.3adlink aggregationor trunking is a recent standardwhich enablesmultiple links
to begroup into asingle aggregatelink (seeSection3.5.4).For agivenpairof switchesWewould
like to know thefollowing:
1. Themaximumnumber of links thatcanbetrunkedperswitch.Thestandardsdonotspecify
any limit on the numberof ports that can be trunked, however on someswitchesonly a
subset of ports canbetrunked.

7.6Characterising Ethernetswitchesandmeasuring modelparameters 165
0 500 1000 15000
10
20
30
40
50
60
70
80
90
100
Message size. Bytes
Com
bine
d sw
itch
late
ncy.
us
2 nodes. Comms 1. T4 GE
1 switch2 switches3 switches
Figure7.21:End-to-endlatency through multiple Titan T4 GigabitEthernet ports.
2. Does the trunked link work as expected. That is, are we able to obtain the bandwidth
equivalentto theaggregationof thetrunkedlinks.
3. In theeventof thefailureof a link in atrunk, wewould like to knowif thetraffic is re-routed
to another link in thetrunk, how long in takesandhow many packetsarelost in theprocess.
4. Conversely, whena disabled link of a trunk is re-enabled, we would like to know if the
traffic is allocatedto it andhow long it takes.
5. Doesthe loadbalancing work. What is thepolicy for using new links givena new conver-
sation. How is thedistribution handledwhena new connection is introduced?
Item 1 of theabove list is normally supplied by theswitchvendor andcanbeobservedin the
switch configuration menu. Item 2 canbe tested asfoll ows. The setupconsists of two switches
connectedwith trunkedlinksandafixednumberof nodesoneachswitchasshownin Figure7.22.
This showstwo switches A andB with a numberof nodeson each.The switchesareconnected
together via trunked links. For this measurement, we require that the numberpairs of nodes
communicating through the switchesbe greater thanor equal to the numberof links trunked so
that thetrunkedlink canbesaturated.Traffic is sentsystematicallyat themaximumratebetween
the nodeson switch A andthe nodeson switch B andthe received rateanalysed. The achieved
throughput betweentheswitchesshould bea function of thenumberof links in thetrunk.
To testtheeffect of a broken link (Item 3), the samesetup is used. We require two nodeson
switch A andtwo nodeson switch B andtwo links in the trunk. Traffic is sentunidirectionally
andsystematically from thenodeson switchA to thenodeson switchB. During thetransmission,
oneof the links of the trunk is unpluggedto simulatea broken link. If the traffic is re-routedto

166 Chapter 7. Analysis of testbedmeasurements
Trunkedlinks
Transmittingnodes
Receiving nodes
Switch BSwitch A
a1
a2
a3
a4
b1
b2
b3
b4
Figure7.22:A setup to testtrunking. Trunkedlinks areused to connecttwo Ethernet switches
the working link, then the received rateon eachof the nodeson switch B should change from
a high steady rateto a reduced steady rate. The time betweenthesephasesis the time taken by
the switchesto detect androutearound the broken link. The numberof packetslost canalsobe
detected.
To testItem 4, the samesetupis usedbut this time re-connecting the link to simulate the re-
enabling of thelink. Thereceivedrateof thenodeson switchB areexaminedto detectthechange
from a low steady rateto a higher steady rate.This will tell ushow long it takesfor theswitches
to re-allocatetraffic to a re-enabledlink.
Therearemany waysin which the load balancing acrossthe trunked links canbe tested. An
exampleis asfollows. Thesetup should besimilar to Figure7.22with threenodeson switch A,
threenodeson switch B and two links in the trunk. Nodea1 and a2 both transmittraffic in a
systematicpattern to nodesb1 andb2 respectively at 100% of thelink rate. This will saturate the
trunked links. Oncethis setupis running, node a3 attemptsto sendtraffic at 100% to nodeb3.
By reducing therateof nodea1 anda2 alternately, thereceivedpacket rateat node b3 is analysed
in eachcaseto determinewhetherload balancing is taking place, that is, if thestreamfrom node
a3 to nodeb3 is ableto take advantageof the maximumavailable link rate. If load balancing is
taking place,we canmeasure how long it takesto occur by noting thetime on node b3 whenthe
transmit rateson nodea1 or a2 is alteredandnoting thetime againwhenthereceive rateon node
b3 becomesstable.

7.6Characterising Ethernetswitchesandmeasuring modelparameters 167
7.6.8 Saturating Gigabit links
As mentioned previously in Section6.8, with our current approach, it is difficult to saturate a
Gigabit link with onePC.The full link rateis needed to testwhetherthe switchesaretruly non-
blocking. Therearetwo wayswe cando this.
Saturation using multiple switches
Thefirst is by usingmultiple nodes streaming to a single Gigabit link on a switch port suchthat
theaggregatethroughput reaches1 Gbit/s. This saturatedlink canbeusedasa sourcefor testing
anotherswitch’sGigabitport. On theoutputport of theswitchundertest,thereneedsto bea third
switch which candistribute the aggregaterateto multiple nodes. To do this, we mustbe sureof
thatthefirst andthird switchesareableto sustain therequiredrates.
Saturation using switcheswith VLANs
Saturating a Gigbit link with VLAN s requiresthesetup shown in Figure7.23.Critical featuresof
this setup aretheway VLA Ns aredefinedon theswitchandhow theswitchports areconnected.
TheswitchesinvolvedmustsupportVLAN sasdescribedin Section3.5.2andmustbeableto pass
thetestof Section 7.6.6.
Thesetup hastwo switches, A andB. SwitchA hasa number of input ports(four in this case)
setto differentVLA Ns,v1 to v4. Packetsentering theinput portsshould beof theoriginalEthernet
frameformat, that is without the VLAN tag. Switch A hasa single output port setto VLAN vt.
This port belongsto all the definedVLAN s on Switch A. It is alsoa tagged VLA N port, that is,
frameswhich areforwardedfrom that port have the VLAN tag added. Switch A should always
forward packet to the port marked vt becauseall other ports are in a different VLAN. For this
reason, onswitchA learningcanbeenabledor theforwarding tablecanbestatically setto indicate
thatnode b1 is foundon theport markedvt.
Switch B hasa single input port marked vt anda number of output ports(four in this case).
The port marked vt belongs to all the definedVLANs on Switch B. Switch B forwards frames
received on the port marked vt to all ports in the VLAN indicatedby the tag informationof the
received packets. The output ports of switch B areall setto untaggedports, that is frameshave
their4-byte(typeandtagcontrol informationfields)tags(seeSection3.3.2)removedbeforebeing
forwarded. Learning should not be switched off on switch B since that would imply setting up

168 Chapter 7. Analysis of testbedmeasurements
static forwarding tableswhich would causetheswitch to always forward thepacketsto thesame
port or discard themif theinput andoutput ports arein differentVLA Ns.
Loopsin thenetwork aremadeby connecting output portsof switchB to input portsof switch
A in a similar way to that shown in Figure7.23. With this setup, framesof the original Ethernet
frameformataresentfrom nodea1 with thedestination addressof nodeb1. Theframeis sentto
theswitchA port marked vt wheretheVLAN tag is added(basedon theVLAN of theport node
a1 is connectedto) to theframebefore beingforwarded to switchB. WhenswitchB receivesthe
frame,it doesnot know theport on which to find nodeb1, so it forwards theframeto theport in
thesameVLAN, theport markedv1. Beforethe frameis forwarded, the tagcontrol information
fields areremoved. The framethen reappearson the switch A port marked v2. The framewill
loop throughthesystem to v3 andfinally to v4. If a1 continuously streamsdata,thenin thesteady
state, thethroughput on theGigabitlink will beequal to thenumber of loops in thesystem,n, plus
onemultiplied by therateatwhich a1 succeedsin sending. In thecaseof Figure7.23,n will be3,
therefore theratethrough theGigabit link will be4 timestheratea1 sends.
Gigabit Ethernet connection
Transmittingnode
Receiving node
Switch BSwitch A
a1
b1
vt vt
v1
v2
v3
v4
v1
v2
v3
v4
Figure7.23:Loopingback framesto saturatea Gigabit link
Having saturatedthe link, the link canbeusedto senddatathrough a third switch in order to
testit. An exampleof theresults from theloopbackmeasurementis givenin Figure7.24.Thiswas
performedusing two BATM Titan T4swith their FastEthernet ports. In thecaseof the loopback
connection, a single loopbackwasused. As a result, half theFastEthernet rateof 12 MBytes/s is
themaximumachievethroughput (Figure7.24(b)). In Figure7.24(a),thegradientof theloopback
plot is 0.3176 É s/byte. This is twice thevalueobtainedfor thenon-loopbackcaseandcorresponds
to four FastEthernet storeandforwards.Thefixedoverhead for theloopbackcaseis 21.6 É s. This
is alsotwice thevalueobtainedfor thenon-loopbackcaseandcorrespondsto four timesthefixed
overheadfor a single Titan T4 switch.

7.7Conclusions 169
0 200 400 600 800 1000 1200 1400 16000
100
200
300
400
500
600
Late
ncy.
us
Message size. Bytes
Comms 1 BATM Titan T4
Two switchesTwo switches with 1 loopback
(a) TheswitchingLatency
0 200 400 600 800 1000 1200 1400 16000
2
4
6
8
10
12
14Comms 1 BATM Titan T4
Message size. Bytes
Thr
ough
put.
MB
ytes
/s
Two switchesTwo switches with 1 loopback
(b) Thethroughput
Figure 7.24: Exampleresults comparing a loopback and a non-loopback measurementon the
BATM Titan T4.
7.7 Conclusions
We have describedin this section measurementsaimedat characterising Ethernet switches. We
have illustratedthetypeof results we arelikely to seeandinterpretationsto thoseresults. We can
discover thefollowing.
Ê Thearchitectureof theswitch.Ê Thearchitectureof theswitching fabric.Ê Therateat which unicast,multicast andbroadcastarehandled.Ê Therespective priorities of unicast,multicast andbroadcast.Ê Thelossrate.Ê Theinput andoutput buffer sizes.Ê Themaximuminter-module andintra-modulethroughputs.Ê Themaximumusable backplanethroughput.Ê Themaximummodule throughputto andfrom thebackplane.Ê How well trunking, VLA Ns andpriorities work.
We have identified thesemeasurementsbased on our experienceswith real switchesandour
efforts in modelling. Thesemeasurementscantell us sufficient details aboutthe internals of the
switchto allow usto modeltraffic passing throughtheswitchport. As themodelling work evolves,
other measurementsmayneedto bedefinedsuchthattherelevant parameterscanbeidentified and
measured.

170 Chapter 7. Analysis of testbedmeasurements

Chapter 8
Parametersfor contemporary Ethernet
switches
171

172 Chapter 8. Parametersfor contemporary Ethernet switches
8.1 Intr oduction
In our investigationof Ethernetfor theATLAS LVL2 network, wefollow two approaches. Firstly,
we look at real Ethernet switches. Their performance,scalability andhow well they work based
on the standards. Secondly, modelsof the switchesarebeing developedbasedon the results of
theperformancetests, suchthatlargescalemodelsof acomparablesizeto thefinal ATLAS LVL2
network canbesimulatedandstudied.
As aresulta largebodyof measurementsandanalysishasbeendoneandcontinueto bedone.
To date,we have performedmeasurementson the Netwiz Turboswitch 2000, the Intel 550T, the
BATM Titan T4, TheFoundryBigIron 4000, theCiscoCatalyst 6509,theCiscoCatalyst 4912G,
the Cisco Catalyst4003, the Xylan OmniSwitchSR9and the ARCHES switch [49] developed
at CERN as part of the ESPRITproject. In this chapter, We present a selected few of these
measurements.
In the first part of this chapter, we present a validation of the parameterisedmodel, wherea
comparison of modelsandreal switches aremade. In the second section we present someoff–
the–shelfEthernet switches, their parametersfor thepurposeof modelling andwe identify issues
of interest to ATLAS basedon our experiences.
8.2 Validation of the parameterisedmodel
8.2.1 Parametersfor the Turboswitch 2000
A detailed description of thearchitectureof theNetwizTurboswitch 2000is givenin Appendix C.
The switch we hadaccessto wasequippedwith eight FastEthernet modulesandeachmodule
hadfour ports. The switch supports a proprietary VLAN implementation andflow control only
in half duplex modeandtherefore measurementsof these featuresarenot presentedhere. Man-
agement is via a graphical user interfacerunning under theMicrosoft Windows environment. The
software wassupplied by thevendor. It usestheSimpleNetwork ManagementProtocol (SNMP)
communicatingover TCP/IP(seeSection3.5.6).
Comms1 measurements
Figure8.1showstheend-to-endlatency obtainedfrom thecomms1 exercise. Thefigureshowsthe
result for two nodes:directly connected, through thesamemoduleof theswitch,throughdifferent

8.2Validation of theparameterisedmodel 173
modules of the switch and using broadcast through different modules of the switch. We were
unable to obtain sensible results for broadcaststhrough the samemodule because of excessive
losses. In this switch, multicast andbroadcastarehandled in the sameway. Theseresults are
summarisedin termsof theswitchparametersin Table8.1.
P1
[frames]ËP2
[frames]ËP3
[Mbytes/s]ÌP4
[Mbytes/s]ÌP5
[Mbytes/s]ÌP6
[Mbytes/s]ËP7
[Mbytes/s]ÍP8
[Mbytes/s]ÍP9[ Î s ] Í P10[ Î s ] Í
Unicast 64 64 31.3 27.9 50 480 2.8 12.5 18.5 4.1
Broadcast/
Multicast
64 64 2.0 2.0 unknown 480 2.0 unknown 29.0 unknown
Table8.1: Model parametersfor the Turboswitch 2000Ethernetswitches. The parametersob-
tained from the ping-pongmeasurementaremarked with Ï . The parametersobtainedfrom the
vendorsaremarkedwith Ð . Theparametersobtainedfrom thestreaming measurementaremarked
with Ñ (themaximumbandwidth for 1500Bytesis given).
Theparametersmarkedwith Ï arethose extractedfrom theping-pongmeasurements.These
areP7,P8,P9andP10.Thefixedlatency throughtheswitch,P9andP10areobtainedby extrapo-
lating thelinesof Figure8.1to azerolength messageandsubtracting thevalueobtainedfrom that
of the direct connection. This is interpretedasthe minimum time to make a switching decision.
ParametersP7andP8arethethroughput reservedfor a single packet going through theswitchor
theunpipelinedthroughput. Theseareobtainedby taking thegradientsof the linesof Figure8.1
andsubtractingthe gradient of the direct connection. SeeSection7.6.1for a full description of
how parametersareobtainedfrom thecomms1 measurement.
The parametersmarked with Ð are thoseobtained from the switch vendor. The parameters
markedwith Ñ areobtainedfrom thestreaming measurementsandaredescribedbelow. SeeSec-
tion 7.6.2for a full description of how parametersareobtainedfrom thebasicstreamingmeasure-
ment.
Basicstreaming
Figure8.2 shows the results of the basic streamingexercise. From this plot, we seethat for the
unicastcase, we areableto obtain the samethroughput through the switch aswe canfor direct
connection. This impliesthatwearenot limited by theswitch. For broadcasthowever, we arenot
ableto achieve thesamerateasfor theunicast.Themaximumbroadcastrateis 2.0 MBytes/s,a
valueconfirmedby thevendor. Sincethereis no flow control, all packetssentabove this rateare

174 Chapter 8. Parametersfor contemporary Ethernet switches
0 500 1000 15000
100
200
300
400
500
600
700
800
Message size. Bytes
Late
ncy.
use
cs
Comms 1 on switch A.
Direct Same mod Diff mod Bcast diff mod
(a) End-to-endlatency asa function of message
size
0 10 20 30 40 50 60 70 80 90 1000
20
40
60
80
100
120
140
Message size. Bytes
Late
ncy.
use
cs
Comms 1 on switch A.
Direct Same mod Diff mod Bcast diff mod
(b) End-to-endlatency asa function of message
size.From0 to 100bytes
Figure8.1: Theend-to-endlatency for direct connection andthroughtheTurboswitch 2000
dropped. Figure8.3 shows the resulting plot of theminimuminter-packet time for thestreaming
measurement.The gradient of the unicast line is equivalent to the FastEthernet full line rateof
12.5MBytes/s. We areableto reachthe full line ratefor all four ports of a single module. This
gave ustheparameterP5summarisedin Table8.1.
Theminimuminter-packettimefor thezerolength packetis 3.2 É sfor unidirectional streaming
throughtheswitchandfor thedirectly connectednodes. Thusfor unidirectional traffic, theswitch
is ableto support thefull rateof theend-nodes.For broadcast, theminimuminter-packet time for
thezerolength packet is 19.4 É s.
Backplaneaccess
To investigatethe moduleaccess to andfrom the backplane (that is the maximumratethat data
canbesentinto andreceivedout of thebackplane), we performedthemeasurement described in
Section7.6.3. We termedthis the3111 setup. It consistedof four switch modules. Onemodule
hadthree nodesandtheotherseachhadonenode. Theresults obtainedfor going into andout of
themodulefor 1500bytesand500bytesframesareshown in Figure8.4.
The results of Figure8.4 show the accepted throughput against the end-to-endlatency. We
notethatthelatency is constantuntil we reachthesaturation point. At this point, theformation of
queuesin theswitchcausesthe latenciesto risesharply. For a givenmessagesize,thesaturation
point is different for packetsgoing into a modulecomparedwith packetsgoing out of a module.

8.2Validation of theparameterisedmodel 175
0 500 1000 15000
2
4
6
8
10
12
14
Message size. Bytes
Thr
ough
put.
MB
ytes
/s
Unidirectional streaming on switch A.
Direct Same mod Diff mod Bcast diff mod
Figure8.2: The throughput obtainedfor uni-
directional streamingwith two nodesthrough
theTurboswitch 2000
0 500 1000 15000
100
200
300
400
500
600
700
800
Message size. Bytes
inte
r−pa
cket
tim
e. u
secs
Unidirectional streaming on switch A
Direct Same mod Diff mod Bcast Diff mod
Figure 8.3: The minimum inter-packet time
obtained for unidirectional streaming with
two nodes through theTurboswitch 2000
As a quick crosscheck, we note that the latency for a given message size matchesthe line for
differentmodule shown in Figure8.1(a). In Table8.1,thevalues P3andP4representthemodule
accessto andfrom thebackplane.Thevalue corresponding to 1500byte framesis presented.
16 18 20 22 24 26 28 30 320
100
200
300
400
500
600
700
800
900
10003111 module dist. systematic fixed distribution. Cross module comms
Late
ncy.
us
Accepted throughput. MBytes/s
1500B out500B out 1500B in 500B in
Figure 8.4: The Turboswitch 2000 results
from the 3111 setup to discover access into
andout of a module
0 5 10 15 20 25 300
500
1000
1500
2000
2500
3000
Accepted traffic. MBytes/s
Ave
rage
end
to e
nd la
tenc
y. u
secs
3111 random exponential. Cross module. parameterised model vs measurements.
Meas 1500BMeas 500BMod 1500BMod 500B
Figure 8.5: Randomtraffic for 3111 setup
through the Turboswitch 2000. Traffic is
inter-moduleonly.
Measurementsand model compared
Figures8.5and 8.6showstheresults of measurementscompared to themodelling with thenodes
transmitting at various loads with a random traffic distribution, that is the destination for each

176 Chapter 8. Parametersfor contemporary Ethernet switches
0 500 1000 1500 2000 2500 3000 3500 400010
−5
10−4
10−3
10−2
10−1
100
3111 1500 bytes random traffic. Exponential dist. Cross module. In
Latency. us
Pro
babi
lity
of g
reat
er e
nd−
to−
end
late
ncy
meas 87.8%meas 83.3%meas 78.4%meas 59.7%mod 87.8%mod 83.3%mod 78.4%mod 59.7%
Figure8.6: Histogram of latenciesfor variousloads(asapercentageof theFastEthernet link rate).
3111configurationrandom traffic. Model against measurements.
packet sentfrom a node wasrandomly chosenandtheinter-packet time wastaken from anexpo-
nential distribution (SeeSection7.6.3).The3111setup wasused. Figures8.5shows theaccepted
traffic load against the average end-to-end latency for 1500 and 500 byte frames. This shows
very good agreement betweenthe model and the measurements. In Figure 8.6, histogramsof
the latenciesfor the samesetup at various load areshown. The histogramis plotted asthe nor-
malisedprobability of finding a packet of a greater end-to-endlatency. The load is represented
asa percentageof theEthernet link rate(all nodes wereconfiguredto transmit at thesamerate).
This showsthatthereis very goodagreementbetween theparameterised modelandthemeasured
performanceof therealswitch.
8.2.2 Testingthe parameterisationon the Intel 550T
In orderto testthe ability of the parameterisedmodelto modelotherswitches, we modelled the
Intel 550TEthernetswitch. TheIntel 550Tswitchis aneight portFastEthernetswitch. It hastwo
expansion slots which caneach hosta moduleof four ports, bringing the total number of ports
to 16. Theexpansionslots canalsohosta stacking modulewhich allows theconnection of up to
seven 550T switchestogether to form a 96 port switch. It canoperatein both store andforward
andcut-throughmodes. The switch testedwasa single eight port unit. For our tests,the switch
wassetinto store andforwardmode.
The literaturessupplied with the switch wasunclear. The minimum latency of 11 É s is re-
portedin thedocumentation and7.5 É s in thedescription givenon theweb1. Thedocumentsgive
1http://www.intel.com/network/products/exp550t f.htm

8.2Validation of theparameterisedmodel 177
2 2.5 3 3.5 4 4.5 510
10.5
11
11.5
12
12.5 Intel 550T. Ports 1,2,5,6,8
Number of nodes
Ave
rage
tran
smit
thro
ughp
ut p
er n
ode.
Mby
tes/
s
(a)Theaveragethroughputpernodeasafunction
of thenumberof nodes
2 2.5 3 3.5 4 4.5 520
25
30
35
40
45
50
55 Intel 550T. Bidirectional systematic traffic. Ports 1,2,5,6,8
Number of nodes
Tot
al s
witc
h th
roug
hput
. Mby
tes/
s
(b) Thetotalnetwork throughput asa functionof
thenumberof nodes.
Figure8.7: Theresults of thebidirectional streaming testson the Intel 500Tswitch. This shows
thattheup to four FastEthernet nodes cancommunicatesat thefull link rate.
6.3 Gbit/saggregateinternal bandwidth, 2.1 Gbit/sbackplane, but 800Mbit/s aggregatenetwork
bandwidth. Our requestfor clarification from thevendor wentunanswered.Testson theeight port
switchshowed that thezeromessage lengthlatency was5 É s in thestore andforward setup. We
alsodiscoveredthat theswitching fabric mustbea shared busor sharedbuffer sinceindependent
of numberports used, we were limited to an accepted load of 51 MBytes/s, equivalent to just
over four ports running at full rate. This is shown in Figure8.7. In Figure8.7, thesetup initially
consistedof two nodes. Eachnodein the systemsentto another at the full rateandthe total re-
ceivedratewasmeasured.Thenumberof nodesin thesystemwasincreasedandthemeasurement
repeated.Figure8.7(a)shows theaveragethroughput pernodeandFigure8.7(b)shows the total
throughput through theswitch.
Tolly2, a third-party network equipmenttesthouse, testedthe Intel 550T [40]. It is difficult
to get informationwe canuseto build our modelsfrom theTolly report dueto the configuration
they used. Their chosen configuration was56 ports, that is seven switchesconnectedby a ma-
trix module,with flow control disabled. Their report doesnot give the throughput achieved for
all nodestransmitting andreceiving bidirectionally. They do however supply the throughput for
unidirectionaltraffic.
For unidirectional traffic, with 28 streams all going through the backplane, they achieved a
2http://www.tolly.com

178 Chapter 8. Parametersfor contemporary Ethernet switches
maximumof 2.8 Gbit/s, with no frameloss. In our own test,we cameto theconclusion that the
maximumbackplanespeed perswitchwas51.1MBytes/sor 408Mbit/s bidirectionally. For seven
switches, this would give the2.8Gbit/smeasured by Tolly.
In modelling the550T, we performedthenecessarymeasurementto obtain theparameterswe
required. However, wewereunableto obtain thebuffersizesfrom themanufacturer. To investigate
thesizeof thebuffers, theoutput buffer wassetto oneandtheinput buffer wasvaried. Figure8.8
how well the different configurations agreed with the measurementson the real system. The
configuration waseight nodessending packetsof 1500 bytes to eachother wherethedestination
addressandtheinter-packet time waschosenrandomly. Flow control wasturnedoff for this.
5 10 15 20 25 30 35 40 45 50 550
100
200
300
400
500
600
700
800
900
1000
Accepted throughput. MBytes/s
Ave
rage
late
ncy.
us
Intel 550T switch; 8 nodes; rnd addr; IPG exp; 1500B frames; measured vs modelled
Measured Modelled: RR, input FIFO 64 frames Modelled: RR, input FIFO 8 framesModelled: RR, input FIFO 4 framesModelled: RR, input FIFO 2 frames
Figure8.8: Investigatingthebuffer sizein theIntel 550Tswitch.
For loadsof higherthan51.1MBytes/stheswitchloosesframesin suchawaythattheaccepted
throughput canbelessthanfor ahigherload. This is reason why themeasurementline curvesback
to a lower acceptedthroughput asthelatency grows.
As the results show, the model with an output buffer size of four framesbestmatchesthe
measurements.Figure8.9 shows themeasurementrepeatedwith a framesizeof 500bytes. Fig-
ure8.9(a) showstheacceptedthroughput against theaverage latency andFigure8.9(b)shows the
offered throughput against the lost framerate. The results show very goodagreement with the
measurements.The full list of parametersusedin modelling the Intel 550T switch is shown in
Table8.2.

8.2Validation of theparameterisedmodel 179
P1[frames] P2[frames] P3
[Mbytes/s]ÌP4
[Mbytes/s]ÌP5
[Mbytes/s]ÌP6
[Mbytes/s]
P7
[Mbytes/s]ÍP8
[Mbytes/s]ÍP9[ Î s ] Í P10[ Î s ] Í
4 1 NA NA 51.1 NA NA 12.5 NA 5.0
Table8.2: Model parametersfor theIntel 550TEthernet switches.Theparametersobtainedfrom
the ping-pong measurement are marked with Ï . The parameters obtained from the streaming
measurementaremarkedwith Ñ (themaximumbandwidth for 1500Bytesis given). NA implies
not applicable.
5 10 15 20 25 30 35 40 45 50100
200
300
400
500
600
700
Accepted throughput. MBytes/s
Ave
rage
late
ncy.
us
Intel 550T switch; 8 nodes; addr rnd; IPG exp; 500B; <= 50MB/s
measured modelled 4 inp buffer, dest IDLE, limit with filler frames
(a) Acceptedthroughput
0 10 20 30 40 50 60 700
1000
2000
3000
4000
5000
6000
7000
Offered traffic. MBytes/s
Ave
rage
lost
fram
e ra
te. F
ram
es/s
Intel 550T switch; 8 nodes; addr rnd; IPG exp; 500B; <= 50MB/s
measured modelled 4 inp buffer, dest IDLE, limit with filler frames
(b) Lost framerate
Figure8.9: The performanceof the Intel 550T FastEthernet switch with random traffic. Model
against measurements.

180 Chapter 8. Parametersfor contemporary Ethernet switches
8.3 Conclusions
Theparameterised modelhasbeenvalidated.Themodelreflectsthebehaviour of therealswitch
with an accuracy of five to ten percent at loads belowsaturation. Thanksto its simplicity, larger
networks canbe modelled without a dramatic increasein the modelling time, aswas observed
using thea detailedmodel.
Theapplicability of theparameterisedmodelto awiderangeof switcheswith different internal
andhierarchical architecture hasbeendemonstratedin [34].
8.4 Performanceand parametersof contemporaryEthernet switches
In this section,we presentsomeoff–the–shelf Ethernet switches,their parametersfor thepurpose
of modelling andwe identify issuesof interest to ATLAS based on our experiences.
In themeasurementspresentedhere, not all theresults of all switchesarepresent.Therearea
number of reasonsfor this. Firstly, not all theswitchesmadeavailableto ushadtheconfiguration
to allow thefull setof measurementsto bedone. For example, someswitcheswereprovidedwith
only a single moduleor with Gigabit Ethernetportsonly. Secondly, At the time of availability,
we did not have thenecessaryequipmentto fully testtheswitch.Thirdly, thesomeswitcheswere
only available for a limited period of time. Insufficient for the full set of measurementsto be
performed.
8.4.1 Switchestested
In Tables8.3,wepresent modelling parametersfor BATM TitanT4 switchin bothFastandGigabit
Ethernet configurations,theBigIron 4000, theAlteon 180,theCisco6509, theCisco4912G, the
Cisco4003, theXylan OmniSwitchSR9andtheARCHESswitch.
Ê TheBATM Titan T4 hasa hierarchical architecture. A picture is shown in Figure8.10. It
canhostany combination of up to four Fastor GigabitEthernet modules. A FastEthernet
modulehaseight portsanda GigabitEthernet modulehasa single port.
We discoveredthatearlymodelsof theseswitches wereblocking for bothFastandGigabit
Ethernetmodules. After discussionswith the vendor, it becameclear that this wasdueto
limitations in the memoryspeeds usedin the switches. In Table8.3, the blocking nature
of the switch is shownby parameterP3 andP7 in the Gigabit Ethernet configuration. In

8.4Performance andparametersof contemporaryEthernetswitches 181
BATM Ti-
tan T4 Fast
Ethernet
BATM
Titan T4
Gigabit
Ethernet
BigIron
4000
Alteon 180 Cisco6509 Cisco
4912G
Cisco4003 Xylan Om-
niSwitchSR9
ARCHES
switch
Number of
ports per
module
8 1 8 8 2 12 6 2 1
Number of
of modules
in chassis
4 4 4 1 9 1 2 9 7
P1
[frames]Ë672 1350 Unknown Unknown Unknown Unknown Unknown Unknown 10
P2
[frames]Ë672 1350 Unknown Unknown Unknown Unknown Unknown Unknown 3
P3
[Mbytes/s]Ì100.0 105.8 Unknown NA Unknown NA Unknown Unknown 60
P4
[Mbytes/s]Ì100.0 125.0 Unknown NA Unknown NA Unknown Unknown 60
P5
[Mbytes/s]Ì100.0 NA Unknown Unknown Unknown Unknown Unknown Unknown NA
P6
[Mbytes/s]
4800 500Ë 4000 NA Unknown NA Unknown Unknown 420
P7
[Mbytes/s]Í12.5 105.8 116.2 NA Unknown NA Unknown Unknown 40.7
P8
[Mbytes/s]Í12.5 NA 129.9 277.8 526 526 526 39.8 NA
P9[ Î s ] Í 8.4 5.4 5.4 NA Unknown NA Unknown Unknown 2.5
P10[ Î s ] Í 4.9 NA 5.4 5.5 2.8 0 0 7.9 NA
Table8.3: Model parameters for variousEthernet switches. The parametersobtained from the
ping-pongmeasurementaremarkedwith Ï . Theparametersobtainedfrom thevendorsaremarked
with Ð . Theparametersobtainedfrom thestreamingmeasurementaremarkedwith Ñ (themaxi-
mumbandwidth for 1500Bytesis given).NA=not applicable.

182 Chapter 8. Parametersfor contemporary Ethernet switches
Figure8.10:A picture of theBATM titan T4
Figure 8.11: The Foundry BigIron 4000
switch.
orderto support thefull Gigabitrate, P3andP7should be125Mbytes/s (1000 Mbit/s), but
instead they areboth105.8Mbytes/s.
We performeda seriesof testsconnecting multiple Titan T4 switches togethervia Fastand
Gigabit Ethernet links. Theseshowed no surprisesin termsof latenciesandthroughputs,
that is, the latenciesgrew linearly with increasingnumber of switches betweensender and
receiver andthethroughput waslimited by theconnectinglink’s speed.
Measurementsof multiple Fast Ethernet nodes transmitting to a single Gigabit Ethernet
nodeon theT4 havebeen lookedat in Section6.2.1.Packet lossandframeprioritisation on
the T4 have beendiscussedon Section7.6.2and7.6.6respectively. VLANs wereproved
to work on the T4 by the performanceof the loopbacktest in Section 7.6.8Trunking and
Broadcastsissueson theT4 arediscussedat below.
Ê TheBigIron 4000, seeFigure8.11,hasa hierarchical architecture that canhostup to four
modules. Theswitch astestedhadtwo Gigabit Ethernetmodules. Eachmodulehaseight
GigabitEthernet ports.Theperformanceof theBigIron 4000 going through thesamemod-
uleanddifferent modulesis verysimilar. Thefixedoverheadin theframelatency is thesame
for inter-module andintra-module transfers(parametersP9andP10in Table8.3),however
the byte dependant overhead is slightly different (parameter P7 andP8 in Table8.3). The
framelossfor theBigIron 4000hasbeenlookedat in Section7.6.2.
This switch is a highly configurableswitch to the extent that the usercaneven configure
rateof thebroadcastandmulticasts.In our experiencemodern switchesarebecoming more
configurable.This is a goodthing for ATLAS since it allows moreflexibil ity.

8.4Performance andparametersof contemporaryEthernetswitches 183
Ê The ARCHESswitch [49] wasdevelopedat CERNaspart of the ESPRIT project. It was
built to demonstrate the useof the HS-Link technology in commodityproducts such as
Ethernet. The switch hadseven Gigabit Ethernet ports. Being a prototype, it supporteda
limited numberof Ethernet features. It supportedIEEE 802.3xflow control, but did not
support broadcast,the spanning tree algorithm, VLA Ns or trunking. Full details of the
switchandits performancearecontainedin [49].
Ê The Alteon 180 switch is a fixed configuration switch. It haseight Gigabit Ethernet ports
andeight FastEthernet ports for redundancy. Weonly tested theperformanceof theGigabit
Ethernetports. Theframelosshasbeenlookedat in Section 7.6.2.
The following switches wereonly available remotely, thereforewe werelimited in what we
could test.
Ê CiscoCatalyst 6509: It hasthe hierarchical architecture of modules anda backplane. The
chassis canholdninemodules. Only onemodulewith two GigabitEthernetportswasavail-
ableon theswitchwe tested. TheCiscodocumentation [48] refer to this asthe“supervisor
engine with two Gigabit up-links”. It hold the CPU to enable management of the switch.
As aresult, wewereableto testonly intra-moduletransfersandonly thetests involving two
ports.
Ê CiscoCatalyst4912G:It is a12-port dedicatedGigabitEthernet switch. It is afixedconfig-
uration switch.
Ê CiscoCatalyst4003:It hasahierarchicalarchitecturesupporting amaximumof threemod-
ules. Oneof the modules is reserved to the managementmodule. The configuration we
testedhad a single Gigabit Ethernet module with 6 ports. We could therefore only test
intra-moduletransfers.
Ê Xylan OmniSwitchSR9:The switch comesin three forms,supporting three, five andnine
modules. Theconfigurationof theonewe tested supportsninemodules. We hadonemod-
ule, the GSX-FM-2W with two Gigabit portson it. Thusonly intra-module transfersand
two port testscould beperformed. Of theGiagabit Ethernet switcheslookedat, it showed
thelargestframelatency fixedoverhead(P10which is 7.9É s)andthesmallest intra-module
transfer bandwidth (P8which is 39.8Mbytes/s).

184 Chapter 8. Parametersfor contemporary Ethernet switches
0 500 1000 15000
10
20
30
40
50
60
70
Sw
itch
port
to p
ort l
aten
cy. u
s
Message length. Bytes
2nodes comms1 broadcast. Switch B
Figure8.12:Portto port latency for broadcast
packets. Obtainedfrom comms1
0 500 1000 15000
1
2
3
4
5
6
7
8x 10
4
Message size. Bytes
Fra
me
rate
. Fra
mes
/s
2 nodes. streaming broadcast. Switch B.
Direct Broadcast streaming switch B broadcast streaming
Figure 8.13: The frame rate obtained when
streaming broadcastpacketsthroughtheTitan
T4
8.4.2 Broadcastand Multicast
Theport to port latency for broadcastpacketsontheTitanT4 is shown in Figure8.12. Thelatency
is muchhigher thantheunicastlatency shownin Figure7.24(a)(thenon-loopbackline). We also
notethatparadoxically, thebroadcastlatency decreasesasthemessagelength increases.This has
not yet beenunderstood andis being lookedat with theswitchvendor.
Figure 8.13 shows the framerateobtainedby streaming broadcastframes. We seethat the
broadcastframerateis limited to around 10,000 packetspersecond.
The performanceof multicast through the Titan T4 is the sameas unicast. In fact, when
streaming to a destination, the addressof which the switch hasyet to learn, thenthe framesare
multicast to all ports. Thedifferencebetweenmulticastandunicast is the frameloss. Multicasts
will experienceframelossasshown in Figure7.11.
Broadcastsarelimited in theTitanT4 by thevendor to reducebroadcaststormsonthenetwork.
Broadcaststakeupuseful bandwidth andin theabsenceof VLANs getforwarded acrossthewhole
switch/network. Reducing thebroadcastrateon theswitch is a way to limit this. Not all vendors
take this approach. Somehave broadcastand multicasts at the samerate as unicasts. On the
BigIron 4000, we found that the broadcastandmulticast ratescould be definedby the user. For
ATLAS,a switchwhich is ableto broadcastandmulticast at thesamerateasunicastis preferable
dueto thetime constraint imposed by theaveragedecision latency.

8.4Performance andparametersof contemporaryEthernetswitches 185
8.4.3 Trunkin g on the Titan T4
On theTitan T4, trunking is currently supportedonly on FastEthernet portsof thesamemodule.
We tested trunking on the Titan T4 andfound its implementation to beunsatisfactory. Whenwe
setupatrunked link andsent astream of traffic through,wenoticedthatthemaximumthroughput
correspondedto thesizeof thetrunkedlink. Howeveronsubsequent transmissions,themaximum
throughput wasonly equivalent to streamingon a single link. This is clearly a bug in thesystem.
We informed the switch vendor who told us it would be fixed in the next revision of the switch
software. For theLVL2 network, trunking is useful for redundantlinks andminimising the total
number of concentrating switchunits.
8.4.4 Jumbo frames
Netwiz Turboswitch 2000cantransmitandreceive up to 2000-byte packets. theTitan T4 canbe
configuredto transmit andreceive up to 4000-bytepackets.TheAlteon andXylan switches were
the only switcheswhich support jumbo frames(up to 9000bytes). All other switchestested are
limited to theEthernetmaximumframesize.
Advocatesof jumbo framesseethem as a simple solution to maximising the utilisation of
the Ethernetlink while reducing the CPU usageper byte of data. Detractors seethem asnon-
standard, thus breaking the Ethernet compatibility anduseful only for backup anddatastorage
typeapplications. They maintainthattheperformanceincreaseis notworthbreaking thestandard.
Sofar jumboframeshave not hada big impacton themarket. They arenot to be includedin the
10-Gigabit Ethernet standard.
Althoughanumberof switchessupport larger thanthemaximumEthernet framesize,ATLAS
cannot rely on this for thefutureswitches.
8.4.5 Switch management
Switch management in earlier switches hasbeenvia dedicatedmanagementsoftware normally
running on WindowsOS.Vendors arenow offering managementvia a web browser. From our
experience,these interfacesdo not work well. They areprone to crashing whether using Inter-
net Explorer 5.0 or Netscape 4.7 on Windows NT or Netscape4.7 on Unix. Both of theseweb
browsers areknown to bebuggy especially with Java. Thefailure oftenrequired theswitch to be
re-bootedandresetbeforeaccess to themanagementinterfacecouldbeobtainedagain.Manage-

186 Chapter 8. Parametersfor contemporary Ethernet switches
mentis alsoprovidedvia a serialinterfaceattachedto theswitchmostof the time. This we have
found is alwaysreliable,but unfortunately limited in functionality. Not all the configuration op-
tions areavailable.Theold systemof a dedicatedmanagement software running normally on the
WindowsOSwaslessflexible but morereliable. In this study, we have not looked at commercial
managementsoftware.
As the technology matures, it is hoped that the management softwarewill get morereliable.
For the ATLAS LVL2 network, the network could consist of around 20 switchesandtheir man-
agement becomes a non-trivial exercise.
8.5 Conclusions
A wide rangeof high performanceEthernet switchesexists in therapidly evolving marketplace.
Theparameterised modelhasbeenvalidated. To date, themodelhasbeentestedfor up to 32
FastEthernet nodesand4 GigabitEthernet nodes. We have providedparametersof off–the–shelf
switches for modelling. Theparameterised modelsof Ethernet switchesarebeing usedto:Ê Studythelatency, throughputandframelossasa function of thenetwork configurationfor
theATLAS traffic pattern.Ê Model thefull scaleATLAS LVL2 triggernetwork andstudy its scalability . [44].Ê Studythe mostsuitable architecture for the ATLAS LVL2 network. How bestto employ
featureliketrunking andVLANs, thebestwayto distributetheROBsandprocessorsaround
theswitchesandtheoptimumnetwork size.Ê Studythebottlenecks in thesystemandwherequeuesbuild up. Find outwhatsortof traffic
shaping is requiredto alleviate bottlenecks.Ê Look at thepossibility of running LVL2 andtheeventfilter on thesamenetwork.
Wehavealsoidentified areasof concernto ATLAS.Excessive lossesin broadcast is aconcern.
Therefore the chosen switches must be tested for this and the ATLAS broadcast rate carefully
controlled or lossesdealtwith. Modernswitches tendto bemorenon-blocking andconfigurable,
thusfuture trendslook favourable for ATLAS needs.

Chapter 9
Conclusions
187

188 Chapter9. Conclusions
9.1 Achievements
Therequirementsof ATLAS pushtheboundaries of technology. In aneffort to keepdown costs
throughout the lifetime of the project, commodity off-the-shelf products arebeing investigated.
The objective of this thesis was to assess the Ethernet technology for the ATLAS LVL2 trig-
ger/DAQ network.
Thefirst partof this thesisdeals with issuesaffecting theendnodes. A characterisationof host
PCperformancewhile running communications on a variety of protocols for both FastEthernet
andGigabit Ethernet hasbeenproduced. The TCP/IPimplementation under Linux hasbeenre-
viewedandassessedfor theATLAS LVL2 triggersystem. Its short-comings led to theassessment
of MESH,a purposebuilt communications library for theATLAS LVL2 trigger system. Thesec-
ond part of the thesis deals with Ethernet switches andnetworks. Possible topologies have been
identified in orderto obtain thebestperformancefor theATLAS LVL2 system.
An Ethernet switch performancetesting tool, ETB, hasbeen developed andtested. The tool
cantestFastEthernetat thefull link ratefor packet sizesgreater than100bytes. Theperformance
under GigabitEthernet is limited by thehostPCIbus. Thedevelopmentof ETB involvedsynchro-
nisation of PCclocks. Wewereableto achievethis to anaccuracy of lessthanamicrosecondwith
a drift of 2.9 É s perminute.
A seriesof measurementshavebeendevelopedwhichwill allow thecharacterisationandhence
themodelling of Ethernet switches. Extensive measurementshave beenmadeandcontinueto be
madein orderto fully characteriseaseriesof switchesfor themodellingeffort. To date, anetwork
of up to 32 nodeshassuccessfully tested.
Results obtainedfrom thework presentedhasbeenusedin a numberof papers andpresenta-
tions ( [33], [34], [35], [39] [44], [45], [28], [46] and[47]).
9.2 Considerationsin usingEthernet for theATLAS LVL2 trigger/DAQ
network
Thissectioncontainsalist of considerationsin usingEthernet for theATLAS LVL2 network based
on thework in this thesisandfuture technology trends. We alsosuggestareaswhich needfurther
study.

9.2Considerations in using Ethernet for theATLAS LVL2 trigger/DAQ network 189
9.2.1 Nodes
1. OS: For the ATLAS LVL2 system, we cannot rely on current OS aimedat the desktop
market. Theseareoptimisedfor responsivenessto theuser. As such they arenot optimised
for I/O. In consequencehugedelayscanoccurin delivering packets to theapplication in the
presenceof multiple threads.
2. Protocol: Thestandarddrivershave beenshown to be expensive in termsof CPUload. It
hasbeen shown that the current implementation of the TCP/IPprotocol usesconsiderable
amountof CPUtime to reach theI/O rates required by theATLAS LVL2 network. ATLAS
doesnot require a streambased protocol like TCP. MESH or a similar lightweight packet
basedprotocol with optimised driversmay be moreappropriatefor I/O. The disadvantage
with MESHis that it doesnot provideguaranteed end-to-end packetdelivery. performance,
QoS,packet loadbalancing.
3. NIC: Most FastEthernetNICs aremadefor 32-bit, 33 MHz PCI systems. We areunable
to reach the full rateon FastEthernet for packets lessthan100 bytesfor MESH andfor
packets lessthan250 bytes for TCP/IP(on a 32bit, 33MHz PCI bus, 400 MHz processor
speedsystem). Most Gigabit Ethernet NICs on the market arecompatible with the64-bit,
66MHz PCIbus.Eventhoughthecost of aGigabitEthernetNIC is fivetimesthepriceof a
FastEthernetNIC, it maybemorecosteffectivein thelongertermto useGigabitEthernet at
theendnodesof theLVL2 network rather thanFastEthernet. This offersasimplerupgrade
pathsincethecopperbasedGigabitEthernet NICscanberun at 10,100and1000Mbit/s.
Considerationshould alsobegivento anall GigabitEthernet network. Thecostof Gigabit
Ethernetequipmentis dropping rapidly. The lifetime of ATLAS is expected to be around
20 years.Replacing theFastEthernet links with GigabitEthernet allowsfor sparenetwork
capacity andreducetheaveragelatency.
Network
1. Ethernetswitches:Most Ethernet switchesusestore-and-forwardmechanismswhich intro-
ducea latency dependenton the packet size. Only a few switchesprovide cut-through (or
wormhole)routing which makesthelatency independentof thepacket size.
Thelatency providedby store-and-forwardswitchesis suitable for theLAN market. There-
fore, switch manufacturers have littl e interest in providing cut-through routing. Further-
more,changesof bandwidth require theuseof store-and-forwardswitching.

190 Chapter9. Conclusions
Thethroughput achievedby thefirst FastEthernetandGigabitEthernetswitchesweinvesti-
gatedwerelimited by theinternalsof theswitch,thebackplanecapacity wasinsufficient. In
general, newer switcheshave a higher capacity. Themarket trendis towards non-blocking
switches. In this sense, theinterestsof ATLAS andthemarket trendsarealigned.
2. Switchvendor claims:Not all thevendorsclaimscanbetakenwith full confidence.Switches
bought for theATLAStrigger network should betestedfor therequiredfeatures.To getthe
bestuseof the available bandwidth provided by the links, non-blocking switchesmay be
moreappropriate in theATLAS LVL2 trigger network.
3. Topologyconsiderations: Oneconstraints imposed by the ATLAS LVL2 trigger system is
that all processors should be ableto accessall buffers. New extensionsanddevelopments
in theEthernet standardswill allow greater flexibili ty in thenetwork topologies(seeChap-
ter 5).
Switchesavailableonthemarket aremainlyof thestoreandforwardnaturewith ahierarchi-
cal structureof modules andbackplane. Thecurrent proposedarchitecture for theATLAS
LVL2 system(Figure5.4) have ROBson onesideof thesystem andtheprocessorson the
otherside. This meansthat all the traffic always goesvia the central switch. A moreef-
ficient architecturewill mix theprocessorsandROBson thesameconcentrating switches.
Betteryet on the samemoduleof the concentrating switch. This meanspart of the traffic
is localisedto the concentrating switches. This reducesthe averagenode-to-nodelatency
andmore importantly the backplanebandwidth required of the central switch by at least
5%. Theseissues areimportant sinceit is unclear what thebiggestswitchavailable on the
market will be.
4. Frameprioritisation: We have demonstratedherethat prioritisation works in a congested
system. Thereare various ways in which priorities can be implemented in the ATLAS
LVL2 triggernetwork. An exampleis to prioritise LVL3 traffic ashighestpriority sinceit
hasalready beenprocessedandacceptedby LVL2 andis therefore moreimportant than the
LVL2 traffic. It is hoped thattheongoing modellingwork will revealthemostefficient way
in which to implementQoSin theATLAS LVL2 trigger network.
5. Flow control: Someswitches do not implementthe IEEE 802.3x flow control. Other
switchesreact to flow control framesbut do not sendthem. Someswitches reactto and
sendflow control framesbut do not implement it well enough to avoid packet loss. Others
implementit to avoid packet loss,but lossescanoccur if theaddress of a destination is not
known. Thereason why someswitchesdonotpropagateflow control in awaywhichavoids

9.2Considerations in using Ethernet for theATLAS LVL2 trigger/DAQ network 191
packet lossis becausethereis a risk of blocking the whole network. In the ATLAS LVL2
network, a lost frame would meana lost event, rendering all other framesfor that event
useless. The blocked network scenario is not necessarily a problem due to the request-
responsenature of theLVL2 traffic pattern. Switchesexist which work in therequiredway.
However, we have seenthat there is still a risk of framelossif the switch hasnot learned
the addressesof the destination nodes. A solution is static forwarding tables. This means
manually entering addressesinto theswitchforwarding tables.An undesirable sideeffect.
Oneof themajorstrengthsof Ethernet is thatnodes andswitchescanbeadded or removed
from thenetwork andthenetwork reconfiguresitself automatically andcontinuesworking.
If a switch or port dies,nodescanbe moved to another switch port and the network au-
tomatically learns the new location. Staticforwarding tablesprevent this andwill make it
difficult for automatic configuration.
An alternativeto staticforwardingtablesis to performabroadcastfrom eachnodeevery300
secondssuch thateachswitch in thenetwork is awareof whereevery nodeis located. 300
seconds is the recommended addressaging time in the IEEE bridging standard. This can
normally bealteredby the user. The impactof all nodesin thesystembroadcasting every
300secondsasynchronouslyduring normaloperation hasnot beenstudied. In theabsence
of a higher layer protocol, the agingtime will decide whena nodeis no longer available.
This andthe recovery time should alsobe studied to find the mostappropriate valuesfor
ATLAS.
In the LVL2 network, we do not expect the nodes to be moved. This issueneedsto be
re-addressed in thestudy of fault tolerancefor theLVL2 trigger network.
6. 10-Gigabit Ethernet: Poltrack[30] arguesthat if we accept Moore’s Law, whereprocessor
speeddoublesevery 12 to 18 months, thenetwork I/O will have to keep up with this. Thus
Ethernetperformanceshould increaseby 10 timesevery 3.3 to 5 years.10Gigabit Ethernet
productsarealready emerging. Thestandardsarescheduledto be publishedin 2002. The
useof 10-Gigabit Ethernet should be seriously consideredfor the ATLAS LVL2 trigger
network. It is likely to be morecost effective on a price per port basisandwould mean
reducedwiring complexity dueto a smaller numberof ports.
7. Trunking: The LVL2 network can be constructed without trunking, but would meana
greater numberof concentrating switches. Increasingthenumber of concentrating switches
meansa lossof locality betweenports:moretraffic hasto passthroughthecentral switchto

192 Chapter9. Conclusions
getto its destination. Thiswill increasecongestion andhencedelayon theup-links. Trunk-
ing alsogiveslink redundancy. Switchestoday canbebought with someredundancy built
into them. The mostcommonelementsare redundantpower supplies, switching fabrics,
fansandCPUs.
The costof a Gigabit port is currently around five times the costof a FastEthernetport.
Thismeanwhentrunking FastEthernet links, it is morecost effective to simply useGigabit
Ethernetwhentrunking five or moreFastEthernet ports.UsingGigabitEthernet alsogives
shorter link latencies.If thepriceof 10 GigabitEthernet fallsasrapidly asits predecessors,
then it will be costeffective to use10 Gigabit Ethernet ports rather thantrunking several
GigabitEthernet ports. Theuseof trunking within the LVL2 trigger should be focusedon
providing link redundancy andenabling greater port locality (placing thenodescommuni-
catingbetweenthemselvesonthesameconcentrating switch)thanfor performancereasons.
8. Fault toleranceandredundancy: Aspectsof fault toleranceandredundancy areareasrequir-
ing further study. By fault tolerance,we meanthe resilienceof the LVL2 system to both
hardandtransitory faults. Redundancy is required in caseof failures.
9. Higher layer switching: We expect anincreasingamount of intelligence to beput into Eth-
ernetswitches. Wearealreadyseeingswitcheswhich look into thedatapartof theEthernet
frameto make decisionsbeforeswitching. At present, higher layer switching is in its in-
fancy andnostandardsexist for them.Vendorshavevaryingfeaturesin theirswitcheswhich
they refer to asLayer3 andLayer4 switching. Higher layerswitching should berevisited
in thefuture to seeif it is of useto ATLAS.
10. Broadcast andMulticast: Broadcast andmulticast arenecessaryin the LVL2 network be-
causethey areusedby the supervisors to minimise the packets they send.We have found
that broadcastandmulticast packetscanhave lower maximumrates,be subject to higher
latencies and losses thanunicast packets. A few switchesoffer the functionality for user
programmablebroadcastsandmulticasts rates. If broadcastandmulticastareto beusedfor
ATLAS, theneither a securebroadcastandmulticast mechanismsmustbedevised or they
mustbeusedin wayswhich aretolerant to theseperformanceissues.
11. Loadbalancing andtraffic shaping: Thebottlenecksin theLVL2 systemneedsto be iden-
tified in order to implementthemostefficient loadbalancing andtraffic shaping algorithm.
A degree of loadbalancingcanbeimplementedin thesupervisor nodes.Sincethey control
theallocationof tasksto theprocessors,they could allocatetasks accordingto thespeed of
theprocessors. TheLVL2 system currently modelledemploys a round robin scheme.

9.2Considerations in using Ethernet for theATLAS LVL2 trigger/DAQ network 193
12. Network Management: Keeping a large network running will bea majorchallenge. Issues
which have to be addressedaremanaging reliability, availability andserviceability. Eth-
ernetswitches typically support theSimpleNetwork ManagementProtocol(SNMP).This
protocol allowsmonitoring thenetwork performance,detection of network failures,andthe
accomplishmentof traffic re-routing.
Vendorshavevariousproprietarymechanismsby whichto managetheirswitches. Thetrend
is towardswebbased managementsoftwarewhich is run from a Java enabledwebbrowser.
Theadvantageis that it canberun on any OSandany platform andfrom anywhereaslong
astheswitchandmanaging nodeareconnectedvia a network. This normally comesat the
expenseof aswitchport. Theinterfacesthemselvesarenotuniform andunlikely to become
soin thenear future. Featuresrequired from a network managementtool are:
Ê Easymanagementof multiple switches. With the ability to construct VLAN s, multi-
casttrees,trunking etc.
Ê A single commoninterfacefor switchconfiguration.
Ê Theability to savea network configuration to a file andrestore from a file.
Ê A way of validating a network configuration.
Ê A simpleway of addressinga particular switchin thenetwork.
Ê A notification system which reports thestateof thenetwork.
Our experiencehasshown that thereareEthernetswitcheson the market which arehighly
reliable. However a majority of vendors take the approach that framescan be lost in cases of
congestion. Ethernet is a besteffort technology which doesnot guaranteedelivery. Lossesand
corruption canoccur dueto:
Ê Congestion. Theswitchmaydropframes.Ê Electrical problemson thecable.Ê A fault at thenode.Ê A fault at theswitch.
Summary
ATLAS equipmentwill be in a relatively smallarea(100m diameter) with a controlled electrical
environment. Therewill beno collisionssincewe areusing point-to-point links. With thecorrect

194 Chapter9. Conclusions
equipmentandsetup (perfectly working flow control) thereshould be very low packet lossdue
to congestionandthe switch. Flow control doesnot work perfectly on all switches andof those
tested, only oneworkedin therequiredway. ATLAS cannot rely on a single vendor.
Thelatest developmentsin Ethernet switches arerelated to Quality of Service (QoS)aspects.
It is to be expected that in the nearfuture, Ethernet switcheswill provide a very high communi-
cation reliability with QoSparametersthat canbe configured to discard specific packet types in
caseof congestion. Thedominantmarket is likely to remaintheLAN andnot high performance
parallel computing. Therefore a higher layerprotocol with flow control andpacket lossrecovery
mechanism should beconsideredto broadentheswitchchoiceavailableto ATLAS.
The costof a Gigabit switch today is around $1000 per port. For FastEthernet it is around
$200. For thearchitecturedescribedin Figure5.4of Chapter 5, therearearound2250FastEthernet
ports and334 Gigabit Ethernet ports. This meansthe costof the network if it could be bought
today would be$784,000. Figure3.9showshow thepriceof FastandGigabitEthernet NICs and
switches have variedasa function of time. From this we estimatethat by 2005, the costof the
network will beof theorderof $350,000.
9.2.2 Competing technologies
At thestartof thisproject,AsynchronousTransferMode(ATM), ScalablecoherentInterface(SCI)
and Ethernetwereseenas serious contenders for the ATLAS level 2 trigger DAQ. It hasbeen
decided[1] thatno further studiesof SCI for ATLAS will bemade.This is becausealthough it is
becoming morewidely adopted, it is likely to remainin a niche market with small volumesand
few sources.
ATM is a technology basedof transferring datain fixedsizepacketsor cells of 53 byteslong.
It is ableto deliver different service classes.It is ableto deliver real-time integratedvoice, video
anddata. However ATM standardisation took longer thanexpected. Therealsoexists problems
of inter-operability between differentvendors asreportedby theUniversity of New Hampshire1.
Thedeploymentof FastEthernet saw greatermarket penetration than155Mbit/s ATM which was
deployedmuchearlier. For this reason, ATM hasfailedto take off asa technology to thedesktop.
Theresult is thatprices have remained high andATM hasbeenusedmainly for theWAN market.
Theaveragecostperport for 155Mbit/s ATM is $1500,This includestheswitchportandtheNIC.
This comparesto FastEthernet’s $300 andGigabitEthernet’s $1500.
1http://www.iol.unh.edu

9.3Outlook 195
Work on ATM in the ATLAS community hasstopped. Ethernet is thereforethe most likely
technological option for theLVL2 network.
9.2.3 Futur e work
Thepossibility of asinglefarmperformingboth theLVL2 andEFprocessingis being investigated.
This is a result of theLVL2 implementationstudied in thePilot Project.
Investigationsareunder way to determine the feasibility andpossible benefitsof using SMP
(SymmetricMulti -Processors). An SMP version of MESH currently exists and it performance
with thereferencesoftware is being investigated.
A studyof a suitableprotocol for ATLAS needs to be under taken. Whether we usea light
weightversionof TCP/IP2 or something like theScheduled TransferProtocol3 needs to belooked
at. Requirementsarelow latency, guaranteeddelivery fault tolerant andQoS.
9.2.4 Summary and conclusions
ThebiggestEthernet switch we have comeacrossto dateis a 120 port switch madeby Foundry
networks, theBigIron 150004, at a costof $300,000. They claim it is fully non-blocking andhas
an internal crossbarrunning at twice the link rateto overcome the 60% limit for random traffic
dueto headof line blocking (HOL). At thecurrentrateof advancement,it is reasonableto expect
a 256 to 500port GigabitEthernet switchby 2003. On a longer time scale, vendorsareworking
on switching fabricsthatcansupport a few tens of 10-Gigabit Ethernet ports.
Preliminary results andcomputer simulation [44] have shownthat theEthernet technology is
capableof meeting therequirementsof theLVL2 trigger. Equipment approaching thesizerequired
by ATLAS is appearingon themarket. It is clearthaton thetime scaleof theLHC, industry will
beableto provide all thenetworking equipmentrequired for theATLAS trigger network.
9.3 Outlook
The appeal of commodity off the shelf productsandespecially Ethernetfor ATLAS arethe ex-
pected long-termsupportability andupgradability, its cost-effectivenessin termsof initial outlay
andcostof ownership, product availability from a wide rangeof vendors anda wide knowledge2http://www.sics.se/adam/lwip/3http://www.hippi.org/cProf.html4http://www.foundrynet.com/hotironnews5 00.html

196 Chapter9. Conclusions
base. Over theyears1998 and2000, theseexpectationshave beenconfirmed. A largenumber of
well-establishedcompaniesdevelop andsell Ethernetproducts.Theperformanceandcapabiliti es
of theswitches–such asQualityof Service(QoS)aspects,Virtual LocalAreaNetworks(VLANs),
andtrunking– areincreasing. Ethernetswitchesareincreasingly non-blocking andof higher port
densities. The10 GBit/s Ethernet standard (IEEE 802.3ae) is currently under development. The
first 10 Gigabit Ethernetswitches canbe expectedby the year2002, in time for usewithin the
ATLAS trigger.
An importantrequirementfor ATLAS is scalability . Ethernetswitches,whenusedin thestan-
dardway, canonly exploit a treetopology. Thenetwork topology itself doesnot needto bea tree,
it cancontain additional connectivity. However, the Ethernet switches will automatically shut-
down theredundantconnectivity in thenetwork andeffectively changeit into a tree.Any loopsin
thenetwork topology areremovedby thespanningtreealgorithm. If any of theconnections used
within the tree fails, the network will reorganiseitself using this algorithm into a different tree
topology, exploiting redundancy in thenetwork. As a result, theperformanceof anEthernet net-
work undertrigger-li ke all-to-all traffic is limited to theperformanceof theroot switch: Ethernet
only scalesto theperformanceof thelargestswitchyou canbuy.
A rootswitchsuitable for theATLAS trigger is likely to bea224port GigabitEthernetswitch,
or a 23 port 10 GigabitEthernet switch. It is to beexpectedthatbefore 2005,suchswitcheswill
beavailable.
In addition to using a large Ethernetswitch for the trigger, onecanalsodisable thespanning
treealgorithm to allow topologiesother thantrees. We have demonstrated(Section 5.3.1)that if
the automatic configuration canbe turnedoff andan explicit configuration is used, any network
topology canbe supported. This allows Ethernet to be organisedasa Clos network, a topology
which hasalready proven to be suitable for the ATLAS trigger [31]. The ability to turn off the
spanning treealgorithm is becoming morecommonin Ethernet switches.
A weakpoint in termof theATLAS trigger application is the implementationof flow control
in Ethernetswitches. Most implementations aregeared towardstheLAN market wheretheocca-
sional packet lossis not importantbut network deadlocksareunacceptable. Fromour experience
lossfreecommunicationis assuredonly whentheswitchhaslearnt theaddressesof thedestination
nodes. Supplying static forwarding table losessomeof the flexibili ty Ethernet provides. In the
future, fully lossfreeswitchesmaybeavailableon themarket, but in order to have a wider range
of choiceof switches,ATLAS should considertheuseof a guaranteed delivery protocol.

9.3Outlook 197
Broadcastandmulticast arerequired in the ATLAS LVL2 trigger system. They areusedto
sendclearmessagesto ROBsandto forward eventsto LVL3. Without broadcastsandmulticasts,
thenumberof packetsin theATLAS network will greatly increase.Theperformanceof broadcasts
andmulticastsmayvaryin termsof rates,latency andlosseswhencomparedto unicastonthesame
switch.
Thelargenumberof Ethernetvendorsgivesusconfidencein beingable to find productscater-
ing to theneeds of theATLAS trigger system.
We cannot usetoday implementations of TCP/IPon a desktop operating systemlike Linux
andWindows. MESH,a light-weightscheduling andcommunications library is ableto getmuch
moreefficient useof the underlying hardware. However MESH lacks somethings important to
ATLAS.It reliesonthelower layer flow control, thereis currently noguaranteeof delivery, packet
fragmentation mustbehandledby theapplication, it is proprietaryandcurrently it supportsonly
a limited numberof NICs.
Ethernet hasover 80% penetration of the LAN market andcontinuesto evolve. Its future in
the networking industry is assured. TheATLAS LVL2 triggercommunity is expectedto make a
decisionon which technology to usein June2002. Ethernet remainsa very strong candidate.

198 Chapter . Conclusions

Appendix A
Glossary of networking terms
199

200 ChapterA. Glossary of networking terms
Bridge A layer2 devicethatpassespacketsbetweennetwork segments(normally 2 segments).
Bridges provide filtering andforwarding functionsto incoming packets.
Broadcast domain Thesetof network devices thatwill receive broadcastframesoriginating
from any devicewithin theset.A broacastdomaincancontain multiple collision domainsandare
typically boundedby routers.
Collision domain Thepartof a network to which colliding packetsarebounded.
CSMA/CD Carriersensemultiple accesswith collision detection. This is the Media-access
mechanismusedby Ethernet in half duplex mode.A station wishingto transmit sensesthemedium
to seeif any other nodeis transmitting. If nooneelseis transmitting, thestationstartstransmitting.
During transmission, the sender readsthe signal it sendsout in order to detectcollisions. If a
collisionis detected,thetransmitting stationsstopsending andbacks-off for arandomtimebefore
trying to retransmit.
Delayed acknowledgementTCPusesanacknowledgementschemeto notify thesenderthatit
hasreceive its transmissions. Theseacknowledgementscontain no userdataandarehencewaste-
ful of bandwidth. To reducethenumberof packetsonthenetwork, acknowledgementsaredeferred
until a usermessage on thesameconnection is readyto besent. Theacknowledgement canthen
beattached(piggybacked)to theuser message. If a timeoutis reached,thentheacknowledgement
is then sentby itself.
ETB The Ethernet TestBedprogramis softwaredevelopedaspart of the work in this thesis
for performancemeasurementsof Ethernetswitches.This softwareusesPCswith NICs astraffic
sourcesandconsumers.
Ethernet A popular local areanetwork (LAN) technology developedby Xerox Corporation.
Thestandardsaredefined in theIEEE802.3standards. Therearecurrently threedifferentbit rate
technologiesonthemarket,10,100and1000Mbit/s. EthernetusestheCSMA/CDaccessmethod.
Fast Ethernet The100Mbit/s version of Ethernet.
Frame Theterminology usedto refer to dataencapsulatedby anEthernet header andtrailer.
Sometimesframesarealsorefered to aspackets.
Gigabit Ethernet The1000Mbit/s version of Ethernet.
Hub A device for connecting multiple hosts to anetwork. Thesedevicesarenormally passive
andsimply copy receivedpacketsto all of its ports.
IEEE TheInstituteof Electrical andElectronics Engineers.This organisation wasfoundedin
1884for developingstandardsfor thecomputer andelectronics industry.

201
LAN Local areanetwork. A LAN is a network for connecting computersthatnormally spans
a single building or groupof buildings.
MESH Themessaging andscheduling library developedfor ATLAS to optimisetheavailable
communicationandcomputation on commodityoff-the-shelf products.It currently runsunder the
Linux OSwith Ethernet.
MSS (Maximum segmentsize) The maximumchunk of data (header not included)TCP
will send. This dependson the underlying network technology. The default is 536 bytes. BSD
implementations have multiplesof 512bytes. Othersystems, SunOS4.1.3,solaris 2.2,AIX 3.2.2
usea commonMSSof 1460.
MTU (Maximum transmission unit) Themaximumdatasizehandled by thelink layerpro-
tocol belowtheIP layer. In thecaseof Ethernet, this is 1500bytes. Allowing for theTCPandIP
headers,this translatesto a datasizeof 1460bytes (this is how it relates to theMSS).
Nagle Algori thm This algorithm wasproposedby John Nagle in 1984[17]. It is a way of
reducing congestionin a network caused by sending many small packets. As dataarrives from
the userto TCP for transmission, the TCP layer inhibits the sending of new segments until all
previouslytransmitteddatahavebeenacknowledged. While waiting for theacknowledgements to
come,the usercansendmoredatato TCPfor transmission. Whentheacknowledgementfinally
arrives, the next segment to be sentwill be a bigger dueto the additional sends by the user. No
timer is employedwith this algorithm.
NIC Network interfacecard. A device usedin a computer to allow connection to a network.
OSI 7-layer model The OpenSystemInterconnect seven layer referencemodel for imple-
menting protocols.
Repeater A Layer 1 network device usedto regenerate signals weakened and distorted by
transmissionlosses.
Router A Layer3 device which forwardspacketsfrom onenetwork to another.
RTT The round trip time. The time it takes for a message to be sent from a source to a
destination andthedestinations responsereceivedat thesource.
SegmentSeecollision domain.
SocketsThefile accessmechanismin UNIX style OSused to provideanendpoint for com-
munication is referredto asa socket. Files,devices or network I/O canall be thought of asa file
to which data canbesentto andreadfrom. A socket canbeused in all thesecases.
Socket options arethe options associatedwith the connection. Among themarethe socket

202 ChapterA. Glossary of networking terms
sendandreceive buffer sizeandtheno delay option which disablestheTCPNaglealgorithm.
Socket sizerefers to the available buffer spacefor sending andreceiving datafrom the peer
node. The sendsocket buffer andthe receive socket buffer areindependent andcanbe set inde-
pendently.
Subnet A subnet is a subset of a larger network which forms a network in its own right. In
IP networks, subnetssharesa commonaddresscomponent. Subnetting in an IP network implies
splitting up a large network into smaller setsof networks with an IP router. This split givesthe
advantageof smallerlookup tables in the routersandhencequicker lookup times. It alsomakes
managementeasier.
Switch A layer 2 devicewhich filters andforwards packets based on the destinationaddress
of theincoming packets. They aresimilar to bridges,but have moreportsandaretypically faster.
TCP/IP Transmission Control Protocol/Internet Protocol. A suiteof communications proto-
colsusedto connecthostson a network. Thetwo mainprotocolsof this suite areTCPandIP.
Window sizeTCPusesa Sliding Window algorithm to effect a flow control. Theclient and
server both advertise a window size, which is the number of bytesthe receiver canreceive. The
window sizewill depend on thereceive buffer andtheamountof datain thereceive buffer still to
beread.
VLAN Virtual LAN. A setof network nodesconfiguredin sucha way that they form a LAN
in a logical way. Thisassociation meansnodes in thisLAN cancommunicatebetween themselves
but have to go through a router to communicate with nodesoutsidethis LAN. This improve man-
agement, security andperformanceby limiting certaintraffic from certain partsof thenetwork.

Appendix B
MESH Overview
203

204 Chapter B. MESHOverview
MESH (MEssaging and ScHeduling) hasbeendeveloped specifically with the aim of min-
imising communications andscheduling overheads.Therelationshipsof MESH andother Linux
userapplications is illustratedin Figure4.2. From the point of view of the Linux OS,MESH is
just another userapplication: MESHapplications canbewritten on top of theMESH. Scheduling
between MESH applicationsis handledby theMESHscheduler. Unlike theother protocolsshown
in Figure4.2,MESHallowsuserspaceaccessto theunderlying Ethernethardwarewithout theuse
of sockets or via any kernel functions.
In reducing overheadsto increaseperformance,MESHusesthefollowing techniques;Ê Avoid operating system calls and context switches. As illustratedin Figure 4.2, MESH
communications bypass theOSkernel anddirectly accesstheNIC hardware. In combina-
tion with tailoredNIC drivers,thismakethetransmissionandreception of packetslessCPU
intensive.Ê Avoid memory to memorycopies: MESH uses zero copy communication which means
oncedatais put into hostmemoryfrom theNIC, it is not copiedbeforebeing handedto the
MESHapplication.Ê Minimise interrupts: By usingit own userlevel drivers, MESH avoids costlyOSinterrupts
which would occur on sending and receiving of a packet. MESH usesa polling system
to detect the arrival of packets,alsoknown asan “external event”. It is up to the MESH
application programmerto explicitly insert poll statements in his code to enable context
switching to be performed. Polling for an external event is donein local memoryrather
than across the PCI bus. A memoryareais updated by the NIC via a DMA when data
arrives.Ê ImplementlightweightprotocolsandasimpleAPI: MESH doesnot implementflow control
andpacketsequenceintegrity, but it is ableto usethatsuppliedby theunderlying protocol,in
thiscase,Ethernet. MESHusesMESHportsasthelogical communication endpoints. Each
MESH port is uniquesystem wide, i.e. a MESH port belongsto a single node within the
wholenetwork but a nodecanbeassignedmultiple MESHports. In anEthernet frame,the
first four bytesof dataarereservedfor MESHportsnumbers. Two bytesfor thedestination
andtwo bytesfor thesourceport.
MESH operation
FigureB.1showsthetransmitandreceivecyclesof MESH. EachMESHport is assignedanumber
of buffers collectively known as a pool. There is a transmit and a receive pool. The MESH

205
interfaceto the NIC is via two queues, a transmit and a receive queue. Thesequeues contain
descriptors. Eachdescriptor hasthe physical memoryaddress of the packet and its length. A
MESHapplicationtransmitsapacket by first obtainingabuffer from thetransmitpool andadding
thedescriptor to thetransmit queue. MESH removespacket descriptors which have beenmarked
“read” by theNIC from thetransmit queue.
At thereceiver, in orderto avoid non-transientoverloadingin thenetwork MESHusesselective
discard. On arrival of a packet for a particular port, if the port hasa free buffer available in its
receivepool, i.e. thepool is not full, thenthedescriptor pointing to thereceivedpacket is addedto
theport’s receivequeueanda descriptor pointing to anemptybuffer takenfrom thereceiveport’s
pool. Otherwisethepacket is discarded.This discardavoids network overloadingbecauseit frees
up thehostmemoryto receive moreincoming packetsfor other MESHapplications.
Thread Pool
NIC (In transmit queue) NIC (In receive queue)
Pool
Port (In receive queue)
Thread
Communication of a packetover the network
After transmission’read’ packets arereturned to pool If pool empty;
selective discard
If pool not emptyadd full buffer toport’s receive queueand add empty bufferto NIC’s receive queue
Transmit cycle Receive cycle
Application initiated buffer transition
MESH initiated buffer transition
Add descriptor totransmit queue
Buffer obtainedfrom pool and filled with
data
Empty bufferreturned to pool
Applicationreceives packet
FigureB.1: Thetransmit andreceive cycles in MESH(Source: Boosten[10])
MESH has its own user level scheduler which handles context switching between MESH
threads without invoking kernel functions. MESH threadsexists completely within the address
space of a MESH process. The disadvantage with this scheduling system is that MESH canbe
descheduled by the OS scheduler. If this happens,noneof the MESH user threads will run. To
minimisethis, it is importantto run only oneMESHprocesson eachhostandalsoensure thatno
other softwareis running excepttheOS.It is alsoadvisablethatnoblocking system callsareused
in theMESHapplicationsince this will alsoblock theMESHprocess.
When switching betweenthreads,the MESH scheduler minimisesthe time by saving only
the registersthat are in useby the thread at the momentof the context switch asopposedto all
registers which is commonly donein traditional context switches. The context switch time is

206 Chapter B. MESHOverview
reducedfurther by changing thecontext switchfunction into anin-line function. Eachinvocation
of anin-line function is expandedinto anumber of in-linemachine instructions. Boosten[10] has
shown thatchanging thecontext switchfrom aC function call to anin-lineC function reducesthe
context switchtime from 98 nsto 55 ns.A factor 1.8.
MESH wasdevelopedunder Linux OS. It hascurrently support for two types of NICs: the
FastEthernetNIC Intel EtherExpressPro 100 with the i82558 andi82559 chipsandthe Alteon
ACENICGigabitEthernetNIC. TheACENIC is alsosoldasthetheNetgearGA620.

Appendix C
The architectureof a contemporary
Ethernet switch
207

208 Chapter C. Thearchitecture of a contemporary Ethernet switch
C.1 Intr oduction
The switch we studied in detail, the Turboswitch 2000 from Netwiz, is able to host 10 Mbit/s
Ethernet modules, Hub modules, FastEthernetmodulesandGigabitEthernet modules. TheTur-
boswitch 2000haseight FastEthernet modules. Therefore we concentrateon the FastEthernet
setup.
TheFastEthernet modulescanonly operate in storeandforwardmode.Eachmodulehasfour
FastEthernet ports. A single moduleresidesin a chassis slot.
Theswitcharchitecture is shownin FigureC.1. Within theswitch, thereis a CPUmodule, aÒ�Ó�ÔÖÕ×Ò�Ó�Ô
matrix module, a contentaddressable memory(CAM) logic moduleandI/O modules
asshown in FigureC.1.A PCwhich runstheswitchmanagementsoftwarecanbeusedto manage
the switch. It is connectedvia oneof the I/O ports. The role of each of the modules is setout
below.
128X128Matrix module
I/OModules
CPU
CAM/LogicModule
RequestGrant
RequestGrant
24-bit @ 20MHz Switch bus
30-bit @ 10 MHz Control bus
8
8
Managing PC
Switch
FigureC.1: Thearchitecture of theTurboswitch 2000.
C.2 The CPU module
TheCPUcarries out thefoll owing functions:
Ø Spanning tree:RunningtheSpanning Treealgorithm.
Ø Learning: This is essentially the updating the CAM or forwarding table. The CAM table
update happenson two occasions:

C.2TheCPUmodule 209
1. Whenhandling frameswith Unknown address. If a framesarriveson theswitchport
with an unknown source address,thenthe frameis forwardedto the CPU.The CPU
thenaddsa new entry into the CAM table and the frame is discarded. The vendor
claims that this discard is not detrimentalto userdataflow because the first frames
sentby a nodetendsto be an ARP (Address Resolution Protocol. Usedby nodesto
translateIP addressesto Ethernet addresses. SeeSection ??).
2. Whena nodeis movedfrom oneswitchport to another. This is commonlyreferredas
”hotswap” becauseit is donewhile theswitch is operating. By examining thesource
addressof the framestransmittedby the node, the switch canautomatically identify
whena nodemoves(only afterthenode first transmits a packet) andupdate theCAM
tableaccordingly.
Ù Management: Handling requests from a management PC to configure the switch. The
SNMPprotocol is used. SeeSection3.5.6.
Ù IP/Layer3 switching: As mentionedin Section3.5.5,differentvendors implement Layer3
switching in differentways.Theimplementation in theTurboswitch 2000 is anAddressres-
olution protocol (ARP).ARPsarebroadcast packetsexchangedbetweenhostsrunningIP. It
is usedto translatea remoteIP addressto thecorrect Ethernet addresssuchthat subsequent
packet canbeaddressedwith thetranslatedunicast address.Thebroadcastis recognisedby
the target IP host which responds.SwitchA builds up an IP andEthernet database(either
manually by theuser or examining incoming IP packets)andis ableto respond to ARPs in
orderto avoid sending broadcasts.
Ù VLA Ns: WhenVLAN s aresetup, all broadcasts arefiltered by the CPUaccording to the
VLA N. VLAN s canbesetup according to the switch ports, the Ethernetaddressor the IP
addressof packets.Note,this is not theIEEE802.1Q compliant.
Ù H/W initialisation: TheCPUiniti alisestheCAM/logic module, thematrix module andI/O
moduleson power up.
Ù Fault Recovery: The CPU continuously monitors eachswitch port. Shoulda fault be de-
tectedon a port, theport is restarted.
Ù Redundancy of Systemboards: Multiple matrix modulescould be inserted. In caseone
fails, theCPUcandetect thefailure,disablethefailedmodule andenable thebackup.
Ù Interfacewith LocalDisplay: Theswitchhasa localdisplay onwhich limited configuration
canbedone.

210 Chapter C. Thearchitecture of a contemporary Ethernet switch
From To VLAN Control bits
8-bits 8-bits 7-bits 7-bits
FigureC.2: Theformat of thecontrol packet from theCAM/logic module
The CPU runsthe DOS operating system. The CAM/logic module connects to the CPUby
a control bus. The CPU hasa 24-bit bus running at 10MHz, connecting it to the CAM module
(seeFigureC.1)andtwo dedicatedmatrix links. Theselinks andconnectionsareusedto send and
receive datato theI/O moduleports.
C.3 The CAM and Logic module
The CAM/logic module is responsible for taking switching requests,queueing up framesand
setting up andreleasingconnections in thematrix module.
Along the 24-bit bus leading to the CAM, thereare two lines per I/O module. One is the
switching requestline, theother thegrant line. Therequestandgrant linesalsoconnectto theI/O
modules andCPU.Thearbitration mechanism for switching requestsis round robin i.e. eachof
theI/O moduleandtheCPUaresequentially checkedfor a switching request.
Oncea switching requesthasbeengranted, the bus is usedto transfer the source anddesti-
nation addresseson which the CAM makes it switching decisions. The bus takestwo cycles to
transfer a 48 bit Ethernet address.
The decisions on which matrix links to useandwhen to switch aresentby the CAM/logic
moduleon the control bus to the matrix. Filtering informationbased on VLANs andsubnets is
also sentvia this bus to the I/O modules. The control bus is 30 bit wide and runs at 10MHz.
Dataon this control bushastheformatshown in FigureC.2. The‘From’ field hastheCAM/logic
moduleencodedin it. The ‘To’ field is used to distinguish who the control datais aimedat; the
CPU,theI/O moduleor thematrix module. TheVLAN field containsVLAN information andthe
Control bits field holdscontrol information. Theconnectionssetup in thematrix module by the
CAM/logic module ensuresthat the appropriateframesarrive at the right I/O module. Fromthe
I/O module, theframeis forwardedto theappropriateoutput port.

C.3TheCAM andLogic module 211
Therearefive FIFO queues implementedin theCAM for eachI/O module.Onequeueis the
uplink to thematrixmodule. Theotherfour queuesarefor thetransmitdirection of theI/O module
ports, onequeue per port. All framesentering the switch arerepresentedby pointersinside the
CAM/logic module. It is thesepointerswhich arequeued. The CAM/logic modulesetsup and
releasesconnections in thematrix modulevia theControl Bus. Thedecisionson which frameto
queue first is madeon a roundrobin basis.
TheCAM holdstheMAC addressesof theconnectednodes andtheir associatedswitchports.
It alsoholds a valueindicatingthe VLA N eachswitch port belongsto. It canstoreup to 64000
addresses.PermanentMAC addresses(nodesthatwill bepermanently attachedto theswitchvia
a uniqueswitchport) canbeprogrammedinto theswitchvia themanaging PC.
Theswitchcanoperatesin two modes,LAN andDTE.LAN modeimpliesthatoneachswitch
port, therecanbeoneor morenodes.In LAN modeit is possible to move nodesto differentports
of theswitchandtheswitchwill automatically learnthem. In DTE modehowever, it is assumed
that thereis always only onenodeon theport andthe nodedoesn’t change ports. Consequently,
framesarriving on ports set to LAN moderequire threeaccesses to the CAM when switching
via the matrix andtwo whenswitching in the sameI/O module. Framesarriving on portssetto
DTE moderequire only two accesseswhenbeing switched via the matrix andoneaccess when
switching in thesameI/O module. Theextra access in LAN modeis usedto check if a node has
changedportsby checking thesourceaddressesof thereceivedframes.Theother accessesarefor
locating thedestinationport. DTE modeis equivalentto thestatic entriesin theforwarding table,
except thattheswitchmakestheentries automatically basedon thefirst packet transmitted.
The CAM cansupport 10 million accessesper second. With a framesize of 64 bytes, the
maximumnumberof framespersecondfor aFastEthernetlink is 148800. A switchof 60Ethernet
portscangenerateÚ0ÛnÜ�Ü�Ý�ÝßÞAà�ÝßÞAáÄâäãÂå£æwÞçÚ�Ý0è accessespersecondfor LAN portsand Ú0ÛnÜ�Ü�Ý�Ý�Þà�ÝéÞêãëâìÚ�å�íiÞ©Ú�Ý�è accessespersecond for DTE ports.
Thenumber 60in theabovecalculationscorrespondsto themaximumnumberof FastEthernet
ports on the switch (given a maximumof 15 fastEthernetmodulesandfour portsper module).
This meanstheCAM cannever besaturated.

212 Chapter C. Thearchitecture of a contemporary Ethernet switch
C.4 The Matrix Module
Thematrix modulehasa 128Þ 128 non-blocking matrix. Eachmatrix link runsat 40 Mbit/s. The
actual dataratepermatrix link is 32Mbit/s dueto theuseof two control bits every eightdatabits.
Note that the control bits areadded only in the physical matrix links, andnot while the frames
arein memory. Eachof the I/O modules have eight matrix links going in andeight matrix links
going out of it. This implies that whenall four moduleportsarecommunicating via the matrix,
themaximumdataratethatcanbeachievedis ÜÄÞîá�ã Mbit/s âìã�ï�à Mbit/s in half duplex mode.
The matrix links arenot fixed to any particular port. Eachport canaccess any of the links and
multiple links at a time.
The switch backplanecansupport an aggregatebandwidth of 5.12Gigabit per second. This
5.12Gigabit per second backplaneis calculated according to the numberof links on the matrix
(128) andeachlink supporting adatarateof 40Mbit/s. In fact, oneof thematrix links is dedicated
for useby theCPUto handlebroadcast. Two matrix linksarededicatedto theCPUfor transmitting
data. All I/O moduleshave accessto thebroadcastlink. Also, with 15 FastEthernetmodules and
eight links perport, thereare Ú�ï�ÞëÜëâðÚ�ã�Ý links usedfor unicasttraffic. At anactualuserdatarate
of 32 Mbit/s, this meansthe backplane usable for userdata transfer is Ú�ã�ÝñÞ¦á�ãñâòáÂå�Ü3Û Gigabit
persecond, excluding broadcasts.
C.5 The I/O modules
FigureC.3shows two FastEthernet I/O modulesconnected to thematrix module.TheMAC used
in eachof the FastEthernetI/O modules is the SEEQ84C300A FastEthernet controller. This
hasfour MACsperchip, therefore onechip on each four port FastEthernetmodule. As shown in
FigureC.3,each MAC has128byteinput buffer and128byteoutput buffer.
The MAC chip hasa 32-bit wide bus interfaceto the commonbuffer, running at 33MHz.
BetweenthecommonbufferandtheFIFOleading to thematrix link, thissamebusrunsat66MHz.
Theallocationof thisbusto theportsis doneonaround robinbasisto ensurefair arbitration. Each
port cantransfer128bytesbeforethenext port hasaccessto thebus. If certain portshavenothing
to send,thentheir time slot is givento thebusy ports.
At 100 Mbit/s, we have 200 Mbit/s on each ports in full duplex mode. That meansÛ©Þã�Ý�Ýóâ�Ü�Ý�Ý Mbits/s maximumdatarateper FastEthernet module. The speedof the 32-bit bus
is 33 MHz from the MAC to the commonbuffer. That meansit can transfer á�ãêÞ×á�á©âôÚ�Ý7ï�à

C.6Theswitchoperation 213
Mbits/s. Thetime it takesto transfer 128bytesis õ�Ú�ã�ÜçÞ(Ü7ö,÷ÂÚ�Ý7ï�àÖÞóÚ�Ý è âøÝ�å�í7æù s. In theworst
casescenario, the bus hasto transfer seven setsof 128 byte buffers before servicing the eighth.
This will take æñÞ×Ý�å�í7æù sâúàÂå£æ�í3ù s. Running at 100 Mbit/s, to fill a 128 byte buffer will take
õ�Ú�ã�Ü(Þ¢Ü7ö,÷ÂÚ�Ý�ݦÞûÚ�Ý�è¦âüÚ�Ý�å�ã3Û�ù s. This calculation illustratesthat the 32-bit bus is more than
adequateto deal with thetransfersfrom theMAC.
Also attachedto the32-bit busis theframebuffer. Eachport on theFastEthernet module has
aprivatebuffer of 32kbytesfor reception. 128kbytesof shared buffer is availablefor all portsper
modulein bothsend andreceive directions. Thetotal buffer sizeis á�ã k Þ;ÛëýþÚ�ã�Ü k âÿã�ï�à kbytes
per I/O module(i.e. per four ports). Whena framearrives,it is first put into theshared buffer. If
thesharedbuffer becomes full, thentheprivatebuffers areused to receive. This implementation
allows flow control to be managed on a per port basis. The privatebuffers arenot usedin the
transmit direction. In thebuffer space,eachframeoccupies2048bytes no matterwhat theframe
size.
As the arrival of more framesstarts filling up the privatebuffer space, the logic on the I/O
modulechecks whetherthe space available in the private buffers areacan take more than five
frames(in half duplex mode).If it cannot, it impliesthat theportbuffer is in dangerof overflowing,
sobackpressure is activated. Backpressureis a flow control mechanism to avoid buffer overflow
andconsequently, packet loss. It only work in half duplex modeandis not inter operable with
IEEE802.3x. ThebackpressuremechanismenablestheEthernetpreamble signal on thelink. This
makesthe link appear busy to all nodes attachedto it. Hencethose nodeswill defer transmission
until thelink becomesfree. No flow control is implementedfor full duplex mode.
As mentionedearlier, a FastEthernet modulehaseight links going to thematrix modulesand
eight links coming from the matrix module. Accessto the matrix links are via another set of
buffers. Thematrix linksarenot fixedto any particularport. Theallocation schemeis afirst come
first serve basis. It is theoretically possible to have a singleport using all eight matrix links if its
eight framesarrive before any other port’s. Accessto thematrix links is via the32-bit bus.
C.6 The switch operation
Whena framearriveson a port, it is first sentto the shared buffer via the 32-bit bus andstored.
The cyclic redundancy check (CRC) field is checked as the framecomesin. For FastEthernet
modules, framesfoundto bein errorarediscarded.

214 Chapter C. Thearchitecture of a contemporary Ethernet switch
MAC
MAC
MAC
MAC
Port 0
Port 1
Port 2
Port 3128-bytes
128-bytes
128-bytes
128-bytes
128-bytes
128-bytes
128-bytes
128-bytes
32-bit busBuf. 0
Buf. 1
Buf. 2
Buf. 3
MAC
MAC
MAC
MAC
Port 0
Port 1
Port 2
Port 3128-bytes
128-bytes
128-bytes
128-bytes
128-bytes
128-bytes
128-bytes
128-bytes
32-bit bus
128 k Sharedbuffer space.
common buffer for allfour ports
Buf. 0
Buf. 1
Buf. 2
Buf. 3
SEEQ Quad MAC chip
SEEQ Quad MAC chip
128 k Sharedbuffer space.
Commonbuffer for all
four ports
OUTFIFO
INFIFO
CrossbarBackplane
8 links to matrixEach link runsat 40 Mbit/s
Actual data rateis 32 Mbit/s
bus bus
8 links from matrixEach link runs
at 40 Mbit/sActual data rate
is 32 Mbit/s
Module 1 Module 2
FigureC.3: An illustration of two modules of the Turboswitch 2000andtheir connection to the
backplane. Theshaded areasshow wherepackets canqueuein theswitchwhentransferringfrom
module1 to module 2.
As theframecomesinto thebuffer, assoonasthesourceanddestinationaddressof theframe
areobtained,a look up is madeby theCAM. This look up checks if thedestinationMAC address
canbe found in the CAM andthat the source anddestination addressesarein the sameVLAN
(Virtual LAN). Therearefour possibilitiesat this point;
a. Thesource addressis unknown, sotheframeis forwardedto theCPU.
b. Thesourceanddestination arein differentVLANs sotheframeis discarded.
c. Thedestinationaddressis unknown or it is abroadcastaddress,sotheframeis broadcastwithin
thesender’s VLAN by theCPU.
d. If thesource anddestinationarein thesameVLAN , thentheframeis switched.
For the multicasts andBroadcastscasein (c), the framesareforwardedby the CAM using a
dedicatedmatrix link which reachesall I/O modulesandtheCPU.
EachFast Ethernet modulecontains a filtering table which takes an input from the CAM.
Theseinputsareinformation based on VLAN s andsubnets. TheFastEthernet modules filter for
example, broadcastsbasedon thefiltering tables such that ports allowedto receive thebroadcasts
(i.e. within thesameVLAN or subnet asthesource)receive it.
In case(d) wheretheframeis switched, therearetwo possible waysin which theframecanbe
switched. Oneis switching on thesameI/O module andtheotheris via thematrix. This depends

C.7Frameordering 215
on which port thedestinationMAC canbefound.
Switchingon the sameI/O module. Whenthe destination port canbe found on the sameI/O
module,theframeis queuedto besent aftertheCAM lookup. If theframecanbeswitched,
it is switchedvia the32 bit buson theI/O module(seeFigure2.3) to thedestination port.
Switchingvia thematrix module. Theframeis switchedvia thematrix moduleif thesourceport
andthedestinationportsareondifferentFastEthernet I/O modules.Onreceiving thewhole
framefrom the source port into the buffer, the frameis queued by the CAM in the matrix
uplink queue. If theframecanbeswitched,it is switchedto therelevant I/O module. In this
I/O module,asecondCAM lookupis performedto obtain thedestinationportandtheframe
is queued by the CAM. Whenthe framecanbe switched, it is switched to the destination
port. Essentially, oncetheframehaspassed thematrix, thetreatmentof theframeis exactly
thesameasswitching on thesameI/O module.
In both cases (switching via the matrix andon the sameI/O module), if learning is invoked,
thereis anotherlookup in theCAM tableto seewhether thesourceaddressandportnumbermatch
thatstored in theCAM. If thesedonotmatch,thentheCAM is updated.A simplifiedflow diagram
illustrating theoperation of theswitchis shownin FigureC.4.
C.7 Frame ordering
Framesareswitchedaccording to thetime they start arriving anddoes not depend on framesize.
Thefollowing is anexampleof a scenario within theswitchandtheresult.
A large framearriveson an input port foll owedby small frame. Their relative sizes aresuch
thatif they arebeingswitchedthroughthematrix, thesecond(small) framewill arriveontheother
sidecompletely beforethefirst (large) frame.In this case, framesequenceintegrity is maintained.
This is becausethe large framearrivesat the switch port first andstarts to be switched first. It
therefore startsarriving at the switch output port buffer first andhenceis queued to be sent out
first.
At the time of production of the Turboswitch 2000, neither trunking nor VLANs werestan-
dardised. However the manufacturer offered these functionalities via a proprietary implementa-
tion. We are interestedin the implementation of the standard, thereforewe did not investigate
these functionalitiesfurther here.

216 Chapter C. Thearchitecture of a contemporary Ethernet switch
Frame arrives at port.
Is the shared buffer full?
Place in private buffer.
Put frame in shared buffer.
Is the bufferfull?
Is the receiveport in half duplex
mode?
Discard any new frames until
space is available.
Is the bufferspace available <= five
frames in size?
Send Backpressure preamble on input port until
space available > 5 frames
Has the source, destination address and type field arrived?
Receive more of frame
Do CAM lookup. i.e. send source and destination addresses to CAM.
Is the sourceport known?
Is the destinationport known?
Is the source addressand destination address in
the same VLAN?
Forward to CPU
Insert new CAM entry.
Send asbroadcast frame.
Discard Frame
Discard Frame
Are weswitching on different
modules?
Queue frame in matrixuplink queue.
Receive all of frame.
Can the outputI/O module receive frame? .e. is there space
in the output I/O module to receivea frame?
Hold the framein buffer.
Switch frame tooutputmodule buffer.
Look up CAM entryfor the destination port
Queue frame foroutgoing port
Receive all of frame
Is learning invoked? i.e.is the port in LAN mode or is the CAM entry
automatically set?
Look up CAM table and compare frame’s source MACaddress and source port ofswhich on shich the framecame with that stored in CAM. Update if necessary
Can we send to the outputport?
Send to output port
End
Hold the framein buffer.
NoYes
YesNo
Yes
No
Yes
No
No
Yes
No
Yes
No
Yes
No
Yes
Yes
No
No
Yes
No
Yes
No
FigureC.4: A simplifiedflow diagram showing theoperation of theTurboswitch 2000.

C.8Addressagingandpacket lifetime 217
C.8 Addr essagingand packet lifetime
Themaximumtime a packet canspendin theswitch is onesecond. This is known asthepacket
lifetime. After this time,thepacket is discarded. Theabsolutemaximumaccordingto theEthernet
standardsis 4.0seconds.
Addressesin the filtering tablehave an aging time associatedwith them. This is the length
of time an address staysin the filtering table before being discarded. This is 300 seconds, the
recommendeddefault valuein theEthernet standards.Therange is from 10 secondsto 1,000,000
seconds. Attachednodeswhich transmit packets in intervalsof lessthan this time do not have
their addressesremovedfrom thefiltering table.
C.9 Conclusions
In this section, we have presentedthearchitecture of a commodity off-the-shelf Ethernet switch.
Theabove information wascollectedto aidunderstandingof measurementsandmodelling of Eth-
ernet switches.Theinformationcontainedherehasbeenresearchedvia available documentation,
measurementson theswitchandwherenecessarycross checkedwith theswitchvendor.

218 Chapter C. Thearchitecture of a contemporary Ethernet switch

Appendix D
A full description of the parametersfor
modelling switches
219

220 Chapter D. A full description of theparametersfor modelling switches
1. ParameterP1: The length of the input buffer in the module. The length is expressedin
numberof frames. This parameter represents the ability of the switch to buffer frames
at the input. Framesare buffered in the input buffer for a time needed to make routing
decision. Framescontinueto occupy theinput buffer in thecasewherethereis not enough
transfer resourcein theswitchto movetheframefrom theinput modulebuffer to theoutput
modulebuffer. To avoid head-of-li ne blocking the input buffer is managed by the buffer
manager. The buffer manager may implement different policies (suchaspriority queues)
whendeciding which of thewaiting frameswill betransferrednext.
2. ParameterP2: The lengthof the output buffer in the module. The length is expressed in
numberof frames. Thisparameter representstheability of theswitchto buffer framesat the
output. After the framereachesthe destination module it is buffered in the output buffer.
If the destination port is free, the frame is sentout via the attached MAC. The buffer is
controlled by the buffer manager. The buffer managermay implement different policies
whendeciding which of the frameswaiting for the particular port will be transferrednext
(for exampleit canorganisethebuffer into high andlow priority queues).
Very often switches implement a shared buffer for both input andoutput. This results in
a cheaper hardwaredesign andmoreflexibili ty in the module. In suchcasesdemarcation
betweeninput andoutput buffers changesdynamically. This however doesnot affect the
concept of providing buffering resourcesat theinput andoutput. It turnsout that thebuffer
sizeis not too critical a parameter. In anoverloadednetwork, thebuffering will eventually
becomeexhausted.
3. ParameterP3:Themaximumthroughputfor thetraffic passing from themoduleto theback-
planein the inter-module transfers. It is expressedin MBytes/s. This represents resource
themoduleoffersto theframesto getfrom theinput buffer to thebackplane.Whena frame
needsto betransferredfrom theinput buffer it requestsa certain amount of bandwidth (see
parameter P7). If suchrequest,togetherwith other requestsfrom otherframescurrently be-
ing transferred,doesnotexceed themaximumthroughput P3,theframecanstarttransfer. If
parameter P3is equalto parameter P7,it impliesthatonly a single packet canbetransfered
to thebackplaneat any time. P3cannot belessthanP7.
4. ParameterP4: Themaximumthroughput for thetraffic from thebackplaneto themodulein
theinter-module transfers.It is expressedin MBytes/s.In mostswitchesparametersP3and
P4 will have equalvalues. However, there might be cases suchasthe Turboswitch 2000,
wherethesevalues maydiffer.
221
5. ParameterP5: The maximumthroughput for the intra-moduletraffic. It is expressedin
MBytes/s. The traffic concernedis between the input buffer and the output buffer on the
samemodule. It is equivalentto themaximumbandwidth available to all portsin a single
module.We assumethat the intramodulearchitecture is sharedmemory. For switchesnot
implementing a hierarchicalarchitecture, this is equivalentto their backplanethroughput.
6. ParameterP6: The maximumthroughput of the backplane. It is expressedin MBytes/s.
TheparameterP6representsa limitation in thetotal number of simultaneous inter-module
transfers. In someswitches,not all transferswhich could pass the limits represented by P3
andP4will beableto startbecauseof thelimitationsin thebackplanethroughput.
7. ParameterP7: Thebandwidth requiredfor a single frametransfer in theinter-modulecom-
munications. It is expressedin MBytes/s.It represent theamountof bandwidth thathasto
beallocated in theswitch resourcesfor the transfer of a single framefrom the input buffer
in thesource moduleto theoutput buffer in thedestinationmodule.
8. ParameterP8: Thebandwidth required for a single frametransfer in theintra-modulecom-
munications. It is expressedin MBytes/s. It representstheamountof bandwidth thathasto
beallocatedin theswitchresourcesfor a transferof a single framefrom theinput buffer to
theoutput buffer in thesamemodule.
9. ParameterP9: Thefixed overhead in framelatency introducedby the switch for the inter-
moduletransfer. It is expressedin microseconds. It representstime spentby the switch
makingtherouting decisionfor theinter-moduletransfer.
10. ParameterP10: Fixed overheadin frame latency introduced by the switch for the intra-
moduletransfer. It is expressedin microseconds. It representstime spentby the switch
makingtherouting decisionfor theintra-moduletransfer.

222 Chapter D. A full description of theparametersfor modelling switches

Bibliography
[1] ATLAS HLT/DAQ/DCSGroup.March2000. “ATLASHigh-Level Triggers,DAQ andDCS:
Technical Proposal” CERN/LHCC2000-17
[2] ATLAS collaboration. June1998. “ATLAS DAQ, EF, LVL2 andDCS Technical Progress
Report” CERN/LHCC 98-16.
[3] MarcDobsonSeptember1999. “The secondlevel trigger of theATLAS detectorattheLHC”
Ph.D.Thesis.Physicsdepartment.Royal Holloway College.University of London.
[4] Bystricky J. Vermeulen J C. April 2000. “Papermodelling of thte ATLAS level 2 trigger
system” ATLASInternal Note,ATL-COM-DAQ-2000-022.
[5] Gilder G, September 1993. “Metcalfe’s Law and Legacy” Forbes ASAP.
http://www.forbes.com/asap/gilder/telecosm4a.htm
[6] Gigabit Ethernet alliance 1998. “Gigabit Ethernet. Accelerating the standard for speed”.
http://www.gigabit-ethernet.org
[7] IEEE Ethernet standards 802.3,FastEthernet 802.3u, Gigabit Ethernet 802.3z, Full duplex
flow control 802.3x, Ethernetbridgestandard802.3D, Qualityof serviceandVLANs 802.1p,
Trunking 802.3ad.Available from http://standards.ieee.org/
[8] SpurgeonC.E. February2000. “Ethernet: The Definitive guide.” O’Reilly andAssociates.
ISBN 1-56592-660-9
[9] ATLAS HLT/DAQ/DCSGroup.March2000.“Results from theLVL2 pilot project testbeds”
ATLAS internal note, ATL-COM-DAQ-2000-035(2000) CERN/LHCC2000-17
223

224 Chapter D. BIBLIOGRAPHY
[10] M. Boosten. June1999“Fine-Grain ParallelProcessingonacommodityPlatform:aSolution
for the ATLAS SecondLevel Trigger” Ph.D.Thesis. Eindhoven University of Technology.
Draft version.
[11] M. Boosten, R.W. Dobinson, P.D.V. van der Stok 1999. “Fine-Grain Parallel Processing
on CommodityPlatforms” Architectures,LanguagesandTechniques.IOS Press.p263-276.
Editedby B.M. Cook.
[12] M. Boosten, R.W. Dobinson, P.D.V. vanderStok.1999“MESH: MEssagingandScHedul-
ing for Fine-Grain ParallelProcessingonCommodityPlatforms”Proceedingsof theInterna-
tional Conference on Parallel andDistributed Processing TechniquesandApplications.vol
IV. 1999. CSREAPressp1716-1722. Editedby H.R.Arabnia.
[13] M. Boosten,R.W. Dobinson,P.D.V. vanderStok.June1999. “High BandwidthConcurrent
Processingon CommodityPlatforms”IEEEReal-Time 99,SantaFe,U.S.A.
[14] TCP (Transmission Control Protocol). RFC 793. 1981. Available from ftp://ftp.cis.ohio-
state.edu/pub/rfc/
[15] IP (Internetprotocol). RFC7911981. Available from ftp://ftp.cis.ohio-state.edu/pub/rfc/
[16] Bock R, Chantemargue F, Dobinson R, Hauser R. 1995.
“Benchmarking communication systems for trigger applications”
http://atlasinfo.cern.ch/Atlas/documentation/notes/DAQTRIG/note48/ATLAS DAQ 48.ps.Z
[17] NagleJ. 1984. “Congestion Control in IP/TCPInternetworks” RFC 896. ftp://ftp.cis.ohio-
state.edu/pub/rfc/
[18] StevensW. R. 1994. “TCP/IP Illustrated Volume1. Theprotocols” Addison-Wesley. ISBN
0-201-63346-9
[19] ComerD. E. April 1995. “Internetworking With TCP/IP: Principles,Protocols, andArchi-
tecture” PrenticeHall ISBN: 0-132-16987-8
[20] Editor R. Braden 1989. RFC1122 “Requirementsfor Internethostscommunicationlayers”.
Available from ftp://ftp.cis.ohio-state.edu/pub/rfc/
[21] QuinnL. B., Russell R. G. 1997. “FastEthernet” Wiley Computerpublishing. ISBN 0-471-
16998-6

BIBLIOGRAPHY 225
[22] SnellQ. O.,Mikler A. R.,Gustafson J.L. 1998. “NetPIPE:A network protocol Independent
PerformanceEvaluator” http://www.scl.ameslab.gov/netpipe/
[23] F. Saka1998.“A brief Performance comparasonof TCP/IPimplementations on Linux and
Windows NT” A draft versionis availablefrom http://fsaka.home.cern.ch/fsaka/
[24] Rubini A. 1998. ”LINUX DeviceDrivers”O’Reilly andAssociates,inc. ISBN 1-56592-292-
1
[25] BradenR. T. July 1994. “T/TCP - TCPextensionsfor transactions functional specification”
RFC1644
[26] Rochez J.August 1997. “Evaluation of anEthernet 100baseT PCI interfacein a Windows
NT environment”. Atlas DAQ note 56. http://atddoc.cern.ch/Atlas/Notes/056/Notes056-
1.html.
[27] Rochez J.,PrigentD. March1998.”Evaluationof theNbaseNH2032FastEthernetswitch”.
Atlas DAQ note86.http://atddoc.cern.ch/Atlas/Notes/086/Notes086-1.html
[28] M. J. LeVine, F. Saka,R.W. Dobinson, M. Dobson, S. Haas,B. Martin. Oct 2000 “IEEE
802.3 Ethernet, Current StatusandFutureProspects at the LHC” - ATLAS Collaboration.
CERN-OPEN-2000-311.DAQ 2000
[29] DobinsonR W, HaasS, Martin B, Thornley D A, Zhu M. 1998.“The Macrame1024node
switching network” Microprocessor andmicrosystemsvol 21.p511-518. Elsevier.
[30] Poltrack L, “High Performance Gigabit Ethernet NICs: Current status and pos-
sible improvements” November 1998. University of California at Berkeley.
ftp://ftp.netcom.com/pub/se/seifert/advanced-lans/Gignics.pdf
[31] HaasS.1998“The IEEE1355Standard: Development, performanceandapplicationin high
energyphysics”. Ph.D.Thesis.Physicsdepartment.University of Liverpool.
[32] Mills D. October 1996 “Simple Network Time Protocol (SNTP) Version 4 for IPv4,
IPv6 and OSI” RFC 20030 University of Delaware. ftp://ftp.cis.ohio-state.edu/pub/rfc/ or
http://www.faqs.org/rfcs/

226 Chapter D. BIBLIOGRAPHY
[33] R. E. Hughes-Jones, F. Saka“Investigating of the performanceof 100 Mbit and Gigabit
Ethernet componentsusing raw Ethernet frames” March 2000.ATALS internal noteATL-
DAQ-2000-032
[34] K. Korcyl, F. Saka,R. W. Dobinson “Modelling Ethernet networks for theATLAS Level-2
trigger” March2000. ATALS internal noteATL-DAQ-2000-044
[35] K. Korcyl, F. Saka,R. W. Dobinson “Modelling large Ethernet networks using parame-
terisedswitches” August2000. OPNETWORK 2000. To bepulishedon OPNET’s website.
http://www.opnet.com
[36] Details of the Intel EtherExpress pro 100 can be found at
http://support.intel.com/support/network/adapter/pro100/index.htm
[37] Details of the Alteon ACENIC Gigabit Ethernet adapter can be found at
http://www.alteonwebsystems.com/products/adapters.shtml
[38] Details of the Netgear GA620 Gigabit Ethernet adapter can be found at
http://netgear.baynetworks.com/pressroom/990111.shtml
[39] F. Saka “The Ethernet testbed” A draft version is available from
http://fsaka.home.cern.ch/fsaka/
[40] TheTolly group. October 1998 “Intel Corporation: Intel Express550Trouting switch.Fast
Ethernet layer2 switchcompetitive evaluation.” Ref no: 8294http://www.tolly.com
[41] TheTolly group. September 1999 “Alteon WebSysytemsInc: Alteon 180eWebswitchver-
susFoundryNetworks’ ServerIron.TCPsession processingperformanceevaluation via layer
4 switching.” Ref no: 199132 http://www.tolly.com
[42] OPNETmodeler environment- MIL3 inc. 34000International Drive NW, Washington DC
20008,USA. http://www.mil3.com
[43] “The PTOLEMY project”, Department of EECS, UC Berkeley, USA.
http://ptolemy.berkeley.edu
[44] P. Clarke, G. Crone, M. Dobson, R. Hughes-Jones, K. Korcyl, S. WheelerApril 2000
“Ptolemy simulationof theATLAS level-2 trigger” ATL-COM-DAQ-2000-020

BIBLIOGRAPHY 227
[45] F. Saka “Ethernet switch measurements” Various reports are available from
http://fsaka.home.cern.ch/fsaka/eth switches
[46] R.W. Dobinson,F. Saka,S.Haas,K. Korcyl, M.J.LeVine,J.Lokier, B. Martin, C. Meirosu,
K. Vella.Oct 2000“TestingandModeling Ethernet Switchesfor Usein ATLAS High-level
Triggers” ATLAS Collaboration. CERN-OPEN-2000-310.DAQ 2000
[47] K. Korcyl, F. Saka,M. Boosten, R. W. Dobinson. 1999. “Use of modeling to assess the
scalability of Ethernet networks for the ATLAS second level trigger” IEEE Conferenceon
Real-TimeComputer Applications in NuclearParticleandPlasmaPhysics. 11thIEEENPSS
RealTimeConference,SanteFe,NM, USA, 14-18June1999. In: p.318, 1999.
[48] Documentation on the Cisco 6000 series switches can be found at
http://www.cisco.com/univercd/cc/td/doc/product/lan/cat6000/6000hw/inst aug/index.htm
Informationon all Cisco’s productscanbefound atCisco’swebsite.http://www.cisco.com/
[49] CERN ARCHES team. March 1999 “ARCHES Project 20693 Deliverable D2.4.3:
Report on the Performance of Gigabit-Ethernet Frame Transmission” Applica-
tion, Refinement and Consolidation of HIC Exploiting Standards ESPRIT. CERN.
http://cern.ch/haass/arches/d243.pdf