Embed Size (px)
Citation preview
Ethiop. J. Agric. Sci. 31(1) 11-30 (2021)
Coffee Quality Profile Mapping of BenchMaji and
Sheka Zones in Southwestern Ethiopia
Abrar Sualeh1*, Kassaye Tolessa2, Ali Mohammed3, Dawit Alemu4
1EIAR, Jimma Agricultural Research Center, P. O. Box 192, Jimma, Ethiopia. 2EIAR, Food Science & Nutrition Research Directorate, P. O. Box, 2003, Addis Ababa, Ethiopia.
3JimmaUniversity College of Agriculture and Veterinary Medicine, P.O. Box307, Jimma, Ethiopia. 4Bilateral Ethio-Netherlands Effort for Food, Income and Trade (BENEFIT) Partnership;
* Corresponding author [email protected]
አህፅሮት ደቡብ ምዕራብ ኢትዮጵያ የአረቢካ ቡና መገኛና ከፍተኛ የሆነ የቡና ብዝሃ-ሕይወት እንደሚገኝበት ይታወቃል፡፡ ጥራት የቡናን ዋጋ እንዲሁም በቡናው ምርት ላይ ያለውን ጠቀሜታ ይወስናል፡፡ በቤንችማጂና ሸካ ዞን አካባቢ ያለውን የቡና ጥራት ጣዕም ለመገምገምና ከአፈርና ከአካባቢያዊ የአየር ሁኔታ ጋር ያለውን ተዛምዶ ለማጥናት ይህ ሙከራ ተከናውኗል፡፡ ጥናቱ የተከናወነው ነስትድ (Nested) በተባለ ዲዛይን በሶስት ድግግሞሽ ነበር፡፡ ቀበሌዎቹ በወረዳ ውስጥ ነስትድ (Nested) ሆነው የተለያዩ ሶስት የቡና ማሳዎች በአንድ ቀበሌ ውስጥ ለድግግሞሽ ውለዋል፡፡ በአጠቃላይ 162 የቡና ናሙናዎች ተሰብስበው በጅማ የግብርና ምርምር ማዕከል የቡና ጥራት ባለሙያዎች የጥሬና የጣዕም ትንተና ተከናውኗል፡፡ በአብዛኛው የቡናው የጥሬና የጣዕም ባህሪያት በናሙናዎቹ መካከል ከፍተኛ የሆነ ተለያይነት እንዳለ ታውቋል፡፡ የየኪ ወረዳ ቡና የወንፊት መጠኑ ከፍተኛ (97.67) ሲሆን ሜኒትጎልዲያ ወረዳ አነስተኛ (95.33) መሆኑ ተለይቷል፡፡ የመቶ ቡና ፍሬ ክብደትን በሚመለከት የአንድራቻ ወረዳ ከፍተኛ (18.81 gm) እንዲሁም የሸኮ ወረዳ ዝቅተኛ ክብደት (16.20 gm) አሳይቷል፡፡ በጥሬ ቡና ግምገማ ውጤት ሜኒትሻሻ ወረዳ ከፍተኛ (36.53) ሲያገኝ ደቡብ ቤንች አነስተኛ (35.28) ውጤት አግኝቷል፡፡ ከፍተኛ (49.81) የቡና ጣዕም ውጤት በአንድራቻ ወረዳ ሲገኝ በየኪ ወረዳ አነስተኛ (43.33) የሆነ ውጤት ተገኝቷል፡፡ በአጠቃላይ የጥሬና ጣዕም ትንተና አንድራቻ ወረዳ ከፍተኛ ውጤት (86.23) ሲያስመዘግብ የኪ ወረዳ አነስተኛ (78.83) የሆነ ውጤት አግኝቷል፡፡ ከ85.00 በላይ የቡና ናሙናዎች 80.00 ከመቶ በላይ የሆነ አጠቃላይ ጥራትና ጣዕም ውጤት ያገኙት ስለሆነ ስፔሻሊቲ ቡና መሆን እንደሚችሉ ጥናቱ አሳይቷል፡፡ በአጠቃላይ በጥናት የቡና ጣዕም ባህሪያት ያገኙት ከተለያዩ የአፈር ከአካባቢው የአየር ጠባይ ጋር ከፍተኛ ቁርኝት እንዳላቸው ታውቋል፡፡ በተጨማሪ አዲስ የቡና ጣዕም የማር ቃና ያለው ቡና በቤንችማጂና ሸካ ዞን ተገኝቷል፡፡
Abstract
Southwestern part of Ethiopia is believed to be the origin of Arabica coffee which
possesses the country to have the largest diversity in coffee genetic resources. Coffee
quality determines the relative price as well as the usefulness of a given quantity of
coffee. Therefore, the experiment was conducted to evaluate coffee quality of
BenchMaji and Sheka zones (BMSZs) coffee producing areas and its correlation with
soil and environmental variables. The experiment was laid out in Nested design with
three replications. Kebeles were nested in each district and three farms in each
Kebele were used as replication. One hundred sixty two coffee samples were
collected and evaluated for green bean physical and cup quality traits by
professional certified coffee tasters at the Jimma Agricultural Research Center,
Ethiopia. Coffee physical quality (screen size, hundred bean weight, shape & make,
color and total raw quality); cup quality attributes (aromatic intensity, aromatic
quality, acidity, astringency, bitterness, body, flavor and overall cup quality) and
total cup and total coffee quality were highly significant (P ≤ 0.01). The Maximum
mean value for screen size was recorded for Yeki (97.67) and the minimum was
recorded for Menitgoldiya (95.33). Maximum mean value for hundred bean weight
Coffee quality profile mapping of BenchMaji and Sheka zones [12]
was recorded for Anderacha (18.81gm) and the minimum (16.20 gm) was recorded
for Sheko district. Similarly, the maximum total raw quality was recorded at
Menitshasha (36.53) whereas the minimum was scored in SouthBench (35.28).
Anderacha district had got maximum value (49.81) of total cup quality and minimum
value (43.33) was achieved at Yeki district. Based on total coffee quality result
Anderacha reveled maximum value (86.23) and minimum value 78.83 recorded at
Yeki district. More than Eighty five percent (85%) evaluated coffee samples scored
80 points and above mean value of total coffee quality qualifying them as specialty
coffee. Generally this study showed the presence of variation for coffee quality
attributes and statistically significant correlations of coffee quality with soil and
environmental factors. In addition, the results revealed that the existence of unique
honey flavor.
Keywords: Arabica coffee, District, Cup quality, Honey flavor and Raw quality.
Introduction
Coffee is one of the leading marketable commodities next to oil in world market.
Commercial coffee production relies mainly on two related species, Arabica
coffee (Coffea arabica L.) and Robusta coffee (Coffea canephora P.) (Lashermes
et al., 2011). Arabica coffee contributes more than 65% of world’s coffee supply
(Anthony et al., 2002; Vieira, 2006). It is originated from southwestern part of
Ethiopia; the country hosts the largest diversity in coffee genetic resources
(Mayne et al., 2002; Girma, 2003). Ethiopia produces large volumes of coffee
every year, with 441,000 metric tons in 2018/19 alone (Abu and Rachel, 2020).
Ethiopia is the 3rd
largest Arabica coffee producer after Brazil and Colombia
(ICO, 2015).
Vast agro-ecology and genetic variability in Ethiopia creates opportunity to have
different distinct coffee quality characters. Even though Ethiopia is known for its
coffee quality in world market for its unique flavor; it has not benefited from the
enormous potential of its specialty coffees as expected. Presence of considerable
variation in raw and cup quality characteristics among Arabica coffee due to
genetic were reported (Yigzaw et al., 2008; Behailu et al., 2008; Abeyot et al.,
2011; Olika et al., 2011).
Profitability dominantly depends on the price of the coffee, which is determined
by the coffee quality, as the consumer market increasingly demands a range of
high quality flavor profiles. Coffee production is important to the Ethiopian
economy (Abu and Teddy, 2015). For instance over millions of the farming
households and about 25% of the total population of the country are dependent on
coffee directly or indirectly deriving their livelihoods.
Abrar et al., [13]
Good quality coffee production in specific areas characterized by their climatic
conditions, clearly showed that climate is one of the important determining factors
in coffee beverage quality (Silva et al., 2005). Variable coffee growing
environments in Ethiopia has a variety of characteristics sought in the
international market. The country has favourable atmosphere for the production of
different quality type that one cannot find elsewhere. So different unique flavour
type like spicy for Sidama, flora for Yirgacheffe, mocha for Harerghe in the same
way Limu, and Wollega coffee growing area are known with winy and fruity
flavours respectively in the market.
Though Ethiopia has favourable conditions for production of quality Arabica
coffee and coffee types with unique flavour and taste; the potential has been
affected by climatic change, adulteration during processing out of the origin and
also improper post-harvest processing techniques employed by some producers
(Behailu et al., 2008; Berhanu et al., 2015). No effort has been made so far to
determine quality profile of other coffee growing areas even if having distinct
nature and large amount coffee production. For, instance in southwest Ethiopia
coffee quality of BenchMaji and Sheka zones (BMSZs) is not well identified.
Coffee production of BenchMaji zone represents about 12.6% of SNNPR and
4.4% of Ethiopia’s total output (Dessalegn and Solomon, 2014). But coffee from
south western parts especially BMSZs are mostly inferior quality having off
flavored cups, bad appearance, many defective beans and so on (Nigussie et al.,
2007). Furthermore, cup evaluation result shows unclean which are not free from
musty, earthy and chemical taste which alters and influences the balance of
acidity, body and flavor. This type of inferior quality comes from improper
processing techniques. The need for proper processing of coffee and demarcating
distinct coffee types by origin should therefore be taken seriously. Much work has
not been done to quality profile mapping of BMSZs coffee with special emphasis
on biochemical properties in addition to raw and cup quality assessment.
Though inherent coffee quality is influenced by genotype and agronomic
practices, the main factors that influence coffee quality are postharvest and
environmental variations. For instance BenchMaji coffee quality deteriorates due
to critical problem of harvesting and post-harvest practices (Dessalegn and
Solomon, 2014). The distinct coffee quality profile of BMSZs is not identified yet,
though it was confirmed that low in quality. The absence of information on
BMSZs coffee quality profile was major challenge that needs attention. So
systematic studies associated with recommended coffee processing method for
BMSZs is more important. Therefore, the present study was proposed to evaluate
coffee quality characteristics and its correlation with some soil and environmental
variables of BMSZs in southwest Ethiopia.
Coffee quality profile mapping of BenchMaji and Sheka zones [14]
Materials and Methods
Description of the study area The study was conducted in selected coffee producing districts of BenchMaji and
Sheka zones in Southwest Ethiopia. BenchMaji lies between 5°33’ and 7°21’ N
latitude and 34°38’and 36°14’ E longitude with an elevation ranging from 800 to
2500 meters above sea level (masl). Sheka Zone lies between 7°24’and7°52’ N
latitude and 35°13’and35°35’ E longitude with an altitudinal range of the areas in
the Zone falls between 900 and 2700 masl.
Experimental design and sampling technique The experiment was laid out in Nested design with three replications. Kebeles
were nested in each district and three farms in each kebele were used as
replication. Multi-stage sampling procedures were applied. In the first stage nine
high coffee producing districts, seven from BenchMaji (NorthBench, SouthBench,
Guraferda, Sheko, ShyBench, Menitshasha & Menitgoldiya) and two from Sheka
(Yeki & Anderacha) zones, were selected using purposive sampling technique. In
the second stage, six kebeles from each district were selected purposively based
on potential of coffee production.
Experimental Procedures Coffee sample preparation
From each selected coffee farm/field six kilograms of red mature coffee cherries
were harvested during the main harvesting season. After coffee samples were
collected based on farmers practices, unripe green berries, over mature cherries,
dry cherries and other foreign materials were sorted out before pulping. At the
spot of each kebele (farm) altitude, longitudinal and latitudinal positions were
recorded using GPS. Soil samples were also collected from each coffee farm at 20
cm depth by excluding the top part using auger. Red fresh cherries were prepared
in wet method of (pulping, fermentation and drying) coffee processing (Behailu et
al., 2008). Wet parchment coffee samples were dried to the moisture content (MC)
of 10.5-11.0% for all samples uniformly. Dry parchment coffee samples were
hulled and hand polished to remove the parchment and silver skins from green
coffee. Finally, 300 g of green coffee per sample were ready for physical and cup
quality analysis.
Physical coffee quality analysis
The weight of randomly selected 100 beans weight (HBW) for each sample was
measured using a sensitive balance. A green coffee bean sample weighing 100 g
was used for a raw evaluation test before roasting. Bulk density of green coffee
(BDGC), Bulk density of roasted coffee (BDRC), percent weight loss upon roast
(%RWL) and percent volume change after roast (%RVC) were recorded using Eq.
Abrar et al., [15]
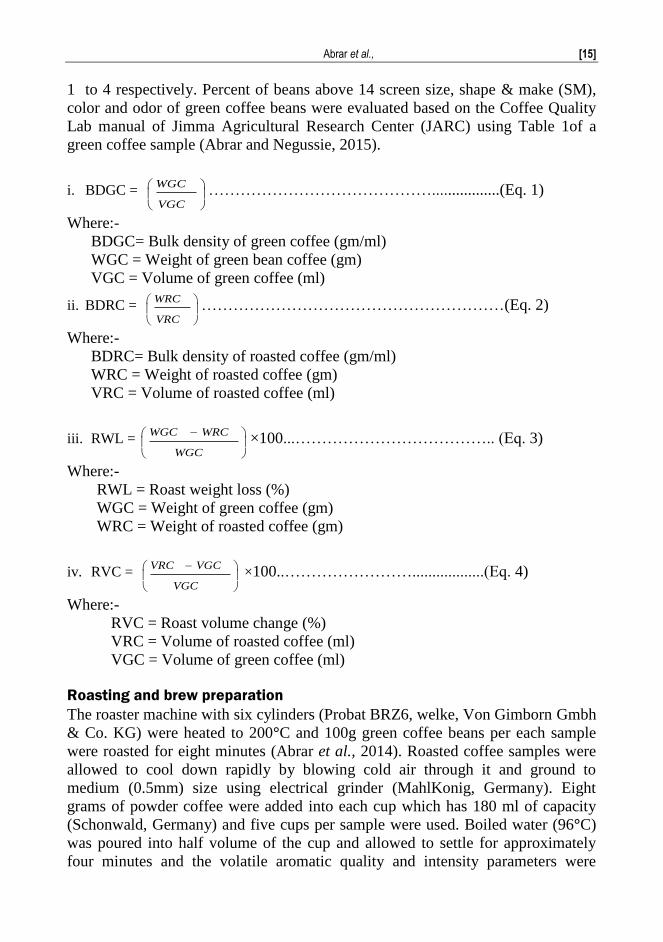
1 to 4 respectively. Percent of beans above 14 screen size, shape & make (SM),
color and odor of green coffee beans were evaluated based on the Coffee Quality
Lab manual of Jimma Agricultural Research Center (JARC) using Table 1of a
green coffee sample (Abrar and Negussie, 2015).
i. BDGC =
VGC
WGC…………………………………….................(Eq. 1)
Where:-
BDGC= Bulk density of green coffee (gm/ml)
WGC = Weight of green bean coffee (gm)
VGC = Volume of green coffee (ml)
ii. BDRC =
VRC
WRC…………………………………………………(Eq. 2)
Where:-
BDRC= Bulk density of roasted coffee (gm/ml)
WRC = Weight of roasted coffee (gm)
VRC = Volume of roasted coffee (ml)
iii. RWL =
WGC
WRCWGC×100...……………………………….. (Eq. 3)
Where:-
RWL = Roast weight loss (%)
WGC = Weight of green coffee (gm)
WRC = Weight of roasted coffee (gm)
iv. RVC =
VGC
VGCVRC ×100..……………………..................(Eq. 4)
Where:-
RVC = Roast volume change (%)
VRC = Volume of roasted coffee (ml)
VGC = Volume of green coffee (ml)
Roasting and brew preparation
The roaster machine with six cylinders (Probat BRZ6, welke, Von Gimborn Gmbh
& Co. KG) were heated to 200°C and 100g green coffee beans per each sample
were roasted for eight minutes (Abrar et al., 2014). Roasted coffee samples were
allowed to cool down rapidly by blowing cold air through it and ground to
medium (0.5mm) size using electrical grinder (MahlKonig, Germany). Eight
grams of powder coffee were added into each cup which has 180 ml of capacity
(Schonwald, Germany) and five cups per sample were used. Boiled water (96°C)
was poured into half volume of the cup and allowed to settle for approximately
four minutes and the volatile aromatic quality and intensity parameters were
Coffee quality profile mapping of BenchMaji and Sheka zones [16]
recorded by sniffing. Then, the cups were filled to the full volume and left to settle
floaters. Finally the surface of the beverage was skimmed off to remove foams and
make ready for tasting by panelists.
Cup quality analysis
Coffee cup quality was evaluated at palatable temperature (60oC) by a team of
three certified Q-grader cuppers following the procedure of coffee quality lab
manual of JARC (Abrar and Negussie, 2015). Data were collected on Aromatic
intensity (AI), aromatic quality (AQ), acidity , astringency(AS), body,
bitterness(BI), flavors, overall quality (OAQ) and also typicity/descriptor (Winy,
fruity, flora, mocha, spicy and others). AI, AQ, AS and BI were evaluated 0 to 5
scales; while acidity, body, flavor and OAQ were assessed at 0 to 10 scales (Table
4). Then after panelists gave their free judgment of blind testing, the average point
(of the panelists) was used for statistical analysis.
Moreover, to determine soils chemical properties, soil samples were air-dried in
the laboratory, crushed and then sieved to 2 mm. The pH of soil sample was
determined with 1:2.5 (Soil: Water suspension) and measured with a digital pH
meter. Exchangeable acidity was extracted with 1M KCl. Exchangeable acidity
was extracted with 1M KCl, followed by the quantification of Al and H by
titration. Organic Carbon was determined by potassium dichromate oxidation
method (Walkley and black, 1934). Total nitrogen (TN) was measured using the
Kjeldahl method (Jackson, 1958). Available Phosphorus was determined by Bray
II Method followed by quantification in a UV-vis spectrophotometer (Bray and
Kurtz, 1945) at the laboratory of JARC.
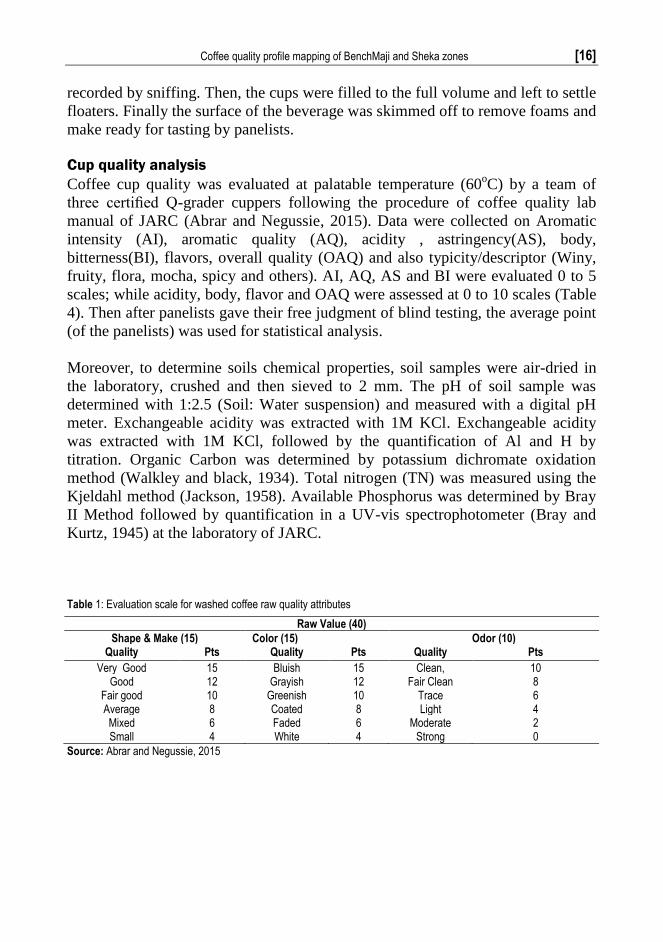
Table 1: Evaluation scale for washed coffee raw quality attributes
Source: Abrar and Negussie, 2015
Raw Value (40)
Shape & Make (15) Color (15) Odor (10) Quality Pts Quality Pts Quality Pts
Very Good 15 Bluish 15 Clean, 10 Good 12 Grayish 12 Fair Clean 8
Fair good 10 Greenish 10 Trace 6 Average 8 Coated 8 Light 4 Mixed 6 Faded 6 Moderate 2 Small 4 White 4 Strong 0
Abrar et al., [17]
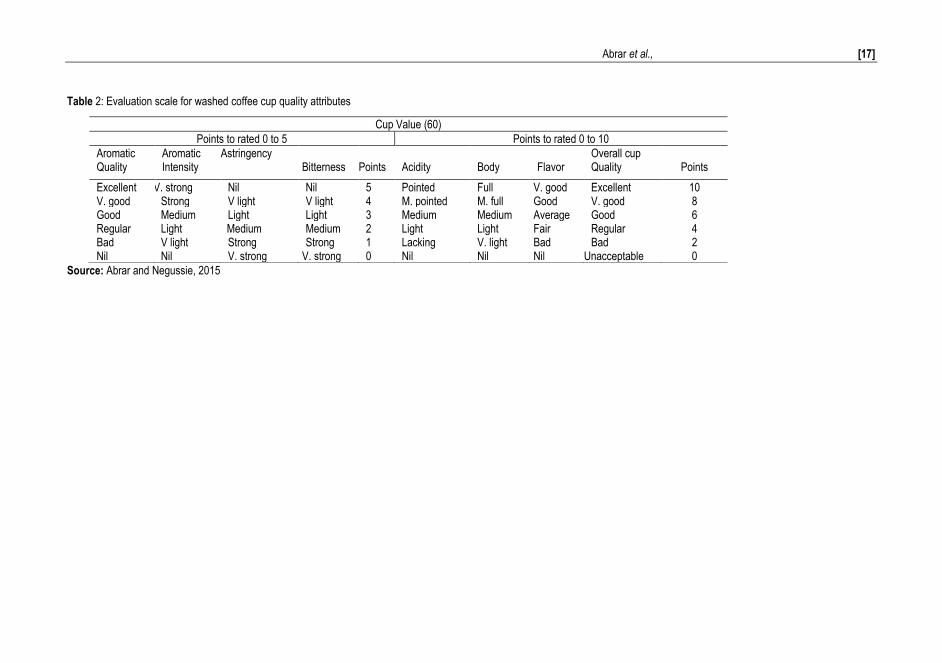
Table 2: Evaluation scale for washed coffee cup quality attributes
Source: Abrar and Negussie, 2015
Cup Value (60)
Points to rated 0 to 5 Points to rated 0 to 10
Aromatic Quality
Aromatic Intensity
Astringency Bitterness
Points
Acidity
Body
Flavor
Overall cup Quality
Points
Excellent V. strong Nil Nil 5 Pointed Full V. good Excellent 10 V. good Strong V light V light 4 M. pointed M. full Good V. good 8 Good Medium Light Light 3 Medium Medium Average Good 6 Regular Light Medium Medium 2 Light Light Fair Regular 4 Bad V light Strong Strong 1 Lacking V. light Bad Bad 2 Nil Nil V. strong V. strong 0 Nil Nil Nil Unacceptable 0
Coffee quality profile mapping of BenchMaji and Sheka zones [18]
Data analysis
Analysis of variance was computed for each quality parameter using statistical
analysis system software version 9.3 (SAS, 2011) in order to identify variations
among raw and cup quality parameters. Parameters which showed significant
differences among the treatments were compared using fisher’s least significant
differences (LSD) at 5% probability level. Besides, to see the relationship between
different variables, Pearson correlation analysis was performed among coffee
quality and environmental variables using IBM SPSS Statistic 20 programme
(SPSS, 2011).
Results and Discussions
The coffee samples collected from fifty four Kebeles were evaluated for different
quality attribute variation and the results presented in Table 3 to 5. Significant
difference for physical and cup quality were achieved due to district variation. The
effect of Kebele within district also showed significant difference on physical
coffee quality and cup quality. Checking the sensory profile of coffee cup quality
to ensure the consistent quality, sensory evaluation is certainly the most reliable
way to assess the quality (Prodoliet, 2004). Correlation of coffee quality with and
soil chemical properties and environmental variables are listed in Table 6 and 7. Physical coffee quality
Analysis variance revealed that physical coffee quality attributes showed
significant differences among districts (P < 0.05) except moisture content, odor,
BDRC, % RWL and % RVC which showed non-significant differences (Table 3).
The total percentage of coffee retained above screen size number 14 was
significant (P < 0.05) due to district difference (Table 3). Yeki district scores
higher (97.67) coffee screen size percentage (Table 4). The lower score (95.33)
was achieved in Menitgoldiya district. Similarly, the parameter shape and make as
well as color of raw coffee bean were significant (P < 0.05) due to district
difference (Table 3). The highest shape and make mean value of 13.36 with more
uniform appearance coffee was recorded for Menitshasha district (Table 4).
Whereas the lower value was scored in SouthBench district without statically
variation of shape and make score ranging from12.56 to 12.83 with the value.
Similarly, thus, the highest result bluish to grayish color value achieved (13.28)
for Anderacha district coffee without statistical different with Sheko, Guraferda,
Menitshasha and Shybench districts (Table 4). The least color value was achieved
for coffee sample collected from SouthBench district scoring mean value of 12.72.
Coffee color profiles were influenced by environmental effect on coffee
production area.
Abrar et al., [19]
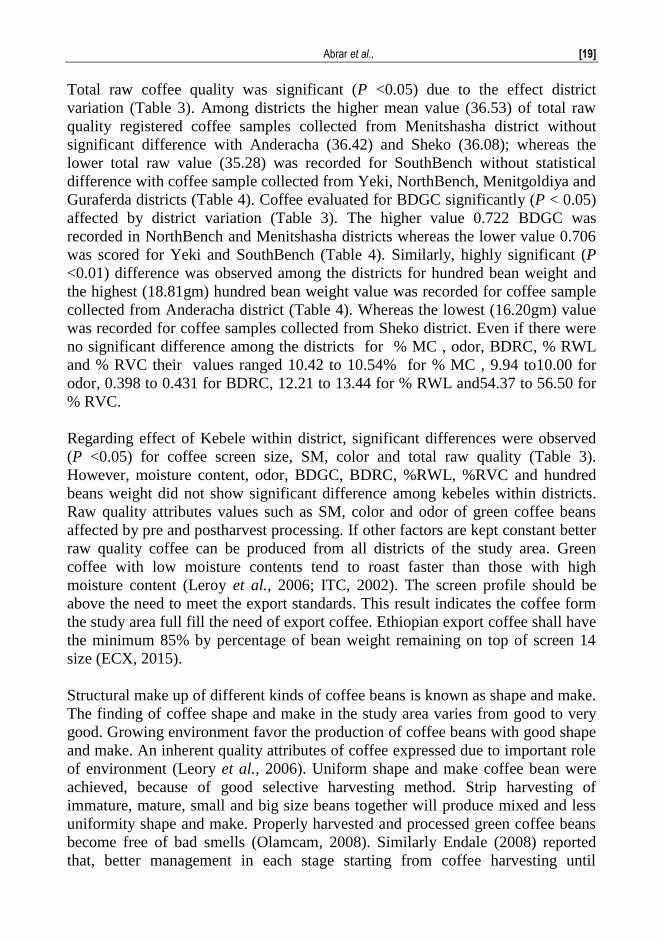
Total raw coffee quality was significant (P <0.05) due to the effect district
variation (Table 3). Among districts the higher mean value (36.53) of total raw
quality registered coffee samples collected from Menitshasha district without
significant difference with Anderacha (36.42) and Sheko (36.08); whereas the
lower total raw value (35.28) was recorded for SouthBench without statistical
difference with coffee sample collected from Yeki, NorthBench, Menitgoldiya and
Guraferda districts (Table 4). Coffee evaluated for BDGC significantly (P < 0.05)
affected by district variation (Table 3). The higher value 0.722 BDGC was
recorded in NorthBench and Menitshasha districts whereas the lower value 0.706
was scored for Yeki and SouthBench (Table 4). Similarly, highly significant (P
<0.01) difference was observed among the districts for hundred bean weight and
the highest (18.81gm) hundred bean weight value was recorded for coffee sample
collected from Anderacha district (Table 4). Whereas the lowest (16.20gm) value
was recorded for coffee samples collected from Sheko district. Even if there were
no significant difference among the districts for % MC , odor, BDRC, % RWL
and % RVC their values ranged 10.42 to 10.54% for % MC , 9.94 to10.00 for
odor, 0.398 to 0.431 for BDRC, 12.21 to 13.44 for % RWL and54.37 to 56.50 for
% RVC.
Regarding effect of Kebele within district, significant differences were observed
(P <0.05) for coffee screen size, SM, color and total raw quality (Table 3).
However, moisture content, odor, BDGC, BDRC, %RWL, %RVC and hundred
beans weight did not show significant difference among kebeles within districts.
Raw quality attributes values such as SM, color and odor of green coffee beans
affected by pre and postharvest processing. If other factors are kept constant better
raw quality coffee can be produced from all districts of the study area. Green
coffee with low moisture contents tend to roast faster than those with high
moisture content (Leroy et al., 2006; ITC, 2002). The screen profile should be
above the need to meet the export standards. This result indicates the coffee form
the study area full fill the need of export coffee. Ethiopian export coffee shall have
the minimum 85% by percentage of bean weight remaining on top of screen 14
size (ECX, 2015).
Structural make up of different kinds of coffee beans is known as shape and make.
The finding of coffee shape and make in the study area varies from good to very
good. Growing environment favor the production of coffee beans with good shape
and make. An inherent quality attributes of coffee expressed due to important role
of environment (Leory et al., 2006). Uniform shape and make coffee bean were
achieved, because of good selective harvesting method. Strip harvesting of
immature, mature, small and big size beans together will produce mixed and less
uniformity shape and make. Properly harvested and processed green coffee beans
become free of bad smells (Olamcam, 2008). Similarly Endale (2008) reported
that, better management in each stage starting from coffee harvesting until
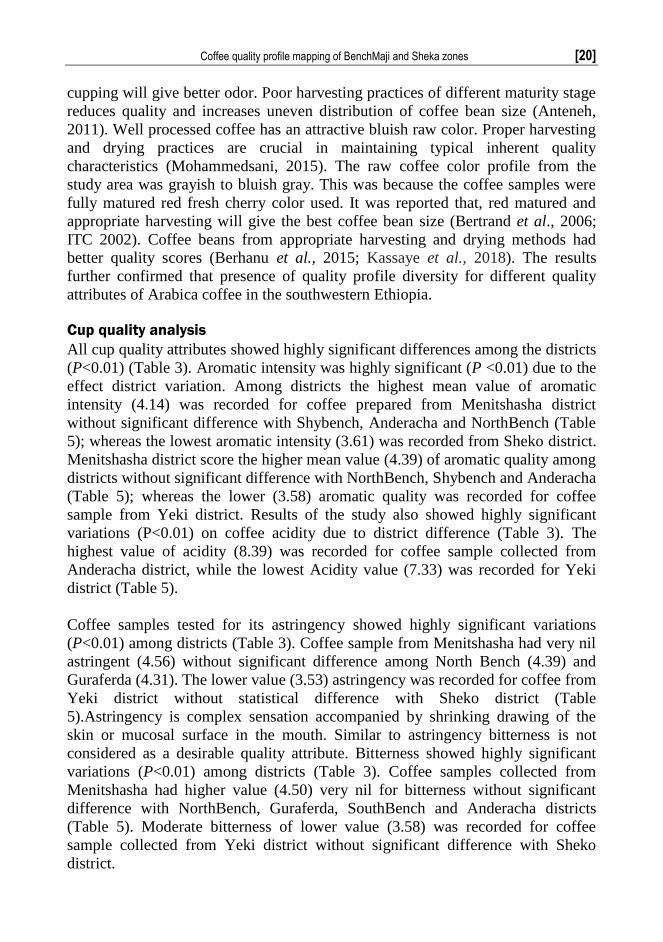
Coffee quality profile mapping of BenchMaji and Sheka zones [20]
cupping will give better odor. Poor harvesting practices of different maturity stage
reduces quality and increases uneven distribution of coffee bean size (Anteneh,
2011). Well processed coffee has an attractive bluish raw color. Proper harvesting
and drying practices are crucial in maintaining typical inherent quality
characteristics (Mohammedsani, 2015). The raw coffee color profile from the
study area was grayish to bluish gray. This was because the coffee samples were
fully matured red fresh cherry color used. It was reported that, red matured and
appropriate harvesting will give the best coffee bean size (Bertrand et al., 2006;
ITC 2002). Coffee beans from appropriate harvesting and drying methods had
better quality scores (Berhanu et al., 2015; Kassaye et al., 2018). The results
further confirmed that presence of quality profile diversity for different quality
attributes of Arabica coffee in the southwestern Ethiopia.
Cup quality analysis
All cup quality attributes showed highly significant differences among the districts
(P<0.01) (Table 3). Aromatic intensity was highly significant (P <0.01) due to the
effect district variation. Among districts the highest mean value of aromatic
intensity (4.14) was recorded for coffee prepared from Menitshasha district
without significant difference with Shybench, Anderacha and NorthBench (Table
5); whereas the lowest aromatic intensity (3.61) was recorded from Sheko district.
Menitshasha district score the higher mean value (4.39) of aromatic quality among
districts without significant difference with NorthBench, Shybench and Anderacha
(Table 5); whereas the lower (3.58) aromatic quality was recorded for coffee
sample from Yeki district. Results of the study also showed highly significant
variations (P<0.01) on coffee acidity due to district difference (Table 3). The
highest value of acidity (8.39) was recorded for coffee sample collected from
Anderacha district, while the lowest Acidity value (7.33) was recorded for Yeki
district (Table 5).
Coffee samples tested for its astringency showed highly significant variations
(P<0.01) among districts (Table 3). Coffee sample from Menitshasha had very nil
astringent (4.56) without significant difference among North Bench (4.39) and
Guraferda (4.31). The lower value (3.53) astringency was recorded for coffee from
Yeki district without statistical difference with Sheko district (Table
5).Astringency is complex sensation accompanied by shrinking drawing of the
skin or mucosal surface in the mouth. Similar to astringency bitterness is not
considered as a desirable quality attribute. Bitterness showed highly significant
variations (P<0.01) among districts (Table 3). Coffee samples collected from
Menitshasha had higher value (4.50) very nil for bitterness without significant
difference with NorthBench, Guraferda, SouthBench and Anderacha districts
(Table 5). Moderate bitterness of lower value (3.58) was recorded for coffee
sample collected from Yeki district without significant difference with Sheko
district.
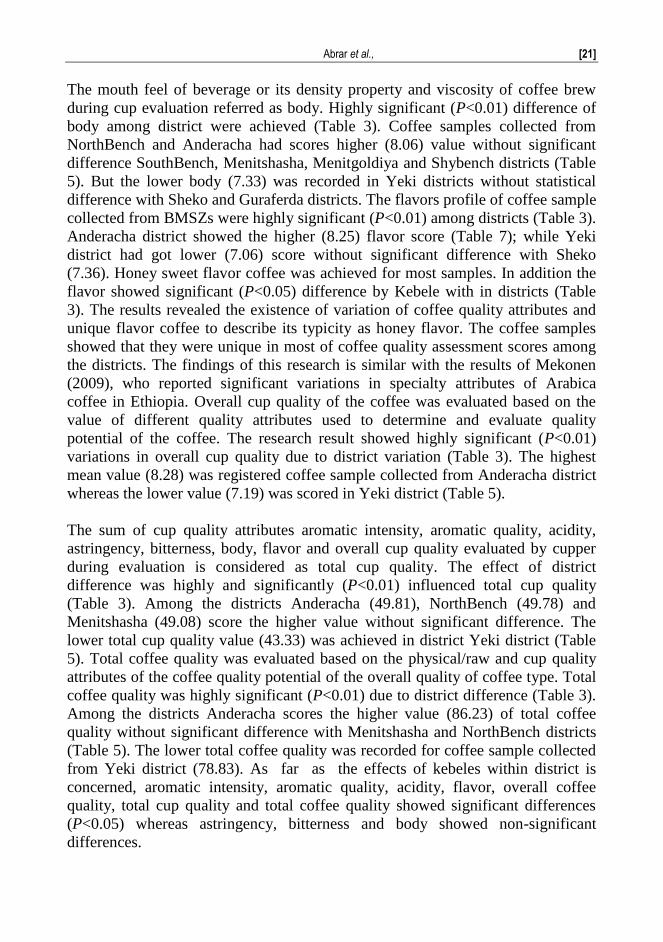
Abrar et al., [21]
The mouth feel of beverage or its density property and viscosity of coffee brew
during cup evaluation referred as body. Highly significant (P<0.01) difference of
body among district were achieved (Table 3). Coffee samples collected from
NorthBench and Anderacha had scores higher (8.06) value without significant
difference SouthBench, Menitshasha, Menitgoldiya and Shybench districts (Table
5). But the lower body (7.33) was recorded in Yeki districts without statistical
difference with Sheko and Guraferda districts. The flavors profile of coffee sample
collected from BMSZs were highly significant (P<0.01) among districts (Table 3).
Anderacha district showed the higher (8.25) flavor score (Table 7); while Yeki
district had got lower (7.06) score without significant difference with Sheko
(7.36). Honey sweet flavor coffee was achieved for most samples. In addition the
flavor showed significant (P<0.05) difference by Kebele with in districts (Table
3). The results revealed the existence of variation of coffee quality attributes and
unique flavor coffee to describe its typicity as honey flavor. The coffee samples
showed that they were unique in most of coffee quality assessment scores among
the districts. The findings of this research is similar with the results of Mekonen
(2009), who reported significant variations in specialty attributes of Arabica
coffee in Ethiopia. Overall cup quality of the coffee was evaluated based on the
value of different quality attributes used to determine and evaluate quality
potential of the coffee. The research result showed highly significant (P<0.01)
variations in overall cup quality due to district variation (Table 3). The highest
mean value (8.28) was registered coffee sample collected from Anderacha district
whereas the lower value (7.19) was scored in Yeki district (Table 5).
The sum of cup quality attributes aromatic intensity, aromatic quality, acidity,
astringency, bitterness, body, flavor and overall cup quality evaluated by cupper
during evaluation is considered as total cup quality. The effect of district
difference was highly and significantly (P<0.01) influenced total cup quality
(Table 3). Among the districts Anderacha (49.81), NorthBench (49.78) and
Menitshasha (49.08) score the higher value without significant difference. The
lower total cup quality value (43.33) was achieved in district Yeki district (Table
5). Total coffee quality was evaluated based on the physical/raw and cup quality
attributes of the coffee quality potential of the overall quality of coffee type. Total
coffee quality was highly significant (P<0.01) due to district difference (Table 3).
Among the districts Anderacha scores the higher value (86.23) of total coffee
quality without significant difference with Menitshasha and NorthBench districts
(Table 5). The lower total coffee quality was recorded for coffee sample collected
from Yeki district (78.83). As far as the effects of kebeles within district is
concerned, aromatic intensity, aromatic quality, acidity, flavor, overall coffee
quality, total cup quality and total coffee quality showed significant differences
(P<0.05) whereas astringency, bitterness and body showed non-significant
differences.
Coffee quality profile mapping of BenchMaji and Sheka zones [22]
The coffee physical and cup quality levels in this research work were within the
ranges observed in other studies. BenchMaji and Sheka zones coffees were diverse
in quality attributes havening new quality typicity/flavor. Ethiopia is known to
produce extensive diversity of coffee having unique quality attributes likemocha,
spicy, flora, winy and fruity flavours in market. Raw and cup quality variation
among Arabica coffee accessions were reported in Ethiopia by different researches
(Kyet al., 2001; Silvarolla et al., 2004). As the result indicted there is honey flavor
which is not more known to Ethiopia. This described honey and floral flavor was
especially for the coffee samples collected from highlands of study area. An
inherent quality attributes of coffee expressed due to important role of
environment (Leory et al., 2006). If coffee from BMS zones prepared in a good
way its quality is not as inferior in quality as reported by some authors (Nigussie
et al., 2007). This is in line with previous findings that indicated Ethiopia as a
center of origin and diversity of coffee (Steiger et al., 2002). Emphasis should be
given to post-harvest management of coffee to the southwestern part of the
country. Specialty coffee buyers’ looks for unique and notable products.
Organoleptic quality evaluation of coffee could be considered more similar to the
consumers’ preference as it is the consumer at the end who finally judges
beverage quality (Walyaro, 1983).
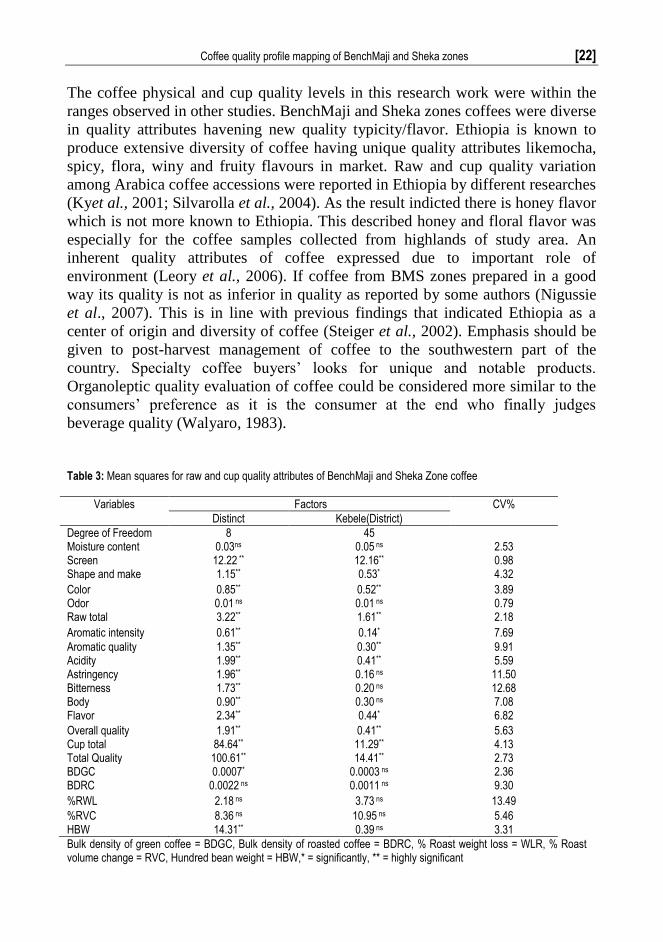
Table 3: Mean squares for raw and cup quality attributes of BenchMaji and Sheka Zone coffee
Variables Factors CV%
Distinct Kebele(District)
Degree of Freedom 8 45 Moisture content 0.03ns 0.05 ns 2.53 Screen 12.22 ** 12.16** 0.98 Shape and make 1.15** 0.53* 4.32
Color 0.85** 0.52** 3.89 Odor 0.01 ns 0.01 ns 0.79 Raw total 3.22** 1.61** 2.18
Aromatic intensity 0.61** 0.14* 7.69
Aromatic quality 1.35** 0.30** 9.91 Acidity 1.99** 0.41** 5.59 Astringency 1.96** 0.16 ns 11.50 Bitterness 1.73** 0.20 ns 12.68 Body 0.90** 0.30 ns 7.08 Flavor 2.34** 0.44* 6.82
Overall quality 1.91** 0.41** 5.63 Cup total 84.64** 11.29** 4.13 Total Quality 100.61** 14.41** 2.73 BDGC 0.0007* 0.0003 ns 2.36 BDRC 0.0022 ns 0.0011 ns 9.30
%RWL 2.18 ns 3.73 ns 13.49
%RVC 8.36 ns 10.95 ns 5.46 HBW 14.31** 0.39 ns 3.31
Bulk density of green coffee = BDGC, Bulk density of roasted coffee = BDRC, % Roast weight loss = WLR, % Roast volume change = RVC, Hundred bean weight = HBW,* = significantly, ** = highly significant
Abrar et al., [23]
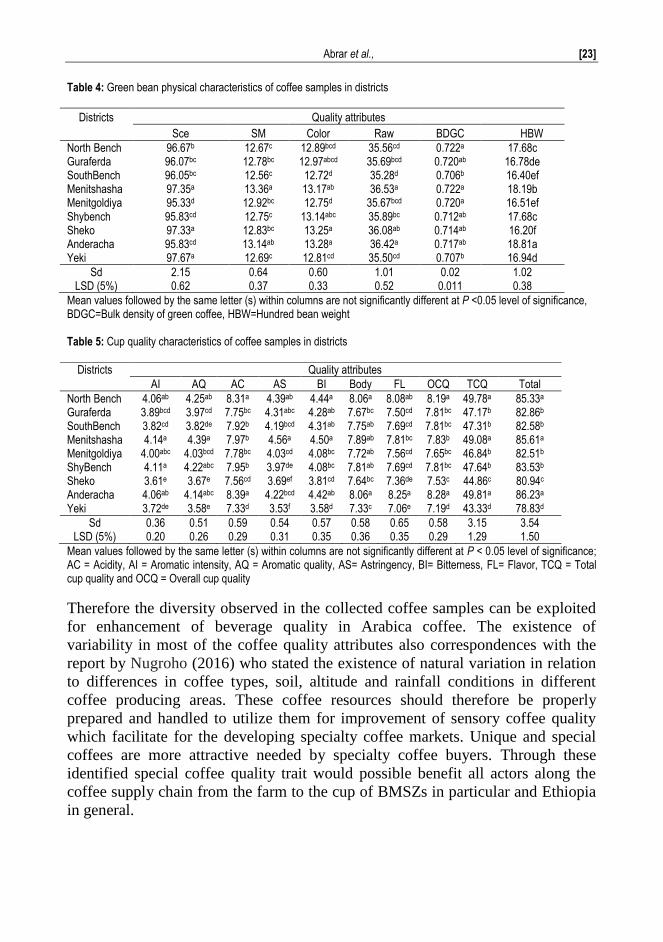
Table 4: Green bean physical characteristics of coffee samples in districts
Districts Quality attributes
Sce SM Color Raw BDGC HBW
North Bench 96.67b 12.67c 12.89bcd 35.56cd 0.722a 17.68c Guraferda 96.07bc 12.78bc 12.97abcd 35.69bcd 0.720ab 16.78de SouthBench 96.05bc 12.56c 12.72d 35.28d 0.706b 16.40ef Menitshasha 97.35a 13.36a 13.17ab 36.53a 0.722a 18.19b Menitgoldiya 95.33d 12.92bc 12.75d 35.67bcd 0.720a 16.51ef Shybench 95.83cd 12.75c 13.14abc 35.89bc 0.712ab 17.68c Sheko 97.33a 12.83bc 13.25a 36.08ab 0.714ab 16.20f Anderacha 95.83cd 13.14ab 13.28a 36.42a 0.717ab 18.81a Yeki 97.67a 12.69c 12.81cd 35.50cd 0.707b 16.94d
Sd 2.15 0.64 0.60 1.01 0.02 1.02 LSD (5%) 0.62 0.37 0.33 0.52 0.011 0.38
Mean values followed by the same letter (s) within columns are not significantly different at P <0.05 level of significance, BDGC=Bulk density of green coffee, HBW=Hundred bean weight Table 5: Cup quality characteristics of coffee samples in districts
Mean values followed by the same letter (s) within columns are not significantly different at P < 0.05 level of significance; AC = Acidity, AI = Aromatic intensity, AQ = Aromatic quality, AS= Astringency, BI= Bitterness, FL= Flavor, TCQ = Total cup quality and OCQ = Overall cup quality
Therefore the diversity observed in the collected coffee samples can be exploited
for enhancement of beverage quality in Arabica coffee. The existence of
variability in most of the coffee quality attributes also correspondences with the
report by Nugroho (2016) who stated the existence of natural variation in relation
to differences in coffee types, soil, altitude and rainfall conditions in different
coffee producing areas. These coffee resources should therefore be properly
prepared and handled to utilize them for improvement of sensory coffee quality
which facilitate for the developing specialty coffee markets. Unique and special
coffees are more attractive needed by specialty coffee buyers. Through these
identified special coffee quality trait would possible benefit all actors along the
coffee supply chain from the farm to the cup of BMSZs in particular and Ethiopia
in general.
Districts Quality attributes
AI AQ AC AS BI Body FL OCQ TCQ Total
North Bench 4.06ab 4.25ab 8.31a 4.39ab 4.44a 8.06a 8.08ab 8.19a 49.78a 85.33a Guraferda 3.89bcd 3.97cd 7.75bc 4.31abc 4.28ab 7.67bc 7.50cd 7.81bc 47.17b 82.86b SouthBench 3.82cd 3.82de 7.92b 4.19bcd 4.31ab 7.75ab 7.69cd 7.81bc 47.31b 82.58b Menitshasha 4.14a 4.39a 7.97b 4.56a 4.50a 7.89ab 7.81bc 7.83b 49.08a 85.61a Menitgoldiya 4.00abc 4.03bcd 7.78bc 4.03cd 4.08bc 7.72ab 7.56cd 7.65bc 46.84b 82.51b ShyBench 4.11a 4.22abc 7.95b 3.97de 4.08bc 7.81ab 7.69cd 7.81bc 47.64b 83.53b Sheko 3.61e 3.67e 7.56cd 3.69ef 3.81cd 7.64bc 7.36de 7.53c 44.86c 80.94c Anderacha 4.06ab 4.14abc 8.39a 4.22bcd 4.42ab 8.06a 8.25a 8.28a 49.81a 86.23a Yeki 3.72de 3.58e 7.33d 3.53f 3.58d 7.33c 7.06e 7.19d 43.33d 78.83d
Sd 0.36 0.51 0.59 0.54 0.57 0.58 0.65 0.58 3.15 3.54 LSD (5%) 0.20 0.26 0.29 0.31 0.35 0.36 0.35 0.29 1.29 1.50
Coffee quality profile mapping of BenchMaji and Sheka zones [24]
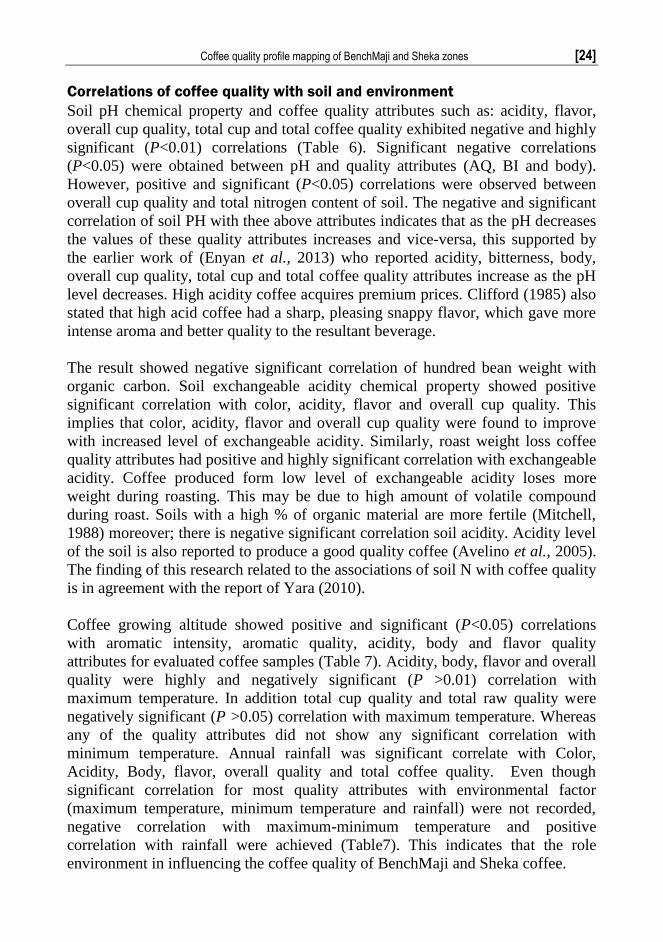
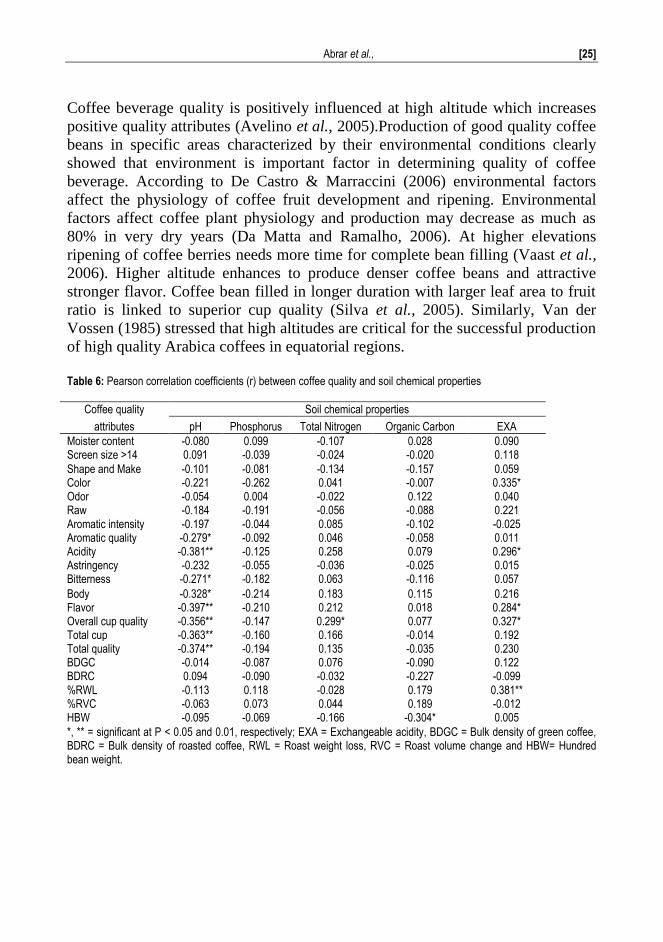
Correlations of coffee quality with soil and environment
Soil pH chemical property and coffee quality attributes such as: acidity, flavor,
overall cup quality, total cup and total coffee quality exhibited negative and highly
significant (P<0.01) correlations (Table 6). Significant negative correlations
(P<0.05) were obtained between pH and quality attributes (AQ, BI and body).
However, positive and significant (P<0.05) correlations were observed between
overall cup quality and total nitrogen content of soil. The negative and significant
correlation of soil PH with thee above attributes indicates that as the pH decreases
the values of these quality attributes increases and vice-versa, this supported by
the earlier work of (Enyan et al., 2013) who reported acidity, bitterness, body,
overall cup quality, total cup and total coffee quality attributes increase as the pH
level decreases. High acidity coffee acquires premium prices. Clifford (1985) also
stated that high acid coffee had a sharp, pleasing snappy flavor, which gave more
intense aroma and better quality to the resultant beverage.
The result showed negative significant correlation of hundred bean weight with
organic carbon. Soil exchangeable acidity chemical property showed positive
significant correlation with color, acidity, flavor and overall cup quality. This
implies that color, acidity, flavor and overall cup quality were found to improve
with increased level of exchangeable acidity. Similarly, roast weight loss coffee
quality attributes had positive and highly significant correlation with exchangeable
acidity. Coffee produced form low level of exchangeable acidity loses more
weight during roasting. This may be due to high amount of volatile compound
during roast. Soils with a high % of organic material are more fertile (Mitchell,
1988) moreover; there is negative significant correlation soil acidity. Acidity level
of the soil is also reported to produce a good quality coffee (Avelino et al., 2005).
The finding of this research related to the associations of soil N with coffee quality
is in agreement with the report of Yara (2010).
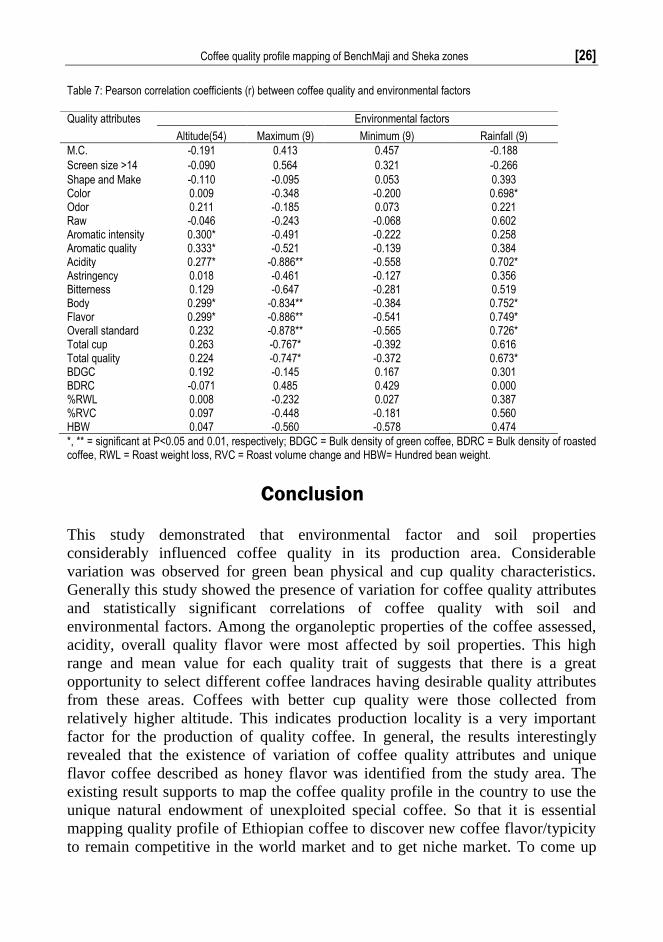
Coffee growing altitude showed positive and significant (P<0.05) correlations
with aromatic intensity, aromatic quality, acidity, body and flavor quality
attributes for evaluated coffee samples (Table 7). Acidity, body, flavor and overall
quality were highly and negatively significant (P >0.01) correlation with
maximum temperature. In addition total cup quality and total raw quality were
negatively significant (P >0.05) correlation with maximum temperature. Whereas
any of the quality attributes did not show any significant correlation with
minimum temperature. Annual rainfall was significant correlate with Color,
Acidity, Body, flavor, overall quality and total coffee quality. Even though
significant correlation for most quality attributes with environmental factor
(maximum temperature, minimum temperature and rainfall) were not recorded,
negative correlation with maximum-minimum temperature and positive
correlation with rainfall were achieved (Table7). This indicates that the role
environment in influencing the coffee quality of BenchMaji and Sheka coffee.
Abrar et al., [25]
Coffee beverage quality is positively influenced at high altitude which increases
positive quality attributes (Avelino et al., 2005).Production of good quality coffee
beans in specific areas characterized by their environmental conditions clearly
showed that environment is important factor in determining quality of coffee
beverage. According to De Castro & Marraccini (2006) environmental factors
affect the physiology of coffee fruit development and ripening. Environmental
factors affect coffee plant physiology and production may decrease as much as
80% in very dry years (Da Matta and Ramalho, 2006). At higher elevations
ripening of coffee berries needs more time for complete bean filling (Vaast et al.,
2006). Higher altitude enhances to produce denser coffee beans and attractive
stronger flavor. Coffee bean filled in longer duration with larger leaf area to fruit
ratio is linked to superior cup quality (Silva et al., 2005). Similarly, Van der
Vossen (1985) stressed that high altitudes are critical for the successful production
of high quality Arabica coffees in equatorial regions.
Table 6: Pearson correlation coefficients (r) between coffee quality and soil chemical properties
*, ** = significant at P < 0.05 and 0.01, respectively; EXA = Exchangeable acidity, BDGC = Bulk density of green coffee, BDRC = Bulk density of roasted coffee, RWL = Roast weight loss, RVC = Roast volume change and HBW= Hundred bean weight.
Coffee quality Soil chemical properties
attributes pH Phosphorus Total Nitrogen Organic Carbon EXA
Moister content -0.080 0.099 -0.107 0.028 0.090 Screen size >14 0.091 -0.039 -0.024 -0.020 0.118
Shape and Make -0.101 -0.081 -0.134 -0.157 0.059 Color -0.221 -0.262 0.041 -0.007 0.335* Odor -0.054 0.004 -0.022 0.122 0.040 Raw -0.184 -0.191 -0.056 -0.088 0.221 Aromatic intensity -0.197 -0.044 0.085 -0.102 -0.025 Aromatic quality -0.279* -0.092 0.046 -0.058 0.011 Acidity -0.381** -0.125 0.258 0.079 0.296* Astringency -0.232 -0.055 -0.036 -0.025 0.015 Bitterness -0.271* -0.182 0.063 -0.116 0.057
Body -0.328* -0.214 0.183 0.115 0.216 Flavor -0.397** -0.210 0.212 0.018 0.284* Overall cup quality -0.356** -0.147 0.299* 0.077 0.327* Total cup -0.363** -0.160 0.166 -0.014 0.192 Total quality -0.374** -0.194 0.135 -0.035 0.230 BDGC -0.014 -0.087 0.076 -0.090 0.122 BDRC 0.094 -0.090 -0.032 -0.227 -0.099 %RWL -0.113 0.118 -0.028 0.179 0.381** %RVC -0.063 0.073 0.044 0.189 -0.012 HBW -0.095 -0.069 -0.166 -0.304* 0.005
Coffee quality profile mapping of BenchMaji and Sheka zones [26]
Table 7: Pearson correlation coefficients (r) between coffee quality and environmental factors
*, ** = significant at P<0.05 and 0.01, respectively; BDGC = Bulk density of green coffee, BDRC = Bulk density of roasted coffee, RWL = Roast weight loss, RVC = Roast volume change and HBW= Hundred bean weight.
Conclusion
This study demonstrated that environmental factor and soil properties
considerably influenced coffee quality in its production area. Considerable
variation was observed for green bean physical and cup quality characteristics.
Generally this study showed the presence of variation for coffee quality attributes
and statistically significant correlations of coffee quality with soil and
environmental factors. Among the organoleptic properties of the coffee assessed,
acidity, overall quality flavor were most affected by soil properties. This high
range and mean value for each quality trait of suggests that there is a great
opportunity to select different coffee landraces having desirable quality attributes
from these areas. Coffees with better cup quality were those collected from
relatively higher altitude. This indicates production locality is a very important
factor for the production of quality coffee. In general, the results interestingly
revealed that the existence of variation of coffee quality attributes and unique
flavor coffee described as honey flavor was identified from the study area. The
existing result supports to map the coffee quality profile in the country to use the
unique natural endowment of unexploited special coffee. So that it is essential
mapping quality profile of Ethiopian coffee to discover new coffee flavor/typicity
to remain competitive in the world market and to get niche market. To come up
Quality attributes Environmental factors
Altitude(54) Maximum (9) Minimum (9) Rainfall (9)
M.C. -0.191 0.413 0.457 -0.188
Screen size >14 -0.090 0.564 0.321 -0.266
Shape and Make -0.110 -0.095 0.053 0.393 Color 0.009 -0.348 -0.200 0.698* Odor 0.211 -0.185 0.073 0.221 Raw -0.046 -0.243 -0.068 0.602 Aromatic intensity 0.300* -0.491 -0.222 0.258 Aromatic quality 0.333* -0.521 -0.139 0.384 Acidity 0.277* -0.886** -0.558 0.702* Astringency 0.018 -0.461 -0.127 0.356 Bitterness 0.129 -0.647 -0.281 0.519 Body 0.299* -0.834** -0.384 0.752* Flavor 0.299* -0.886** -0.541 0.749* Overall standard 0.232 -0.878** -0.565 0.726* Total cup 0.263 -0.767* -0.392 0.616 Total quality 0.224 -0.747* -0.372 0.673* BDGC 0.192 -0.145 0.167 0.301 BDRC -0.071 0.485 0.429 0.000 %RWL 0.008 -0.232 0.027 0.387 %RVC 0.097 -0.448 -0.181 0.560 HBW 0.047 -0.560 -0.578 0.474
Abrar et al., [27]
with more comprehensive conclusion the observed result of raw and cup quality
attributes of BenchMaji and Sheka zones coffee should be confirmed using
biochemical analysis.
Acknowledgements
The authors would like to acknowledge Ethiopian Institute of Agricultural
Research (EIAR) and Agricultural Growth Project II (AGP-II) for the allocation of
fund for the research work. We would like to Acknowledge Jimma Agricultural
Research Center (JARC) professional coffee cupper and Laboratory technicians.
References
Abeyot Tessema, Sentayehu Alamerew, Taye Kufa and Weyessa Garedew. 2011.
Variability and Association of Quality and Biochemical Attributes in some
promising Coffee Arabica Germplasm collections in Southwestern Ethiopia,
International Journal of Plant Breeding and Genetics 5(4):302-316.
Abrar Sualeh and Negussie Mekonnen. 2015. Manual for Coffee Quality Laboratory
ISBN: 978999446605410-8
Abrar Sualeh, Solomon Endris and Ali Mohammed. 2014. Processing Method, Variety
and Roasting Effect on Cup Quality of Arabica Coffee (Coffee arabica L.);
Discourse Journal of Agriculture and Food Sciences, 2(2): 70-75.
Abu Tefera and Rachel Bickford. 2020. Ethiopia Coffee Annual, USDA Foreign
Agricultural Service, Global Agricultural Information Network, Report Number:
ET2020-0004, May 22, 2020.
Abu Tefera and Teddy Tefera. 2014. Ethiopia Coffee Annual report / Coffee Annual
Report, Grain Report Number ET-1402, USDA Foreign Agricultural Service, May
13, 2014.
AntenehTemesgen. 2011. Farm productivity and value chain analysis of coffee in
Darolabu district, west Hararghe Zone of Oromia Regional State. M.Sc. Thesis
presented to School of Graduate Studies of Haramaya University, Haramaya,
Ethiopia. pp 84
Anthony F, Combes MC, Astorga C, Bertrand B, Graziosi G, and Lashermes P. 2002. The
origin of cultivated CoffeaarabicaL. varieties revealed by AFLP and SSR markers.
Theoretical and Applied Genetics, 104: 894-900.
Avelino J, Barboza B, Araya JC, Fonseca C, Davrieux F, Guyot B and Cilas C. 2005.
Effects of slope exposure, altitude and yield on coffee quality in two altitude
terroirs of Costa Rica, Orosi and Santa Maria de Dota. Journal of the Science of
Food and Agriculture, 85(11):1869-1876.
Behailu W/Senbet, AbrarSualeh, NugussieMekonen, Solomon Endries. 2008. Coffee
processing and quality research in Ethiopia. pp. 307-316. In: GirmaAdugna,
BayettaBelachew, TesfayeShimber, EndaleTaye and TayeKufa (eds.). Coffee
Coffee quality profile mapping of BenchMaji and Sheka zones [28]
Diversity and Knowledge. Proceedings of a National Workshop Four Decades of
Coffee Research and Development in Ethiopia. Addis Ababa, Ethiopia.
Berhanu Tsegaye, Ali Mohammed, Tesfaye Shimber, Yehenew Getachew and Essubalew
Getachew. 2015. Influence of Sun Drying Methods and Layer Thickness on
Quality of Midland Arabica Coffee Varieties at Gomma-II, Southewest Ethiopia,
International Journal of Innovative Agriculture & Biology Research 3(1):47-58.
Bertrand B, Vaast P, Alpizar E, Etienne H, Davrieux F, and Charmetant P. 2006.
Comparison of bean biochemical composition and beverage quality of arabica
hybrids involving Sudanese-Ethiopian origins with traditional varieties at various
elevations in Central America. Tree Physiology, 26(9), 1239-1248.
Bray HR and Kurtz LT. 1945. Determination of organic and available forms of
phosphorus in soils. Soil Science, 9:39 - 46.
Clifford MN. 1985. Chemical and physical aspects of green coffee and coffee products.
In: M.N. Clifford and K.C.Willson (Eds.). Coffee Botany, Biochemistry, and
Production of beans and beverage (pp. 305-374). Croom Helm, London.
Da matta FM and Ramalho JDC. 2006. Impacts of drought and temperature stress on
coffee physiology and production: a review. Brazilian Journal of Plant Physiology
18: 55-81.
De Castro RD and Marraccini P. 2006. Cytology, biochemistry and molecular changes
during coffee fruit development. Brazilian Journal of Plant Physiology, 18(1),
175199.
Dessalegn Gachena and Solomon Kebebew. 2014.Evaluating Coffee Market Structure
and Conduct in Bench Maji Zone, South West Ethiopia. Journal of Agricultural
Economics, Extension and Rural Development, 2(5): 156-163.
ECX. (Ethiopian Commodity Exchanges), 2015. Coffee Contracts, Ethiopia Commodity
Exchange, Addis Ababa, Ethiopia. p.14
Endale Asfaw. 2008. Physical quality standards and grading systems of Ethiopian coffee
in demand and supply chain. In: GirmaAdugna, BayettaBellachew,
TesfayeShimber, EndaleTaye and TayeKufa (eds). Coffee Diversity and
Knowledge, (pp. 328-334). Ethiopian Institute of Agricultural Research (EIAR),
Addis Ababa, Ethiopia.
Enyan F, Banful BKB and Kumah P. 2013. Physical and organoleptic qualities of coffee
bean under different drying methods and depths of drying in a tropical environment.
International Research Journal of Plant Science, 4(9): 280-287
Girma Mammo. 2003. Agrometriology Geographic Information System to Enhance
Coffee Varity, 2002. Impact of Specialty Coffee Increased Quality and Profits for
small holders. California, Colombia.
ICO/ICC. 2015. Sustainability of the coffee sector in Africa. International Coffee
Organization/ International Coffee Council 115th Session 28 September - 2
October 2015 Milan, Italy.
ITC (International Trade Centre). 2002. Coffee An exporter's guide. UNCTAD/WTO.
Switzerland, Geneva. pp. 243-289.
Jackson ML. 1958. Soil Chemical Analysis, Prentice Hall Inc., New Jersey, USA. pp. 38-
226.
Abrar et al., [29]
Kassaye Tolessa, Duchateau L and Boeckx P. 2018. Analysis of coffee quality along the
coffee value chain in Jimma zone, Ethiopia, African Journal of Agricultural
Research, 13(29):1468-1475.
Ky CL, Louarn J, Dussert S, Guyot B, Hamon S and Noirot M. 2001. Caffeine,
trigonelline, chlorogenic acids and sucrose diversity in wild Coffeearabica L. and
C. canephoraP. accessions. Food Chemistry, 75: 223-230.
Lashermes P, Combes M-C, Ansaldi C, Gichuru E, and Noir S. 2011. Analysis of alien
introgression in coffee tree (Coffeearabica L.). Molecular breeding, 27(2), 223-232
Leroy T, Fabienne R, Benoit B, Pierre C, Magali D, Christophe M, Pierre M. and David
P. 2006. Genetics of Coffee Quality. Brazilian J. Plant Physiol.18 (1):229-242.
Mayne R, Tola A and Kebede G. 2002. Crisis in the birthplace of coffee, Oxfam
International research paper, Oxfam International.
Mekonen Hailemichael. 2009. Influence of Genotype, Location and processing methods
on the quality of coffee (Coffee Arabica L.). An M.Sc. Thesis, presented to the
schoolof Graduate studies of Hawasa University, Hawasa, Ethiopia.
Mitchell HW. 1988. Cultivation and Harvesting of the Arabica Coffee Tree. Coffee:
Agronomy. Clarke, R. J. (Ed.) New York: Elsevier Applied Science, 4: 43-90.
Mohammedsani Amin. 2015.Effect of Harvesting and Postharvest Processing Methods on
the Quality of Hararghe Coffee (CoffeaarabicaL.) Genotype in Mechara, Eastern
Ethiopia, An M.Sc. Thesis Submitted to the College of Agriculture and
Environmental Sciences, School of Plant Sciences, School of Graduate Studies of
Haramaya University, Ethiopia.
NCCRS, National coffee commodity research strategy. 2017-2030. unpublished.
Nigussie Efa, Mekonnen M and Agwanda C. 2007. Does Acquisition of Information and
Knowledge Suffice? Lessons in improving coffee quality through an innovative and
integrated approach in Ethiopia. In African Crop Science Conference Proceedings.
8: 1237-1241.
Nugroho D. 2016. Condition of Soil Fertility and Sensory Profile of Smallholder Robusta
Coffee in Jember District. Pelita Perkebunan (a Coffee and Cocoa Research
Journal), 32(3):192-197.
Olamcam. 2008. Report on Sustainability of Arabica coffee in the North West Region of
Cameroon. An export coffee organization part of Olam International Agri Business,
Singapore.
Olika Kitila, SentayehuAlemarew, TayeKufa and WayessaGeredaw. 2011. Organoleptic
characterization of some limmu coffee (Coffee arabica L) germplasm at Agaro,
southern Ethiopia. International Journal of Agricultural Research 6 (7):537- 549.
Prodolliet J. 2004. Coffee Quality Assurance: Current Tools and Perspective. ASIC, 20th
colloquium, India, Bangalore, pp 120-145.
SAS (Statistical Analysis System). 2011. (Version 9.3). SAS Institute, Cary, NC. USA.
Silva EA, Mazzafera P, Brunini O, Sakai E, Arruda FB, Mattoso LHC, Carvalho C RL
and Pires RCM. 2005. The influence of water management and environmental
conditions of the chemical composition and beverage quality of coffee beans.
Brazilian Journal of Plant Physiology; 17 (2): 229-238.
Silvarolla MB, Mazzafera P and Fazuoli LC. 2004. Plant biochemistry: a naturally
decaffeinated arabica coffee. Nature, 429(6994): 826-826.
Coffee quality profile mapping of BenchMaji and Sheka zones [30]
Steiger DL, Nagai C, Moore PH, Morden CW, Osgoog RW and Ming R. 2002. AFLP
analysis of genetic diversity within and among Coffeearabica cultivars. Theory of
Applied Genetics, pp: 189-215.
SPSS. 2011. IBM SPSS Statistics for Windows, Version 20.0. IBM Corp. Armonk, NY
USA.
Vaast P, Bertrand B, Perriot JJ, Guyot B, Génard M. 2006. Fruit thinning and shade
influence bean characteristics and beverage quality of Coffee arabicain optimal
conditions. Journal of Food Science andAgriculture. 86: 197-204.
Van der Vossen HAM. 1985. Coffee selection and breeding. pp. 77 -79. In: M.N. Clifford
and K.C. Willson (Eds.), Coffee botany, Biochemistry and Production of Beans and
Beverage, Croom Helm, London.
Vieira LGE. 2006. Brazilian coffee genome project: an EST-based genomic resource.
Brazilian Journal of Plant Physiology, 18(1): 95-108.
Walyaro DJA. 1983. Considerations in breeding for improved yield and quality in
Arabica coffee (CoffeearabicaL.). A PhD Dissertation, Wageningen Agricultural
University.
Walkley A and Black IA. 1934. An examination of the Degtjareff method for determining
soil organic matter and a proposed modification of the chromic acid titration
method. Soil Sci. 37: 29-38
Yara IA SA. 2010. Crop knowledge is important: The effect of nutrients on yield and
quality, balanced fertilization - key to grow fine coffee-7th African fine coffee
conference and exhibition,
Yigzaw Dessalegn Y, Labuschagne MT, Osthoff G and Herselman L. 2008. Genetic
diversity and correlation of bean caffeine content with cup quality and green bean
physical characteristics in coffee (Coffeearabica L.). Sci Food Agric. 88:1726-1730.