Embed Size (px)
Citation preview

ETHNIC CLASSIFICATION IN INTERNATIONAL CONTEXT:
A CROSS-NATIONAL COMPARISON OF 1995-2004 CENSUS ITEMS
Ann Morning
New York University
August 27, 2004
An early version of this report was prepared in fulfillment of a research contract with the U.S.
Census Bureau (Immigration Statistics Branch, Population Division). The views expressed in
this report, however, are those of the author and do not reflect any official position on the part of
the Census Bureau.

Page 1
ETHNIC CLASSIFICATION IN INTERNATIONAL CONTEXT:
A CROSS-NATIONAL COMPARISON OF 1995-2004 CENSUS ITEMS
Ann Morning*
New York University
August 27, 2004
Many if not most countries around the world categorize their inhabitants by race,
ethnicity, and/or national origins when it comes time to conduct a census. In a recent
unpublished survey of the census questionnaires used in 147 countries, the United Nations found
that 95, or 65 percent, enumerated their populations by national or ethnic group (Alemany and
Zewoldi 2003). However, this statistic encompasses a wide diversity of approaches to ethnic
classification, as evinced by the spectrum of terms employed; “race,” “ethnic origin,”
“nationality,” “ancestry” and “indigenous,” “tribal” or “aboriginal” group all serve to draw
distinctions within the national population. The picture is further complicated by the ambiguity
of the meanings of these terms: what is called “race” in one country might be labeled “ethnicity”
in another, while “nationality” means ancestry in some contexts and citizenship in others. Even
within the same country, one term can take on several connotations, or several terms may be
used interchangeably.
Though complex, the diversity of international ethnic enumeration offers demographers a
wealth of formats and approaches to consider when revisiting their own national census
schedules. This paper’s principal objective is to survey the approaches to ethnic enumeration
taken in 135 countries, based on a unique data set compiled by the United Nations Statistical
Division, and to identify several dimensions along which classification practices vary. The
purposes of this analysis are both academic and policy-oriented. On one hand, this large-scale
overview of enumeration conventions from the 1995-2004 census round suggests several
factors—historical, demographic and political—that merit scholarly attention when accounting
for the evolution of ethnic categorization practices. On the other, this comparative analysis can
be of use to demographers whose awareness of other nations’ enumeration practices might
inform their own preparations for future censuses by providing a source of potential innovations.
In this more pragmatic vein, I include a case study of the United States in order to illustrate the
ways in which international comparison highlights unusual national practices and provides
models for alternative approaches.
This report begins with a brief review of both theoretical and empirical literature on
ethnic classification before going on to describe the data on census ethnicity questions analyzed
* I wish to thank Mr. Kevin Deardorff, Chief of the Immigration Statistics Branch at the U.S. Census Bureau’s
Population Division, for funding this research. Moreover, this work has benefited from the comments of
participants in the Census Bureau’s Migration Speakers Series. I am also deeply indebted to the staff of the
Demographic and Social Statistics Branch in the United Nations Statistics Division of the Department of Economic
and Social Affairs. In particular, I thank Drs. Mary Chamie, Jeremiah Banda, and Yacob Zewoldi for generously
making their data, offices, insights and other resources available for this project. The views expressed herein are
those of the author and do not reflect the official positions of either the U.S. Census Bureau or the United Nations.

A. Morning Ethnic Classification in International Context
Page 2 of 27
here. I next present findings on the frequency of ethnic enumeration, both globally and by
region, and then examine the terminology and formats used both in questions about ethnicity and
their response options. In the last set of findings, I focus on the United States’ 2000 census items
on ancestry, ethnicity and race in order to illustrate the points of divergence that emerge when
one nation’s practices are compared both to the global array and to smaller subsets, such as
nations with similar demographic histories or those that are the primary senders of immigrants to
the country in question. After reviewing these results, the concluding section revisits the
question of the uses of international comparison in an area of demographic measurement that is
so profoundly shaped by cultural and historical variation.
A. Research on “Ethnicity” and Related Census Classifications
1. Conceptual Links between Ethnicity, Race, and Nationality
Any review of approaches to ethnic identification must tackle the question of what—if
anything—distinguishes the concepts of ethnicity, race, and nationality. The elision between the
three is a well-known and widely apparent phenomenon (Fenton 2003). In The New Oxford
American Dictionary (Jewell and Abate 2001), for example, ethnicity is defined as “the fact or
state of belonging to a social group that has a common national or cultural tradition” (p. 583),
and the definition for “race” also equates it with ethnicity (p. 1402):
race: each of the major divisions of humankind, having distinct physical
characteristics…a group of people sharing the same culture, history, language, etc; an
ethnic group…a group or set of people or things with a common feature or features
This brief example suffices to illustrate the interconnections often drawn between ethnicity, race,
nationality and other concepts. Here the definition of ethnicity makes reference to “national
tradition,” and the definition of race mirrors that of ethnicity.
Academic research has however suggested various distinctions between the three
concepts. One of the most common is the association of ethnicity with cultural commonality,
while race is seen as revolving around physical or biological commonality.1 As Weber (1978)
described, ethnic groups are “those human groups that entertain a subjective belief in their
common descent…it does not matter whether or not an objective blood relationship exists” (p.
389), whereas “race identity” stems from “common inherited and inheritable traits that actually
derive from common descent” (p. 385). The conceptualization of race as biology remains
significant in the United States today, despite challenge from academic understandings of race as
a social construct (Omi 2001).
Another important line of distinction that has been drawn between racial and ethnic
identity turns on the degree to which they reflect voluntary choice and entail significant
consequences (Banton 1983; Jenkins 1997). In the United States in particular, ethnicity has
1 Kertzer and Arel (2002b) note, however, that even culturalist interpretations of ethnicity took on an essentialist,
almost biologistic quality in 19th
-century beliefs in culture as physically inheritable, e.g. “in the blood.”

A. Morning Ethnic Classification in International Context
Page 3 of 27
increasingly come to be understood as “symbolic” (Gans 1979) or “optional” (Waters 1990).
According to these views, individuals can choose the ethnic group(s) with which they most
identify, and signal their affiliation with the group(s) by means of superficial behavior (e.g.
choice of clothing or food) with the knowledge that such identification will have little if any
repercussion for major life outcomes such as employment or educational opportunities. In sharp
contrast, racial identity is usually portrayed as involuntary—it is imposed by others—and
immutable, regardless of individual behavioral choices. Most important of all, this externally-
enforced affiliation has profound and far-reaching effects on life outcomes (Smelser, Wilson and
Mitchell 2001).
Interestingly, the concept of nationality has been linked to both ethnicity and race, as well
as to citizenship. Eighteenth-century German Romantic ideas of the Volk laid the groundwork
for the view that political boundaries mirrored cultural, ethnic ones, and even that they contained
people of the same “blood” or physical stock (Hannaford 1996). Such ideas found expression in
the 19th
and 20th
centuries as well, leading to mass migrations and conflicts over state borders
(Brubaker 1996). In Eastern Europe in particular, nationality has come to designate something
other than political citizenship, something more like ancestry or national origins (Eberhardt
2003; Kertzer and Arel 2002b).
Given the fluidity between the conceptual borders of ethnicity, race, and nationality, this
study uses a broad definition of “ethnic enumeration” that includes census references to all three,
provided they do not expressly refer to political citizenship or birthplace. In other words, as
described further in the Methodology discussion (below), I treat a heterogeneous collection of
terms (e.g. “ethnic group,” “race,” “people,” “tribe”) as markers of ethnic identity, as long as
they indicate a somewhat inchoate sense of “groupness,” rather than being grounded in a more
objective measure like language fluency or passport nationality.
2. International Comparisons of Ethnicity, Race and Nationality Enumeration
Another question raised by the comparative study of ethnic categorization is simply
whether such classification systems are in fact comparable across national boundaries, given the
particularity of historical and cultural interpretations of group identity in different societies.
In its 1998 Principles and Recommendations for Population and Housing Censuses
(Revision 1), the United Nations Statistical Division noted the difficulty of proposing a common,
cross-national approach to ethnic enumeration given the wide range of conceptualizations of the
meaning of ethnicity:
The national and/or ethnic groups of the population about which information is needed in
different countries are dependent upon national circumstances. Some of the bases upon
which ethnic groups are identified are ethnic nationality (in other words country or area
of origin as distinct from citizenship or country of legal nationality), race, colour,
language, religion, customs of dress or eating, tribe or various combinations of these
characteristics. In addition, some of the terms used, such as “race”, “origin” and “tribe”,
have a number of different connotations. The definitions and criteria applied by each
country investigating ethnic characteristics of the population must therefore be

A. Morning Ethnic Classification in International Context
Page 4 of 27
determined by the groups that it desires to identify. By the very nature of the subject,
these groups will vary widely from country to country; thus, no internationally relevant
criteria can be recommended. (p. 72)
This variety also complicates international comparisons of enumeration approaches. However,
this paper argues that such comparisons can nonetheless be fruitful, illuminating the bases upon
which social groups are thought to be distinct in different parts of the world, as well as the
strategies that national governments employ with respect to these groups. A comparative
approach also offers ideas for new strategies to be considered.
Academic comparison of census ethnic enumeration often involves only a few cases, as
part of an intensive social, historical, and political examination (e.g. Kertzer and Arel 2002a;
Nobles 2000). However, broader surveys can be found in Alemany and Zewoldi (2003),
Statistics Canada and U.S. Census Bureau (1993), and Almey, Pryor, and White (1992). In their
forthcoming chapter “Démographie et Ethnicité: Une Relation Ambiguë,” Rallu, Piché and
Simon examine a wide range of national censuses and identify four types of governmental
approach to ethnic enumeration:
1) Enumeration for political control (compter pour dominer)
2) Non-enumeration in the name of national integration (ne pas compter au nom de
l’intégration nationale)
3) Discourse of national hybridity (compter ou ne pas compter au nom de la mixité)
4) Enumeration for antidiscrimination (compter pour justifier l’action positive)
Rallu et al. identify colonial census administration with the first category, as well as related
examples such as apartheid-era South Africa, the Soviet Union, and Rwanda. In these cases,
ethnic categories form the basis for exclusionary policies. In the second category, where ethnic
categories are rejected in order to promote national unity, western European nations such as
France, Germany, and Spain are prominent. The third category is largely associated with Latin
American countries, where governments take different decisions about whether to enumerate by
ethnicity, but a broader discourse praising interethnic mixture or hybridity is not uncommon.
The final category is illustrated with examples from Latin America (e.g. Brazil, Colombia) and
Asia (China), but the principal cases discussed here are those of England, Canada, and the United
States, where ethnic census data serve as tools in combating discrimination.
Such studies focus on the question of which political motives result in the presence or
absence of an ethnic question on a national census. They do not however delve into the details
of the precise format of the question. This study seeks to address the more detailed issues of
what terminology is used in different countries (e.g., “race” or “nationality”?), how the request
for information is framed, and what options are given to respondents in formulating their answer.

A. Morning Ethnic Classification in International Context
Page 5 of 27
B. Data and Methodology
As publisher of the annual Demographic Yearbook, the United Nations Statistical
Division (UNSD) regularly collects international census information, including both
questionnaire forms and data results. For the 2000 round (i.e. censuses conducted from 1995
through 2004), UNSD drew up a list of 231 nations and territories from which to solicit census
materials. As of October 1, 2003, this researcher located 135 national questionnaires in the
UNSD collection and elsewhere (i.e. from 58 percent of the countries listed), and calculated that
43 nations (19 percent) were either not scheduled to conduct a census in that round or planned to
do so later in the round. Therefore questionnaires were missing from 53 countries (23 percent of
the original list, or 28 percent of the 188 countries expected to have already conducted a census
within the 2000 round).2
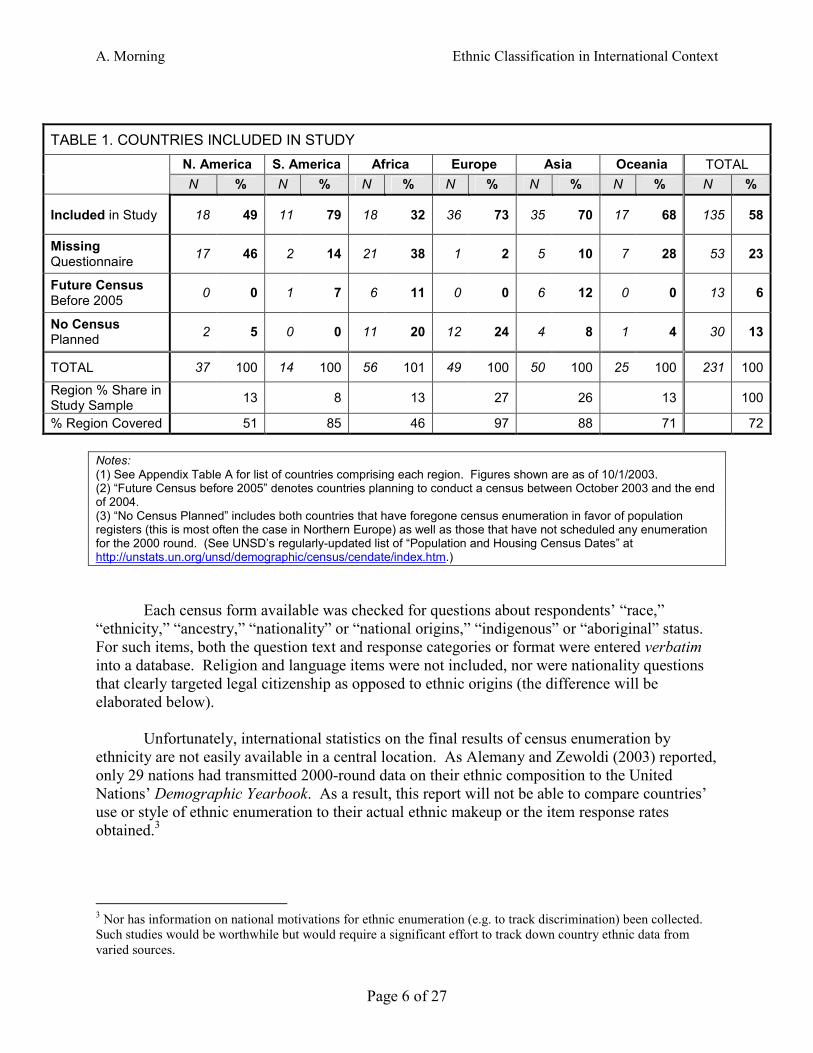
The gaps in UNSD’s coverage of international census-taking were not spread randomly
across the globe, as Table 1 shows. The nations of Europe were best-represented in the
collection, as UNSD had obtained 36 of the 37 (97 percent) of the questionnaires available for
the 2000 census round. Next came Asia (including the Middle East), for which 88 percent of the
available questionnaires had been obtained, followed by South America (85 percent), Oceania
(71 percent), North America (at 51 percent, including Central America and the Caribbean), and
Africa (46 percent). One effect of this uneven coverage is that African countries, which would
make up 21 percent of the sample and the second-largest regional bloc after Asia if all its 1995-
2004 censuses to date were included, contribute only 13 percent to the final sample of national
census questionnaires studied. More generally, the variation in coverage suggests that while the
results to be described can be considered a good representation of enumeration in Europe, Asia,
South America and possibly Oceania, this is not the case for discussion of North (and Central)
America or of Africa. Moreover, the country-level data below do not indicate what percentage
of the world’s population is covered by the census regimes studied here; findings are not
weighted by national population in this inquiry.
2 In addition to the unique collection of census questionnaires compiled by the United Nations, the author benefited
from productive discussions with the staff of the Demographic and Social Statistics Branch and access to
Demographic Yearbook data. In addition to the questionnaires received by countries submitting annual data to the
Demographic Yearbook, UNSD and this researcher located other census forms on the Internet (at country sites or the
ACAP project run by the University of Pennsylvania) and in the library collections of Princeton University’s Office
of Population Research and the U.S. Census Bureau’s International Population Collection.
A. Morning Ethnic Classification in International Context
Page 6 of 27
TABLE 1. COUNTRIES INCLUDED IN STUDY
N. America S. America Africa Europe Asia Oceania TOTAL
N % N % N % N % N % N % N %
Included in Study 18 49 11 79 18 32 36 73 35 70 17 68 135 58
Missing Questionnaire
17 46 2 14 21 38 1 2 5 10 7 28 53 23
Future Census Before 2005
0 0 1 7 6 11 0 0 6 12 0 0 13 6
No Census Planned
2 5 0 0 11 20 12 24 4 8 1 4 30 13
TOTAL 37 100 14 100 56 101 49 100 50 100 25 100 231 100
Region % Share in Study Sample
13 8 13 27 26 13 100
% Region Covered 51 85 46 97 88 71 72
Notes:
(1) See Appendix Table A for list of countries comprising each region. Figures shown are as of 10/1/2003. (2) “Future Census before 2005” denotes countries planning to conduct a census between October 2003 and the end of 2004. (3) “No Census Planned” includes both countries that have foregone census enumeration in favor of population registers (this is most often the case in Northern Europe) as well as those that have not scheduled any enumeration for the 2000 round. (See UNSD’s regularly-updated list of “Population and Housing Census Dates” at http://unstats.un.org/unsd/demographic/census/cendate/index.htm.)
Each census form available was checked for questions about respondents’ “race,”
“ethnicity,” “ancestry,” “nationality” or “national origins,” “indigenous” or “aboriginal” status.
For such items, both the question text and response categories or format were entered verbatim
into a database. Religion and language items were not included, nor were nationality questions
that clearly targeted legal citizenship as opposed to ethnic origins (the difference will be
elaborated below).
Unfortunately, international statistics on the final results of census enumeration by
ethnicity are not easily available in a central location. As Alemany and Zewoldi (2003) reported,
only 29 nations had transmitted 2000-round data on their ethnic composition to the United
Nations’ Demographic Yearbook. As a result, this report will not be able to compare countries’
use or style of ethnic enumeration to their actual ethnic makeup or the item response rates
obtained.3
3 Nor has information on national motivations for ethnic enumeration (e.g. to track discrimination) been collected.
Such studies would be worthwhile but would require a significant effort to track down country ethnic data from
varied sources.

A. Morning Ethnic Classification in International Context
Page 7 of 27
C. Census Use of Ethnic Classification
Similar to Alemany and Zewoldi’s (2003) results, I identified 84 countries or 63 percent
of the 1344 surveyed as employing some form of ethnic census classification.
TABLE 2. SHARE OF COUNTRIES STUDIED USING ETHNIC ENUMERATION, BY REGION
N. America S. America Africa Europe Asia Oceania TOTAL
N % N % N % N % N % N % N %
Enumerating Ethnicity
15 83 9 82 8 44 16 44 22 65 14 82 84 63
Total N Countries Studied in Region
18 11 18 36 34 17 134
As Table 2 shows, in this study North America, South America, and Oceania were the regions
with the greatest propensity to use ethnic classifications on their censuses. While Asia’s
tendency to enumerate by ethnicity was close to the sample average, both Europe and Africa
were much less likely to do so. However, as the next section demonstrates, the specific
terminology used varied greatly within regions.
D. Approaches to Ethnic Enumeration
1. Census Questions on Ethnicity: Terminology and Geographic Distribution
In 47 of the 84 cases of ethnic enumeration (56 percent), the terms “ethnicity” or
“ethnic” were used.5 This terminology was found in censuses from every world region. Often
the term was combined with others for clarification, as in: “Caste/Ethnicity” (Nepal); “cultural
and ethnic background” (Channel Islands/Jersey); “grupo étnico (pueblo)” (Guatemala);
“Ethnic/Dialect Group” (Singapore); “Ethnic nationality” (Latvia); and “race or ethnic group”
(Jamaica). Overall, 11 different terms or concepts appeared in census ethnicity questions; Table
3 lists them in descending order of frequency. The table also distinguishes between “primary”
terms (i.e. first to appear if more than one term is used in one or more questions) and
“secondary,” or following, terms.
4 One questionnaire—that of Bangladesh—has not been included pending translation from the Bengali.
5 This includes their cognates in foreign languages (e.g. ethnicité, étnico) and the English-language translations
provided by census authorities.

A. Morning Ethnic Classification in International Context
Page 8 of 27
TABLE 3. TERMINOLOGY OF CENSUS ETHNICITY QUESTIONS
Number of Countries Using Term as: Total Frequency
Primary Term Secondary Term N %
Ethnicity 43 4 47 56
Nationality 16 3 19 23
Indigenous Group/Tribe 6 6 12 14
Race 3 9 12 14
Ancestry/Descent/Origin 3 3 6 7
Cultural Group 2 2 4 5
Community/Population 3 0 3 4
Language Group 1 2 3 4
Caste 2 0 2 2
Color/Phenotype 2 0 2 2
Religious Group 0 1 1 1
As Table 3 shows, the second most frequent term after “ethnicity” was “nationality,”
used in 19 cases (or 23 percent). Here reference is made to the use of “nationality” to denote
origins rather than current legal citizenship status. This distinction was made clear in most cases
either by the presence on the census questionnaire of a separate question for citizenship (e.g.
Romania, Tajikistan) or by the use of the adjective “ethnic” to create the term “ethnic
nationality” (Estonia). However, I also include in this category census items that combined
ethnicity and nationality by using a single question to identify either citizens’ ethnicity or non-
citizens’ nationality. For example, the Senegalese question ran, “Ethnie ou nationalité:
Inscrivez l'ethnie pour les Sénégalais et la nationalité pour les étrangers” (Ethnicity or
nationality: Write down ethnicity for Senegalese and nationality for foreigners).6 References to
nationality as ethnic origin came largely from eastern European nations (e.g. Poland, Romania)
and Asian countries of the former Soviet Union (e.g. Tajikistan, Uzbekistan).
Roughly 14 percent of the national censuses asked about respondents’ indigenous status.
These cases came from North America (e.g. Mexico: “¿[Name] pertenece a algún grupo
indígena?”; Does [name] belong to an indigenous group?), South America (e.g. Venezuela:
“¿Pertenece usted a algún grupo indígena?”; Do you belong to an indigenous group?), Oceania
(e.g. Nauru: “family’s local tribe”), and Africa (Kenya: “Write tribe code for Kenyan Africans”).
In other words, this formulation was not found on European or Asian censuses.
The same number of countries (12, or 14 percent of all censuses using some form of
ethnic enumeration) asked for respondents’ race, but this term was three times more likely to
appear as a secondary term than as a primary one. For example, the Brazilian question placed
“race” after “color” (“A sua cor o raça e:”), and Anguilla used race to modify ethnicity: “To
6 All translations by author.

A. Morning Ethnic Classification in International Context
Page 9 of 27
what ethnic/racial group does [the person] belong?”). Race usage was largely confined to North
America (including Central America and the Caribbean), as well as to United States territories in
Oceania (American Samoa, Guam, Northern Mariana Islands).
Together, the four most frequent terms—“ethnicity,” “nationality,” “indigenous group,”
and “race”—were used as either primary or secondary terms by 75 (or 89 percent) of the
countries that used ethnic enumeration in this sample. The remaining terms were each used on
only 6 censuses or less. While some of these terms were used as the primary measurement of
ethnicity—this is the case for “community/population,” “caste,” and “color/phenotype”—others
were more likely to figure in a secondary position; this was the case for “language” and
“religion.” The remaining terms (“ancestry/descent/origin” and “cultural group”) were equally
likely to figure in either a primary or secondary position.
As the foregoing discussion suggests, some terms were more likely to be used in certain
world regions than others. Table 4 gives an overview of the geographic distribution of the four
most frequent ethnic terms found on the census questionnaires studied.
TABLE 4. CENSUS ETHNICITY TERMINOLOGY BY REGION
N. America S. America Africa Europe Asia Oceania TOTAL Primary or Secondary Term: N % N % N % N % N % N % N %
Ethnicity 8 53 3 33 4 50 9 56 12 55 11 79 47 56
Nationality 0 0 0 0 2 25 9 56 7 32 1 7 19 23
Indigenous/Tribe 2 13 6 67 1 13 0 0 0 0 3 21 12 14
Race 7 47 1 11 1 13 0 0 0 0 3 21 12 14
Countries Covered by 4 Terms
13 87 8 89 5 63 16 100 19 86 14 100 75 89
No. Countries Using Some Ethnicity Term
15 9 8 16 22 14 84
Note: Percentages do not total to 100, because (a) not all ethnic terms are included; and (b) many countries use
more than one ethnic term on their censuses.
It is notable that although in most regions, the most widely-used terms “ethnicity,”
“nationality,” “indigenous/tribe” and “race” are sufficient to describe the ethnic enumeration
strategies of more than 85 percent of the national censuses in use, in Africa these terms appear on
only 63 percent of the censuses studied. The remaining 37 percent (3 countries) refer to “tipo
somático / origem” (Mozambique), “population group” (South Africa), and “linguistic group”
(Mauritius).

A. Morning Ethnic Classification in International Context
Page 10 of 27
Despite the generally widespread use, however, of the four most frequent ethnic
identifiers, the usage of each one varies considerably across the globe. Reference to “ethnicity”
is most prevalent in Oceania and least prevalent in South America, whereas “nationality” is
found on more than half of the European censuses but on none in the Americas. Conversely,
references to “indigenous status” or “tribe” reach their peak in South America, but are absent on
European and Asian censuses. Similarly, “race” is not found on European or Asian censuses, but
appears on almost half of those used in North America (which includes Central America and the
Caribbean). Still, in all regions “ethnicity” remains the most frequent term used, with the
exception of South America, where references to indigenous status appear twice as often as those
to ethnicity.
2. The Language of Census Ethnicity Questions
The census language employed to elicit respondents’ ethnic background also varies
considerably in its recognition of ethnicity as a matter of subjective belief as opposed to
objective fact. Twelve (or 14 percent) of the 84 countries that practice ethnic enumeration treat
it as a subjective facet of identity by asking respondents what they “think,” “consider,” or
otherwise believe themselves to be. Examples come from every world region. Saint Lucia’s
census asks, “To what ethnic group do you think [the person] belongs?” (emphasis added) rather
than simply, “To what ethnic, racial or national group does [the person] belong?” The same
explicitly subjective formulation is found on the census questionnaires of New Caledonia (“A
laquelle des communautés suivantes estimez-vous appartenir?”; To which of the following
communities do you think you belong?) and Paraguay (“¿Se considera perteneciente a una étnia
indígena?”; Do you consider yourself as belonging to an indigenous ethnic group?), for example.
In addition to the recognition of the subjectivity of identity through references to
respondents’ beliefs, these censuses achieve the same end by emphasizing the personal, self-
selected aspect of ethnicity; it is what the individual says it is, not the product of an objective
external measurement. Accordingly, the individual respondent’s choice is paramount here, as in
the Philippines’ question, “How does [the person] classify himself/herself?” or Bermuda’s “In
your opinion, which of the following best describes your ancestry?” South Africa’s census asks,
“How would (the person) describe him/herself in terms of population group?” while Jamaica
asks, “To which race or ethnic group would you say you/… belong(s)?”, both questions
employing the conditional tense. Deference to the individual’s choice of self-recognition is
found in non-English formulations as well, such as Argentina’s “¿Existe en este hogar alguna
persona que se reconozca descendiente o perteneciente a un pueblo indígena?” (Is there
someone in this household who considers him/herself a descendant of or belonging to an
indigenous people?) or Suriname’s “Tot welke etnische groep rekent deze persoon zichzelf?”
(With which ethnic group does this person identify him/herself?). Peru’s census question even
lays out the basis on which individuals might construct their ethnic identity, asking “¿Por sus
antepasados y de acuerdo a sus costumbres Ud. se considera:…" (Given your ancestors and
traditions, you consider yourself…).
Many of these examples also illustrate another strategy of recognizing the subjectivity of
identity, and that is the reference to ethnic groups as something with which one is affiliated, as
opposed to the more total ethnicity as something that one is. The difference between an essential

A. Morning Ethnic Classification in International Context
Page 11 of 27
being ethnic and a constructed belonging to an ethnicity can be illustrated by juxtaposing the
question “What is your ethnic group?” (United Kingdom) against “To what ethnic group do you
belong?” (Guyana). The difference is subtle, yet it marks a distinction between a more
essentialist concept of ethnicity as an objective characteristic, and a more constructionist
understanding of ethnicity as subjectively and socially developed. In addition to the 14 percent
of the national censuses studied that presented ethnicity as subjective in the ways previously
described, another 20 percent (17 countries) used the concept of belonging (appartenir in
French, pertenecer in Spanish) in the formulation of their ethnicity question. Again, this
approach was found on censuses from every world region.
It is clear however that in the majority of cases, census ethnicity questions were brief and
direct, simply asking respondents to report their ethnicity. Some did not in fact include a
question, merely a title (e.g. “Ethnic Group,” Bulgaria), but others did take on a question format
(“What is [the person’s] ethnic group?”, Tuvalu; "Is the person of Aboriginal or Torres Strait
Islander origin?", Australia).
Finally, it should be noted that three national censuses from eastern Europe indicated that
it was not obligatory to respond to the ethnicity question, ostensibly due to its sensitive nature.
Croatia’s census notes “person is not obliged to commit himself/herself,” Slovenia’s reads, “You
don't have to answer this question if you don't wish to,” and Hungary adds, “Answering the
following questions is not compulsory!”
3. Answering the Ethnicity Question: Response Formats
The national censuses studied also varied a great deal in their structuring of response
options on ethnicity questions. I have divided them into three major groups:
1. Closed-ended responses (e.g. category checkboxes; code lists)
2. Closed-ended with open-ended “Other” option (i.e. permitting the respondent to write in
a group name that is not included on the list presented)
3. Open-ended (i.e. write-in blanks)
The three approaches were used in nearly equal proportions among the 84 countries employing
ethnic enumeration: 31 (37 percent) used the entirely closed-ended approach, 28 (33 percent) the
mixed approach, and 25 (30 percent) permitted respondents to write in whatever ethnic identity
they chose.
The closed-ended approach generally took two forms: either a limited number of
checkbox category options, or the request to select a code from a list of ethnic groups assigned to
codes. The former strategy can be found, for example, on the Brazilian census, which gave
respondents five options to choose from to identify their “color or race”: (1) Branca; (2) Preta;
(3) Parda; (4) Amarela; (5) Indigena. This listing of five categories is a relatively brief one;
another such example is Romania’s series of “nationality” answers: (1) Romanian; (2)
Hungarian; (3) Gypsy/Roma; (4) German, and (5) Other. At the other end of the spectrum,
Guatemala offered a list of 22 indigenous groups plus Garifuna and Ladino, and Argentina and

A. Morning Ethnic Classification in International Context
Page 12 of 27
Paraguay each presented a list of 17 indigenous groups for selection by the respondent.
However, the second type of closed-ended format—the linking of ethnic groups to code
numbers—permitted respondents to select from an even longer list of choices; Laos offered 48
such code options. Other countries to use the code-list strategy were Ghana, Kenya, Malaysia,
the Philippines, and India.
An even wider range of responses was possible on the censuses that featured the
combination of closed-ended categories with a fill-in blank for the “Other” option alone. After
giving respondents six options to choose from—Estonian, Ukrainian, Finnish, Russian,
Belorussian, and Latvian—the Estonian census requested that individuals choosing the seventh
“Other” box write in their specific “ethnic nationality.” In Mongolia, respondents either
identified with the Khalkh option or wrote in their ethnicity. Singapore listed 13 possibilities for
“ethnic/dialect group”—Hokkien, Teochew, Cantonese, Hakka (Khek), Hainanese, Malay,
Boyanese, Javanese, Tamil, Filipino, Thai, Japanese, and Eurasian—before requesting
specification from anyone selecting the last, “Others” option.
In the last, entirely open-ended strategy, respondents were simply asked to “write in”
(Senegal) or “provide the name of” (China) their ethnic group.
Although the sample of censuses studied was fairly evenly divided across the three types
of ethnic response format, each world region generally favored one approach more than the
others. Table 5 shows that in South America and Africa, the closed-ended approach was taken
by about two thirds of the national censuses, whereas roughly the same share in Europe used the
mixed approach, and about two thirds of Asian censuses relied on the open-ended strategy.
TABLE 5. CENSUS ETHNICITY RESPONSE FORMATS BY REGION
N. America S. America Africa Europe Asia Oceania TOTAL Primary or Secondary Term: N % N % N % N % N % N % N %
Closed-Ended 7 47 6 67 5 63 2 13 6 27 5 36 31 37
Closed w/Write-in “Other” option
6 40 3 33 1 13 11 69 2 9 5 36 28 33
Open-Ended 2 13 0 0 2 25 3 19 14 64 4 29 25 30
TOTAL 15 100 9 100 8 101 16 101 22 100 14 101 84 100
In addition to geographic distribution, census ethnicity response formats also vary
depending on whether the terminology in use is “ethnicity,” “nationality,” “indigenous
status/tribe,” or “race” (see Table 6). In particular, questions on nationality are most likely to
permit some kind of write-in response, while those inquiring about indigenous status are the least
likely to do so. The first finding (regarding nationality) may reflect the expectation that fairly
few national origins are likely to be elicited and thus an open-ended approach is not likely to

A. Morning Ethnic Classification in International Context
Page 13 of 27
become unwieldy. The second finding (concerning indigenous status) may reflect governmental
tendencies to develop official lists of indigenous groups that are formally recognized by the state,
as well as the common use of a simply dichotomy (indigenous/non-indigenous) for these items.
As for questions using “race” terminology, they are fairly evenly distributed across the three
response formats, but are most likely to combine closed categories with an “Other” write-in
option. This may reflect an underlying conception of race as involving a limited number of
categories, coupled with a sense of necessity to assign all respondents to a racial group
(including via the “Other” option if necessary).
TABLE 6. CENSUS ETHNICITY RESPONSE FORMATS, BY QUESTION TYPE
Type of Question Terminology:
Ethnicity Nationality Indigenous/Tribe Race Response Format:
% N % N % N % N
Closed-Ended 36 17 16 3 67 8 33 4
Closed w/“Other” Write-in 34 16 37 7 25 3 42 5
Open-Ended 30 14 47 9 8 1 25 3
Total 100 47 100 19 100 12 100 12
Next I touch briefly on three other ways in which census response formats for ethnicity
vary:
a. Mixed or Combined Categories. Several census questionnaires permit the respondent to
identify with more than one ethnicity. This flexibility takes three forms. First, some
censuses allow the respondent to check off more than one category (e.g. Channel Islands –
Jersey; Canada; New Zealand; United States; U.S. Virgin Islands). Other census
questionnaires offer a generic mixed-ethnicity response option (e.g. “Mixed”: Channel
Islands – Jersey, Saint Lucia, Anguilla, Guyana, Zimbabwe, Trinidad and Tobago, Jamaica,
Mozambique, Suriname; “Mestizo”: Belize, Peru; “Coloured” in South Africa). Finally,
some censuses specify exact combinations of interest, for example: “White and Black
Caribbean,” “White and Black African,” etc. in the United Kingdom; “Black and White,”
“Black and Other,” etc. in Bermuda; “Part Cook Island Maori,” Cook Islands; “Eurasian,”
Singapore; “Part Ni-Vanuatu,” Vanuatu; “Part Tokelauan/Samoan,” “Part
Tokelauan/Tuvaluan,” etc., Tokelau; “Part Tongan,” Tonga; and “Part Tuvaluan” in Tuvalu.
b. Overlap between ethnic, national, language and other response categories. The conceptual
proximity between such concepts as ethnicity and nationality is illustrated once again by the
use on some censuses of the same set of response categories to serve as answers to distinct
questions on ethnicity, nationality, or language. For example, the Bermudan census response
category “Asian” can be selected when responding either to the “race” or the “ancestry”
question. An even more striking example comes from Hungary, where the same detailed list

A. Morning Ethnic Classification in International Context
Page 14 of 27
of categories serves as the response options to three separate questions (one each for
nationality, culture and language); the options are: Bulgarian; Gipsy (Roma); Beas; Romani;
Greek; Croatian; Polish; German; Armenian; Roumanian; Ruthenian; Serbian; Slovakian;
Slovenian; Ukrainian; Hungarian, and “Do not wish to answer.” Moldova also uses the same
responses for three questions (one each on citizenship, nationality and language), while
Estonia and Poland use the same categories for their citizenship and ethnic nationality
questions, and Latvia and Romania use the same response options for nationality and
language questions.
It is also worth recalling that even when only one ethnicity question appears on a census with
one set of response options, the answer categories themselves may contain multiple concepts
such as race and nationality. The United States’ race question, which includes answers like
“white” and “black” alongside national or ethnic designations like “Korean” and “Japanese,”
provides a good example. Similarly, Saint Lucia and Guyana’s ethnicity options include
races like “black” and “white” alongside national designations like “Chinese” and
“Portuguese.”
Nationality and ethnicity are also intertwined on censuses that use a single question to ask
respondents for ethnicity if they are citizens, but for something else if they are foreigners.
For example, Indonesia requests, “If the respondent is a foreigner, please specify his/her
citizenship and if the respondent is an Indonesian, please specify his/her ethnicity.” Kenya’s
ethnicity question reads, “Write tribe code for Kenyan Africans and country of origin for
other Kenyans and non-Kenyans.” Zambia’s ethnicity question instructs, “If Zambian enter
ethnic grouping, if not mark major racial group.” And Iraq’s census asks only Iraqis to
answer the ethnicity question.
c. Use of examples. National censuses also vary in the extent to which they employ examples
to facilitate response to their ethnicity questions. Given typical space constraints, however,
this strategy is not widely used; instead, the list of checkbox response options may serve as
the principal illustration of the objective of the question. For example, the Philippine
presentation of examples before its closed-ended code-list question is unusual: “How does
[the person] classify himself/herself? Is he/she an Ibaloi, Kankanaey, Mangyan, Manobo,
Chinese, Ilocano or what?” Instead, examples are more likely to be employed when the
answer format calls for an open-ended write-in response; it is in this context, for example,
that Fiji offers respondents the examples "Chinese, European, Fijian, Indian, part European,
Rotuman, Tongan, etc." The U.S. Pacific territories do the same for their “ethnic origin or
race” write-in item.
In short, both the amount of latitude the census respondent enjoys when responding to an
ethnicity question and the amount of guidance or clarification they are given vary considerably
across the international spectrum.

A. Morning Ethnic Classification in International Context
Page 15 of 27
E. Case Study: U.S. Ethnic Enumeration in Global Context
1. U.S. Approach to Ethnic Enumeration
As the foregoing discussion suggests, the United States census practice of enumerating
Hispanic ethnicity, race, and ancestry is unusual in certain respects. For one thing, the U.S.
limitation of the ethnicity question to identifying only one group (Hispanics) is virtually unique.
Instead, the essentially dichotomous response format (yes/no) likens it to some countries’
questions concerning indigenous status, although many of those in fact seek to capture a wide
range of indigenous affiliations, not just a generic aboriginal status.
The United States is also somewhat unusual in using the term “race” for its primary
ethnicity question. As Table 3 showed, only 14 percent of the countries that use ethnic
enumeration employed the language of race on their censuses. It must be noted, however, that
even when national censuses employed the term “ethnicity” rather than “race,” the response
categories they offered often included the same groups as would be found among the answer
options to a race question (e.g. “Black,” “Caucasian,” “Chinese,” etc.).
The explicit permission to select more than one race, ethnicity, or ancestry group is
another distinguishing feature of the 2000 U.S. census. However, in its response formats (e.g.
checkboxes with some write-in on the race question), the United States’ ethnicity questions take
a similar approach to other nations’ censuses.
In summary, U.S. ethnic enumeration diverges most strikingly from other countries’ in its
treatment of “race” as a concept distinct from “ethnicity,” and its related use of the ethnicity
question to single out only one group (Hispanics), instead of identifying a wider range of ethnic
affiliations. No other country that mentions “race” on its census treats it as a measure separate
from “ethnicity”; instead, they routinely present the two concepts as interchangeable, as in “To
what ethnic/racial group does [the person] belong?” (Anguilla). Interestingly, even the censuses
administered in the United States’ Pacific territories treat race and ethnicity as substitutes for
each other: “What is this person's ethnic origin or race?” (used in American Samoa, Guam, and
Northern Mariana Islands). By setting apart a question dedicated especially to enumerating one
group in particular (Hispanics), the U.S. census presumes that neither the race question nor the
ancestry question can adequately identify this group; but no other national census takes such an
asymmetrical approach to non-indigenous respondents.
The conceptual separation of “race” from “ethnicity” found only on the U.S. census,
moreover, may unwittingly support the longstanding belief, described above, that race reflects
biological difference and ethnicity, cultural difference. In this scheme, ethnicity is socially-
produced but race is an immutable facet of nature. So walling off race from ethnicity on the
census may preclude consideration of the ways in which racial categories are also socially
constructed.

A. Morning Ethnic Classification in International Context
Page 16 of 27
2. Ethnic Enumeration in Countries with Similar Demographic History
It is also instructive to compare the United States to the narrower range of nations with
similar demographic histories. The formation of states in the wake of European colonization is a
fairly widespread experience, but the subsequent development of societies that—like the U.S.—
are numerically dominated by people of European descent is largely limited to the Americas,
Australia and New Zealand. And while all of these cases entailed European encounters with
indigenous peoples, not all experienced the influx as well of a significant African population.
Taking these fundamental features into account, perhaps the country most demographically
similar to the United States is Brazil, but as numerous authors have demonstrated, the two
countries seem to have developed quite different forms of race relations and imagery (Marx
1998; Nobles 2000). In short, the United States’ demographic evolution and its cultural response
are unique. However, I sketch below a few points of comparison between it and other societies
outside Europe in which the descendants of European settlers have remained a distinct
majority—like Canada, Australia, and New Zealand—or have assimilated a large African
population, like Brazil.
Like the United States, Canada uses three questions to elicit ethnic information from its
respondents. First is an ancestry question, "To which ethnic or cultural group(s) did this person's
ancestors belong?” Answer examples are given, and individuals are permitted four open-ended
fill-in entries. Next Canadians are asked (without specifying the term “race”), “Is this person…”
and they are given the following response options: White; Chinese; South Asian; Black;
Arab/West Asian; Filipino; South East Asian; Latin American; Japanese; Korean; Other-specify.
Respondents may mark more than one group. Finally, Canadians are asked about their
indigenous affiliation.
Three differences from the U.S. procedure are particularly noteworthy. First is the list of
categories on the Canadian race question; as in the United States, they include categories such as
White, Black and several Asian categories (e.g. Chinese, Japanese). However, they also include
the category “Latin American” among these choices—unlike the American creation of a separate
Hispanic ethnicity question—and they include an “Arab/West Asian” option, thereby facilitating
the self-identification of people of Arab or Middle Eastern descent.
Second, Canadians are permitted to list up to four ancestry groups, compared to the two
allowed on the U.S. census long form.
Finally, Statistics Canada has placed explanatory notes next to its census ethnicity
questions. The question on ancestral origins is annotated:
While most people in Canada view themselves as Canadians, information on their
ancestral origins has been collected since the 1901 Census to capture the changing
composition of Canada’s diverse population. Therefore, this question refers to the origins
of the person’s ancestors.
Moreover, Canada’s “race” item (with categories beginning, “White,” “Chinese,” “South Asian,”
“Black,” etc.) is accompanied by the note:

A. Morning Ethnic Classification in International Context
Page 17 of 27
This information is collected to support programs that promote equal opportunity for
everyone to share in the social, cultural and economic life of Canada.
In other words, Statistics Canada clearly attempts to provide its respondents with a rationale for
the use of such questions.
Australia uses two ethnicity questions on its census: “What is the person's ancestry?” and
“Is the person of Aboriginal or Torres Strait Islander origin?” Response options to the ancestry
question include: English; Irish; Italian; German; Greek; Chinese; Australian, and “Other—
please specify.” New Zealand further condenses its request for information to one question:
"Which ethnic group do you belong to?” Here the possible answers are: New Zealand
European; Maori; Samoan; Cook Island Maori; Tongan; Niuean; Chinese; Indian, and "Other
(such as DUTCH, JAPANESE, TOKELAUAN).” Multiple responses are permitted. New
Zealand’s approach is of particular interest because it places indigenous groups side-by-side with
other ethnic groups, rather than assigning them to a separate question (for example, as Australia
and Canada do). In this respect, it is similar to the U.S. race question. However, New Zealand’s
reliance on one question alone to elicit the desired ethnic information raises the important
question of why more than one ethnicity question might be necessary for a national census. In
other words, do multiple questions actually target different kinds of information, or could they
plausibly be covered with one question alone?
In contrast to the American, Canadian, Australian and New Zealander cases, the Brazilian
census’ ethnic enumeration is limited to race, and in particular, color terminology. It asks for
respondents’ “color or race” (“A sua cor ou raça e:”) and the response options use color terms
(Branca, Amarela) and imply a gradation of color (Preta, Parda).7 Since Brazil is the only other
country highlighted here to have been a large-scale importer of African slaves, it is notable that
both the U.S. and Brazil privilege the concept of race—anchored in a black/white binary—in
their ethnic enumeration practices, whereas Canada, Australia and New Zealand evoke
“ethnicity” and “ancestry.” In fact, the link between “race” terminology in official classification
and African slavery is further evinced by the finding that in this study, virtually all of the 12
countries to refer to race are either New World former slave societies (United States, Anguilla,
Bermuda, Brazil, Jamaica, Saint Lucia) and/or their territories (United States Virgin Islands,
Puerto Rico, American Samoa, Guam, Northern Mariana Islands).
3. Ethnic Enumeration in Largest Immigrant-Sending Countries
Another group of countries whose enumeration practices are of particular interest in the
U.S. context are the largest contemporary senders of its immigrants. This group includes:
Mexico, El Salvador, Cuba, and the Dominican Republic; the Philippines, Vietnam, India, and
China; Ukraine and Bosnia-Herzegovina (see Table 7). Unfortunately, 2000-round census
7 This emphasis on phenotype is found on only one other census in this sample, that of similarly Lusophone
Mozambique. Mozambique’s census asks for “tipo somático/origem” and features similar response categories as
Brazil’s (Negro; Misto; Branco; Indiano; Outro).

A. Morning Ethnic Classification in International Context
Page 18 of 27
questionnaires from El Salvador, the Dominican Republic, Cuba, and Bosnia-Herzegovina were
not available as part of the United Nations collection at the time of this writing.
TABLE 7. LARGEST SOURCE COUNTRIES FOR U.S. IMMIGRATION
Fiscal Year 2002 Immigrants Admitted % of All U.S. Immigrants
Mexico 219,380 20.6
India 71,105 6.7
China 61,282 5.8
Philippines 51,308 4.8
Vietnam 33,627 3.2
El Salvador 31,168 2.9
Cuba 28,272 2.7
Bosnia-Herzegovina 25,373 2.4
Dominican Republic 22,604 2.1
Ukraine 21,217 2.0
Total, 10 Largest Source Countries 565,336 53.1
Total Immigrants, All Countries 1,063,732 100.0
Source: U.S. Citizenship and Immigration Services, Yearbook of Immigration Statistics 2002. Note: Future versions of this paper will present data on the total foreign-born population in the U.S., rather than simply the newest legal immigrants. However, the list of countries is similar: In 2000, the top 10 source countries for the U.S. foreign-born population were (in descending order): Mexico, China, Philippines, India, Vietnam, Cuba, South Korea, Canada, El Salvador, Germany (Malone et al. 2003).
All of the major immigrant-sending countries for whom census questionnaires were
available, however, use some form of census ethnic enumeration. Mexico stands out in this
group as it employs only a dichotomous yes/no question about indigenous status (“¿[Name]
pertenece a algún grupo indígena?”; Does [name] belong to an indigenous group? ). Most of the
major immigrant source countries, however, offer an open-ended write-in format in response to a
request for “ethnic group” or “ethnicity” (China, Vietnam, Ukraine). And India and the
Philippines ask respondents to select a numerical code from a code list to indicate caste and tribe
(in the Indian case) or ethnicity (in the Filipino case, where the question reads, “How does [the
person] classify himself/herself? Is he/she an Ibaloi, Kankanaey, Mangyan, Manobo, Chinese,
Ilocano or what?”). India and the Philippines offer particularly good examples of the ways in
which immigrants are likely to have been accustomed to group categories in their home countries
that are entirely different from those encountered on the U.S. census. Although Asian
immigrants find their responses to the U.S. race question facilitated by the inclusion of national
categories (including Filipino and Asian Indian), this attempt at ethnic enumeration is unlikely to
elicit the group identities that were originally salient for them in their countries of origin. And
for immigrants from the Caribbean, Africa, Latin America, and the Middle East, who are not
offered any national designators on the U.S. census race question, the instruction to locate

A. Morning Ethnic Classification in International Context
Page 19 of 27
themselves in the categories of White, Black, Asian, or American Indian must seem even more at
odds with the ethnicity schemes to which they are accustomed (Rodríguez 2000; Waters 1999).
4. Implications of Comparative Review for Ethnic Classification on the U.S. Census
One of the main objectives of the foregoing juxtaposition of U.S. census approaches to
ethnicity with those of other nations has been to illustrate how a comparative perspective reveals
distinct national practices that might merit review in future census rounds. In the U.S. case in
particular, at least three striking divergences from international conventions emerged:
a. The United States is one of a small number of nations to enumerate by “race.” In this
sample, only 14 percent of the census questionnaires referred to race. However, many
countries that used the term “ethnicity” in their census question included traditionally
racial groups (e.g. black, Caucasian) among their response options.
b. The United States is alone in treating “race” and “ethnicity” as different types of identity. The few other countries that mention both race and ethnicity on their census
questionnaires treat them as synonymous (as in Anguilla’s question, “To what
ethnic/racial group does [the person] belong?”). Only the United States uses separate
questions to measure its citizens’ race versus their ethnicity. One unintended effect of
this practice may be to reinforce essentialist, biological understandings of race, since it is
presented as distinct from culturally-delineated ethnicity.
c. The United States’ use of an “ethnicity” question to single out only one group (Hispanics) is unique. National ethnic enumeration is usually intended to permit all
respondents to register the group(s) with which they identify. In contrast, the United
States’ ethnicity question only records ethnic identity if it is Hispanic; all others are
deemed simply non-Hispanic. The closest precedent for this approach in the rest of the
world is the measurement of indigenous status, but even this inquiry usually permits
respondents to identify with a number of groups (as is true of the “American Indian or
Alaska Native” fill-in blank on the U.S. race question). The delegation of Hispanic
ethnicity to a question other than the race or ancestry questions raises the question of
what it is about this particular group that precludes its measurement through either the
race or ancestry questions. Moreover, it results in the somewhat unusual practice of
using three distinct ethnicity questions.
The ways in which U.S. ethnic enumeration differs from other countries’ practices
suggests possible areas for change (with the assumption that some form of ethnicity enumeration
is to be retained). Of course, the fact that one country has adopted a particular classificatory
scheme does not imply any requirement that it be more closely aligned with other national
conventions. Such departures from widespread norms, however, can prove fertile sites for
questioning national objectives of ethnic enumeration and revisiting established approaches; in
other words, identifying divergence from widespread practices offers demographers and
policymakers “food for thought.”
I return to the U.S. example once more in order to further suggest that international
comparisons can also provide models for future innovations to ethnic enumeration. For example,

A. Morning Ethnic Classification in International Context
Page 20 of 27
placing the uniquely American separation of “race” from “ethnicity” questions in international
context suggests two modifications. One might be to offer some explanation or guidance
concerning the difference between the two concepts (recall Canada’s guide). What do “race”
and “ethnicity” each mean in this context? Such a step would both clarify the rationale for the
two questions and facilitate response. The other possible modification might be to combine the
race and ethnicity questions, if in fact there is little logical rationale for treating Hispanics as a
group apart. This approach might also have the positive effect of underscoring the socially-
constructed nature of all the categories in question—including “black” and “white”—especially
if the resultant combined question used the language of “ethnicity” rather than “race.”8
Dropping the reference to race would also bring the United States’ practice closer to that of other
nations.
The unusual practice of using an ethnicity question to target only one type of group
affiliation (Hispanic) could also be modified by turning the current ethnicity question into one
that resembles the type found most commonly abroad: a question that permits respondents to
register the full range of ethnic identities. This could happen in one of two ways (assuming no
change to the current race question). One possibility would be to expand the current Hispanic
ethnicity question into a more comprehensive ethnicity question, along the lines of “To what
ethnic group do you belong?”, with either closed- or open-ended responses. The other strategy
would be to adapt the current ancestry question in some way (if necessary) to ensure that it
adequately captures Hispanic ethnicity. Essentially, both approaches involve some kind of
amalgamation of the current ethnicity and ancestry questions into a single question. This might
be preferable to combining the Hispanic ethnicity question with the race question, as the
Hispanic category—especially with its subcategories like “Mexican,” “Cuban,” etc.—is perhaps
conceptually closer to ancestry categories like “Irish” or “Italian.”
Finally, the example of New Zealand and many other countries raises the question of why
a national census would require even two questions on ethnicity; would one be sufficient?
Considering that all the categories in question are socially-delineated groupings with some
reference to geographical origins, perhaps one question could be developed. This would not only
save space, but it would also reduce the sense that some groups receive more attention—
welcome or unwelcome—than others. Consider the United Kingdom’s example, which uses a
racial framework (white, Asian, black) to structure its request for more detailed national/ethnic
identifiers:
What is your ethnic group? Choose ONE section from A to E, then check the appropriate box to
indicate your cultural background.
A. White
� British
� Irish
� Any other White background, please write in
B. Mixed
8 Note that the American Anthropological Association (1997) has also recommended that the term “ethnicity”
replace “race” in federal classification, for the same reason.

A. Morning Ethnic Classification in International Context
Page 21 of 27
� White and Black Caribbean
� White and Black African
� White and Asian
� Any other Mixed background, please write in
C. Asian or Asian British
� Indian
� Pakistani
� Bangladeshi
� Any other Asian background, please write in
D. Black or Black British
� Caribbean
� African
� Any other Black background, please write in
E. Chinese or other ethnic group
� Chinese
� Any other, please write in
Here racial groups (white, Asian, and black) are used as the geographic superstructure for a more
detailed breakdown of identities by national or regional origin (albeit with the treatment of
Chinese as distinct from the Asian group). The same model could be used without recourse to
racial labels, substituting continental origins (African, European, Asian) instead. In this way, the
detailed ethnic identities currently sought by the U.S. ancestry and Hispanic ethnicity questions
could be recorded, but the data could also be grouped into “racial” categories as desired.
F. Conclusions
1. Summary of Findings
Although widespread, ethnic enumeration is not a universal feature of national censuses;
63 percent of the censuses studied here included some type of ethnicity question. In nearly half
of these cases, “ethnicity” was the term used, but significant numbers of censuses inquired about
“nationality,” “indigenous status,” and “race.” Each of these terms tended to be associated with
a particular type of response format: questions about indigenous status were most likely to entail
a closed-ended response format (checkboxes or code lists), whereas nationality questions were
the most likely to permit open-ended responses (i.e. fill-in blanks). National census practices
also varied in terms of their allowance of multiple-group reporting and use of examples.
The large number of questionnaires studied here (134 in total, with 84 employing ethnic
enumeration) permits the exploration of geographic patterns in census practices. Based on this
sample, it appears that nations in the Americas and in Oceania are most likely to enumerate by
ethnicity, while those in Europe and Africa are the least likely. Among the countries that do
practice census ethnic classification, the term “nationality” is most likely to be used in eastern
Europe and the former Soviet Union, while “indigenous status” is most likely to be a concern in
the Americas, as is “race.”
A. Morning Ethnic Classification in International Context
Page 22 of 27
Finally, comparison of U.S. ethnic enumeration with census practices elsewhere
illustrates the ways in which global overviews can highlight unusual national procedures and
provoke reëvaluation, if not necessarily reformulation, of such items.
2. Topics for Further Research
This collection of data on international census practices is limited in certain ways that
precluded inquiry into several issues that might well furnish the bases for future research. For
one thing, the statistical results of census-taking with respect to national ethnic makeup could
address the question of whether countries with particular social compositions are more likely to
undertake particular forms of ethnic enumeration (taking into account, of course, that our
knowledge of their makeup depends on the enumeration strategy). It might also offer insight into
which types of ethnic questions and answer formats are likely to garner the highest item response
rates. Similarly, a more in-depth historical review of national debates and discourses concerning
ethnicity would shed light on the geographic patterns observed in the recourse to ethnic
enumeration and the use of particular terminologies. Returning to Rallu, Piché and Simon’s
typology of census ethnicity approaches, it seems likely that the relatively limited use of ethnic
enumeration in Europe and in Africa reflects the strategy of avoiding ethnic classification in
order to preserve or encourage national unity. This study, however, is not far-reaching enough to
validate such conclusions. Moreover, Rallu et al.’s framework raises a further question, namely,
what factors lead to national decisions to enumerate by ethnicity or not? And given the degree of
variation demonstrated here in the particular forms of ethnic questioning employed, a similar
question would seek out the factors behind the question and answer approaches used. For
example, the finding that only states with a history of African slavery (and their territories) use
the language of “race” today suggests that contemporary ethnic enumeration practices cannot be
fully accounted for without considering the historical evolution of social stratification in different
settings.
3. International Comparison of Ethnic Enumeration
Despite the variety of terminologies and approaches to ethnic enumeration taken by
censuses worldwide, the opportunity to place a national census in international perspective casts
new light on existing practices and suggests potential modifications for future approaches. Thus
global comparisons—and perhaps even global communication between national census
bureaux—have much to offer. This is particularly true as a growing number of countries face
similar issues related to ethnic enumeration, such as immigrant influx and calls for strengthened
antidiscrimination protections. At the same time, there is a growing body of academic literature
that explores the impact of governmental activities like census-taking on notions of identity and
group belonging (Goldberg 2002; Kertzer and Arel 2002a). The realization that official ethnic
enumeration is not simply a scientific measurement of objective fact, but that it simultaneously
shapes the identities it seeks to capture, provides another reason for considering how and why
diverse nations grapple with the task. Attention to the strategies employed abroad to register
ethnic diversity can thus provide useful input for the review of any one national approach in
particular.

A. Morning Ethnic Classification in International Context
Page 23 of 27
APPENDIX A. Countries Included in Regional Groupings
Organizing scheme borrowed from United Nations Statistical Division. Countries marked with
an asterisk * are those whose censuses from the 1995-2004 period were used for this study.
North America
Anguilla*
Antigua and Barbuda
Aruba
Bahamas*
Barbados
Belize*
Bermuda*
British Virgin Islands
Canada*
Cayman Islands
Costa Rica*
Cuba
Dominica
Dominican Republic
El Salvador
Greenland
Grenada
Guadeloupe
Guatemala*
Haiti*
Honduras*
Jamaica*
Martinique
Mexico*
Montserrat
Netherlands Antilles
Nicaragua*
Panama*
Puerto Rico*
Saint Kitts and Nevis
Saint Lucia*
Saint Pierre and Miquelon
Saint Vincent and the
Grenadines
Trinidad and Tobago*
Turks and Caicos Islands
United States*
U.S. Virgin Islands*
South America
Argentina*
Bolivia*
Brazil*
Chile*
Colombia
Ecuador
Falkland Islands (Malvinas)
French Guiana*
Guyana*
Paraguay*
Peru*
Suriname*
Uruguay*
Venezuela*
Africa
Algeria
Angola
Benin
Botswana*
Burkina Faso
Burundi
Cameroon
Cape Verde*
Central African Republic
Chad
Comoros
Congo
Cote d'Ivoire
Democratic Republic of the
Congo
Djibouti
Egypt*
Equatorial Guinea
Eritrea
Ethiopia
Gabon
Gambia
Ghana*
Guinea*
Guinea-Bissau
Kenya*
Lesotho*
Liberia
Libyan Arab Jamahiriya
Madagascar
Malawi*
Mali
Mauritania
Mauritius*
Morocco
Mozambique*
Namibia*
Niger
Nigeria
Réunion
Rwanda
Saint Helena
Sao Tome and Principe
Senegal*
Seychelles*
Sierra Leone
Somalia
South Africa*
Sudan
Swaziland*
Togo
Tunisia
Uganda
United Rep. of Tanzania*
Western Sahara
Zambia*
Zimbabwe*

A. Morning Ethnic Classification in International Context
Page 24 of 27
Europe
Albania*
Andorra
Austria*
Belarus*
Belgium*
Bosnia and Herzegovina
Bulgaria*
Channel Islands (Guernsey) *
Channel Islands (Jersey) *
Croatia*
Czech Republic*
Denmark
Estonia*
Faeroe Islands
Finland*
France*
Germany
Gibraltar
Greece*
Holy See
Hungary*
Iceland
Ireland*
Isle of Man*
Italy*
Latvia*
Liechtenstein*
Lithuania*
Luxembourg*
Malta*
Monaco*
Netherlands
Norway*
Poland*
Portugal*
Republic of Moldova*
Romania*
Russian Federation*
San Marino
Slovakia
Slovenia*
Spain*
Svalbard and Jan Mayen Islands
Sweden
Switzerland*
Former Yugoslav Republic of
Macedonia*
Ukraine*
United Kingdom*
Yugoslavia*
Asia
Afghanistan
Armenia*
Azerbaijan*
Bahrain*
Bangladesh
Bhutan
Brunei Darussalam
Cambodia*
China*
Cyprus*
Democratic People's Republic of
Korea
East Timor
Georgia*
Hong Kong*
India*
Indonesia*
Iran
Iraq*
Israel*
Japan*
Jordan
Kazakhstan*
Kuwait*
Kyrgyzstan*
Lao People's Dem. Republic*
Lebanon
Macao*
Malaysia*
Maldives*
Mongolia*
Myanmar
Nepal*
Occupied Palestinian Territory*
Oman
Pakistan*
Philippines*
Qatar
Republic of Korea*
Saudi Arabia
Singapore*
Sri Lanka*
Syrian Arab Republic
Tajikistan*
Thailand*
Turkey*
Turkmenistan
United Arab Emirates
Uzbekistan*
Vietnam*
Yemen*
Oceania
American Samoa*
Australia*
Cook Islands*
Fiji*
French Polynesia*
Guam*
Kiribati*
Marshall Islands
Micronesia (Federated
States of)
Nauru*
New Caledonia*
New Zealand*
Niue
Norfolk Island
Northern Mariana Islands*
Palau
Papua New Guinea*
Pitcairn
Samoa
Solomon Islands
Tokelau*
Tonga*
Tuvalu*
Vanuatu*
Wallis and Futuna Islands*

A. Morning Ethnic Classification in International Context
Page 25 of 27
REFERENCES
Alemany, Julia, and Yacob Zewoldi. 2003. Ethnicity: A Review of Data Collection and
Dissemination. United Nations Statistical Division. Draft. August. New York.
Almey, Marcia, Edward T. Pryor, and Pamela M. White. 1992. National Census Measures of
Ethnicity in the Americas. Proceedings of Conference on the Peopling of the Americas,
vol. 3. Vera Cruz, Mexico, May 23. Published by International Union for the Scientific
Study of Populations.
American Anthropological Association. 1997. Response to OMB Directive 15: Race and Ethnic
Standards for Federal Statistics and Administrative Reporting. September.
Banton, Michael. 1983. "Chapter 3: Changing Conceptions of Race." Pp. 32-59 in Racial and
Ethnic Competition. Cambridge: Cambridge University Press.
Brubaker, Rogers. 1996. Nationalism Reframed: Nationhood and the National Question in the
New Europe. Cambridge: Cambridge University Press.
Eberhardt, Piotr. 2003. Ethnic Groups and Population Changes in Twentieth-Century Central-
Eastern Europe: History, Data, and Analysis. Armonk, NY and London: M.E. Sharpe.
Fenton, Steve. 2003. Ethnicity. Malden, MA: Blackwell Publishing.
Gans, Herbert. 1979. "Symbolic Ethnicity: The Future of Ethnic Groups and Cultures in
America." Ethnic and Racial Studies 2 (1): 1-19.
Goldberg, David Theo. 2002. The Racial State. Malden, MA: Blackwell.
Hannaford, Ivan. 1996. Race: The History of an Idea in the West. Washington, DC: Woodrow
Wilson Center Press.
Jenkins, R. 1997. Rethinking Ethnicity: Arguments and Explorations. London and Thousand
Oaks, CA: Sage.
Jewell, Elizabeth J., and Frank Abate (Eds.). 2001. The New Oxford American Dictionary. New
York: Oxford University Press.
Kertzer, David I., and Dominique Arel (Eds.). 2002a. Census and Identity: The Politics of Race,
Ethnicity, and Language in National Censuses. Cambridge: Cambridge University Press.
—. 2002b. "Censuses, Identity Formation, and the Struggle for Political Power." Pp. 1-42 in
Census and Identity: The Politics of Race, Ethnicity, and Language in National Censuses,
edited by David I. Kertzer and Dominique Arel. Cambridge: Cambridge University Press.
Malone, Nolan, Kaari F. Baluja, Joseph M. Costanzo, and Cynthia J. Davis. 2003. The Foreign-
Born Population: 2000. U.S. Department of Commerce. December. Washington, DC.
Internet: http://www.census.gov/prod/2003pubs/c2kbr-34.pdf.
Marx, Anthony W. 1998. Making Race and Nation: A Comparison of South Africa, the United
States, and Brazil. Cambridge: Cambridge University Press.
Nobles, Melissa. 2000. Shades of Citizenship: Race and the Census in Modern Politics. Stanford
CA: Stanford University Press.
Omi, Michael A. 2001. "The Changing Meaning of Race." Pp. 243-263 in America Becoming:
Racial Trends and Their Consequences, edited by Neil J. Smelser, William Julius
Wilson, and Faith Mitchell. Washington, DC: National Academy Press.
Rallu, Jean-Louis, Victor Piché, and Patrick Simon. Forthcoming. "Démographie et Ethnicité:
Une Relation Ambiguë." Pp. XX-XX in Démographie: Analyse et Synthèse, edited by
Graziella Caselli, Jacques Vallin, and Guillaume Wunsch. Paris: Institut National
d'Etudes Démographiques.
A. Morning Ethnic Classification in International Context
Page 26 of 27
Rodríguez, Clara E. 2000. Changing Race: Latinos, the Census, and the History of Ethnicity in
the United States. New York: New York University Press.
Smelser, Neil J., William Julius Wilson, and Faith Mitchell (Eds.). 2001. America Becoming:
Racial Trends and Their Consequences. Washington, DC: National Academy Press.
Statistics Canada and U.S. Census Bureau. 1993. Challenges of Measuring an Ethnic World:
Science, Politics, and Reality. Washington, DC: U.S. Government Printing Office.
United Nations. 1998. Principles and Recommendations for Population and Housing Censuses.
Department of Economic and Social Affairs, Statistics Division.
ST/ESA/STAT/SER.M/67/Rev.1. New York.
Waters, Mary. 1990. Ethnic Options: Choosing Identities in America. Berkeley: University of
California Press.
Waters, Mary C. 1999. Black Identities: West Indian Immigrant Dreams and American Realities.
New York and Cambridge, MA: Russell Sage Foundation and Harvard University Press.
Weber, Max. 1978. Economy and Society. Berkeley: University of California Press.


![[WI 2014]Context Recommendation Using Multi-label Classification](https://img.pdfslide.net/doc/110x75/555a3e68d8b42ae1398b4cef/wi-2014context-recommendation-using-multi-label-classification.jpg)