Embed Size (px)
Citation preview
1
Ethnic population distribution, immigration and internal migration in Britain: what evidence of linkage at the district scale?
John Stillwell and Oliver Duke-Williams School of Geography, University of Leeds, Leeds, LS2 9JT, United Kingdom
Email: [email protected]
Paper prepared for the British Society for Population Studies Annual Conference at the University of Kent at Canterbury, 12-14 September 2005
Abstract
The geographical distribution of ethnic minority groups across the nation is characterised by concentrations in London and in certain provincial towns and cities. As non-white ethnic minority populations in Britain increase in size through natural change, there is a suggestion that their spatial concentration is increasing and that levels of segregation within the biggest cities are rising. Whilst in situ demographic processes are likely to be important drivers of ethnic expansion and concentration, it is also fundamental to understand the population dynamics that are brought about through immigration and internal migration behaviour of white and non-white ethnic groups since it is these components of population change that have been the most significant in recent decades. Using data from the 2001 Census Key Statistics (KS) and the Special Migration Statistics (SMS), this paper maps the geographical patterns of ethnic group residential location, immigration and internal migration across Great Britain at the district scale, measures these patterns using a number of summary indicators and then attempts to quantify the relationships between ethnic concentration and immigration, between ethnic concentration and internal migration, and between immigration and internal migration. Despite an extensive literature in the USA, relatively little work on these linkages has been undertaken in Europe. The results suggest that whilst immigration reinforces ethnic minority concentration, net internal migration has a deconcentrating effect and that white net migration losses are most evident in those areas experiencing highest non-white immigration.
1 Introduction
Ethnic minority populations in metropolitan Britain are increasing in size through
natural change and migration. Some observers suggest that non-white ethnic
communities are becoming increasingly concentrated spatially across the country and
that levels of segregation within the biggest cities are rising. Whilst demographic
processes and immigration from overseas are likely to be important drivers of ethnic
expansion and concentration, the role of internal migration of both white and non-
2
white ethnic groups must be considered since it is these components of population
dynamics that have been the most significant in recent decades.
There are a number of ‘big’ questions to be answered including the following:
• What are the differences in levels of spatial concentration of different ethnic
groups?
• Are minority ethnic groups becoming more or less geographically
concentrated/segregated?
• What are the spatial patterns of immigration of different ethnic groups?
• Is immigration fuelling processes of ethnic concentration?
• What are the patterns of internal migration of minority ethnic groups?
• Is there any relationship between non-white immigration and white internal
migration?
• What evidence is there about linkage between ethnic distribution, immigration
and internal migration from the results of the 2001 Census?
Using data at the local authority district scale from the 2001 Census, this
paper aims to illustrate the geographical variations in the distributions of ethnic
populations on census date in Great Britain, the distributions of immigrants by ethnic
group into Britain from abroad during the 12 months prior to the 2001 Census and
internal migration flows of different ethnic groups taking place within Britain during
a similar period of time.
Whilst many scholars have examined each of these dimensions independently,
much less attention has been paid to the relationships that may or may not exist
between them. Unlike the USA, where the debate on the relationships between ethnic
settlement, immigration and internal migration has been ongoing for several years,
researchers on this side of the Atlantic have been less concerned with issues of
potential linkage. Thus, in contrast to the wealth of studies that tend to have a uni-
dimensional perspective, some selected examples of which are mentioned in Section
2 of the paper, there is a paucity of work considering the relationships between these
variables based on empirical analysis of either British or other European data sets.
This appears to be the case despite Ron Skeldon’s plea ten years ago that a new
paradigm for migration research might “best be achieved through intensive
examination of how internal and international migrations are linked” (Skeldon,
1995).
3
Definitional issues relating to the variables used to measure the population
distribution, immigration and internal migration of ethnic groups in the 2001 Census
as well as their relative magnitudes are considered in Section 3, together with an
introduction to the system of local authority districts used for the analyses that follow.
Thereafter, in Section 4, we are concerned with measuring the geographical variations
that occur in the incidence of ethnic group populations across the country in 2001,
and in immigration and internal migration between April 2000 and 2001. Indices of
dissimilarity are used to quantify ethnic segregation across the country and for
particular types of local authority district. Rates of immigration and net migration are
computed and mapped to visualise their distributions and indices of connectivity and
effectiveness are used to provide aggregate measures for comparison between ethnic
groups. Linkage between the variables is explored using various methods in Section
5, before some conclusions and suggestions for further research are offered in the
final section.
2 Context
The literature on empirical studies and theoretical perspectives of ethnic distribution,
immigration and internal migration is very extensive, crossing disciplinary
boundaries between human geography and the other social sciences. Amongst the
important studies of ethnic distribution in the UK in recent years are those by
Coleman and Salt (1996), Peach (1996a, 1996b), Ratcliffe (1996), Haskey (1997),
Phillips (1998), Peloe and Rees (1999), Johnston et al. (2002) and Simpson (2004).
Whilst there are fewer empirical studies of immigration to the UK (Salt et al., 1994;
Dobson and McLaughlin, 2001; Hilderink et al., 2002 are examples), there is a wide-
ranging literature on international migration (e.g. Castles and Miller, 1993) and on
theoretical frameworks for international migration streams (e.g. Gorter et al., 1998).
The tradition of empirical work on internal migration in the UK is well established
with books by Champion and Fielding (1992), Stillwell et al. (1992) and Champion et
al. (1998 A much smaller volume of studies (including Robinson, 1992, for
example), have looked at the migration patterns of ethnic minorities in the UK,
although some work is now beginning to emerge using 2001 Census migration flow
data (e.g. Simpson, 2004; Stillwell and Phillips, 2005)
4
In terms of linkage, some empirical work was reported using Polish data by
Korcelli (1994) suggesting that regions with high internal out-migration have
relatively small emigration flows and that regions from which the largest numbers of
emigrants originated were also the regions that attracted internal migrants in large
numbers in the 1980s. In a feasibility study for EUROSTAT, Stillwell et al. (1999)
compared total gross and net migration components of regional international
migration and inter-regional internal migration for a subset of NUTS 2 regions within
the European Union and found only weak linkage between immigration and net
migration at this rather unsatisfactory spatial scale.
Most research on linkage comes from USA and includes studies during the
1990s by Butcher and Card (1991), Walker et al. (1992), Filer (1992), Sassen (1991,
1994), Frey (1995, 1996), Wright et al. (1997), Ellis and Wright (1998) and Frey and
Liaw (1998). This work centres on Frey’s contention that a process of ‘demographic
balkanisation’ has been occurring which involves a “spatial segmentation of
population by race-ethnicity, class, and age across broad regions, states, and
metropolitan areas… driven by both immigration and long distance internal
migration patterns” (Frey, 1996: 760). Ellis and Wright (1998) condemn Frey on
racial grounds indicating that he is helping to “sustain an anti-immigrant, pro-Anglo-
conformist agenda that many immigrants perceive as hostile to their language and
culture” (Ellis and Wright, 1998: 694). These studies and more recent empirical
work has led on to the theoretical debate between those who believe that immigration
is fuelling ‘white flight’ (Frey’s ‘push’ hypothesis) and those who believe that
counterurbanisation is happening anyway and this is creating
‘vacancies/opportunities’ in cities that are filled by immigrants (Ellis and Wright’s
‘pull’ hypothesis). Sassen argues that global cities have attracted low-skilled workers
from overseas that have increased the extent of ethno-social polarisation and
encouraged ghetto neighbourhoods within cities. The debate taking place in the US
has raised questions as to whether similar processes are occurring or will occur in
European cities and comparative work on New York and London, for example, has
been reported by Peach (1999).
5
3 2001 Census population and migration data
The data for this research is drawn exclusively from the 2001 Census, making use of
the classification of ethnic group in the Special Migration Statistics (SMS) Table 3 at
level 1 (district level). Unlike the equivalent table in 1991 that distinguished four
groups, this table identifies seven ethnic groups: (i) white; (ii) Indian; (iii) Pakistani
and other South Asian (OSA); (iv) Chinese; (v) Caribbean, African, Black British
and other black; (vi) mixed; and (vii) other. These categories are a mixture of the five
broad and 16 more detailed groups used in Table 6 of the Key Statistics (KS)
providing counts of usual residents. The white group in the SMS is an amalgam of
white British, white Irish and white other groups used in the KS. The Indian, Chinese
and other groups are directly comparable with the groups in the more specific KS
classification, whereas Asian or Asian-British Pakistanis, Bangladeshis and other
Asians are lumped into a single group as are the black or black-British Caribbean,
African and other black individuals. The mixed group is a broad category containing
those defined as white and black Caribbean, white and black African, white and
Asian, and other mixed.
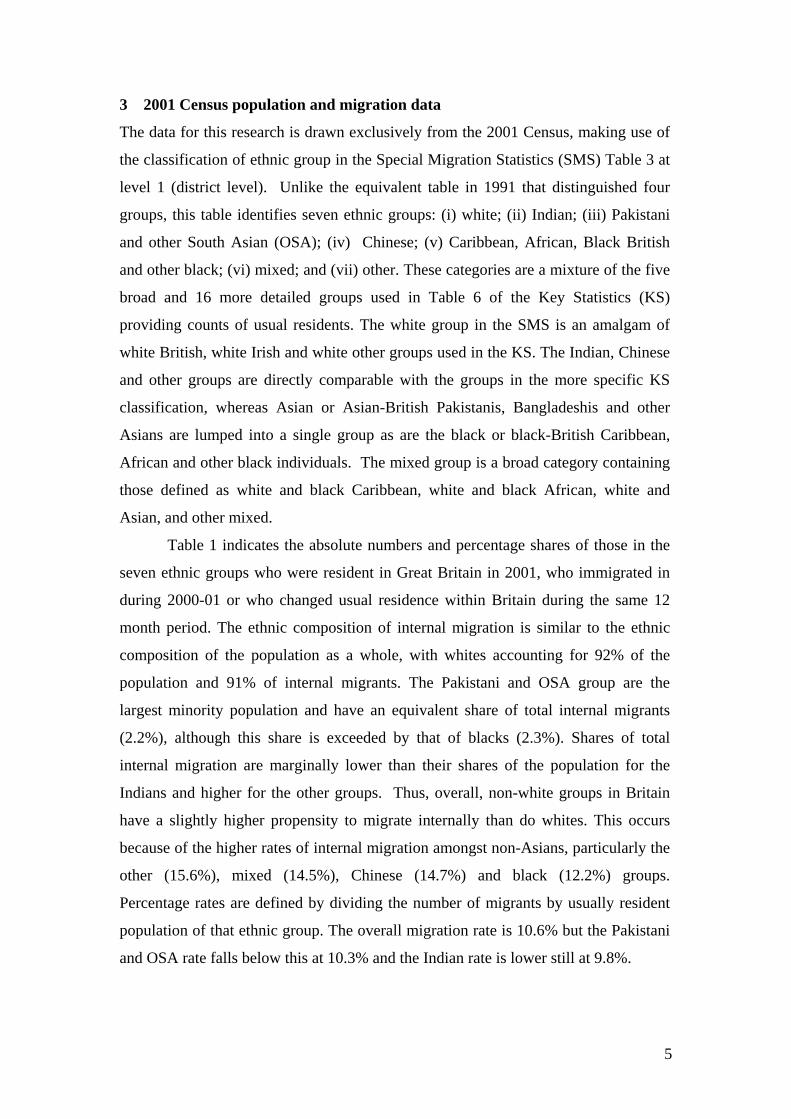
Table 1 indicates the absolute numbers and percentage shares of those in the
seven ethnic groups who were resident in Great Britain in 2001, who immigrated in
during 2000-01 or who changed usual residence within Britain during the same 12
month period. The ethnic composition of internal migration is similar to the ethnic
composition of the population as a whole, with whites accounting for 92% of the
population and 91% of internal migrants. The Pakistani and OSA group are the
largest minority population and have an equivalent share of total internal migrants
(2.2%), although this share is exceeded by that of blacks (2.3%). Shares of total
internal migration are marginally lower than their shares of the population for the
Indians and higher for the other groups. Thus, overall, non-white groups in Britain
have a slightly higher propensity to migrate internally than do whites. This occurs
because of the higher rates of internal migration amongst non-Asians, particularly the
other (15.6%), mixed (14.5%), Chinese (14.7%) and black (12.2%) groups.
Percentage rates are defined by dividing the number of migrants by usually resident
population of that ethnic group. The overall migration rate is 10.6% but the Pakistani
and OSA rate falls below this at 10.3% and the Indian rate is lower still at 9.8%.
6
Table 1. Population, immigration and internal migration by ethnic group, GB, 2001 Ethnic group Persons in 2001
Number % Immigrants*
Number % Internal migrants* Number %
White 52,481,200 91.9 279,824 70.1 5,510,662 91.0 Indian 1,051,844 1.8 21,015 5.3 103,457 1.7 Pakistani & OSA 1,276,892 2.2 21,290 5.3 131,618 2.2 Chinese 243,258 0.4 14,544 3.6 35,793 0.6 Black 1,147,597 2.0 22,921 5.7 139,811 2.3 Mixed 673,796 1.2 12,637 3.2 97,449 1.6 Other 229,324 0.4 27,117 6.8 35,878 0.6 Total 57,103,911 100.0 399,348 100.0 6,054,668 100.0
* during the 12 months prior to the census Sources: 2001 Census KS and SMS
In comparison with the 6 million internal migrants, only around 400,000
people recorded by the 2001 Census as being resident in Britain on census date
entered the country from abroad and 70% of these were white. The immigration
shares of the three major ethnic minority groups were all between 5% and 6% for this
period and the largest non-white group of immigrants was that defined as ‘other’
(6.8%) despite only having 0.4% of the population. Consequently, this group had the
highest immigration rate at 11.8% when defined using the group-specific population
as the denominator in comparison with the rate for white immigration which was only
0.5% during this period. The Chinese immigration rate was relatively high (6%)
whereas the rates for the other minority groups were all either at or just below 2%. In
fact, there were a further 456,700 people recorded by the 2001 Census as having
migrated but for whom no usual address at the start of the period was available. It is
not possible to establish what proportion of these moved in from abroad, although it
is known that 81.2% were white, that 5.5% were black, 5.2% were Pakistani and
OSA, 2.6% were Indian, and 2.5% were of mixed ethnicity.
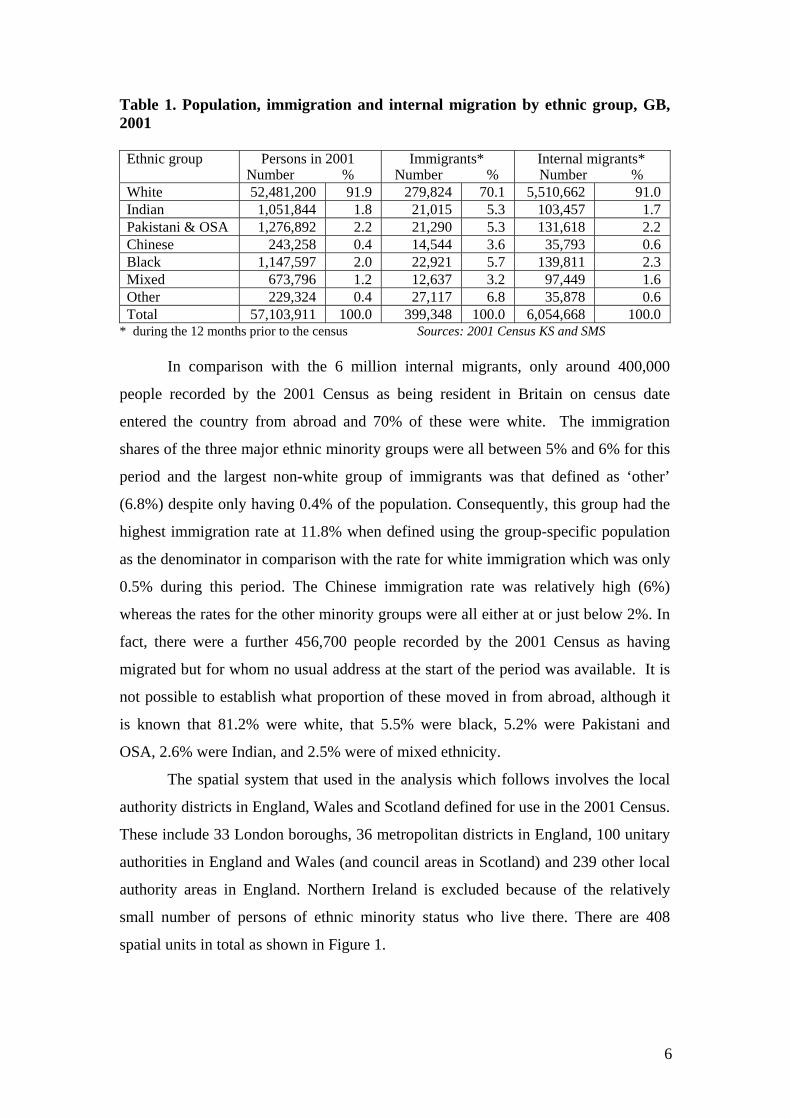
The spatial system that used in the analysis which follows involves the local
authority districts in England, Wales and Scotland defined for use in the 2001 Census.
These include 33 London boroughs, 36 metropolitan districts in England, 100 unitary
authorities in England and Wales (and council areas in Scotland) and 239 other local
authority areas in England. Northern Ireland is excluded because of the relatively
small number of persons of ethnic minority status who live there. There are 408
spatial units in total as shown in Figure 1.
7
Figure 1. Local authority districts of Britain in 2001
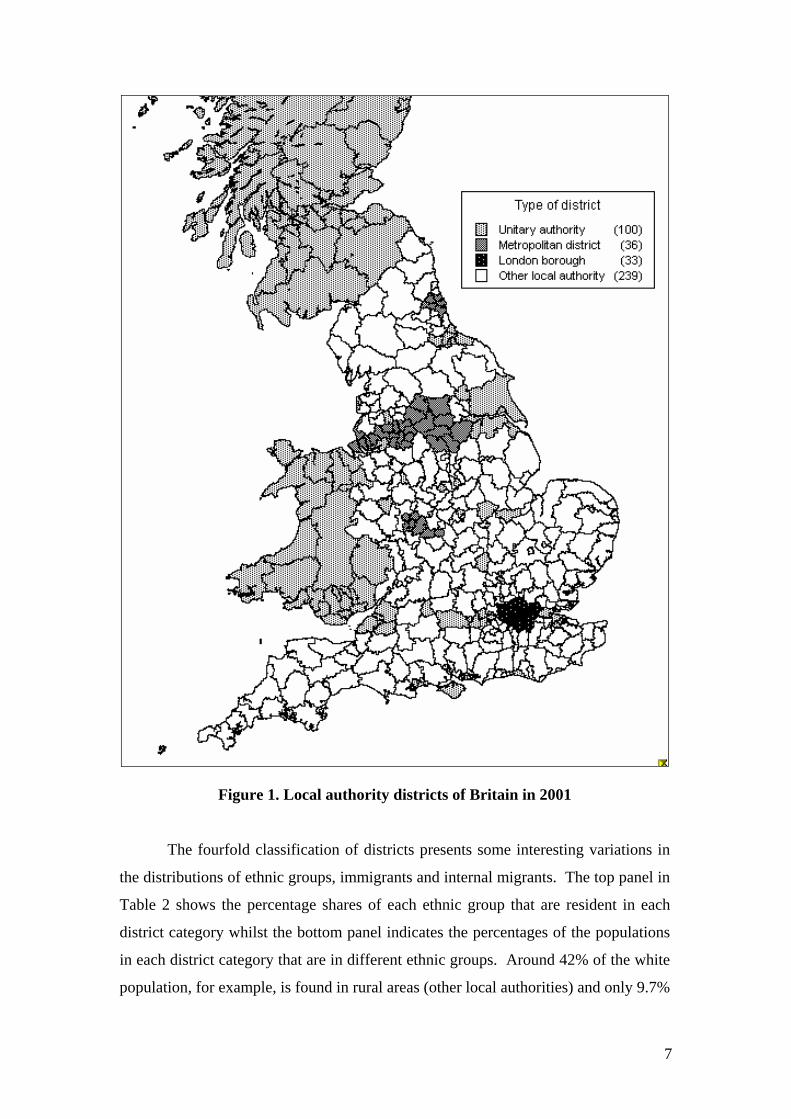
The fourfold classification of districts presents some interesting variations in
the distributions of ethnic groups, immigrants and internal migrants. The top panel in
Table 2 shows the percentage shares of each ethnic group that are resident in each
district category whilst the bottom panel indicates the percentages of the populations
in each district category that are in different ethnic groups. Around 42% of the white
population, for example, is found in rural areas (other local authorities) and only 9.7%
8
in Greater London, whilst over two thirds of the black population is located in
London and less than 10% of the population of unitary and other local authorities is
black. Minority groups are found predominantly in London although the highest
percentage of the Pakistani and OSA group occurs in metropolitan districts outside
London. London’s non-white population now represents 28.8% of its total population
whereas the non-white population amounts to only 4.6% in unitary authorities and
Scottish council areas and 3.1% in total in other local authorities.
Table 2. Distribution of ethnic groups by district type, Great Britain, 2001
Ethnic group London
Boroughs Metro
Districts Unitary
Authorities Other Local Authorities
Total
Percentages by ethnic group White 9.7 18.5 29.3 42.4 100.0 Indian 41.5 23.8 19.3 15.3 100.0
Pakistani & OSA 33.7 36.9 17.2 12.2 100.0 Chinese 33.0 17.8 22.1 27.1 100.0
Black 68.2 14.4 9.0 8.3 100.0 Mixed 33.6 21.4 18.7 26.3 100.0 Other 49.3 13.0 16.6 21.1 100.0 Total 12.6 19.0 28.3 40.2 100.0
Percentages by district type White 71.2 89.8 95.4 96.9 91.9 Indian 6.1 2.3 1.3 0.7 1.8
Pakistani & OSA 6.0 4.4 1.4 0.7 2.2 Chinese 1.1 0.4 0.3 0.3 0.4
Black 10.9 1.5 0.6 0.4 2.0 Mixed 3.2 1.3 0.8 0.8 1.2 Other 1.6 0.3 0.2 0.2 0.4 Total 100.0 100.0 100.0 100.0 100.0
Source: 2001 Census KS
A similar share breakdown for immigration is presented in Table 3,
highlighting the importance of London as a destination for people in all ethnic groups
although a higher proportion of Chinese immigrants are resident in unitary and other
local authority areas. Metropolitan districts have the lowest share of white immigrants
but the highest share of those in the Pakistani and OSA, Chinese and mixed groups.
Internal migrants can be distinguished according to whether they move
between or within districts (Table 4). In this case, approximately 40% of all internal
migrants move across district boundaries whereas 60% migrate internally and
therefore the rates of migration tend to be higher for shorter distance intra-district
migration behaviour. Rates are computed by dividing migrant numbers by the
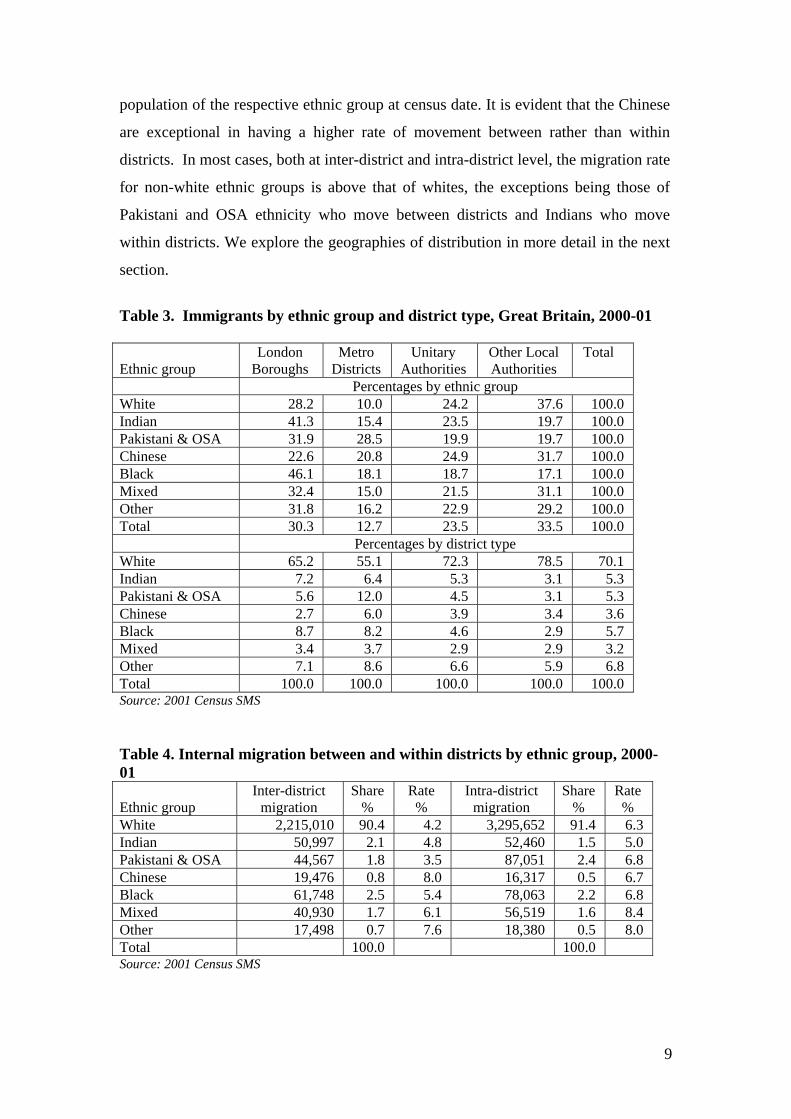
9
population of the respective ethnic group at census date. It is evident that the Chinese
are exceptional in having a higher rate of movement between rather than within
districts. In most cases, both at inter-district and intra-district level, the migration rate
for non-white ethnic groups is above that of whites, the exceptions being those of
Pakistani and OSA ethnicity who move between districts and Indians who move
within districts. We explore the geographies of distribution in more detail in the next
section.
Table 3. Immigrants by ethnic group and district type, Great Britain, 2000-01
Ethnic group London
Boroughs Metro
Districts Unitary
Authorities Other Local Authorities
Total
Percentages by ethnic group White 28.2 10.0 24.2 37.6 100.0 Indian 41.3 15.4 23.5 19.7 100.0 Pakistani & OSA 31.9 28.5 19.9 19.7 100.0 Chinese 22.6 20.8 24.9 31.7 100.0 Black 46.1 18.1 18.7 17.1 100.0 Mixed 32.4 15.0 21.5 31.1 100.0 Other 31.8 16.2 22.9 29.2 100.0 Total 30.3 12.7 23.5 33.5 100.0 Percentages by district type White 65.2 55.1 72.3 78.5 70.1 Indian 7.2 6.4 5.3 3.1 5.3 Pakistani & OSA 5.6 12.0 4.5 3.1 5.3 Chinese 2.7 6.0 3.9 3.4 3.6 Black 8.7 8.2 4.6 2.9 5.7 Mixed 3.4 3.7 2.9 2.9 3.2 Other 7.1 8.6 6.6 5.9 6.8 Total 100.0 100.0 100.0 100.0 100.0 Source: 2001 Census SMS Table 4. Internal migration between and within districts by ethnic group, 2000-01
Ethnic group Inter-district
migration Share
% Rate
% Intra-district
migration Share
% Rate %
White 2,215,010 90.4 4.2 3,295,652 91.4 6.3 Indian 50,997 2.1 4.8 52,460 1.5 5.0 Pakistani & OSA 44,567 1.8 3.5 87,051 2.4 6.8 Chinese 19,476 0.8 8.0 16,317 0.5 6.7 Black 61,748 2.5 5.4 78,063 2.2 6.8 Mixed 40,930 1.7 6.1 56,519 1.6 8.4 Other 17,498 0.7 7.6 18,380 0.5 8.0 Total 100.0 100.0 Source: 2001 Census SMS
10
4 Patterns of ethnic group distribution, immigration and internal migration
4.1 Ethnic groups
The figures presented in the previous section demonstrate the extent to which Britain
has become a multi-ethnic society and the importance of London in this respect,
where almost 30% of the population is non-white. In fact, the spatial variations in
ethnic concentration are determined by the extent of the geographical units being used
for measurement and increase as the level of spatial resolution becomes finer. At the
district scale, the range of non-white shares stretches from 61% in Newham to 0.3%
in the Isles of Scilly. There are only two districts where white residents outnumber
non-white but a further 13 (Table 5) whose non-white populations exceed 30%. All of
these are London boroughs with the exception of Slough and Leicester. At the other
end of the spectrum are authorities, all very rural and relatively peripheral, that
remain dominated by white residents.
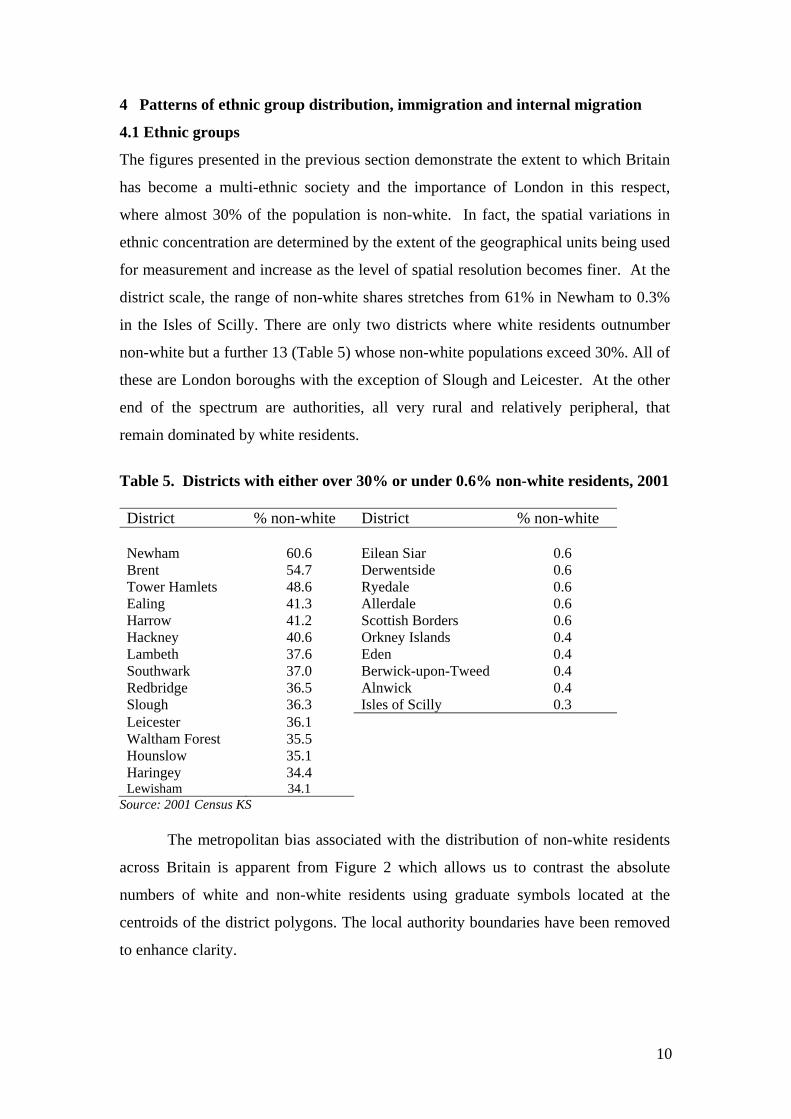
Table 5. Districts with either over 30% or under 0.6% non-white residents, 2001 District % non-white District % non-white Newham 60.6 Eilean Siar 0.6 Brent 54.7 Derwentside 0.6 Tower Hamlets 48.6 Ryedale 0.6 Ealing 41.3 Allerdale 0.6 Harrow 41.2 Scottish Borders 0.6 Hackney 40.6 Orkney Islands 0.4 Lambeth 37.6 Eden 0.4 Southwark 37.0 Berwick-upon-Tweed 0.4 Redbridge 36.5 Alnwick 0.4 Slough 36.3 Isles of Scilly 0.3 Leicester 36.1 Waltham Forest 35.5 Hounslow 35.1 Haringey 34.4 Lewisham 34.1
Source: 2001 Census KS
The metropolitan bias associated with the distribution of non-white residents
across Britain is apparent from Figure 2 which allows us to contrast the absolute
numbers of white and non-white residents using graduate symbols located at the
centroids of the district polygons. The local authority boundaries have been removed
to enhance clarity.
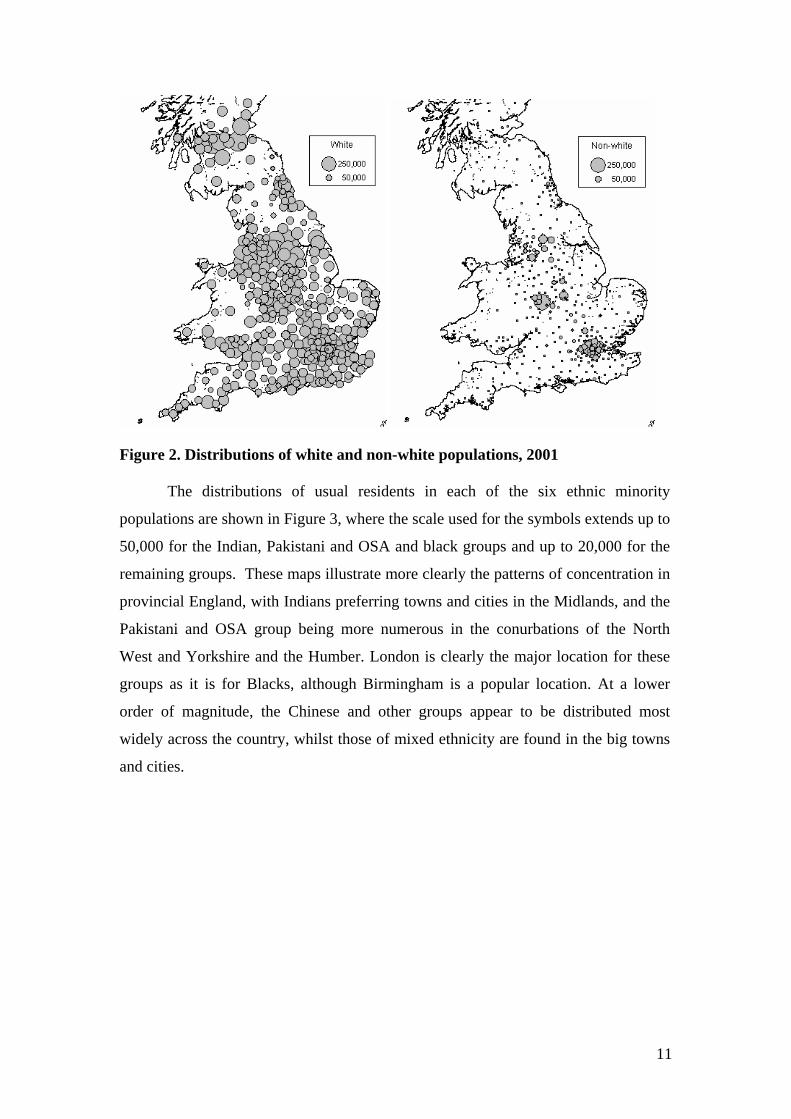
11
Figure 2. Distributions of white and non-white populations, 2001
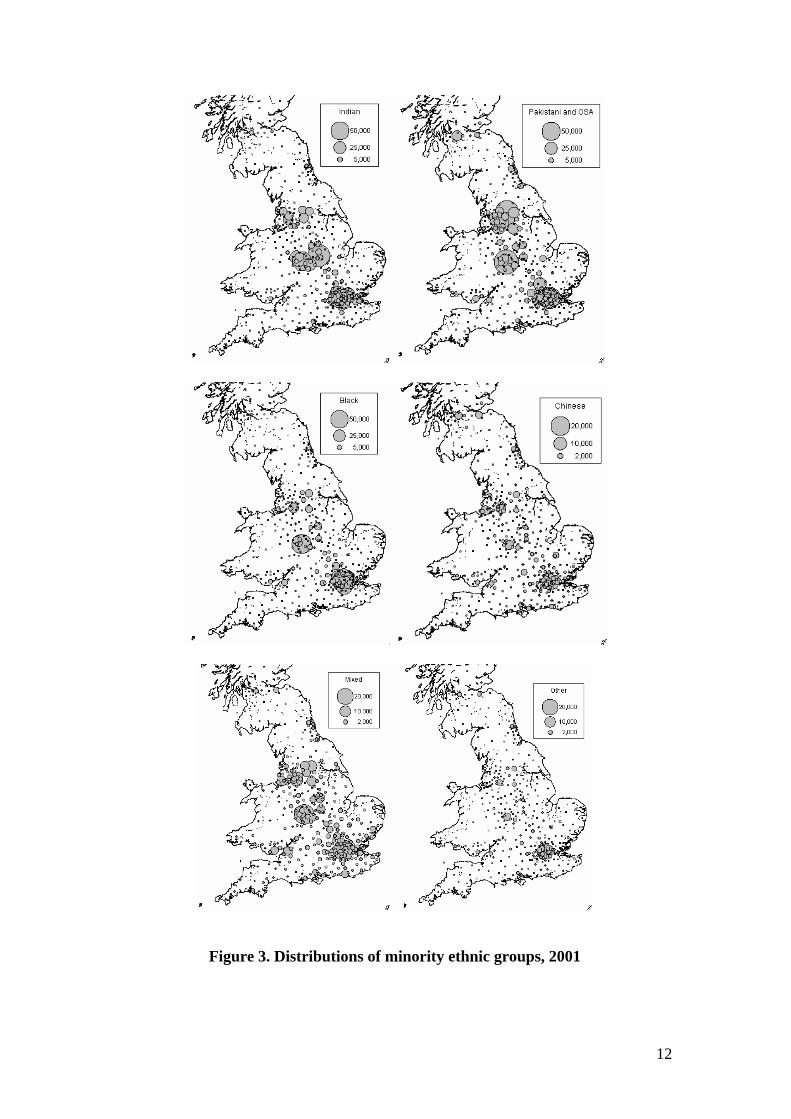
The distributions of usual residents in each of the six ethnic minority
populations are shown in Figure 3, where the scale used for the symbols extends up to
50,000 for the Indian, Pakistani and OSA and black groups and up to 20,000 for the
remaining groups. These maps illustrate more clearly the patterns of concentration in
provincial England, with Indians preferring towns and cities in the Midlands, and the
Pakistani and OSA group being more numerous in the conurbations of the North
West and Yorkshire and the Humber. London is clearly the major location for these
groups as it is for Blacks, although Birmingham is a popular location. At a lower
order of magnitude, the Chinese and other groups appear to be distributed most
widely across the country, whilst those of mixed ethnicity are found in the big towns
and cities.
12
Figure 3. Distributions of minority ethnic groups, 2001
13
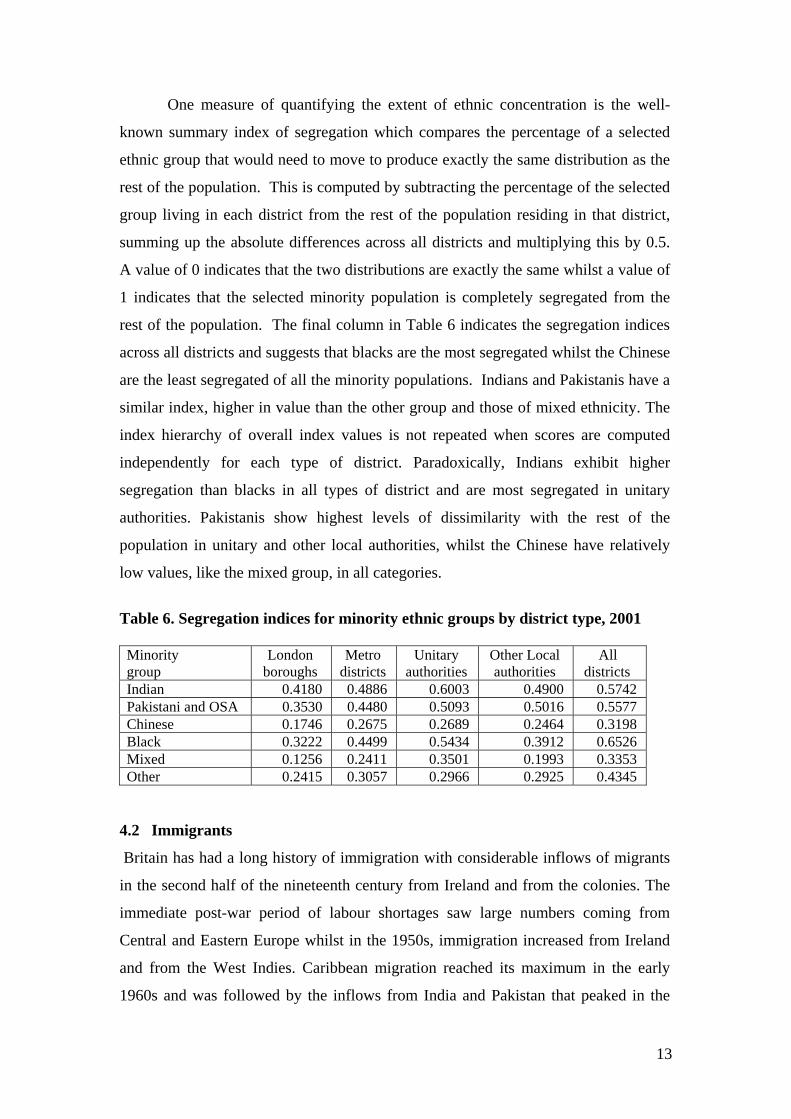
One measure of quantifying the extent of ethnic concentration is the well-
known summary index of segregation which compares the percentage of a selected
ethnic group that would need to move to produce exactly the same distribution as the
rest of the population. This is computed by subtracting the percentage of the selected
group living in each district from the rest of the population residing in that district,
summing up the absolute differences across all districts and multiplying this by 0.5.
A value of 0 indicates that the two distributions are exactly the same whilst a value of
1 indicates that the selected minority population is completely segregated from the
rest of the population. The final column in Table 6 indicates the segregation indices
across all districts and suggests that blacks are the most segregated whilst the Chinese
are the least segregated of all the minority populations. Indians and Pakistanis have a
similar index, higher in value than the other group and those of mixed ethnicity. The
index hierarchy of overall index values is not repeated when scores are computed
independently for each type of district. Paradoxically, Indians exhibit higher
segregation than blacks in all types of district and are most segregated in unitary
authorities. Pakistanis show highest levels of dissimilarity with the rest of the
population in unitary and other local authorities, whilst the Chinese have relatively
low values, like the mixed group, in all categories.
Table 6. Segregation indices for minority ethnic groups by district type, 2001 Minority group
London boroughs
Metro districts
Unitary authorities
Other Local authorities
All districts
Indian 0.4180 0.4886 0.6003 0.4900 0.5742 Pakistani and OSA 0.3530 0.4480 0.5093 0.5016 0.5577 Chinese 0.1746 0.2675 0.2689 0.2464 0.3198 Black 0.3222 0.4499 0.5434 0.3912 0.6526 Mixed 0.1256 0.2411 0.3501 0.1993 0.3353 Other 0.2415 0.3057 0.2966 0.2925 0.4345
4.2 Immigrants
Britain has had a long history of immigration with considerable inflows of migrants
in the second half of the nineteenth century from Ireland and from the colonies. The
immediate post-war period of labour shortages saw large numbers coming from
Central and Eastern Europe whilst in the 1950s, immigration increased from Ireland
and from the West Indies. Caribbean migration reached its maximum in the early
1960s and was followed by the inflows from India and Pakistan that peaked in the
14
late 60s and early 70s and inflows from Bangladesh and the African Commonwealth
countries including Kenya and Tanzania which were highest in the early 1980s
(Haskey, 1997). A sequence of Acts of Parliament were implemented between 1962
and 1988 that restricted the inflows and the wave of labour migrants characteristic of
these years were replaced with wave of immigrants seeking family reunification and
subsequently, by those that White (1993) refers to as post-industrial movers, those
with high skills, those arriving illegally and those seeking asylum. It is the latter that
have increased in magnitude during the latter years of the 1990s and early twentieth
century.
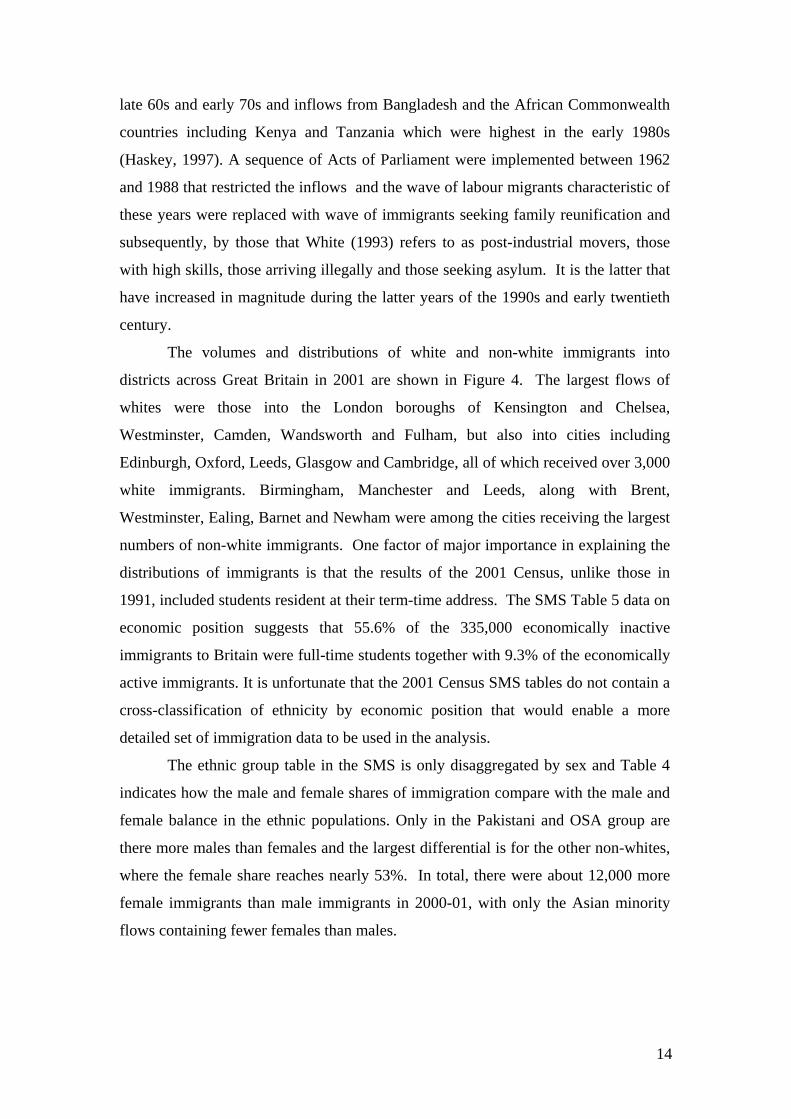
The volumes and distributions of white and non-white immigrants into
districts across Great Britain in 2001 are shown in Figure 4. The largest flows of
whites were those into the London boroughs of Kensington and Chelsea,
Westminster, Camden, Wandsworth and Fulham, but also into cities including
Edinburgh, Oxford, Leeds, Glasgow and Cambridge, all of which received over 3,000
white immigrants. Birmingham, Manchester and Leeds, along with Brent,
Westminster, Ealing, Barnet and Newham were among the cities receiving the largest
numbers of non-white immigrants. One factor of major importance in explaining the
distributions of immigrants is that the results of the 2001 Census, unlike those in
1991, included students resident at their term-time address. The SMS Table 5 data on
economic position suggests that 55.6% of the 335,000 economically inactive
immigrants to Britain were full-time students together with 9.3% of the economically
active immigrants. It is unfortunate that the 2001 Census SMS tables do not contain a
cross-classification of ethnicity by economic position that would enable a more
detailed set of immigration data to be used in the analysis.
The ethnic group table in the SMS is only disaggregated by sex and Table 4
indicates how the male and female shares of immigration compare with the male and
female balance in the ethnic populations. Only in the Pakistani and OSA group are
there more males than females and the largest differential is for the other non-whites,
where the female share reaches nearly 53%. In total, there were about 12,000 more
female immigrants than male immigrants in 2000-01, with only the Asian minority
flows containing fewer females than males.
15
Figure 4. Distributions of white and non-white immigrants, 2000-01 Table 4. Sex structure of ethnic groups and immigrants
Ethnic group Immigration Ethnic group Male % Female % Male % Female % White 49.1 50.9 48.6 51.4 Indian 49.4 50.6 52.4 47.6 Pakistani and OSA 53.2 46.8 54.7 45.3 Chinese 48.5 51.5 45.2 54.8 Black 48.4 51.6 48.1 51.9 Mixed 48.7 51.3 48.7 51.3 Other 47.1 52.9 41.9 58.1 Total 49.2 50.8 48.5 51.5
Source: 2001 Census KS and SMS
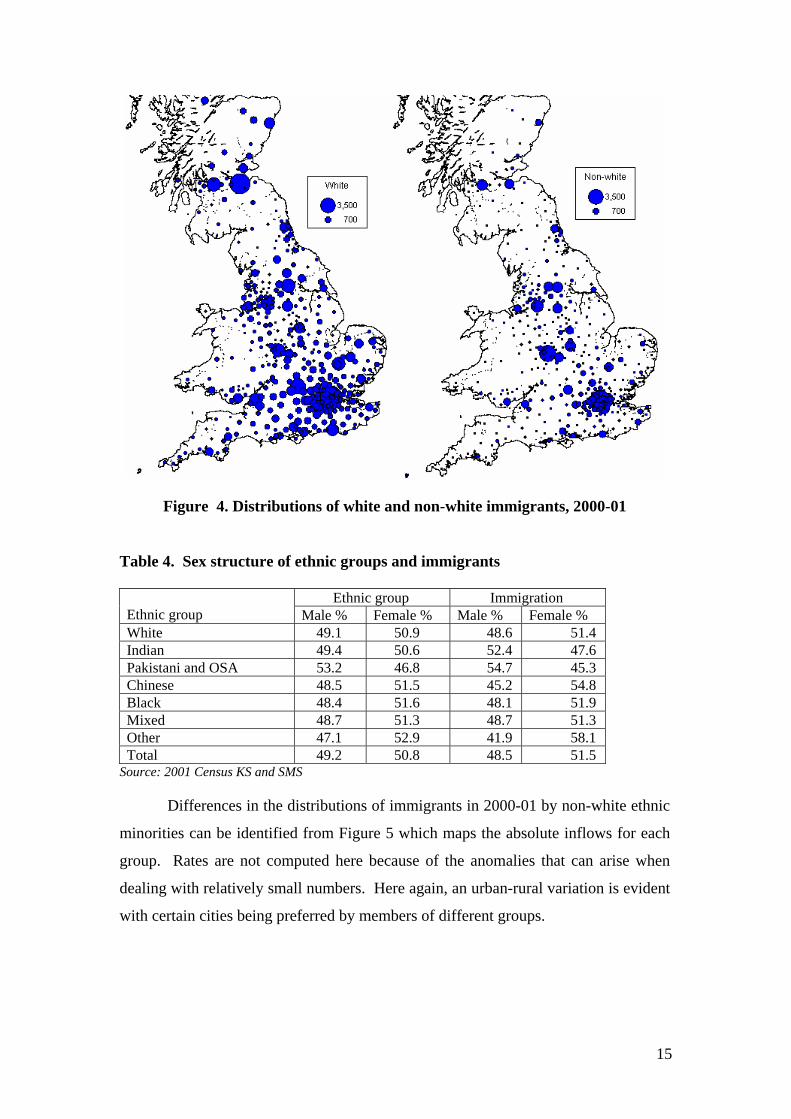
Differences in the distributions of immigrants in 2000-01 by non-white ethnic
minorities can be identified from Figure 5 which maps the absolute inflows for each
group. Rates are not computed here because of the anomalies that can arise when
dealing with relatively small numbers. Here again, an urban-rural variation is evident
with certain cities being preferred by members of different groups.
16
Figure 5. Distributions of ethnic minority immigration flows, 2000-01
17
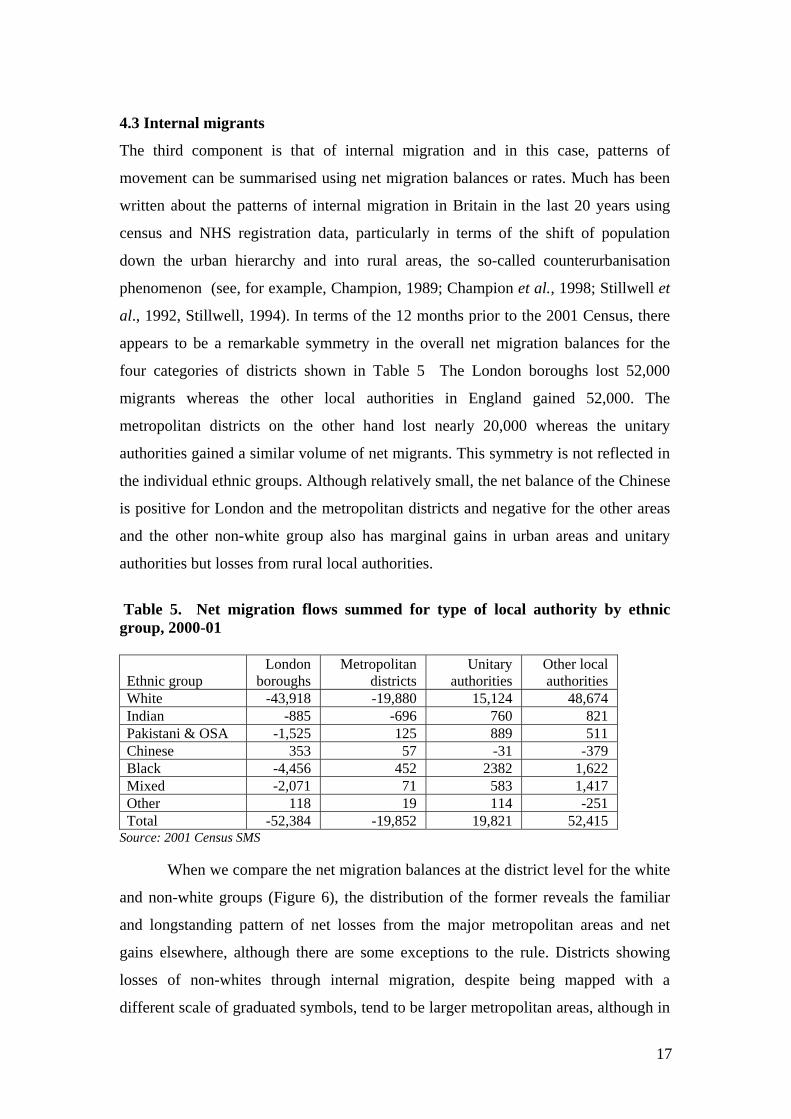
4.3 Internal migrants
The third component is that of internal migration and in this case, patterns of
movement can be summarised using net migration balances or rates. Much has been
written about the patterns of internal migration in Britain in the last 20 years using
census and NHS registration data, particularly in terms of the shift of population
down the urban hierarchy and into rural areas, the so-called counterurbanisation
phenomenon (see, for example, Champion, 1989; Champion et al., 1998; Stillwell et
al., 1992, Stillwell, 1994). In terms of the 12 months prior to the 2001 Census, there
appears to be a remarkable symmetry in the overall net migration balances for the
four categories of districts shown in Table 5 The London boroughs lost 52,000
migrants whereas the other local authorities in England gained 52,000. The
metropolitan districts on the other hand lost nearly 20,000 whereas the unitary
authorities gained a similar volume of net migrants. This symmetry is not reflected in
the individual ethnic groups. Although relatively small, the net balance of the Chinese
is positive for London and the metropolitan districts and negative for the other areas
and the other non-white group also has marginal gains in urban areas and unitary
authorities but losses from rural local authorities.
Table 5. Net migration flows summed for type of local authority by ethnic group, 2000-01
Ethnic group London
boroughs Metropolitan
districts Unitary
authorities Other local authorities
White -43,918 -19,880 15,124 48,674 Indian -885 -696 760 821 Pakistani & OSA -1,525 125 889 511 Chinese 353 57 -31 -379 Black -4,456 452 2382 1,622 Mixed -2,071 71 583 1,417 Other 118 19 114 -251 Total -52,384 -19,852 19,821 52,415
Source: 2001 Census SMS
When we compare the net migration balances at the district level for the white
and non-white groups (Figure 6), the distribution of the former reveals the familiar
and longstanding pattern of net losses from the major metropolitan areas and net
gains elsewhere, although there are some exceptions to the rule. Districts showing
losses of non-whites through internal migration, despite being mapped with a
different scale of graduated symbols, tend to be larger metropolitan areas, although in
18
the case of London, losses occur only from the inner boroughs and the outer boroughs
are all gaining. Gains are also evident in many of the freestanding cities.
Figure 6. Net migration balances for whites and non-whites, 2000-01
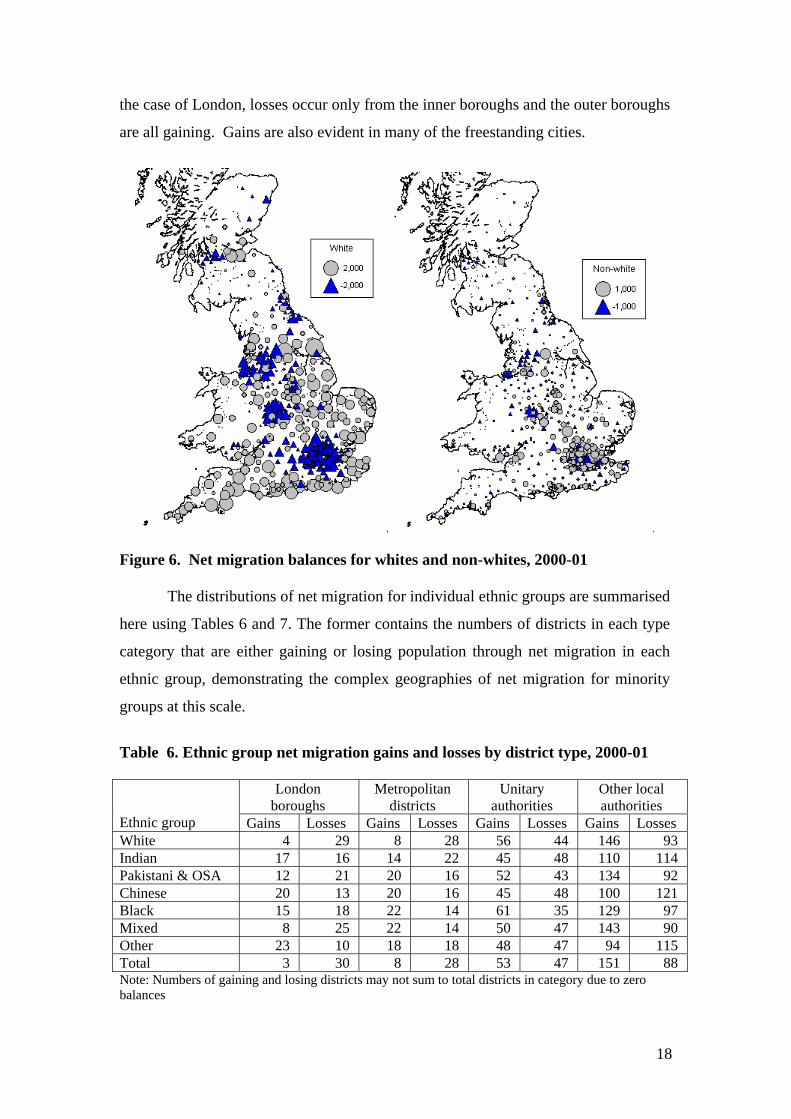
The distributions of net migration for individual ethnic groups are summarised
here using Tables 6 and 7. The former contains the numbers of districts in each type
category that are either gaining or losing population through net migration in each
ethnic group, demonstrating the complex geographies of net migration for minority
groups at this scale.
Table 6. Ethnic group net migration gains and losses by district type, 2000-01
London boroughs
Metropolitan districts
Unitary authorities
Other local authorities
Ethnic group Gains Losses Gains Losses Gains Losses Gains Losses White 4 29 8 28 56 44 146 93 Indian 17 16 14 22 45 48 110 114 Pakistani & OSA 12 21 20 16 52 43 134 92 Chinese 20 13 20 16 45 48 100 121 Black 15 18 22 14 61 35 129 97 Mixed 8 25 22 14 50 47 143 90 Other 23 10 18 18 48 47 94 115 Total 3 30 8 28 53 47 151 88 Note: Numbers of gaining and losing districts may not sum to total districts in category due to zero balances
19
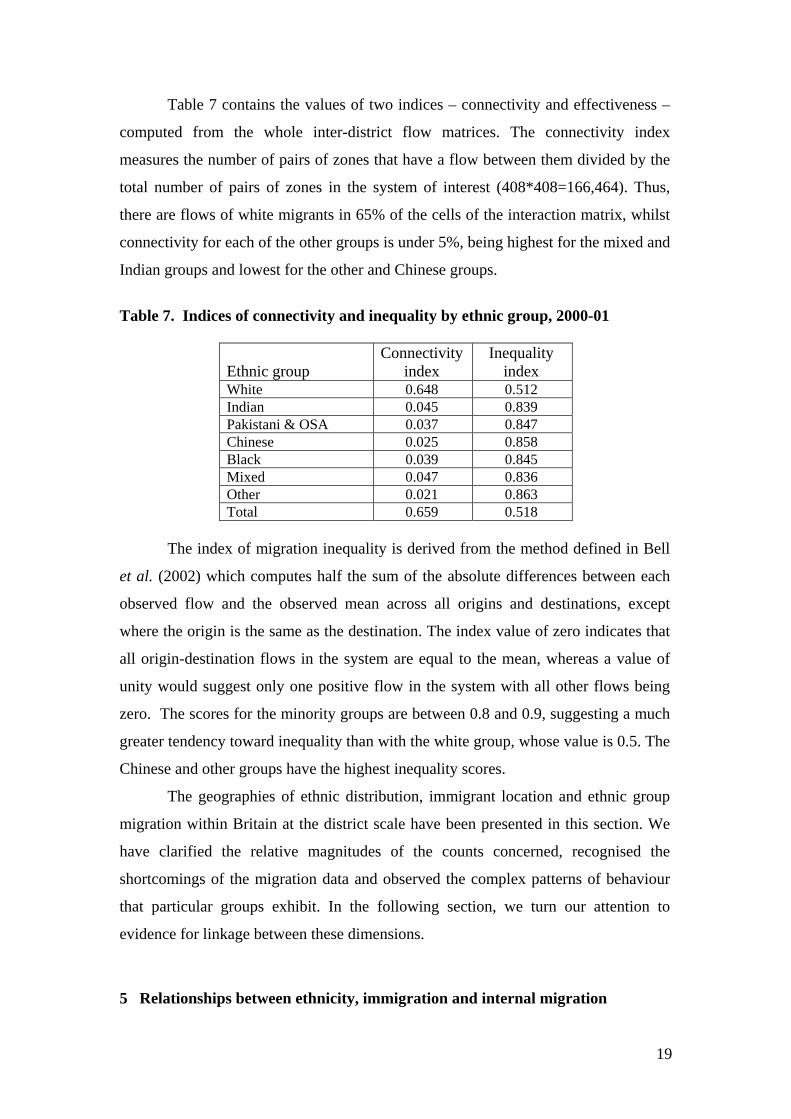
Table 7 contains the values of two indices – connectivity and effectiveness –
computed from the whole inter-district flow matrices. The connectivity index
measures the number of pairs of zones that have a flow between them divided by the
total number of pairs of zones in the system of interest (408*408=166,464). Thus,
there are flows of white migrants in 65% of the cells of the interaction matrix, whilst
connectivity for each of the other groups is under 5%, being highest for the mixed and
Indian groups and lowest for the other and Chinese groups.
Table 7. Indices of connectivity and inequality by ethnic group, 2000-01
Ethnic group Connectivity
index Inequality
index White 0.648 0.512 Indian 0.045 0.839 Pakistani & OSA 0.037 0.847 Chinese 0.025 0.858 Black 0.039 0.845 Mixed 0.047 0.836 Other 0.021 0.863 Total 0.659 0.518
The index of migration inequality is derived from the method defined in Bell
et al. (2002) which computes half the sum of the absolute differences between each
observed flow and the observed mean across all origins and destinations, except
where the origin is the same as the destination. The index value of zero indicates that
all origin-destination flows in the system are equal to the mean, whereas a value of
unity would suggest only one positive flow in the system with all other flows being
zero. The scores for the minority groups are between 0.8 and 0.9, suggesting a much
greater tendency toward inequality than with the white group, whose value is 0.5. The
Chinese and other groups have the highest inequality scores.
The geographies of ethnic distribution, immigrant location and ethnic group
migration within Britain at the district scale have been presented in this section. We
have clarified the relative magnitudes of the counts concerned, recognised the
shortcomings of the migration data and observed the complex patterns of behaviour
that particular groups exhibit. In the following section, we turn our attention to
evidence for linkage between these dimensions.
5 Relationships between ethnicity, immigration and internal migration
20
We confine our analysis in this section to answering three questions. Firstly, is
immigration of different minority ethnic groups contributing to the process of their
residential concentration? Secondly, are internal migration flows of minority ethnic
groups causing the accentuation of ethnic concentration or do they suggest processes
of deconcentration? Thirdly, is there any evidence to suggest a relationship between
non-white immigration and white internal migration?
The relationship between ethnic minority concentration and immigration is
one we might expect to be positive. Traditionally, generations of immigrants have
followed their predecessors to locations in which they can benefit from the social and
family networks, the feelings of security and the economic and accommodation
opportunities that may be available in a community with people of the same racial
background. We might therefore expect to find that places whose populations contain
relatively large numbers of ethnic minorities will attract larger number of immigrants
from that ethnic group. In order to examine this, we have ranked the 408 districts
according to their respective populations of Indian, Pakistani and OSA, Chinese and
black minorities and plotted populations against immigrants for each group using a
logarithmic scale (Figure 7) since the distribution of population values is one with a
smaller number of large values and larger number of smaller values. Thus the
ordering of districts along the horizontal axis is different in each of the four plots. In
each case, the trend in immigration volume follows, in general terms, the decline in
population size, However, the variation in immigration is much less pronounced for
the Pakistani and OSA group, suggesting a closer relationship than for the other
groups selected.
This is confirmed by the correlation coefficient of 0.891 between the
population and immigration counts for this ethnic group based on all 408 areas (Table
8), although the correlation is less significant between the ethnic share and the
immigration count, the ethnic population and the immigration rate and the ethnic
share and the immigration rate. The rate variables have been defined using the total
populations as denominators rather than ethnic group populations. The graph for the
black minority group in Figure 7 is interesting because there is little variation in the
rankings of population and immigration for the first dozen districts but increasing
variation thereafter. The correlation coefficients for blacks using each of the four
combinations of variables suggests that it is this minority group where the linkage
between concentration and immigration is strongest. In fact the coefficients are
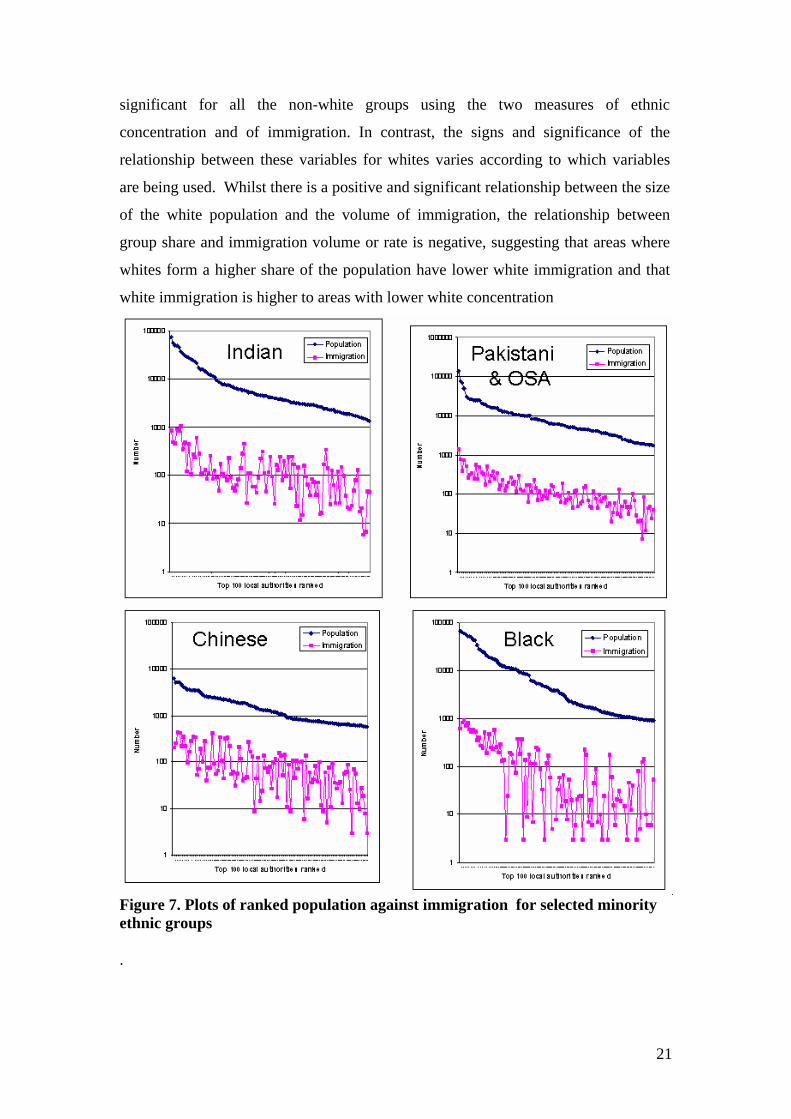
21
significant for all the non-white groups using the two measures of ethnic
concentration and of immigration. In contrast, the signs and significance of the
relationship between these variables for whites varies according to which variables
are being used. Whilst there is a positive and significant relationship between the size
of the white population and the volume of immigration, the relationship between
group share and immigration volume or rate is negative, suggesting that areas where
whites form a higher share of the population have lower white immigration and that
white immigration is higher to areas with lower white concentration
Figure 7. Plots of ranked population against immigration for selected minority ethnic groups .
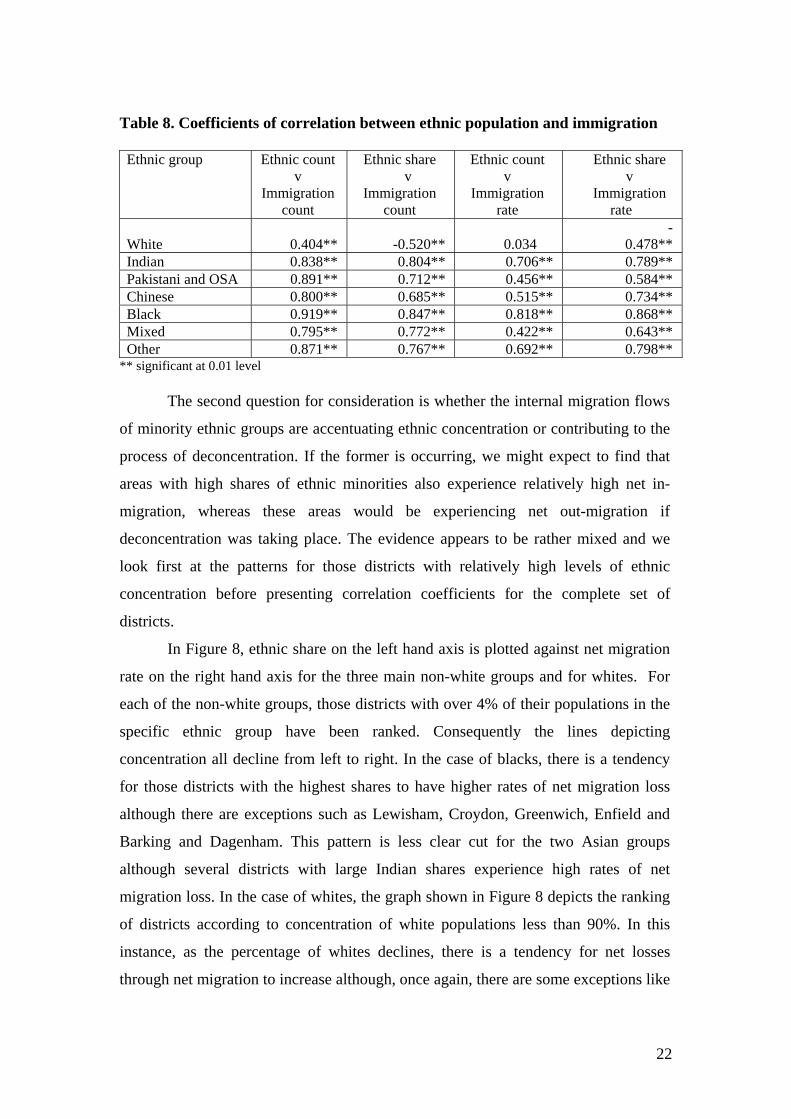
22
Table 8. Coefficients of correlation between ethnic population and immigration Ethnic group Ethnic count
v Immigration
count
Ethnic share v
Immigration count
Ethnic count v
Immigration rate
Ethnic share v
Immigration rate
White 0.404** -0.520**
0.034 -
0.478** Indian 0.838** 0.804** 0.706** 0.789** Pakistani and OSA 0.891** 0.712** 0.456** 0.584** Chinese 0.800** 0.685** 0.515** 0.734** Black 0.919** 0.847** 0.818** 0.868** Mixed 0.795** 0.772** 0.422** 0.643** Other 0.871** 0.767** 0.692** 0.798**
** significant at 0.01 level
The second question for consideration is whether the internal migration flows
of minority ethnic groups are accentuating ethnic concentration or contributing to the
process of deconcentration. If the former is occurring, we might expect to find that
areas with high shares of ethnic minorities also experience relatively high net in-
migration, whereas these areas would be experiencing net out-migration if
deconcentration was taking place. The evidence appears to be rather mixed and we
look first at the patterns for those districts with relatively high levels of ethnic
concentration before presenting correlation coefficients for the complete set of
districts.
In Figure 8, ethnic share on the left hand axis is plotted against net migration
rate on the right hand axis for the three main non-white groups and for whites. For
each of the non-white groups, those districts with over 4% of their populations in the
specific ethnic group have been ranked. Consequently the lines depicting
concentration all decline from left to right. In the case of blacks, there is a tendency
for those districts with the highest shares to have higher rates of net migration loss
although there are exceptions such as Lewisham, Croydon, Greenwich, Enfield and
Barking and Dagenham. This pattern is less clear cut for the two Asian groups
although several districts with large Indian shares experience high rates of net
migration loss. In the case of whites, the graph shown in Figure 8 depicts the ranking
of districts according to concentration of white populations less than 90%. In this
instance, as the percentage of whites declines, there is a tendency for net losses
through net migration to increase although, once again, there are some exceptions like
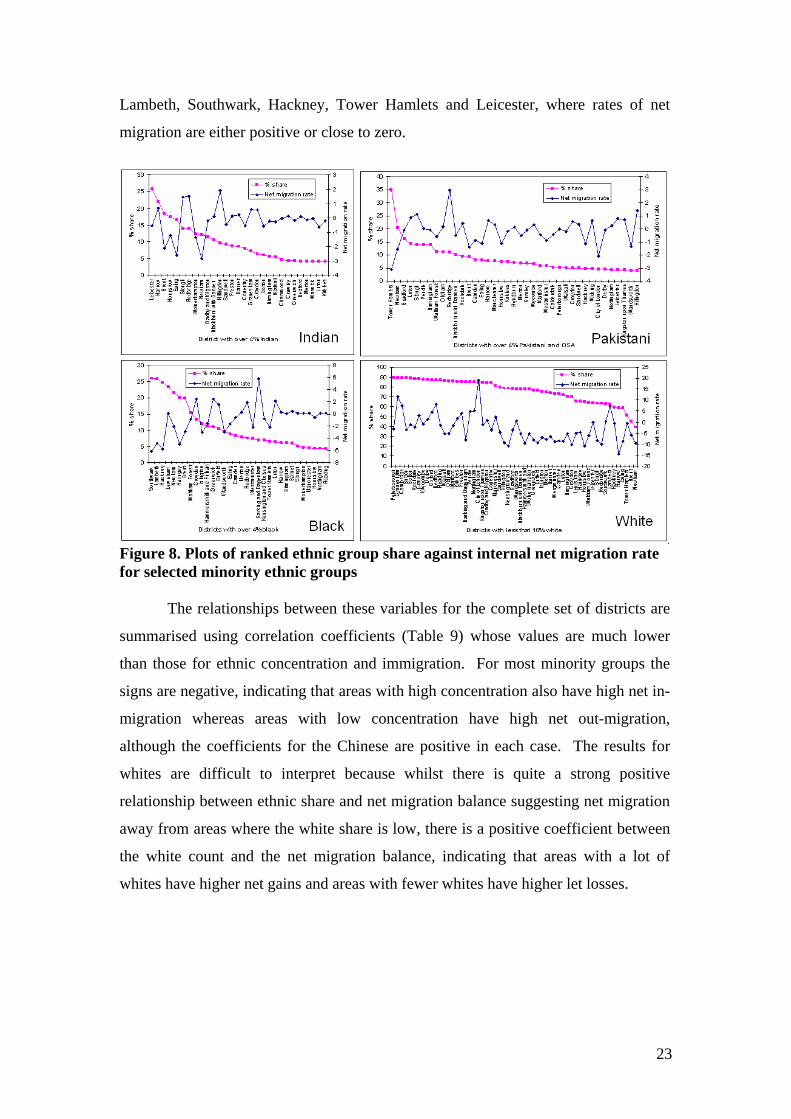
23
Lambeth, Southwark, Hackney, Tower Hamlets and Leicester, where rates of net
migration are either positive or close to zero.
Figure 8. Plots of ranked ethnic group share against internal net migration rate for selected minority ethnic groups
The relationships between these variables for the complete set of districts are
summarised using correlation coefficients (Table 9) whose values are much lower
than those for ethnic concentration and immigration. For most minority groups the
signs are negative, indicating that areas with high concentration also have high net in-
migration whereas areas with low concentration have high net out-migration,
although the coefficients for the Chinese are positive in each case. The results for
whites are difficult to interpret because whilst there is quite a strong positive
relationship between ethnic share and net migration balance suggesting net migration
away from areas where the white share is low, there is a positive coefficient between
the white count and the net migration balance, indicating that areas with a lot of
whites have higher net gains and areas with fewer whites have higher let losses.
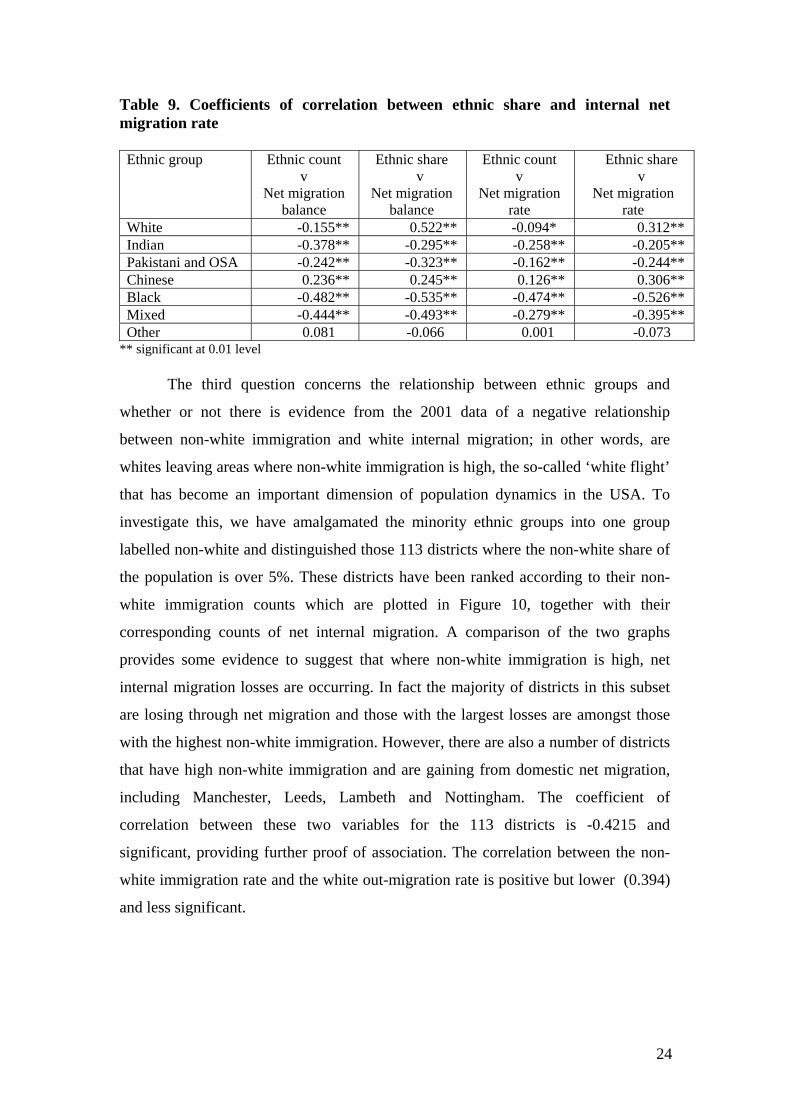
24
Table 9. Coefficients of correlation between ethnic share and internal net migration rate Ethnic group Ethnic count
v Net migration
balance
Ethnic share v
Net migration balance
Ethnic count v
Net migration rate
Ethnic share v
Net migration rate
White -0.155** 0.522** -0.094* 0.312** Indian -0.378** -0.295** -0.258** -0.205** Pakistani and OSA -0.242** -0.323** -0.162** -0.244** Chinese 0.236** 0.245** 0.126** 0.306** Black -0.482** -0.535** -0.474** -0.526** Mixed -0.444** -0.493** -0.279** -0.395** Other 0.081 -0.066 0.001 -0.073
** significant at 0.01 level
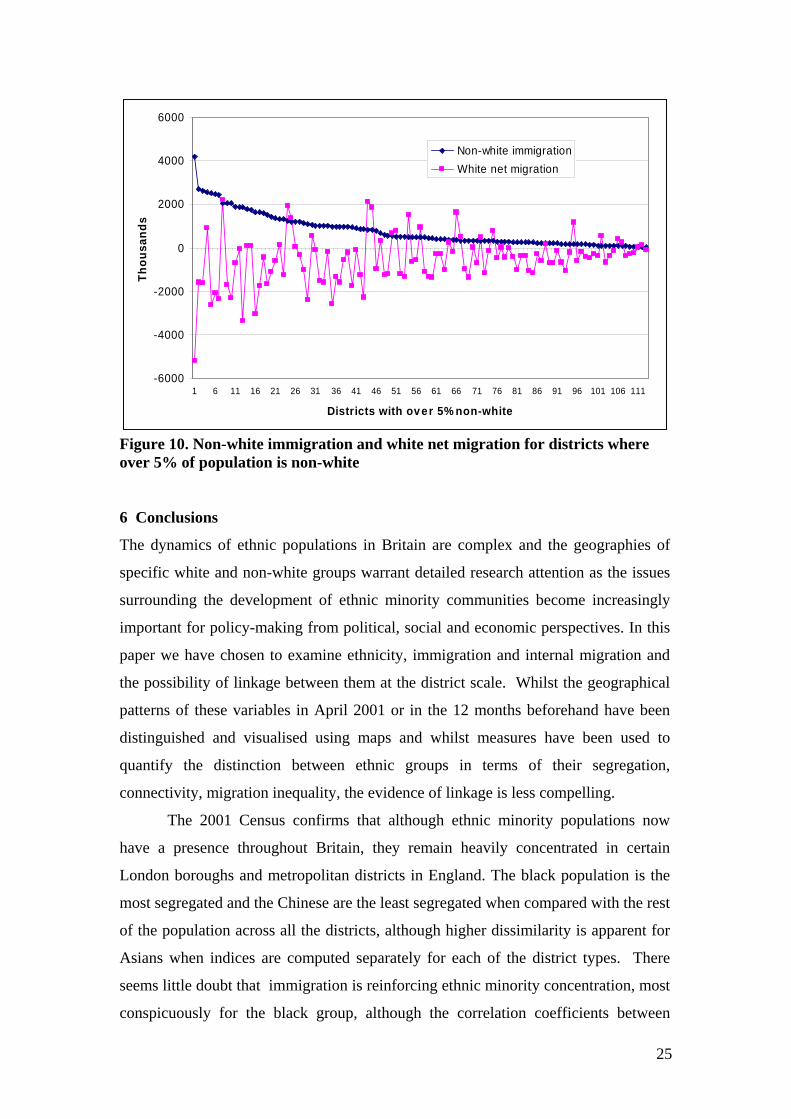
The third question concerns the relationship between ethnic groups and
whether or not there is evidence from the 2001 data of a negative relationship
between non-white immigration and white internal migration; in other words, are
whites leaving areas where non-white immigration is high, the so-called ‘white flight’
that has become an important dimension of population dynamics in the USA. To
investigate this, we have amalgamated the minority ethnic groups into one group
labelled non-white and distinguished those 113 districts where the non-white share of
the population is over 5%. These districts have been ranked according to their non-
white immigration counts which are plotted in Figure 10, together with their
corresponding counts of net internal migration. A comparison of the two graphs
provides some evidence to suggest that where non-white immigration is high, net
internal migration losses are occurring. In fact the majority of districts in this subset
are losing through net migration and those with the largest losses are amongst those
with the highest non-white immigration. However, there are also a number of districts
that have high non-white immigration and are gaining from domestic net migration,
including Manchester, Leeds, Lambeth and Nottingham. The coefficient of
correlation between these two variables for the 113 districts is -0.4215 and
significant, providing further proof of association. The correlation between the non-
white immigration rate and the white out-migration rate is positive but lower (0.394)
and less significant.
25
-6000
-4000
-2000
0
2000
4000
6000
1 6 11 16 21 26 31 36 41 46 51 56 61 66 71 76 81 86 91 96 101 106 111
Districts with over 5% non-white
Thou
sand
sNon-white immigrationWhite net migration
Figure 10. Non-white immigration and white net migration for districts where over 5% of population is non-white 6 Conclusions
The dynamics of ethnic populations in Britain are complex and the geographies of
specific white and non-white groups warrant detailed research attention as the issues
surrounding the development of ethnic minority communities become increasingly
important for policy-making from political, social and economic perspectives. In this
paper we have chosen to examine ethnicity, immigration and internal migration and
the possibility of linkage between them at the district scale. Whilst the geographical
patterns of these variables in April 2001 or in the 12 months beforehand have been
distinguished and visualised using maps and whilst measures have been used to
quantify the distinction between ethnic groups in terms of their segregation,
connectivity, migration inequality, the evidence of linkage is less compelling.
The 2001 Census confirms that although ethnic minority populations now
have a presence throughout Britain, they remain heavily concentrated in certain
London boroughs and metropolitan districts in England. The black population is the
most segregated and the Chinese are the least segregated when compared with the rest
of the population across all the districts, although higher dissimilarity is apparent for
Asians when indices are computed separately for each of the district types. There
seems little doubt that immigration is reinforcing ethnic minority concentration, most
conspicuously for the black group, although the correlation coefficients between
26
ethnic population and immigration counts are all 0.8 or above and statistically
significant. On the other hand, the evidence for the white population is more obscure
and conflicting; the coefficients measuring correlation between the ethnic counts and
immigration counts and rates are positive whilst those for the ethnic shares and the
immigration variables are negative. Following the latter, this would indicate that more
immigration takes place to areas where the white share of the population is low.
One feature of the 2001 Census data used in the analyses is the inclusion of
students in migration flows in SMS and in the counts of population in the KS. This is
problematic because their movement is driven as much by the supply of places in
higher education institutions as it is by the desire to live in a particular place. The
student community of ethnic minorities tends to be a rather different community from
the ethnic minority communities whose members are permanent residents. In further
research it might be beneficial to commission special tables from ONS that cross-
classify migrants by ethnic group and economic position (and by age and occupation)
so we can identify the types of migrant in more detail and consequently be more
confident in the motivation that is likely to be underpinning the observed flows.
Internal migration involved over 10% on the British population in 2000-01
and the geographical patterns of net migration are characterised by net losses from
London and the metropolitan areas, a relatively longstanding pattern that is dominated
by counterurbanisation movements as was the case in the early 1990s. This pattern of
net migration is dominated by whites whose share of total internal migration was
91%. The relationships between ethnic minority distributions and net migration
balances and rates are much less significant than between ethnicity and immigration,
but the negative correlation coefficients for the major groups support the view that
there is net movement away from areas with higher ethnic concentration and this is
most significant for blacks. For whites, the correlations between ethnic share and
immigration balances and rates are both positive, suggesting net in-movement to
areas with higher shares of whites and net losses from areas with lower shares of
whites.
Finally, our analyses have tried to shed some light on the contentious issue of
the relationship between non-white minority immigration and the internal net
migration of whites, without being able to claim cause and effect. The evidence here
indicates that those areas that have relatively high rates of immigration do also tend to
have relatively high rates of net out-migration and rates of net migration loss fall as
27
immigration rates decline. However, there are a number of districts that do not
conform to this pattern and this suggests the need for a closer look at the types and
locations of the areas concerned. And a more detailed investigation of London
boroughs. Furthermore, in the wider context of research on linkage, given the
preponderance of ethnic minority populations in particular parts of Britain’s
provincial cities, it would seem appropriate for further research to examine these
variables at ward level.
References Bell, M., Blake, M., Boyle, P., Duke-Williams, O, Rees, P., Stillwell, J. and Hugo, G.
(2002) Cross-national comparison of internal migration: issues and measures, Journal of the Royal Statistical Society A, 165 (2): 1-30.
Boyle, P and Feng, Z. (2002) A method for integrating the 1981 and 1991 GB census interaction data, Computers, Environment and Urban Systems, 26: 241-256.
Butcher, G.J. and Card, D. (1991) Immigration and wages: evidence of from the 1980s, American Economic Review, 81: 246-256.
Castles, S. and Miller, M. (1993) The Age of Migration, Macmillan, London. Champion, A. (1989) Counterurbanisation: The Changing Pace and Nature of
Population Deconcentration, Edward Arnold, London. Champion, A. and Fielding, A. (eds.) (1992) Migration Processes and Patterns
Volume 1 Research Progress and Prospects, Belhaven Press, London. Champion, A., Fotheringham, S., Rees, P., Boyle, P. and Stillwell, J. (1998) The
Determinants of Migration Flows in England: A Review of Existing Data and Evidence, Report prepared for the Department of the Environment, Transport and the Regions, Department of Geography, University of Newcastle, Newcastle.
Coleman, D. and Salt, J. (1996) Ethnicity in the 1991 Census, Volume 1: Demographic Characteristics of Ethnic Populations, HMSO, London.
Dobson, J. and McLaughlin, G. (2001) International migration to and from the United Kingdom 1975-1999: consistency, change and implications for the labour market, Population Trends, 106: 29-38.
Ellis, M. and Wright, R. (1998) The balkanization metaphor in the analysis of US immigration, Annals of the Association of American Geographers, 88(4): 686-98.
Filer, R. (1992) The effect of immigrant arrivals on migratory patterns of native workers, in Borgas, G.J. and Freman, R.B. (eds.) Immigration and the Work Force: Economic Consequences for the United States and Source Areas, University of Chicago Press, Chicago, pp. 245-270.
Frey, W. (1995) Immigration and internal migration ‘flight’ from the US metropolitan areas: toward a new demographic balkanisation, Urban Studies, 4-5, 733-757.
Frey, W. (1996) Immigration, domestic migration, and demographic balkanization in America: new evidence for the 1990s, Population and Development Review, 22(4): 741-763.
Frey, W. and Liaw, K-L. (1998) The impact of recent immigration on population redistribution within the United States, in Smith, J.P. and Edmonston, B. (eds.) The Immigration debate Studies on the Economic, Demographic and Fiscal Effects of Imigration, National Academy Press, Washington. DC, 388-448.
28
Gorter, C., Nijkamp, P. and Poot, J. (eds.) (1998) Crossing Borders Regional and Urban Perspectives on International Migration, Ashgate, Aldershot.
Haskey, J.(1997) The ethnic minority and overseas-born populations of great Britain, Population Trends, 88: 13-30
Hilderink, H., van der Gaag, N., van Wissen, L., Jenissen, R., Salt, J., Clarke, J. and Pinkerton, C. (2000) Forecasting and Analysis of International Migration by Major Groups, Draft Report of Part 3, NIDI, The Hague.
Johnston, R. Forrest, J. and Poulsen, M. (2002b) The ethnic geography of EthniCities, Ethnicities, 2(2): 209-235.
Korcelli, P. (1994) On interrelations between internal and international migration, Innovation, 7, 2, 151-163.
ODPM (2004) Competitive European regions: where do the core cities stand?, Urban Research Summary 13, ODPM, London.
Peach, C. (ed.) (1996a) Ethnicity in the 1991 Census, Volume 2: the Ethnic Minority Populations of Great Britain, HMSO, London.
Peach, C. (1996b) Does Britain have ghettos?, Transactions, Institute of British Geographers, 21(1): 216-235.
Peach, C. (1999) London and New York: Contrasts in British and American models of segregation (with comment by Nathan Glazer), International Journal of Population Geography, 5: 319-351.
Peloe, A., and Rees, P. (1999) Estimating ethnic change in London, 1981-1991, using a variety of census data, International Journal of Population Geography, 5: 179-194.
Phillips, D. (1998) Black minority ethnic concentration, segregation and dispersal in Britain, Urban Studies, 35(10): 1681-1702.
Ratcliffe, P. (ed.) (1996) Social Geography and Ethnicity in Britain: Geographical Spread, Spatial Concentration and Internal Migration, Volume 3 of Ethnicity in the 1991 Census, HMSO, London.
Rees, P. and Butt, F. (2003) Ethnic change and diversity in England, 1981-2001, Paper presented at the RGS-IBG Annual Conference, London, September.
Robinson, V. (1992) Move on up: the mobility of Britain’s Afro-Caribbean and Asian populations, Chapter 15 in Stillwell, J.C.H, Rees, P.H. and Boden, P. (eds.) Migration Processes and Patterns Volume 2 Population Redistribution in the United Kingdom, Belhaven Press, London, pp. 271-291.
Salt, J., Singleton, A. and Hogarth, J. (1994) Europe’s International Migrants: Data Sources, Patterns and Trends, HMSO, London.
Sassen, S. (1991) The Global Cities, Princeton University Press, Princeton. Sassen, S. (1994) Cities in a World Economy, Pine Forge Press, Thousand Oaks, C.A. Simpson, L. (2004) Statistics of racial segregation: measures, evidence and policy,
Urban Studies, 41 (3): 661-681. Skeldon, R. (1995) The challenge facing migration research: a case for greater
awareness, Progress in Human Geography, 19, 19-96. Stillwell, J. (1994) Monitoring intercensal migration in the United Kingdom,
Environment and Planning A, 26, pp. 1711-1730. Stillwell, J. and Phillips, D. (2005) Diversity and change: understanding the ethnic
geographies of Leeds, Journal of Migration and Ethnic Studies, forthcoming. Stillwell, J. Rees, P. and Boden, P. (eds.) (1992) Migration Processes and patterns
Volume 2 Population Redistribution in the United Kingdom, Belhaven Press, London.
29
Stillwell, J., Eyre, H. and Rees, P. (1999) Regional International Migration and Interregional Migration within the European Union: A Feasibility Study, Final Report for the Commission of the European Communities DGXVI and EUROSTAT, University of Leeds, Leeds.
Stillwell, J. and Duke-Williams, O. (2003) A new web-based interface to British census of population origin-destination statistics, Environment and Planning A, 35:113-132.
Stillwell, J. and Duke-Williams, O. (2005) WICID and the 2001 interaction data, Paper prepared for the CUPUM05 Conference, UCL, London, June
Walker, R., Ellis, M. and Barff, R. (1992) Linked migration systems: immigration and internal labor flows in the United States, Economic Geography, 68, 234-48.
White, P. (1993) The social geography of immigrants in European cities: the geography of arrival, Chapter 3 in King, R. (ed.) The New Geography of European Migrations, Belhaven, London, pp. 47-66.
Wright, R., Ellis, J. and Reibel, M. (1997) The linkage between immigration and internal migration in large metropolitan areas in the United States, Economic Geography, 73, 234-54.