Embed Size (px)
Citation preview
University of Tartu
Faculty of Science and Technology
Institute of Ecology and Earth Sciences
Department of Geograhy
Master thesis in human geography
Ethnic segregation in out-of-home non-employment activity
locations during public and national holidays: a study with mobile
phone data
Veronika Mooses
Supervisors: Prof. Rein Ahas
Siiri Silm PhD
Allowed to defence:
Supervisor:
Head of department:
Tartu 2014
2
Table of contents
Introduction .............................................................................................................................. 3
1. Theoretical background ....................................................................................................... 5
1.1 Ethnic segregation and its causes ..................................................................................... 5
1.2 Different concepts of holidays .......................................................................................... 7
1.2.1 Spatio-temporal approach: activity spaces and holidays .......................................... 7
1.2.2 Cultural approach: ethnicity and holidays ................................................................ 8
1.3 Ethnic segregation in different parts of activity space ..................................................... 9
1.4 Ethnic groups and segregation in Estonia ....................................................................... 11
2. Data and methods ............................................................................................................... 14
2.1 Mobile positioning data and selection of holidays ......................................................... 14
2.2 Methods .......................................................................................................................... 17
3. Results ................................................................................................................................. 19
3.1 The location of people in Tallinn and Estonia outside Tallinn ....................................... 19
3.2 Ethnic differences in spatial distribution ........................................................................ 21
3.3 The influence of destination’s ethnic composition ......................................................... 24
3.4 Summary of results ......................................................................................................... 24
4. Discussion ............................................................................................................................ 26
4.1 Explaining ethnic differences during holidays ............................................................... 26
4.2 Methodological issues .................................................................................................... 30
Conclusions ............................................................................................................................. 32
Kokkuvõte ............................................................................................................................... 34
Acknowledgments ................................................................................................................... 36
References ............................................................................................................................... 37
3
Introduction
Ethnic segregation is a complex socio-geographical process that significantly affects different
domains of the society and individual’s life. Spatial segregation is traditionally defined as a
process through which socially defined groups become spatially separated (Massey et al
2009). In order to get a better understanding of ethnic segregation process and its outcomes, it
is necessary to evaluate the process in various dimensions (Massey & Denton 1988), spaces
(Wong & Shaw 2011) and time (Silm & Ahas 2014b). While residential and workplace
segregation has been the major focus of several segregation studies, little is known about
leisure segregation that has been in the background due to lack of appropriate data. Leisure
segregation can be more dynamic and it can be the outcome of different motives, actors and
structures when compared to long-term changes in residential space. This master thesis
concentrates therefore on ethnic segregation in leisure spaces during certain time-period –
holidays.
There are two approaches how holidays can be conceptualized. From time-use perspective
holidays can be defined as a time for escaping from the routine or a time that is „free“ (Gram
2006). Holidays refer to nationally, religiously or culturally important day and they are
usually opposed to everyday routine, generally involving leisure (Urry 1996). From cultural
perspective holidays can be considered as important means how to build up or sustain
collective and national identity (Zhu 2012). Their number, functions, traditions and
characteristics accord to the needs of social system and they can change throughout time
(Frolova 2013). In an era of ever-growing migration, migrants’ cultural traditions that are
being followed also in the host society can however differ from the majority’s cultural
practises. In that sense, celebration of holidays can be very important part of acculturation
process and it is also an issue for integration policies.
In this study holidays are viewed both from time-use and cultural perspective. On one hand
holidays provide people with free time to undertake certain activities that depend on their
motivations and socio-economic background; on the other hand holidays tend to be routine in
the sense of culturally “inherited” traditions and rituals. It means that not always the activity
choices are freely chosen by an individual but are often derived from the cultural or religious
affiliation. Since holidays are related to leisure-time and its activity places, the spatial location
and movements of different ethnic groups during that time is the reflection of the influence of
various causal factors. Ethnic segregation evident on holidays can differ from the ordinary
leisure-time segregation due to different motivations and contribution of structural factors.
Therefore this topic adds a new perspective and contributes to a better understanding of the
leisure-time segregation that is becoming an interest for segregation scholars.
Until now the information about the role of holidays on people’s spatial behaviour is very
limited. The effects of holidays have been concerned in transportation studies that outline its
influences on human travel behaviour (Cools et al 2007, Cools et al 2009, Cools et al 2010,
Isaacman et al 2011, Sepp 2010) and traffic safety (Anowar et al 2013). Holidays affect the
demand and the supply for activities, the distribution of passengers and goods; they can also
influence infrastructures and their management systems (Cools et al 2007, Cools et al 2009,
4
Cools et al 2010). During holidays people conduct different activities and travel further
distances than on everyday routine (Cools et al 2007, Sepp 2010, Isaacman et al 2011).
However, time-use and transportation studies tend to deliberately avoid the inclusion of
holidays in the study periods therefore the knowledge about holiday effects on spatial
behaviour is rather limited. The effect of particular holidays like Thanksgiving Day
(Wallendorf & Arnould 1991), Valentine’s Day (Close & Zinkhan 2009), Labor Day (Ngai
2003) and Christmas (Fischer & Arnold 1990) on consumption behaviour has also been
studied. In the sense of ethnic differences and segregation holidays have got very little
attention in academic literature.
Therefore, the objective of this paper is to explore the effect of different holidays on
Estonians and Russian-speaking minority’s out-of-home non-employment activity locations,
including also leisure-time activities undertaken outside home area. The topic is studied in
Estonia using mobile telephone usage data with 12500 respondents and a study period
encompassing the years 2007 to 2010. Estonia is a small country with a total population of 1.3
million and with a clearly distinguishable Russian ethnic minority. Research questions are as
follows:
1) How does the location of people change in- and outside their home-city during
holidays?
2) How do holidays affect the spatial distribution of ethnic groups?
3) Does the destination’s ethnic composition affect the activity locations during
holidays?
This thesis is divided into four parts. In the first part compact overview about the causes and
patterns of ethnic segregation in different parts of human’s activity space is given. Also, two
approaches how to define holidays is outlined. In the second part an overview about the data,
included holidays and used methods is provided. Third part outlines the results according to
the research questions and in the discussion part possible explanations derived from the theory
are given for the results. It is noteworthy that this master thesis is intentionally rather compact
due to further publishing plans and accompanying limits for the length.
5
1. Theoretical background
1.1 Ethnic segregation and its causes
The circumstances, where and how different ethnic groups live, move or interact with each
other, have lead to a wide range of ethnic segregation studies. Ethnic segregation is a
geographical process through which ethnic groups become spatially separated in different
parts of human activity space. It means that members of certain ethnic groups tend to live (e.g.
Clark 2002, Charles 2003, Johnston et al 2007b, Musterd & van Kempen 2009), work (e.g.
Ellis et al 2004), or spend free time (e.g. Dixon & Durrheim 2003) with members of their own
group.
The causes for segregation vary in different parts of human activity space. In general the
reasons can be divided into four: discrimination, disadvantage, preferences and social
networks (Allen & Turner 2011, Wang et al 2012). First, host society’s prejudices and
discriminatory practises towards minorities can restrict their access to residence locations, job
opportunities and free time activity locations (Johnston et al 2007a). Minorities’ spatial
separation from the majority can be also intentional defensive reaction against discrimination.
(Musterd & van Kempen 2009, Peach 1996). Discrimination in leisure-spaces results in
undertaking activities in ethnically homogeneous groups as well as visiting minorities’ own
well-defined social spaces (Stodolska 2007). Being discriminated can result in lower socio-
economic position and disadvantaged position in society.
Disadvantage or marginality effect states that social structural barriers like lower socio-
economic status of minorities in terms of education, income, occupation and employment
limits minorities’ opportunities (Allen & Turner 2011, Johnson et al 2001) in different parts of
person’s activity space. Differences in income and wealth can restrict access to housing
market and leisure-time facilities. Household income (Musterd & van Kempen 2009), cost of
recreation activities (Wasburne 1978 cit Stodolska 1998), access to transport and information
(Stodolska 1998, Kamruzzaman & Hine 2012) can limit minorities’ activity locations and
social experience, which can lead to residential and leisure-time segregation. Lower education
and discriminatory practises, also living in segregated neighbourhoods can influence
workplace segregation (Strömgren et al 2011). During holidays, being in a disadvantaged
position and having less economical opportunities can affect the minorities’ chances for
making travels and taking part in free-time activities or different holiday celebrations.
Preferences represent more ethno-cultural approach, according to which individual’s choices
are often affected by ethnic background. It is often opposed to marginality and discrimination
approach that stresses the influence of structural constraints. Preferences are influenced on
one hand by the homophily principle – people prefer to spend free-time (Stodolska 2007),
communicate (McPherson et al 2001) or live with others of similar background (Allan &
Turner 2011). This approach stresses the element of choice (Musterd & van Kempen 2009)
and the process itself is sometimes referred as “self-segregation” (White et al 1993) or “ethnic
enclosure” (Stodolska 2007). During national holidays individual’s preference to spend time
among own group can be very evident, because then it is possible to strengthen community-
6
feeling and the sense of belonging to a certain group (Fox 2006). On the other hand,
according to ethnicity thesis, ethnic background often shapes the activities of minorities due
to cultural values, norms and traditions that result in residential segregation (Musterd & van
Kempen 2009) and different recreation behaviour (Floyd 1999). For example, Aizlewood et al
(2006) found that those who were religious had the smallest participation rate in recreation
activities. Activities undertaken on holidays are also often influenced by ethno-cultural and
religious traditions. Identity thesis indicates that different activities, especially leisure-time
choices, can enhance the preservation of ethnic identity (Karlis & Dawson 1990). It means
that ethnic minorities might avoid ’mainstream’ activities (Aizlewood et al 2006), such as
celebrating majority’s holidays (Fox 2006) in order to keep their own identity and heritage.
Social networks are mediums for information that can form a basis for residential (White et al
1993), work (van Kempen & Özüekren 1998) or leisure time ethnic segregation (Silm & Ahas
2014a). In the initial stages of immigration, social networks can lessen the culture shock of
immigrants. Nevertheless, due to cultural proximity, accessibility to necessary information
and socio-economic benefits, minorities choose to live near others of the same ethnic group
also after the initial reception of the host country (White et al 1993). Besides the benefits,
relatively “monocultural” social networks can, however, limit minorities’ social worlds in
terms of “information what they receive, attitudes they form and interactions they experience”
(McPherson et al 2001). The effect of social networks is especially evident in leisure time
activities, because the notion of leisure is associated with interactions with friends and family
(Schlich et al 2007, Carr & Williams 1993). Social link between people can trigger activities
and travel between them (Carrasco & Miller 2006), so social networks are often reflected in
the travel behaviour and longer travel distances (Carrasco & Miller 2009, Sheller & Urry
2006). Social networks have a very big impact on people’s movements also during holidays,
because at that time it is possible to conduct different activities and rituals in order to sustain
and express people’s ethnicity or nationality, reunite with the family (Wallendorf & Arnould
1991, Sepp 2010) and visit friends that are important to strengthen the community-feeling
(Close & Zikhan 2009). Socialization occurring on holidays can have a positive impact on
maintaining social contacts and it enables easier „social matching“ on ordinary workdays and
weekends (Merz & Osberg 2006).
The effect of causal factors can vary in different socio-geographical spaces and are often
interrelated (Johnson et al 2001). For example, restrictions to work or education
(discrimination, marginality) can affect recreation opportunities and residence locations.
Residential neighbourhood can in turn affect the composition of social networks (Verbrugge
1983, McPherson et al 2001) and the degree of disadvantage of out-home activity locations
(Krivo et al 2013). Studies supporting marginality effect state, that socio-economic
background influences recreation choices more than the ethno-cultural minority status (Peters
2008, Aizlewood et al 2006). In contrast, ethnicity based hypothesises state that through
leisure-time activities ethnic groups can maintain and express their ethnic boundaries,
preferences and identity (Floyd 1999, Allison & Ceiger 1993, Karlis & Dawson 1990) or
contrast themselves from other groups (Wasburne & Wall 1980). Minorities’ leisure time
7
activities are often also more family-centred what indicates the importance of social networks
(Peters 2008, Stodolska 2007) and cultural values.
1.2 Different concepts of holidays
1.2.1 Spatio-temporal approach: activity spaces and holidays
All human activities have a measurable spatial-temporal dimension (Hägerstrand 1970). This
is connected to concept of activity space, which is traditionally defined as „the subset of all
urban location with which the individual has direct contact as the result of day-to-day
activities” (Horton and Reynolds 1971, p 37). In more general level, activity space combines
spatial, temporal and cognitive dimensions of activities, along which differences between
individuals can occur (Wang et al 2012).
The focus of activity space-based studies has been generally on its spatial dimension.
According to Golledge & Stimson (1997) individual’s activity space consists of different
spatial locations where person conducts his/her daily activities. Person’s activity space can be
divided into three domains such as residential, work-place and leisure-time space which all
represent the spaces where ethnic segregation can occur. Temporal dimension of activity
space is, however, rather obscure.
Time that is used for different activities can be divided into four groups: work-time,
household time, personal time and free time (Robinson & Godbey 1997). Since holidays have
gained relatively little attention in time-use studies, there is a lack of definition of this time
period. Nevertheless, because holidays often represent free days, it can be considered as free-
time. Free time consists of leisure (socializing, culture, hobbies etc) and “semi-leisure”
(organizational activities, religion etc) activities that are to a more or less extent chosen by
individuals (Robinson & Godbey 1997). How people are using time for different activities
depend on several space-time constraints (Hägerstrand 1970, Thrift 1977), individual
preferences, possibilities and various structural factors like weekday, season, climatic
conditions and type of day (normal vs holiday) (Cools et al 2007). Obligatory (work, school)
and household maintenance activities depend more on socio-structural constraints and thus
have a recognizable daily and weekly pattern (Golledge & Stimson 1997, Järv 2014).
Activities that are undertaken outside residence and workplace (i.e. out-of-home non-
employment activities) during free time have a higher temporal variation (Schlich et al 2007).
Activities occurring on holidays can, thus, differ from everyday routine (Gram 2006) and
from everyday leisure activities (e.g. going to gym). Free days that often come along with
holidays, give people opportunities to travel longer distances, reunite with the family
(Wallendorf & Arnould 1991) and friends or to perform different cultural or religious
activities. The irregular temporal nature of holidays and accompanying activities require
longer study periods.
Wong & Shaw (2011) have stated that activity space concept lacks temporal dimension.
Although the definition provided by Golledge & Stimson (1997) refers to daily spaces, it has
8
also been used for longer time periods such as weeks (Schönfelder 2003) or months (Järv et al
2014). Moreover, it has been applied also to non-routine activities and corresponding time-
periods, such as celebrating Christmas (e.g. Sepp 2010). During holidays individual’s activity
space may be wider when compared to ordinary time due to presence of free days when the
travel distance is usually longer and people conduct different activities (Cools et al 2007). The
type of holiday is also important: even though some holidays are working days, the emotional
and cultural meaning can still trigger different activities and travel behaviour when compared
with ordinary days. This refers to cultural property of holidays.
1.2.2 Cultural approach: ethnicity and holidays
From a cultural perspective, holidays are closely related to ethnicity. Ethnicity is a notion of
group’s unity and a manifestation of human collectivity (Sasidharan 2002) that is based on
language, religion, culture, appearance, ancestry or geographic origin (Nagel 1994). Two
basic components of ethnicity are identity and culture (Nagel 1994). Identity is formed by
designating group membership boundaries, i.e. who is “us“ and “them“ (Nagel 1994). The
creation of ethnic culture is related to the historical evolution and practice of particular ethnic
elements in everyday life thereby reconstructing and reshaping it (Nagel 1994).
The role of ethnicity is twofold - instrumental, expressive - which is also linked to temporal
dimensions. First, instrumental function, i.e. regulating everyday life (Gans 1979), occurs
mostly on a daily basis. The notion of ethnic belonging is usually taken for granted and there
is no need for explicitly expressing it. Ethnic culture can be simultaneously practised through
language, art, music, dressing, religion, norms, beliefs, symbols, myths and customs (Nagel
1994, Vihalemm 1999). Second, expressive function appears more on a longer time-scale
when the sense of belonging to a certain ethnic group must be reinforced and recreated. That
is the role of holidays that can be considered as instruments for producing national,
organizational or group awareness (Fox 2006), which aim at shaping public memory and
promoting national unity and identity (Zhu 2012). Therefore, holidays are important time for
expressing national (Fox 2006) as well as ethnic belonging. In addition, festive practices
occurring on holidays are laden with cultural meanings and they contribute to sustaining
cultural peculiarities (Fischer & Arnold 1990).
However, the role of ethnicity for migrants and minorities is different compared to ethnic
majority. After immigration the ties to original ethnicity are usually getting weaker (Gordon
1964) and the instrumental function (regulating everyday life) of ethnicity change to more
expressive (stating their ethnic identity) (Gans 1979). It also means that practising ethnic
identity and culture becomes more of a leisure-time activity (Gans 1979, Floyd 1998) because
people have more free choice and they experience fewer constraints during that time (Kelly
1987 cit Floyd 1999). Leisure-time choices can, thus, be an important part of culture
(re)creation and identity assertion for ethnic minorities (Floyd 1998).
National holiday celebrations play an important role in connecting migrants’ diaspora with the
original country (Scully 2012). According to “symbolic ethnicity” concept (Gans 1994)
members of ethnic minorities use particular symbols such as public holidays in order to feel

9
part of the ethnic group or sustain and express their identity instead of practising particular
culture in everyday life. After immigration the holiday traditions are likely to remain,
however, the meaning can change through different immigrant generations. For example,
St.Patrick’s Day parade depicts historically important means of community solidarity for
older Irish migrants, while among later generations the meaning of the day is more
ambivalent, varying from family celebrations to more individualistic activities (Scully 2012).
Celebrating holidays is also an important way for minorities to gain a bigger attention from
the public and claim their ethnicity (Seljamaa 2010).
However, celebrating a holiday does not always serve the function of expressing one’s
culture. For example, in Japan the Christian basis for Christmas holiday is not evident in most
of the Japanese consciousness (Kimura & Belk 2005). Globalization, media and
commercialisation have been successful in exploiting holidays in order to reinforce
consumerism and therefore change the original celebration traditions and invent new rituals
(Close & Zinkhan 2006). Thus, many holidays (e.g. Halloween, Christmas and Valentine’s
Day) are now widely celebrated all over the world, even though there might be no connection
to the particular holiday’s origin and its traditions.
Given the functions and historical roots, holidays can be divided into two groups: civil or
secular and religious holidays (Frolova 2013). Civil holidays are related to national identity
and they emphasize the state’s authority, while religious can be associated with the events of
sacred history (Frolova 2013). Civil holidays can be further divided into public holidays
(established by law, non-working days), national celebration/commemorative days (usually
established by law, working days) and folk holidays (not established by law, but still
important and being celebrated due to cultural reasons).
1.3 Ethnic segregation in different parts of activity space
Activity space approach has been mostly applied for studying the spatial dimension of ethnic
segregation. Most of the traditional segregation research has been done considering residence-
based segregation, which can be viewed as a special case of activity space-based approach
(Wang et al 2012). Literature now clearly states that individuals can experience segregation in
other socio-geographical spaces (work, leisure) beyond residential (Kwan 2013, Wong &
Shaw 2011, Wang et al 2012, Farber et al 2012, Silm & Ahas 2014a, Toomet et al 2011,
Schnell & Benjamini 2001) so the focus of segregation studies should be more wider. Some
scholars stress the importance of elaborating all the spatial dimensions of activity spaces at
once (e.g. Wong & Shaw 2011). It is, however, a great challenge due to data and
methodological issues, which is why most of the studies still focus of particular part of
people’s activity space.
In terms of ethnic segregation, residential space is the most comprehensively studied part of
human’s activity space. Ethnic or racial residential segregation can occur or be experienced in
different dimensions (Massey and Denton 1988) among which the aspect of evenness is
probably one of the most analysed. It refers how differently two ethnic groups are residing
10
among areal units in a city (Massey & Denton 1988). Place of residence influences social
interaction, accessibility to employment, education and other services, thus affecting notably
other domains of everyday life (White et al 1993). Studies have concluded that ethnic and
racial minorities tend to live in poorer inner-city neighbourhoods, while members of majority
most probably reside in affluent metropolitan areas (Massey & Denton 1993, Semyonov &
Glikman 2009). In European cities the level of ethnic residential segregation is found to be
lower than in USA (Musterd 2005). Some studies have indicated also a new trend – ethnic
residential segregation is declining, because minorities are moving to suburbs (Charles 2003),
while the gap between rich and poor i.e. socio-economical segregation is increasing (Massey
et al 2009). In terms of activity-space approach, home is a place where most daily trips start or
end and where many activities are undertaken, making it the most important node in
individuals’ activity space (Wang et al 2012).
Workplace segregation is highly linked to residential segregation. Finding a job in a
neighbourhood with the same ethnic composition is easier due to social networks, better
accessibility to information and availability of certain types of employment opportunities
(Wang 2010, Ǻslund & Skans 2010). Thus, combined with gender, ethnic background plays
an important role in defining an occupation in labour market (Schrover et al 2007). It has been
noted that increasing contacts with natives can further improve immigrant’s success in the
labour market (Tammaru et al 2010). Workplace ethnic segregation is found to be lower than
(Ellis et al 2004, Strömgren et al 2011) or with a similar level (Toomet et al 2011) as
residential segregation.
Studies concerning leisure time have focused mostly on ethnic differences in participating in
different types of activities, for example visiting national parks and wildland areas (Johnson et
al 1998, Floyd 1999), playing golf (Gobster 1998) or visiting church (Dougherty 2003).
Researches show that ethnic differences occur in participation rates (Gobster 1998),
preferences for activities and their locations (e.g. Zhang & Gobster 1998), attitudes and
experiences (Carr & Williams 1993). Researches from North-America and Europe show that
racial and ethnic groups are mostly underrepresented in outdoor recreation-leisure venues
(Aizlewood et al 2006, Gobster 1998, Washburne 1976 cit Floyd 1999) and they engage in
fewer different leisure time activites during free time when compared to native people (Peters
2008). What is more, minorities tend to participate in leisure-time activities in ethnically
homogeneous groups in their well-defined social spaces (Stodolska 2007) that depicts the
importance of family and social networks.
While residential and work-place segregation can be evaluated using census data, studies
considering leisure-time ethnic differences have mainly investigated single activities or used
questionnaires due to lack of more comprehensive data. New data-sets and methods give the
opportunity to evaluate leisure-time segregation more extensively. For example using mobile
positioning data, it is possible to cover leisure-time entirely instead of focusing on single
activities (e.g. Toomet et al 2011, Silm & Ahas 2014a, Müürisepp 2013). In addition, long-
term data sets with high temporal precision enable to observe spatio-temporal segregation, i.e.
how segregation rate changes across weeks, days or even hours (e.g. Silm & Ahas 2014b).
This enables also to observe the influence of holidays on ethnic segregation.
11
There are very few number of studies that focus on the importance of holidays on segregation,
leisure-time activities and integration among ethnic groups. There are some examples where
holiday celebration criterion is used in measuring integration (e.g. Eshel & Rosenthal-Sokolov
2000, The Study of Integration of Social Groups 2013). The study conducted by Dixon &
Durrheim (2003) in South-Africa during Christmas holiday found that even though people
from different ethnic background were together on the same beach, there was very little
interaction between them, indicating micro-scale segregation. The case study by Fox (2006)
showed, that Hungarian students did not take part in the festivities during Romanian public
holiday, but many of them participated in the Hungarian commemoration holiday. This
finding indicates, that during holidays the ethnic segregation can be higher, and it is caused by
national or ethnic awareness and is oriented at avoiding activities that are not the part of
particular identity. What is also interesting is that for Hungarians Romanian public holiday
did not break their everyday routine and did not draw much attention. It therefore shows that
various holidays influence ethnic groups differently, depending on their cultural background.
1.4 Ethnic groups and segregation in Estonia
Estonia is a country that belonged to Soviet Union from 1944 till 1991. Besides Estonians,
who is the ethnic majority comprising 67% (census 2000) of overall population, there are over
100 ethnic minorities living in Estonia. The biggest minority is Russians, followed by
Ukrainians, Byelorussians and Finns. Due to the legacy of Soviet regime, many immigrants
from the former member republics can speak Russian. This language can be considered as the
most important unifying aspect and an indicator of ethnic origin for post World War II
immigrants in Estonia (Tammaru & Kulu 2003, Vihalemm 2007). Therefore the focus of this
study is set on Russian-speaking minority (Russians, Ukrainians and Byelorussians) rather
than considering their real ethnic origin.
Estonian society is relatively segregated in terms of the language groups’ residence, socio-
economic position (Tammaru & Kulu 2003, van Ham & Tammaru 2011) and communication
networks that tend to be linguistically separated (Vihalemm 2007). Russian-speaking minority
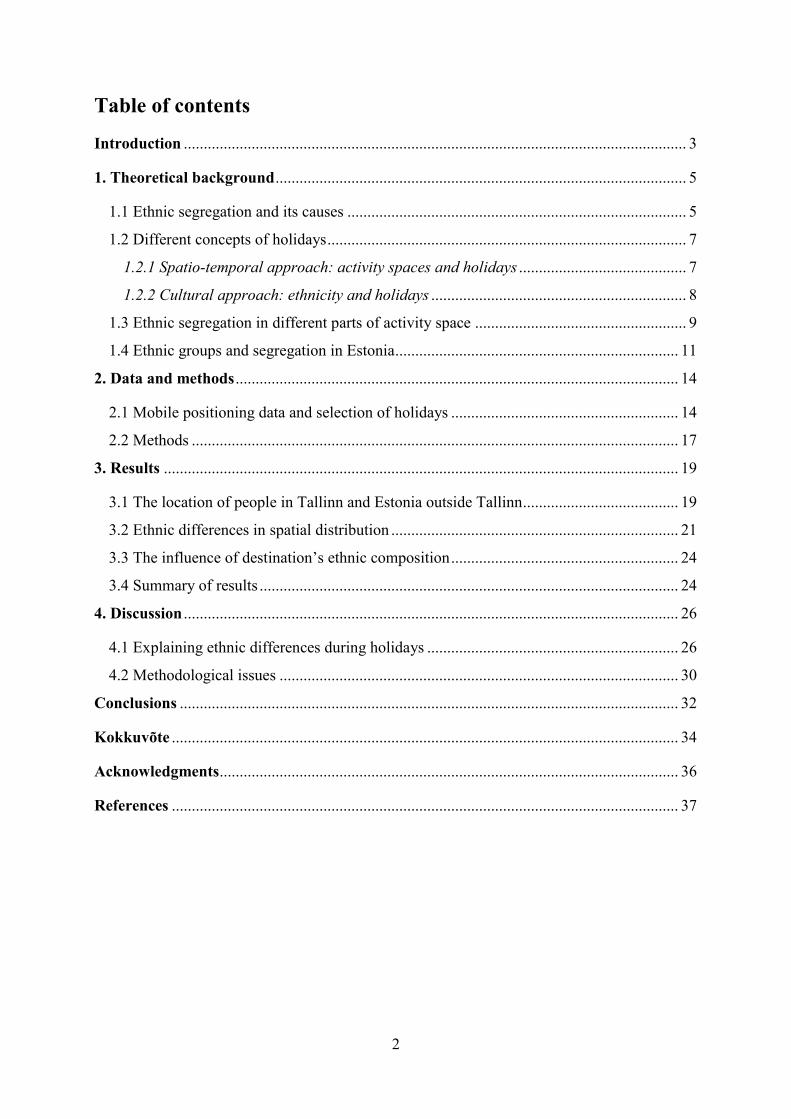
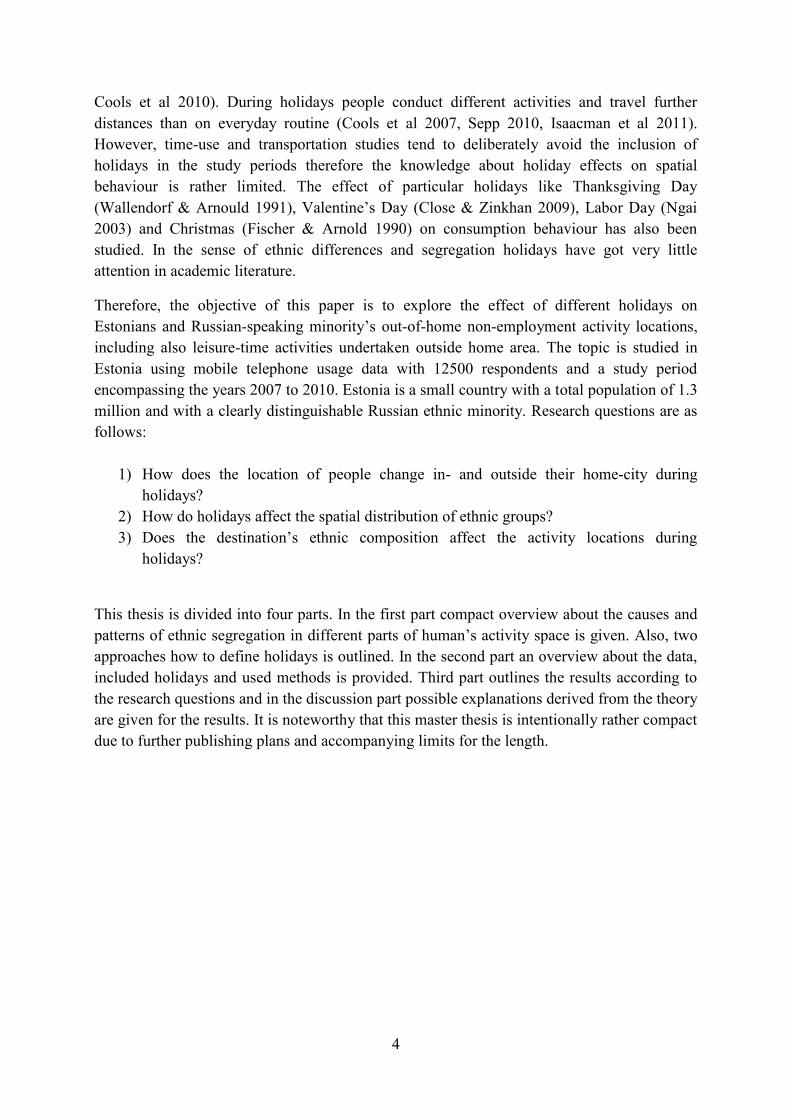
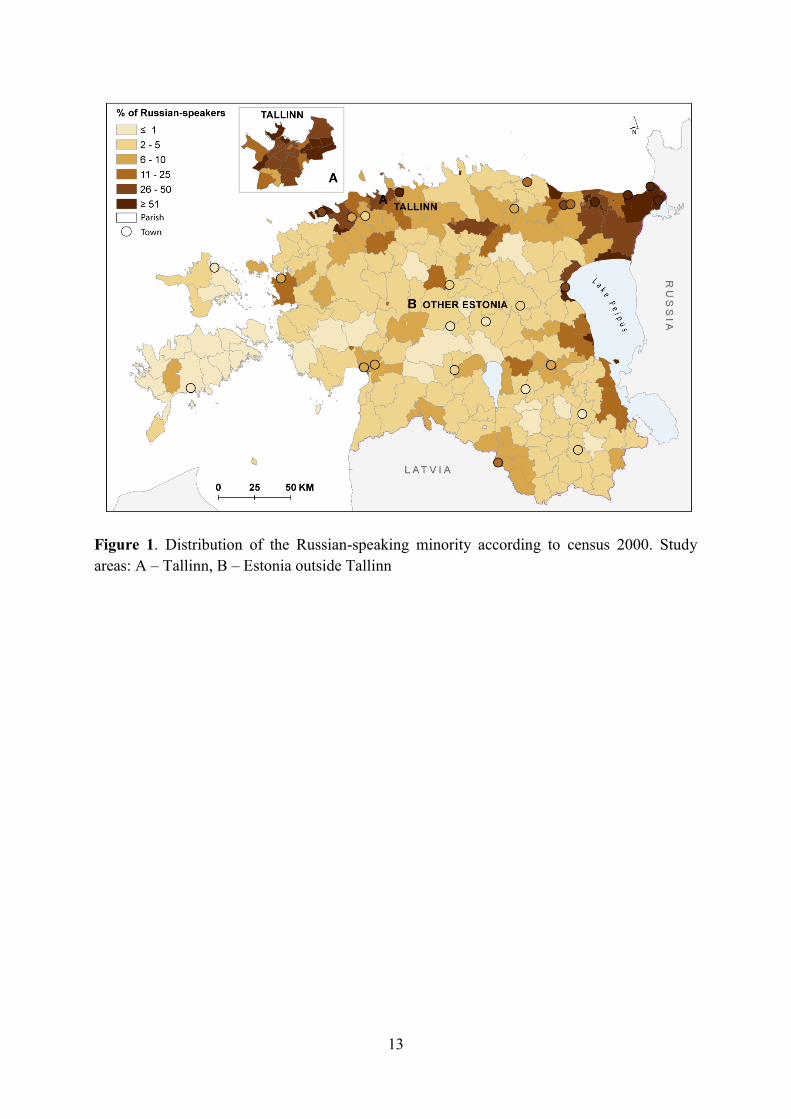
make up ca 30% of the Estonia’s population and they reside mostly in Harju and Ida-Viru
counties (census 2000, Figure 1). The degree of urbanization among Russian-speakers is very
high: ca 90% live in cities. Most of them reside in the capital-city Tallinn (ca 43%, Harju
County) and North-Eastern industrial towns (ca 32%, Ida-Viru County), thus they are quite
concentrated in space. This pattern is due to Soviet Union’s industrialization program during
60’s and 70’s under which most of the non-Estonian immigrants were settled to urban areas
where the major industrial enterprises were located (Tammaru & Kulu 2003).
The residential segregation has been studied mainly in Tallinn where it is the highest when
compared to other domains of everyday life (Toomet et al 2011). Russian-speaking minority
is dominating in panel housing districts (Kährik & Tammaru 2010), whereas Estonians prefer
more detached housing (Kährik 2002). Ethnic minorities in Estonia are less likely to move to
suburban settlements compared to Estonians (Tammaru et al 2011, Kährik & Tammaru 2008).
12
Similarly to residence, workplaces of Estonians and Russian-speakers in Estonia are fairly
segregated. Differences in the workspace existed already during Soviet times, when Estonians
were occupied mostly in the agricultural and Russians in manufacturing sector (Vöörmann &
Helemäe 2003, van Ham & Tammaru 2011). Today, Estonians and Russian-speaking
minority still often work in different sectors of economy (white-collar vs blue-collar)
(Tammaru & Kulu 2003, van Ham & Tammaru 2011) that is also evident in the spatial
distribution of workplaces in Tallinn (Toomet et al 2011, Müürisepp 2013).
Leisure time segregation has been studied in the context of Estonia relatively little. Toomet et
al (2011) found that compared to work and residence locations, leisure-time activity places for
Estonians and Russian-speakers in Tallinn are less segregated. Silm & Ahas (2014a) indicate
that Estonians’ and Russian-speakers’ activity spaces outside Tallinn are, however, segregated
and the latter tend to visit more districts, which are mostly populated by the Russian-speaking
minority. It is noteworthy that most of the inter-ethnic contacts between Estonians and
Russians are work-related and they take place in the public sphere (Korts 2009). Inter-ethnic
contacts in private sphere are not so common (Korts 2009).
In terms of religion, Estonia is one of the less religious countries in the world (Ringvee 2008)
with 29% of people with religious affiliation (census 2011); 16% of people living in Estonia
claimed to be Russian Orthodox and 10% Lutherans (census 2011). Most of religious
Estonians are Lutherans, while Russians, Ukrainians and Byelorussians are mainly Russian
Orthodox (census 2011).
Due to different cultural, religious and historical background, there are disparities as well as
similarities in the celebrated holidays and their traditions among Estonian and Russian-
speaking communities in Estonia. For Estonians Christmas, New Year’s Eve and Midsummer
Day can be considered as three of the most popular and widely celebrated holidays, which are
connected to celebrations with family and friends (e.g. Sepp 2010) and important seasonal
changes (Ahas et al 2005). Celebrating Midsummer Day has also gained popularity among
Russian-speaking community in Estonia (Seljamaa 2013). Russian-speaking minority’s
festivities are influenced on a large scale by the Russian and Orthodox roots. In Russia New
Year’s Holiday is one of the most popular holiday that is usually celebrated in the family-
friends circle twice: first time according to European tradition on 31st December and 1
st of
January, second time according to Old Calendar on 14th
of January (Frolova 2013). Many
Soviet holidays have been transformed and lost their ideological meaning (Frolova 2013) but
are still widely celebrated, for example Victory Day (09.05) and Women’s Day (08.03).
Similarly to Estonia, holidays with Western origin have also entered Russian cultural
landscape, such as Orthodox-proved Valentine’s Day and not so favoured Halloween (Frolova
2013). Many folk and church holidays like Maslenitsa and Orthodox Easter are celebrated in
Russia as well as in Russian-speaking community in Estonia (e.g. Seljamaa 2010, Mooses
2011).
13
Figure 1. Distribution of the Russian-speaking minority according to census 2000. Study
areas: A – Tallinn, B – Estonia outside Tallinn
14
2. Data and methods
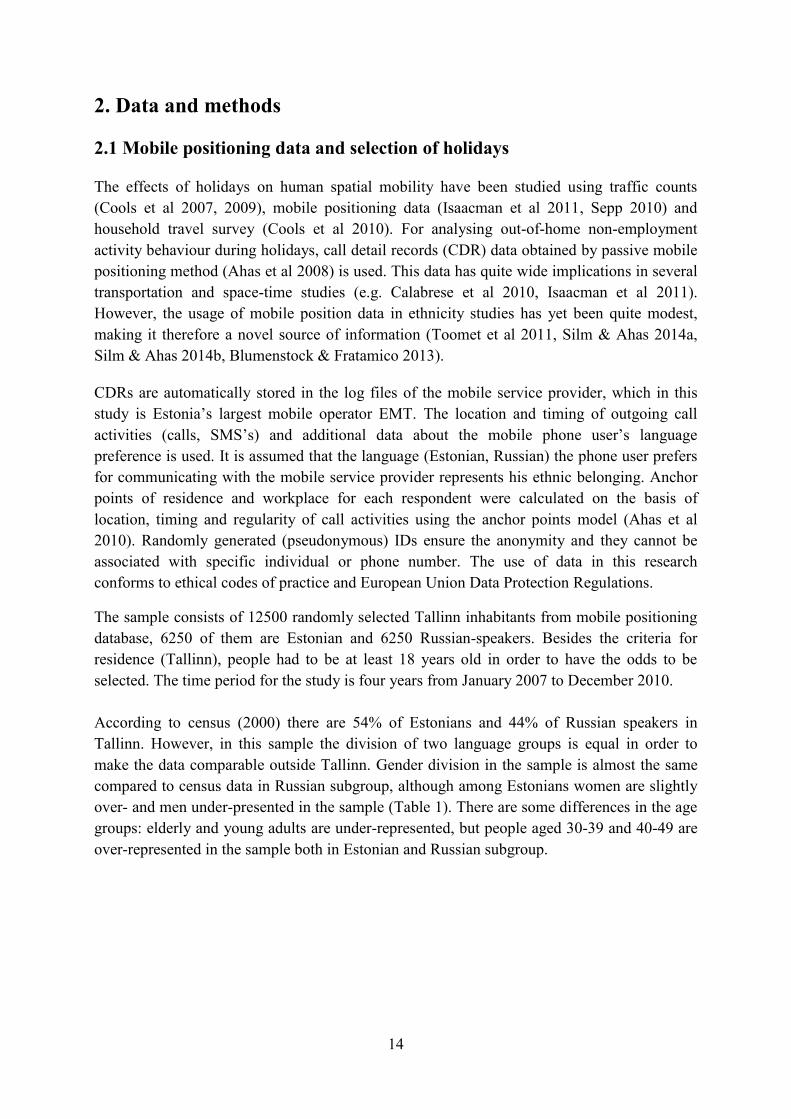
2.1 Mobile positioning data and selection of holidays
The effects of holidays on human spatial mobility have been studied using traffic counts
(Cools et al 2007, 2009), mobile positioning data (Isaacman et al 2011, Sepp 2010) and
household travel survey (Cools et al 2010). For analysing out-of-home non-employment
activity behaviour during holidays, call detail records (CDR) data obtained by passive mobile
positioning method (Ahas et al 2008) is used. This data has quite wide implications in several
transportation and space-time studies (e.g. Calabrese et al 2010, Isaacman et al 2011).
However, the usage of mobile position data in ethnicity studies has yet been quite modest,
making it therefore a novel source of information (Toomet et al 2011, Silm & Ahas 2014a,
Silm & Ahas 2014b, Blumenstock & Fratamico 2013).
CDRs are automatically stored in the log files of the mobile service provider, which in this
study is Estonia’s largest mobile operator EMT. The location and timing of outgoing call
activities (calls, SMS’s) and additional data about the mobile phone user’s language
preference is used. It is assumed that the language (Estonian, Russian) the phone user prefers
for communicating with the mobile service provider represents his ethnic belonging. Anchor
points of residence and workplace for each respondent were calculated on the basis of
location, timing and regularity of call activities using the anchor points model (Ahas et al
2010). Randomly generated (pseudonymous) IDs ensure the anonymity and they cannot be
associated with specific individual or phone number. The use of data in this research
conforms to ethical codes of practice and European Union Data Protection Regulations.
The sample consists of 12500 randomly selected Tallinn inhabitants from mobile positioning
database, 6250 of them are Estonian and 6250 Russian-speakers. Besides the criteria for
residence (Tallinn), people had to be at least 18 years old in order to have the odds to be
selected. The time period for the study is four years from January 2007 to December 2010.
According to census (2000) there are 54% of Estonians and 44% of Russian speakers in
Tallinn. However, in this sample the division of two language groups is equal in order to
make the data comparable outside Tallinn. Gender division in the sample is almost the same
compared to census data in Russian subgroup, although among Estonians women are slightly
over- and men under-presented in the sample (Table 1). There are some differences in the age
groups: elderly and young adults are under-represented, but people aged 30-39 and 40-49 are
over-represented in the sample both in Estonian and Russian subgroup.

15
Table 1. Sample characteristics compared to census (2000) data.
Sample Tallinn inhabitants (2000
census)
Estonian Russian All Estonian Russian All
Gender
Male 40% 46% 43% 45% 45% 45%
Female 60% 54% 57% 55% 55% 55%
Age
18-291
15% 11% 13% 24% 19% 22%
30-39 29% 27% 28% 17% 18% 18%
40-49 24% 26% 25% 16% 23% 19%
50-59 16% 24% 20% 16% 15% 15%
60 16% 12% 14% 27% 25% 26%
1 the age group for the census is 20-29.
There are two spatial units under observation (Figure 1): 1) capital of Estonia – Tallinn –
which consists of 25 study districts defined by similar buildings and functions; 2) Estonia
excluding Tallinn, which comprises of 216 municipalities that have at least one mobile
antenna in their territory. Municipalities that have no antenna were excluded from the
analysis.
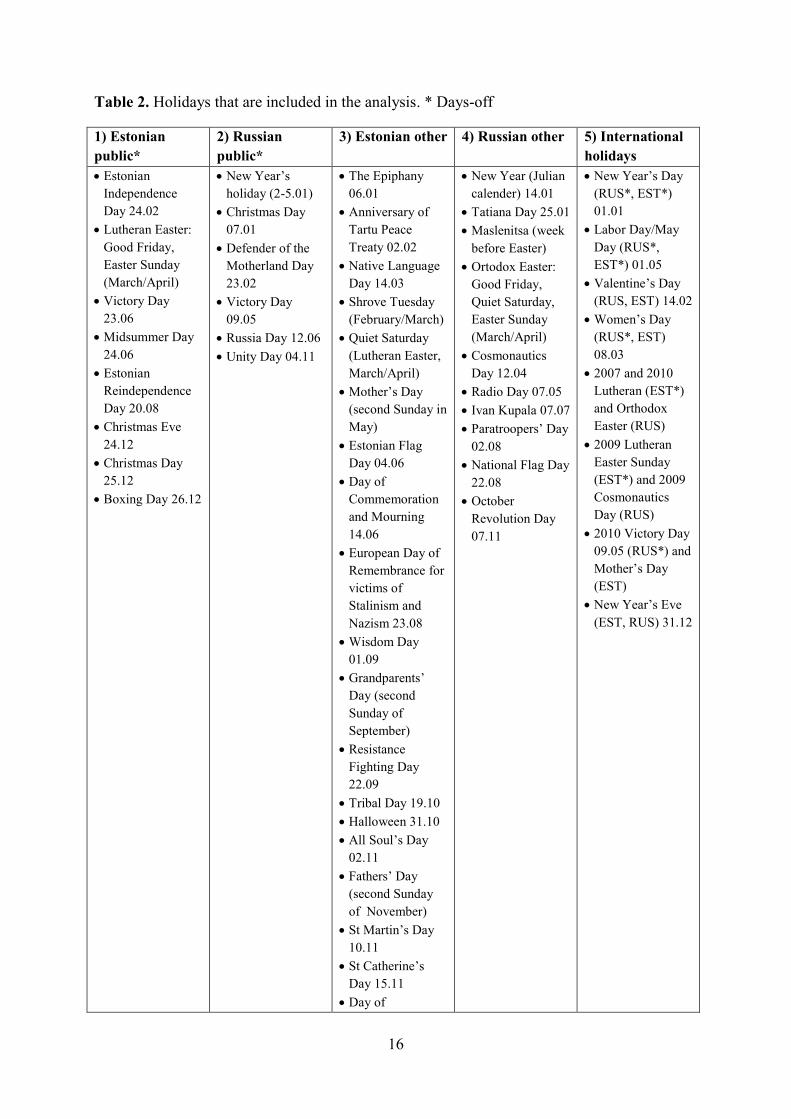
Holidays were divided based on the country (Estonia, Russia) and type (public, religious,
national/folk holidays and celebration days) into five groups (Table 2): 1) Estonian public
holidays that are established by law and are days-off in Estonia, 2) Russian public holidays
that are established by Russian government and are days-off days in Russia but working days
in Estonia, 3) Estonian other holidays: religious, folk holidays and celebration days that are
working days in Estonia, 4) Russian other holidays: folk and religious holidays that are
working days in Russia and Estonia, 5) international public and national holidays that are
celebrated at the same time in Estonia as well as in Russia. Depending on the holiday, it can
be day-off as well as working day in Estonia.
16
Table 2. Holidays that are included in the analysis. * Days-off
1) Estonian
public*
2) Russian
public*
3) Estonian other 4) Russian other 5) International
holidays
Estonian
Independence
Day 24.02
Lutheran Easter:
Good Friday,
Easter Sunday
(March/April)
Victory Day
23.06
Midsummer Day
24.06
Estonian
Reindependence
Day 20.08
Christmas Eve
24.12
Christmas Day
25.12
Boxing Day 26.12
New Year’s
holiday (2-5.01)
Christmas Day
07.01
Defender of the
Motherland Day
23.02
Victory Day
09.05
Russia Day 12.06
Unity Day 04.11
The Epiphany
06.01
Anniversary of
Tartu Peace
Treaty 02.02
Native Language
Day 14.03
Shrove Tuesday
(February/March)
Quiet Saturday
(Lutheran Easter,
March/April)
Mother’s Day
(second Sunday in
May)
Estonian Flag
Day 04.06
Day of
Commemoration
and Mourning
14.06
European Day of
Remembrance for
victims of
Stalinism and
Nazism 23.08
Wisdom Day
01.09
Grandparents’
Day (second
Sunday of
September)
Resistance
Fighting Day
22.09
Tribal Day 19.10
Halloween 31.10
All Soul’s Day
02.11
Fathers’ Day
(second Sunday
of November)
St Martin’s Day
10.11
St Catherine’s
Day 15.11
Day of
New Year (Julian
calender) 14.01
Tatiana Day 25.01
Maslenitsa (week
before Easter)
Ortodox Easter:
Good Friday,
Quiet Saturday,
Easter Sunday
(March/April)
Cosmonautics
Day 12.04
Radio Day 07.05
Ivan Kupala 07.07
Paratroopers’ Day
02.08
National Flag Day
22.08
October
Revolution Day
07.11
New Year’s Day
(RUS*, EST*)
01.01
Labor Day/May
Day (RUS*,
EST*) 01.05
Valentine’s Day
(RUS, EST) 14.02
Women’s Day
(RUS*, EST)
08.03
2007 and 2010
Lutheran (EST*)
and Orthodox
Easter (RUS)
2009 Lutheran
Easter Sunday
(EST*) and 2009
Cosmonautics
Day (RUS)
2010 Victory Day
09.05 (RUS*) and
Mother’s Day
(EST)
New Year’s Eve
(EST, RUS) 31.12
17
Declaration of
Sovereignty 16.11
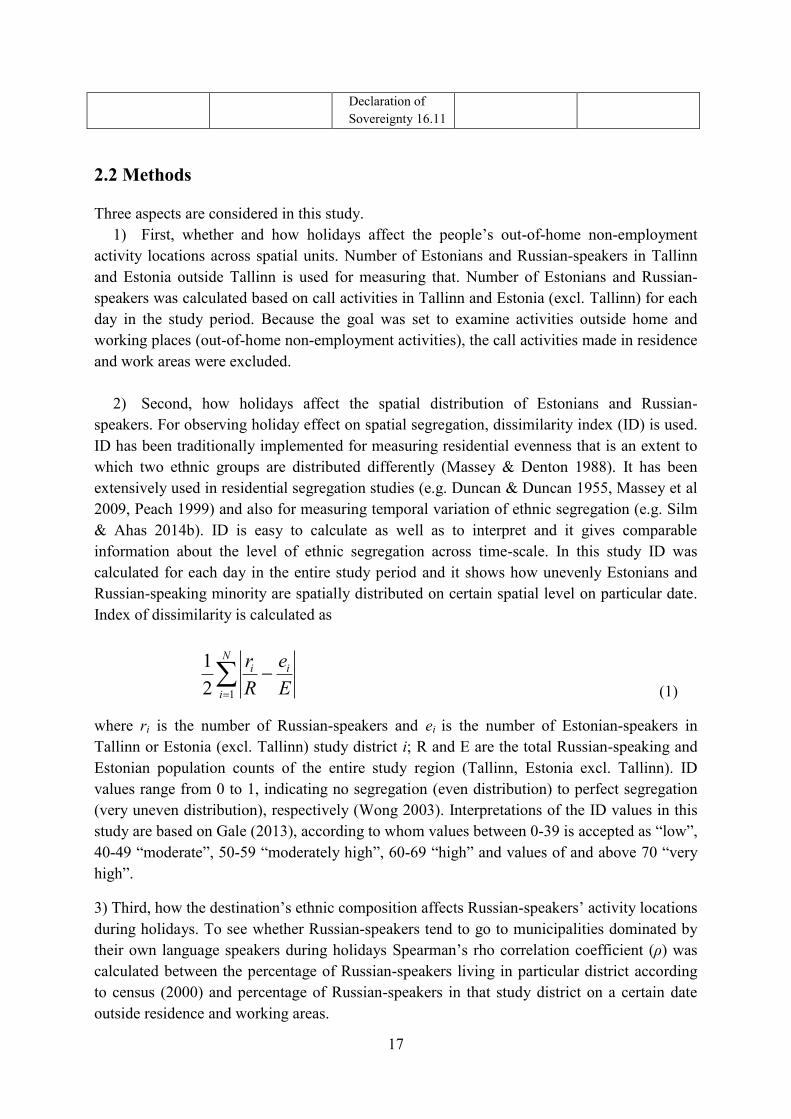
2.2 Methods
Three aspects are considered in this study.
1) First, whether and how holidays affect the people’s out-of-home non-employment
activity locations across spatial units. Number of Estonians and Russian-speakers in Tallinn
and Estonia outside Tallinn is used for measuring that. Number of Estonians and Russian-
speakers was calculated based on call activities in Tallinn and Estonia (excl. Tallinn) for each
day in the study period. Because the goal was set to examine activities outside home and
working places (out-of-home non-employment activities), the call activities made in residence
and work areas were excluded.
2) Second, how holidays affect the spatial distribution of Estonians and Russian-
speakers. For observing holiday effect on spatial segregation, dissimilarity index (ID) is used.
ID has been traditionally implemented for measuring residential evenness that is an extent to
which two ethnic groups are distributed differently (Massey & Denton 1988). It has been
extensively used in residential segregation studies (e.g. Duncan & Duncan 1955, Massey et al
2009, Peach 1999) and also for measuring temporal variation of ethnic segregation (e.g. Silm
& Ahas 2014b). ID is easy to calculate as well as to interpret and it gives comparable
information about the level of ethnic segregation across time-scale. In this study ID was
calculated for each day in the entire study period and it shows how unevenly Estonians and
Russian-speaking minority are spatially distributed on certain spatial level on particular date.
Index of dissimilarity is calculated as
(1)
where ri is the number of Russian-speakers and ei is the number of Estonian-speakers in
Tallinn or Estonia (excl. Tallinn) study district i; R and E are the total Russian-speaking and
Estonian population counts of the entire study region (Tallinn, Estonia excl. Tallinn). ID
values range from 0 to 1, indicating no segregation (even distribution) to perfect segregation
(very uneven distribution), respectively (Wong 2003). Interpretations of the ID values in this
study are based on Gale (2013), according to whom values between 0-39 is accepted as “low”,
40-49 “moderate”, 50-59 “moderately high”, 60-69 “high” and values of and above 70 “very
high”.
3) Third, how the destination’s ethnic composition affects Russian-speakers’ activity locations
during holidays. To see whether Russian-speakers tend to go to municipalities dominated by
their own language speakers during holidays Spearman’s rho correlation coefficient (ρ) was
calculated between the percentage of Russian-speakers living in particular district according
to census (2000) and percentage of Russian-speakers in that study district on a certain date
outside residence and working areas.
N
i
ii
E
e
R
r
12
1
18
Regression models were further employed in order to analyse the influence of holidays and
different holiday types on dependent variables compared to ordinary days (non-holidays).
Dependent variables are number of Estonians, number of Russian-speakers, ID and ρ values
and the object in the regression models is one day. Predictors are „holiday“ (holiday/normal
day; holiday categories/normal day), „season“ (winter, spring, summer, autumn) and
„weekend“ (weekend-day/working day). Regression models were constructed using two
approaches. Firstly, only one factor – holiday variable – was used in a model. Secondly, other
predictors were also added into a model. Separate models were made for holiday variable:
first, only holiday/normal day was included; second, models with holiday categories were
constructed.
For the case of number of Estonian and Russian-speakers overdispersed Poisson regression
analysis was used, because it has been proved to be suitable for analysing count data that do
not meet the requirements of OLS regression (Coxe et al 2009, Huang & Cornell 2012). The
resulting Poisson model with all the predictors is
iXbXbXbY 3322110b )ln( (2)
where Y is the number of Estonians or Russian-speakers in Tallinn or Estonia (excl Tallinn)
on a certain day, b0 is the intercept, bn is the regression coefficient for a particular predictor,
X1 is the season, X2 is a weekend variable, X3 is a holiday variable.
For ID and Spearman ρ values general linear model was used
iXbXbXbY 3322110b (3)
where Y is the value of dissimilarity index or Spearman ρ on a certain day, b0 is the intercept,
bn is the regression coefficient for a particular predictor, X1 is the season, X2 is a weekend
variable, X3 is a holiday variable. All the models turned out to be statistically significant.
In addition, how the values of all dependent variables changed on each particular holiday was
also under observation. A day one week earlier was used as a comparison for most of the
holidays. However, due to study period issues, for holidays that occur on 1st to 7
th of January,
the comparison time is day one week later.
For the number of people, CDR data was aggregated in a way that the amount of people who
were present in Tallinn or Estonia (excl. Tallinn) on a particular date was summed. A person
who made at least one call activity on a certain date while staying in Tallinn or outside Tallinn
was counted as being present. For the case of dissimilarity index and Spearman’s ρ, the
number of people was summed according to Tallinn study districts and Estonia’s
municipalities. The data aggregation minimizes the influence of calling habits on spatial
mobility indicators, so the number of call activities made by person does not influence the
overall number of people in a spatial unit. On average Estonian-speakers made 4.3 and
Russian-speakers 4.4 call activities per day (p > 0.05) which indicates similar calling habits.
19
3. Results
3.1 The location of people in Tallinn and Estonia outside Tallinn
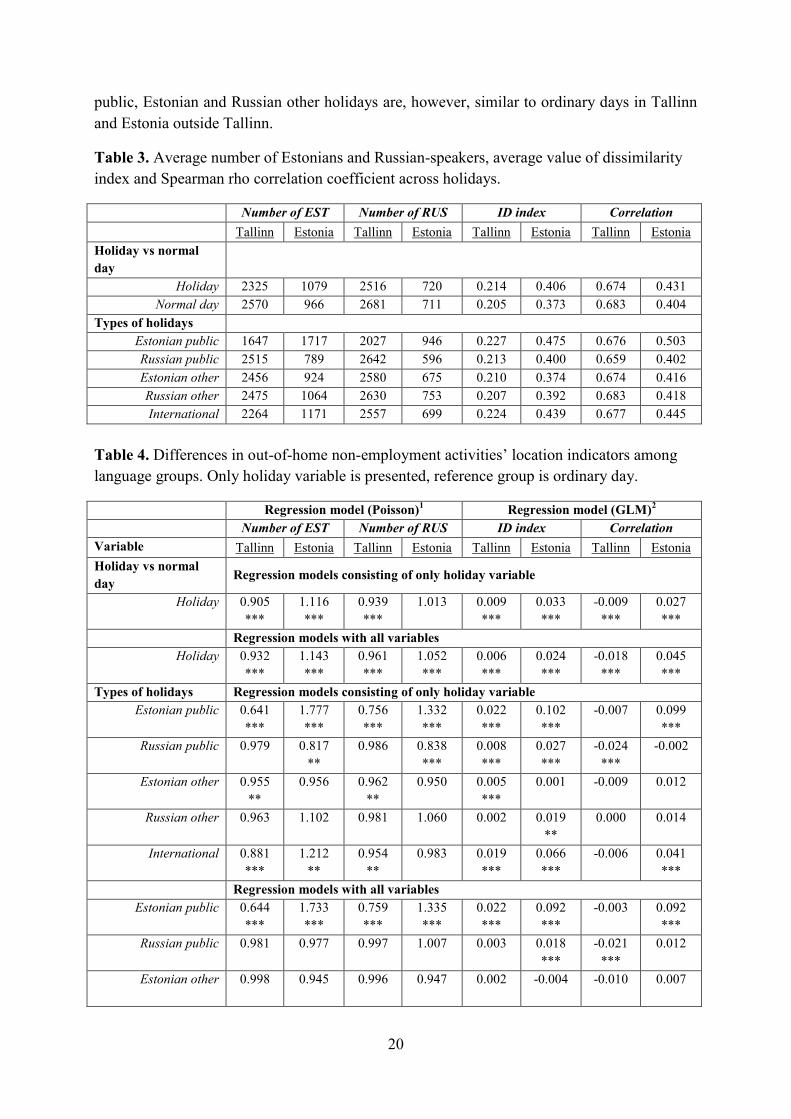
Study results show that during holidays people’s out-of-home non-employment activity
locations are different compared to ordinary workdays or weekends. In Tallinn there are
overall less and in Estonia (excl. Tallinn) more people during holidays when compared to
ordinary days. It means that people leave the capital-city during holidays and this trend is
similar across both language groups. However, more Estonians leave the capital during
holidays than Russian-speakers. For example, in Tallinn during holidays there are on average
191 Russian-speakers more than Estonians, while on ordinary days the average difference is
111 people (Table 3). Outside the capital, the number of Estonian-speakers exceeds the
Russians’ by 359 on holidays and on ordinary days by 255 people.
Various holiday types influence out-of-home non-employment activities’ locations
differently. Estonian public holiday is the most influential holiday type due to the
accompanying free days when more time is available to perform non-work related activities
outside home area. During that time many Estonians and Russian-speakers leave the capital-
city, although the number of leaving Estonians is bigger. During holidays there are 36% less
Estonian and 24% less Russian-speakers than on normal days in Tallinn (Table 4). Outside
Tallinn during Estonian public holidays the number of Estonians increase 177% and for
Russian-speakers 133% times when compared with ordinary days.
International holiday that include temporally overlapping Estonian and Russian holidays was
also important factor that affects leaving the home-city. However, the differences in the
number of people were smaller when compared to Estonian public holidays. For the case of
Estonians there are 12% less people during that time in Tallinn outside their home and
working areas and 21% more people in Estonia (excl Tallinn) (Table 4). However, for the
Russian-speakers the number of people in Tallinn does not significantly differ from ordinary
days when all variables are included. In Estonia outside Tallinn the average number of
Russian-speakers is actually lower when compared to ordinary days, however, the model with
all variables predicts the number to be significantly higher. The result why the average
number of Russian-speakers in Estonia outside Tallinn is smaller during international holidays
can be partly explained by the composition of this holiday category (Table 2). Most holidays
are short and many of them are not free days, which explains why the overall number of
people that leave the capital is smaller than on Estonian public holidays. The difference in
between the number of Estonians and Russian-speakers can originate from Easter (Lutheran
and Orthodox) holiday. During this religious holiday Russians’ activities are much related to
the religious places (like church and cemeteries), while Estonians’ traditions are more family-
centred. It can be one of the reasons why Russian-speakers are more likely to stay in the
home-city, visit sacred places and conduct church-related rituals, when many Estonians leave
the capital.
In the models where all predictors are included, Estonian public and international holidays
remain significantly different from the ordinary days. The number of people during Russian
20
public, Estonian and Russian other holidays are, however, similar to ordinary days in Tallinn
and Estonia outside Tallinn.
Table 3. Average number of Estonians and Russian-speakers, average value of dissimilarity
index and Spearman rho correlation coefficient across holidays.
Number of EST Number of RUS ID index Correlation
Tallinn Estonia Tallinn Estonia Tallinn Estonia Tallinn Estonia
Holiday vs normal
day
Holiday 2325 1079 2516 720 0.214 0.406 0.674 0.431
Normal day 2570 966 2681 711 0.205 0.373 0.683 0.404
Types of holidays
Estonian public 1647 1717 2027 946 0.227 0.475 0.676 0.503
Russian public 2515 789 2642 596 0.213 0.400 0.659 0.402
Estonian other 2456 924 2580 675 0.210 0.374 0.674 0.416
Russian other 2475 1064 2630 753 0.207 0.392 0.683 0.418
International 2264 1171 2557 699 0.224 0.439 0.677 0.445
Table 4. Differences in out-of-home non-employment activities’ location indicators among
language groups. Only holiday variable is presented, reference group is ordinary day.
Regression model (Poisson)1 Regression model (GLM)
2
Number of EST Number of RUS ID index Correlation
Variable Tallinn Estonia Tallinn Estonia Tallinn Estonia Tallinn Estonia
Holiday vs normal
day Regression models consisting of only holiday variable
Holiday 0.905
***
1.116
***
0.939
***
1.013
0.009
***
0.033
***
-0.009
***
0.027
***
Regression models with all variables
Holiday 0.932
***
1.143
***
0.961
***
1.052
***
0.006
***
0.024
***
-0.018
***
0.045
***
Types of holidays Regression models consisting of only holiday variable
Estonian public 0.641
***
1.777
***
0.756
***
1.332
***
0.022
***
0.102
***
-0.007
0.099
***
Russian public 0.979
0.817
**
0.986
0.838
***
0.008
***
0.027
***
-0.024
***
-0.002
Estonian other 0.955
**
0.956
0.962
**
0.950
0.005
***
0.001
-0.009
0.012
Russian other 0.963
1.102
0.981
1.060
0.002
0.019
**
0.000
0.014
International 0.881
***
1.212
**
0.954
**
0.983
0.019
***
0.066
***
-0.006
0.041
***
Regression models with all variables
Estonian public 0.644
***
1.733
***
0.759
***
1.335
***
0.022
***
0.092
***
-0.003
0.092
***
Russian public 0.981
0.977
0.997
1.007
0.003
0.018
***
-0.021
***
0.012
Estonian other 0.998
0.945
0.996
0.947
0.002
-0.004
-0.010
0.007
21
Russian other 1.011
1.010
1.011
1.011
-0.001
0.006
0.004
0.001
International 0.905
***
1.413
***
0.973
1.136
***
0.013
***
0.057
***
-0.001
0.056
***
Significance: ***1%, **5%
1 – Difference estimation is Exp(B) and reference value is 1.
2 – Difference estimation is B and reference value is 0.
When looking all holidays separately the biggest change in the amount of people outside
home and working areas in Tallinn compared to the time week before is on Midsummer Day
(24.06), when there are 56% less Estonians and 28% less Russian-speakers in Tallinn.
Midsummer Day is followed by Christmas Day (25.12) with a 56% and 27% decrease in the
number of Estonians and Russian-speakers respectively. Because these holidays are days-off,
a lot of people tend to leave the capital-city. However, on New Year’s Eve (31.12) the amount
of people outside home and working areas compared to the week before is the highest both for
Estonian (29%) and Russian-speakers (23%). The amount of Estonians increase also during
Victory Day (09.05) by 18% and Mother’s Day (every second Sunday in May) by 16%. There
are more Russian-speakers during Women’s Day (08.03, 19%) and Victory Day (09.05, 12%).
It indicates that in Tallinn different holidays have a particular influence on the number of
people.
Outside Tallinn the biggest increase in the number of Estonian-speakers is during New Year’s
Day (01.01, 170%), Christmas Eve (24.12, 169%), Christmas Day (25.12, 132%), Victory
Day (23.06, 126%) and Midsummer Day (24.06, 96%). For the case of Russian-speakers, the
biggest change compared to ordinary days is on Victory Day (23.06, 111%), Midsummer Day
(24.06, 77%), New Year’s Day (01.01, 31%), May Day (01.05, 31%) and Christmas Day
(25.12, 30%).
3.2 Ethnic differences in spatial distribution
During holidays Russian-speaking minority and Estonians are distributed more unevenly than
on ordinary days. The uneven distribution, i.e. average dissimilarity index, during holidays is
bigger outside the capital-city, indicating moderate level of segregation (ID=0.406), than in
Tallinn, where it is low (0.214) (Table 3). However, the differences from ordinary days are
small but statistically significant (p<0.01) (Table 4). The ID in Estonia (excl Tallinn) is by
0.033 higher than on ordinary days (ID=0.373) and in Tallinn by 0.009 higher than on normal
time (ID=0.205).
Estonians and Russian-speakers are most unevenly distributed during Estonian public and
international holidays both in Tallinn and outside the capital. In Estonia (excl Tallinn) during
Estonian public holidays the ID index is 0.475 (difference from ordinary days 0.102) and on
international holidays the value of ID is 0.439 (difference 0.066) (Tables 3 and 4). In addition,
when all variables are included, also Russian public holidays (ID=0.400) remain statistically
significant with a 0.027 difference from ordinary days. These ID values indicate moderate
22
level of segregation. In Tallinn on Estonian public (ID=0.227) and international holidays
(ID=0.224) the level of segregation is low and the difference from ordinary days are small
(yet significant).
In Tallinn Estonians and Russian-speakers are the most unevenly distributed during New
Year’s Day (01.01, ID=0.27, difference 0.06). In Estonia (excl. Tallinn) segregation is the
highest during Christmas Day (25.12, ID=0.53, difference 0.18) and Boxing Day (26.12,
ID=0.52, difference 0.16). Segregation is higher than usual time also on Victory Day (23.06)
in Tallinn and Midsummer Day (24.06) in Tallinn and Estonia outside Tallinn. On Victory
Day and Midsummer Day the average ID values are 0.50 for Estonia; On Midsummer Day
0.23 in Tallinn. In addition, in the capital-city on Estonian Independence Day (24.02,
ID=0.24, difference 0.03) and Christmas Day (ID=0.24, difference 0.04) bigger differences
from ordinary days occur as well.
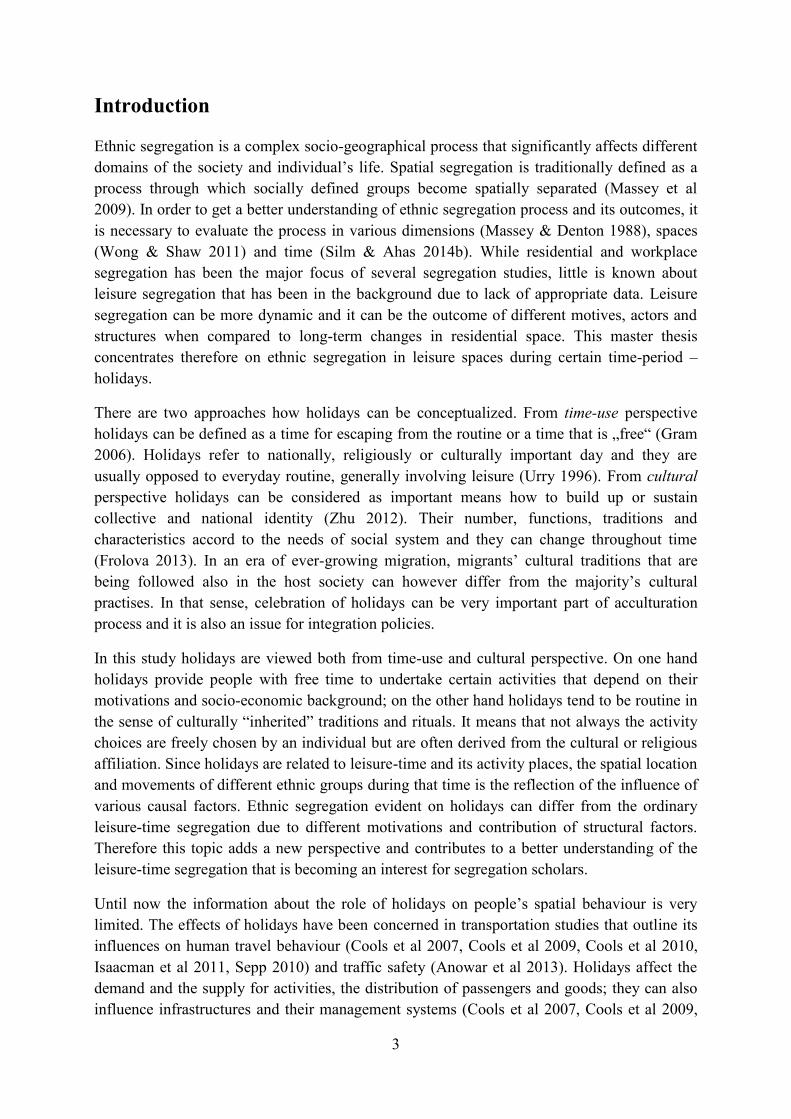
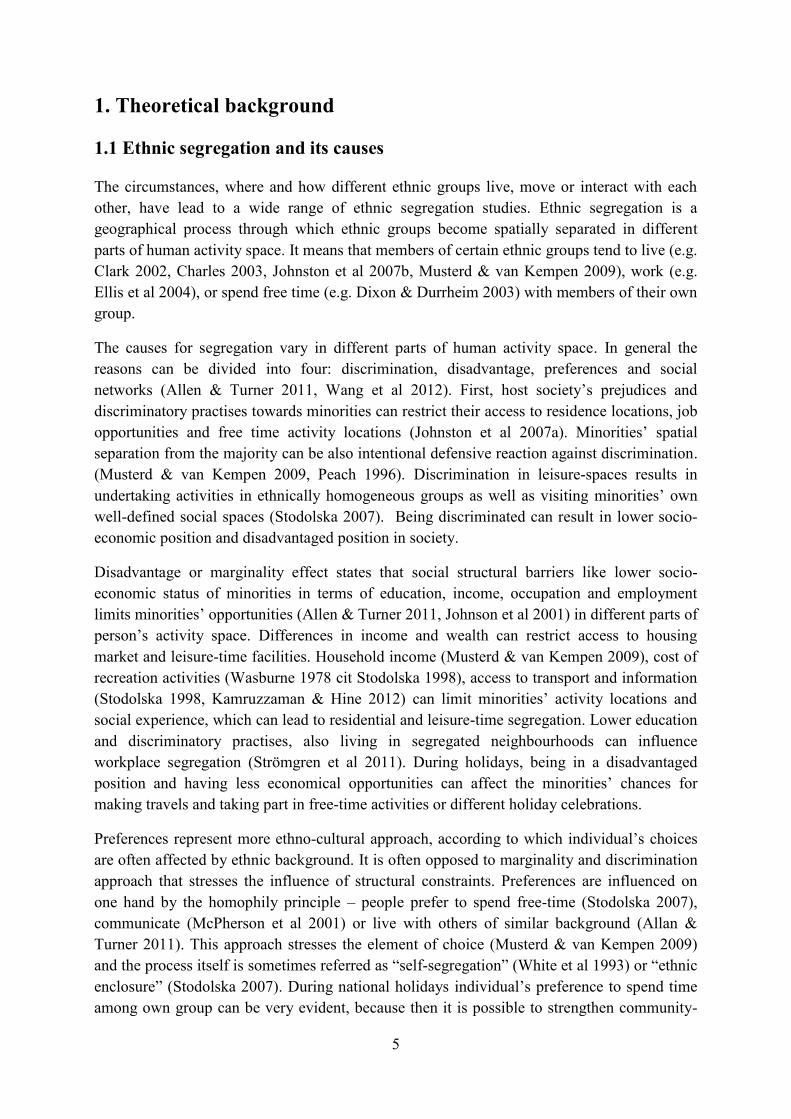
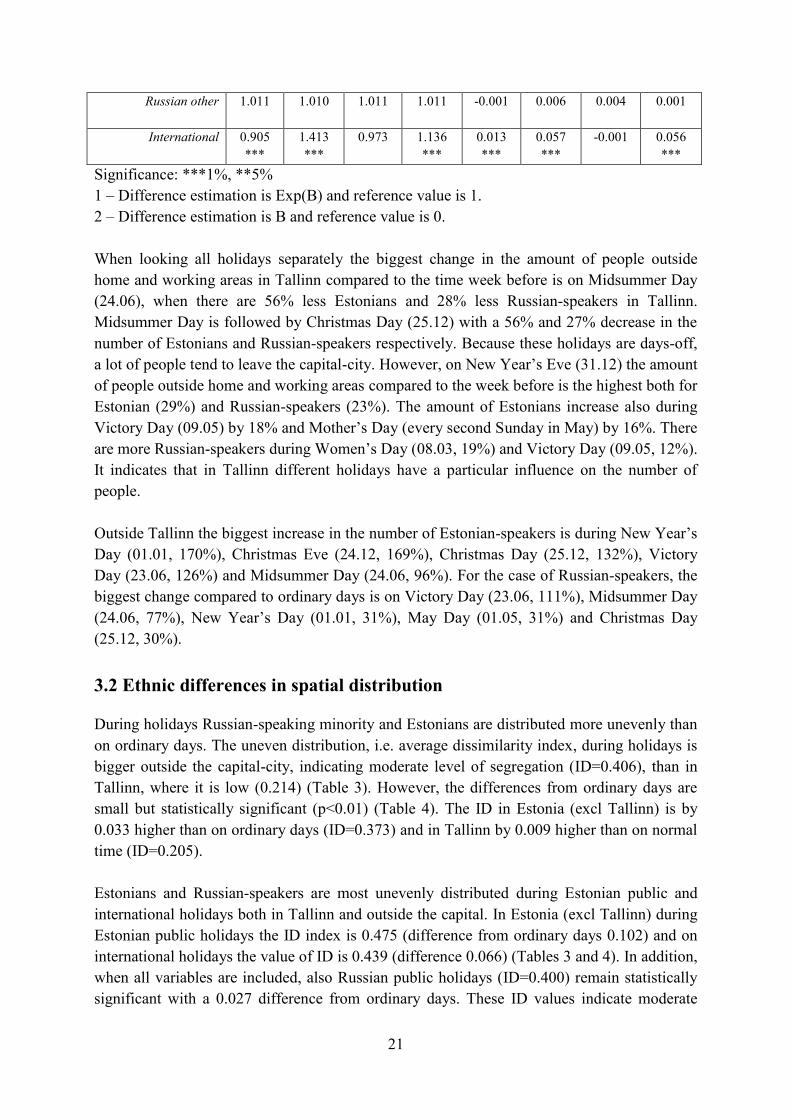
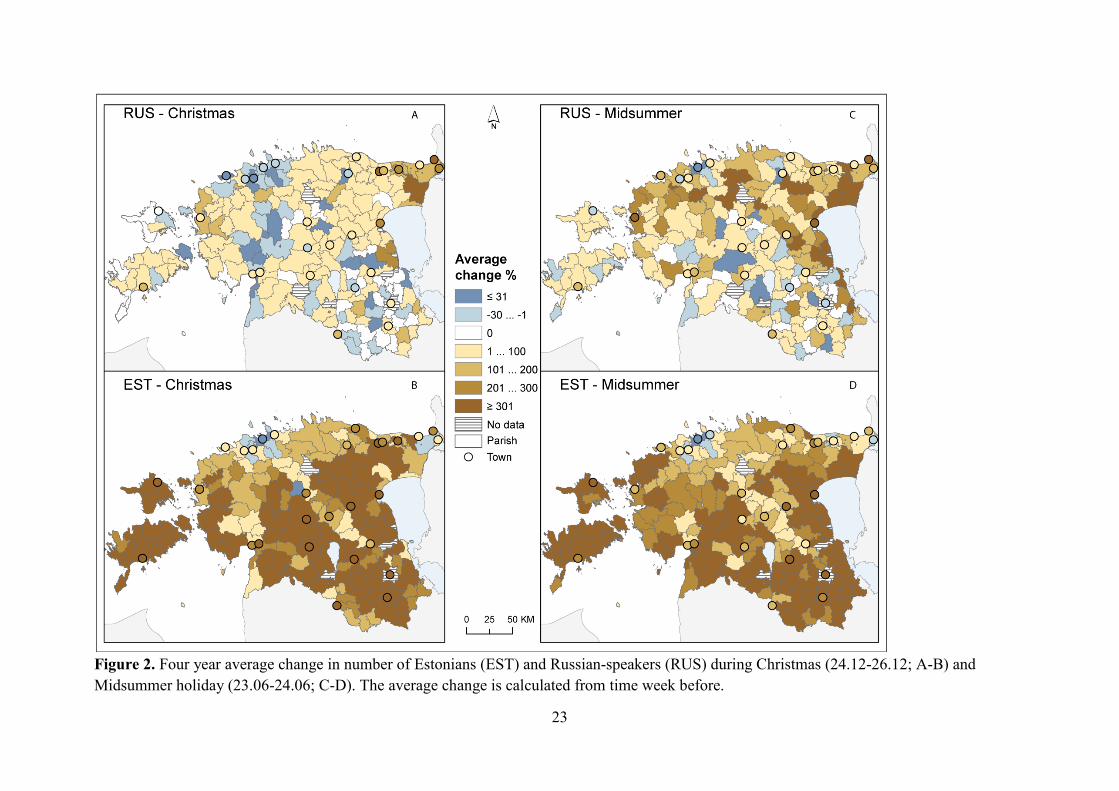
Given the above, the biggest differences in the spatial distribution of Estonians and Russian-
speakers occur during Midsummer holiday (23.06-24.06) and Christmas (24.12-26.12)
(Figure 2). More Estonian-speakers can be found during that time outside their home-city
Tallinn compared to ordinary days and they are located widely all over Estonia. However,
while more Russian-speakers are outside Tallinn as well (compared to ordinary days) they are
mostly located near the capital-city, North-East Estonia and Lake Peipus, where the
percentage of Russian inhabitants is higher. When comparing Christmas and Midsummer, it is
evident, that during Midsummer holiday the average change in the number of Russian-
speaking people is higher in more municipalities (Figure 2 – C) than on Christmas (Figure 2 –
A). It shows that during Midsummer holiday more Russian-speakers leave the capital-city and
their out-of-home non-employment activities are more widely distributed. It can indicate that
Russian-speakers are probably celebrating this Estonian public holiday. During Christmas the
average change of Russian-speakers in different municipalities is, however, smaller which
means that during that time fewer people undertake trips to other municipalities.
23
Figure 2. Four year average change in number of Estonians (EST) and Russian-speakers (RUS) during Christmas (24.12-26.12; A-B) and
Midsummer holiday (23.06-24.06; C-D). The average change is calculated from time week before.
24
3.3 The influence of destination’s ethnic composition
The influence of the destination’s ethnic composition is controversial when comparing Tallinn
and Estonia. During holidays in Tallinn Russian-speakers are visiting districts outside their
home and working areas where many Russian-speakers are living less (ρ=0.674) than on
ordinary days (ρ=0.683) (Table 3). The difference is small in number (0.009) but statistically
significant (Table 4). Outside Tallinn the pattern is opposite: during holidays Russian-
speakers are visiting more Russian-dominated districts (ρ=0.431) than on ordinary days
(ρ=0.404). The difference is 0.027 and remains significant when all the predictors are
included (Table 4).
The relationship between where Russian-speakers are living and where Russian-speakers are
located is different among various holiday types in Tallinn and in Estonia. In Tallinn during
Russian public (ρ=0.659) holidays more Russian-speakers are located outside Russian-
speakers’ home areas compared with ordinary days (ρ=0.683). The meeting/celebration places
can be located near the city centre, where fewer Russian-speakers are living thus the
correlation values are therefore smaller. It also means that during this time the possibility to
encounter Estonians is higher. However, in Estonia (excl. Tallinn) Russian-speakers tend to
go to municipalities where the proportion of Russian speaking inhabitants is higher during
Estonian public (ρ=0.503) and international holidays (ρ=0.445) when compared to ordinary
days. This finding indicates the role of free days: during non-working days there is a bigger
possibility to travel longer distances and visit people of social networks.
When looking at holidays separately, the correlation between where Russian-speakers are
living and where Russian-speakers go compared to week before is in Tallinn the highest
during Russian holidays: Russia Day (12.06), Tatiana Day (25.01) and Orthodox Easter. It is
the lowest during Midsummer Day (24.06), Christmas Day (24.12) and European Day of
Remembrance for victims of Stalinism and Nazism (23.08). In Estonia Russian-speakers tend
to go to municipalities of their own language the most (compared to week before) during
Midsummer Day (24.06), Victory Day (23.06) and Christmas Day (24.12).
3.4 Summary of results
To get a more comprehensive overview how holidays are affecting ethnic segregation it is
important to view all three analysed aspects together. This study shows that during holidays
ethnic segregation is higher both in Tallinn and in Estonia outside Tallinn. During that time
Estonians’ and Russian-speaking minority’s out-of-home non-employment activity locations
are different compared to ordinary time and observed language groups are more unevenly
distributed in space.
In Tallinn during Estonian public and international holidays there are less Estonians outside
their home and working areas and only on Estonian public holidays less Russian-speakers.
Even though the language groups in Tallinn are slightly more unevenly distributed during
Estonian public and international holidays, Russian-speakers are visiting Russian dominated
25
districts similarly to ordinary time. Interestingly, the only holiday category when Russian-
speakers tend to significantly visit less Russian dominated districts in Tallinn is Russian
public holidays. It is worth nothing that during that time the spatial distribution is statistically
the same as ordinary time. It therefore means that the places visited by Russian-speakers
during that time can be located more in the centre of the city or near places where are more
Estonians out-of-home non-employment activity locations.
However, Russian-speaking minority still tend to go to Russian dominated areas during some
Russian holidays more than on ordinary time. The highest correlation is during Russian public
holiday Russia Day, followed by Tatiana day and Orthodox Easter. It means that during this
time Russian-speakers go more to areas where other Russian-speakers are living. So, even
though some general conclusions can be drawn, every observed segregation aspect is highly
dependent on specific holiday peculiarities.
On New Year’s Eve (31.12) the number of Estonians and Russian-speakers increases the most
when compared to week before outside of their home and working areas. This result can be
attributed to New Year’s celebrations which usually takes place in the city centre. However,
on New Year’s Day (01.01) Estonians and Russian-speakers are the most unevenly distributed
(ID=0.27) across observed holidays in Tallinn. It is also a day when the number of Estonians
increases the most (170%) in Estonia (outside Tallinn) compared to usual time, while for the
Russian-speakers the increase is only 31% compared to ordinary time. The rise of unevenness
can therefore be attributed to leaving Estonians, which raises the percentage of Russian-
speakers in various districts in Tallinn.
While in Tallinn the relationship between the percentage of Russian speaking inhabitants and
number of Russian-speakers in these districts vary among different holidays, then in Estonia
outside Tallinn the relationship is quite straightforward: Russian-speakers tend to go to
municipalities of their own language during holidays. It is also evident in the spatial
distribution among Estonians and Russian-speakers, which is more uneven during holidays
indicating a moderate level of segregation.
Two of the most influential holiday types across analysed segregation aspects outside Tallinn
were Estonian public and international holidays, which indicate the role of free days. During
Estonian public holidays all three aspects had the highest values; on international holiday the
differences in the number of people, unevenness and the movements to Russian dominated
areas were smaller. In addition, during Russian public holidays Estonians and Russian-
speakers are significantly more unevenly distributed outside Tallinn, however, other
segregation aspects did not significantly differ during this time.
Two of the most significant public holidays that differ from the routine time in Estonia
outside Tallinn are Midsummer holiday (Midsummer Day 24.06 and Victory Day 23.06) and
Christmas (24-26.12). During Christmas Estonians’ space usage is much wider than of
Russian-speakers’. It is also noteworthy that during these holidays the number of people is the
smallest in Tallinn across observed holidays.
26
4. Discussion
4.1 Explaining ethnic differences during holidays
The goal of this study was to find out how holidays affect ethnic segregation of Estonians and
Russian-speaking minority. On the most general level it is possible to conclude that during
holidays, people’s out-of-home non-employment activity locations are different compared to
ordinary workdays or weekends. This is in line with previous studies in this matter (Isaacman
et al 2011, Cools et al 2007, Cools et al 2010, Sepp 2010) that found differences in the
people’s spatial mobility during holidays. Overall the segregation was higher in Estonia
outside Tallinn than in Tallinn during holidays. This study also showed that different holidays
influence ethnic groups and their activity locations differently, which is similar to Fox (2006)
case study. Estonians leave the capital during Estonian public and international holidays,
while Russian-speakers only on Estonian public holidays. Segregation was the highest during
Estonian public and international holidays both in- and outside Tallinn; in Estonia outside
Tallinn it was also significantly higher on Russian public holidays when compared to ordinary
time. When Russian-speakers leave the capital during holidays, they tend to go to
municipalities with high percentage of Russian-speakers. In Tallinn, only on Russian public
holidays Russian-speakers visit different districts (in terms of Russian-speaking inhabitants)
when compared to ordinary time.
Explanations why people from different ethnic groups conduct various activities during
holidays are highly dependent on the definition of holidays. When holidays are considered
just as a time that is free, like it has been done mainly in transportation studies (e.g. Cools et
al 2007), the differences in Estonians and Russian-speakers’ out-of-home non-employment
activities can be explained to some extent by disadvantage or marginality hypothesis.
Marginality hypothesis states that lower socio-economic status of minorities can limit their
leisure time opportunities (Johnson et al 2001, Floyd 1998). Estonian public holidays and
international holidays which include temporally overlapping Estonian and Russian holidays
represent mainly non-working days that offer the opportunity for travelling. Compared to
Russian-speakers the number of Estonians is higher in Estonia outside Tallinn among both of
these holiday categories which mean that Estonians are more likely to leave the home-city
than Russian-speakers. While Russian-speaking minority is relatively concentrated to certain
areas during holidays, Estonians’ space usage outside Tallinn is much wider. This finding
corresponds to other studies conducted in Estonia which claim that Russian-speaking
minority’s spatial behavior is more compact (Müürisepp 2013) and they visit smaller number
of districts during leisure time than Estonians (Silm & Ahas 2014a). It can partly be explained
by the disadvantaged position of the Russian-speakers, who have smaller income and higher
unemployment-rate than the national average (Tammaru & Kulu 2003, Vöörman & Helemäe
2003). These factors can limit the access to transportation and information that is necessary
for undertaking activities further away from home-city.
In addition, social networks also influence people’s spatial behavior during holidays, because
during free days it is possible to visit family (Wallendorf & Arnould 1991, Sepp 2010) and
27
friends which is important to strengthen the community-feeling (Close & Zikhan 2009). In
this study the impact of social networks on ethnic segregation during holidays is very evident
in Estonia outside Tallinn. The spatial distribution of Estonians and Russian-speakers outside
Tallinn is moderately uneven during that time and Russian-speakers tend to visit places with
high percentage of Russian speaking inhabitants. This finding depicts the influence of social
networks that have the propensity of stimulating social activities and travel that are connected
to friends, acquaintances and family (Carrasco & Miller 2006, Stodolska 2007). This finding
is similar to Silm & Ahas (2014a) according to which Russian-speakers’ tend to visit more
districts that are mostly populated by the Russian-speaking minority. Estonians on the other
hand have much wider social networks that explain why their spatial behaviour is spatially
more far-reaching. The role of Russian-speakers’ social networks in Tallinn is generally not
so evident, although on certain Russian holidays like Russia Day, Russian-speaking minority
is located more in districts where other Russian-speakers live.
However, Russian-speakers’ socio-economic position and spatially concentrated social
networks do not explain why in Tallinn they tend to visit less places of their own language
during holidays nor why there are so big differences in Russian-speakers distribution during
Midsummer holiday (23.06-24.06) and Christmas (24.12-26.12). It is quite clear that these
factors alone cannot explain, for example, the differences in spatial behavior during Christmas
and Midsummer holiday, since these factors would influence the ability to move during free
days in a similar manner. It indicates that besides socio-economic position and social
networks, there might be other explanatory factors behind different activity locations of
Russian-speakers. The choice what to do during holidays can be affected by the preferences
which in turn depend on ethnic peculiarities. Ethnicity thesis states that choices based on
different cultural norms, values and traditions can contribute to ethnic segregation in different
parts of human activity space (e.g. White et al 1993, Floyd 1999, Allison & Ceiger 1993). The
standard approach for testing ethnicity thesis has been interpreting significant differences that
remain after controlling the socio-economic factors as contributors to variability in leisure-
time choices. This, however, does not explicitly indicate which element of ethnicity (Nagel
1994) contributes to differences in leisure-time segregation (Floyd 1998). Similarly, in this
study it is also not possible to outline what is the main contributor for ethnic differences in
activity locations during holidays, but it is quite clear that ethnic background plays an
important role. It also indicates that some holidays are not “just free time” but are laden with
cultural meanings and certain functions (Frolova 2013, Zhu 2010) that are important for
particular ethnic groups thereby affecting their leisure-time (out-of-home non-employment)
activity locations.
Cultural and religious traditions evident on holidays is one possible aspect of ethnicity that
can explain the differences in Russian-speakers’ activity-locations when compared to
everyday life. Only on Russian public holidays Russian-speakers’ out-of-home non-
employment activities are differently located in Tallinn than on ordinary time. During this
time Russian-speakers are visiting places with less Russian speaking inhabitants which means
that these places are located more in the centre of the city or in districts where less Russian-
speakers live. These places can be related to different activity locations for conducting
28
traditions and rituals. For example, on Victory Day (09.05), that belongs to Russian public
holiday category and depicts victory and sorrow for WWII, Russians traditionally visit
cemeteries and monuments (Frolova 2013). In Tallinn, many Russian-speakers gather near
Bronze Soldier in Estonia’s Defence Forces Cemetery (City Centre district) during this
holiday. Another example when results indicate different spatial behavior probably due to
traditions is Women’s Day, which is a very popular holiday among Russians (Frolova 2013).
During this time the average absolute number of Russian-speakers outside their home and
working areas is the highest across all holidays in Tallinn and it can be explained by the
tradition of buying flowers and gifts for female acquaintances. Big shopping areas are
normally located outside the Russian-dominated districts in Tallinn. There are also more
Estonians during this time in Tallinn, but the change compared to ordinary time is not so
significant. Following traditions might be also evident during Orthodox Easter, when more
Russian-speakers are located in Tallinn districts with many Russian-speaker inhabitants.
During this time Russians tend to visit churches and cemeteries with family-relative members.
While according to ethnicity thesis the choices evident during holidays are not so “freely”
chosen due to cultural traditions, then identity thesis provides explanation based on more free
choice. According to identity thesis ethnic minorities avoid ’mainstream’ activities
(Aizlewood et al 2006) in order to keep their own identity and heritage and contrast
themselves from another groups (Washburne 1980). They consciously choose to construct and
preserve their identity by engaging in ethno-specific recreation (Karlis & Dawson 1995). This
approach can to some extent possibly explain why less Russian-speakers leave Tallinn during
Estonian public and international holidays compared to Estonians. For example, the reason
why few Russian-speakers are leaving the capital during Christmas (compared to Midsummer
holiday), even though it is accompanied also with free days, might be connected to the
Russian cultural roots. Christmas in Russia is celebrated in January according to the old
calendar (Frolova 2013); Russian-speaking minority in Estonia might not feel emotionally
connected to Lutheran Christmas, because it is not part of their ethnic culture. They might
either consider not worth celebrating it, like in the case study conducted by Fox (2006), or
they consider celebrating it as a “threat” for their identity. For Estonians, however, this
holiday is very important and it is usually spent in family-circle (Sepp 2010). Thus, ethnic
segregation evident on Christmas is probably the result of different cultural attachment to
these holidays: Estonians leave the capital and visit their family while Russian-speakers do
not feel emotionally connected to this time and move less. This result is somewhat similar
with Fox (2006) study where members of ethnic minority tended to deliberately avoid
celebrating majority’s holiday.
Although little elaborated, the idea of identity thesis puts leisure and leisure-time choices into
a different context than it has been so far considered. Floyd (1998) states that majority of the
leisure-time literature has seen leisure as a dependent variable, thus considering ethnicity as a
factor that influences free-time choices, thereby supporting the ethnicity theory. Nevertheless,
in the context of ethnic culture creation, leisure time may serve an enormous role in recreating
a particular identity and it can be the “part of the mix of materials from which ethnicity is
created, recreated and asserted” (Floyd 1998, Nagel 1994). In his view, leisure might be more
29
of an explanatory variable. This approach might, in my opinion, be applicable for the case of
holidays and accompanying free time, since their function is to recreate cultural peculiarities
(Fischer & Arnold 1990) and sustain national unity (Zhu 2012). Derived from this, activities
undertaken during holidays may be important contributors to preservation of ethnicity.
Although this study cannot directly prove this hypothesis, some results support the idea. For
example, activities undertaken during Russian public holiday – Victory Day in Tallinn is
more likely due to sustaining Russophone identity than being “enforced by the cultural
traditions“. Therefore celebrating national, folk or public holidays might serve the purpose of
recreating one’s identity both for majority and the ethnic minority in the host society.
However, the relationship between leisure and ethnicity needs further explorations in order to
confirm this argument.
Nevertheless, whether the choices occurring on holidays are the result of ethnicity or identity
approach, they are still connected to the preferences of particular person. A choice to
celebrate majority’s holiday may indicate a stronger attachment to the host society. The
criterion of celebrating majority’s holidays has been used in studies that try to measure the
level of integration (e.g. Eshel & Rosenthal-Sokolov 2000). According to the Study of
Integration of Social Groups (2013) more integrated Russians are celebrating fewer Russian
holidays than those who are less integrated. According to Seljamaa (2013) Midsummer
holiday is also quite popular among Russian-speaking minority, therefore more Russian-
speakers are likely to take part in the festivities, which can also refer to more integrated
Russian-speakers. However, this study shows that Estonians are during that time mostly
located in South- and West-Estonia, Russian-speakers are crowded in North- and East-Estonia
in Russian-dominated districts. During that time the correlation and dissimilarity index in
Estonia (excl Tallinn) was one of the highest across all observed holidays. This means that
celebrating majority’s holiday does not necessarily indicate higher integration and do not
contribute to the increase of inter-ethnic contacts. It can be hypothesized why Russian-
speaking minority is celebrating this day. Is it because of accompanying free days, the essence
of this particular holiday (bonfires, many parties and other activities) and the fact that the
holiday takes place in summer when it is easier to travel. Or is it because in Russian culture
they have a very similar holiday – Ivan Kupala that takes place in June or July depending on
the calendar – and they actually celebrate the Russian holiday during the same time as
Estonian Midsummer holiday. More in-depth studies are necessary to answer this question.
In Tallinn the segregation was the highest during New Year’s Day, which is an interesting
result, given the fact that holiday celebrations are similar among both observed ethnic groups.
It means that the norms, values and traditions derived from ethnic background probably do
not matter here. Also, since it is international holiday, the festivities during that time cannot
be attributed to reasserting one’s identity. So, the result can most probably be explained by the
preferences to spend the holiday among own group (homophily principle) and social networks
or marginality thesis which enables more well-off Estonians to leave the capital.
Current study is a contribution to existing segregation literature, because it combines spatial
and temporal dimension of ethnic segregation. Toomet et al (2011) observed ethnic
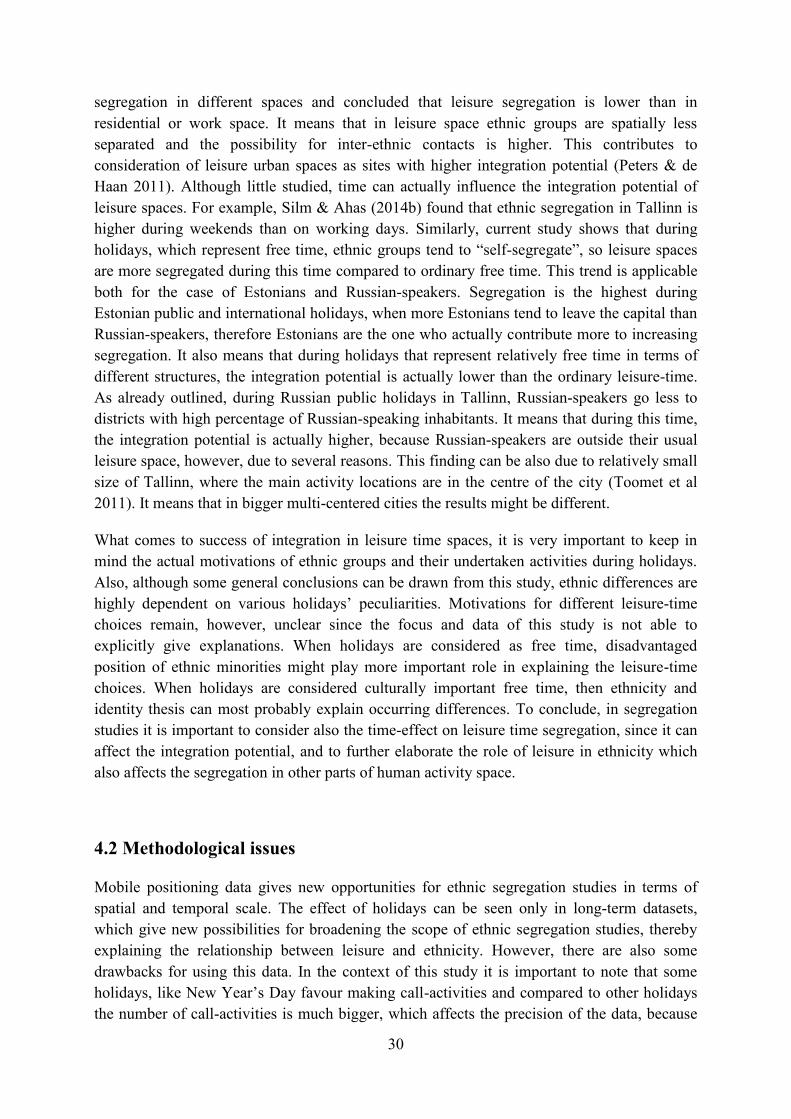
30
segregation in different spaces and concluded that leisure segregation is lower than in
residential or work space. It means that in leisure space ethnic groups are spatially less
separated and the possibility for inter-ethnic contacts is higher. This contributes to
consideration of leisure urban spaces as sites with higher integration potential (Peters & de
Haan 2011). Although little studied, time can actually influence the integration potential of
leisure spaces. For example, Silm & Ahas (2014b) found that ethnic segregation in Tallinn is
higher during weekends than on working days. Similarly, current study shows that during
holidays, which represent free time, ethnic groups tend to “self-segregate”, so leisure spaces
are more segregated during this time compared to ordinary free time. This trend is applicable
both for the case of Estonians and Russian-speakers. Segregation is the highest during
Estonian public and international holidays, when more Estonians tend to leave the capital than
Russian-speakers, therefore Estonians are the one who actually contribute more to increasing
segregation. It also means that during holidays that represent relatively free time in terms of
different structures, the integration potential is actually lower than the ordinary leisure-time.
As already outlined, during Russian public holidays in Tallinn, Russian-speakers go less to
districts with high percentage of Russian-speaking inhabitants. It means that during this time,
the integration potential is actually higher, because Russian-speakers are outside their usual
leisure space, however, due to several reasons. This finding can be also due to relatively small
size of Tallinn, where the main activity locations are in the centre of the city (Toomet et al
2011). It means that in bigger multi-centered cities the results might be different.
What comes to success of integration in leisure time spaces, it is very important to keep in
mind the actual motivations of ethnic groups and their undertaken activities during holidays.
Also, although some general conclusions can be drawn from this study, ethnic differences are
highly dependent on various holidays’ peculiarities. Motivations for different leisure-time
choices remain, however, unclear since the focus and data of this study is not able to
explicitly give explanations. When holidays are considered as free time, disadvantaged
position of ethnic minorities might play more important role in explaining the leisure-time
choices. When holidays are considered culturally important free time, then ethnicity and
identity thesis can most probably explain occurring differences. To conclude, in segregation
studies it is important to consider also the time-effect on leisure time segregation, since it can
affect the integration potential, and to further elaborate the role of leisure in ethnicity which
also affects the segregation in other parts of human activity space.
4.2 Methodological issues
Mobile positioning data gives new opportunities for ethnic segregation studies in terms of
spatial and temporal scale. The effect of holidays can be seen only in long-term datasets,
which give new possibilities for broadening the scope of ethnic segregation studies, thereby
explaining the relationship between leisure and ethnicity. However, there are also some
drawbacks for using this data. In the context of this study it is important to note that some
holidays, like New Year’s Day favour making call-activities and compared to other holidays
the number of call-activities is much bigger, which affects the precision of the data, because

31
more people leave their “digital footprint” in database. Although the influence of call
activities on the number of people was minimized using aggregated data, there is still the
possibility that during some holidays the intensity of making calls or sending SMSs is very
low or high, which influences the number of people in different spatial units and can hide or
overestimate the holiday effect. Also in some places, such as churches, people tend to usually
make fewer call-activities than in other activity locations.
CDR data is a very valuable source for leisure-time ethnic studies due to its
comprehensiveness in terms of sampling opportunities and temporal scale. For making
general conclusions the data is very suitable, however, it does not provide answers to more
specific questions and it lacks of individual information (Silm & Ahas 2014b) that can be
important for explaining the holiday effect. Therefore in the future studies, it is necessary to
combine these general results with more detailed data in order to find out the peculiarities of
various holidays, their meanings and individual activity motivations.
In terms of used methods, some critics may be applied for holiday categories and the selection
of holidays. For the sake of methodological cohesion, the selection of holidays was quite rigid
and it can be argued whether included holidays are important enough. When combined into
categories some unimportant holidays can diminish the influence of more important ones,
therefore influencing the results. However, in this study there was no possibility to
confidently distinguish more important holidays from unimportant ones without bringing in
the subjective viewpoint. Perhaps in the future studies the focus could be set on holidays and
their categories that had significant influence in this study.
In this study call activities that were made in the residence district were excluded for the sake
of obtaining activities locations which represent leisure space. However, some holidays are
quite home-centred and excluding in-home activities might have some effect on the results.
32
Conclusions
There is a growing attention towards the importance and influence of leisure time choices in
social sciences due to diversification of leisure opportunities and a growing share of free-time
activities in our everyday lives (Sheller & Urry 2006, Schlich et al 2007). Over the last years
more segregation studies (e.g. Wong & Shaw 2011, Wang et al 2012) have considered activity
space concept as an appropriate construct for observing the domains of individual’s everyday
life – home, work, leisure – where segregation can occur. This study is a contribution to this
field, because it focuses on relatively little studied out-of-home non-employment sphere and
temporal dimension of ethnic segregation.
The goal of this study was to explore the impact of holidays on ethnic segregation between
Estonian and Russian-speakers from three aspects using mobile positioning data with the
sample size of 12500 people. Three analysed aspects were a) the location of Estonians and
Russian-speakers in Tallinn and Estonia (excl Tallinn); b) unevenness dimension of
segregation measured by dissimilarity index; c) the influence of activity location’s ethnic
composition for Russian-speakers. Holiday effect was estimated by a) contrasting holidays
with normal days, b) contrasting several holiday types with normal days.
On the most general level it is possible to conclude that holidays affect people’s activity
locations and their locations are different when compared to ordinary time. Current study also
shows that even though holidays are different from ordinary time, holiday types such as
Estonian and Russian public or international holidays have a particular effect people’s spatial
behaviour. On the contrary, Russian and Estonian other holidays do not have significant
effects on neither of the language groups. These disparities occur on various spatial levels. It
depicts different temporal layers of segregation, which also indicates different integration
potential in leisure-spaces during various time-frames.
During holidays Estonian and Russian-speakers are spatially more segregated compared to
ordinary time. Estonians leave the capital during Estonian public and international holidays,
while Russian-speakers only on Estonian public holidays. Segregation was the highest during
Estonian public and international holidays both in- and outside Tallinn; in Estonia outside
Tallinn it was also significantly higher on Russian public holidays when compared to ordinary
time. When Russian-speakers leave the capital during holidays, they tend to go to
municipalities with high percentage of Russian-speakers. In Tallinn, only on Russian public
holidays Russian-speakers visit different districts (in terms of Russian-speaking inhabitants)
when compared to ordinary time. During that time they tend to visit districts with less
percentage of Russian-speakers than on ordinary time.
To conclude, the results of this study showed that different holiday types have a different
influence on the Estonians and Russian-speaking minority’s spatial mobility and segregation.
Outside the capital, Estonians movements are probably more related to emotional connection
to particular holidays than it is for Russian-speakers. Their travels made on public holidays
are highly connected to social networks and it is probable that the trips are not linked with
emotional connectedness to Estonian holidays and integration process, but rather to a

33
possibility to visit members of social networks. In Tallinn, the choices derived from ethnic
background or the wish to sustain Russopohone identity is more probable, especially during
Russian public holidays.
34
Kokkuvõte
Magistritöö „Etniline segregatsioon vaba aja tegevuskohtades riiklike ja
rahvuslike pühade ajal“
Etniline segregatsioon on geograafide huviorbiidis olnud juba aastakümneid ning uute
kontseptsioonide ja andmeallikate valguses saab see geograafiline protsess üha
mitmekesisemat tähelepanu. Tegevusruumi kontseptsioon hõlmab erinevaid dimensioone, kus
etnilised grupid võivad ruumilist eraldatust kogeda (Wong & Shaw 2011, Farber et al 2012).
Wang jt (2012) järgi peaksid tegevusruumil põhinevad segregatsiooniuuringud vaatlema
erinevaid ruumilisi – s.o eluruum, töökoht, vaba aeg – ja ajalisi mõõtmeid. Käesolev
uurimistöö keskendub pühadeaegsele ruumikasutusele väljaspool elu- ja töökohta, hõlmates
ka vaba aja tegevuskohti.
Magistritöö eesmärk on vaadelda ja seletada pühade mõju eestlaste ja venekeelse elanikkonna
etnilisele segregatsioonile. Seejuures vaadeldi seda protsessi kolmest aspektist: a) kuidas
muutub inimeste arv Tallinnas ja väljaspool Tallinna pühade ajal; b) milline on pühade mõju
ruumilisele eraldatusele; c) kuidas mõjutab sihtkoha etniline koosseis pühadeaegseid
tegevuskohti. Valim koosnes 12500 eesti ja vene keelt EMT’ga suhtluskeelena kasutavast
uuritavast ja andmestiku moodustab nende nelja aasta (2007-2010) vältel tehtud
kõnetoimingud, mis hangiti passiivse mobiilpositsioneerimise meetodi abil. Pühade mõju
hindamiseks kasutati Poissoni regressioonanalüüsi ja üldiseid lineaarseid mudeleid (GLM).
Sõltuvad tunnused olid peale eestlaste ja venekeelsete arvu veel erinevuse (dissimilarity)
indeks ja Spearmani ρ. Esmalt vaadeldi mudelite abil, kas pühad üleüldiselt mõjutavad
ruumikasutust, seejärel hinnati kuivõrd need erinevused ilmnevad erinevate pühade lõikes.
Pühad mõjutavad tavapäevadega võrreldes eestlaste ja venekeelsete inimeste ruumikasutust
märkimisväärselt. Kuigi pühade ajal on üldiselt nii eestlasi kui venekeelseid Tallinnas vähem,
mõjutavad pühade kategooriad inimeste tegevuskohti erinevalt. Käesolevast uurimistööst
selgus, et Eesti, Vene riigi- ja rahvusvahelised mõjutavad inimeste ruumikasutust oluliselt,
Eesti ja Vene rahvuslikud pühad aga mitte. See tulemus viitab etnilise segregatsiooni ajalisele
varieeruvusele, mis mõjutab integreerumist ja rahvustevaheliste kontaktide potentsiaali ning
seda just vaba aja ruumides.
Etnilise segregatsiooni tase on pühade ajal suurem kui tavapäevadel. Kui eestlased lahkuvad
Tallinnast Eesti riigi- ja rahvusvaheliste pühade ajal, siis venekeelsed eelkõige Eesti
riigipühade ajal. Eestlased ja venekeelsed uuritavad olid ruumiliselt kõige ebaühtlasemalt
jaotunud nii Tallinnas kui väljaspool pealinna Eesti riigi- ja rahvusvaheliste pühade ajal;
väljaspool Tallinna on etniline segregatsioon tavapäevadest statistiliselt oluliselt erinev ka
Vene riigipühade ajal. Kui venekeelsed uuritavad lahkuvad Tallinnast, siis nad lähevad
enamasti kõrge venekeelse elanike osatähtsusega omavalitsustesse. Tallinnas on ainult Vene
riigipühade ajal statistiliselt oluline seos venekeelse elanikkonna ja vene keelt kõnelevate
uuritavate osatähtsuse vahel tavapäevadega võrreldes. Sellel ajal viibivad venekeelsed
inimesed ruumilistes üksustes, kus venekeelse elanikkonna osatähtsus on väiksem.

35
Kokkuvõtvalt võib väita, et pühad ja pühade liigid mõjutavad eestlaste ja venekeelsete
ruumikasutust erinevalt ja sellel ajal on vaba aja segregatsioon suurem.

36
Acknowledgments
Very sincere thanks to my supervisors Dr. Siiri Silm and Prof. Rein Ahas, who have guided
me through this long process. Without their help I would have not been able to finish this
thesis. Special and big thanks go also to my dear Estonian and Hong Kong friends and family
who always supported and kept on motivating me.

37
References
Ahas, R., Aasa, A., Roose, A., Mark, Ü., Silm, S., 2008. Evaluating Passive Mobile
Positioning Data for Tourism Surveys: An Estonian Case Study. Tourism Management, 29
(3), 469-486
Ahas, R., Silm, S., Järv, O., Saluveer, E., Tiru, M., 2010. Using Mobile Positioning Data to
Model locations Meaningful to Users of Mobile Phones. Journal of Urban Technology, 17
(1), 3-27.
Ahas, R., Aasa, A., Silm, S., Roosaare, J., 2005. Seasonal Indicators and Seasons of
Estonian Landscapes. Landscape Research, 30(2), 173-191.
Aizlewood, A., Bevelander, P., Pendakur, R., 2006. Recreational Participation among
Ethnic Minorities and Immigrants in Canada and the Netherlands. Journal of Immigrant &
Refugee Studies, 4 (3), 1-32.
Allen, J.P., Turner, E., 2011. Black-White and Hispanic-White Segregation in U.S.
Counties. The Professional Geographer, 64 (4), 503-520.
Allison, M.T., Geiger, C.W., 1993. Nature of Leisure Activities among the Chinese-
American Elderly. Leisure Sciences, 15 (4), 309-319.
Anowar, S., Yasmin, S., Tay, R., 2013. Comparison of Crashes during Public Holidays and
Regular Weekends. Accident Analysis and Prevention, 51, 93-97.
Ǻslund, O., Skans, O.N., 2010. Will I See You at Work? Ethnic Workplace Segregation in
Sweden, 1985-2002. Industrial and Labor Relations Review, 63 (3), 471-493.
Blumenstock, J., Fratamico, L., 2013. Social and Spatial Ethnic Segregation: A Framework
for Analyzing Segregation with Large-Scale Spatial Network Data. Proceedings of the 4th
Annual Symposium on Computing for Development. Article No 11.
Calabrese, F., Pereira, F.C., Di Lorenzo, G., Liu, L., Ratti, C., 2010. The Geography of
Taste: Analyzing Cell-Phone Mobility and Social Events. Pervasive Computing, LNCS, 6030,
22-37.
Carr, D.S., Williams, D.R., 1993. Understanding the Role of Ethnicity in Outdoor
Recreation Experiences. Journal of Leisure Research, 25 (1), 22-38.
Carrasco, J.A., Miller, E.J., 2009. The Social Dimension in Action: A Multilevel, Personal
Networks Model of Social Activity Frequency between Individuals. Transportation Research
A, 43, 90-104.
Charles, C.Z., 2003. The Dynamics of Racial Residential Segregation. Annual Review of
Sociology, 29, 167-207.
38
Clark, W.A.V., 2002. Ethnic Preferences and Ethnic Perceptions in Multi-Ethnic Settings.
Urban Geography, 23 (3), 237-256.
Close, A.G., Zinkhan, G.M., 2006. A Holiday Loved and Loathed: A Consumer Perspective
of Valentine’s Day. Advances in Consumer Research, 33, 356-365
Close, A.G., Zinkhan, G.M., 2009. Market-Resistance and Valentine’s Day events. Journal
of Business Research, 62, 200-207.
Cools, M., Moons, E., Wets, G., 2007. Investigating Effect of Holidays on Daily Traffic
Counts. Transportation Research Record: Journal of the Transportation Research Board,
2019, 22-32.
Cools, M., Moons, E., Wets, G., 2009. Investigating the Variability in Daily Traffic Counts
Through Use of ARIMAX and SARIMAX Models. Transportation Research Record:
Journal of the Transportation Research Board, 2136, 57-66
Cools, M., Moons, E., Wets, G., 2010. Assessing the Impact of Public Holidays on Travel
Time Expenditure. Differentiation by Trip Motive. Transportation Research Record: Journal
of the Transportation Research Board, 2157, 29-37
Coxe, S., West, S.W., Aiken, L.S., 2009. The Analysis of Count Data: A Gentle Introduction
to Poisson Regression and Its Alternatives. Journal of Personality Assessment, 91(2), 121-
136.
Dixon, J., Durrheim, K., 2003. Contact and the Ecology of Racial Division: Some Varieties
of Informal Segregation. British Journal of Social Psychology, 42, 1-23.
Dougherty, K. D., 2003. How Monochromatic Is Church Membership? Racial-Ethnic
Diversity in Religious Community. Sociology of Religion, 64 (1), 65-85.
Duncan, O.D., Duncan, B., 1955. Residential Distribution and Occupational Stratification.
The American Journal of Sociology, 60 (5), 493-503.
Ellis, M., Wright, R., Parks, V., 2004. Work Together, Live Apart? Geographies of Racial
and Ethnic Segregation at Home and at Work. Annals of the Association of American
Geographers, 94 (3), 620-637.
Eshel, Y., Rosenthal-Sokolov, M., 2000. Acculturation Attitudes and Sociocultural
Adjustment of Sojourner Youth in Israel. The Journal of Social Psychology, 140 (6), 677-691.
Farber, S., Páez, A., Morency, C., 2012. Activity Spaces and the Measurement of Clustering
and Exposure: A Case Study of Linguistic Groups in Montreal. Environment and Planning A,
44, 315-332.
Fischer, E., Arnold, S.J., 1990. More than a Labor of Love: Gender Roles and Christmas
Gift Shopping. Journal of Consumer Research, 17, 333- 345
Floyd, M., 1999. Race, Ethnicity and Use of National Park System. Social Science Research
Review, 1 (2), 1-24.
39
Floyd, M.F., 1998. Getting Beyond Marginality and Ethnicity: The Challenge for Race and
Ethnic Studies in Leisure Research. Journal of Leisure Research, 30 (1), 3-22
Fox, J.E., 2006. Consuming the Nation: Holidays, Sports, and the Production of Collective
Belonging. Ethnic and Racial Studies, 29 (2), 217-236.
Frolova, A., 2013. Modern Holiday Calendar of the Russians. Етноантрополошки
проблеми [Issues in Ethnology and Anthropology], 8 (1), 239-257.
Gale, R., 2013. Religious Residential Segregation and Internal Migration: the British Muslim
Case. Environment and Planning A, 45, 872-891.
Gans, H., 1979. Symbolic Ethnicity: the Future of Ethnic Groups and Cultures in America.
Ethnic and Racial Studies, 2 (1), 1-20.
Gobster, P.H., 1998. Explanations for Minority „Underparticipation“ in Outdoor Recreation:
A Look at Golf. Journal of Park and Recreation Administration, 16 (1), 46-64.
Golledge, R.G., Stimson, R.J., 1997. Spatial Behaviour: A Geographical Perspective. The
Guilford Press, New York.
Gordon, M.M., 1964. Assimilation in American life: The Role of Race, Religion, and
National Origins. New York: Oxford University Press
Gram, M., 2005. Family Holidays. A Qualitative Analysis of Family Holiday Experiences.
Scandinavian Journal of Hospitality and Tourism, 5 (1), 2-22.
Horton, F.E., Reynolds, D.R., 1971. The Effects of Urban Spatial Structure on Individual
Behavior. Economic Geography, 47, 36–48.
Huang, F.L., Cornell, D.G., 2012. Pick Your Poisson: A Tutorial on Analyzing Counts of
Student Victimization Data. Journal of School Violence, 11 (3), 187-206.
Hägerstrand, T., 1970. What About People in Regional Science? Papers and Proceedings of
the Regional Science Association, 24, 7-21.
Isaacman, S., Becker, R., Caceres, R., Kobourov, S., Martonosi, M., Rowland, J., 2011.
Ranges of Human Mobility in Los Angeles and New York.
https://raptor.cs.arizona.edu/~kobourov/mucs.pdf
Järv, O., Ahas, R., Witlox, F., 2014. Understanding Monthly Variability in Human Activity
Spaces: A Twelve-Month Study Using Mobile Phone Call Detail Records. Transportation
Research Part C, 38, 122-135.
Johnson, C.Y., Bowker, J.M., Cordell, H.K., 2001. Outdoor Recreation Constraints: An
Examination of Race, Gender, and Rural Dwelling. Southern Rural Sociology, 17, 111-133.
40
Johnson, C.Y., Bowker, J.M., English, D.B., Worthen, D., 1998. Wildland Recreation in
the Rural South: An Examination of Marginality and Ethnicity Theory. Journal of Leisure
Research, 30 (1), 101-120.
Johnston, R., Poulsen, M., Forrest, J., 2007a. The Geography of Ethnic Residential
Segregation: A Comparative Study of Five Countries. Annals of the Association of American
Geographers, 97(4), 713-738.
Johnston, R., Poulsen, M., Forrest, F., 2007b. Ethnic and racial Segregation in U.S.
Metropolitan Areas, 1980-2000: The Dimensions of Segregation Revisited. Urban Affairs
Review, 42 (4), 479-504.
Kamruzzaman, M., Hine, J., 2012. Analysis of Rural Activity Spaces and Transport
Disadvantage Using A Multi-Method Approach. Transport Policy, 19, 105-120.
Karlis, G., Dawson, D., 1990. Ethnic Maintenance and Recreation: A Case Study. Journal of
Applied Recreation Research, 15 (2), 85-99.
Kelly, J.R., 1987. Freedom to Be: A New Sociology of Leisure. New York, NY:MacMillan
Press.
Kimura, J., Belk, R.W., 2005. Christmas in Japan: Globalization Versus Localization.
Consumption Markets & Culture, 8 (3), 325-338.
Korts, K., 2009. Inter-Ethnic Attitudes and Contacts Between Ethnic Groups in Estonia.
Journal of Baltic Studies, 40 (1), 121-137.
Krivo, L.J., Washington, H.M., Peterson R.D., Kwan, M.P., 2013. Social Isolation of
Disadvantage and Advamtage: the Reproduction of Inequality in Urban Space. Social Forces,
92 (1), 141-164.
Kwan, M.P., 2013. Beyond Space (As We Knew It): Toward Temporally Integrated
Geographies of Segregation, Health and Accessibility. Annals of the Association of American
Geographers, 103 (5), 1078-1086
Kährik, A., 2002. Changing Social Divisions in the Housing Market of Tallinn, Estonia.
Housing, Theory and Society, 19, 48-56.
Kährik, A., Tammaru, T., 2008. Population Composition in New Suburban Settlements of
the Tallinn Metropolitan Area. Urban Studies, 45 (5&6), 1055-1078
Kährik, A., Tammaru, T., 2010. Soviet Prefabricated Panel Housing Estates: Areas of
Continued Social Mix or Decline? The Case of Tallinn. Housing Studies, 25(2), 201-219.
Li, C.L., Chick, G.E., Zinn, H.C., 2007. Ethnicity as a Variable in Leisure Research.
Journal of Leisure Research, 39 (3), 514-545.
41
Massey, D., Rothwell, J., Domina, T., 2009. The Changing Bases of Segregation in the
United States. The ANNALS of the American Academy of Political and Social Science, 626
(14), 74-90.
Massey, D.S., Denton, N.A., 1988. The Dimensions of Residential Segregation. Social
Forces, 67 (2), 281-315.
Massey, D.S., Denton, N.A., 1993. American Apartheid: Segregation and the Making of the
Underclass. Harvard University Press, Cambridge, MA.
McPherson, M., Smith-Lovin, L., Cook, J.M., 2001. Birds of a Feather: Homophily in
Social Networks. Annual Review of Sociology, 24, 415-444.
Merz, J., Osberg, L., 2006. Keeping in Touch – A Benefit of Public Holidays. FFB-
Discussion Paper No.57. Universität Lüneburg.
Mooses, V., 2011. Lasnamäel elava eesti- ja venekeelse elanikkonna ruumikasutuse
erinevused riiklike ja rahvuslike pühade ajal [Differences in Spatial Behaviour Among
Estonian and Russian Speaking Communities in Lasnamäe During National Holidays].
Master’s thesis. University of Tartu, Department of Geography.
Musterd, S., 2005. Social and Ethnic Segregation in Europe: Levels, Causes and Effects.
Journal of Urban Affairs, 27 (3), 331-348.
Musterd, S., van Kempen, R., 2009. Segregation and Housing of Minority Ethnic Groups in
Western European Cities. Tijdschrift voor Economische en Sociale Geografie, 100 (4), 559-
566.
Müürisepp, K., 2013. Tegevusruumipõhine etniline segregatsioon Tallinna eesti- ja
venekeelse elanikkonna näitel [Ethnic Segregation and Individual Activity Spaces: The Case
of Estonian- and Russian-speaking Population of Tallinn]. Master’s Thesis, University of
Tartu, Department of Geography.
Nagel, J., 1994. Constructing Ethnicity: Creating and Recreating Ethnic Identity and Culture.
Social Problems, 41 (1), 152-176.
Ngai, P., 2003. Subsumption or Consumption? The Phantom of Consumer Revolution in
„Globalizing“ China. Cultural Anthropology. 18 (4), 469-492.
Peach, C., 1999. London and New York: Contrasts in British and American Models of
Segregation. International Journal of Population Geography, 5, 319-351.
Peters, K., 2008. Leisure in a Multicultural Society. In: de Haan & van der Duim (editors)
Landscape, Leisure and Tourism. Eburon, 97-112.
Peters, K., de Haan, H., 2011. Everyday Spaces of Inter-Ethnic Interaction: the Meaning of
Urban Public Spaces in the Netherlands. Leisure/Loisir, 35 (2), 169-190.
42
Ringvee, R., 2008. State, Religion and the Legal Framework in Estonia. Religion, State and
Society, 36 (2), 181-196.
Robinson, J.P., Godbey, G., 1997. The Use of Time. In: Time for Life -The Surprising Ways
Americans Use Their Time. The Pennsylvania State University Press, 3-57.
Sasidharan, V., 2002. Special Issue Introduction: Understanding Recreation and the
Environment within the Context of Culture. Leisure Sciences, 24 (1), 1-11.
Schlich, R., Schönfelder, S., Hanson, S., Axhausen, K.W., 2007. Structures of Leisure
Travel: Temporal and Spatial Variability. Transport Reviews, 24 (2), 219-237.
Schnell, I., Benjamini, Y., 2001. The Sociospatial Isolation of Agents in Everyday Life
Spaces as an Aspect of Segregation. Annals of the Association of American Geographers, 91
(4), 622-636.
Schönfelder, S., 2003. Between Routines and Variety Seeking: The Characteristics of
Locational Choice in Daily Travel. Paper presented at 10th
International Conference on Travel
Behaviour Research, Lucerne, 10-15 August.
Schrover, M., van der Leun, J., Quispel, C., 2007. Niches, Labour Market Segregation,
Ethnicity and Gender. Journal of Ethnic and Migration Studies, 33 (4), 529-540.
Scully, M., 2012. Whose Day Is It Anyway? St. Patrick’s Day as a Contested Performance of
National and Diasporic Irishness. Studies in Ethnicity and Nationalism, 12 (1), 118-135.
Seljamaa, E.H., 2010. „Kui pidu korraldatakse, on järelikult seda kellelgi vaja“:Vene
vastlapühade tähistamisest Tallinnas. („Every Celebration is Necessary for Someone“:
Russian Shrovetide in Tallinn). Keel ja Kirjandus, 8 (9), 671-686.
Seljamaa, E.H., 2013. Tähtpäevad identiteediloome teenistuses [Holidays As a Part of
Identity Creation], interviewer Paulus, S. 2013, Universitas Tartuensis – University of Tartu
Journal, April 2013, 4, 28-29.
Semyonov, M., Glikman, A., 2009. Ethnic Residential Segregation, Social Contacts, and
Anti-Minority Attitudes in European Societies. European Sociological Review, 25 (6), 693-
708.
Sepp, E. 2010. Eesti elanike vaba aja ruumikasutuse seosed igapäevaste tegevusruumidega
jõuluõhtu näitel [Ethnic Segregation and Individual Activity Spaces: The Case ofEstonian-
and Russian-speaking Population of Tallinn]. Master’s thesis. University of Tartu,
Department of Geography.
Shaull, S.L., Gramann, J.H., 1998. The effect of cultural assimilation on the importance of
family-related and nature-related recreation among Hispanic Americans. Journal of Leisure
Research, 30, 47-63.

43
Sheller, M., Urry, J., 2006. The New Mobilities Paradigm. Environment and Planning A, 38,
207-226.
Silm, S., Ahas, R.,2014a. Ethnic Differences in Activity Spaces: A Study of Out-of-Home
Nonemployment Activites with Mobile Phone Data. Annals of the Association of American
Geographers, 104 (3), 542-559
Silm, S., Ahas, R., 2014b. The Temporal Variation of Ethnic Segregation in a City: Evidence
from a Mobile Phone Use Dataset. Social Science Research, 47, 30-43.
Stodolska, M., 1998. Assimilation and Leisure Constraints: Dynamics of Constraints on
Leisure in Immigrant Populations. Journal of Leisure Research, 30, 521-551.
Stodolska, M., 2007. Ethnic Enclosure, Social Networks, and Leisure Behaviour of
Immigrants from Korea, Mexico and Poland. Leisure/Loisir, 31 (1), 277-324.
Strömgren, M., Tammaru, T., van Ham, M., Marcinczak, S., Stjernström, O., Lindgren,
U., 2011. Pre-Hire Factors and Workplace Ethnic Segregation. Discussion paper series //
Forschungsinstitut zur Zukunft der Arbeit, No. 5622,
http://nbn-resolving.de/urn:nbn:de:101:1-201104134258
Study of Integration of Social Groups, 2013 [Lõimumisvaldkonna sotsiaalsete gruppide
uuring]. Research report, Tallinn: TLÜ RASI.
Tammaru, T., Kulu, H., 2003. The Ethnic Minorities of Estonia: Changing Size, Location,
and Composition. Eurasian Geography and Economics, 44 (2), 105-120
Tammaru, T., Strömgren, M., Stjernström, O., Lindgren, U., 2010. Learning Through
Contact? The Effects on Earnings of Immigrant Exposure to the Native Population.
Environment and Planning A, 42, 2938-2955.
Tammaru, T., van Ham, M., Leetmaa, K., Kährik, A., 2011. Ethnic Dimensions of
Suburbanisation in Estonia, Discussion paper series // Forschungsinstitut zur Zukunft der
Arbeit, 5617, http://nbn-resolving.de/urn:nbn:de:101:1-201104114065
Thrift, N., 1977. An Introduction to Time Geography. Concepts and Techniques in Modern
Geography, 13, 3-37.
Toomet, O., Silm, S., Saluveer, E., Tammaru, T, Ahas, R., 2011. Ethnic Segregation in
Residence, Work, and Free-time: Evidence from Mobile Communication. University of Tartu
http://www.obs.ee/~siim/seminars/Segregation_domains-2011-11-14.pdf
Urry, J. 1996. The Tourist Gaze. Leisure and Travel in Contemporary Socities. London: Sage
Publications.
van Ham, M., Tammaru T., 2011. Ethnic Minority-Majority Unions in Estonia. European
Journal of Population, 27, 313-335.
44
van Kempen, R., Özüekren, A.Ş., 1998. Ethnic Segregation in Cities: New Forms and
Explanations in a Dynamic World. Urban Studies, 35 (10), 1631-1656.
Verbrugge, L.M., 1983. A Research Note on Adult Friendship Contact: A Dyadic
Perspective. Social Forces, 62, 78-83.
Vihalemm, T., 1999. Group Identity Formation Process Among Russian-speaking Settlers of
Estonia: A Linguistic Perspective. Journal of Baltic Studies, 30 (1), 18-39.
Vihalemm, T., 2007. Crystallizing and Emancipating Identities in Post-Communist Estonia.
Nationalities Papers, 35 (3), 477-502
Vöörmann, R., Helemäe, J., 2003. Ethnic Relations in Estonia’s post-Soviet Business
Community. Ethnicities, 3 (4), 509-530.
Wallendorf, M., Arnould, E.J., 1991. „We Gather Together“: Consumption Rituals of
Thanksgiving Day. Journal of Consumer Research, 18, 13-31.
Wang, D., Li, F., Chai, Y., 2012. Activity Spaces and Sociospatial Segregation in Beijing.
Urban Geography, 33 (2), 256-277.
Wang, Q., 2010. How Does Geography Matter in the Ethnic Labor Market Segmentation
Process? A Case Study of Chinese Immigrants in the San Francisco CMSA. Annals of the
Association of American Geographers, 100 (1), 182-201.
Washburne, R.F., Wall, P., 1980. Black-White Ethnic Differences in Outdoor Recreation.
USDA Forest Service Research Paper 1980 No. INT-249, Intermountain Forest and Range
Experiment Station, Ogden, UT.
Washburne, R.F., 1978. Black Under Participation in Wildland Recreation: Alternative
Explanations. Leisure Sciences, 1, 175-189.
White, M.J., Biddlecom, A.E., Guo, S., 1993. Immigration, Naturalization and Residential
Assimilation among Asian Americans in 1980. Social Forces, 72 (1), 93-117.
Wong D.W.S., Shaw, S.L., 2011. Measuring Segregation: An Activity Space Approach.
Journal of Geographical Systems, 13 (2), 127-145.
Wong, D.W.S., 2003. Implementing Spatial Segregation Measures in GIS. Computers,
Environment and Urban Systems, 27 (1), 53-70.
Zhang, T., Gobster, P.H., 1998. Leisure Preference and Open Space Needs in an Urban
Chinese American Community. Journal of Architectural and Planning Research, 15 (4), 338-
355.
Zhu, L., 2012. National Holidays and Minority Festivals in Canadian Nation-Building. PhD
Thesis. University of Sheffield, Department of History.
45
Non-exclusive licence to reproduce thesis and make thesis public
I, Veronika Mooses
1. herewith grant the University of Tartu a free permit (non-exclusive licence) to:
1.1. reproduce, for the purpose of preservation and making available to the public, including
for addition to the DSpace digital archives until expiry of the term of validity of the copyright,
and
1.2. make available to the public via the web environment of the University of Tartu,
including via the DSpace digital archives until expiry of the term of validity of the copyright,
“Ethnic segregation in out-of-home non-employment activity locations during public and
national holidays: a study with mobile phone data” supervised by Prof.Rein Ahas and
Dr.Siiri Silm.
2. I am aware of the fact that the author retains these rights.
3. I certify that granting the non-exclusive licence does not infringe the intellectual property
rights or rights arising from the Personal Data Protection Act.
Tartu, 19.05.2014