Embed Size (px)
Citation preview
Ethnicity, Inequality and the Public Sector: A Comparative Study
Yusuf Bangura UNRISD
This paper is based largely on the manuscripts submitted under the UNRISD project on “Ethnic Structure, Inequality and Governance of the Public Sector”
1
The United Nations Research Institute for Social Development (UNRISD) is an autonomous agency engaging in multidisciplinary research on the social dimensions of contemporary problems affecting development. Its work is guided by the conviction that, for effective development policies to be formulated, an understanding of the social and political context is crucial. The Institute attempts to provide governments, development agencies, grassroots organizations and scholars with a better understanding of how development policies and processes of economic, social and environmental change affect different social groups. Working through an extensive network of national research centres, UNRISD aims to promote original research and strengthen research capacity in developing countries. Current research programmes include: Civil Society and Social Movements; Democracy, Governance and Human Rights; Identities, Conflict and Cohesion; Social Policy and Development; and Technology, Business and Society. A list of the Institute’s free and priced publications can be obtained by contacting the Reference Centre.
UNRISD, Palais des Nations 1211 Geneva 10, Switzerland
Tel: (41 22) 9173020 Fax: (41 22) 9170650
E-mail: [email protected] Web: http://www.unrisd.org
Copyright © United Nations Research Institute for Social Development (UNRISD). This is not a formal UNRISD publication. The responsibility for opinions expressed in signed studies rests solely with their author(s), and availability on the UNRISD Web site (http://www.unrisd.org) does not constitute an endorsement by UNRISD of the opinions expressed in them. No publication or distribution of these papers is permitted without the prior authorization of the author(s), except for personal use.
Overview of Research Findings and Policy Issues
2
Table of Contents Introduction 4. A Typology of Ethnic Structures 6. Public Sector Institutions: Identities and Access 11. Ethnic Structure, Group Dynamics and Inequalities 13.
Unipolarity: Lithuania and Botswana 14. Cleavages and socio-economic inequalities 14. Group dynamics 16. Public sector inequalities 17. Bipolarity: Latvia, Belgium, Fiji and Trinidad 18.
Cleavages and socio-economic inequalities 18. Group dynamics 20. Public sector inequalities 24.
Tripolarity: Bosnia, Switzerland, Malaysia and Nigeria 26. Cleavages 26. Socio-economic inequalities 27. Group dynamics 28. Public sector inequalities 30. Concentrated multipolarity: Ghana, Kenya and India 34. Cleavages and socio-economic inequalities 34. Group dynamics and public sector inequalities 37. Fragmented multipolarity: Papua New Guinea and Tanzania 41. Institutional and Policy Reforms 44. Proportionality and redistribution 45. An index of ethnic proportionality 45. Redistributive policies 47. Majoritarian rule and power sharing 49. Federalism, decentralisation and minority rights 56. Conclusion 58. References 60.
Overview of Research Findings and Policy Issues
3
Tables and Boxes Tables Table 1: Ethnic structures and the fractionalisation index 7. Table 2: A typology of ethnic structures 9. Table 3: Ethnic inequalities in public sector institutions: Lithuania and Botswana 18. Table 4: Ethnic inequalities in public sector institutions: Fiji, Trinidad, Latvia and Belgium 25. Table 5: Ethnic inequalities in public sector institutions: Malaysia, Nigeria, Switzerland and Bosnia 33. Table 6: Ethnic inequalities in public sector institutions: Ghana and Kenya 38. Table 7: Ethnic inequalities in public sector institutions: Papua New Guinea and Tanzania 43. Table 8: Ethnic proportionality in public sector institutions 46. Table 9: Governance reforms: theory and practice 53. Table 10: Ethnic diversity and institutional characteristics 57. Boxes Box 1: Majoritarian rule and power sharing in Nigeria and Fiji 55.
Overview of Research Findings and Policy Issues
4
Ethnicity, Inequality and the Public Sector: A Comparative Study
Introduction Scholars in development studies increasingly recognize that inequalities between groups constitute a more potent source for violent conflict than inequalities among individuals (Stewart, 2000; Chua, 2002; Justino, 2003; Ndikumana, 2004). When inequalities in incomes, wealth, and access to social services or political power coincide with group differences, ethnicity may assume importance in shaping choices and mobilizing individuals for collective action. Yet little is known about the nature and dynamics of ethnic cleavages and inequalities1, especially as they affect the public sector, which plays a central role in resource allocation and identity formation. The public sector may be rendered ineffective or illegitimate if it fails to develop mechanisms to regulate difference and ensure inclusiveness. This paper examines the complex ways ethnic cleavages and inequalities affect public sector institutions. It focuses on issues of inclusion, accommodation and cohesion in the constitution and management of the public sectors of multiethnic societies under formal democratic rule. Ethnicity affects the identities of states, access to institutions, and the confidence different sections of society may have in government. Inequalities arising from the structure of opportunities and the way the public sector is governed are often a source of tension as individuals use group solidarity to maintain or alter advantages. The paper challenges three influential ideas about ethnicity, governance and cohesion. First, it is often believed by development analysts, political theorists, policy makers and the lay public that countries that are ethnically diverse are likely to be less cohesive and stable (Barry, 1991; Connor, 1994; and Miller, 1995), more prone to violent conflict (Furnivall, 1948; Smith, 1969; Ignatieff, 1993; and Moyniham, 1993), less disposed towards democratic government (Miller, 1995; Barry 1991; Nyerere, 1967; Museveni, 1997), more likely to experience low levels of industrialisation (Gellner, 1983)2 or growth (Easterly and Levine, 1997), and less likely to sustain universal welfare programmes (Goodhart, 2004). Although some recent quantitative studies (Collier and Hoeffler, 2001a,b; Elbadawi and Sambanis, 2001; Fearon and Laitin, 2003; Mozaffar, Scarritt and Galaich, 2003)3 have challenged some of these assumptions, the alternative views they posit have tended to minimise the role of diversity in influencing social and political outcomes. We argue that the relevant issue is not the existence of diversity per se, but types of diversity, which can constrain or support particular outcomes. Ethnic fragmentation does not necessarily produce pathological situations; nor is it helpful to downplay diversity in explaining social 1 Much of the analysis on inequality and conflict focuses on income inequality, which is often not disaggregated according to ethnic groups. See Cramer (2003a,b) for a critical review of this literature. Tilly (1999) discusses the institutionalisation of group inequality and its tolerance under given conditions. 2 Arash Abizadeh (2002) has advanced a very cogent theoretical critique of these arguments. Previous UNRISD projects on Ethnic Conflict and Development (Stavenhagen, 1996) and Ethnic Diversity and Public Policy (Young, 1998) were also critical of the link between diversity and pathological outcomes. 3 Mozaffar et al (2003) recognise the salience of diversity but limit it to fragmentation and concentration.
Overview of Research Findings and Policy Issues
5
behaviour. Ethnic cleavages are configured differently in different social structures and are less conflictual in some countries than in others. Second, contrary to the assumptions of liberal individualism, it is difficult to achieve proportionality or balance in the public sector if policies are not oriented towards it. Multiethnic societies that adopt ethnicity-blind policies run the risk of creating highly unequal public sectors. Even a cleavage-neutral policy, such as merit-based recruitment or one based on republican civic values, may produce unequal outcomes because of the unequal starting points of groups. Our study suggests that relative balance has been achieved in countries that are highly fragmented or those with ethnicity-sensitive policies that are oriented towards high levels of proportionality. Some countries have achieved less disproportionality in some institutions because of redistributive policies that focus on those institutions. Most of our cases display varying levels of inequality and weakly structured or non-existent policies for promoting balance. Third, politicians and citizens face different types of constraints in constituting the public sector. These stem from the dynamic interplay of the structures of ethnicity, group dynamics and inequalities. Institutions, however well crafted, may have different levels of significance in different social settings. Ethnic structures with two or three key groups often require ethnically sensitive institutions that provide incentives to cooperate and avoid conflicts. Ethnicity-sensitive institutions may not be relevant in situations where there is one overwhelmingly large group or where the ethnic structure is highly fragmented. In this regard, the paper challenges two policy frameworks that have been held up as solutions to the governance problems of ethnically divided societies. These are majoritarian policies that reward moderation in party behaviour and vote pooling while also encouraging adversarial politics; and consensus-based or power sharing arrangements that seek to accommodate the ethnic segments. The first seeks to promote plurality within the party system by encouraging actors to seek votes outside their ethnic strongholds (Horowitz, 1990). The second accepts ethnic-based parties as given, and promotes plurality at the governmental level rather than in the party system (Lijphart, 1999). Our study suggests that although the pulls of majoritarian rule and power sharing are very strong, they do not always pull in opposite directions. The majority of ethnically segmented countries, like their more homogenous counterparts, have opted for majoritarian solutions. However, ethnic problems have forced some of them to incorporate power-sharing elements in their majoritarian institutions. The next section of the paper discusses the typology that guides the study. Section three provides a conceptual discussion of public sector institutions as they relate to issues of identities and access. Section four, which is divide into five parts, analyses ethnic cleavages, group dynamics and inequalities in four public sector institutions: cabinet, parliament, civil service and party system. Section five examines institutions for managing diversity and inequality. The institutions range from electoral rules to governance arrangements for power sharing, federalism and decentralisation, and protection of minority rights. Redistributive policies and rules that seek to correct disproportionality are also analysed. An index of ethnic proportionality is developed to guide the discussion on the relative inclusiveness of the different public sectors. 15 countries that formed the core of the UNRISD project on Ethnic Structure, Inequality and Governance of the Public Sector provide the basis for the analysis. These
Overview of Research Findings and Policy Issues
6
countries are Belgium, Bosnia-Herzegovina, Botswana, Ghana, Fiji, India, Kenya, Latvia, Lithuania, Malaysia, Nigeria, Papua New Guinea, Switzerland, Tanzania and Trinidad and Tobago. A typology of ethnic structures Although most countries in the world are multiethnic, Africa, Asia and the Pacific are the most ethnically segmented regions. An index of ethnic fractionalisation developed by Soviet ethnologists in 1964 and revised by Taylor and Hudson (1972) shows that Africa is not only the most ethnically diverse region, it also accounts for most of the fragmented countries in the world. Using raw data entries for countries in Grime’s Ethnologue (1998), we have calculated that the average number of ethnic groups per state in Africa, Asia and the Pacific regions, with language as a key indicator, is about 50. The average for European states is about 9.5 and for Latin America and the Caribbean 21. In some African states, such as Nigeria, Cameroon, Democratic Republic of Congo, Tanzania and Chad, ethnic groups number between 127 and 470. In the Pacific region, Papua New Guinea and Vanuatu have respectively 817 and 109 ethno-linguistic groups. There are also very large numbers of ethnic groups in some Asian states: India (407), Indonesia (712), China (201) and the Philippines (168).
The structure of ethnic group distribution illustrates an interesting pattern. In Sub-Saharan Africa, if the small island states are excluded, it is only in 12 of 34 states that a single ethnic group accounts for more than 50% of the population. In Asia, despite its very large number of ethnic groups – more than 2,700 – 34 of 46 states have ethnic groups with more than 50% of the population. This is also the case for the Pacific region, where 19 of 26 states have ethnic groups that constitute the majority population where they are located. In Latin America and the Caribbean, it is only in six countries that a single ethnic group does not account for at least 50% of the population. And all states in Europe (except the new republic of Bosnia-Herzegovina) have ethnic groups that constitute the majority group. The relative ethnic homogeneity in Europe can be explained by the nation-state projects of the 18th and 19th centuries that defined states in ethnically homogenous terms. The Soviet index of ethnic fractionalisation has been very influential in many recent studies in economics and political science to explain civil wars, democratisation and the development problems of plural societies. The index calculates the probability that two randomly chosen individuals will not belong to the same ethnic group. The index of a country is obtained by subtracting the sum of the squares of the relative population shares of each group from the figure one. The more groups a country has the higher the index; and the more equally distributed the groups the higher also the index. As a continuous measure, the index is not sensitive to ethnic structures. It thus imposes serious constraints on efforts to understand the links between ethnic diversity and behavioural outcomes. In Table 1, for instance, contrary to what analysts who have used this index would predict, Country F with a high fractionalisation index may be more disposed towards consensual outcomes than Countries A, B and C with low fractionalisation indexes. An example of Country F will be Tanzania and examples of Countries A, B and C, will be Rwanda, Burundi and Fiji. A single ethnic group will find it difficult to dominate the public sector in F where groups are many and relatively small in size,
Overview of Research Findings and Policy Issues

7
compared to A, B and C where there are only two groups. Furthermore, even though the indexes for Countries B (0.32) and E (0.35) are similar, they are structurally different countries. Country B has only two groups, whereas Country E has 21. Indeed, the dominant group in E may fragment into many tendencies, allowing for inter-group cooperation. Finally, despite the high levels of fractionalisation in Countries F and G, the dynamics of ethnic behaviour may be different in both countries. The relatively equal groups with a larger share of the population in Country G may be tempted to construct selective coalitions. The urge for selective ethnic coalitions may be weaker in Country F. The fractionalisation index, in other words, is not sensitive to ethnic structure or the way groups are configured in society.
Table 1 Ethnic Structures and the Fractionalisation Index
Country No. of Ethnic Population Fractionalisation Groups Shares Index A 2 90; 10 0.18 B 2 80; 20 0.32 C 2 50; 50 0.50 D 3 33; 33; 33 0.67 E 21 1 group = 80% 20 equal groups = 20% 0.35 F 100 1% each 0.99 G 104 4 equal groups = 60% 100 equal groups = 40% 0.90 Problems with the index have led researchers working with Large-N cross-country data sets to introduce other dimensions of fractionalisation. Estaban and Ray (1994) have developed an index of polarisation. This increases in countries with few large and internally homogenous groups and reduces in countries with small groups, which is a mirror image of the fractionalisation index. Collier and Hoeffler (2001a) use an index of ethnic dominance in addition to the fractionalisation index in their study on the economics of civil wars. The index of ethnic dominance differentiates societies that are highly fractionalised from those with a majority group (45-90% of the population). They conclude that plural societies with majority groups “have about double the risk of conflict of other societies”. Ted Gurr’s Minorities at Risk project develops codes on ethnic concentration to analyse different types of ethnic groups and potential for risk or conflict. Mozaffar, Scarritt and Galaich (2003) use Gurr’s codes on ethnic concentration to develop an index of ethnopolitical group concentration to study voter behaviour and party formation in ethnically diverse Africa. The index of a country is the sum of the concentration indexes for each group; and the index for each
Overview of Research Findings and Policy Issues
8
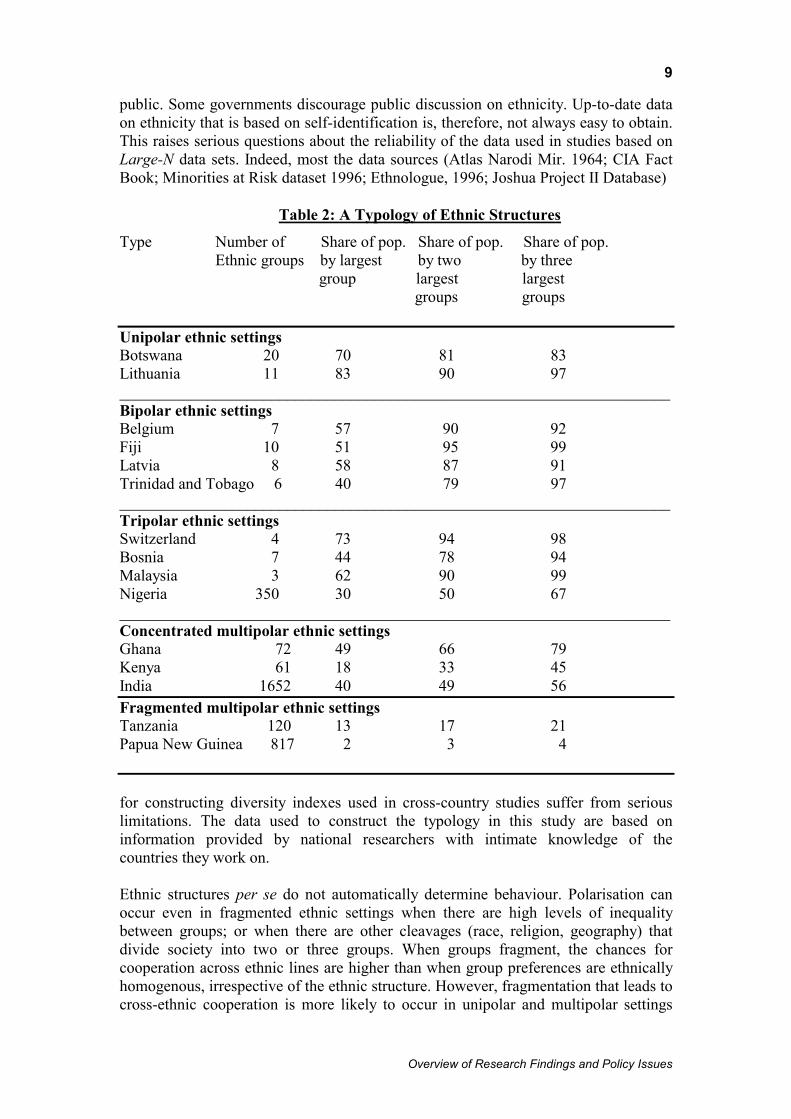
group is obtained by multiplying its concentration code by its share of what the authors define as the ethnopolitically relevant population in the country. Mozaffar et al further attempt to refine the ethnic fractionalisation index by focusing only on “ethnopolitical” groups – i.e. groups that have been mobilised for political competition. They develop an ethnopolitical fractionalisation index by using a scheme that aggregates ethnic groups at three levels of significance: groups that have national significance, those with middle level significance, and those with low-level significance. And Fearon (2002) introduces the notion of cultural distance between ethnic groups to construct an index of cultural fractionalisation. The index of ethnic dominance faces similar problems as the ethnic fractionalisation index: it does not distinguish between different types of ethnic structures. For instance, the index will predict that in Table 1, Country E with a majority group will have more problems than Country D where there is no majority group. This is counter-intuitive; the opposite conclusion seems more realistic. The concentration index is useful, although it is marred by the narrow focus on “ethnopolitical” groups and the fact that individuals may behave ethnically in their political choices even when they are geographically dispersed. It also ignores the way different types of ethnic structures may influence individual and group behaviour. The ethnopolitical fractionalisation index and the cultural fractionalisation index are problematic. Democratisation tends to politicise all groups even when they do not provide an organisational framework to aggregate group choices. The view that some groups are not ethnopolitical groups is therefore questionable. And there is a lot of subjective judgement in constructing the cultural fractionalisation index. The typology adopted in this study distinguishes countries according to their levels of ethnic polarization. We do not, however, use the Estaban and Ray index of polarisation, nor do we construct one. We distinguish instead five types of ethnic structures: first, those in which one ethnicity is overwhelmingly dominant (referred to as unipolar); second, those in which there are only two groups, or two roughly equal groups predominate in a multiethnic setting (bipolar); and third, those in which there are only three groups, or three large groups in a multiethnic setting (tripolar). The fourth and fifth types deal with cases in which the ethnic structure is fragmented: cases of fragmented multipolarity, or high levels of fragmentation; and cases of concentrated multipolarity, in which fragmentation offers a few large groups the potential to organize selective coalitions to influence access to the public sector. Table 2 provides an illustration of this typology based on the 15 countries that constitute the core of this study. We need to point out that ethnic identities are not always easy to pin down, since they are for the most part constructed. Objective attributes, such as language, religion, culture or shared history can be fuzzy and may not always correctly describe a person's ethnicity. Subjectivity or self-identification is important. Furthermore, ethnicity competes or overlaps with many other forms of identity. It is also subject to change. Despite the fuzziness of ethnicity, individuals do not easily change their ethnicity at will. Ethnic identities may not only persist over a long time frame; they tend in many cases to have a pattern; thus our use of the term structure. These structures, again, are not static or cast in stone; they undergo change over the long run. Many countries do not include ethnicity as a variable in their census data. And some, which collect data on ethnicity, do not always release the information to the
Overview of Research Findings and Policy Issues
9
public. Some governments discourage public discussion on ethnicity. Up-to-date data on ethnicity that is based on self-identification is, therefore, not always easy to obtain. This raises serious questions about the reliability of the data used in studies based on Large-N data sets. Indeed, most the data sources (Atlas Narodi Mir. 1964; CIA Fact Book; Minorities at Risk dataset 1996; Ethnologue, 1996; Joshua Project II Database)
Table 2: A Typology of Ethnic Structures
Type Number of Share of pop. Share of pop. Share of pop. Ethnic groups by largest by two by three group largest largest
groups groups
Unipolar ethnic settings Botswana 20 70 81 83 Lithuania 11 83 90 97 _____________________________________________________________________ Bipolar ethnic settings Belgium 7 57 90 92 Fiji 10 51 95 99 Latvia 8 58 87 91 Trinidad and Tobago 6 40 79 97 _____________________________________________________________________ Tripolar ethnic settings Switzerland 4 73 94 98 Bosnia 7 44 78 94 Malaysia 3 62 90 99 Nigeria 350 30 50 67 _____________________________________________________________________ Concentrated multipolar ethnic settings Ghana 72 49 66 79 Kenya 61 18 33 45 India 1652 40 49 56 Fragmented multipolar ethnic settings Tanzania 120 13 17 21 Papua New Guinea 817 2 3 4 for constructing diversity indexes used in cross-country studies suffer from serious limitations. The data used to construct the typology in this study are based on information provided by national researchers with intimate knowledge of the countries they work on. Ethnic structures per se do not automatically determine behaviour. Polarisation can occur even in fragmented ethnic settings when there are high levels of inequality between groups; or when there are other cleavages (race, religion, geography) that divide society into two or three groups. When groups fragment, the chances for cooperation across ethnic lines are higher than when group preferences are ethnically homogenous, irrespective of the ethnic structure. However, fragmentation that leads to cross-ethnic cooperation is more likely to occur in unipolar and multipolar settings
Overview of Research Findings and Policy Issues
10
than in bipolar and tripolar ones. The latter often require ethnically sensitive institutions that provide incentives to cooperate and avoid conflicts. Ethnically sensitive institutions may not be relevant in unipolar and fragmented multipolar settings. However, redistributive or ethnically sensitive policies are important in all multiethnic societies regardless of the ethnic structure. Understanding the nature and degree of fragmentation is important if we are to explain patterns of inclusion, cooperation and balance in public sector institutions. Behaviour is defined as fragmented when putative members of an ethnic group divide their preferences among competing parties of the same ethnic group, or support the preferences of members of other groups. Behaviour is polarised when the preferences of putative members of an ethnic group are homogenous, and when those preferences are in conflict with those of members of other groups. What causes fragmentation becomes a legitimate issue of enquiry. The study suggests that a group may fragment when non-ethnic issues assume importance in the preferences of members of an ethnic group; or when cultural variations within a group become a basis for expressing choice. Fragmentation may also occur when groups feel less threatened by others in constituting public institutions, or when groups do not have to compete with each other (separate rolls or guaranteed seats) for elective offices. The study highlights several patterns of fragmentation. A group may fragment without losing the preferences of its putative members to other groups. In other words, members may support different parties from the same ethnic group (Bosnia and Herzegovina, Belgium, Fiji, Latvia, Lithuania). A group may also fragment when preferences are divided between different multiethnic parties (Botswana, Switzerland, India, Papua New Guinea, Ghana). Another type of fragmentation may involve undivided support by members of an ethnic group for a party that enjoys cross-ethnic or national support in a multiethnic setting (Tanzania). The logic here is that even though the preferences of the ethnic group are not fragmented, the party that enjoys its support becomes an institution of fragmented cleavages, encompassing multiple ethnicities. Most Large-N studies seek to find correlations between ethnic diversity and one outcome: economic growth, war, or democracy. These often rely on proxy, rather than direct, indicators. They seek to find event regularities that are based on probability. The study by Easterly and Levine (1997) concludes that ethnic diversity is responsible for Africa’s poor growth rates. Collier and Hoeffler (2001a) observe that ethnic fractionalisation and other variables related to grievance are weakly correlated with the incidence of war, and that rebel greed -- the opportunities for war or the availability of finance (primary commodities) and supply of young males – is a better predictor of war. Collier and Hoeffler (2001b) conclude in another paper that Africa’s diverse ethnic structure generates “atypically low risk” factors for war. They argue that rebel groups face a serious collective action problem in highly fractionalised societies, as they will need to mobilise and sustain a large number of ethnic groups for their rebellion to be successful. Elbadawi and Sambanis (2001) also find that high levels of fragmentation reduce the risk of conflict. Fearon and Laitin (2003), echo these views in finding a weak link between ethnic diversity, grievance and conflict. They identify conditions for insurgency, such as state weakness, rough terrain, rebel knowledge of local situations and large population as the key determinants of war. Mozaffar, Scarritt and Galaich (2003) find a positive correlation between ethnic
Overview of Research Findings and Policy Issues
11
diversity and prospects for democracy in Africa in their study on party systems, political behaviour and ethnic cleavages in Africa. In this study, we do not seek to link ethnic structure to a single conflict outcome. Our main concern is the way different types of ethnic diversity facilitate or constrain opportunities for inter-group cooperation, accommodation or cohesion in the constitution and management of the public sector. War is just one outcome in social settings where groups do not feel sufficiently included in the composition and management of the public sector. Even when groups do not resort to violence, perceptions of exclusion or discrimination may weaken the legitimacy of the public sector among sections of society. A culture of xenophobia may develop in which the public arena may be polarised and the composition of the public sector may reflect the ethnic backgrounds of those who happen to be the leaders at any given time. There are also serious well being effects of ethnic inequalities, especially for groups that feel persistently discriminated against (Stewart, 2000; Loury, 2002; Akerlof and Kranton, 2000). Other outcomes are occasional riots, communal violence, constitutional crises, military coups and unstable governments. Our case studies will highlight some of these different outcomes. Public sector institutions: identities and access Identities, values and interests are central to the construction of modern states. They structure opportunities and influence the way individuals from different groups gain access to public institutions. Some states are constructed on the basis of the values and interests of one ethnicity. This is the so-called nation-state project in which those who share common blood ties, history and culture enjoy primary claims on the state. Such nation-states often bear the identities and names of the dominant ethnicity. They may evolve into civic-based states, granting rights to minorities and stressing the importance of equality before the law for all groups. The issue of indigeneity may affect access to public institutions especially in newly independent countries or countries where migration has radically altered the demographic composition of the country. The cases of Latvia, Lithuania, Fiji and Malaysia will illustrate this problem. A second type of public sector is founded on civic republican values, which are blind to ethnicity. It appeals to notions of a community with shared political territory, institutions and history – but not culture— and stresses the principle of equality before the law for all individuals regardless of group membership. France is often seen as a model of this type of public sector. The cosmopolitan values of the French Revolution granted equal legal and political rights to both foreign residents and native-born inhabitants. Civic republicanism is, however, assimilationist, and is tempered by the supremacy of “French culture” over other cultures. Minorities with poor resource endowments may be disadvantaged in such a system. A third model is the nation-building project of multiethnic societies, especially those in early independent Africa, in which ethnicity was discouraged as an organising principle of statecraft. Use of foreign languages and modern secular values implanted by the colonial authorities underpinned the identities of the public sector. A good example is Tanzania, which discouraged references to ethnicity in public discourses and developed a national language, Swahili, in addition to English, to support its egalitarian economic and social policies. In many other countries, the state did not live
Overview of Research Findings and Policy Issues
12
up to its secular, non-discriminatory ideals, as ethnicity became a powerful factor in constituting key public sector institutions. The multiethnic state is the fourth type. Under this model the public sector does not only recognize the multiethnic character of its society. It also develops rules and policies to create a multiethnic public sector. It is the antithesis of the nation-state model. Examples are Switzerland, Belgium, Bosnia-Herzegovina and, to some extent, Nigeria and India. The multiethnic state should be distinguished from multiculturalism, which acknowledges the ethnic origins of all groups in society and, if they do not conflict with the principle of equality, supports the public display of such differences. The multiethnic state seeks to create ethnic balance in the constitution and management of the public sector. These four cases are ideal types. In practice, public sectors around the world are likely to have combinations of the characteristics and values of each type. The core public institutions we will analyse are the civil service, the cabinet and parliament. The civil service executes the policies of the cabinet. It is often a career-based politically neutral body, although the top positions in some countries may depend on the decisions of incumbent governments. The public service includes the central and local public administrations, the security sectors, and parastatals. Our study will focus largely on the central public service. Access to the bureaucracy is largely determined by non-electoral factors. These may include ethnicity-based citizenship laws as in Latvia; colonial policies that favoured one group at the expense of others, as in many African countries and Trinidad; rules of indigeneity that give preferences to “sons of the soil”, as in Fiji and Malaysia; merit-based rules that produce unequal outcomes; patronage regimes that distort the recruitment process; and cleavage-sensitive policies that seek to correct historical disadvantages or ensure balance, as in Bosnia-Herzegovina, Belgium, Switzerland, India and Nigeria. Electoral rules, district magnitude, extent of ethnic fragmentation and party systems are important in explaining the constitution of cabinets and parliaments. If electoral districts are ethnically homogenous in multiethnic societies, the nature of the electoral rules and party systems may not be important to determine whether or not individuals of different ethnic backgrounds have sufficient access to parliaments. First-past-the-post and proportional representation electoral rules may produce similar outcomes since individuals of the same ethnicity will be elected in the districts. The final makeup of the parliament will depend on the numerical size of the groups and whether the electoral districts are of equal size. In such situations, first-past-the-post rules may distort the vote-seat ratios of the parties, but not the ethnic distribution of parliaments. However, if the electoral districts are multiethnic and parties are ethnic, first-past-the-post rules may create unequal ethnic outcomes. If there are many parties as there are ethnic groups, a party may win an electoral district with only its core ethnic votes. This could be as low as 10% of the electorate. A PR system under these conditions may produce more ethnically proportional outcomes. A preference vote (alternative vote) system that aggregates ranked votes may encourage vote pooling and moderation but may not necessarily produce ethnically proportional outcomes. Multiethnic parties, on the other hand, may help to correct these distortions. Access to the cabinet depends on whether the system of government is parliamentary or presidential. In parliamentary systems, in which the executive and legislative
Overview of Research Findings and Policy Issues
13
branches of government are fused, access to the cabinet is limited to parliamentarians. If a parliament is already skewed in favour of a particular group or groups, this may be reflected in the cabinet. More importantly, if parliamentary parties are ethnically differentiated, or if one ethnic group votes overwhelmingly for a party that is not in the government, the outcome will be unbalanced. Coalition governments may allow for a wider representation of groups in government even if parties are ethnic. On the other hand, a presidential system, in which the president has a popular mandate, may allow for a selection of individuals who are not members of parliament into the cabinet. A ruling party may perform poorly among a particular ethnic group and yet appoint individuals from that group into the cabinet to ensure balance. Many African countries follow this approach. However, if a president is not disposed towards accommodation, ethnic groups that support opposition parties may be totally excluded from government because of the majoritarian, winner-takes-all, character of presidential systems of government. By using the word access we seek to avoid the contested concept of representation, especially when it is applied to group relations. Even when the unit of analysis is the individual voter and the elected official, representation is full of ambiguities. The interests of representatives and voters are often not in harmony; and even a voter-sensitive representative will find it difficult to aggregate the preferences of voters who often may not agree on all issues of public policy. All choices by public officials discriminate against some interests (Przeworski, Stokes and Manning, 1999; Stokes, 2001; Young 2000). Those who study group identities and inequalities have introduced the concept of “symbolic” or “descriptive representation” (Dovi 2002), or what Phillips (1995, 1998) calls the “politics of presence”. They defend preferential policies to improve the “representation” of historically disadvantaged groups in public institutions because of the peculiar lack of trust between existing representatives and these groups. They argue that such types of representation are required on grounds of justice, which will further help to incorporate interests that have been ignored by existing representatives as well as improve the legitimacy of public institutions and democracy. However, the concept of symbolic or descriptive representation does not solve the problem of representation. The interests of descriptive representatives and their putative groups do not always converge on all issues. One danger of descriptive representation, especially when applied to ethnic identities that are often fluid, is that it may create a segmented, rather than unified, public sector if representatives perceive their roles narrowly as defenders only of the public interests of their putative ethnic groups. By using the neutral word “access”, we leave open the possibility that the public sector cannot only be made sensitive to cleavages, but that over time, public officials will undergo sufficient transformation to be able to “represent” all individuals irrespective of ethnic origins. Ethnic structure, group dynamics and inequalities In this section we compare the structure of ethnic cleavages, socio-economic inequalities, dynamics that inform the constitution of the public sector, and inequalities or ethnic balance in the public sectors of our typology. The analysis in
Overview of Research Findings and Policy Issues

14
each section is prefaced by a set of hypotheses on ethnic structure and likely behavioural outcomes. Unipolarity: Lithuania and Botswana In unipolar settings we hypothesise that the dominant ethnic group may feel less threatened by minorities, encouraging fragmentation of group preferences and cross-ethnic co-operation or cohesion. Even when minorities decide to organise separately, the fragmentation of the dominant ethnicity may improve the influence of minorities in the public sphere and allow them to collaborate with parties of the dominant ethnicity in forming governments. If minorities are well integrated in the public sector, they may also feel less threatened by the numerical superiority of the dominant group, leading also to a fragmentation of their own preferences. Cleavages and socio-economic inequalities The Lithuanian ethnicity constitutes 83% of the population in Lithuania, and the Tswana in Botswana 70%. The second and third largest groups in Lithuania (Poles and Russians) are only seven per cent each, and the remaining eight groups account for only three per cent. The second largest group in Botswana (the Kalanga) is 11 per cent and the third largest is three per cent; the rest are very small groups. Even though these are unipolar societies, there are differences between them in terms of the way ethnic groups are perceived in the construction of the state system. Indigeneity, which is a strong element in Lithuania, is absent in Botswana. The ethnic structure of Lithuania has experienced changes over time, although Lithuanians have always been the dominant ethnicity. During the period of Polish rule (1920-1939), the Polish population increased dramatically, especially in the capital, Vilnius, where they became the majority group. The Jewish population (7.6%), which was the largest minority group in the 1920s, shrank during the Second World War to less than 1%. During Soviet rule (1940-1991), the Lithuanian population was reduced from 84% to about 80% and the Russian population expanded dramatically, becoming the largest minority (8.5%) by 1959. A considerable process of Russification in culture, the economy, administration and politics occurred during the era of Soviet rule, although not to the same degree as in Latvia and Estonia. Ethnic Lithuanians dominated the communist party whereas there was almost parity between Russians and the host nations in Latvia and Estonia. Russians were, however, highly “over-represented”4 in industry and to a large extent in government institutions before independence in 1991. The restoration of Lithuanian independence in 1991 witnessed a wave of Russian return migration, with Poles once again becoming the largest minority by 2001. Eastern Lithuania is very multiethnic: only half of it is ethnically Lithuanian and one third is Polish; it contains one tenth of the Russian population and one fifth of the Belorussians. Poles are the majority group in the regions of Salcininkai and Vilnius; and Lithuanians are a minority in another region – Svencionys – and the town of Visaginas, both of which have a Russian majority. Even though a few non-Lithuanian
4 Use of representation here and in subsequent sections is in the statistical sense; it does not imply that the individuals “represent” their groups in the strict sense in which we have discussed representation.
Overview of Research Findings and Policy Issues
15
groups are indigenous to the territory, all the large minorities are perceived as non-indigenous, having been associated with external conquest. The Lithuanian ethnic group thus claims primary status in the state. In Botswana, on the other hand, no ethnic group has primary claims to the state. The groups tend to overlap in terms of geographical location, thus giving rise to bi- and multi-lingual tendencies in the affected areas. The multicultural North West District, for instance, represents a convergence of several Bantu and Khosan language groups -- the two main language classifications. The largest district in terms of population and size, Central District, is also a mosaic of cultural diversity with several Khosan and Bantu languages converging. Other districts have at least two Bantu languages and two Khosan languages. The South East and Kgatleng Districts have the least diversity. A social hierarchy of language groups developed over time, investing social prestige on the users of the top languages. Generally, Khosan languages occupy the lowest stratum in the hierarchy; the western, eastern and central Bantu languages are less valued than the southern Bantu languages; and within the southern Bantu group Sekgalagadi, Se-birwa, and Setswapong occupy a lower status than Setswana, even though all are part of the dominant Sotho-Tswana family group. Despite these differences, our research suggests that there is less ethnic polarisation in the two countries. In Lithuania, 37.8% of Russians (one of the two large minorities) speak Lithuanian fluently or treat it as their mother tongue (a much higher figure than what obtains in other Baltic states) and there is a high level of social interaction among groups. Survey research suggests that the majority of non-Lithuanians mix well with Lithuanians; nearly one third have Lithuanian relatives and one third have Lithuanians as personal friends. In large business and professional settings open and multiethnic relations are observed. However, monoethnic work settings are common in small enterprises. The data suggest that there are no statistically significant inter-group income differences. Educational attainment levels are also fairly similar, although some minorities (Jews, Ukrainians, Russians and Germans) perform better than Lithuanians. The least advantaged are the Roma. Although, minority languages are supported, the national dominance of Lithuanian has produced a high level of Lithuanisation, especially at the tertiary level where 99% of the students study in Lithuanian. A 1994 study suggests that educational attainment, not ethnicity, is the key determinant of employment. However, data for 2002 indicate that minorities have a higher unemployment rate than Lithuanians (18.5%: 12.8%). The structure of employment is not very different among the main ethnic groups. In general, the Lithuanian ethnic group feels less threatened by the presence of Russian and other minorities. Not surprisingly, at independence, the Lithuanian ethnic group avoided the initial citizenship laws in Latvia and Estonia that discriminated against Soviet-era immigrants. Most minorities are citizens. In Botswana, the internal fragmentation of the dominant Tswana group into five relatively equal groups has provided opportunities for active minority participation in the public sector. At least eight groups make up the Tswana ethnic group, the largest being the Ngwato (31%), Kwena (13%), Nkwagetse (10%), Tawana (8%) and Kgatla (4%). This fragmentation is a product of precolonial state formation in which identities were based on the name of the founder leader of the polity. There was no unifying Tswana identity, which is largely a product of the modern state project. A multiethnic pact at independence granted the Tswana language official status (along
Overview of Research Findings and Policy Issues
16
with English). Today about 90 percent of the population identify Tswana as their main language. The pact also conferred advantages on the Tswana and other chiefs in the second chamber, the House of Chiefs, at the expense of smaller groups without chiefly traditions. This has recently led to complaints about unequal treatment in the cultural domain. However, these concessions to the Tswana were made in exchange for equal distribution of resources among all groups. High levels of sustained economic growth, facilitated by diamonds, helped to consolidate the pact and depoliticise ethnicity. Diamond revenues were used to promote infrastructural and social development, which, though urban-biased, were extended to rural areas through an accelerated rural development programme. A policy of even distribution of resources across regions drove the programme. With the exception of the small pastoral San groups, the policy of equality has led people to blame non-ethnic factors, such as population size and resource limitations, when development targets are unfulfilled. Group dynamics In both Botswana and Lithuania, the preferences of the dominant ethnicity have fragmented, providing scope for inter-group cooperation. There are however differences between the two countries. In Lithuania, even though some minorities vote for the dominant ethnic parties, they have also organised separately in influencing access to the public sector. This is especially the case with Poles who constitute a majority in a few regions. However, many of the minority parliamentarians tend to be elected on the platform of the Lithuanian-led, left-leaning parties. The fragmentation of the Lithuanian preferences into five parties has allowed for the formation of coalition governments with minority participation. The data suggest that minority voters (especially Russians) are adopting the view that it is better to advance their interests through mainstream parties at the national level (since minority parties stand very little chance of influencing public policy outcomes at that level), and to support minority parties in municipal elections in heavily populated minority areas where these parties stand a better chance of making an impact. The declining seat strength of minority parties in national elections is one indication of this strategy. In Botswana, on the other hand, minorities do not organise separately. Both the opposition and ruling parties reflect similar ethnic structures in their parliamentary representation. For instance, candidates from the four dominant ethnic groups have occupied 69% of the cumulative parliamentary seats of the opposition parties since 1965. The difference between the ruling and opposition parties is that the Ngwato (a Tswana sub-group) rank top in the ruling party, followed by Kalanga and Kwena (a Tswana sub-group), and Ngwaketse (a Tswana sub-group) at the bottom; on the other hand, in the opposition, the Ngwaketse occupy the top position, followed by Kalanga, then Ngwato. The choices of both majority and minority groups have fragmented. Voting patterns, especially after 1994, have assumed instead an urban-rural divide, with the opposition winning most urban votes and the government rural ones. Minorities thus play active roles in parties led by the dominant Tswana ethnicity. The only exception to this non-ethnic trend was in 1969 and 1974 when the three opposition parties appeared to have ethnic bases. However, the ruling party still enjoyed sufficient support even in these ethnic opposition strongholds. By 1984, however, support for the opposition parties had became overwhelmingly national in character. An informal political pact among the top ethnic groups ensures that the
Overview of Research Findings and Policy Issues
17
second largest group, the Kalanga, and some sub-groups of the Tswana (the Ngwaketse, who tend to vote for the opposition) are given special treatment5 if they fail to win enough seats in parliament in order for them to be adequately represented in cabinet. Public sector inequalities One problem in unipolar societies is that the state may tend to assume the features of a nation state, which may disadvantage minorities, and affect the composition of the public sector. This is especially important in Lithuania where issues of indigeneity have affected access to the bureaucracy, parliament and cabinet. As Table 3 shows, even though minorities constitute 17% of the population they account for only 10% of the parliamentarians in 2000. In 1985, before the country attained independence, minorities enjoyed a 21% share; this went down sharply to 7% in the first post-independence parliament of 1992. The situation is worse in governmental bodies, such as the cabinet and upper reaches of the civil service. In the 12 governments formed since independence only two individuals of minority background have served as ministers, and two as heads of civil service ministries. The two ministers served in one government in 1996. Minorities are mostly found in sections dealing with finance and bookkeeping and at the lower end of the bureaucracy. When minorities join coalition governments, they rarely ask for cabinet posts. For instance, the Polish Election Action party seeks mainly to protect regional interests at the municipal level. The Russian parties are marginal: their main interest is participation in parliament, not the cabinet. They also seek to protect Russian business interests. Minorities can also benefit from ambassadorial postings as part of party bargaining. The Lithuania study highlights a process of assimilation of minorities, who are made to feel “invisible” in order to climb the political and administrative ladder. In Botswana, however, it is the dominant Tswana group that is under-represented in key public institutions despite complaints by minorities about the Tswana character of the state. As Table 3 shows, The Tswana group is under-represented in parliament, the cabinet and civil service. Its share of senior civil service posts shows a consistent decline from 60% in 1965 to about 50% in 20036. It’s share of cabinet posts went up from 62% in 1966 to 69% in 1985 but declined to 61% in 2000. A similar trend is observed for the parliament where the Tswana share declined from 65% in 1966 to 61% in 1985 and 2000. The second largest group, the Kalanga (11% of the population), has consistently enjoyed high levels of representation in government for most of the post-independence period. It accounted for the entire minority share of 40% of the civil service posts in 1965 as well as 31% and 24% respectively of the national shares in 1975 and 2003. Its share of parliamentary seats and cabinet posts in 2003 was 17% and 18% respectively. The merit policy that determined recruitment into the civil service advantaged the Kalanga, who had a head start in education over all groups in the country. Small ethnic minorities began to gain access in parliament and government with the expansion of parliamentary seats. It is only the highly marginalized Khosan or San group that does not seem to have gained access in the parliament or cabinet throughout the entire post-independence period. The distribution
5 The president can appoint four individuals to be elected by parliament. 6 20% of the posts are unidentified in terms of ethnicity.
Overview of Research Findings and Policy Issues
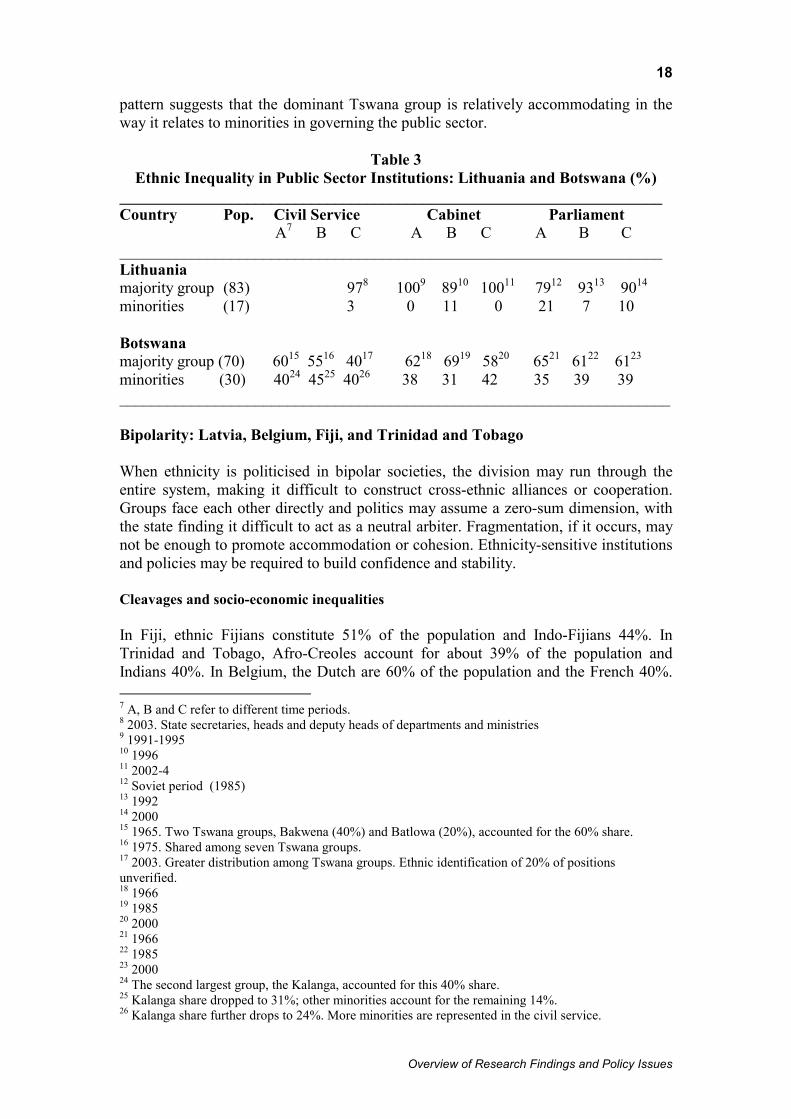
18
pattern suggests that the dominant Tswana group is relatively accommodating in the way it relates to minorities in governing the public sector.
Table 3 Ethnic Inequality in Public Sector Institutions: Lithuania and Botswana (%)
____________________________________________________________________ Country Pop. Civil Service Cabinet Parliament A7 B C A B C A B C ____________________________________________________________________ Lithuania majority group (83) 978 1009 8910 10011 7912 9313 9014 minorities (17) 3 0 11 0 21 7 10 Botswana majority group (70) 6015 5516 4017 6218 6919 5820 6521 6122 6123 minorities (30) 4024 4525 4026 38 31 42 35 39 39 _____________________________________________________________________ Bipolarity: Latvia, Belgium, Fiji, and Trinidad and Tobago When ethnicity is politicised in bipolar societies, the division may run through the entire system, making it difficult to construct cross-ethnic alliances or cooperation. Groups face each other directly and politics may assume a zero-sum dimension, with the state finding it difficult to act as a neutral arbiter. Fragmentation, if it occurs, may not be enough to promote accommodation or cohesion. Ethnicity-sensitive institutions and policies may be required to build confidence and stability. Cleavages and socio-economic inequalities In Fiji, ethnic Fijians constitute 51% of the population and Indo-Fijians 44%. In Trinidad and Tobago, Afro-Creoles account for about 39% of the population and Indians 40%. In Belgium, the Dutch are 60% of the population and the French 40%. 7 A, B and C refer to different time periods. 8 2003. State secretaries, heads and deputy heads of departments and ministries 9 1991-1995 10 1996 11 2002-4 12 Soviet period (1985) 13 1992 14 2000 15 1965. Two Tswana groups, Bakwena (40%) and Batlowa (20%), accounted for the 60% share. 16 1975. Shared among seven Tswana groups. 17 2003. Greater distribution among Tswana groups. Ethnic identification of 20% of positions unverified. 18 1966 19 1985 20 2000 21 1966 22 1985 23 2000 24 The second largest group, the Kalanga, accounted for this 40% share. 25 Kalanga share dropped to 31%; other minorities account for the remaining 14%. 26 Kalanga share further drops to 24%. More minorities are represented in the civil service.
Overview of Research Findings and Policy Issues
19
In Latvia, ethnic Latvians are 58% of the population and Russians 29%. These are bipolar societies. During the 19th and early 20th centuries, Latvia had a unipolar ethnic structure, despite the pressures it faced from its more powerful German and Russian neighbours. The Latvian share of the population increased substantially in 1920 to 76% after the state gained independence from the Russian empire in 1918. The Russian share was only 5.6%, although it increased to 11% in 1930. Other visible minorities – Germans, Jews and Poles -- averaged between 2% and 7% of the population. Because of this unipolarity, it was relatively easy to govern Latvia as a nation-state, following its independence in 1918. The high point of Latvia’s nation-state project occurred during the period of authoritarian rule in the mid-1930s when the liberal concessions granted to minorities in the first democratic government were curtailed. Most industries, which were owned by minorities, were nationalised and a pro-Latvian affirmative action policy was put in place. This helped to narrow the socio-economic gap between Latvians and minorities. This unipolar ethnic structure was transformed into a bipolar one under Soviet rule as many Slavs migrated into Latvia. The Soviet industrialisation strategy depended a lot on migrant labour, especially after the early 1960s, following the repression of national communists. 75% of industrial managers were of Russian and other minority origin. By 1989, the population share of ethnic Latvians had dropped to 52%; and that of the Russian population had risen to about 35% during the same period. The Russian minority became hegemonic in an ethnically bipolar setting. A process of intense Russification took place, which affected the Latvian language and the structure of power and access in the public sector. Only 39% of members of the communist party were Latvian, compared to 71% of Lithuanians in the communist party in Lithuania. In the 1970s and 1980s, only 3 or 4 out of 13 members of the highest decision making organ, the politburo of the communist party, were born in Latvia. Until the mid-1980s, Latvia’s administration remained in the hands of Russian Latvians. Ethnic Latvians accounted for only 28% of the Soviet administrative system. At independence in 1991, the new Latvian leaders sought to convert the state into its pre-war unipolar status through citizenship laws that required Soviet-era residents to apply for citizenship and pass Latvian language tests. By 2003, Latvians were 75% of the citizens and Russians 17.9%. Even though Latvia is moving in a unipolar direction as far as governance of its public sector is concerned, the ethnic structure itself is still bipolar. Russian is still more widely spoken than Latvian, despite the status of Latvian as the state language, and minorities constitute about 42% of the population –the majority of whom identify Russian as their native language. The other three countries in this category have not tried to convert their states into nation states, even though the issue of indigeneity that defines rights in Latvia is present in Fiji, and to some extent Trinidad and Tobago. In Trinidad and Fiji, the issue of language is not very important as English is the state language. In Belgium, given the equal status and claims of the two groups, the two languages, French and Dutch, are granted equal rights after a long struggle by Dutch speakers. Indo-Fijians in Fiji were descended from Indian indentured labourers recruited by the British to work in the sugar cane industries between 1879 and 1916. Their population
Overview of Research Findings and Policy Issues
20
grew rapidly in the 20th century. They obtained parity with ethnic Fijians around 1945. Between 1950 and 1987 Indo-Fijians were more numerous than the indigenous Fijians. The latter regained their numerical superiority after the military coup of 1987 that brought to power an overtly anti-Indian government. Many Indians migrated from the island after the coup. Even though both groups were largely rural for much of the colonial and early independence periods, by 1996, 41% of Fijians and 49% of Indians lived in the towns. However, Indians owned more property in the towns than Fijians. Employment of ethnic Fijians in the sugar plantations was restricted. They were largely confined to their villages, producing other types of crops, and governed by a separate Fijian administration. 84% of the land is governed by customary tenure, meaning that Indians who are non-indigenous, cannot own land. However, many of the fertile lands are leased to Indian sugar cane farmers. In 1990-91, Indian household incomes were 25% higher than average Fijian incomes, while average per capita incomes were 31% higher. However, inequalities within both groups are far greater than inequalities between the groups. Indo-Fijian incomes were far more inequitably distributed than Fijian incomes. The major divides in socio-economic terms are between poorer ethnic Fijian villagers and wealthier Fijian and Indian town residents, and between Fijian villagers and both their rural and urban Indo-Fijian counterparts. Indians vastly outnumber Fijians in the professions and private enterprises. Uneven levels of urbanisation and the early entry of Indians into the formal labour market account for these inequalities. A different type of indigeneity affects ethnic relations in Trinidad, which, like Fiji, has an ethnic division of labour and ethnic-based parties. The two main groups, Afro-Creoles and Indians, arrived in the country at different times. Afro-Creoles arrived as slaves and liberated Africans in the 18th and first half of the 19th centuries; and Indians arrived as indentured labourers largely in the second half of the 19th century and early 20th century to work the sugar plantations abandoned by Afro-Creoles after the abolition of slavery. Afro-Creoles have used the fact of early arrival to justify their dominance of the public sector. Unlike our other three cases, there is a sizeable third group, a mixed group population (18%), which holds the balance in Trinidad, although it has worked more closely with the Afro-Creoles than the Indians in the formation of government. Trinidad is a mineral-based economy, with oil and gas accounting for 52% of export earnings and 32% of government revenues. An ethnic division of labour tends to pervade the labour market, with Afro-Creoles found mainly in the bureaucracy, professions and oil industries, and Indians in the sugar sector and business. While Creole is the lingua franca, about half of the Indians and most Afro-Creoles are Christians, and there is a high level of fluidity, freedom and inter-group interaction in the public arena. Ethnic self-selectivity tends to inform settlement patterns. In Belgium, the two dominant groups are indigenous. However, the Dutch majority was disadvantaged in the nineteenth and early twentieth centuries when French was the official language of communication. With a small majority of the population speaking only Dutch, language gradually became a major political issue. Despite the fact that this conflict never became violent, it has been at the centre of many fierce debates and governmental instability. The country is divided into four linguistic territories: the Dutch-speaking or Flemish region; the francophone region of Wallonia, which has a small German-speaking population in the east (recognised as a German-
Overview of Research Findings and Policy Issues
21
speaking territory); and Brussels, which was originally Flemish, but is now predominantly French and administered as a bilingual region. The French and Dutch speakers have contrasting visions of the state. The French support mainly a three-region division with Brussels as one of the three regions. The Dutch or Flemish on the other hand defend the idea of a bipolar federation, based on the two main language groups, and perceive Brussels as part of Flanders or Dutch territory. The two main regions, Flanders and Wallonia, have developed differently in socio-economic terms. Even though parts of Wallonia were among the first to industrialise in Europe, and for much of the 19th century Flemish provinces were largely rural, by the end of the 19th century Wallonia gradually began to lose its industrial dominance. By 1930 Antwerp, Brussels and Clabecq became the industrial, financial and growth poles of the country. By the 1960s, Flanders equalled Wallonia’s economic development. Today Flanders is the richer and more dynamic of the two regions. Significantly, the catholic values of the new Flemish entrepreneurial class are different from the more liberal Francophone financial class that had dominated the social and economic landscape. Group dynamics Because of the creation of unipolarity in Latvia’s public sphere, Latvians do not feel threatened by Russians and other minorities in determining access to the public sector. As in Lithuania, the preferences of ethnic Latvians have fragmented into multiple parties. There have been on average 21 pre-election parties and nine parties in the four parliaments that have been formed since independence in 1991. Many parties do not survive more than one parliament. However, the party system remains largely ethnic: there are no minorities in the leading ethnic Latvian parties. The preferences of minorities, especially Russians, are also fragmented into three parties, which coalesced into a single formation (PCTVL: Party for Human Rights in United Latvia) until 2003 when it splintered again into various parties. 15 out of 16 deputies in the PCTVL party faction are minorities. About 90% of minority MPs come from the PCTVL, suggesting limited inter-group cooperation. And about 90% of the votes of the PCTVL come from minorities. Apart from the ethnic Latvian dominated Union of Social Democrats (which has attracted about 35% of minority votes), most ethnic Latvian parties have relied overwhelmingly on ethnic Latvian votes to get into parliament. Thus the fragmentation of the two largest groups (ethnic Latvians and Russians) has not led to inter-group cooperation. However, about 25% of the voters of the Latvian-led, left-leaning Union of Social Democrats (USD) are Russian. Ethnic Latvians and minorities are divided on issues of language rights, education policies, citizenship and a number of other issues even though differences have not produced violence. The extent to which a unipolar public sector can be successfully foisted on a bipolar ethnic structure remains an open question. Some may argue that the privileged role given to Latvian, the new educational policies, inter-marriage, and choices of young people from minority groups seeking opportunities in the public sector, may eventually consolidate the unipolar nation state project. But this needs to be tested over a longer time frame, implying that other possibilities should not be foreclosed. The question is whether a Latvianised Russian can be de-Russianised in an environment where Russian is widely spoken and the mother country –Russia -- is a neighbour.
Overview of Research Findings and Policy Issues

22
In Fiji, land and competition for access to public sector institutions constitute the most ethnically polarised issues in the country. Indigenous Fijians perceive themselves as owners of the land and therefore entitled to special rights over Indians who are seen as immigrants. Even though the two groups are roughly equal in size, ethnic Fijians do not accept political equality with Indians. There are no restrictive citizenship rules as in Latvia, but ethnic Fijians believe they should always play a dominant role in public affairs. The renewal of Indian leases is always a controversial affair, as many farmers may have their leases cancelled and forced to vacate their farms. The bifurcated ethnic structure has influenced group dynamics for access to the public sector. The colonial power, Britain, bequeathed Fiji an electoral system of separate rolls with equal number of seats for each ethnic group. In 1965, this system was modified. In addition to the separate rolls, cross-voting or national constituencies were introduced in which the ethnicity of the candidate was specified but voters in all communities voted for the same candidates. Each voter in effect had four votes: one for the reserved seats; and one each for the “Indian”, “Fijian” and “General” candidates in the common or cross-voting constituencies. The latter was meant to encourage cross-ethnic strategies by parties and voters. This mixed system was buttressed by the first-past-the-post parliamentary system of government. The system of guaranteed seats for ethnic groups encouraged a fragmentation of the preferences of members of both groups, although the Fijian group experienced more fragmentation than the Indian one. The two groups did not have to compete against each other to be represented in parliament. By 1999, there were two Indian parties as opposed to at least five major Fijian parties. However, Fijian parties could not win Indian reserved seats, and vice versa. The only inter-group contests were in the cross-voting constituencies. Even in this case, Indian parties won the majority of the seats where Indian voters are in the majority and most of the Fijian electorate seats went to the Fijian Alliance party. In equi-bipolar states such as Fiji, electoral outcomes are decided in a small number of constituencies where the two groups are virtually equal. Minor variations in turnout, split voting or preference ordering could determine the winner. Maintaining the undivided support of one’s own ethnic group, ethnic outbidding and the fermentation of divisions among parties associated with the opposite ethnic group become the dominant modes of politics. This explains the instability that has been associated with politics in Fiji. A new constitution in 1997 changed the anti-Indian discriminatory rules of the post-coup 1990 constitution. The balance between Indian and Fijian reserved seats was brought closer to their respective proportions in the population and the ethnic qualification for the position of Prime Minister was removed. Open constituencies were introduced for the first time, although the system remained largely communal: 46 of the 71 seats were allocated to separate ethnic groups. A new system of power sharing and electoral reform was introduced. Parties that secure at least 10% of parliamentary seats are guaranteed a proportional number of cabinet posts. However, parties rather than voters were empowered to determine the second and lower order preferences of voters. The two Fijian and Indian parties that ushered in the constitutional changes were defeated by an alliance of Indian and Fijian parties that were neither moderate nor multiethnic. The Indian party decided to form a government with an Indian Prime Minister – challenging long-standing Fijian beliefs that the leaders of the country
Overview of Research Findings and Policy Issues
23
should be Fijian. The government was overthrown by a small group of armed indigenous Fijians in 2000. Elections in 2001 produced a Fijian-led government, which refused to grant the Indian party its share of cabinet seats as stipulated in the new constitution. The dynamics of group politics have also introduced elements of instability in the government of Trinidad and Tobago, although not to the same level as in Fiji. By 1960, the early three party formation and the cross-ethnic alliances that informed party behaviour were transformed into a two way race in which the party led by Afro-Creoles, the People’s National Movement, was pitched against the Indian-based Democratic Labour Party. In the 1961 independence elections, the two parties shared all the seats in parliament. The polity became highly polarised with threats of open violence. The PNM won the next six elections and for 25 years established a defacto one party state. Dissent emerged in the 1980s following economic crises and allegations of corruption and mismanagement of public resources. A new multiethnic party, National Alliance for Reconstruction, which combined an Indian-based party and disenchanted sections of the Afro-Creole and Mixed race communities as well as by the small white group, French Creoles, defeated the PNM in 1985. However, the ethnic unity did not last. The NAR was fatally split between the Afro-Creole prime minister and the leader of the Indian group in the alliance. The party was defeated by the PNM in the 1991 elections. In the 1995 elections, the Indian party won the elections when large sections of the mixed race group and other minorities supported it. The next three elections after 2000 reinforced the bipolar ethnic competition between the Afro-Creole-led and Indian-led parties, with the PNM returning to power in 2002. There was bitter resentment among the Indian group when the Afro-Creole President called on the PNM to form a government following the stalemate of the 2001 election. They argued that the President should have first asked the Indian-led party to form the government, since it was the incumbent government. In Belgium, consociational democracy has been used to contain conflict between the two communities. A large degree of autonomy is granted to the contending groups, and issues of common interest are decided by consensus. The consociational federal state is full of checks and balances, power sharing arrangements and veto powers that protect the interests of the two main groups. Consociationalism has its history in the way the Belgian state had resolved similar conflicts that predated or competed with the ethno-linguistic divide. A grand coalition of the three major ideological divides – Catholic, Socialist and Liberals – governed the country from 1918-1921, and between 1935 and 1945. The wide-ranging constitutional reforms introduced since 1970 have produced relative balance in the composition of the public sector. Consociationalism has encouraged a fragmentation of the choices of the two communities into multiple parties. Until the early 1960s the Christian-Democrats controlled more than half the Flemish vote and were the dominant party in the region and country until the early 1990s. The Flemish Christian Democrats always provided the Belgian Prime Minister. In 1999, however, the Flemish Liberal party (an autonomous party after the split of the Belgian Liberals in 1971) became dominant in Flanders. In Wallonia, however, the Socialist party has been dominant since 1961. The Christian-Democrat, Liberal and Socialist parties were unable to survive the linguistic tensions, and collapsed within a very short period of time. Since 1978, national Belgian political parties have ceased to exist; all parties are regional without
Overview of Research Findings and Policy Issues
24
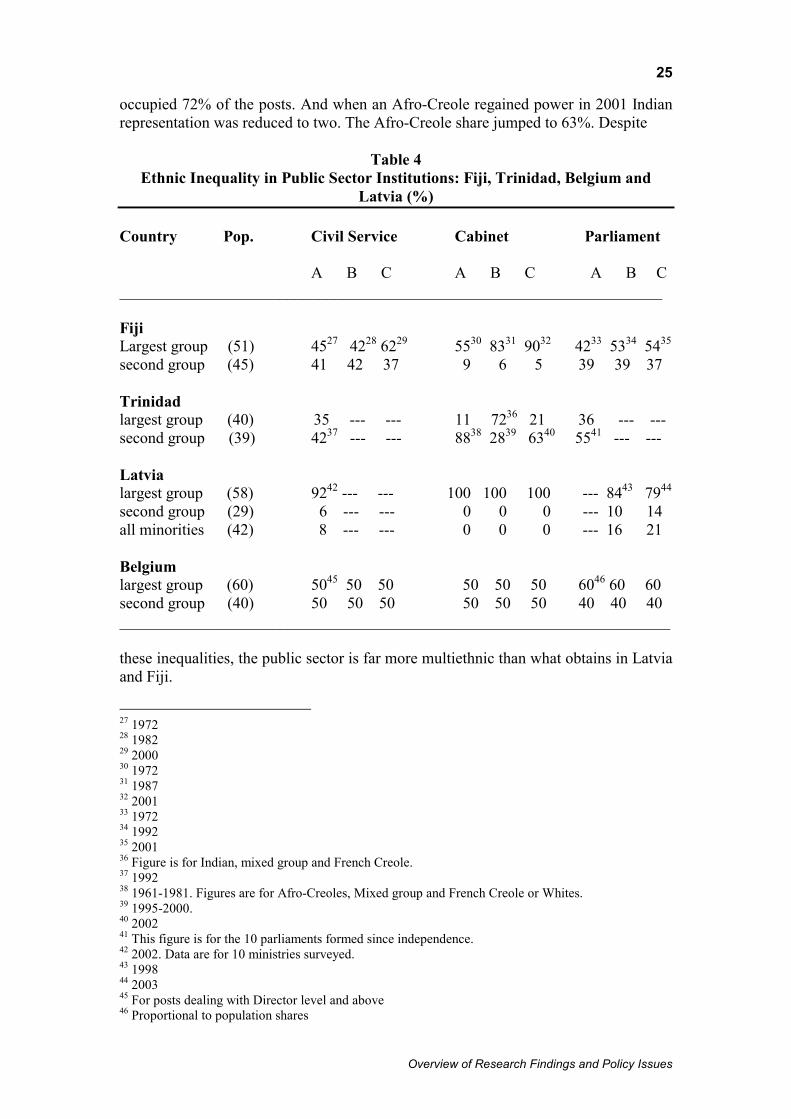
even a federal structure for intra-party co-operation. Parties represent only one section of the country and compete only with parties of their own language. Parties tend to unite on each side of the ethno-linguistic divide, while a huge cleavage exists between similar ideological parties across the divide. Public sector inequalities Table 4 suggests that minorities are highly under-represented in Latvia’s public institutions. Even though they constitute 42% of the population, they accounted for only 16% of parliamentarians in 1998 and 21% in 2003. It should be noted, however, that the latter figure fairly reflects the minority share of the citizen population (25%), suggesting that minorities can be better represented if the citizenship rules are relaxed or more minorities become citizens. Unlike in Lithuania, minority parties have not played a role in the coalition governments that have governed the country since independence, despite the fact that one of the parties is the second largest party in the 2002-2004 parliament, and the third largest in the 1998-2002 parliament. Since minorities are rarely represented on the party lists of mainstream parties, Latvian cabinets are exclusively made up of ethnic Latvians. Citizenship and language laws have also reversed the Soviet era Russian domination of the public bureaucracy. In the ministries surveyed, 92% of employees are ethnic Latvians. However, minorities have a higher level of access in the security ministries: 21% of the air force; 15% of the navy; 23.7% of the military centre for logistics; 34% of the police force; 36% of firemen; 20% of border guards; and 63% of prison employees, with Russians constituting 45%. Because of the communal nature of Fiji’s electoral system, its parliament has tended to reflect the relative population shares of the two groups, although the Fijian share has witnessed a rise from 42% in 1972 to 53% in 1992 and 54% in 2001. It is at the level of the cabinet and civil service that inequalities are very sharp. In 1972, the cabinet was 55% Fijian and 9% Indian. Between 1987 and 1990, it was on average 83% Fijian and only 6% Indian. Between 1990 and 1996 there were no Indians in the cabinet. Even when an Indian became prime minister in 1999, two thirds of cabinet members were Fijians. In 2001, Indians constituted only 5% of the cabinet. There was relative parity in the civil service during the early independence period: in 1980 it was actually 42:42. However, after the coup of 1987, the Fijian share rose sharply. More than 60% of civil servants are now ethnic Fijians, compared to 37% Indian. Fijians constitute over 99% of the armed forces and their share of the top civil service posts is more than 85%. In Trinidad and Tobago, because of the long rule of the Afro-Creole-led party, Afro-Creoles are over-represented in the public service (42% Afro-Creole: 34% Indians), especially at the senior levels where, in conjunction with the mixed group, they account for between 70% and 90% of the positions. 72% of the defence force and 74% of the police force are Afro-Creoles. The 10 parliaments between 1961 and 2002 comprised of 56% Afro-Creoles and 36% Indians. Only one out of five prime ministers has been Indian. Between 1961 and 1991 in cabinets ranging from 17-22 members Indian representation was between two and five members. In 1972, Indians accounted for only 11% of the cabinet. The situation was reversed when an Indian became prime minister in 1995: only six ministers were Afro-Creoles. Indians
Overview of Research Findings and Policy Issues
25
occupied 72% of the posts. And when an Afro-Creole regained power in 2001 Indian representation was reduced to two. The Afro-Creole share jumped to 63%. Despite
Table 4 Ethnic Inequality in Public Sector Institutions: Fiji, Trinidad, Belgium and
Latvia (%) Country Pop. Civil Service Cabinet Parliament A B C A B C A B C ____________________________________________________________________ Fiji Largest group (51) 4527 4228 6229 5530 8331 9032 4233 5334 5435 second group (45) 41 42 37 9 6 5 39 39 37 Trinidad largest group (40) 35 --- --- 11 7236 21 36 --- --- second group (39) 4237 --- --- 8838 2839 6340 5541 --- --- Latvia largest group (58) 9242 --- --- 100 100 100 --- 8443 7944 second group (29) 6 --- --- 0 0 0 --- 10 14 all minorities (42) 8 --- --- 0 0 0 --- 16 21 Belgium largest group (60) 5045 50 50 50 50 50 6046 60 60 second group (40) 50 50 50 50 50 50 40 40 40 _____________________________________________________________________ these inequalities, the public sector is far more multiethnic than what obtains in Latvia and Fiji.
27 1972 28 1982 29 2000 30 1972 31 1987 32 2001 33 1972 34 1992 35 2001 36 Figure is for Indian, mixed group and French Creole. 37 1992 38 1961-1981. Figures are for Afro-Creoles, Mixed group and French Creole or Whites. 39 1995-2000. 40 2002 41 This figure is for the 10 parliaments formed since independence. 42 2002. Data are for 10 ministries surveyed. 43 1998 44 2003 45 For posts dealing with Director level and above 46 Proportional to population shares
Overview of Research Findings and Policy Issues
26
In our four cases of bipolarity, only Belgium has made concerted efforts to create a public sector that strictly reflects the ethnic character of its population. Use of a proportional representation system has ensured that the parliament reflects the population shares of the two groups. However, at the cabinet level both groups have the same number of ministers despite the higher population of the Dutch, who are only compensated at the junior minister level where they enjoy a few extra positions. Decisions are always arrived at by consensus rather than voting. In the civil service, strict parity is enforced at the level of director and above. Below the post of director the distribution reflects the relative population shares of the two groups. These outcomes are captured in Table 4.
Tripolarity: Bosnia, Switzerland, Malaysia and Nigeria
Problems associated with bipolar structures can be found in tripolar settings: when ethnicity is polarised, differences may impact the entire system, constraining the formation of cross-ethnic alliances. There is the additional danger that members of two groups may collaborate to outflank members of the third group, which may assume the status of a permanent opposition. Nigeria and Bosnia have experienced civil wars; communal riots have occurred in Nigeria and Malaysia; and military coups with strong ethnic undecurrents have been a regular feature in Nigeria’s political landscape. Only Switzerland has enjoyed a high level of stability. Cleavages In Bosnia-Herzegovina, Bosniaks (Muslims) are 44%, Serbs 34% and Croats 16% of the population. In Switzerland, Germans are about 70 percent, French 22 percent, Italians 7 percent and Romansch less than one percent of the population. The German group is itself internally fragmented into various dialects and traditions. Most of the cantons have a majority ethnic group. In Malaysia, the Malays are 64%, Chinese 27% and Indians 9%. In Nigeria, the Hausa-Fulani are 30%, Yoruba 20% and Igbo 17%. More than 340 other groups account for 33% of the population. This suggests greater scope for crosscutting alliances. The issue of indigeneity is important only in Malaysia, where a bipolar discourse of bumiputera (sons of the soil) and non-bumiputera interests exists. In the other three cases all groups have primary claims to the territory. Bosnia-Herzegovina is a product of the civil wars that dismantled the Yugoslav state in the early 1990s. The civil war lasted three and half years and left more than 200,000 people dead or missing. The population of the three groups has varied over time. The Bosniak population increased from 39.6% in 1971 to 43.7% in 1991 (before the outbreak of war); that of Serbs and Croats fell from 37.2% to 31.4%, and 20.6% to 17.3% respectively. It has been estimated that after the war the Bosniak population is 44%, Serb 34% and Croat 16%. The war produced about 2.3 million refugees and internally displaced persons. Most were victims of policies by combatants to create ethnically homogenous regions. The multi-ethnic settlement patterns of the pre-war period have been shattered. Today, most Serbs live in Northwestern and Eastern Bosnia (Republic of Serbia); Bosniaks live in six of the 10 cantons of the Federation entity – in central North-western Bosnia; and Croats mostly live in Herzegovina, which is south of the country, and along the Sava River in the North. The cleavages
Overview of Research Findings and Policy Issues
27
are less sharp than in other societies as all three groups share a common language and similar traditions and cultures. However, Serbs adhere to the Serbian Orthodox Church, Croats follow the Catholic Church and Bosniaks are Muslims. While religion remains important in defining the conflict, most people are either atheist or attach little significance to their religious beliefs. In Switzerland, religion and class, which cut across ethnic groups, were historically the main cleavages that defined conflicts. Industrialisation, urbanisation and consensus democracy combined with economic growth and high levels of living to produce a stable, cohesive and inclusive public sector. The 1848 constitution produced a federal state of 25 cantons with different historical, religious and cultural backgrounds. Importantly, the cleavages in these cantons are in the main crosscutting rather reinforcing. For instance, French and Germans could be protestant or catholic, and, apart from the Jura area that was later carved out of the Bern canton, share similar socio-economic profiles. In Malaysia, the Malay share of the population was less than 50% between 1931 and 1957 and there is much internal diversity in the three communities. The Malay includes immigrants from Indonesia and the old Malay states. The Chinese include Hokkien, Cantonese, Hakka, and Hockchew dialects, while “Indians” constitute Tamils, Malayalis and Punjabis, “Pakistanis” and “Ceylonese”. However, official classification adopts a bipolar category that divides the population into “bumiputera” or indigenous people, and non-bumiputera or non-indigenous people. The bumiputera consists of the Malays and the Orang Asli in Peninsula Malaya, while the bumiputera of the islands of Sabah and Sarawak consist of indigenous people of diverse ethnicities. The non-bumiputera are the Chinese and Indians. In Nigeria, the Hausa-Fulani in the north, the Yoruba in the south-west, and the Igbo in the south-east are each numerically and politically dominant in the three regions that governed the country in the early period of independence. All the other ethnic groups are perceived as minority groups, although 11 large minorities constitute about 28% of the population. The most important cleavages are the north-south divide, divisions between the three main groups, and competition between the so-called majority and minority groups. Other cleavages include inter-state rivalry within or between ethnic groups, and inter-ethnic rivalry in multiethnic states. The north-south and inter-ethnic inequalities are now expressed in terms of states or zones. There are currently 36 states, 775 local governments and an informal grouping of 6 zones. In general, the public associates the ethnic identity of each zone with the majority of the population in that zone. Socio-economic inequalities Bosnia was a relatively egalitarian society during the communist period. There was however unequal development between the republics that constituted Yugoslavia. Slovenia, Croatia and Vojvodina were more developed whereas Bosnia, Kosovo, Montenegro and Macedonia were relatively poor. Wages in Bosnia were 16 percent lower than the Yugoslav average, prompting many to seek jobs in other parts of the federation. The war impoverished most sections of the society. However, some individuals, especially those linked to paramilitary units and state power, profited from the war, leading to an increase in socio-economic inequalities today. Post-war
Overview of Research Findings and Policy Issues
28
aid flows, which were skewed in favour of the Croat-Bosniak entity, produced inequalities between the Croat-Bosniak entity and the Serb entity, although differences are declining between Serbs and Bosniaks. 72 percent of Serbs, 65 percent of Bosniaks and 19.8% of Croats live on incomes of less than 500 KM. In Malaysia, an ethnic division of labour historically underpinned its society. During colonial rule, Malays were predominantly rural and produced food crops; Chinese were urban and dominated labour in the tin mines and small enterprises; and Indians were deployed as labourers in the rubber estates. At independence, there were wide gaps in incomes, asset holdings and professional status between the three groups. This ethnic division of labour affected ethnic relations, as Malays, who were predominantly rural, complained of relative economic backwardness. In contrast, immigrant Chinese and Indians exploited the opportunities in the urban sector and were successful in commerce, education and the professions. In 1970, about 85% of households in the lowest income brackets were Malay; and Malays were not represented at the highest income bracket. The Malay ownership of share capital was 1.9% compared to a non-bumiputera share of 37% and a foreign share of about 61%. In Nigeria, socio-economic inequalities between on the one hand the Yoruba and Igbo, and the Northern-based Hausa-Fulani are very sharp. In the educational field, the three northern zones that account for about 53% of the population accounted for only 19.7% of university undergraduate admissions in 2000. The two most northern zones with 39.2% of the population accounted for only 8.6% of the admissions. The professional cadre also demonstrates high levels of inequality. In 1990, only 2% of engineers, 14.6% of lawyers, 0.7% of estate surveyors, 14.2% of architects, and 2.7% of accountants were of northern origin. Only 16% of registered private businesses are in the north. Social sector inequalities also mirror educational, business and professional inequalities: poverty is concentrated in three northwestern states and the north lags behind the south on indicators such as literacy, access to health facilities, electricity and water. Group dynamics Socio-economic inequalities have not been crucial in explaining the dynamics of group behaviour in Switzerland (except in the Jura canton) and Bosnia, where the poor state of the economy affects all groups. They are, however, very important in Malaysia and Nigeria. Fears of exclusion in the public sector are more important than socio-economic inequalities in Bosnia. Under the Yugoslav republic, Serbs dominated the Communist party and administration. This was largely a consequence of the different roles played by the three communities in the party during World War II, and policies such as land reform that affected non-Serbs, as well as the conflict between the communist party and the Catholic Church, to which most Croats are affiliated by faith. Despite reforms, in 1981, 44.3% of communist party members were Serbs, 26.49% were Muslims and 11.43% were Croats. Relative equality based on population shares was only attained in the mid-1980s. However, Serbs remained over-represented in the administration before the outbreak of hostilities in 1991. The administration consisted of 39% Serbs, 34.5% Muslims, and 13.7% Croats. Serb domination was more pronounced in the army. 60% of the officer corp was Serb, 12.6% Croat and 2.4% Muslim. Unlike the
Overview of Research Findings and Policy Issues
29
administration, party and government, ethnicity-sensitive policies were never applied to the army. By 1990, when the first multiparty elections were held, nationalist parties representing the three communities had weakened the grip of the Communist party, taking 71.1% of the vote and controlling 84.2% of the parliamentary seats. Despite a power sharing agreement47, the three parties had diametrically opposed visions of Bosnia and its place in Yugoslavia. The stage was set for highly polarised ethnic politics and a bloody war, after the country was recognised internationally as an independent republic in April 1992. The Dayton peace accord that ended the war produced one of the most institutionally engineered countries in the world. The country is currently run by multiple power sharing arrangements. At the state level, power is shared equally between the three communities. In addition to the state system, there is a Federation entity that is jointly governed by Croats and Bosniaks, and a separate Serb Republic, which is largely governed by Serbs. It is estimated that 72.9% of the population of the Federation is Bosniak, 21.8% Croat, and 4.4% Serb in 2003. The relative population shares before the outbreak of war were 52.09%, 22.13% and 17.62% respectively. In the Serb Republic, Serbs were 96.79%, Bosniaks 2.19% and Croats 1.02% of the population in 1997. Before the war the respective ratios were 54.30%, 28.77% and 9.39%. Each community has a right to veto legislation. In the Federation and Serb Republic a two-thirds majority of a community’s deputies is required in the two chambers of parliament to block legislation. At the state level only one third from each entity can block a law in either of the two chambers of parliament. Additionally, a majority of one of the three peoples can also veto legislation. The composition of the bureaucracy of the three entities reflects the relative population shares of the three groups. This proportionality was introduced in the Serb Republic only recently following the 2002 constitutional amendments. An additional aspect of the power sharing arrangements is the segmented autonomy granted to the three groups. At first, segmented autonomy was restricted to the state and Federation entities as the Serb Republic was treated as a homogenous entity. The effect is that many non-Serbs in the Serb government and parliament actually represent citizens who do not reside anymore in the Serb Republic. Most powers are delegated to the entities and the High Representative exercises much of the remaining power48. There has been, however, a trend towards strengthening of the central institutions. The extension of power sharing mechanisms to the entities has helped to strengthen the state level. Each community is equally represented in the Presidency and wields a veto power. Not only is the ethnicity of the members of the presidency prescribed –one Croat, one Serb and one Bosniak – but members are also elected by the two entities separately. This has created the rather unusual situation in which Serbs in the Federation and Croats and Bosniaks in the Serb Republic49 are not “represented” in the presidency. The Dayton Peace Agreement (DPA) may have been effective in ending the war and providing incentives for the nationalist factions that had partitioned the country into two enclaves to abandon efforts to create separate, independent polities. However, the 47 A Muslim was made president, a Croat prime minister and a Serb president of parliament. 48 NATO-appointed administrator. 49 It is estimated that Non-Serbs are 12% of the population of the entity of the Serb Republic; and Serbs are 17% of the Federation entity.
Overview of Research Findings and Policy Issues

30
DPA’s approach to power sharing emphasised ethnic rather than civic identities as the basis for representation in key institutions. As the war produced mono-ethnic regions and localities, nationalist parties were empowered by the DPA’s power sharing model. Even though the dominant party among Bosniaks advanced civic, universal values, it was unable to break into the electoral domains of the Serb and Croat nationalist parties. And even when the party system and electoral behaviour in Serb and Croat regions fragmented, parties could only advance moderate, not-cross-ethnic, positions; and voters refused to support multi-ethnic parties. The grip of the nationalist parties on their respective electorates was weakened but not broken. The High Representative used two instruments to try to break the ethnicisation of Bosnia’s governance regime. The first was the use of the right of return of refugees using the 1991 census as a basis to determine where people could vote. The votes of refugees altered the homogenous character of the two entities. By this method, minorities in the entities whose populations were drastically reduced by the war were able to gain “representation” proportionate to their pre-war numerical strength. The second instrument was the court ruling of 2000 that changed the entity constitutions. This extended the power-sharing regime to the Serb Republic, opened up that of the Federation to Serb participation, and gave recognition to non-dominant ethnicities in the two entities and the state level. Malaysian social and political life is strongly organized around its ethnic cleavages. Political parties are openly ethnic in membership, interests and organisation. A consociational pact unites the parties of the three main groups. Parliamentary seats are allocated according to the ethnic composition of the electorate, the ethnic profiles of constituencies and the relative strengths of the component parties in the alliance. However the Prime Minister and his deputies are always Malay. The race riots of May 1969 exposed the limitations of the pact’s initial laissez-faire economic policy, which failed to address the rising unemployment, declining incomes and growing inequalities between groups. As a response to the crisis, an interventionist New Economic Policy was adopted, which aimed to eradicate poverty and ethnic inequalities. The Malay component of the governing pact became dominant as Malays monopolized policy making in the key ministries of finance and trade. The redistributive programme, which favoured the Malays, incorporated other objectives: high capacities for policymaking, state intervention in the economy and other modes of governance associated with East Asia’s developmental state. This strategy, which has been blessed with high growth rates, has had the overall effect of radically recomposing Malaysia’s class structure, altered the balance of power between different groups and empowered the state to deliver economic and political outcomes. Divisions have opened up within the dominant ethnicity, even though political organisation and representation remain strongly ethnic. The narrowing of socio-economic disparities between the two main ethnic groups has led to a healthier, less virulently ethnic, discourse on political transformation, despite the suspicions that remain on both sides. In Nigeria, the overlapping inequalities have influenced the structure of opportunities and life chances and provided a platform for political mobilization. Ethnicity correlated with patterns of party formation and voting behaviour before the stringent rules on party registration and government formation were introduced. The pre-independence constitutional settlement gave the north 50% of the seats in parliament. This built-in northern majority was reflected in the governance regime between 1959
Overview of Research Findings and Policy Issues
31
and 1966. Since the civil war of 1967-70 there have been concerted efforts to develop an inclusive and stable public sector through strategies of fragmentation, integration and redistribution. The first has been the dissolution of the colonially inherited three federal regions into a decentralized polity that now contains 36 states and 775 local governments. The second has involved use of electoral rules to produce governments that enjoy broadly national and majority support. In the elections for the Second Republic of 1979-83, a presidential candidate with a plurality of the votes could only be declared winner after obtaining at least 25% of the votes in two thirds of the states. This threshold rule was extended to party formation in the transition to the Third Republic in 1999: in order to be registered to compete for the elections, a party must secure a threshold of 5 per cent of the votes cast in at least 25 of the 36 states in local government elections. The rule on party formation was rescinded in 2003, after a fierce campaign about its constraints on the right of organization. The threshold rule has encouraged the emergence of broadly based parties and candidates who need to appeal across ethnic lines to win elections. The third strategy is use of "federal character" or affirmative action policies to constitute the civil service and educational institutions. This has come to include the demand for the presidency to rotate among the six geopolitical zones; and appointment of at least one federal minister from each of the 36 states. Key offices, such as the Senate President and Speaker of the House of Representatives, have also been affected by the zoning principle. These reforms have radically transformed Nigeria’s public sector, especially at the cabinet level where there is now a high degree of balance. However, ethnic mobilisation and communal violence remain real problems. This is linked to the inadequate design and implementation of the reforms, the massive North-South socio-economic inequalities that feed the politics of religion in deprived states, problems of indigeneity and resource competition among groups associated with state and local government creation, the high level of state dependence on federally collected oil revenues and the intense competition and corruption of public life linked to its distribution, and the unresolved question of how to ensure equal chances of participation in constituting the presidency.
The Swiss power sharing institutions are different from those in Nigeria, Belgium, Bosnia and Malaysia. Swiss political parties are national, rather than ethnic. Today the four biggest parties that constitute the consociation win votes and seats in all linguistic parts of the country. Individuals from the smaller groups, French and Italian, are slightly over-represented in the Federal Council and the Federal Court. The integration of structural minorities in the public sector; the large degree of autonomy enjoyed by the cantons, who have a strong say in federal legislation; the principle of direct democracy, which can be used by small groups to block the legislative process; as well as the high national economic achievement and relative socio-economic equality between groups and cantons account for the success of the Swiss model.
Public Sector Inequalities In our four cases, Bosnia and Switzerland have highly proportional public sectors. In Bosnia, two thirds of the ministers at the state level have to be from the Federation
Overview of Research Findings and Policy Issues
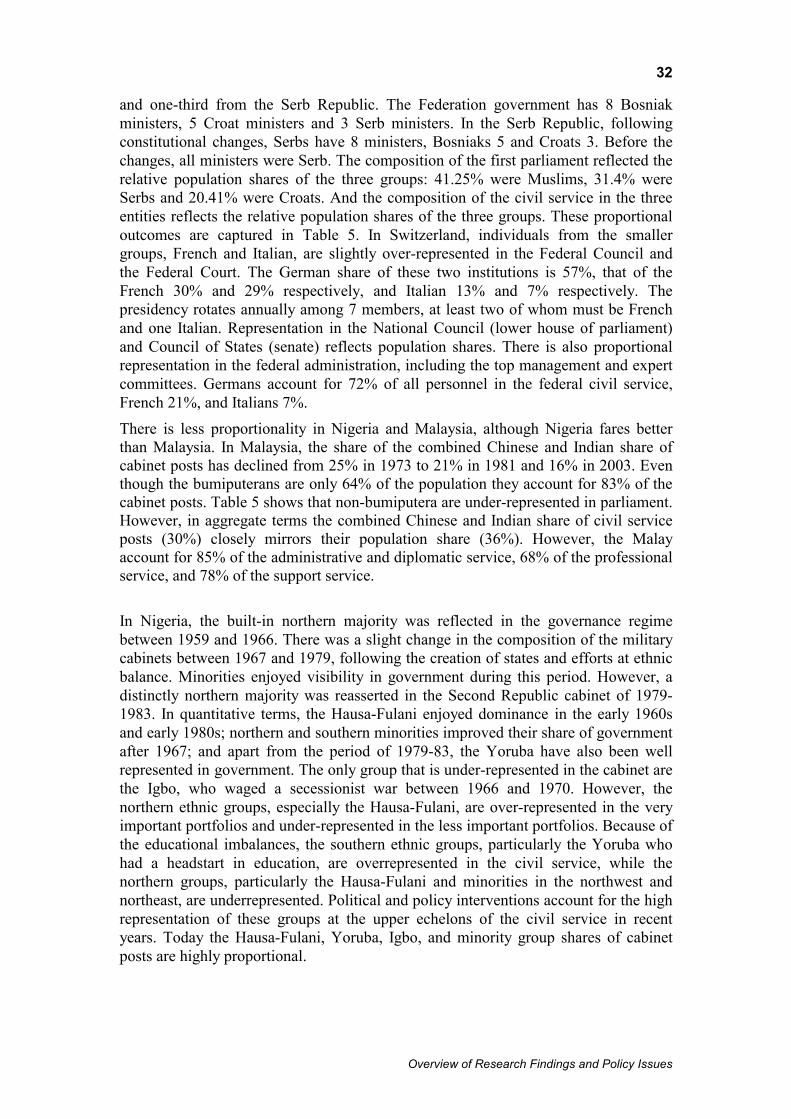
32
and one-third from the Serb Republic. The Federation government has 8 Bosniak ministers, 5 Croat ministers and 3 Serb ministers. In the Serb Republic, following constitutional changes, Serbs have 8 ministers, Bosniaks 5 and Croats 3. Before the changes, all ministers were Serb. The composition of the first parliament reflected the relative population shares of the three groups: 41.25% were Muslims, 31.4% were Serbs and 20.41% were Croats. And the composition of the civil service in the three entities reflects the relative population shares of the three groups. These proportional outcomes are captured in Table 5. In Switzerland, individuals from the smaller groups, French and Italian, are slightly over-represented in the Federal Council and the Federal Court. The German share of these two institutions is 57%, that of the French 30% and 29% respectively, and Italian 13% and 7% respectively. The presidency rotates annually among 7 members, at least two of whom must be French and one Italian. Representation in the National Council (lower house of parliament) and Council of States (senate) reflects population shares. There is also proportional representation in the federal administration, including the top management and expert committees. Germans account for 72% of all personnel in the federal civil service, French 21%, and Italians 7%. There is less proportionality in Nigeria and Malaysia, although Nigeria fares better than Malaysia. In Malaysia, the share of the combined Chinese and Indian share of cabinet posts has declined from 25% in 1973 to 21% in 1981 and 16% in 2003. Even though the bumiputerans are only 64% of the population they account for 83% of the cabinet posts. Table 5 shows that non-bumiputera are under-represented in parliament. However, in aggregate terms the combined Chinese and Indian share of civil service posts (30%) closely mirrors their population share (36%). However, the Malay account for 85% of the administrative and diplomatic service, 68% of the professional service, and 78% of the support service.
In Nigeria, the built-in northern majority was reflected in the governance regime between 1959 and 1966. There was a slight change in the composition of the military cabinets between 1967 and 1979, following the creation of states and efforts at ethnic balance. Minorities enjoyed visibility in government during this period. However, a distinctly northern majority was reasserted in the Second Republic cabinet of 1979-1983. In quantitative terms, the Hausa-Fulani enjoyed dominance in the early 1960s and early 1980s; northern and southern minorities improved their share of government after 1967; and apart from the period of 1979-83, the Yoruba have also been well represented in government. The only group that is under-represented in the cabinet are the Igbo, who waged a secessionist war between 1966 and 1970. However, the northern ethnic groups, especially the Hausa-Fulani, are over-represented in the very important portfolios and under-represented in the less important portfolios. Because of the educational imbalances, the southern ethnic groups, particularly the Yoruba who had a headstart in education, are overrepresented in the civil service, while the northern groups, particularly the Hausa-Fulani and minorities in the northwest and northeast, are underrepresented. Political and policy interventions account for the high representation of these groups at the upper echelons of the civil service in recent years. Today the Hausa-Fulani, Yoruba, Igbo, and minority group shares of cabinet posts are highly proportional.
Overview of Research Findings and Policy Issues
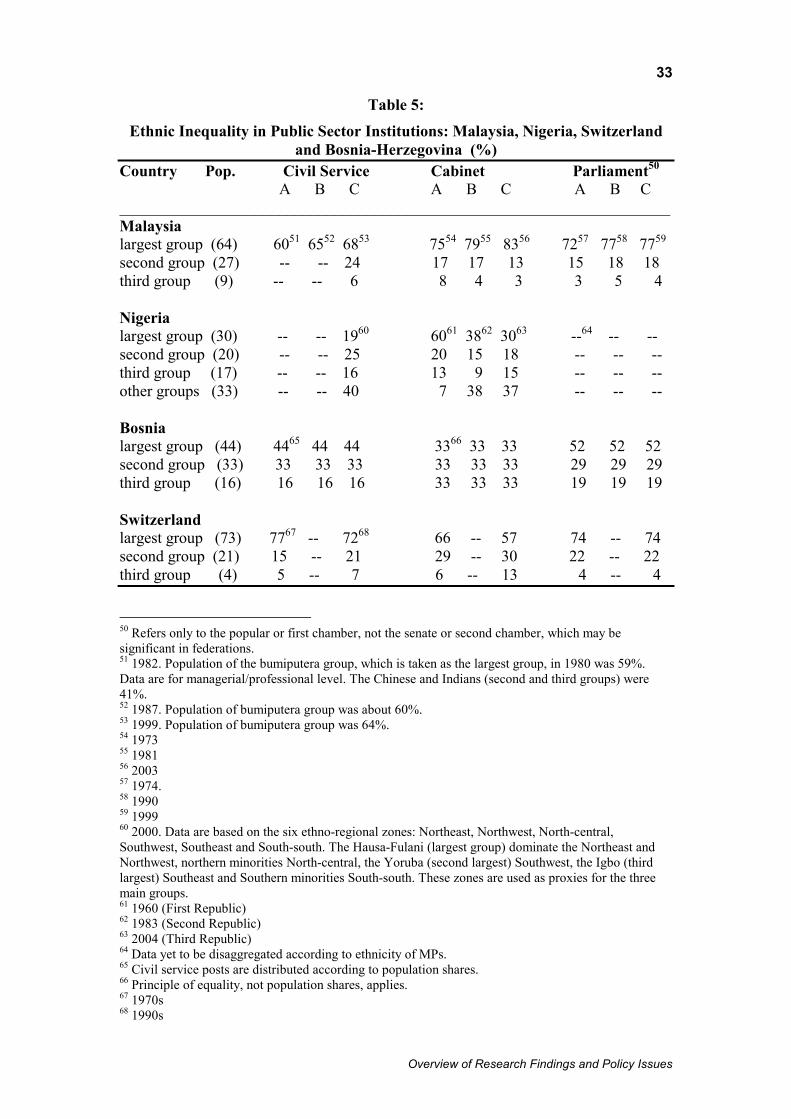
33
Table 5:
Ethnic Inequality in Public Sector Institutions: Malaysia, Nigeria, Switzerland and Bosnia-Herzegovina (%)
Country Pop. Civil Service Cabinet Parliament50 A B C A B C A B C _____________________________________________________________________ Malaysia largest group (64) 6051 6552 6853 7554 7955 8356 7257 7758 7759 second group (27) -- -- 24 17 17 13 15 18 18 third group (9) -- -- 6 8 4 3 3 5 4 Nigeria largest group (30) -- -- 1960 6061 3862 3063 --64 -- -- second group (20) -- -- 25 20 15 18 -- -- -- third group (17) -- -- 16 13 9 15 -- -- -- other groups (33) -- -- 40 7 38 37 -- -- -- Bosnia largest group (44) 4465 44 44 3366 33 33 52 52 52 second group (33) 33 33 33 33 33 33 29 29 29 third group (16) 16 16 16 33 33 33 19 19 19 Switzerland largest group (73) 7767 -- 7268 66 -- 57 74 -- 74 second group (21) 15 -- 21 29 -- 30 22 -- 22 third group (4) 5 -- 7 6 -- 13 4 -- 4 50 Refers only to the popular or first chamber, not the senate or second chamber, which may be significant in federations. 51 1982. Population of the bumiputera group, which is taken as the largest group, in 1980 was 59%. Data are for managerial/professional level. The Chinese and Indians (second and third groups) were 41%. 52 1987. Population of bumiputera group was about 60%. 53 1999. Population of bumiputera group was 64%. 54 1973 55 1981 56 2003 57 1974. 58 1990 59 1999 60 2000. Data are based on the six ethno-regional zones: Northeast, Northwest, North-central, Southwest, Southeast and South-south. The Hausa-Fulani (largest group) dominate the Northeast and Northwest, northern minorities North-central, the Yoruba (second largest) Southwest, the Igbo (third largest) Southeast and Southern minorities South-south. These zones are used as proxies for the three main groups. 61 1960 (First Republic) 62 1983 (Second Republic) 63 2004 (Third Republic) 64 Data yet to be disaggregated according to ethnicity of MPs. 65 Civil service posts are distributed according to population shares. 66 Principle of equality, not population shares, applies. 67 1970s 68 1990s
Overview of Research Findings and Policy Issues
34
Concentrated multipolarity: Ghana, Kenya and India Ghana, Kenya and India represent three types of concentrated multipolar ethnic settings. Even though these are societies with numerous ethnic groups, some of the groups are large enough to form selective coalitions in struggles for access to the public sector. This raises the possibility of exclusion or insufficient access for groups that are not part of a winning coalition. In the first type, one group constitutes about half of the population. This may encourage smaller groups to form coalitions in order to contain the larger group, which may also form selective coalitions. If the dominant group fragments, political behaviour may resemble fragmented multiethnic settings in which ethnicity loses its potency in the public sector. The second type involves cases in which four or five of the numerous groups are relatively equal in size and constitute an overwhelming majority of the population. Elites of each group may feel they can govern by constructing selective coalitions. Electoral rules of first past the post and presidential systems of government may reinforce such choices. The third type is one in which the ethno-linguistic cleavage is interlinked with other powerful cleavages, such as caste and religion, which may be less fragmented than the ethno-linguistic divide. If these cleavages are crosscutting rather than reinforcing, they may encourage centripetal forms of cooperation even when some cleavage-based parties are empowered. Consolidated multipolar ethnic settings can thus produce both positive and negative outcomes. They may be relatively benign, as in unipolar and fragmented multipolar settings, or malignant, as in politicised bipolar and tripolar settings. Cleavages and socio-economic inequalities Ghana is a multiethnic society in which the Akan account for 49.1% of the population, and three other large groups -- Mole Dagbani, Ewe and Ga Adangbe – 16.5%, 12.7% and 8% respectively. These four groups constitute about 86 percent of the population, which is divided into 92 ethnic groups. This structure may encourage adversarial and ethnically selective coalition politics, as happened during the decolonisation period and first few years of independence when the ruling party, Nkrumah’s Convention People’s Party, was pitted against a coalition of ethnic-based parties representing Ashanti, Ewe and Northern interests. However, each one of the four large groups is internally fragmented. This later helped to produce an outcome that has made Ghana resemble a highly fragmented country. The largest fragmentation is among the Akan who are divided into 20 sub groups. The Akan have not behaved as a cohesive political unit and cross-ethnic coalitions have been the norm. There has been ethnic polarisation in two areas: the Ewe-Ashanti divide, and the North-South divide. The Ewe and Ashanti are the two groups that have been less flexible in their voting behaviour. These two groups score highly in the education index and have historically vied for dominance of the public sector. However, their combined strength is only about 27% of the population. The Ashanti, who are 14.8% of the population, have been unable to mobilise the rest of the Akan sub-groups to follow their choices in seeking to govern the public sector. Therefore, even though the Ashanti-Ewe rivalry may be potent, it does not seem threatening to the body politic. The North-South divide assumes religious and material dimensions. The North, which is largely Muslim, is resource-poor and lags behind the South in most social and economic indicators. In the South, the Akan regions and Accra, the capital, are the
Overview of Research Findings and Policy Issues

35
most developed. Even though most governments have made efforts to bridge the North-South gap by having more Northerners represented in government, it seems that it was under the Rawlings government (1981-2000) that the North achieved the highest representation in government. The North-South divide remains intractable, although it does not threaten the unity of the country. The North itself is fragmented and experiences serious communal conflicts, in which the central state has played the role of a neutral arbiter. In Kenya, there is relative equality in the population shares of the five major groups. The largest group, the Kikuyu, is only 21% of the population, and the population shares of four others (Luhya, Kalenjin, Luo and Kamba) range from 11% to 14%. These five groups account for about 70% of the population. Another three groups, varying in population from about 5% to 7%, account for 16% of the population. The combined population of these 8 groups is about 86%. It is estimated that there are about 40 ethno-linguistic groups in the country. None of the remaining 32 groups is more than 2%, and many are less than 1%. Each of the five major groups has a majority presence in at least one of the eight regions of the country. Given the relative equality of the top five groups, each group feels it stands a chance to form a government if it can create a winning ethnic coalition. Each has tried to outbid the others, rendering difficult the formation of broad and lasting coalitions that will involve the participation of most of the large groups. Except for the 2002 elections, the big groups have not bothered to invest in broad-based coalitions. Each group has formed its own party, expecting to bargain only after election results are known. The electoral rules of first past the post have encouraged this behaviour. If politicians from each of the five groups secure the votes of their putative communities, the presidency can be won with less than 30% of the votes. The Central region, where the Kikuyu predominate, is the most developed of the 8 regions. Educational attainment is higher among the Kikuyu, Luo and Luhya than among other groups. The most backward region is Northeastern, with a Somali population. Nairobi dwarfs all regions in the GDP index, followed by the Coastal and Central regions. The high education indexes for Nyanza (Luo) and Western (Luhya) regions are not matched by a high GDP index. These regions are resource poor. The data suggest that the Kikuyu (and the Kalenjin who live in the Rift valley) are less poor than the other main groups. The poorest among the numerically large groups are the Luo in Nyanza province, the Kamba in Eastern province, the Mijikenda in the Coast province, and the Luhya in Western province. Northeastern province –home of the Somalis – is the poorest of all the regions. The relative advantage of the Central province is a product of colonial policies. The province was close the White Highlands and became an important source of labour for the settler economy. The Kikuyu gained early entry into the wage labour market and earnings were remitted back home. Roads, schools and hospitals were gradually built especially in Central region, the Rift Valley (which provided the agricultural base of the settler economy) and Nairobi. The Northeastern province was far from “the fields of accumulation and the fields of power” (Kanyinga, 2004). India, with its numerous languages, religions, castes and tribes, presents a different set of issues. It has more than 1,600 languages, with more than 100 identified as dominant languages. The largest language group – Hindi – is about 40% of the population. The 18 language groups that enjoy official status account for more than
Overview of Research Findings and Policy Issues
36
96% of the population. After Hindi, the next six groups are roughly equal in size: Bengali (8.3%), Telugu (7.87%), Marathi (7.45%), Tamil (6.32%), Urdu (5.18%), and Gujarati (4.85%). Their population ratios may seem small, but in terms of absolute figures these are very large groups.69 Most of these language groups – especially the ones with Hindu religious adherents – are divided by a hierarchical caste system, with the Dalits or Scheduled Castes occupying the lowest stratum. Eight percent of the population is characterised as tribal. And there are about 6 major religions with the largest (82%) being Hindu. Muslims are 12.12%, Christians 2.34%, Sikhs 1.94%, Buddhists 0.76% and Jains 0.39%. These cleavages are in the main crosscutting rather than reinforcing. Someone who is Hindu, may not necessarily speak Hindi, and may belong to a non-Brahmin caste or tribe. It is difficult for parties to mobilise Indians on a single cleavage and expect to receive majority support. Parties that appeal to non-sectional cleavages have historically obtained most votes in elections. Pan-Indian, cross-ethnic parties consistently captured more than 60% of the popular vote between 1952 and 1991. The share went down to 54.4% in 1996. On the other hand, ethnic parties’ share of the popular vote has risen from 11.5% to 34.9%. Federalism and the decision to reverse the divisive policy that granted Hindi the status of official language contained or averted conflicts based on ethno-linguistic differences. However, the politicisation of two other cleavages – caste and religion -- has affected the fragmented character of India’s social structure. Even though there are five main castes and any number of sub-categories within each, the discourse and politics on caste has tended to take on a bipolar character: Forward Caste versus Backward/Schedule Castes/Schedule Tribes, with the latter groups accounting for more than 80 percent of the population. Efforts to improve the lot of lower castes and tribes through affirmative action policies have witnessed the emergence of caste-focused political parties – pitched against Brahmin dominance. Caste-based parties raised their share of the popular vote from 5.6% in 1952 to 13.5% in 1996. The second cleavage that has tended to polarise Indian society is religion. Before independence in 1947, Hindus were slightly more than 70% of the population and Muslims 24%. This bipolar divide was politicised in the run up to independence, leading to a bloody civil war and partition of the country. Partition increased the relative population of Hindus but did not change the bipolar character of religious relations. The 100 million Muslims who remain in the country constitute the second largest Muslim group anywhere in the world, and the second largest religious group in the country (12%). Both Hindus and Muslims still account for more than 94% of the population. This cleavage has lately been exploited by Hindu revivalist parties, which threaten to convert India into a unipolar state using Hinduism as a mobilising force. The share of these parties of the popular vote rose from 5.9% in 1952 to 21.4% in 1996. Since the 1990s, coalition parties, rather than single party-dominant governments, have been frequent.
69 Bengali: 69, 595, 738; Telugu: 66, 017, 615; Marathi: 62, 481, 681; Tamil: 53, 006, 368; Urdu: 43, 406, 932; Gujarati: 40, 673, 814. These groups are larger than most European nations. Some are also found in neighbouring countries. Even smaller groups such as Kannada (3.91%: 32, 753, 676), Malayalam (3.62%: 30, 377, 176), Oriya (3.35%: 28, 061, 313), Punjabi (2.79%: 23, 378, 744) and Assamese (1.56%: 13, 079, 696) are large by European and world standards.
Overview of Research Findings and Policy Issues
37
The socio-economic status of Muslims and Hindus is unequal. The average income of Hindu households exceeds the average Indian income by 0.2%; that of Muslim households is less than the Indian average by about 13%. More Muslims (43%) on the average are below the poverty line than Hindus (39%). Literacy rates are also lower among Muslims (49.4%) than Hindus (53%). And Muslims have less access to electricity (30%) and piped water (19%) than Hindus (43% and 25% respectively). Socio-economic disparities are sharper among castes. Literacy rates among the lower castes (Scheduled Castes) and tribes (Scheduled Tribes) are very low: 37% and 29% respectively. The Indian average is 52%.70 The income poverty ratio for scheduled castes and tribes was 57% in 1983 whereas that for the rest of the population was 39%. Scheduled castes account for only 11.7% of Indians with above high school education, 9.2% of white-collar jobs and 9% of the middle class. The figures for Scheduled Tribes are 4%, 3.4% and 5.2% respectively. Group dynamics and public sector inequalities There have been interesting distributional outcomes in the public sectors of India, Kenya and Ghana. In Ghana, even though the Akan dominate the public sector, there is sufficient representation of the four largest groups, and public policy is supportive of ethnic/regional balance. The current dominant parties are not ethnic and voters’ preferences have not systematically been ethnic. Of the five competitive party elections that have been held since independence -- 1969, 1979, 1992, 1996 and 2000 -- it was only the 1969 one that the Akan vote did not fragment. The winner, the Progress Party (PP), led by a Brong Akan, won all the Akan regions as well the Northern and Upper West regions. The loser, the National Alliance of Liberals, led by an Ewe, was dominant in the Volta (homeland of the Ewe), and tied with the PP in Greater Accra. The Akan vote fragmented in the 1979 elections. The putatively Northern-led People’s National Party defeated the Ashanti-Akan-led Popular Front Party. The PFP won only two Akan regions: Ashanti and Brong. In the 1996 elections the PNDC, whose leader was Ewe, was victorious in 9 of the 10 regions, including five of the six Akan regions. It only lost the Ashanti region. In 2000, the NDC was defeated by the NPP, which has an Akan as leader. The former won four of the six Akan-dominated regions, but the NDC retained the three northern regions, Volta and two Akan regions. The data suggest that the two most inflexible ethnic groups are the Ashanti and the Ewe. The preferences of these two groups have tended not to fragment in virtually all elections held since independence. While other regions distribute their votes, the Volta and Ashanti regions concentrate their votes on parties perceived as home-based. Given their numerical strength and the non-explicitly ethnic nature of the parties, the Akan have dominated most of Ghana’s cabinets, even though other groups have also been included. Table 6 shows that the Akan accounted for 56% of the cabinets formed under the first leader, Nkrumah, between 1952 and 1965. The Ga Adangbe (fourth largest group) accounted for 12% (over-represented), the Ewe (third group) 12.5% (proportional) and the North 15% (under-represented). In the 1969 cabinet of Busia, the Akan greatly increased their dominance to 79%; that of the Ga dropped to 5%; and the North’s increased to 16% even though still disproportional to its population share.
70 These figures are for 1991.
Overview of Research Findings and Policy Issues

38
Table 6 Ethnic Inequality in Public Sector Institutions: Ghana and Kenya (%)
Country Pop. Civil Service Cabinet Parliament71 Ghana A B A B C A -------------------------------------------------------------------------------------------------------- largest group (49) 4172 4373 5674 5475 7476 5777 second group (17/30)78 879 15 1580 26 7 24 81 third group (13) 17 14 7 10 7 10 fourth group (8) 26 20 12 10 14 10 Kenya A B C A B C A B C -------------------------------------------------------------------------------------------------------- largest group (21) 3182 2083 4484 2985 1586 1687 2188 1989 1890 second group (14) 9 12 8 8 13 16 17 12 13 third group (12) 12 7 8 14 10 16 16 10 11 fourth group (12) 6 22 8 6 14 4 12 19 20 Ewes were not represented in the cabinet, leading to Ewe alienation from the government and accusations of ethnic bias.91 Under the Limann government in 1979, the Akan share dropped to 57%. The Ewe returned to the cabinet with a 14% share (balance) and the Ga raised their share to about what it was under Nkrumah (14%:
71 Refers only to the popular or first chamber, not the senate or second chamber, which may be significant in federations. 72 2000. Rawlings government. Based on top strata of six institutions: ministries of health and education, oil refinery, social security and national trust, customs and excise, and armed forces. 73 2001 (current government) 74 1952-1965 75 1992-1999 76 2000-3 77 2000. 78 Second largest ethnic group is 17%. Northern groups are 30%. 79 North is used as proxy for second group 80 North is used as proxy for second group. 81 The north is used as a proxy for the second largest group, which is northern-based. 82 1963-78 (Kenyatta regime) 83 1979-2001 (Moi regime) 84 2002 (current government) 85 1963-78 86 1979-2001 87 2003 (current government) 88 1963 89 1993 90 2002 91 The main problem was that the opposition party won all the seats in the Ewe area. Under the parliamentary system of government, it deprived the governing party of Ewe parliamentarians to be appointed as ministers even if it wanted to do so. The overwhelming dominance of the Akan in the cabinet was not, however, a healthy development. The massive purge of senior Ewe officers from the army and civil service, as well as the expulsion of the opposition leader from parliament led to the perception that the Busia government was ethnocentric. When the cabinet was reshuffled in 1971, the Akan still held 76.4% of the posts.
Overview of Research Findings and Policy Issues
39
over-represented). The North’s share dropped to 14%. During Rawlings’s tenure (1992-2000 of multiparty rule), the profile of the North in the cabinet increased substantially, accounting for about 26% of the posts. The Akan were about 54%, the Ewe 10%, and the Ga 10%. It was the most ethnically balanced government in Ghana’s history. The situation has been reversed under the current Ashanti-led government of the NPP. Akan dominance has been restored: 74%. The shares of the North and Ewe have dropped to 7% each; and that of the Ga has risen to 14%. As it is the first democratically elected government to be led by an Ashanti-Akan, questions are being asked whether the country will polarise into an Akan--non-Akan divide. The distribution in parliament is not very skewed, although the Akan enjoy a slight advantage. Akan dominance is not prominent in the six civil service institutions surveyed. The third and fourth groups (Ewe and Ga) are over-represented. In Kenya, despite the relative equality of five groups, only two, the Kikuyu and Kalenjin, have been able to construct winning coalitions. When Kenyatta was in power (1963-78), the Kikuyu in alliance with the Meru and Emba dominated the public sector; and when Moi took over and ruled from 1978-2002, the Kalenjin (fourth largest group) became dominant. Between 1963 and 1978, the Kikuyu accounted for an average of 29% of cabinet posts even though they were only 21% of the population. Among the other large groups only the Luo (early allies in the formation of KANU) had a share (14%) that was fairly proportional to its population share (14%). The Luhya who were 13% had a share of 8%. That of the Kamba (11% of the population) was 9%; and the Kalenjin (11%) 6%. Interestingly, much smaller groups performed better. The distribution changed dramatically during Moi’s rule. Between 1979 and 2001, the percentage of Kikuyu in the cabinet dropped sharply: from 29% under Kenyatta to 14% under Moi. The average was worse during the period of multiparty rule (1994-2001) when it dropped to 4%. The Kalenjin assumed dominance and were over-represented (14%) relative to their population size (12%). They greatly increased their share during the 1994-2001 period of multiparty rule to 19%. The share of individuals of Luo ethnicity dropped to 10% against a population share of 11% for the period. It was 4% during 1994-2001. The share of the Luhya rose sharply to 13%, which was fairly proportional to its population share for that period (14%). Their share of 16.5% was higher during the period of multiparty rule (1994-2001). The cabinet share (11.34%) of the Kamba group (10.3%) also improved under Moi. There were no presidential candidates from the Kamba and Luhya during the 1992 elections – suggesting an alliance with Moi. This unequal and fluctuating distribution pattern is observable in the civil service. During the Kenyatta period (1963-78), 31% of permanent secretaries were Kikuyu, and there was no Kalenjin permanent secretary. Of the remaining three major groups, the Luo had a share of 12%, the Luhya 9% and the Kamba 13%. The Kalenjin assumed dominance under Moi (1978-2001), accounting for 21.6% of permanent secretaries. It was 30% during multiparty rule (1994-2001). The share of the Kikuyu dropped to 20%. Between 1994 and 2001, the Kikuyu share was only 10%. The share of the Luhya was 12%; that of the Kamba was 10%; and the Luo 7%. Data for ambassadorial postings also indicate similar trends, with the Kikuyu and Kalenjin assuming dominance depending on who the president was. The data for parliamentary representation suggest that the Kalenjin and related groups (Masai, Turkana and Samburu) are over-represented. This was largely due to the
Overview of Research Findings and Policy Issues
40
colonial policy that favoured these groups against the militantly organised Kikuyu and Luo groups during the anti-colonial struggles. Despite being less than 12% of the population, the former groups accounted for about 20% of parliamentary seats by 1993. The electoral reforms under Kenyatta largely favoured the Kikuyu. The Kalenjin and related groups continued to enjoy a share of parliamentary seats that was much higher than their population shares. The Luo, Kamba and Luhya were under-represented. The situation was largely unchanged under the Moi regime. The Kalenjin-dominated KANU won the 1992 and 1997 elections with 36% and 40% respectively of the popular vote. During the 2002 elections, politicians from non-Kalenjin groups formed a broad based coalition for the first time and succeeded in ousting KANU from power. The electoral pact required the president, a Kikuyu, to share cabinet posts equally among politicians of the four main ethnic groups that had opposed KANU. The Kikuyu, Luo and Luhya each got 16% of the cabinet appointments, and the Kamba 12%. The Kalenjin lost out: 4%. Even smaller groups, such as the Meru and Mijikenda that were part of the alliance, fared better than the Kalenjin. They each got 8% of the posts. As in the past, many smaller groups were rewarded with posts of “assistant minister”. However, the old GEMA alliance (Kikuyu, Embu and Meru groups) under Kenyatta is reasserting its dominance in the civil service. This alliance accounts for 44% of permanent secretaries even though its combined population strength is less than 25%. Serious cracks have appeared in the larger alliance as the Kikuyu-led GEMA group is accused of not honouring pre-election commitments to distribute strategic posts to allies. In India, redistributive policies were introduced to tackle long-standing structural forms of exclusion of certain groups in the public sector. The policies reserve 15% of parliamentary seats to Scheduled Castes and 7.5% to Scheduled Tribes. The policy does not apply to Muslims, who have been under-represented in parliament (5.15% in 1991; an average of 5.95 in 10 the parliaments from 1952-1991). This under-representation is largely due to the lack of geographical concentration of Muslims. The share of Scheduled Castes (14.18%) and Scheduled Tribes (7.36%) in parliamentary seats in the 1991-96 parliament was proportional to the quotas, suggesting that Scheduled Tribes and Scheduled Castes have been unable to win seats in the open constituencies. This pattern is fairly the same for other parliaments. The data show that individuals of Upper Caste background constitute 50% of MPs even though they are less than 20% of the population. They also dominate most mainstream parties, including the Congress Party. Unlike its parliamentary representation, Muslim representation (10.76%) in the Union cabinet has been fairly balanced with respect to its population size. However, in the 1990s when the Hindu revivalist parties have been able to form governments, the share of Muslim representation dropped to 3%, and that of Hindus rose to more than 90%. Upper castes have accounted for an average of 63.29% of cabinet seats in the 15 parliaments from 1947-1990. Scheduled Castes account for 8.86% and Scheduled Tribes 0%. During the 1990s, the share of Backward Castes rose to 19.63% that of Upper Castes dropped to 58.28%. Scheduled Castes (with 7.36%) failed to improve their average despite the prevalence of caste-based parties. However, Scheduled tribes gained access to the cabinet for the first time: 3.68%. In terms of regional or ethno-linguistic cleavages, the study shows that 7 to 11 ethno-linguistic groups have been represented in most cabinets, while 14 groups have, at one time or another, been
Overview of Research Findings and Policy Issues
41
represented. Hindi speakers account for 30% to 40% of the total, which broadly reflect their population share. The reservation policy for Scheduled Castes and Scheduled Tribes applies to the civil service. Since 1994, the combined total of the Scheduled Castes, Scheduled Tribes and Backward Castes have accounted for at least 55% of the total recruitment figures in the union civil service. The figure appears to have stabilised around 60% in 1997-99 for which data are available. Despite these impressive figures, the data also suggest that suitable candidates are not always available to fill reserved vacancies in jobs that demand specialised or technical qualifications. Furthermore, Scheduled Castes and Scheduled Tribes are mostly concentrated in the lower echelons of the bureaucracy as office boys and clerks. 44% of civil servants of Scheduled Caste background are sweepers. They account for 87% of employees in that sector of the public service. In contrast, Scheduled Castes account for only 8.4% of Class I civil servants.
Fragmented multipolarity: Papua New Guinea and Tanzania In fragmented multipolar settings, no group is large enough to organise selective coalitions for hegemony under democratic conditions. Mainstream parties are likely to be multiethnic. It is even possible for a single party to appeal across the ethnic divides and win a majority of the votes. Ethnic loyalties and conflicts may instead be localised, implying that the central government may be able to assume a neutral status as mediator. Papua New Guinea is the most ethnically fragmented country in the world. Its population of 5 million is divided into 917 ethno-linguistic groups. The relative population share of the largest group is 1.6%, the second largest is 1.1% and the third largest is 0.86%. The population share of the three largest groups is thus less than 4% of the population. This implies that no one group is large enough to dominate the public sector. Political parties that compete for public offices are multi-ethnic and broad-based. There is relative balance in the “representation” of ethnic groups in parliament, political parties, the cabinet, and the civil service. However, the party system is weakly institutionalised, individuals enjoy more importance than parties in electoral politics, and there is some socio-economic inequality between regions and provinces, implying that some ethnic groups are better endowed than others. Even though there is no ethnic domination in the public sector, competition for access to the public sector is highly ethnic as voters support clansmen and women rather than parties. However, parties account for a larger share of parliamentarians than independent candidates. Much of the ethnic conflict is localised. There has been a high number of candidates (many of whom are independent), high turnover of governments, and local violence. The electoral system of first past the past and the parliamentary system of government in which MPs can become ministers by switching sides may account for this outcome. PNG has 4 regions and 19 provinces. The Highland region is the most populous (1.9 million), followed by New Guinea mainland or Momase (1.4 million), Papua (1.04 million) and New Guinea Islands (741,238). Southern Highlands and Morobe are the most populous provinces, with each accounting for about half a million inhabitants. There are at least 40 language groups in each province. Ethnic conflicts are more prevalent in the Highland region, which is the most populous, resource-endowed, and
Overview of Research Findings and Policy Issues
42
developed. There are conflicts over land and representation in provincial governments. However, the study suggests that no one single ethnic group dominates any of the 19 provincial governments. Polarisation has largely occurred in the region of Bougainville whose ethnic groups believe they have different “racial” identities, customs and historical experiences from the rest of the country. Papua has a 71.1% literacy rate, New Guinea Islands 76.1%, Momase 54.2% and the Highlands 38.2%. Coffee and cocoa are grown mainly in the Highlands and New Guinea islands respectively. There is a general perception throughout the country that growers and producers from the Highlands, and East and West New Britain provinces are likely to make more income from their produce and exports than growers and producers say from Momase and Papuan provinces. For reasons relating to structural problems of the PNG economy and fluctuations in world market prices of PNG exports, there will always be inequalities in household incomes among Papua New Guinea groups. The data suggest that producers and exporters of coffee, oil palm and cocoa enjoyed higher incomes than those of copra, rubber or tea (1991-2001). For every K87 earned by a copra-producing household, a household producing coffee is likely to earn K1338 – 15 times more. Some ethnic groups generate household income from two or more cash crops of income yield such as cocoa and coffee. Generally speaking, the Highlands and New Guinea Highlands people enjoy higher levels of income than those from Momase and Papua regions. Resource endowment correlates with incomes, education and employment opportunities, suggesting inequalities among groups. However, these inequalities and ethnic population sizes are not reflected in the composition of the public sector. None of the three “large” groups is in the current cabinet. And individuals from more affluent regions have not dominated parliament, the cabinet or the civil service. The composition of parliament reflects the population distribution in the regions and provinces: the Highlands region accounts for 36%, Momase 26.7%, Papua 22% and New Guinea Islands 15.6%. The cabinet has also shown much diversity. There are 9 Momase, 7 Highlands, 6 Papuan and 5 New Guinea Islanders in the cabinet. Morobe, Madang and East New Britain provinces each has three members; East Sepik, Bougainville, Enga, Central and Southern Highlands each has two each; and Milne Bay, Oro, Gulf, Chimbu, Western Highlands and National District Capital have one each. A few provinces are not represented. As Table 7 shows that the largest ethnic group has only a 4% share of cabinet posts in the current government; the second and third ethnic groups are not even represented. Heads of government or civil service departments also show much diversity. None of the three largest groups is represented in the current top layer of the civil service. One important feature of PNG is the seeming importance of individuals over parties and the instability of governments. The average number of candidates per electorate has increased consistently from 5.5 in 1964 to 26 in 2002. With such a large number of candidates competing under first past the post electoral rules, winning candidates get elected by an increasingly small proportion of votes in their respective electorates. In 2002, 15% of seats were won by MPs with less than 10% of the popular vote; 37% was won by MPs with 10% - 19% of the vote; 16% was won by MPs with 20-29% of the vote; 10% by those with 30-39% of the vote; and 3% was won by MPs with 40%-49% of the vote. Only 1% of MPs had more than 50% of the votes in their
Overview of Research Findings and Policy Issues
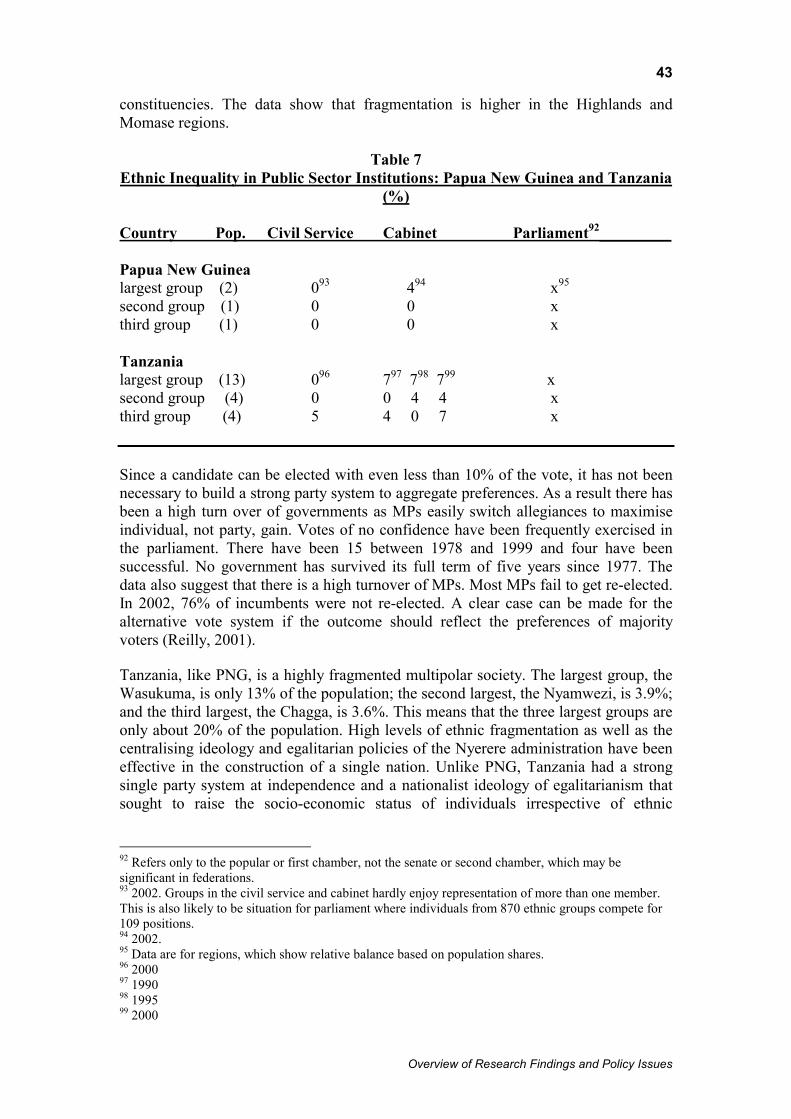
43
constituencies. The data show that fragmentation is higher in the Highlands and Momase regions.
Table 7 Ethnic Inequality in Public Sector Institutions: Papua New Guinea and Tanzania
(%)
Country Pop. Civil Service Cabinet Parliament92_________ Papua New Guinea largest group (2) 093 494 x95 second group (1) 0 0 x third group (1) 0 0 x Tanzania largest group (13) 096 797 798 799 x second group (4) 0 0 4 4 x third group (4) 5 4 0 7 x Since a candidate can be elected with even less than 10% of the vote, it has not been necessary to build a strong party system to aggregate preferences. As a result there has been a high turn over of governments as MPs easily switch allegiances to maximise individual, not party, gain. Votes of no confidence have been frequently exercised in the parliament. There have been 15 between 1978 and 1999 and four have been successful. No government has survived its full term of five years since 1977. The data also suggest that there is a high turnover of MPs. Most MPs fail to get re-elected. In 2002, 76% of incumbents were not re-elected. A clear case can be made for the alternative vote system if the outcome should reflect the preferences of majority voters (Reilly, 2001). Tanzania, like PNG, is a highly fragmented multipolar society. The largest group, the Wasukuma, is only 13% of the population; the second largest, the Nyamwezi, is 3.9%; and the third largest, the Chagga, is 3.6%. This means that the three largest groups are only about 20% of the population. High levels of ethnic fragmentation as well as the centralising ideology and egalitarian policies of the Nyerere administration have been effective in the construction of a single nation. Unlike PNG, Tanzania had a strong single party system at independence and a nationalist ideology of egalitarianism that sought to raise the socio-economic status of individuals irrespective of ethnic
92 Refers only to the popular or first chamber, not the senate or second chamber, which may be significant in federations. 93 2002. Groups in the civil service and cabinet hardly enjoy representation of more than one member. This is also likely to be situation for parliament where individuals from 870 ethnic groups compete for 109 positions. 94 2002. 95 Data are for regions, which show relative balance based on population shares. 96 2000 97 1990 98 1995 99 2000
Overview of Research Findings and Policy Issues
44
background. Ethnic politics was outlawed and Swahili promoted as the national language. The ruling party had effective presence in all regions of the country. When multiparty politics were allowed in the 1990s, most parties were multiethnic, and fragmentation did not encourage proliferation of independent candidates. Most studies underscore the lack of potency of ethnic identity and behaviour in Tanzania because of the high levels of ethnic fragmentation and deliberate state policies of nation building. Political parties are multi-ethnic and there has been relative ethnic/regional balance in the composition of the civil service, parliament and cabinet since independence. Because of this relative balance, electoral rules for managing cleavages and inequality have not been relevant in the Tanzanian discourse. Tanzania practices the first-past-the-post electoral system. Even though this is majoritarian, the multiethnic character of the ruling party means that ethnic groups/regions have not been excluded in parliament and the cabinet. Indeed, it has been possible for a single party to win an overwhelming majority of the votes –as the ruling CCM has done since multiparty elections were introduced in the early 1990s. Voters do not vote ethnic, although one or two opposition parties win most of their seats from regions where their leaders come from. The egalitarian policies of the first 20 years of independence treated ethnic groups/regions equally in the provision of services (education, health, water, etc.) and there were no sharp income inequalities, with the country posting a Gini coefficient of 0.34. At independence, the regions of some ethnic groups -- such as the Chagga, Haya and Nyakyusa -- were significantly better endowed and more developed than the others. They produced most of the cash crops, such as coffee and tea. During the immediate aftermath of independence, they also provided the largest number of educated people and constituted the new elite. However, this relative socio-economic advantage did not translate into political advantage at the national level. The largest and second largest groups are not represented at the top layer of the current civil service. It is rare for an ethnic group to have more than one member at the top cadre of the civil service and cabinet. In the 1990 cabinet, for instance, as Table 7 shows, the largest group had only 7% of the posts, the second largest none, and the third largest 4%. A similar distribution obtains for the 1995 and 2000 cabinets, except that the second largest group increased its share from 0 to 4%; the third largest group was not included in the 1995 cabinet but got 7% of the total in 2000. Given the small number of cabinet and top civil service posts available at any given time, the figures 7% and 4% actually represent one or two positions. The distribution is very balanced. Polarisation has largely occurred in the small island of Zanzibar between Africans and Arabs and in conflicts between indigenes and Indians in the privatisation of public assets. Institutional and policy reforms Perhaps the key issue in ethnicity and governance is not the existence of inequalities per se, but how they are managed (Cramer, 2003a,b). Are inequalities managed fairly and democratically? Are policy makers sensitive to the issue when they advance development policies? Is there some consensus on redistribution? Are there prospects for improving the opportunities of excluded groups even if present levels of inequalities are high? Will additional policies be needed to avoid a backlash from dominant groups? It is worth pointing out that absolute equality, whether of the individual or group type, is unachievable – perhaps even undesirable. Individuals may
Overview of Research Findings and Policy Issues
45
have conflicting preferences; perfect equality may conflict with other societal objectives; and inherited endowments may be difficult to equalise (Stewart, 2000). The goal, instead, should be the reduction of inequality, the promotion of inclusiveness and the management of group differences. Development policy analysts, conflict management theorists, and policy makers have suggested various reforms to resolve the problems of exclusion, inequality and instability that affect ethnically plural societies. This section addresses five of these reforms: redistributive policies; incentives for majoritarian and power sharing outcomes; federalism and decentralisation; and minority rights. Proportionality and redistribution An index of ethnic proportionality We develop an index of proportionality to analyse the extent to which the public sectors of our 15 countries are ethnically balanced or proportional. The index is calculated by using the relative post share of the dominant group in each of the three public institutions divided by its relative population share. For example, the relative post share of the dominant German group in Switzerland’s civil service for all personnel in the 1990s is 71.5%. The relative population share of Germans is 73.4%. Dividing 71.5% by 73.4% gives us an index of 0.97. An index of 1.00 represents perfect proportionality. This is obtained, for instance, in the case of the parliament in Belgium. Proportional representation electoral rules and ethnic-based parties have produced this outcome. The Dutch population share of 60% is reflected in the composition of the parliament. An index of less than 1.00 indicates under-representation of the dominant group and over-representation of minority or non-dominant groups. The Tswana in Botswana, for instance, are 70% of the population but account for only 58% of cabinet posts in 2000. This gives an index of 0.82, suggesting strong minority representation in the cabinet. An index of more than 1.00 indicates that the dominant group is over-represented and non-dominant groups or minorities are under-represented. The extent of over-representation is determined by the two variables used to construct the index: population share and post share. It will not reveal the true nature of inequalities in highly unipolar settings even if the dominant group totally excludes minorities. For instance, ethnic Lithuanians constitute 83% of the population and 100% of the current cabinet, yielding an index of 1.20. On the other hand, if the population share of the dominant group is low and its post share is high, the index will be very high. An example is Trinidad and Tobago. The Afro-Creole group is only 39% of the population but accounts for 62.5% of cabinet posts, yielding an index of 1.60. The index does not correctly reveal the balanced nature of the institutions of fragmented multipolar ethnic settings. In these kinds of societies, most groups are not likely to be represented in an institution at any given time. Even if no single group has more than one member in an institution, the index will be very high because of the limited number of posts available for the country’s numerous groups. For example, the Tolai in Papua New Guinea are the only ethnic group that accounts for two out of 29 cabinet posts in the current government. All other groups in the cabinet account for
Overview of Research Findings and Policy Issues

46
Table 8: Ethnic Proportionality in Public Sector Institutions Typology Proportionality Index100 ____________________
Civil service Parliament Cabinet Unipolar ethnic settings Botswana 0.71101 0.87 0.82 Lithuania 1.16 1.10 1.20102 _____________________________________________________________________ Bipolar ethnic settings Fiji 1.22103 1.10 1.76 Trinidad and Tobago 1.10 1.38 1.58 Belgium 0.83104 1.00 0.83105 Latvia 1.59106 1.36 1.72 _____________________________________________________________________ Tripolar ethnic settings Bosnia 1.00 1.18 0.75107 Switzerland 0.98 1.01 0.78 Malaysia 1.10 1.20 1.30 Nigeria 0.63108 x 1.00 _____________________________________________________________________ Concentrated multipolar ethnic settings Ghana 0.88109 1.16110 1.51 Kenya 2.10111 1.67 0.76 India (2.38112)(0.92113) (2.82114)(0.98115) (3.32116)(1.05117) _____________________________________________________________________ Fragmented multipolar cases Papua New Guinea x x x (no dominant group) Tanzania x x x (no dominant group) 100 See Appendix 3 for a discussion of the proportionality index. 101 This figure is based on 80% of senior administrative posts. 20% of the posts are unconfirmed. Tswana hold 40% of the posts; the Kalanga, the second largest group (11% of the population) hold 24%. 102 Data are for state secretaries of all ministries. 103 Data are for permanent secretaries, deputy secretaries and chief administrative officers. 104 Strict party is enforced for all positions of director level and above. This gives the French minority an advantage. However proportionality applies for posts below director level. 105 Equality, not proportionality, determines cabinet formation. The French minority are advantaged. 106 Data are for 10 ministries with 1,673 employees. 107 Equality principle is applied. Bosniaks (Muslims), the largest group, are disadvantaged. 108 Data are for ethno-political zones, not individual ethnic groups. The Southwest zone is dominant. 109 Data based on eight ministries and agencies. 110 Available data are for regions. There is relative proportionality in regional representation. 111 Data are for permanent secretaries for the period 1979-2001. 112 Data for ethno-linguistic disproportionality not yet collected, but data on regional representation show relative balance for civil service, parliament and cabinet. Figure above refers to caste disproportionality. 113 Figure refers to religious cleavage 114 Figure refers to caste cleavage. 115 Figure refers to religious cleavage. 116 Figure refers to caste cleavage. 117 Figure refers to religious cleavage.
Overview of Research Findings and Policy Issues

47
one post each. The Tolai are not one of the three largest groups, which, as we have seen, account for less than 4% of the population. If we assume that the Tolai’s population share is 0.5% (the third largest group is 0.86%), the proportionality index for this group will be 14.00 – a rather bizarre result. The data suggest that all the groups in the top layer of the civil service have only one member each. No individual from the three largest groups is on the list. A share of one post out of 28 for any one of the groups (say one with 0.5% of the population) will produce another bizarre index of 7.14. In most of our cases, the dominant group is the most numerous. However, in Trinidad and Tobago, the dominant group is the second largest. The dominant group may not always be the same group for all three institutions. The index works best when there are only two groups: under/over-representation of the dominant group is equal to the over/under representation of the other group. When groups are many, using the dominant group as a proxy does not reveal the inequalities between the non-dominant groups. It only reports the inequalities between the dominant group and the non-dominant groups as a single group. The challenge is to construct an index that is sensitive to the relative proportionality/disproportionality of all groups. The data used for the civil service is not uniform across countries. In some cases, only senior service posts are used to determine the relative share of posts between groups. The index uses only data for the current distribution of posts. It is not sensitive to historical trends in the composition of the institutions. Redistributive policies If the public sector is to function effectively and enjoy widespread legitimacy, all groups in society must feel a sense of belonging, representation and shared interest in the institutions that govern their lives. Policies that aim to achieve proportionality assume several forms. Some are clearly redistributive in the sense that disadvantaged groups gain at the expense of those previously advantaged either in the public or private sector (Malaysia, India); other policies do not single out any particular group for upliftment but are strongly sensitive to proportionality (Nigeria, Belgium, Switzerland, Bosnia-Herzegovina). Some policies cover both the public and private sectors (Malaysia); others are restricted to the public sector (India and Nigeria); and still others target specific public sector areas. Public policy in many of our cases is sensitive to proportionality but use informal methods (Botswana, Ghana) to promote it. Our study suggests that it is difficult to achieve proportionality in the public sector if policies are not oriented towards it. Even a cleavage-neutral policy, such as merit-based recruitment, may produce unequal outcomes because of the unequal starting points of groups. The Kalanga in Botswana, who are only 11 percent of the population, accounted for more than 30% of senior civil service jobs in the first 10 years of independence because of early advantages in education. Even in 2003, their share of these jobs was still 24%. Botswana however shows high levels of inclusiveness in its public institutions because of ethnicity-sensitive policies. As Table 8 shows, relative balance has been achieved only in countries that are highly fragmented (Papua New Guinea and Tanzania) or those with ethnicity-sensitive policies that are oriented towards high levels of proportionality (Belgium,
Overview of Research Findings and Policy Issues
48
Switzerland, Bosnia-Herzegovina). India, Malaysia, Nigeria, and Ghana have achieved some proportionality in some institutions because of ethnicity-sensitive policies. The remaining cases display varying levels of inequality and weakly structured or non-existent policies to promote balance. The studies suggest that it is easier to correct socio-economic and public sector inequalities if an economy is growing, the target population has strong access to policy making institutions, and the redistributive policy is part of a wider developmental strategy that seeks to transform the economy and eliminate poverty irrespective of ethnic origin (Malaysia). Proportionality and redistributive policies may be controversial and non-sustainable when economies are not growing, and the fundamental inequalities, especially in education, are not narrowing, despite redistribution. This may give rise to accusations of bias by those who think they are better qualified than the target group (Nigeria). Problems may also arise when contributions to the central pool from the various groups are perceived as not only unequal, but that beneficiaries from weaker groups are not making efforts to narrow the gaps (Belgium, Nigeria). When there is relative equality in the society and the economy is growing, absence of a centrally directed equalisation policy may help diffuse problems of bias or subsidy (Switzerland). Redistributive policies that depend on the choices of majority groups may be unsustainable if the majority public turns against them (USA: not in our cases). It is easier to correct inequalities in institutions that are shaped by electoral politics (parliament and cabinet) than in the public bureaucracy. If parties are ethnic, citizens vote ethnic, and the electoral district is not homogenous or minorities are dispersed rather than geographically concentrated, PR could serve the purpose of ensuring relative balance in the composition of legislatures. However, if the electoral district is homogenous or minorities are concentrated geographically, even first-past-the-post rules could achieve some degree of balance. Achieving balance in the cabinet could depend on the nature of the party system and whether the political regime is presidential or parliamentary. In parliamentary systems, recruitment into cabinet is limited to parliamentarians. If a parliament is already skewed in favour of a particular group or groups, this may be reflected in the cabinet. More importantly, if parliamentary parties are ethnically differentiated, or if one ethnic group votes overwhelmingly for a party that is not in the government, the outcome will be unbalanced. The Ghana study shows that this happened during Busia’s rule in the late 1960s. The Ewe, the third largest group, was not represented in the government because the ruling party did not have an Ewe MP. This outcome poisoned ethnic relations between the Ewe and the Ashanti, the perceived base of the ruling party. A presidential system, on the other hand, may allow for a selection of members who are not members of parliament into the cabinet. A ruling party may perform poorly among a particular ethnic group and yet appoint individuals from that group into the cabinet to ensure balance. A good example is the Nigerian election of 1999 in which the ruling party failed to win parliamentary seats in the Western region. Individuals from that region were, however, richly rewarded in the government. Consociations, such as Belgium, Switzerland, and Bosnia, which have produced high levels of proportionality, are mixed systems.
Overview of Research Findings and Policy Issues
49
Majoritarian rule and power sharing
Studies on ethnicity and governance reforms have produced two competing policy frameworks for managing plurality: majoritarian reforms that encourage vote pooling and moderation, while also supporting adversarial politics; and consociational or power sharing arrangements that accommodate the ethnic divisions. The first type of reforms seeks to promote plurality within the party systems by encouraging political actors to seek votes outside of their traditional ethnic strongholds. Under this arrangement, parties, in a sense, may become ethnic coalitions rather than ethnic parties. The maximisation of votes may encourage parties to work with individuals from other ethnic groups and de-emphasise the role of ethnicity in politics. Even though the end result is to have a majoritarian outcome, or a government composed of only one party, the fact that all electable parties are ethnic coalitions means that the governments will be plural and may not discriminate against particular ethnic groups. The main electoral system that has been advanced for the emergence of plural cross-ethnic parties is the alternative vote or “preference vote” (Farrell, 1997), in which voters are asked to rank the candidates on the ballots, using the symbols 1, 2, 3, 4 and so on, where 1 represents their favourite choice, 2 their second best, 3 their third best, etc. If no candidate receives more than 50% of the votes on the first count, the last candidate is eliminated and his/her second preference votes are transferred to the remaining candidates. The process is repeated if no candidate scores more than 50% in subsequent rounds of counting, until a winner emerges.
Preference voting is voter empowering as it allows the electorate to reward candidates who advance issues other than those of their core group or party. It forces candidates to adopt centrist positions since their chances of winning elections depend on their ability to appeal to a wide range of concerns. Candidates who advance ethnically extremist positions may, of course, win first preference votes but this may not be enough to get them elected. Even though the initial reason for the creation of this electoral system was to enable relatively homogenous societies elect candidates with a majority of the votes in a constituency, Donald Horowitz ( 1985, 1990, 1991) has forcefully revived the alternative vote in debates on governance reforms of ethnically plural societies. Horowitz is very critical of the power sharing system, which he believes gives too much power to elites or ethnic entrepreneurs, traps countries in primordial ethnic politics, and offers no rewards or incentives for politicians to build cross-ethnic alliances.
The second type of governance reforms – consociation or power sharing -- accepts ethnic-based parties as given and seeks to promote plurality not within the contending parties but at the governmental level itself. Arthur Lewis, the Caribbean Nobel Laureate economist for 1979, developed the early building blocks for the theory of consociation. Lewis was very critical of majoritarian and adversarial politics in multi-ethnic societies. As he explained it, “to exclude the losing groups from participating in decision-making clearly violate the primary meaning of democracy”. His book, Politics in West Africa (1965), written at the dawn of African independence, condemned the one party system of government and the Westminster model of adversarial, zero-sum or majority rule politics. He advocated inclusive coalitions (to be made up of parties that secure at least 20% of the votes), decentralization, federalism, and an electoral system of proportional representation (the single transferable vote that encourages both proportionality and sensitivity to others) for the
Overview of Research Findings and Policy Issues
50
governance of West African societies (Lewis, 1965; Premdas, 1991). The Nigerian political scientist, Claude Ake, in his A Theory of Integration (1967), further developed the central idea of elite consensus. Ake favoured consensual, power sharing arrangements among the key elites of society, even though he did not develop democratic mechanisms to guide the formation of such consensus.
The leading advocate of consociation today is the Dutch political scientist, Arend Lijphart (1977, 1985, 1990, 1999). In Lijphart’s schema, a consociation has four key elements: a government of national unity, or a grand coalition, which should reflect all the key segments of society; proportional distribution of public sector jobs; a high degree of territorial autonomy – federalism or decentralisation -- for groups that opt for it; and a minority veto on the most important issues. Underpinning Lijphart’s consociation model is the electoral system of proportional representation (the list type). Under this system, a country may be divided into one single constituency or very large electoral districts. It seeks to ensure that popular votes gained are proportional to the seats allocated in parliament. The electorate votes for parties and not for individuals. The parties draw up a list of ranked candidates, corresponding to the number of seats to be filled. Seats are allocated according to the proportion of votes gained by each party and are filled by candidates in descending order of preference on each list.
The list type proportional representation system will encourage all key segments to be sharply defined as groups that feel alienated from the political process may form their own parties to gain some representation in parliament, the government and the civil service. The behavioural properties of the List PR system draws on an established theory in political science that was first developed by the French political scientist, Maurice Duverger (1986). The Duverger Law establishes a strong correlation between the nature of electoral systems and party systems, with the electoral system being the independent variable. According to this law, proportional representation produces many independent parties; and plurality rules or first-past-the-post rules produce a two party system. There have been several refinements of this theory, such as the influence of the district magnitude in determining party proliferation and proportionality, and the roles of geographical concentration and ethnic cleavages in encouraging party fragmentation even under plurality rules (Odeshook and Shvetsova, 1994; Moser, 1999; Mozaffar, et al, 2003)118.
However, most scholars of electoral systems would agree that, generally, there are strong incentives for small parties to be formed under proportionality than plurality rules. Under proportionality rules, segmented and polarized societies may throw up many parties to reflect the segments. For instance, when New Zealand changed its electoral system from first-past-the-post to the List PR system in its 1996 general elections, the country was transformed immediately from a two-party system to a multi-party system, with six parties gaining representation in parliament. The consociational model is inclusive rather than adversarial. It seeks to avoid winner-takes-all, majoritarian or zero-sum arrangements in governance. It is the most popular
118 Mozaffar et al’s article provides insightful analysis of how Africa’s fragmented multiethnic societies encourage coalition governments and limit the number of political parties. They argue, however, that moderate levels of fragmentation in situations where ethnic groups are geographically concentrated will increase the number of parties.
Overview of Research Findings and Policy Issues
51
policy instrument by international negotiators and peacemakers in contemporary war-torn societies.
What are the merits of the two policy frameworks? The main governance institutions in politics are constitutions, parliaments, cabinet, bureaucracies, party systems, courts, and electoral systems. Lijphart (1999) has established strong empirical links between types of electoral arrangements, party systems, and cabinet government. The two policy frameworks seek to change the composition or behaviour of these institutions through electoral rules. The consociation model goes further by incorporating other far-reaching institutional changes that stipulate how governments and bureaucracies should be constituted. Like all institutions, constitutions are incomplete contracts: they leave scope for policy acts (Dixit, 1998). The consociation model, for instance, stipulates how governments should be formed but not who will get what post or how members should behave when they are in government. Both frameworks are strong on access but weak on accountability. Accountability under the alternative vote is largely about getting politicians to behave in non-ethnic ways, while under the consociation model it tends to be restricted to how well political parties pursue the narrow interests of their segments. It is useful to review some of the debate about the efficacy of these two policy frameworks for managing conflicts in ethnically segmented societies. There are four contending lines in the debate.
The first is whether electoral reforms can offer adequate incentives for politicians to substantially change their behaviour and pursue moderate policies, or whether additional or different incentives are needed that will guarantee politicians basic rights in the seat of power irrespective of their minority status. The evidence here is ambiguous: there are merits and problems in both systems. The alternative vote can, indeed, encourage politicians to pursue moderate policies, but this can only happen if the constituencies are mixed, or if, as Horowitz himself notes, the entire country is taken as a single constituency. In homogenous settings, voters will elect candidates from the same ethnic group even if they belong to different parties. However, by producing majoritarian outcomes, the alternative vote system may exclude from government key politicians of other groups, who may decide not to play by the rules since they may have no opportunity to be in government. In addition, even though it may allow governing parties to get votes from regions other than their core areas of support, a large number of voters from other regions may not vote for the governing party. Farrell (1997) notes in the case of the Hume constituency in Australia that in the 1993 elections, 46% of voters did not support the winner under the alternative vote system.
A second line of disagreement is the extent to which voters are empowered or disempowered by both policy frameworks. On this score, the evidence suggests that voters have greater leverage in influencing the behaviour of politicians under the alternative vote system than in the consociational model, which is explicitly elitist. Indeed, the list PR system of the consociational model may weaken the accountability of parliamentarians to their electorate and strengthen party, or indeed leaders’, control over parliamentarians. It may encourage formation of political oligarchies, secrecy in inter-party negotiations, and authoritarian control of the democratic process (Premdas, 1991; Daadler, 1974; Lustick, 1979). Authoritarian-inclined party leaders can exploit the list PR system to their advantage: if an MP is expelled from a party, such an MP may find it difficult to remain in Parliament, since he/she owes his/her parliamentary
Overview of Research Findings and Policy Issues
52
status to the party. In Sierra Leone, for instance, the leader of the second largest party in the 1996 parliament, the United National People’s Party, expelled more than 80% of his MPs from the party in 1996, and demanded that other members in the party list replace them in parliament. The expelled MPs colluded with the leading party, the Sierra Leone People’s Party, to block the expulsion and instead suspended the UNPP leader from parliament. The tensions generated by this crisis fed into the politics of the military coup of 1997 as both factions of the party took different sides in the confrontation between the ousted government and the military junta (Bangura, 2000).
A third line of contention concerns the practical use of the electoral instruments of the two policy frameworks: can all types of voters readily use them? Since the alternative vote requires ranking of candidates, it may be difficult to apply it in societies with low levels of literacy. One can only get round this problem if the ballots for the first, second and other choices are given different colours and voters are asked to put them in different boxes, or the boxes are arranged in a ranked way. It may require a high level of voter education to avoid a large number of wasted votes. Vote counting can take a much longer time than usual. In the Fiji elections of 1999, counting took three days since all ballot boxes have to be in a central location before the count. For a country of dispersed islands, such as Fiji, centralization of boxes delays the counting process. There were also an unusually high number of wasted votes -- 17.3% -- which underscored the point that voters did not fully understand the system. A high number of wasted votes were also recorded in the London local elections of May 2000 and 2004.
A fourth area of contention is the issue of strong government. It is difficult to resolve this issue since both systems have different visions of strong government. The alternative vote system is majoritarian: it promotes moderation but may end up excluding some groups from government who may undermine the government. In sharply polarized situations, voters may even decide not to reveal second order preferences or boycott the elections altogether. The consociational system is proportional and opts for inclusiveness. This may lead to stable, but not necessarily strong, government.
A major pitfall of the debate on governance, electoral systems design and ethnicity is the tendency to see the reform instruments as dichotomies. It also assumes that the policies will work in the same way in every ethnically plural society. Actually, in Lijphart’s first book on consociation, The Politics of Accommodation (1968), which focused on the Dutch experience, and his subsequent book, Democracy in Plural Societies (1977), in which he tried for the first time to apply the concept to a large number of countries, clear conditions were set for the successful operation of a consociation. The model was restricted to small countries with a limited number of ethnic groups (not exceeding five) and mutually reinforcing deep-seated cleavages. As Lane and Errson (2000: 208-210) have pointed out, Lijphart’s subsequent writings, especially those of the 1990s, adopted a much more assertive and undifferentiated line of argument: power sharing is better than majoritarian government irrespective of the social structure. One encounters a similar problem with Horowitz’s writings. In his seminal 1985 book, Ethnic Groups in Conflict, Horowitz analysed several electoral systems and
Overview of Research Findings and Policy Issues
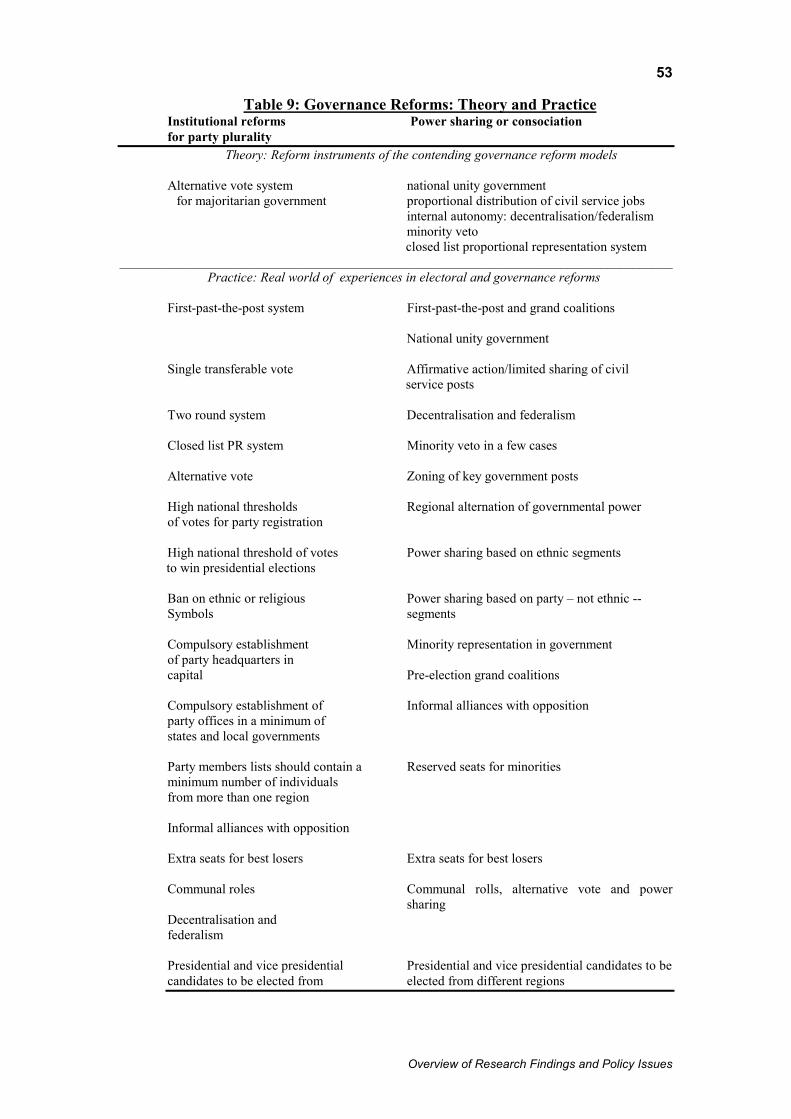
53
Table 9: Governance Reforms: Theory and Practice Institutional reforms Power sharing or consociation for party plurality Theory: Reform instruments of the contending governance reform models Alternative vote system national unity government
for majoritarian government proportional distribution of civil service jobs internal autonomy: decentralisation/federalism minority veto closed list proportional representation system
___________________________________________________________________________________ Practice: Real world of experiences in electoral and governance reforms First-past-the-post system First-past-the-post and grand coalitions
National unity government
Single transferable vote Affirmative action/limited sharing of civil
service posts
Two round system Decentralisation and federalism Closed list PR system Minority veto in a few cases Alternative vote Zoning of key government posts High national thresholds Regional alternation of governmental power of votes for party registration High national threshold of votes Power sharing based on ethnic segments
to win presidential elections Ban on ethnic or religious Power sharing based on party – not ethnic -- Symbols segments Compulsory establishment Minority representation in government of party headquarters in capital Pre-election grand coalitions Compulsory establishment of Informal alliances with opposition party offices in a minimum of states and local governments Party members lists should contain a Reserved seats for minorities minimum number of individuals from more than one region Informal alliances with opposition Extra seats for best losers Extra seats for best losers Communal roles Communal rolls, alternative vote and power
sharing Decentralisation and federalism Presidential and vice presidential Presidential and vice presidential candidates to be candidates to be elected from elected from different regions
Overview of Research Findings and Policy Issues
54
rules for the promotion of moderation without giving undue preference to any one type. However, in his subsequent articles and book on South Africa, which largely were a reaction to Lijphart’s List PR and consociational system, Horowitz opted for a single policy framework: he became critical of List PR and consociation, extolled the virtues of the alternative or preference vote over the single transferable vote (STV), and the STV over the List PR. In short, he became a key advocate of majoritarianism.
Reilly and Reynolds (1999) have introduced contextual issues – such as the nature of group identity; the intensity of the conflict; and the size, number and distribution of ethnic groups – in their useful article on ethnicity and governance. However, despite their sensitivity to different types of ethnic structures, Reilly and Reynolds make the same assumptions as Horowitz and Lijphart by treating the electoral and governance reforms as closed or mutually opposed policies that cannot be combined by countries. Indeed, in their three models or typology, Reilly and Reynolds use the different electoral systems – AV, List PR and STV -- to classify countries as if the electoral systems are independent variables. Reilly (2001) adopts a slightly different framework in his useful book on Democracy in Divided Societies. The Reilly-Reynolds analysis of ethnic structure is not sufficiently disaggregated -- in terms of ethnic group distribution -- to allow for a useful comparison of countries.
As Table 9 shows, the real world of reforms reveals a much more complex picture. Electoral reforms to promote moderation and plurality have not been limited to electoral systems. Some countries, especially those in Africa, have added other rules, such as threshold percentage of votes for party registration and formation of government, ban on ethnic or religious symbols, compulsory location of party headquarters in capital cities, and establishment of party offices in a minimum number of states and local governments. Even though both frameworks reject first-past-the-post electoral rules, they have been used in combination with other instruments by countries such as Nigeria and Malaysia to promote plurality. The two round electoral system, which is popular in Francophone Africa and is heavily majoritarian, has also been combined with such power sharing instruments as decentralisation and informal methods of minority representation in government. The single transferable vote system, which encourages proportional outcomes and thus allows key groups to be represented in parliament, has been used in Northern Ireland. This electoral system has been combined with power sharing arrangements. Our studies show that consociational arrangements have been practiced largely in bipolar and tripolar settings: Belgium, Malaysia, Switzerland and Bosnia-Herzegovina. The consociations of Belgium and Bosnia-Herzegovina are ethnically defined with the various groups enjoying relative equality and veto powers; that of Malaysia is ethnic and lopsided, as the principle of indigeneity defines the distribution of powers among the contending groups; and that of Switzerland promotes ethnic proportionality through multiethnic parties. Nigeria combines first-past-the-post with threshold rules to make its party system ethnically inclusive. And even though its presidential system is clearly majoritarian, it contains strong elements of ethnic inclusiveness that border on power sharing. India’s majoritarian parliamentary system is sensitive to caste representation and regional balance in the formation of governments. It has not developed institutions or policies for resolving the religious cleavage. And Fiji has combined the alternative vote, which promotes majoritarian
Overview of Research Findings and Policy Issues

55
Box 1: Majoritarian rule and Power sharing in Nigeria and Fiji The Nigerian threshold system and the alternative vote system seek to promote plurality in party behaviour (moderation) and composition (cross-ethnic membership). However, voters reward moderation in AV, whereas in the Nigerian threshold system, parties select cross-ethnic candidates, who do not have to be moderate in their constituencies to be elected. On the other hand, the Nigerian system provides higher incentives for cross-ethnic parties to emerge. In the alternative vote system a party can field moderate candidates from the same ethnic group and expect to win second order preference votes. Since the threshold for party registration (a party needs 5% of the votes in 25 of 36 states) and formation of government (a winner needs 25% of the votes in two thirds of the states) was high, the Nigerian elections in 1999 produced only three political parties: the People’s Democratic Party (PDP) and the All People’s Party (APP), which had broad national support, and the Alliance for Democracy (AD), which drew most of its support from the Yoruba areas of the south-west. For the presidential election, the APP and the AD decided to merge and support the candidacy of the leader of the AD, Olu Falae, a Yoruba. The PDP candidate was the present president, Olusegun Obasanjo. Traditionally, Nigeria’s leaders had come from the north. But now for the first time both candidates were not just from the south but also from the southwest. Effectively, the northern leaders had forgone the right to contest the presidency in favour of Yoruba politicians in the two dominant political parties in which the former have strong influence. There are problems, however, with this system. First, the high threshold for party formation may give enormous powers to dominant factions within official parties and frustrate efforts to establish new parties. Second, party discipline may be difficult to enforce since the parties that get registered may contain a wide range of interests or factions held loosely together by a logic of convenience rather than by ideology or political beliefs. Third, the system may exclude dominant politicians from regions whose parties may have lost the elections. Fourth, even though the ruling party may have national spread, leaders who participate in the government may be second-order, rather than first order, politicians in their own regions if citizens in those areas have overwhelmingly voted against the ruling party. Obasanjo, for instance, failed to win a majority of the votes in the six southwest states in 1999. The system, which combines majoritarianism with limited power sharing, may be open to instability if the dominant politicians in a core region that feels excluded from central government decide to be spoilers.
Fiji’s attempt to combine both consociational rules and preference voting when multiparty rule was restored in 1999 has been fraught with difficulties. Parties that secure at least 10% of parliamentary seats are guaranteed a proportional number of cabinet posts in the constitutional reforms. The Alternative Vote or preference system was introduced in place of the first-past-the-post system. However, parties rather than voters were empowered to determine the second and lower order preferences of voters. Preference voting produced a government that had less than 40% of the popular vote even when second and lower preference votes were counted. The majority of ethnic Fijians did not vote for the leading Indian party of government. It got its majority thanks to the strategic behaviour of two Fijian parties in marginal constituencies that were determined to punish the incumbent ethnic Fijian government that ushered in the reforms. These parties gave their second and lower order preference votes to the Indian-led party. The Indian-led government was overthrown by a small group of armed indigenous Fijians in 2000. When a coalition of ethnic Fijian parties won the elections in 2001, the 10% rule for sharing cabinet posts proved unworkable. Only two parties -- the main Ethnic Fijian and ethnic Indian parties -- got more than 10% of the votes and the parliamentary seat difference between them was very small (34-27 out of 70). The ruling party refused to give cabinet posts to the Indian party with 27% of the seats, preferring instead to govern with two smaller Fijian parties. The implementation of the 10% and proportionality rule in the formation of the cabinet would have unravelled the coalition. It would have meant giving more than 40% of the cabinet posts to the Indian party and none to the allies of the leading party. These parties would have withdrawn their support from the government and the latter would have been beholden to the Indian party. The only way the coalition would have remained dominant would have been if the 10% rule had been relaxed and cabinet seats were rewarded according to the proportion of parliamentary seats. The government’s allies would have been represented in cabinet and the second largest party would not have been able to bring down the government.
Overview of Research Findings and Policy Issues
56
outcomes, with explicit rules on cabinet formation that are oriented towards power sharing. The Nigerian and Fiji innovations are further discussed in Box 1. The evidence in multi-ethnic societies suggests that although the pulls of majoritarianism and power sharing are very strong, they do not always pull in opposite directions. The majority of ethnically segmented countries, like their more homogenous counterparts, have opted for majoritarian solutions. But ethnic problems have forced some of them to incorporate power-sharing elements in their majoritarian institutions. Formal consociational arrangements may not be relevant in unipolar ethnic settings or fragmented multiethnic societies, where governments are bound to be ethnically inclusive under democratic conditions. They seem unavoidable in bipolar and tripolar formations or in multipolar settings with strong ethnic or regional clusters. Federalism, decentralisation and minority rights Federalism and decentralisation are important components of the policy instruments for cohesion advocated by proponents of power sharing. If ethnic groups are geographically separated, local autonomy may allow groups to govern themselves, take responsibility for policy outcomes, and lessen competition for central resources and power. It is not surprising that bipolar and tripolar ethnic settings in which power sharing regimes have been introduced (Switzerland, Belgium, Bosnia-Herzegovina) are federations. Most of the countries that have tried to combine majoritarian and power sharing regimes (India, Nigeria, Malaysia) are also federations or quasi-federations. The majority of our cases are unitary systems, although many have decentralised governments. Decentralisation in Lithuania has allowed minorities to participate actively in the governance of localities where they have strong presence. It has also offered minority voters (especially Russians) the choice to advance their interests through ethnic Lithuanian-led parties at the national level (since minority parties stand very little chance of influencing public policy outcomes at that level) and support minority parties in municipal elections where these parties stand a better chance of making an impact. In Bosnia, decentralisation facilitated the creation of Brcko, the only multi-ethnic district, which is governed as a protectorate under the authority of a military official, assisted by an appointed 29-member assembly. The entity makes no reference to ethnicity in selecting members to serve in the assembly. A multiethnic police force was created and the school system was desegregated. However, federalism and decentralisation may pose problems for minorities. They may lead to a hardening of local ethnic boundaries if the boundaries of local governments or federal states correspond to ethnic identities. An unhealthy discourse on indigeneity may develop in which so-called “sons of the soil” may discriminate against migrants. The case studies of Nigeria and Belgium illustrate this problem. Minority rights are very salient in unipolar ethnic settings (Lithuania and Botswana), where, as we have seen, the state may be treated as a nation-state by the dominant ethnicity. Such rights are also important in bipolar and tripolar ethnic settings with a majority group (Switzerland, Malaysia, Belgium, Latvia). They may not be very
Overview of Research Findings and Policy Issues
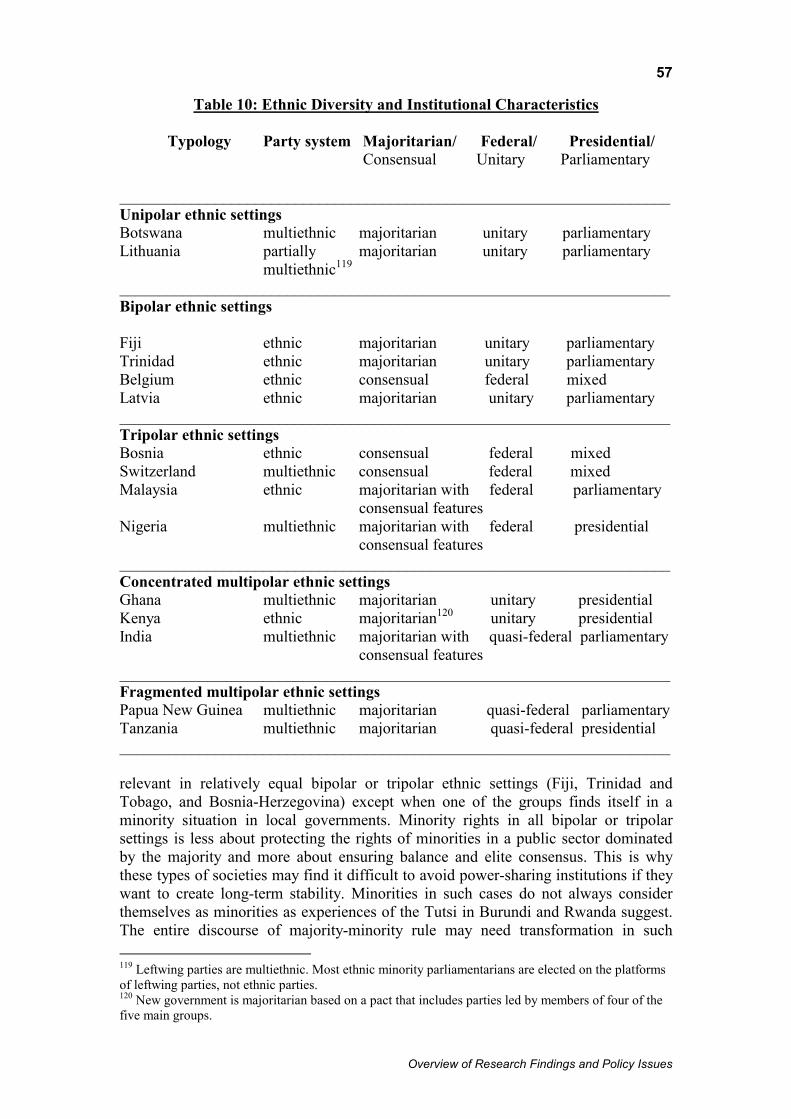
57
Table 10: Ethnic Diversity and Institutional Characteristics
Typology Party system Majoritarian/ Federal/ Presidential/ Consensual Unitary Parliamentary _____________________________________________________________________ Unipolar ethnic settings Botswana multiethnic majoritarian unitary parliamentary Lithuania partially majoritarian unitary parliamentary
multiethnic119 _____________________________________________________________________ Bipolar ethnic settings Fiji ethnic majoritarian unitary parliamentary Trinidad ethnic majoritarian unitary parliamentary Belgium ethnic consensual federal mixed Latvia ethnic majoritarian unitary parliamentary _____________________________________________________________________ Tripolar ethnic settings Bosnia ethnic consensual federal mixed Switzerland multiethnic consensual federal mixed Malaysia ethnic majoritarian with federal parliamentary
consensual features Nigeria multiethnic majoritarian with federal presidential consensual features _____________________________________________________________________ Concentrated multipolar ethnic settings Ghana multiethnic majoritarian unitary presidential Kenya ethnic majoritarian120 unitary presidential India multiethnic majoritarian with quasi-federal parliamentary consensual features _____________________________________________________________________ Fragmented multipolar ethnic settings Papua New Guinea multiethnic majoritarian quasi-federal parliamentary Tanzania multiethnic majoritarian quasi-federal presidential _____________________________________________________________________ relevant in relatively equal bipolar or tripolar ethnic settings (Fiji, Trinidad and Tobago, and Bosnia-Herzegovina) except when one of the groups finds itself in a minority situation in local governments. Minority rights in all bipolar or tripolar settings is less about protecting the rights of minorities in a public sector dominated by the majority and more about ensuring balance and elite consensus. This is why these types of societies may find it difficult to avoid power-sharing institutions if they want to create long-term stability. Minorities in such cases do not always consider themselves as minorities as experiences of the Tutsi in Burundi and Rwanda suggest. The entire discourse of majority-minority rule may need transformation in such 119 Leftwing parties are multiethnic. Most ethnic minority parliamentarians are elected on the platforms of leftwing parties, not ethnic parties. 120 New government is majoritarian based on a pact that includes parties led by members of four of the five main groups.
Overview of Research Findings and Policy Issues
58
societies. It is interesting that the Swiss have avoided the discourse of majority-minority rule through their very elaborate institutions of power sharing even though Germans are a clear numerical majority. Minority rights may not be salient in fragmented multiethnic settings except where adoption of decentralisation disadvantages groups considered non-indigenous in the jurisdiction. Minority rights have focused on language rights (Latvia, Lithuania, Belgium), cultural rights (Botswana), access and resource redistribution. The issue of indigeneity often colours the discourse on minority rights in countries that have experienced large-scale migration, such as Fiji, Malaysia, Latvia and Lithuania. It also affects countries in which the boundaries of federalism and decentralisation have followed ethnic lines (Belgium, Bosnia-Herzegovina, Nigeria). Conclusion Most states in the world today are multiethnic. Ethnicity affects the identities of states, the allocation of public resources, and the confidence that different sections of societies may have in government. Although most governments would claim that their public sectors are not discriminatory, ethnic groups are structured differently in national political economies. Differences may be a product of history, market dynamics, resource endowments and, in some cases, overtly discriminatory public policies. Inequalities arising from such differences are often a source of tension as groups compete to maintain or redefine advantages. The public sector itself is very central to such conflicts: it may be rendered ineffective if it fails to develop mechanisms to regulate difference and competition. Politicised ethnicity may encourage xenophobia, blocking the evolution of citizenship that is essential for the growth of democratic institutions. Good data on ethnic cleavages, inequalities and voter behaviour are required if advances are to be made in understanding the links between ethnicity and governance. The first issue is the generation of a data-set on ethnic cleavages. The available data-sets are not very reliable. Since identities are largely constructed, the census offers the best source for constructing a data-set on ethnic cleavages around the world. However, only a few countries include ethnicity as a variable in their censuses. International development agencies and national statistical offices should cooperate to institutionalise the ethnicity variable in censuses. The Inter-American Development Bank and the World Bank now work with Latin American governments on this issue as they seek to subject development projects to diversity impact assessments. The second issue is the development of an index of ethnic inequality or proportionality that is sensitive to all cleavages, not just the two-group proportionality index employed in this study. Such an index can be used to analyse the progress of countries in the annual development reports of multilateral agencies. Ethnic, or horizontal, inequalities, as Frances Stewart (2000) has explained it, are a neglected dimension of development that needs urgent rectification. They need to be at the centre of present concerns about poverty, the Millennium Development Goals and social policy more generally. Our study suggests that the key issue in governing multiethnic societies is not diversity per se, but types of diversity, which can constrain the choices of politicians, policy makers and citizens. In unipolar settings struggles for access and selection of
Overview of Research Findings and Policy Issues

59
those who should govern the public sector are likely to be less ethnically polarised. Electoral politics may open up, instead, conflicts within the dominant ethnicity, promoting intergroup cooperation. In fragmented multipolar ethnic settings with relatively small ethnic groups, ethnic-based political behaviour for access to the public sector is also likely to be less virulent. It is difficult for a single group to advance a hegemonic project under democratic rules. Since political parties may have to appeal to a large cross section of ethnic groups to be electorally viable, they are bound to be broad ethnic coalition parties. The more difficult cases are countries with bipolar and tripolar ethnic structures or cases where groups have formed selective ethnic coalitions, limiting the scope for bargaining, concessions and the promotion of multiple loyalties. Countries with these types of ethnic structures that are relatively stable and cohesive have introduced ethnicity-sensitive institutions and policies to influence access and selection to the public sector. Contrary to conventional ideas on ethnicity, fragmentation stands out as a powerful tool for inter-group cooperation. Our study suggests that polarisation and fragmentation can occur in all countries. In other words, polarisation is not only confined to the obvious cases of bipolar and tripolar settings, and fragmentation to multipolar and unipolar settings. As we have seen, India’s ethnic fragmentation encompasses forms of bipolarity in the religious and caste spheres (Hindis versus Muslims; Forward versus Backward Castes). The highly fragmented ethnic structures in Tanzania and Papua New Guinea are tempered respectively by the mainland-Zanzibar polarisation in Tanzania (which assumes racial dimensions) and the Bougainville-mainland conflict in PNG (which is conditioned by geographical separation and assumed colour-as well as-cultural differences between mainlanders and those in Bougainville). Bipolar impulses have also been observed in unipolar settings. In Botswana, this takes the form of differences between the relatively well-endowed Kalanga and the majority Tswana, even though the two groups do not organise separately in the political field. High growth and ethnically sensitive redistributive policies have helped to check the conflict. The Tanzania study also suggests that the relative advantage enjoyed by a few ethnic groups (Chagga, Haya and Nyakyusa) at independence in terms of educational attainment and development would have produced a bipolar situation (the relatively well-off, who would have dominated the public sector, versus the rest) if a policy of nation building and balanced development had not been pursued by the first post-independence government. Similarly, even though bipolar and tripolar structures seem more prone to polarisation, it should also not be assumed that they inevitably lead to ethnic polarisation. The social and political divide in bipolar Trinidad during the first years of independence did not assume ethnic dimensions: the preferences of the African population were divided between two different parties -- one African-led and the other Indian-led. Rural Africans voted with the largely rural Indian population against the party that had its social base among the urban African and mixed group population. Indians and rural Africans supported the same party in the early period of independence. Ethnic polarisation developed later. Our study suggests that understanding the dynamics of fragmentation requires efforts to promote the integrity of the electoral system. There should be zero tolerance for the manipulation or rigging of the electoral process if analysts and policy-makers are to understand the choices of voters and construct appropriate governance reforms to stabilize multi-ethnic societies. Two major types of fragmentation that are supportive
Overview of Research Findings and Policy Issues
60
of inter-group cooperation stand out in our case studies. The first is the Swiss and Botswana type121 in which ethnic groups distribute their votes across multiethnic parties. In other words, individuals from the same ethnic group support different multiethnic parties. The second is the Belgian, Bosnia-Herzegovina, Lithuanian and Latvian type in which ethnic choices fragment, but not across the ethnic divide. Individuals from the same ethnic group vote for different parties, which draw their support from the same ethnic group. The first is obviously more advanced than the second in terms of inter-group cooperation. The value of the second is that it may allow for inter-group cooperation if no single party of each group is able to gain a majority and the votes of parties with different ethnicities become important. Voters will also be able to extract accountability from leaders, who may otherwise be tempted to take the ethnic electorate for granted if it were not fragmented. At the core of our analysis is the need to weaken or manage polarity. Policy-makers cannot turn all ethnically plural countries into homogenous societies, short of creating 8000 or more mini states. Even such a policy of ethnic state creation may not be viable in a world of increasing migration and inter-marriage. The best option for stability and inter-group cooperation in divided societies may be to promote more fragmentation. Electoral rules and other incentives can be used to open up cleavages in groups that appear homogeneous; multi-ethnic forms of association can also be supported. The importance this study attaches to fragmentation comes close to respecting a major finding in political science that democracies are more likely to be stable in situations where resources, power and allegiances are widely dispersed (Dahl, 1971; Vanhanen, 1997, Boix, 2003). Since we have focused on the first method of promoting fragmentation, we should end with the second. The crafting of institutions that are sensitive to, but not trapped in, ethnic cleavages is a challenge for policy-makers in plural societies. It is always important to bear in mind that ethnicity is only one form of identification, even in rigidly bipolar countries. Ethnic identities are fluid. Institutional designers should avoid reforms that make it difficult for individuals to express other identities. Institutional reforms should, thus, be based on sound principles of universal citizenship where individuals are free to travel, settle and take up employment anywhere in the national territory, and where a common set of citizenship rights applies to everyone. Efforts should also be made to promote institutions that are likely to reflect crosscutting cleavages and defend national, as opposed to narrow, ethnic interests. Such institutions include trades unions, professional associations and other civic organizations. These initiatives are important in ensuring that ethnic entrepreneurs do not capture governance reforms that are sensitive to ethnic cleavages; and that they are also sensitive to the wider goal of building a plural state that can promote economic development and deliver services to all citizens without discrimination.
121 India, Ghana and, to some extent, Nigeria should be added.
Overview of Research Findings and Policy Issues
61
References The UNRISD Project’s manuscripts Ray Anere (2004), Ethnicity, Inequality and Public Sector Governance in Papua New Guinea Florian Bieber (2004), Ethnicity, Inequality and Public Sector Governance in Bosnia-Herzegovina Kris Deshouwer (2004), Ethnicity, Inequality and Public Sector Governance in Belgium Jon Fraenkel (2004), Ethnicity, Inequality and Public Sector Governance in Fiji Emmanuel Giymah-Boadi and Richard Asante (2004), Ethnicity, Inequality and Public Sector Governance in Ghana Niraja Gopal Jayal (2004), Ethnicity, Inequality and Public Sector Governance in India Karuti Kanyinga (2004), Ethnicity, Inequality and Public Sector Governance in Kenya Natalija Kasatkina and Vida Beresneviciute (2004), Ethnicity, Inequality and Public Sector Governance in Lithuania Khoo Boo Teik, Ethnicity (2004), Inequality and Public Sector Governance in Malaysia Wolf Linder and Isabelle Steffen (2004), Ethnicity, Inequality and Public Sector Governance in Switzerland Abdul Raufu Mustapha (2004), Ethnicity, Inequality and Public Sector Governance in Nigeria Julius Nyang’oro (2004), Ethnicity, Inequality and Public Sector Governance in Tanzania Artis Pabriks (2004), In Defiance of Fate: Ethnicity, Inequality and Public Sector Governance in Latvia Ralph Premdas (2004), Ethnicity, Inequality and Public Sector Governance in Trinidad and Tobago Onalenna Selolwane (2004), Ethnicity, Inequality and Public Sector Governance in Botswana
Overview of Research Findings and Policy Issues
62
Other references Abizadeh, A. (2002), “Does Liberal Democracy Presuppose a Cultural Nation? Four Arguments”. American Political Science Review. Vol. 96, No. 3. September. Pp. 495-509. Ake, C. (1967), A Theory of Political Integration. Homewood, Illinois: Dorsey Press. Akerlof, G. A. and Kranton, R. E. (2000), “Economics and Identity”, The Quarterly Journal of Economics. CXV. No. 3. Pp. 715-53. Atlas Narodov Mir. (1964). Moscow: Glavnoe upravlenie goedezii i kartograffi. Bangura, Y. 2000, “Strategic Policy Failure and Governance Reform in Sierra Leone”, December, Journal of Modern African Studies. Barry, B. (1991), Democracy and Power: Essays in Political Theory. Oxford: Clarendon Press. Boix, C. (2003), Democracy and Redistribution. Cambridge University Press: United Kingdom. Chua, A. (2002), World on Fire: How Exporting Free Market Democracy Breeds Ethnic Hatred and Global Instability. Doubleday Books. CIA Fact Book. http://www.odci.gov/cia/publications/factbook/index/html Collier, P. and Hoeffler, A. 2001a), Greed and Gievance in Civil War. World Bank. 21 October. Collier, P. and Hoeffler, A. (2001b), On the Incidence of Civil Wars in Africa. World Bank. 13 December. Connor, W. (1994), Ethnonationalism: The Quest for Understanding. Princeton, N.J: Princeton University Press. Cramer, C (2003a), “Does Inequality Cause Conflict?” Journal of International Development, Vol. 15. No. 4. Pp. 397-412. Cramer, C. (2003b), “Inequality and Conflict: A Review of an Age-Old Concern”. UNRISD. Mimeo. Daadler, H. (1974), “The Consociational Theme”, World Politics. July, pp. 607-608. Dahl, R. (1971), Polyarchy: Participation and Opposition. New Haven and London: Yale University Press. Dixit, A.K. (1998), The Making of Economic Policy: a transaction cost politics perspective. Cambridge, MA & London: The MIT Press.
Overview of Research Findings and Policy Issues
63
Dovi, S. (2002), “Preferable Descriptive Representatives: Will Just Any Woman, Black, or Latino Do?” American Political Science Review. Vol. 96, No. 4. December. Pp. 729-743. Duverger, M. (1986), Douverger’s Law: Forty Years Later”, in B. Grofman and A. Lijphart (eds.), Electoral Laws and Their Political Consequences, New York: Agathon Press, pp. 69-84. Easterly, W. and Levine, R. (1997), “Africa’s Growth Tragedy: Policies and Ethnic Divisions”, Quarterly Journal of Economics. November. Vol. CXII. Issue No. 4. Pp. 1203-1250. Elbadawi, I. and Sambanis, N. (2001), “How Much War Will We See? Estimating Incidence of Civil War in 161 Countries.” World Bank. Farrell, D. (1997), Comparing Electoral Systems. London and New York: Prentice Hall/Harvester Wheatsheaf. Fearon, J. D. (2002), “Ethnic Structure and Cultrual Diversity in the World: A Cross-National Data Set on Ethnic Groups”. Paper to the 2002 Annual meeting of the American Political Science Association. 29 August-1 September. Fearon, J. D. and Laitin, D. D. (2003), “Ethnicity, Insurgency and Civil War”. American Political Science Review. Vol. 97, No. 1. February. Pp. 75-90. Furnivall, J. S. (1948), Colonial Policy and Practice. Cambridge University Press. Gellner, E. (1983), Nations and Nationalism. Ithaca, N. Y: Cornell University Press. Goodhart, D. (2004), “Discomfort of Strangers”, Parts 1&2. The Guardian. United Kingdom. 24 February. Grimes, B. F. (ed.), (1998), Ethnologue. Thirteenth Edition. Gurr, T. R. (1996), “Minorities at Risk III Dataset: User’s Manual”. CIDCM, University of Maryland. Horowitz, D. (1985), Ethnic Groups in Conflict. Berkeley: University of California Press. Horowitz, D. (1990), “Making Moderation Pay: The Comparative Politics of Ethnic Conflict Management”, in J. Montville (ed.), Conflict and Peacemaking in Multiethnic Societies. New York: Lexington Books. Horowitz, D. (1991), A Democratic South Africa? Constitutional Engineering in a Divided Society. Berkeley: University of California Press. Ignatieff, M. (1993), Blood and Belonging. London: Noonday Press.
Overview of Research Findings and Policy Issues

64
Joshua Project II Database. http://www.joshuaproject.net Justino, P. (2003), Redistribution, Inequality and Political Conflict, PRUS Working Paper No. 18. Poverty Research Unit, University of Sussex. Lane, J-E and Svante, E. (2000), “The Lijphart system”, part three of J-E. Lane and E. Svante, The New Institutional Politics: Performance and Outcomes. London and New York: Routledge. Lewis, A. W. (1965), Politics in West Africa. London: George Allen and Unwin. Lijphart, A. (1977), Democracy in Plural Societies: A Comparative Exploration. New Haven: Yale University Press. Lijphart, A. (1985), Power Sharing in South Africa. Policy Papers in International Affairs No. 24. Institute of International Studies, University of California, Berkeley. Lijphart, A. (1990), “The Power Sharing Approach”, in J. Montville (ed.), Conflict and Peacemaking in Multiethnic Societies. New York: Lexington Books. Lijphart. A. (1995), “Electoral Systems”, in S.M. Lipset (ed.), The Encyclopedia of Democracy. Washington D.C.: Congressional Quarterly Press. Lijphart, A. (1999), Patterns of Democracy: Government Forms and Performance in Thirty-Six Countries. New Haven and London: Yale University Press. Loury, G. (2002), The Anatomy of Racial Inequality. Harvard University Press. Lustick, I. 1979, “Stability in Deeply Divided Societies: Consociationalism versus Control”, World Politics 31, No. 3 (April): 325-44. Miller, D. (1995), On Nationality. Oxford: Clarendon Press. Moser, R. G. 1999, Electoral Systems and the Number of Parties in Post Communist States, World Politics, No. 51, April, pp 359-84. Moyniham, D. (1993), Pandemonium: Ethnicity in International Politics. New York: Oxford University Press. Mozaffar, S., J. Scarritt and G. Galaich (2003), “Electoral Institutions, Ethnopolitical Cleavages, and Party Systems in Africa’s Emerging Democracies”. American Political Science Review. Vol. 97. No. 3. August. Pp. 379-390. Museveni, Y. (1997), Sowing the Mustard Seed: The Struggle for Freedom and Democracy in Uganda. London: Macmillan. Ndikimuna, L. (2004), “Distributional Conflict, the State, and Peace Building in Burundi”. WIDER Conference Paper “Making Peace Work”. Helsinki.
Overview of Research Findings and Policy Issues
65
Nyerere, J. (1967) "Democracy and the Party System," in J. Nyerere, Freedom and Unity: A Selection from Writings and Speeches, 1952-65. Nairobi: Oxford University Press. Odeshook, P. and Shvetsova, O. (1994), “Ethnic Heterogeneity, District Magnitude, and the Number of Parties”. American Journal of Political Science.Vol. 38, No. 1.February. Pp. 100-23. Phillips, A. (1995), Politics of Presence. New York: Clarendon Press. Phillips, A. (1998), Feminism and Politics. Oxford: Oxford University Press. Premdas, R. 1991, “The Politics of Inter-ethnic Accommodation in a Democracy: The Lewis Model”, in R. Premdas and E. Cyr (eds.), Sir Arthur Lewis: An Economic and Political Portrait. Institute of Social and Economic Research, University of the West Indies, Mona, Jamaica. Przeworski, A., S. Stokes and B, Manin (eds.) (1999), Democracy, Accountability and Representation. UK: Cambridge University Press. Reilly, B. (2001), Democracy in Divided Societies: Electoral Engineering for Conflict Management. Cambridge: Cambridge University Press. Reilly, B. and A. Reynolds (1999), Electoral Systems and Conflicts in Divided Societies. Papers on International Conflict Resolution No. 2. Committee on International Conflict Resolution Commission on Behavioural and Social Sciences and Education. National Research Council. USA. Smith, M. G. (1969), “Institutional Political Conditions of Pluralism”. In L. Kuper and M. G. Smith (eds.), Pluralism in Africa. L. A: University of California Press. Stavenhagen, R. (1996), Ethnic Conflicts and the Nation State. United Kingdom: Palgrave Press. Stewart, F. (2000), Horizontal Inequalities: A Neglected Dimension of Development, WIDER Annual Lectures 5. December. Stokes, S. (2001), Mandates and Democracy: Neoliberalism by Surprise in Latin America. UK: Cambridge University Press. Taylor, C. L. and Hudson, M. C, 1972, World Handbook of Political and Social Indicators, 2nd edition. New Haven, CT: Yale University Press. Tilly, C. (1999), Durable Inequality. Berkeley: University of California Press. Young, C. (1998), Ethnic Diversity and Public Policy: A Comparative Enquiry. United Kingdom: Palgrave Press. Young, M. (1990), Justice and the Politics of Difference. Princeton, N.J: Princeton University.
Overview of Research Findings and Policy Issues
66
Vanhanen, T. (1997), Prospects for Democracy. New York: Routledge.
Overview of Research Findings and Policy Issues