Embed Size (px)
Citation preview
1
Stable and Selective Electrochemical Reduction of Carbon Dioxide to
Ethylene on Copper Mesocrystals Chung Shou Chen, Albertus D. Handoko, Jane Hui Wan, Liang Ma, Dan Ren and Boon Siang Yeo*
SUPPORTING INFORMATION
S1. Determination of Faradaic Efficiencies of Gaseous and Liquid Products Using Gas
Chromatography (GC) and Nuclear Magnetic resonance (NMR) Spectroscopy Data
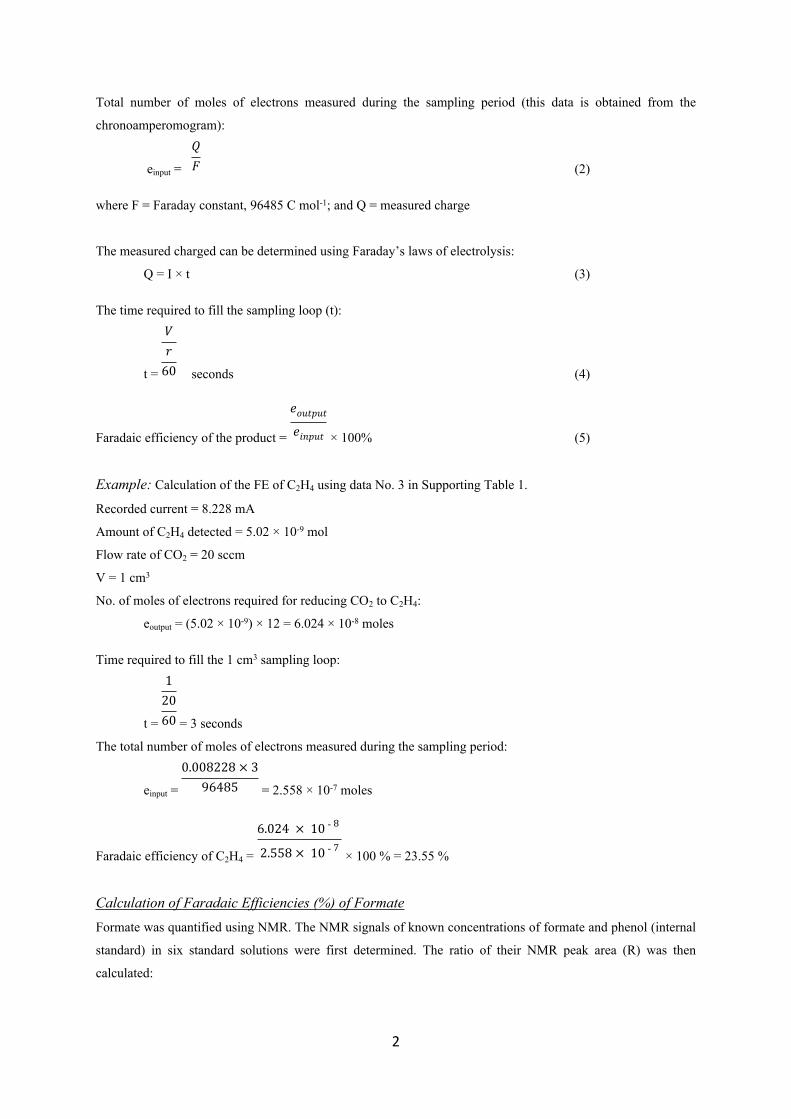
A representative set of GC data obtained during CO2 electroreduction on Cu mesocrystals is presented in
Supporting Table 1. Supporting Table 1: Data obtained from the GC analysis of CO2 reduction products using Cu mesocrystal (Catalyst A). The
volume of the sampling loops are 1 cm3 (for CH4, C2H4, C2H6 and CO), and 0.5 cm3 (for H2).
Amount of gaseous products (mol)
Sampling No.
Time of sample
injection (s)
Current (mA) CH4 C2H4 C2H6 CO H2
1 230 10.850 3.04 ×10⁻¹⁰ 3.29 ×10⁻⁹ 2.82 ×10⁻¹¹ 4.97 ×10⁻¹⁰ 5.14 ×10⁻⁸
2 900 9.100 3.54 ×10⁻¹⁰ 4.46 ×10⁻⁹ 2.29 ×10⁻¹¹ 5.35 ×10⁻¹⁰ 4.28 ×10⁻⁸
3 1570 8.228 4.33 ×10⁻¹⁰ 5.02 ×10⁻⁹ 3.68 ×10⁻¹¹ 6.72 ×10⁻¹⁰ 3.97 ×10⁻⁸
4 2240 8.331 5.98 ×10⁻¹⁰ 6.28 ×10⁻⁹ 5.23 ×10⁻¹¹ 9.49 ×10⁻¹⁰ 4.97 ×10⁻⁸
5 2910 7.665 5.41 ×10⁻¹⁰ 5.72 ×10⁻⁹ 5.19 ×10⁻¹¹ 7.59 ×10⁻¹⁰ 3.59 ×10⁻⁸
6 3580 7.342 5.23 ×10⁻¹⁰ 4.98 ×10⁻⁹ 4.33 ×10⁻¹¹ 7.77 ×10⁻¹⁰ 3.67 ×10⁻⁸
Average (3~6) 7.8915 5.24 ×10⁻¹⁰ 5.50 ×10⁻⁹ 4.61 ×10⁻¹¹ 7.89 ×10⁻¹⁰ 4.05 ×10⁻⁸
Calculation of Faradaic Efficiencies (%) of Gaseous ProductsTo ensure that the reported data is from a system under equilibrium condition, only the 3rd - 6th GC
measurements were used for calculating the Faradaic efficiencies.
Let:
Recorded amount of product = y (mol)
Recorded current = I (A)
Recorded flow rate = r (sccm) = cm3 s-1
𝑟60
Volume of sampling loop = V cm3
No. of moles of electrons required for reducing CO2 to a particular product
eoutput = y × No. of electrons required to obtain 1 molecule of product (1)
The number of electrons required to form a molecule of C2H6, C2H4, CH4, CO (from CO2) and H2 (from H+) are
14, 12, 8, 2 and 2 electrons respectively.1
Electronic Supplementary Material (ESI) for Catalysis Science & Technology.This journal is © The Royal Society of Chemistry 2014
2
Total number of moles of electrons measured during the sampling period (this data is obtained from the
chronoamperomogram):
einput = (2)
𝑄𝐹
where F = Faraday constant, 96485 C mol-1; and Q = measured charge
The measured charged can be determined using Faraday’s laws of electrolysis:
Q = I × t (3)
The time required to fill the sampling loop (t):
t = seconds (4)
𝑉𝑟
60
Faradaic efficiency of the product = × 100% (5)
𝑒𝑜𝑢𝑡𝑝𝑢𝑡
𝑒𝑖𝑛𝑝𝑢𝑡
Example: Calculation of the FE of C2H4 using data No. 3 in Supporting Table 1.
Recorded current = 8.228 mA
Amount of C2H4 detected = 5.02 × 10⁻⁹ mol
Flow rate of CO2 = 20 sccm
V = 1 cm3
No. of moles of electrons required for reducing CO2 to C2H4:
eoutput = (5.02 × 10-9) × 12 = 6.024 × 10⁻⁸ moles
Time required to fill the 1 cm3 sampling loop:
t = = 3 seconds
12060
The total number of moles of electrons measured during the sampling period:
einput = = 2.558 × 10⁻⁷ moles
0.008228 × 396485
Faradaic efficiency of C2H4 = × 100 % = 23.55 %
6.024 × 10 - 8
2.558 × 10 - 7
Calculation of Faradaic Efficiencies (%) of Formate Formate was quantified using NMR. The NMR signals of known concentrations of formate and phenol (internal
standard) in six standard solutions were first determined. The ratio of their NMR peak area (R) was then
calculated:
3
R = (6)
𝑃𝑒𝑎𝑘 𝑎𝑟𝑒𝑎 𝑜𝑓 𝑓𝑜𝑟𝑚𝑎𝑡𝑒 𝑎𝑡 8.3𝑝𝑝𝑚𝑃𝑒𝑎𝑘 𝑎𝑟𝑒𝑎 𝑜𝑓 𝑝ℎ𝑒𝑛𝑜𝑙 𝑎𝑡 7.2𝑝𝑝𝑚
R was plotted as a function of formate concentration. The slope of our calibration curve was 340.7 M-1.
Using the calibration curve, we can determine the concentration of formate in the catholyte:
Formate concentration = M (7)
𝑅340.7
The total volume of catholyte in cathodic compartment is 0.032 L. Hence, the number of moles of formate in the
cathodic compartment is:
nformate = 0.032 L × Formate concentration (M) (8)
The number of moles of electrons required to reduce CO2 to formate is:
eoutput = nformate × 2e- (9)
The total number of moles of electrons measured during the sampling period:
einput = (10)
𝑄𝐹
The Faradaic efficiency of formate = × 100%
𝑒𝑜𝑢𝑡𝑝𝑢𝑡
𝑒𝑖𝑛𝑝𝑢𝑡
Example: Quantification of formate formed during CO2 electroreduction on Cu mesocrystal catayst
The ratio of the NMR peak areas of formate and phenol:
R = =0.103
0.31873.0881
Number of moles of electrons required to reduce CO2 to formate
eoutput = ( =1.93×10⁻⁵ moles.0.032 ×
0.103340.7
) × 2
Most of the charges during the first 200s of the CO2 reduction process are used for reducing CuCl to Cu
mesocrystals (see, for example, Figure 1a). Hence, we only take into account the charges that passed through the
electrode from 200-4200 seconds. From the chronoamperomogram,
Q = 34.44 C
Hence, the total number of moles of electrons measured
einput = =3.57×10⁻⁴ moles.
34.44 96485
Faradaic efficiency of formate = × 100 % = 5.41 %
1.93 × 10 - 5
3.57 × 10 - 4
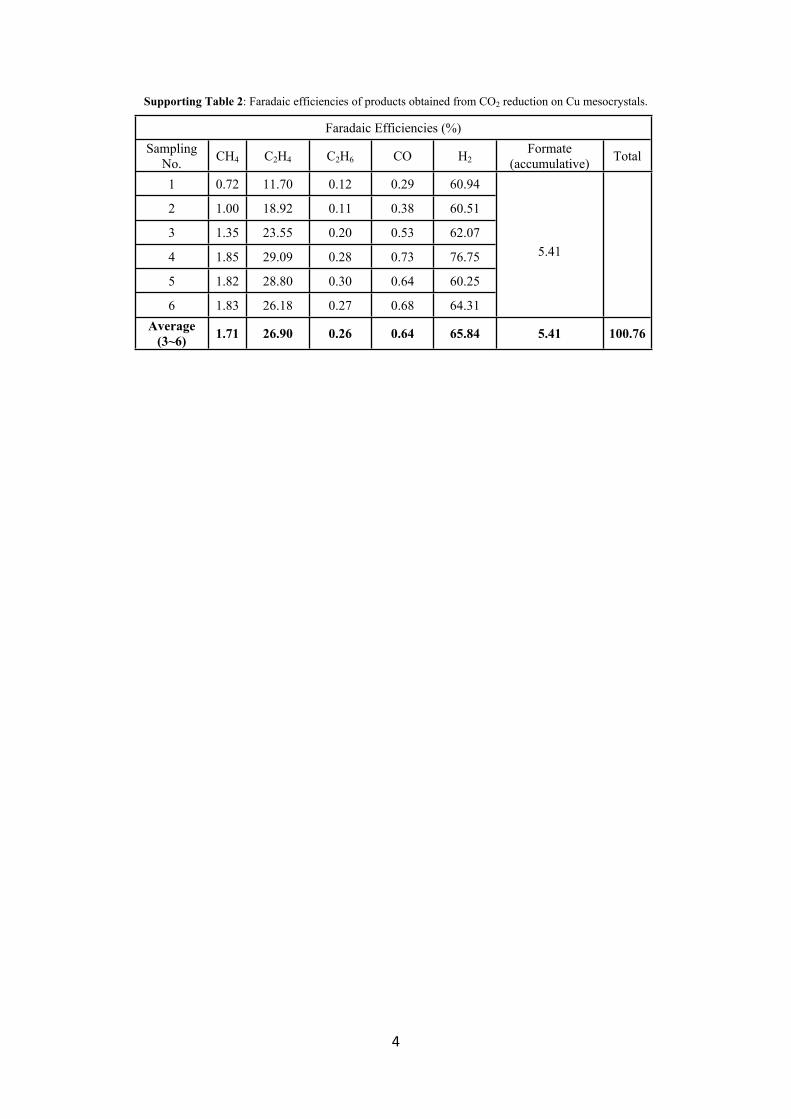
These calculations were repeated for the rest of the values in Supporting Table 1, and the Faradaic efficiencies
are presented in Supporting Table 2.
4
Supporting Table 2: Faradaic efficiencies of products obtained from CO2 reduction on Cu mesocrystals.
Faradaic Efficiencies (%)Sampling
No. CH4 C2H4 C2H6 CO H2Formate
(accumulative) Total
1 0.72 11.70 0.12 0.29 60.94
2 1.00 18.92 0.11 0.38 60.51
3 1.35 23.55 0.20 0.53 62.07
4 1.85 29.09 0.28 0.73 76.75
5 1.82 28.80 0.30 0.64 60.25
6 1.83 26.18 0.27 0.68 64.31
5.41
Average (3~6) 1.71 26.90 0.26 0.64 65.84 5.41 100.76
5
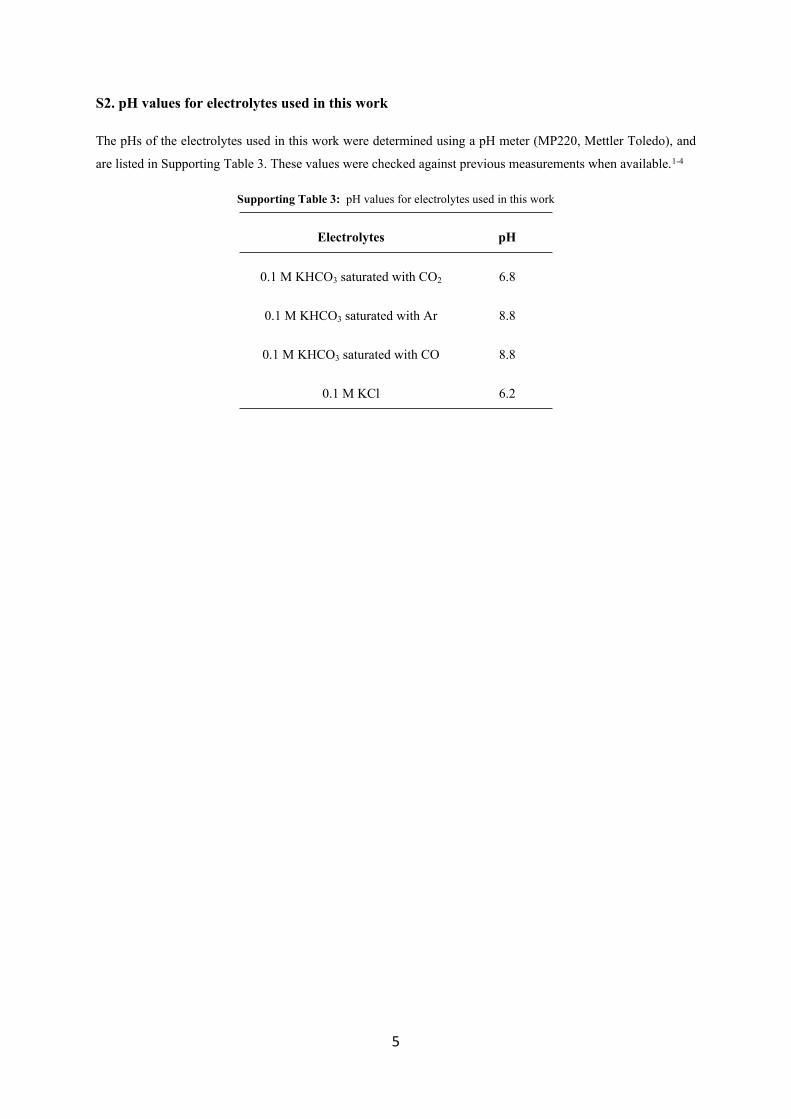
S2. pH values for electrolytes used in this work
The pHs of the electrolytes used in this work were determined using a pH meter (MP220, Mettler Toledo), and
are listed in Supporting Table 3. These values were checked against previous measurements when available.1-4
Supporting Table 3: pH values for electrolytes used in this work
Electrolytes pH
0.1 M KHCO3 saturated with CO2 6.8
0.1 M KHCO3 saturated with Ar 8.8
0.1 M KHCO3 saturated with CO 8.8
0.1 M KCl 6.2
6
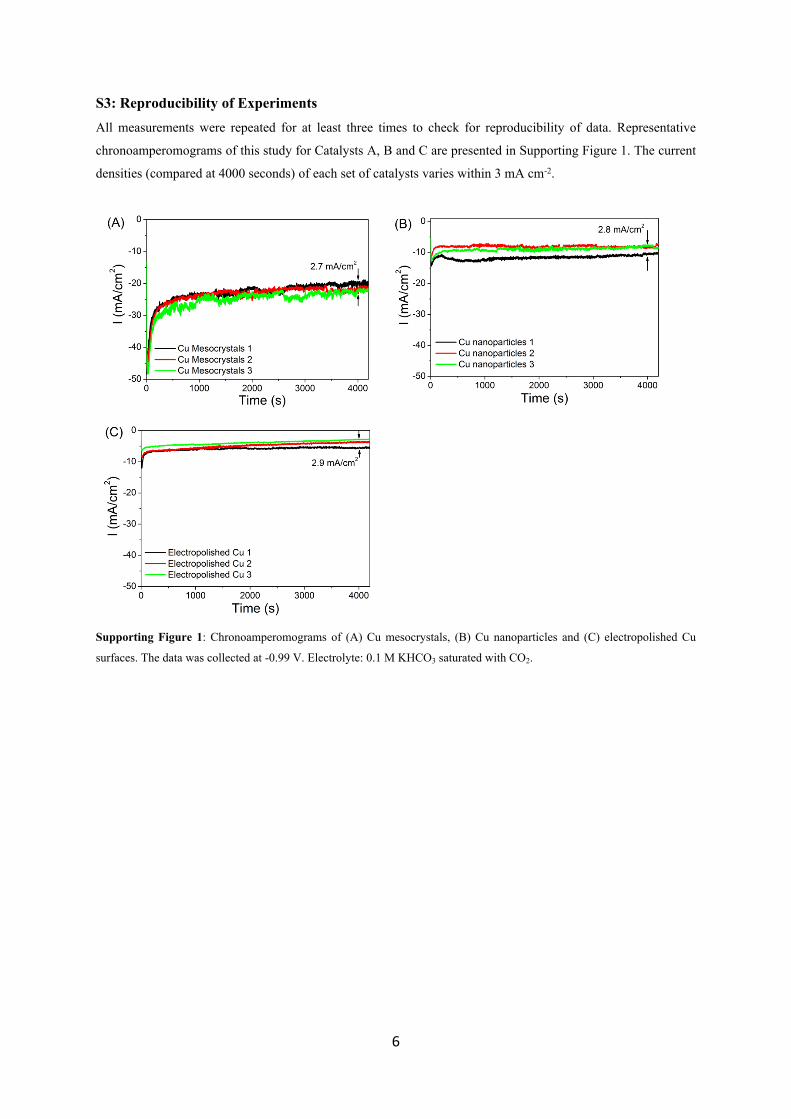
S3: Reproducibility of Experiments All measurements were repeated for at least three times to check for reproducibility of data. Representative
chronoamperomograms of this study for Catalysts A, B and C are presented in Supporting Figure 1. The current
densities (compared at 4000 seconds) of each set of catalysts varies within 3 mA cm-2.
Supporting Figure 1: Chronoamperomograms of (A) Cu mesocrystals, (B) Cu nanoparticles and (C) electropolished Cu
surfaces. The data was collected at -0.99 V. Electrolyte: 0.1 M KHCO3 saturated with CO2.
7
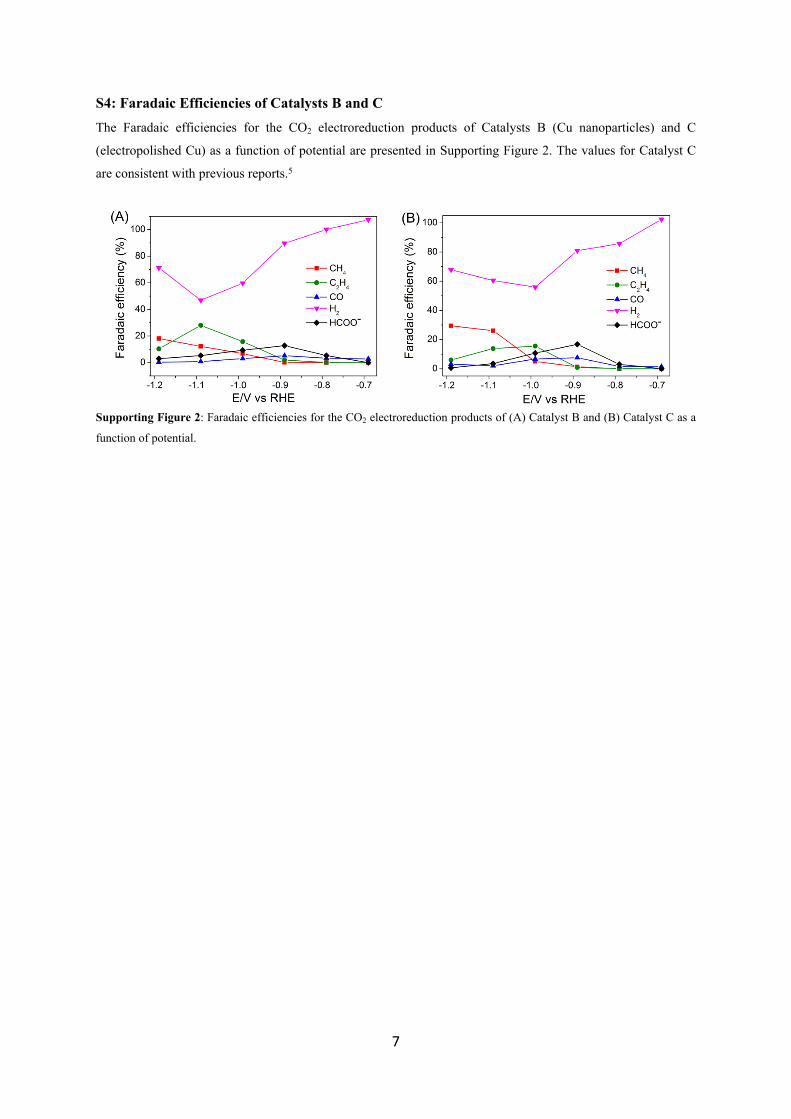
S4: Faradaic Efficiencies of Catalysts B and C The Faradaic efficiencies for the CO2 electroreduction products of Catalysts B (Cu nanoparticles) and C
(electropolished Cu) as a function of potential are presented in Supporting Figure 2. The values for Catalyst C
are consistent with previous reports.5
Supporting Figure 2: Faradaic efficiencies for the CO2 electroreduction products of (A) Catalyst B and (B) Catalyst C as a
function of potential.
8
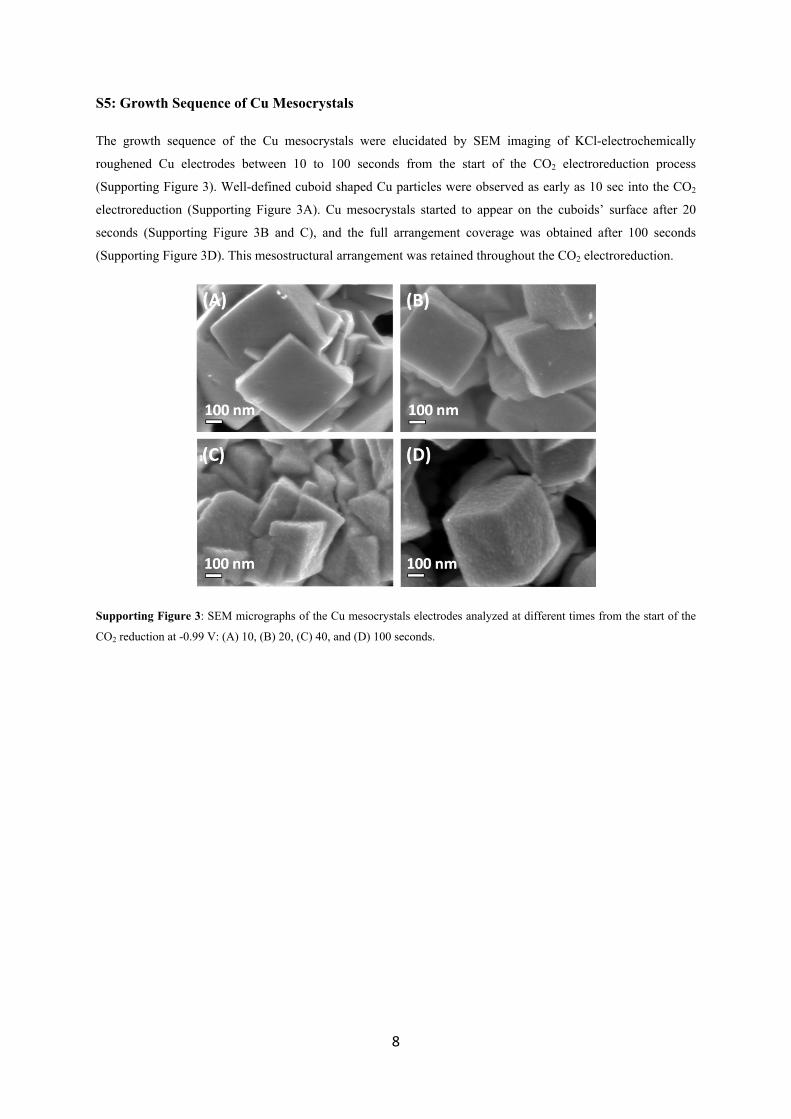
S5: Growth Sequence of Cu Mesocrystals
The growth sequence of the Cu mesocrystals were elucidated by SEM imaging of KCl-electrochemically
roughened Cu electrodes between 10 to 100 seconds from the start of the CO2 electroreduction process
(Supporting Figure 3). Well-defined cuboid shaped Cu particles were observed as early as 10 sec into the CO2
electroreduction (Supporting Figure 3A). Cu mesocrystals started to appear on the cuboids’ surface after 20
seconds (Supporting Figure 3B and C), and the full arrangement coverage was obtained after 100 seconds
(Supporting Figure 3D). This mesostructural arrangement was retained throughout the CO2 electroreduction.
Supporting Figure 3: SEM micrographs of the Cu mesocrystals electrodes analyzed at different times from the start of the
CO2 reduction at -0.99 V: (A) 10, (B) 20, (C) 40, and (D) 100 seconds.
9
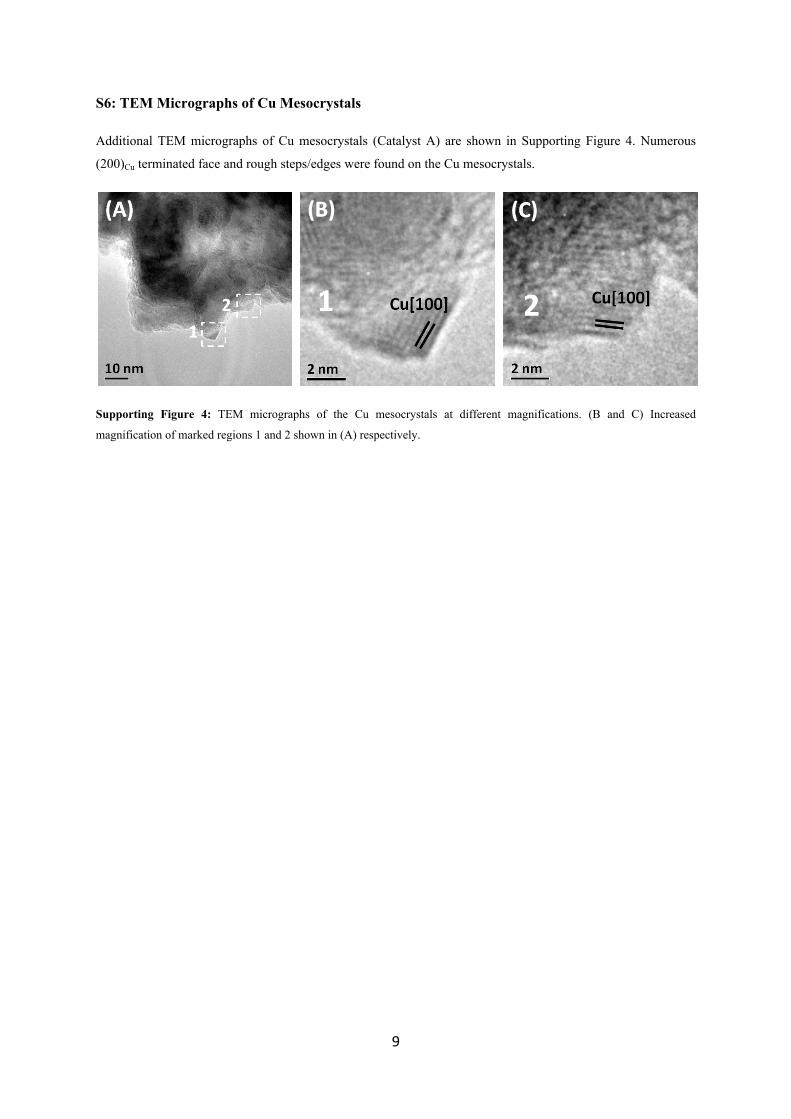
S6: TEM Micrographs of Cu Mesocrystals
Additional TEM micrographs of Cu mesocrystals (Catalyst A) are shown in Supporting Figure 4. Numerous
(200)Cu terminated face and rough steps/edges were found on the Cu mesocrystals.
Supporting Figure 4: TEM micrographs of the Cu mesocrystals at different magnifications. (B and C) Increased
magnification of marked regions 1 and 2 shown in (A) respectively.
10
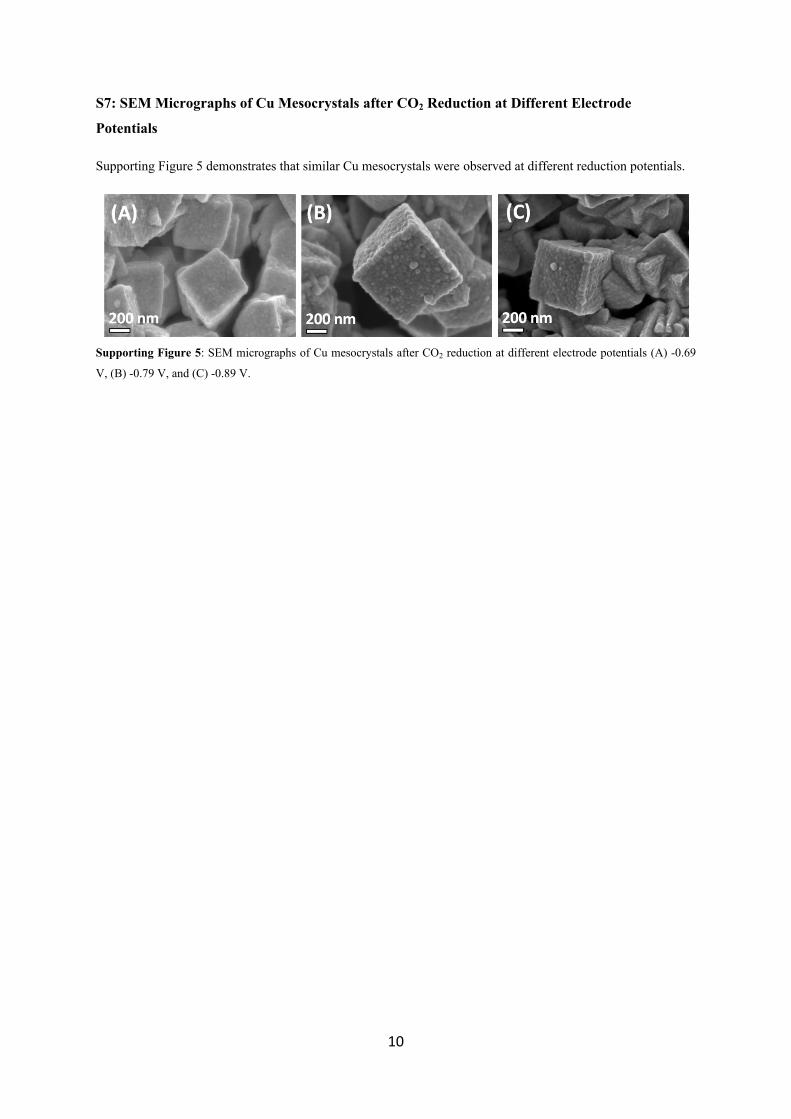
S7: SEM Micrographs of Cu Mesocrystals after CO2 Reduction at Different Electrode
Potentials
Supporting Figure 5 demonstrates that similar Cu mesocrystals were observed at different reduction potentials.
Supporting Figure 5: SEM micrographs of Cu mesocrystals after CO2 reduction at different electrode potentials (A) -0.69
V, (B) -0.79 V, and (C) -0.89 V.
11
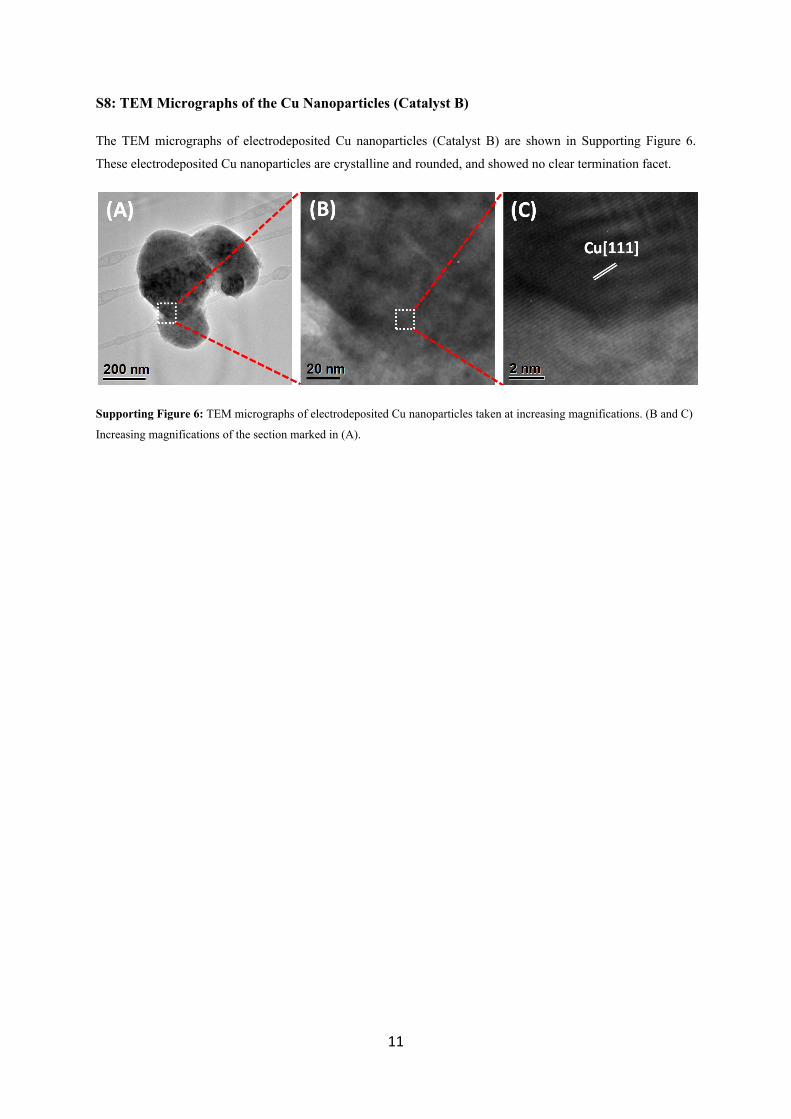
S8: TEM Micrographs of the Cu Nanoparticles (Catalyst B)
The TEM micrographs of electrodeposited Cu nanoparticles (Catalyst B) are shown in Supporting Figure 6.
These electrodeposited Cu nanoparticles are crystalline and rounded, and showed no clear termination facet.
Supporting Figure 6: TEM micrographs of electrodeposited Cu nanoparticles taken at increasing magnifications. (B and C)
Increasing magnifications of the section marked in (A).
12
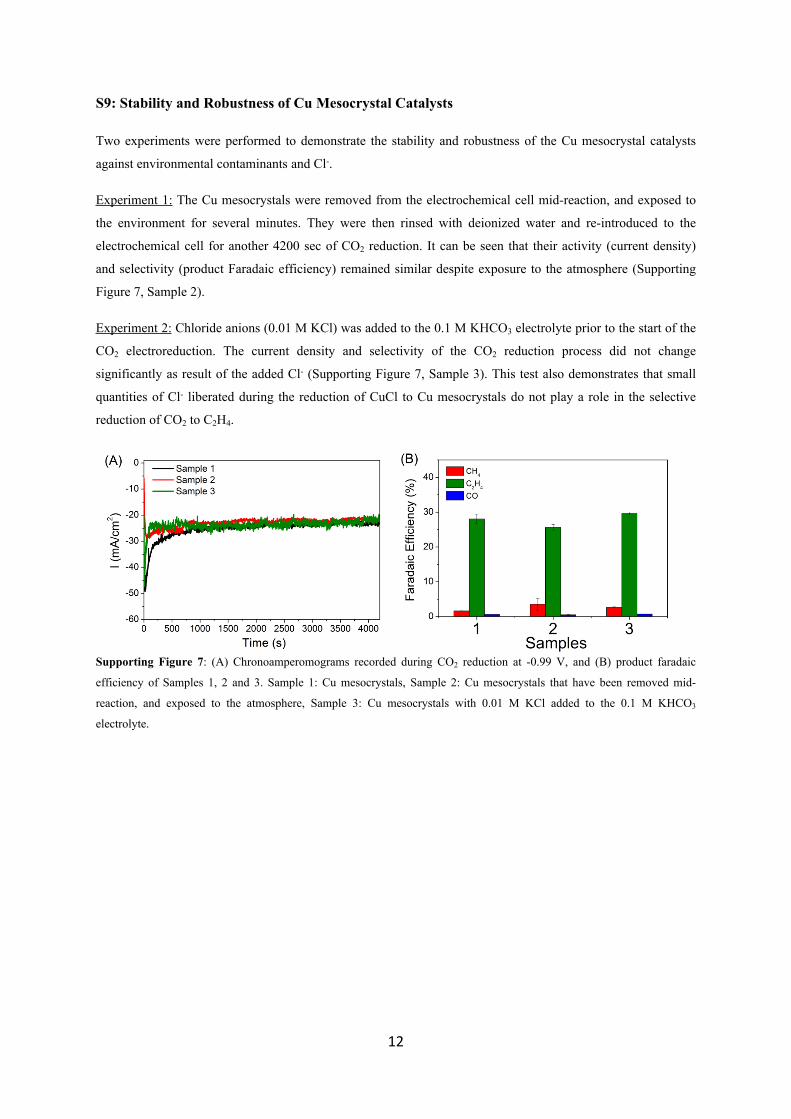
S9: Stability and Robustness of Cu Mesocrystal Catalysts
Two experiments were performed to demonstrate the stability and robustness of the Cu mesocrystal catalysts
against environmental contaminants and Cl-.
Experiment 1: The Cu mesocrystals were removed from the electrochemical cell mid-reaction, and exposed to
the environment for several minutes. They were then rinsed with deionized water and re-introduced to the
electrochemical cell for another 4200 sec of CO2 reduction. It can be seen that their activity (current density)
and selectivity (product Faradaic efficiency) remained similar despite exposure to the atmosphere (Supporting
Figure 7, Sample 2).
Experiment 2: Chloride anions (0.01 M KCl) was added to the 0.1 M KHCO3 electrolyte prior to the start of the
CO2 electroreduction. The current density and selectivity of the CO2 reduction process did not change
significantly as result of the added Cl- (Supporting Figure 7, Sample 3). This test also demonstrates that small
quantities of Cl- liberated during the reduction of CuCl to Cu mesocrystals do not play a role in the selective
reduction of CO2 to C2H4.
Supporting Figure 7: (A) Chronoamperomograms recorded during CO2 reduction at -0.99 V, and (B) product faradaic
efficiency of Samples 1, 2 and 3. Sample 1: Cu mesocrystals, Sample 2: Cu mesocrystals that have been removed mid-
reaction, and exposed to the atmosphere, Sample 3: Cu mesocrystals with 0.01 M KCl added to the 0.1 M KHCO3
electrolyte.

13
Further References
1. Y. Hori, in Modern Aspects of Electrochemistry, eds. C. Vayenas, R. White and M. Gamboa-Aldeco, Springer New York, 2008, vol. 42, ch. 3, pp. 89-189.
2. A. A. Panova, P. Pantano and D. R. Walt, Anal. Chem., 1997, 69, 1635-1641.3. N. Gupta, M. Gattrell and B. MacDougall, J. Appl. Electrochem., 2006, 36, 161-172.4. R. Shiratsuchi, Y. Aikoh and G. Nogami, J. Electrochem. Soc., 1993, 140, 3479-3482.5. K. P. Kuhl, E. R. Cave, D. N. Abram and T. F. Jaramillo, Energy Environ. Sci., 2012, 5, 7050-7059.