Embed Size (px)
Citation preview
10/10/2012 4:18 PM
1Copyright © 2005 IHS Inc. All Rights Reserved.
Ethylene/ PolyethylenePolypropylene
Nick VafiadisSenior Director: Global Polyolefins and Plastics
• Short term: - Demand: Global demand growth for PE may beslowing as China demand weakens, and Europe contends withrecession.L T S l T “l t” i (N th A i d th
Key Issues for the Global Polyethylene Industry
• Long Term: Supply: Two “low cost” regions (North America and theMiddle East) are set to compete for much of the global demandgrowth. The industry has never before included two major “costadvantaged” regions.
−Numerous capacity additions expected in North America as producersin the region seek to leverage cost advantage driven by “shale gas”.
• Continued demand strength anticipated for specialty polyethylened t h t l d bi i
© 2012, IHS Inc. No portion of this presentation may be reproduced, reused, or otherwise distributed in any form without prior written consent.
products such as metalocenes and bio-resins.• While annual Integrated margins are generally expected to trend
higher, most of the margin is forecast to remain with the ethylenemolecule.
10/10/2012 4:18 PM
2Copyright © 2005 IHS Inc. All Rights Reserved.
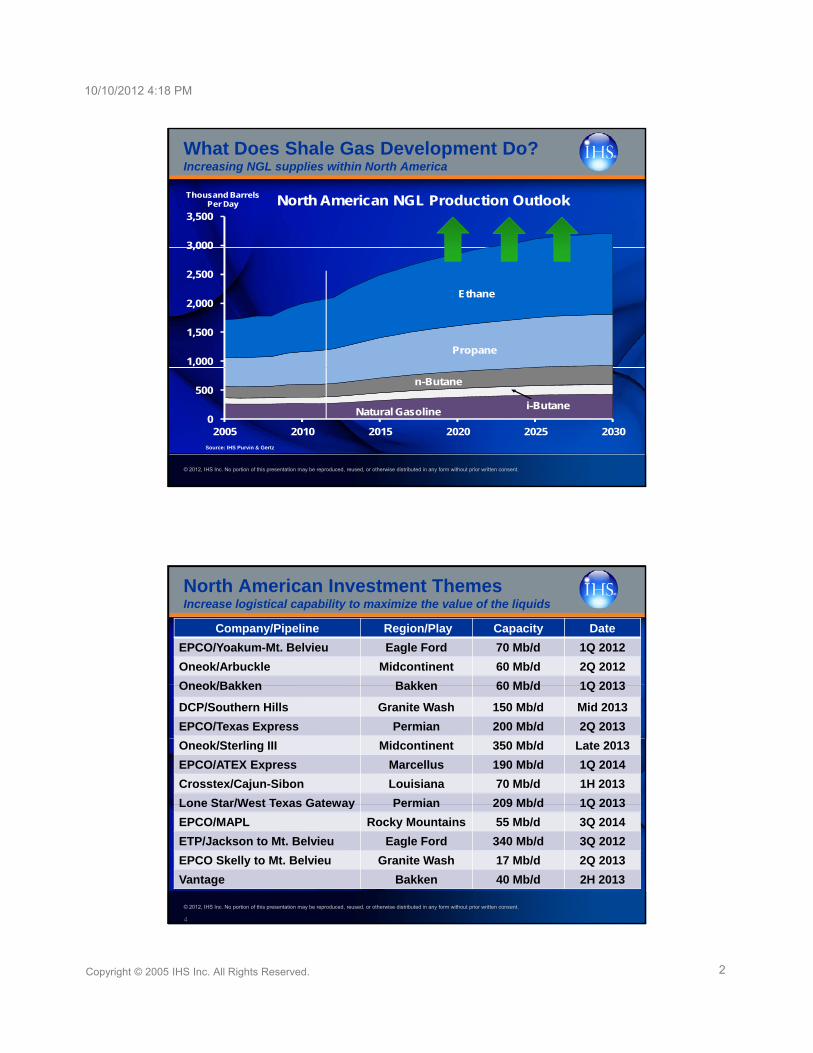
What Does Shale Gas Development Do?Increasing NGL supplies within North America
3,000
3,500
Thousand Barrels Per Day North American NGL Production Outlook
1,000
1,500
2,000
2,500
3,000
Ethane
Propane
© 2012, IHS Inc. No portion of this presentation may be reproduced, reused, or otherwise distributed in any form without prior written consent.
Source: IHS Purvin & Gertz
0
500
2005 2010 2015 2020 2025 2030
n-Butane
i-ButaneNatural Gasoline
North American Investment ThemesIncrease logistical capability to maximize the value of the liquids
Company/Pipeline Region/Play Capacity Date
EPCO/Yoakum-Mt. Belvieu Eagle Ford 70 Mb/d 1Q 2012
Oneok/Arbuckle Midcontinent 60 Mb/d 2Q 2012
Oneok/Bakken Bakken 60 Mb/d 1Q 2013Oneok/Bakken Bakken 60 Mb/d 1Q 2013
DCP/Southern Hills Granite Wash 150 Mb/d Mid 2013
EPCO/Texas Express Permian 200 Mb/d 2Q 2013
Oneok/Sterling III Midcontinent 350 Mb/d Late 2013
EPCO/ATEX Express Marcellus 190 Mb/d 1Q 2014
Crosstex/Cajun-Sibon Louisiana 70 Mb/d 1H 2013
Lone Star/West Texas Gateway Permian 209 Mb/d 1Q 2013
© 2012, IHS Inc. No portion of this presentation may be reproduced, reused, or otherwise distributed in any form without prior written consent.
4
Lone Star/West Texas Gateway Permian 209 Mb/d 1Q 2013
EPCO/MAPL Rocky Mountains 55 Mb/d 3Q 2014
ETP/Jackson to Mt. Belvieu Eagle Ford 340 Mb/d 3Q 2012
EPCO Skelly to Mt. Belvieu Granite Wash 17 Mb/d 2Q 2013
Vantage Bakken 40 Mb/d 2H 2013
10/10/2012 4:18 PM
3Copyright © 2005 IHS Inc. All Rights Reserved.
50%50%
60%60%
16 16
18 18
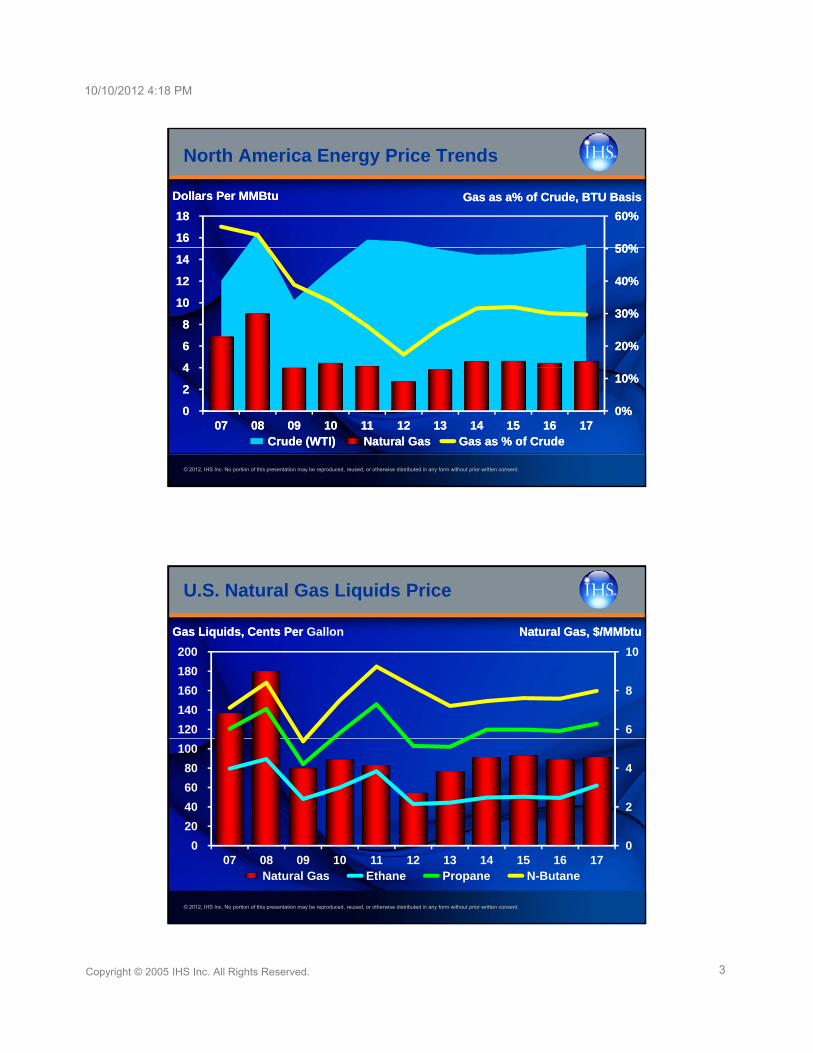
Dollars Per Dollars Per MMBtuMMBtu Gas as a% of Crude, BTU BasisGas as a% of Crude, BTU Basis
North America Energy Price Trends
20%20%
30%30%
40%40%
50%50%
44
6 6
8 8
10 10
12 12
14 14
© 2012, IHS Inc. No portion of this presentation may be reproduced, reused, or otherwise distributed in any form without prior written consent.
0%0%
10%10%
0 0
2 2
4 4
0707 0808 0909 1010 1111 1212 1313 1414 1515 1616 1717Crude (WTI)Crude (WTI) Natural GasNatural Gas Gas as % of CrudeGas as % of Crude
10
180
200
Gas Liquids, Cents PerGas Liquids, Cents Per Gallon Natural Gas, $/Natural Gas, $/MMbtuMMbtu
U.S. Natural Gas Liquids Price
2
4
6
8
40
60
80
100
120
140
160
© 2012, IHS Inc. No portion of this presentation may be reproduced, reused, or otherwise distributed in any form without prior written consent.
0
2
0
20
40
07 08 09 10 11 12 13 14 15 16 17Natural Gas Ethane Propane N-Butane
10/10/2012 4:18 PM
4Copyright © 2005 IHS Inc. All Rights Reserved.
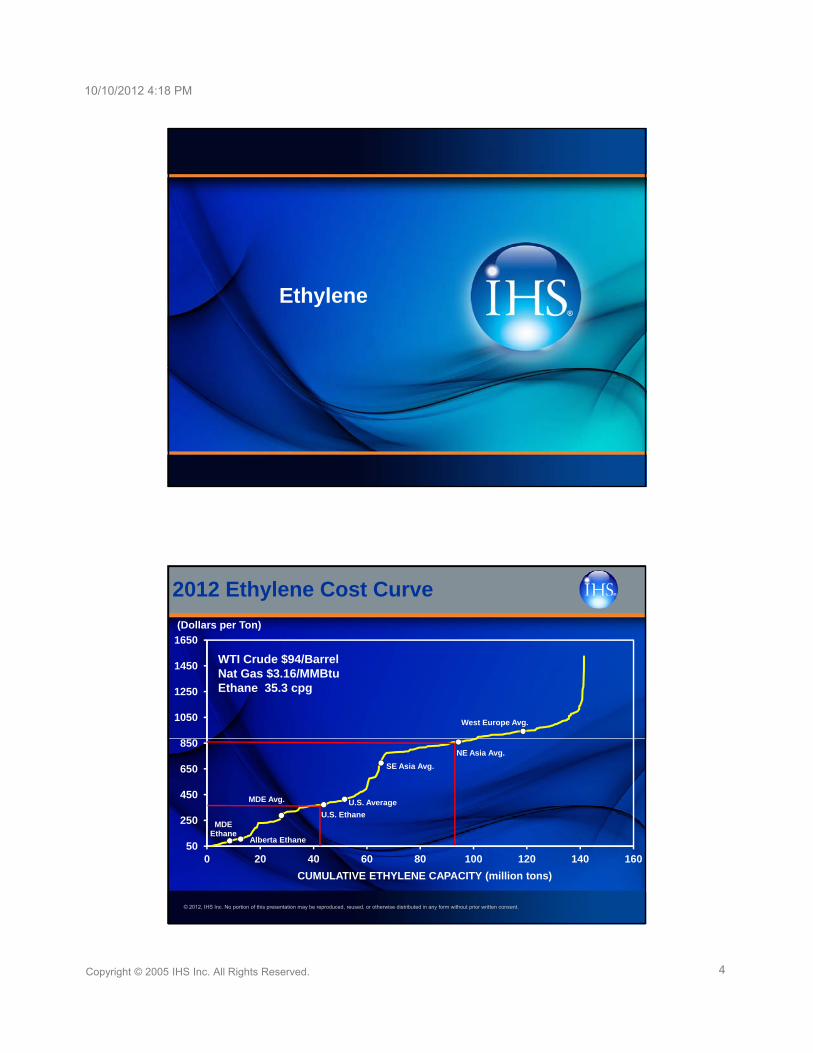
Ethylene
1450
1650
(Dollars per Ton)
2012 Ethylene Cost Curve
WTI Crude $94/Barrel Nat Gas $3.16/MMBtuEth 35 3
U.S. AverageMDE Avg.
West Europe Avg.
NE Asia Avg.
SE Asia Avg.
450
650
850
1050
1250 Ethane 35.3 cpg
© 2012, IHS Inc. No portion of this presentation may be reproduced, reused, or otherwise distributed in any form without prior written consent.
U.S. Average
Alberta Ethane
U.S. EthaneMDE
Ethane
50
250
0 20 40 60 80 100 120 140 160
CUMULATIVE ETHYLENE CAPACITY (million tons)

10/10/2012 4:18 PM
5Copyright © 2005 IHS Inc. All Rights Reserved.
Influence of Shale DevelopmentNorth American ethylene advantage
• Producers in the U.S. & Canada are among the lowest cost60
70
1,323
1,543
World Ethylene Cash Cost ComparisonU.S. Dollars Per Metric Ton U.S. Cents Per Pound
Ethylene Cash Costs From Ethane in Saudi Arabia
the lowest cost producers in the world
• Cost position affords export flexibility in times of lower demand
• Energy intensive derivatives such as10
20
30
40
50
60
220
441
661
882
1,102
1,323
© 2012, IHS Inc. No portion of this presentation may be reproduced, reused, or otherwise distributed in any form without prior written consent.
derivatives, such as PVC, get an additional boost from low natural gas prices
0
10
0
220
Western Canada
U.S. Ethane
U.S. Weighted Average
U.S. Coprod. Int. Light Naphtha
U.S. Light Naphtha
Northeast Asia
Naphtha
Southeast Asia
Naphtha
West Europe Naphtha
August 2012 July 2012
13231323
15431543
70 70
80 80
Dollars Per Metric TonDollars Per Metric TonCents Per PoundCents Per Pound
U.S. Ethylene Daily Cash Costs
220220
441441
661661
882882
11021102
1010
20 20
30 30
40 40
50 50
60 60 Ethylene Cash Costs as of Sep 25
Purity Ethane = 12.8 cpp
Weighted Average = 18.7 cppPropane = 17.8 cpp
Light Naphtha = 42.8 cppCoprod. Int. Lt. Naphtha = 30.7 cpp
Butane = 32.2 cppGas Oil = 74.3 cpp
© 2012, IHS Inc. No portion of this presentation may be reproduced, reused, or otherwise distributed in any form without prior written consent.10
000 0
10 10
Aug 01Aug 01 Aug 08Aug 08 Aug 15Aug 15 Aug 22Aug 22 Aug 29Aug 29 Sep 06Sep 06 Sep 13Sep 13 Sep 20Sep 20
Light NaphthaLight Naphtha Purity EthanePurity Ethane Weighted AverageWeighted AverageCoprod. Int. Lt. NaphthaCoprod. Int. Lt. Naphtha PropanePropane ButaneButaneGas OilGas Oil
10/10/2012 4:18 PM
6Copyright © 2005 IHS Inc. All Rights Reserved.
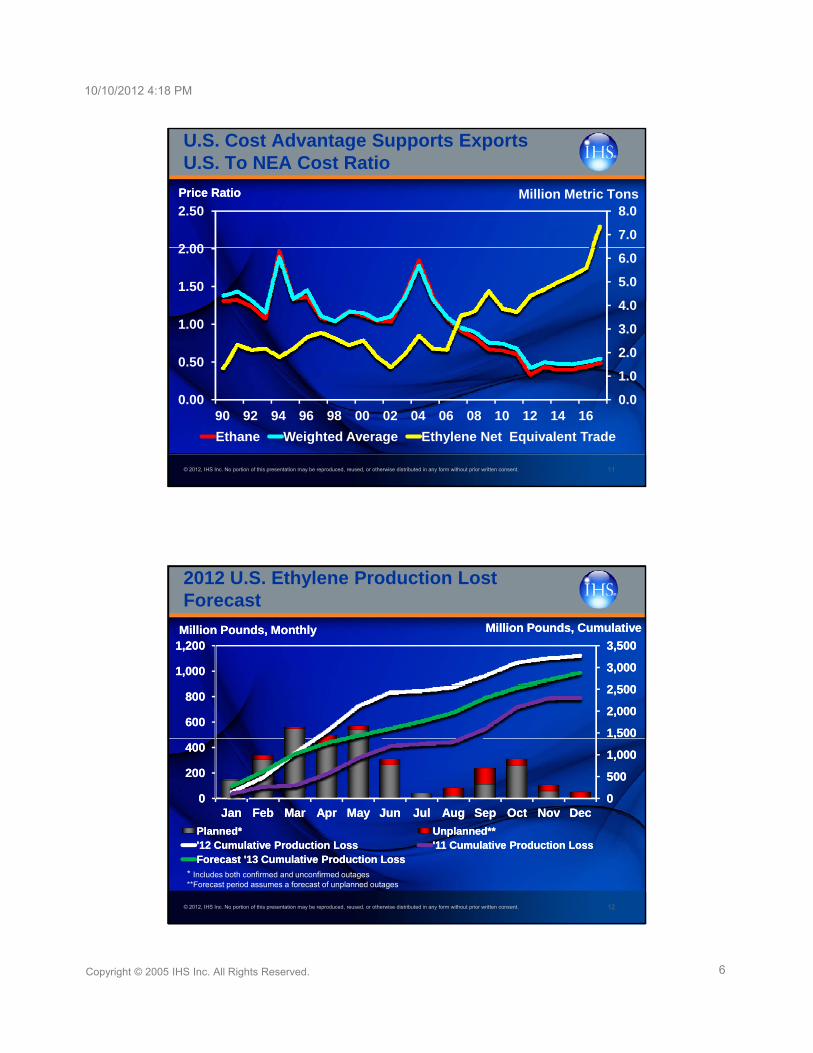
U.S. Cost Advantage Supports ExportsU.S. To NEA Cost Ratio
Price RatioPrice Ratio
7.0
8.0
2 00
2.50Million Metric Tons
2.0
3.0
4.0
5.0
6.0
0.50
1.00
1.50
2.00
© 2012, IHS Inc. No portion of this presentation may be reproduced, reused, or otherwise distributed in any form without prior written consent. 11
0.0
1.0
0.0090 92 94 96 98 00 02 04 06 08 10 12 14 16
Ethane Weighted Average Ethylene Net Equivalent Trade
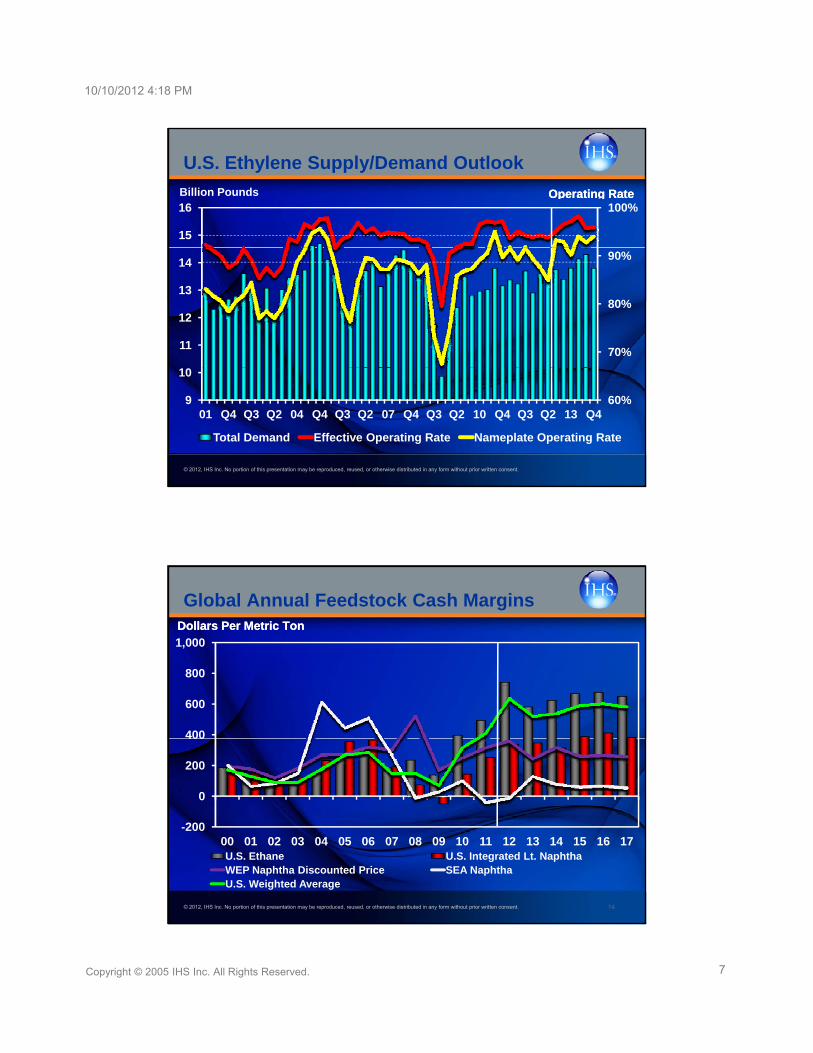
2012 U.S. Ethylene Production Lost Forecast
2 5002 500
3,0003,000
3,5003,500
1,0001,000
1,2001,200Million Pounds, MonthlyMillion Pounds, Monthly Million Pounds, CumulativeMillion Pounds, Cumulative
00
500500
1,0001,000
1,5001,500
2,0002,000
2,5002,500
00
200200
400400
600600
800800
© 2012, IHS Inc. No portion of this presentation may be reproduced, reused, or otherwise distributed in any form without prior written consent. 12
JanJan FebFeb MarMar AprApr MayMay JunJun JulJul AugAug SepSep OctOct NovNov DecDec
Planned*Planned* Unplanned**Unplanned**'12 Cumulative Production Loss'12 Cumulative Production Loss '11 Cumulative Production Loss'11 Cumulative Production LossForecast '13 Cumulative Production LossForecast '13 Cumulative Production Loss
* Includes both confirmed and unconfirmed outages **Forecast period assumes a forecast of unplanned outages
10/10/2012 4:18 PM
7Copyright © 2005 IHS Inc. All Rights Reserved.
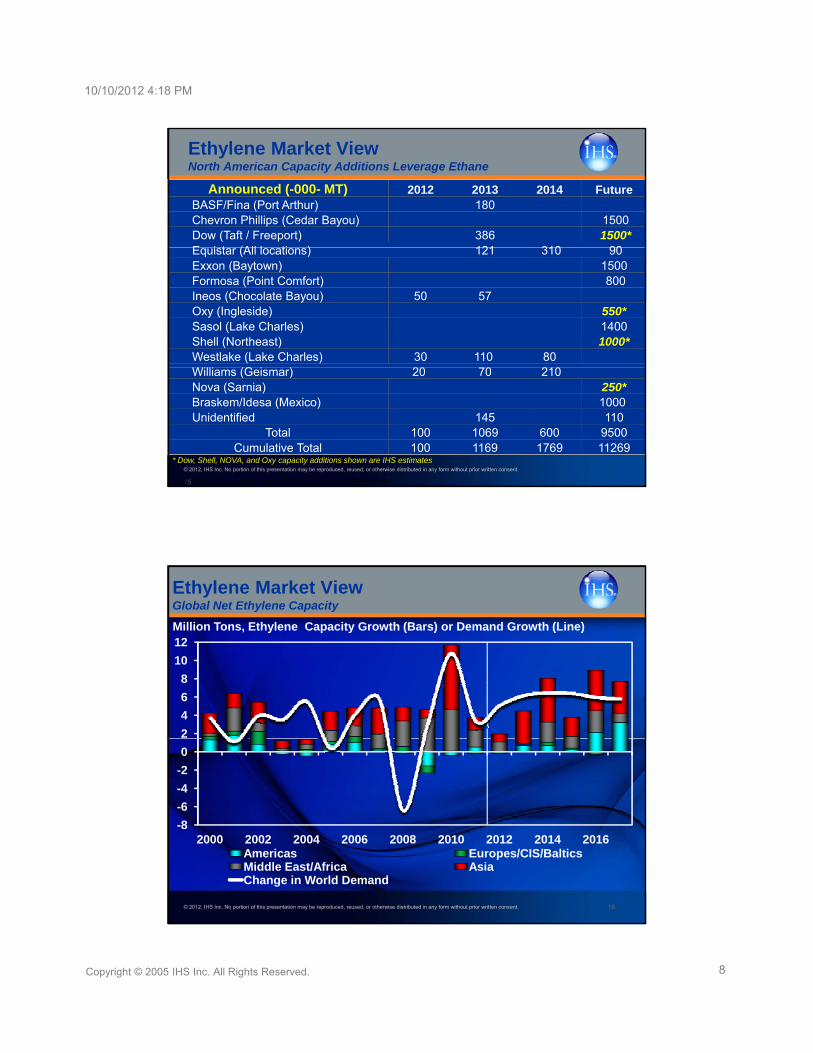
U.S. Ethylene Supply/Demand Outlook
100%
15
16Billion Pounds Operating RateOperating Rate
70%
80%
90%
11
12
13
14
© 2012, IHS Inc. No portion of this presentation may be reproduced, reused, or otherwise distributed in any form without prior written consent.
60%9
10
01 Q4 Q3 Q2 04 Q4 Q3 Q2 07 Q4 Q3 Q2 10 Q4 Q3 Q2 13 Q4
Total Demand Effective Operating Rate Nameplate Operating Rate
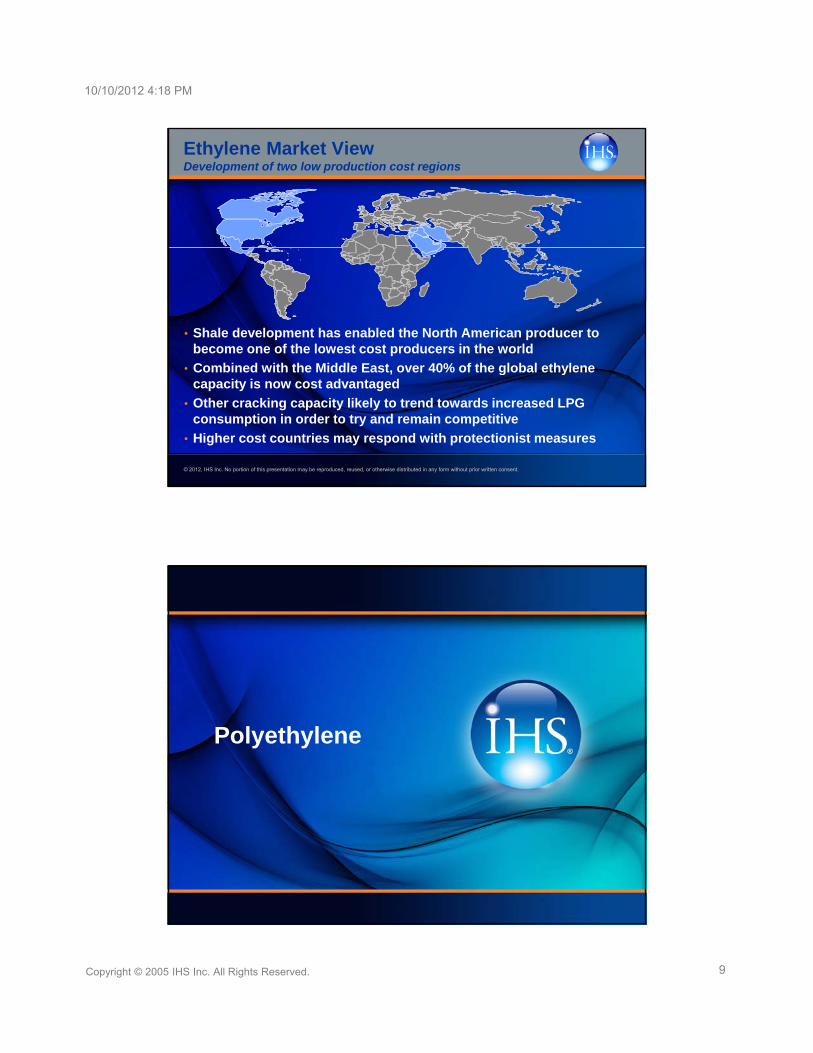
Global Annual Feedstock Cash Margins
800
1,000
Dollars Per Metric TonDollars Per Metric Ton
0
200
400
600
© 2012, IHS Inc. No portion of this presentation may be reproduced, reused, or otherwise distributed in any form without prior written consent. 14
-20000 01 02 03 04 05 06 07 08 09 10 11 12 13 14 15 16 17U.S. Ethane U.S. Integrated Lt. NaphthaWEP Naphtha Discounted Price SEA NaphthaU.S. Weighted Average
10/10/2012 4:18 PM
8Copyright © 2005 IHS Inc. All Rights Reserved.
Announced (-000- MT) 2012 2013 2014 FutureBASF/Fina (Port Arthur) 180Chevron Phillips (Cedar Bayou) 1500Dow (Taft / Freeport) 386 1500*E i t (All l ti ) 121 310 90
Ethylene Market ViewNorth American Capacity Additions Leverage Ethane
Equistar (All locations) 121 310 90Exxon (Baytown) 1500Formosa (Point Comfort) 800Ineos (Chocolate Bayou) 50 57Oxy (Ingleside) 550*Sasol (Lake Charles) 1400Shell (Northeast) 1000*Westlake (Lake Charles) 30 110 80
(G )
© 2012, IHS Inc. No portion of this presentation may be reproduced, reused, or otherwise distributed in any form without prior written consent.
15•Dow, Shell, NOVA, and Oxy capacity additions shown are CMAI estimates
Williams (Geismar) 20 70 210Nova (Sarnia) 250*Braskem/Idesa (Mexico) 1000Unidentified 145 110
Total 100 1069 600 9500Cumulative Total 100 1169 1769 11269
* Dow, Shell, NOVA, and Oxy capacity additions shown are IHS estimates
Ethylene Market View Global Net Ethylene Capacity
Million Tons, Ethylene Capacity Growth (Bars) or Demand Growth (Line)
8
10
12
6
-4
-2
0
2
4
6
© 2012, IHS Inc. No portion of this presentation may be reproduced, reused, or otherwise distributed in any form without prior written consent. 16
-8
-6
2000 2002 2004 2006 2008 2010 2012 2014 2016Americas Europes/CIS/BalticsMiddle East/Africa AsiaChange in World Demand
10/10/2012 4:18 PM
9Copyright © 2005 IHS Inc. All Rights Reserved.
Ethylene Market ViewDevelopment of two low production cost regions
• Shale development has enabled the North American producer to become one of the lowest cost producers in the world
• Combined with the Middle East over 40% of the global ethylene
© 2012, IHS Inc. No portion of this presentation may be reproduced, reused, or otherwise distributed in any form without prior written consent.
• Combined with the Middle East, over 40% of the global ethylene capacity is now cost advantaged
• Other cracking capacity likely to trend towards increased LPG consumption in order to try and remain competitive
• Higher cost countries may respond with protectionist measures
Polyethylene
10/10/2012 4:18 PM
10Copyright © 2005 IHS Inc. All Rights Reserved.
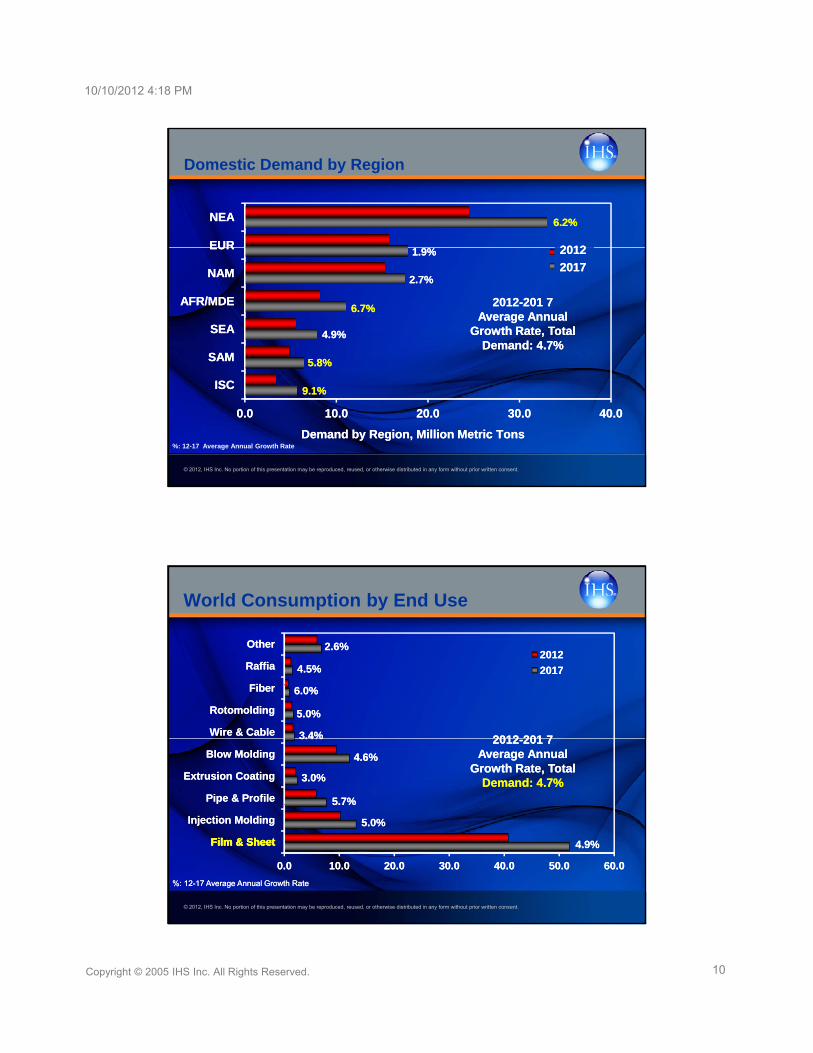
Domestic Demand by Region
EUREUR
NEANEA 6.2%6.2%
20122012
SAMSAM
SEASEA
AFR/MDEAFR/MDE
NAMNAM
EUREUR2012201220172017
2.7%2.7%
5.8%5.8%
4.9%4.9%
1.9%1.9%
6.7%6.7% 20122012--201 7 201 7 Average Annual Average Annual
Growth Rate, Total Growth Rate, Total Demand: Demand: 4.7%4.7%
20122012
20172017
© 2012, IHS Inc. No portion of this presentation may be reproduced, reused, or otherwise distributed in any form without prior written consent.
%: 12-17 Average Annual Growth Rate
0.00.0 10.010.0 20.020.0 30.030.0 40.040.0
ISCISC
Demand by Region,Demand by Region, Million Million Metric Metric TonsTons
9.1%9.1%
World Consumption by End Use
FibFib
RaffiaRaffia
OtherOther20122012
201720174.5%4.5%
2.6%2.6%
Pipe & ProfilePipe & Profile
Extrusion CoatingExtrusion Coating
Blow MoldingBlow Molding
Wire & CableWire & Cable
RotomoldingRotomolding
FiberFiber
5.7%5.7%
3.0%3.0%
4.6%4.6%
3.4%3.4%
5.0%5.0%
6.0%6.0%
20122012--201 7 201 7 Average Annual Average Annual
Growth Rate, Total Growth Rate, Total Demand: Demand: 4.7%4.7%
© 2012, IHS Inc. No portion of this presentation may be reproduced, reused, or otherwise distributed in any form without prior written consent.
%: 12%: 12--17 Average Annual Growth Rate17 Average Annual Growth Rate
0.00.0 10.010.0 20.020.0 30.030.0 40.040.0 50.050.0 60.060.0
Film & SheetFilm & Sheet
Injection MoldingInjection Molding
4.9%4.9%
5.0%5.0%
5.7%5.7%
Film & SheetFilm & Sheet
10/10/2012 4:18 PM
11Copyright © 2005 IHS Inc. All Rights Reserved.
88
1010
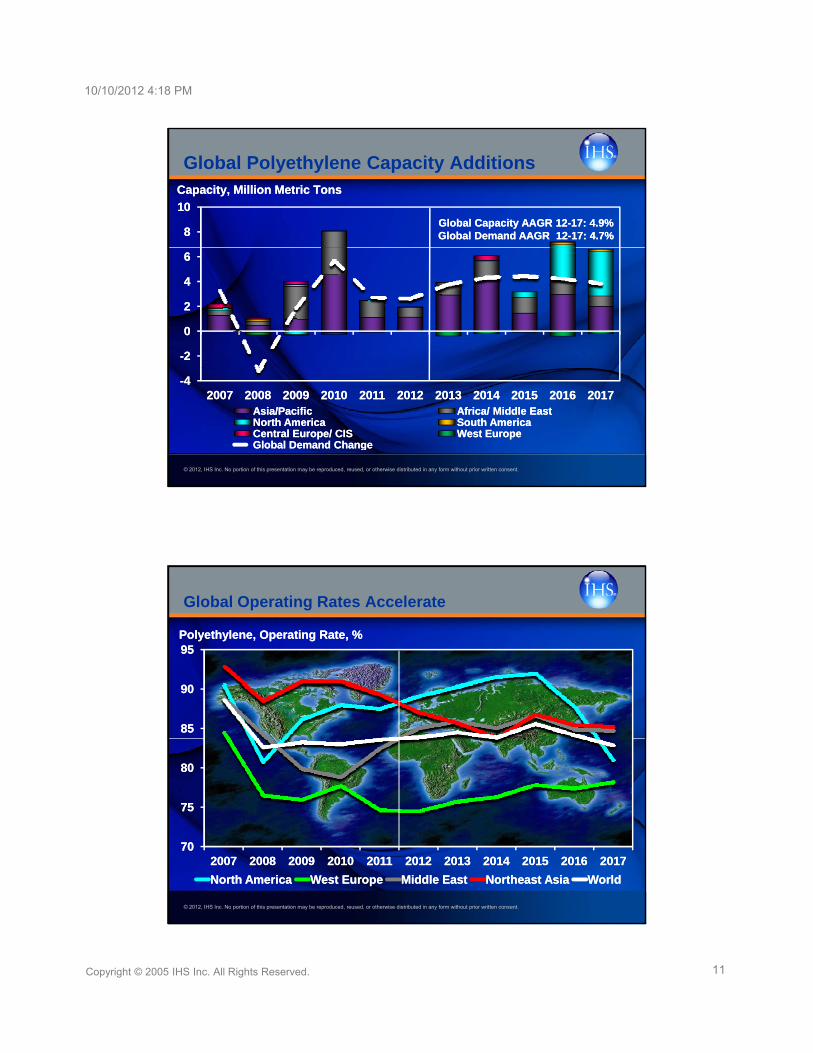
Capacity, Million Metric TonsCapacity, Million Metric Tons
Global Polyethylene Capacity Additions
Global Capacity AAGR 12Global Capacity AAGR 12--17: 4.9%17: 4.9%Global Demand AAGR 12Global Demand AAGR 12--17: 4.7%17: 4.7%
--22
00
22
44
66
© 2012, IHS Inc. No portion of this presentation may be reproduced, reused, or otherwise distributed in any form without prior written consent.
--4420072007 20082008 20092009 20102010 20112011 20122012 20132013 20142014 20152015 20162016 20172017
Asia/PacificAsia/Pacific Africa/ Middle EastAfrica/ Middle EastNorth AmericaNorth America South AmericaSouth AmericaCentral Europe/ CISCentral Europe/ CIS West EuropeWest EuropeGlobal Demand ChangeGlobal Demand Change
9090
9595Polyethylene, Operating Rate, %Polyethylene, Operating Rate, %
Global Operating Rates Accelerate
7575
8080
8585
9090
© 2012, IHS Inc. No portion of this presentation may be reproduced, reused, or otherwise distributed in any form without prior written consent.
7070
7575
20072007 20082008 20092009 20102010 20112011 20122012 20132013 20142014 20152015 20162016 20172017
North AmericaNorth America West EuropeWest Europe Middle EastMiddle East Northeast AsiaNortheast Asia WorldWorld
10/10/2012 4:18 PM
12Copyright © 2005 IHS Inc. All Rights Reserved.
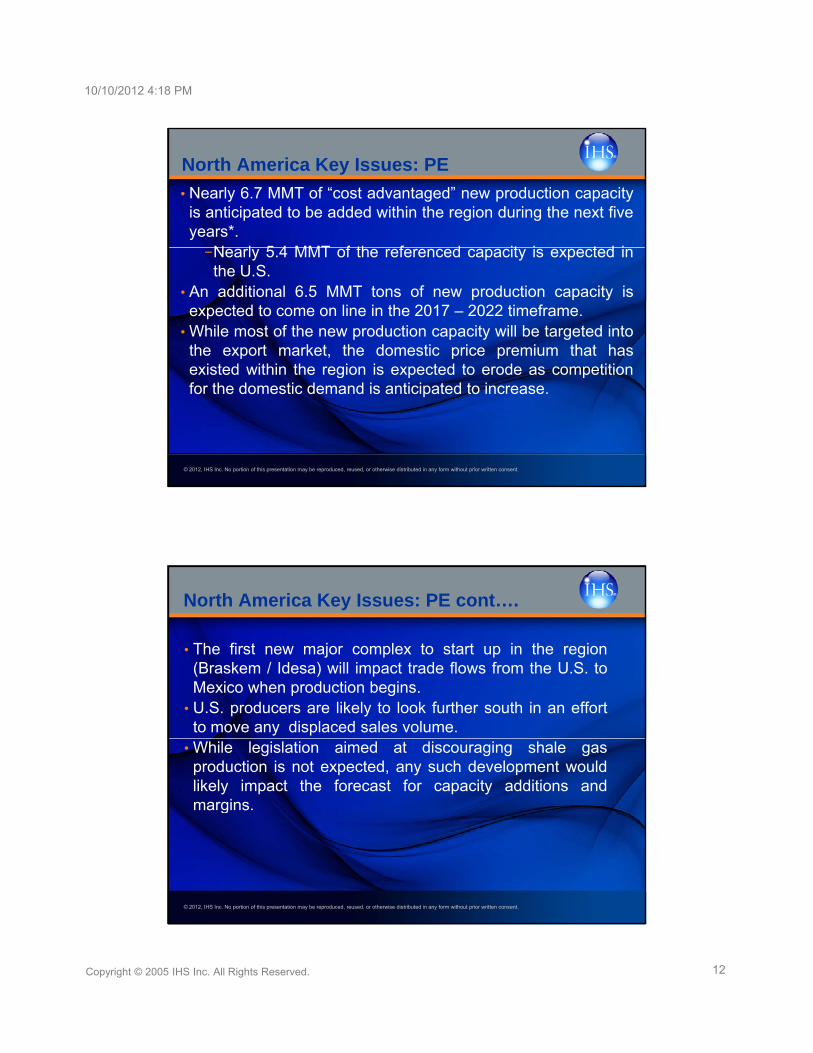
• Nearly 6.7 MMT of “cost advantaged” new production capacityis anticipated to be added within the region during the next fiveyears*.
N l 5 4 MMT f th f d it i t d i
North America Key Issues: PE
−Nearly 5.4 MMT of the referenced capacity is expected inthe U.S.
• An additional 6.5 MMT tons of new production capacity isexpected to come on line in the 2017 – 2022 timeframe.
• While most of the new production capacity will be targeted intothe export market, the domestic price premium that hasexisted within the region is expected to erode as competition
© 2012, IHS Inc. No portion of this presentation may be reproduced, reused, or otherwise distributed in any form without prior written consent.
existed within the region is expected to erode as competitionfor the domestic demand is anticipated to increase.
• The first new major complex to start up in the region(Braskem / Idesa) will impact trade flows from the U.S. toMexico when production begins
North America Key Issues: PE cont….
Mexico when production begins.• U.S. producers are likely to look further south in an effort
to move any displaced sales volume.• While legislation aimed at discouraging shale gas
production is not expected, any such development wouldlikely impact the forecast for capacity additions andmargins
© 2012, IHS Inc. No portion of this presentation may be reproduced, reused, or otherwise distributed in any form without prior written consent.
margins.
10/10/2012 4:18 PM
13Copyright © 2005 IHS Inc. All Rights Reserved.
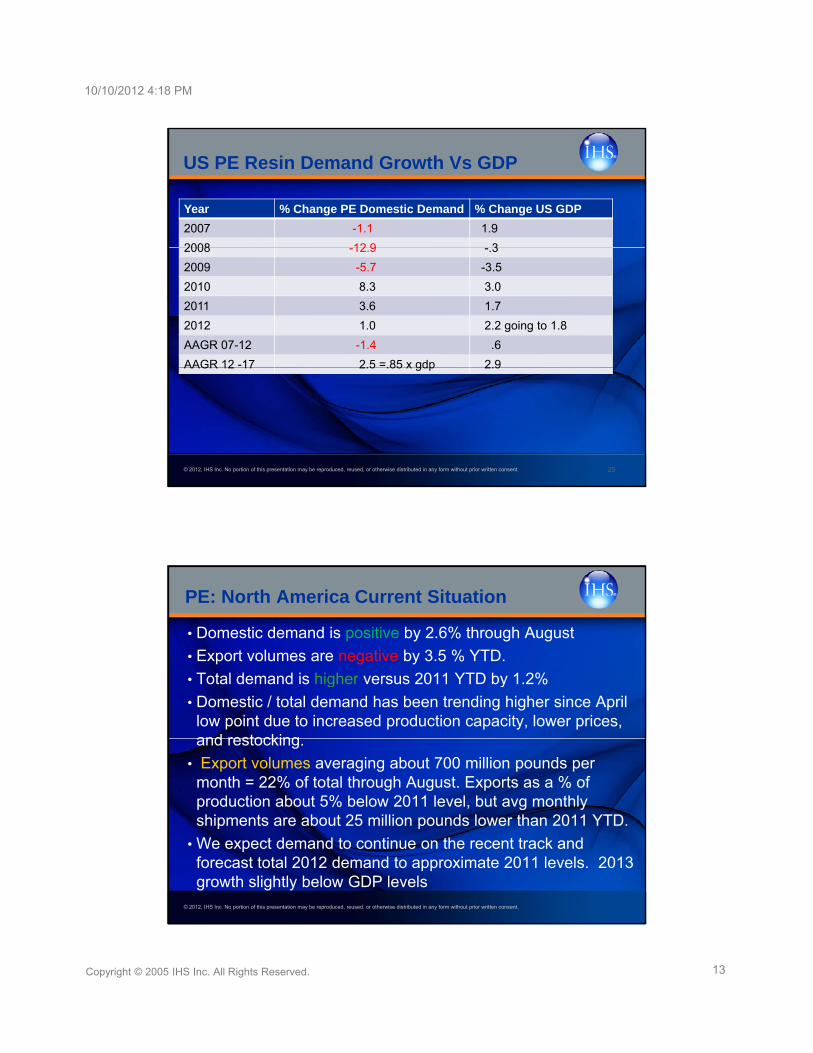
Year % Change PE Domestic Demand % Change US GDP
2007 -1.1 1.9
2008 12 9 3
US PE Resin Demand Growth Vs GDP
2008 -12.9 -.3
2009 -5.7 -3.5
2010 8.3 3.0
2011 3.6 1.7
2012 1.0 2.2 going to 1.8
AAGR 07-12 -1.4 .6
AAGR 12 -17 2.5 =.85 x gdp 2.9
© 2012, IHS Inc. No portion of this presentation may be reproduced, reused, or otherwise distributed in any form without prior written consent.
AAGR 12 17 2.5 .85 x gdp 2.9
25
PE: North America Current Situation
• Domestic demand is positive by 2.6% through August
• Export volumes are negative by 3.5 % YTD.
• Total demand is higher versus 2011 YTD by 1.2%g y
• Domestic / total demand has been trending higher since April low point due to increased production capacity, lower prices, and restocking.
• Export volumes averaging about 700 million pounds per month = 22% of total through August. Exports as a % of production about 5% below 2011 level but avg monthly
© 2012, IHS Inc. No portion of this presentation may be reproduced, reused, or otherwise distributed in any form without prior written consent.
production about 5% below 2011 level, but avg monthly shipments are about 25 million pounds lower than 2011 YTD.
• We expect demand to continue on the recent track and forecast total 2012 demand to approximate 2011 levels. 2013 growth slightly below GDP levels
10/10/2012 4:18 PM
14Copyright © 2005 IHS Inc. All Rights Reserved.
PE: N. America: Current + Forecast
• Contract PE prices increased 6.0 cents Jan – April due to tight ethylene and high spot / contract ethylene prices, but later declined by 14.0 cents over May/Juneprices, but later declined by 14.0 cents over May/June as supplies improved and ethylene prices collapsed.
• Prices recently rebounding with +5 in Aug achieved and +5 in October announced.
• Integrated margins were recently near record levels = 28 cpp in Aug vs ytd avg of 28.75 cpp. Rest of yr. avg
© 2012, IHS Inc. No portion of this presentation may be reproduced, reused, or otherwise distributed in any form without prior written consent.
pp g y g pp y gmargin = 25.5 cpp and 2013 avg of 25.3 cpp. Margins fcst to move higher and peak in 2015/2016 prior to start up of new capacity. Non int. margins only slightly positive today
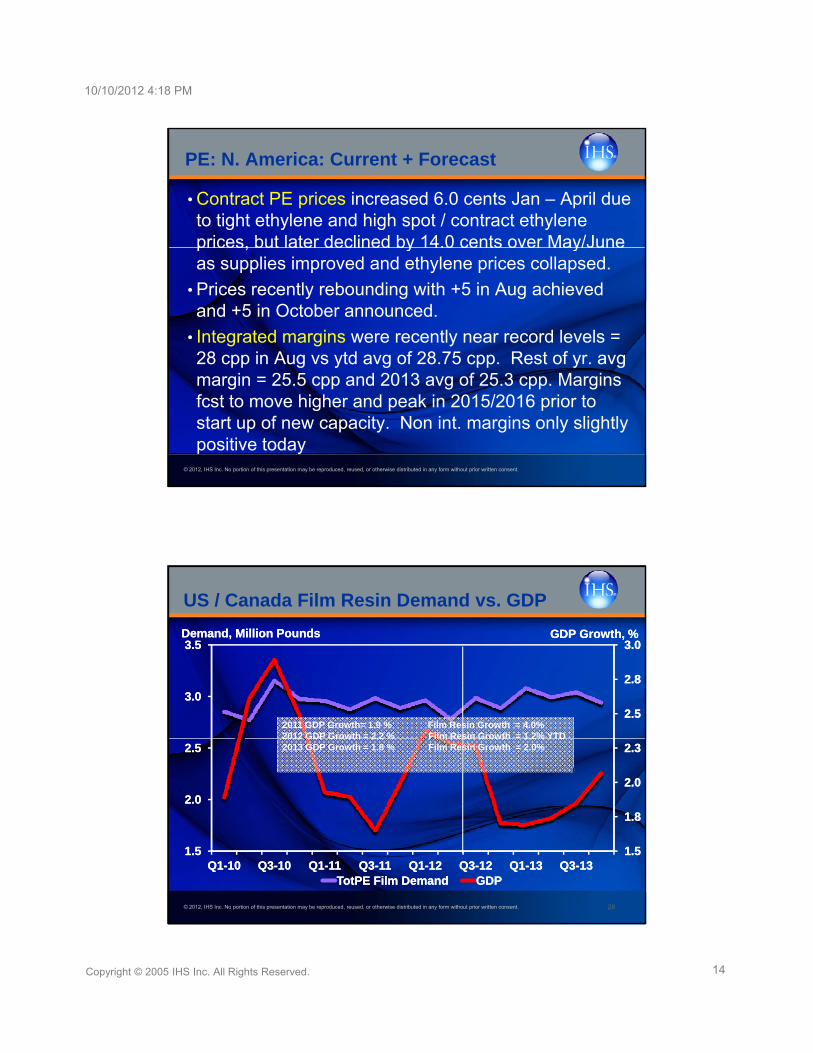
US / Canada Film Resin Demand vs. GDP
2.82.8
3.03.03.53.5Demand, Million PoundsDemand, Million Pounds GDPGDP Growth, %Growth, %
2.02.0
2.32.3
2.52.5
2.02.0
2.52.5
3.03.0
2011 GDP Growth= 1.9 % Film Resin Growth = 4.0% 2012 GDP Growth = 2.2 % Film Resin Growth = 1.2% YTD2013 GDP Growth = 1.8 % Film Resin Growth = 2.0%
© 2012, IHS Inc. No portion of this presentation may be reproduced, reused, or otherwise distributed in any form without prior written consent. 28
1.51.5
1.81.8
1.51.5Q1Q1--1010 Q3Q3--1010 Q1Q1--1111 Q3Q3--1111 Q1Q1--1212 Q3Q3--1212 Q1Q1--1313 Q3Q3--1313
TotPE Film DemandTotPE Film Demand GDPGDP
10/10/2012 4:18 PM
15Copyright © 2005 IHS Inc. All Rights Reserved.
HDPEHDPE Percent ChangePercent ChangeFilm 12 Mils and BelowFilm 12 Mils and Below 5 95 9
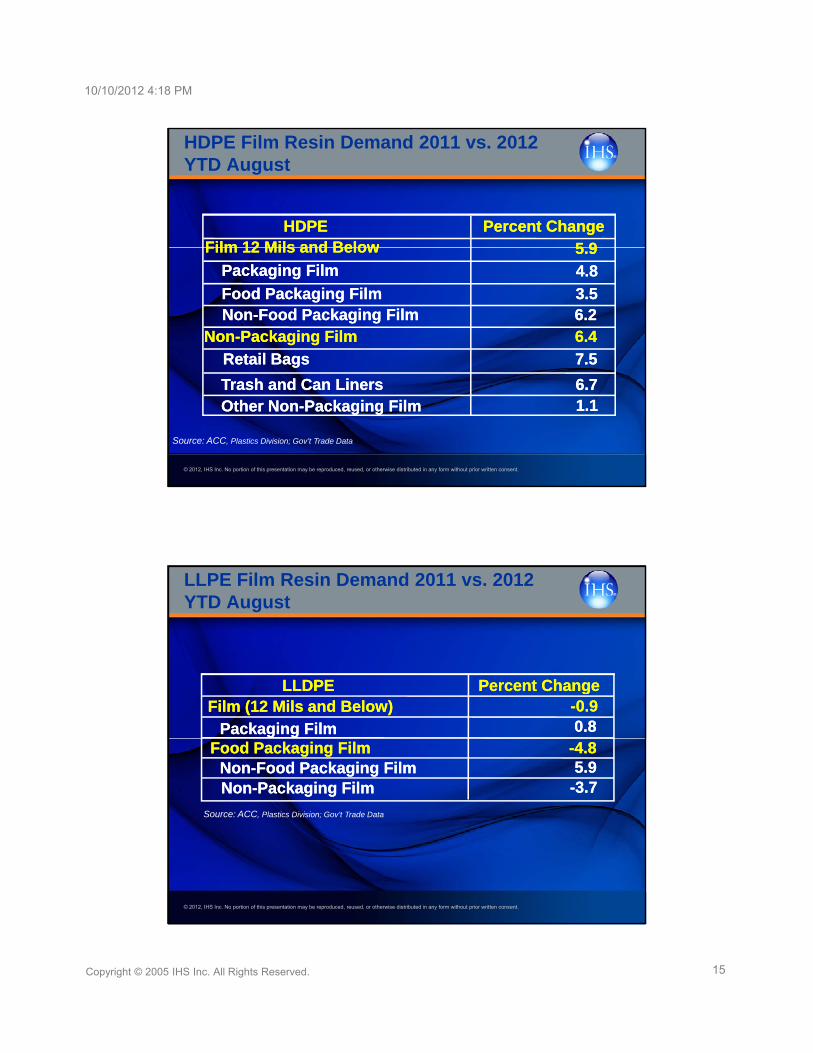
HDPE Film Resin Demand 2011 vs. 2012YTD August
Film 12 Mils and BelowFilm 12 Mils and Below 5.95.9Packaging FilmPackaging Film 4.84.8
Food Packaging FilmFood Packaging Film 3.53.5NonNon--Food Packaging FilmFood Packaging Film 6.26.2
NonNon--Packaging FilmPackaging Film 6.46.4
Retail BagsRetail Bags 7.57.5
© 2012, IHS Inc. No portion of this presentation may be reproduced, reused, or otherwise distributed in any form without prior written consent.
gg
Trash and Can LinersTrash and Can Liners 6.76.7Other NonOther Non--Packaging FilmPackaging Film 1.11.1
Source: ACC, Plastics Division; Gov’t Trade Data
LLDPELLDPE Percent ChangePercent Change
LLPE Film Resin Demand 2011 vs. 2012YTD August
LLDPELLDPE Percent ChangePercent Change--0.90.90.80.8
--4.84.85.95.9
--3.73.7NonNon--Food Packaging FilmFood Packaging FilmNonNon--Packaging FilmPackaging Film
Film (12 Mils and Below)Film (12 Mils and Below)
Packaging FilmPackaging FilmFood Food Packaging FilmPackaging Film
© 2012, IHS Inc. No portion of this presentation may be reproduced, reused, or otherwise distributed in any form without prior written consent.
Source: ACC, Plastics Division; Gov’t Trade Data
10/10/2012 4:18 PM
16Copyright © 2005 IHS Inc. All Rights Reserved.
LDPELDPE Percent ChangePercent Change
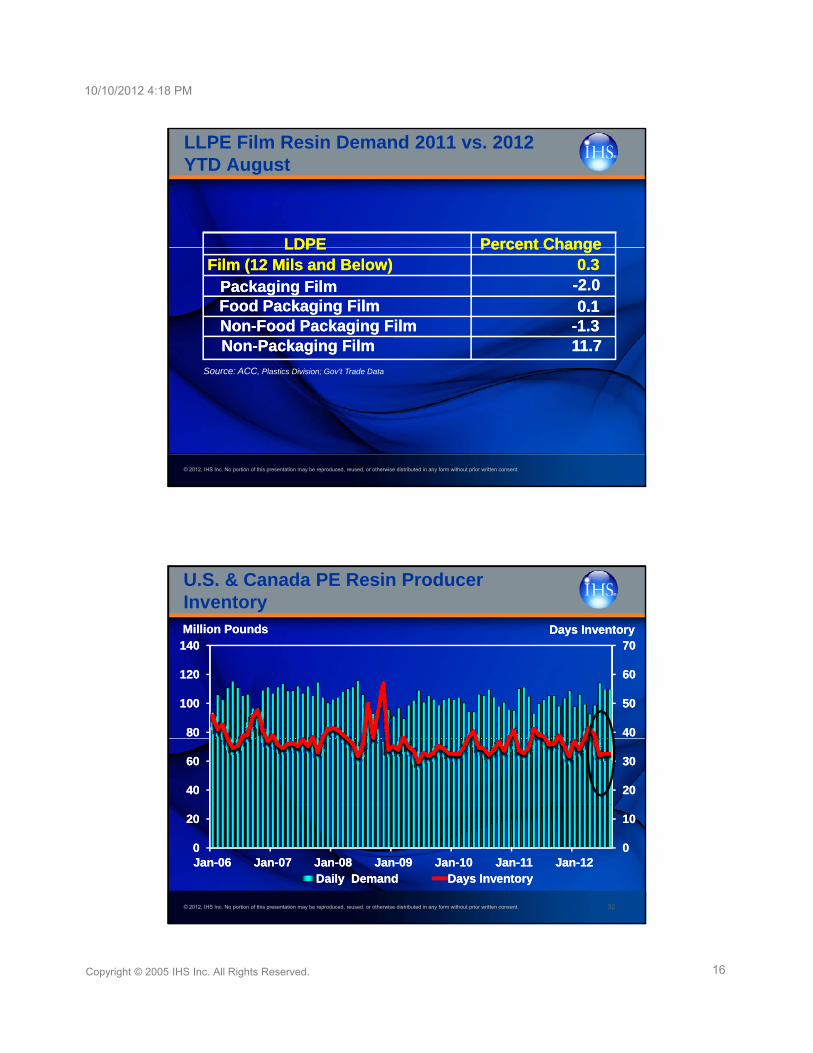
LLPE Film Resin Demand 2011 vs. 2012YTD August
LDPELDPE Percent ChangePercent Change0.30.3
--2.02.00.10.1
NonNon--Food Packaging FilmFood Packaging Film --1.31.3NonNon--Packaging FilmPackaging Film 11.711.7
Film (12 Mils and Below)Film (12 Mils and Below)Packaging FilmPackaging FilmFoodFood Packaging FilmPackaging Film
S CC
© 2012, IHS Inc. No portion of this presentation may be reproduced, reused, or otherwise distributed in any form without prior written consent.
Source: ACC, Plastics Division; Gov’t Trade Data
6060
7070
120120
140140Million PoundsMillion Pounds Days InventoryDays Inventory
U.S. & Canada PE Resin Producer Inventory
2020
3030
4040
5050
4040
6060
8080
100100
© 2012, IHS Inc. No portion of this presentation may be reproduced, reused, or otherwise distributed in any form without prior written consent. 32
00
1010
00
2020
JanJan--0606 JanJan--0707 JanJan--0808 JanJan--0909 JanJan--1010 JanJan--1111 JanJan--1212Daily DemandDaily Demand Days InventoryDays Inventory
10/10/2012 4:18 PM
17Copyright © 2005 IHS Inc. All Rights Reserved.
8080
9090
100100
Cents Per PoundCents Per Pound
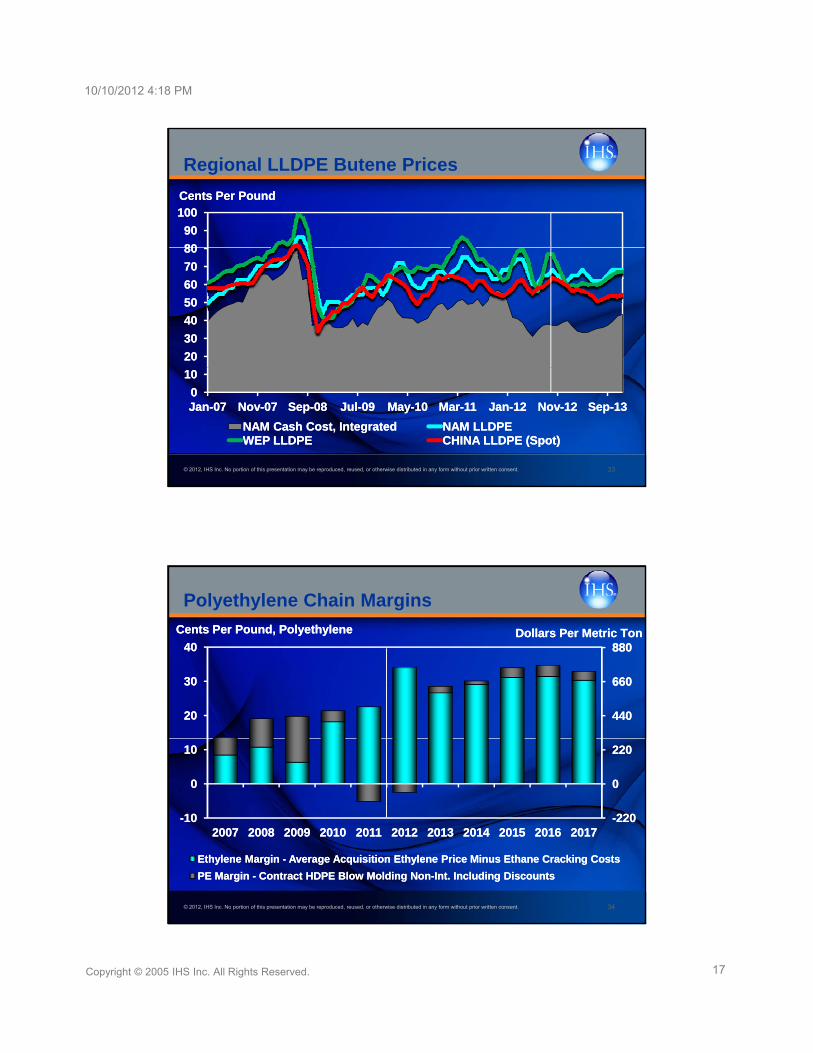
Regional LLDPE Butene Prices
2020
3030
4040
5050
6060
7070
8080
© 2012, IHS Inc. No portion of this presentation may be reproduced, reused, or otherwise distributed in any form without prior written consent. 33
00
1010
JanJan--0707 NovNov--0707 SepSep--0808 JulJul--0909 MayMay--1010 MarMar--1111 JanJan--1212 NovNov--1212 SepSep--1313
NAM Cash Cost, IntegratedNAM Cash Cost, Integrated NAM LLDPENAM LLDPEWEP LLDPEWEP LLDPE CHINA LLDPE (Spot)CHINA LLDPE (Spot)
Polyethylene Chain Margins
660660
880880
3030
4040
Cents Per Cents Per Pound, Pound, PolyethylenePolyethylene Dollars Per MetricDollars Per Metric TonTon
00
220220
440440
660660
00
1010
2020
3030
© 2012, IHS Inc. No portion of this presentation may be reproduced, reused, or otherwise distributed in any form without prior written consent. 34
--220220--101020072007 20082008 20092009 20102010 20112011 20122012 20132013 20142014 20152015 20162016 20172017
Ethylene Margin Ethylene Margin -- Average Acquisition Ethylene Price Minus Ethane Cracking CostsAverage Acquisition Ethylene Price Minus Ethane Cracking Costs
PE Margin PE Margin -- Contract HDPE Blow Molding NonContract HDPE Blow Molding Non--Int. Including DiscountsInt. Including Discounts
10/10/2012 4:18 PM
18Copyright © 2005 IHS Inc. All Rights Reserved.
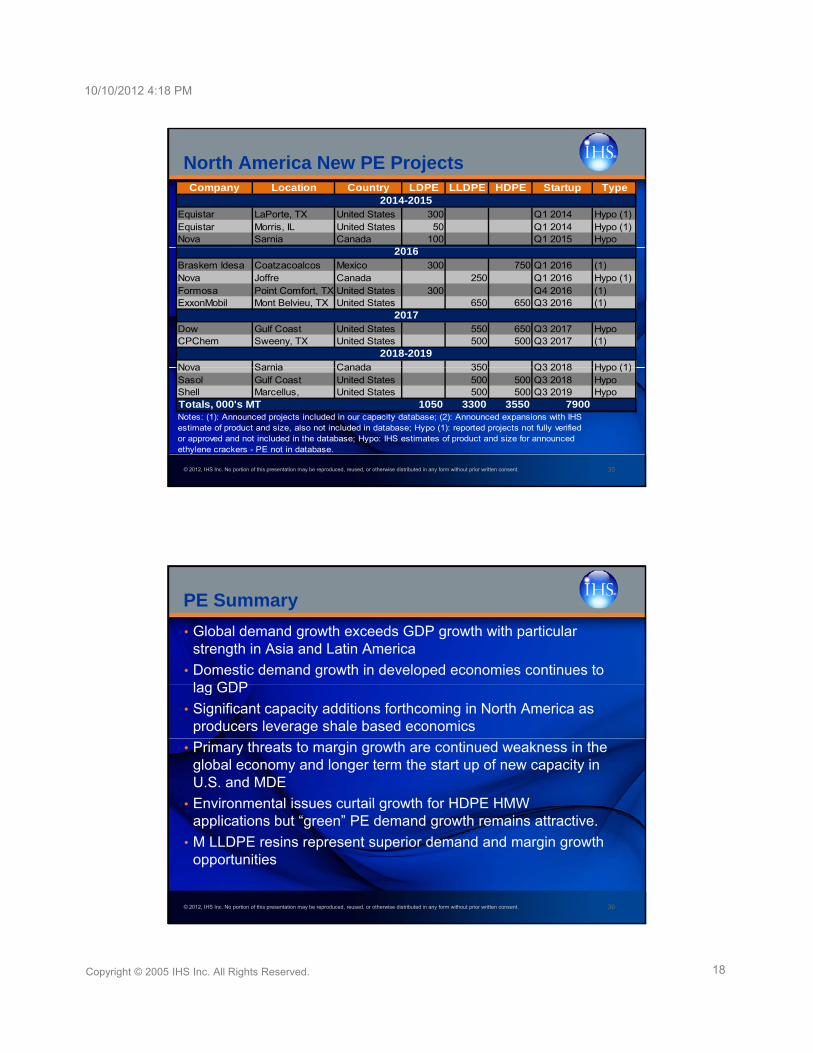
North America New PE ProjectsCompany Location Country LDPE LLDPE HDPE Startup Type
2014-2015Equistar LaPorte, TX United States 300 Q1 2014 Hypo (1)Equistar Morris, IL United States 50 Q1 2014 Hypo (1)Nova Sarnia Canada 100 Q1 2015 Hypo
20162016Braskem Idesa Coatzacoalcos Mexico 300 750 Q1 2016 (1)Nova Joffre Canada 250 Q1 2016 Hypo (1)Formosa Point Comfort, TX United States 300 Q4 2016 (1)ExxonMobil Mont Belvieu, TX United States 650 650 Q3 2016 (1)
2017Dow Gulf Coast United States 550 650 Q3 2017 HypoCPChem Sweeny, TX United States 500 500 Q3 2017 (1)
2018-2019Nova Sarnia Canada 350 Q3 2018 Hypo (1)
© 2012, IHS Inc. No portion of this presentation may be reproduced, reused, or otherwise distributed in any form without prior written consent. 35
Nova Sarnia Canada 350 Q3 2018 Hypo (1)Sasol Gulf Coast United States 500 500 Q3 2018 HypoShell Marcellus, United States 500 500 Q3 2019 HypoTotals, 000's MT 1050 3300 3550 7900Notes: (1): Announced projects included in our capacity database; (2): Announced expansions with IHS estimate of product and size, also not included in database; Hypo (1): reported projects not fully verifiedor approved and not included in the database; Hypo: IHS estimates of product and size for announced ethylene crackers - PE not in database.
• Global demand growth exceeds GDP growth with particular strength in Asia and Latin America
• Domestic demand growth in developed economies continues to lag GDP
PE Summary
lag GDP
• Significant capacity additions forthcoming in North America as producers leverage shale based economics
• Primary threats to margin growth are continued weakness in the global economy and longer term the start up of new capacity in U.S. and MDE
• Environmental issues curtail growth for HDPE HMW
© 2012, IHS Inc. No portion of this presentation may be reproduced, reused, or otherwise distributed in any form without prior written consent.
• Environmental issues curtail growth for HDPE HMW applications but “green” PE demand growth remains attractive.
• M LLDPE resins represent superior demand and margin growth opportunities
36
10/10/2012 4:18 PM
19Copyright © 2005 IHS Inc. All Rights Reserved.
Outlook for Polypropylene
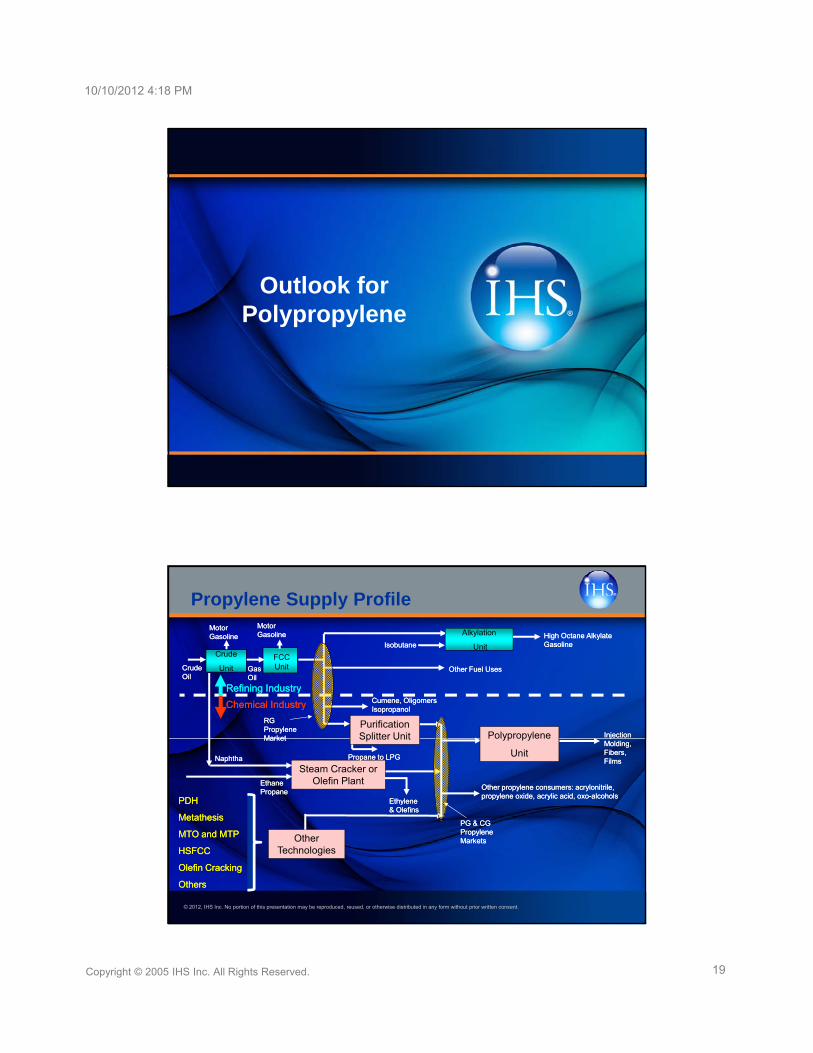
Propylene Supply Profile
FCC Unit
Alkylation
UnitIsobutaneIsobutaneHigh Octane High Octane AlkylateAlkylateGasolineGasoline
Other Fuel UsesOther Fuel Uses
R fi i I d tR fi i I d t
Gas Gas OilOil
Crude
UnitCrude Crude OilOil
Motor Motor GasolineGasoline
Motor Motor GasolineGasoline
Steam Cracker or Olefin PlantEthane Ethane
PropanePropaneOther propylene consumers: Other propylene consumers: acrylonitrileacrylonitrile, , propylene oxide, acrylic acid, propylene oxide, acrylic acid, oxooxo--alcoholsalcohols
Propane to LPGPropane to LPG
CumeneCumene, , OligomersOligomersIsopropanolIsopropanol
Purification Splitter Unit
Refining IndustryRefining Industry
Chemical IndustryChemical Industry
RG RG Propylene Propylene MarketMarket
NaphthaNaphtha
Ethylene Ethylene
Polypropylene
Unit
Injection Injection Molding, Molding, Fibers, Fibers, FilmsFilms
PDHPDH
© 2012, IHS Inc. No portion of this presentation may be reproduced, reused, or otherwise distributed in any form without prior written consent.
Other Technologies
PG & CG PG & CG Propylene Propylene MarketsMarkets
yy& Olefins& Olefins
MetathesisMetathesis
MTO and MTPMTO and MTP
HSFCCHSFCC
Olefin Olefin CrackingCracking
OthersOthers
10/10/2012 4:18 PM
20Copyright © 2005 IHS Inc. All Rights Reserved.
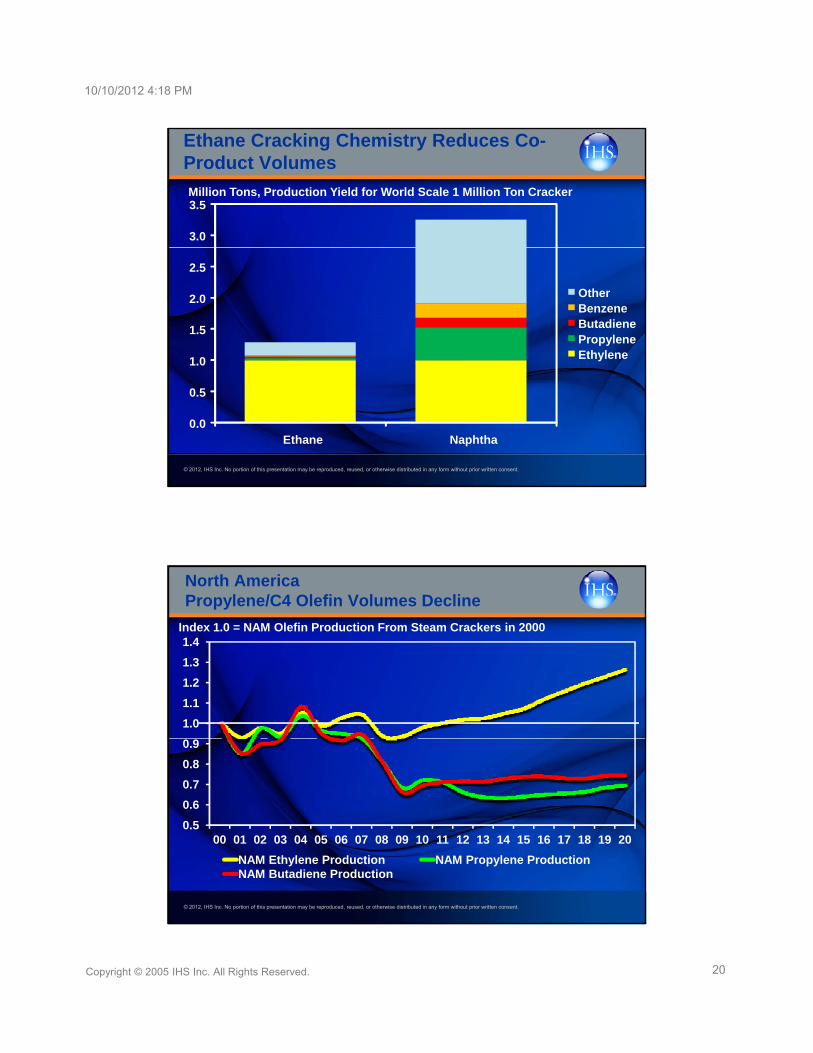
Ethane Cracking Chemistry Reduces Co-Product Volumes
3.0
3.5Million Tons, Production Yield for World Scale 1 Million Ton Cracker
1.0
1.5
2.0
2.5
OtherBenzeneButadienePropyleneEthylene
© 2012, IHS Inc. No portion of this presentation may be reproduced, reused, or otherwise distributed in any form without prior written consent.
0.0
0.5
Ethane Naphtha
North AmericaPropylene/C4 Olefin Volumes Decline
1.2
1.3
1.4Index 1.0 = NAM Olefin Production From Steam Crackers in 2000
0 6
0.7
0.8
0.9
1.0
1.1
1.2
© 2012, IHS Inc. No portion of this presentation may be reproduced, reused, or otherwise distributed in any form without prior written consent.
0.5
0.6
00 01 02 03 04 05 06 07 08 09 10 11 12 13 14 15 16 17 18 19 20
NAM Ethylene Production NAM Propylene ProductionNAM Butadiene Production
10/10/2012 4:18 PM
21Copyright © 2005 IHS Inc. All Rights Reserved.
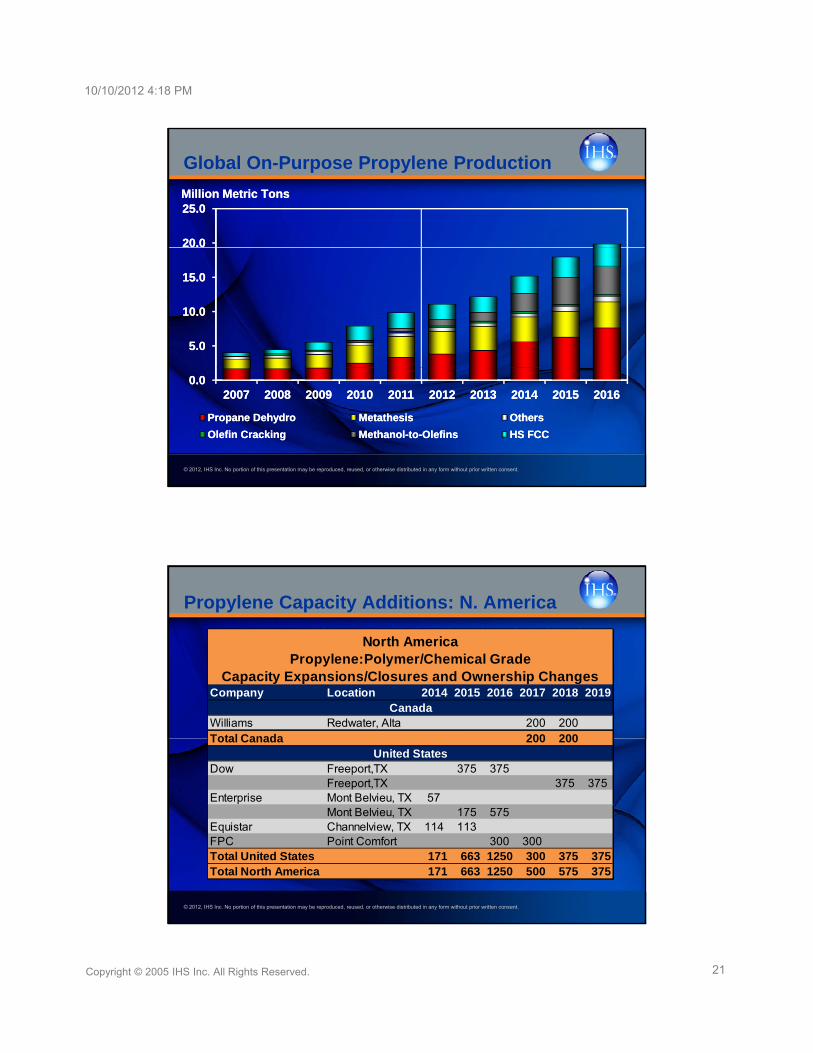
Global On-Purpose Propylene Production
20.020.0
25.025.0Million Metric TonsMillion Metric Tons
5.05.0
10.010.0
15.015.0
© 2012, IHS Inc. No portion of this presentation may be reproduced, reused, or otherwise distributed in any form without prior written consent.
0.00.020072007 20082008 20092009 20102010 20112011 20122012 20132013 20142014 20152015 20162016
Propane DehydroPropane Dehydro MetathesisMetathesis OthersOthers
Olefin CrackingOlefin Cracking MethanolMethanol--toto--OlefinsOlefins HS FCCHS FCC
Propylene Capacity Additions: N. America
North AmericaPropylene:Polymer/Chemical Grade
Capacity Expansions/Closures and Ownership ChangesCompany Location 2014 2015 2016 2017 2018 2019
Williams Redwater, Alta 200 200Total Canada 200 200
Dow Freeport,TX 375 375Freeport,TX 375 375
Enterprise Mont Belvieu, TX 57
Canada
United States
© 2012, IHS Inc. No portion of this presentation may be reproduced, reused, or otherwise distributed in any form without prior written consent.
Mont Belvieu, TX 175 575Equistar Channelview, TX 114 113FPC Point Comfort 300 300Total United States 171 663 1250 300 375 375Total North America 171 663 1250 500 575 375
10/10/2012 4:18 PM
22Copyright © 2005 IHS Inc. All Rights Reserved.
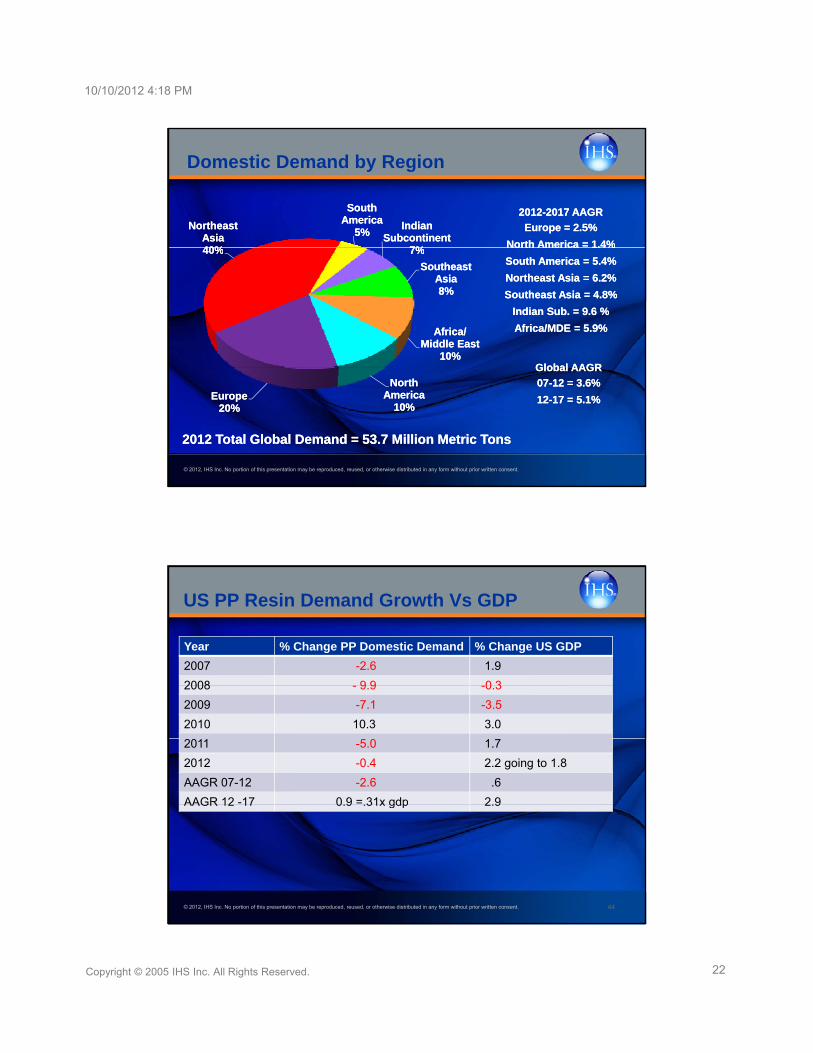
Domestic Demand by Region
South South AmericaAmerica
5%5%Indian Indian
SubcontinentSubcontinent7%7%
Northeast Northeast AsiaAsia40%40%
20122012--2017 AAGR2017 AAGR
Europe = 2.5%Europe = 2.5%
North America = 1.4%North America = 1.4%7%7%
Southeast Southeast AsiaAsia8%8%
Africa/ Africa/ Middle EastMiddle East
10%10%
40%40% North America 1.4%North America 1.4%
South America = 5.4%South America = 5.4%
Northeast Asia = 6.2%Northeast Asia = 6.2%
Southeast Asia = 4.8%Southeast Asia = 4.8%
Indian Sub. = 9.6 %Indian Sub. = 9.6 %
Africa/MDE = 5.9%Africa/MDE = 5.9%
Global AAGRGlobal AAGR
© 2012, IHS Inc. No portion of this presentation may be reproduced, reused, or otherwise distributed in any form without prior written consent.
North North AmericaAmerica
10%10%EuropeEurope
20%20%
2012 Total Global Demand = 53.7 Million Metric Tons2012 Total Global Demand = 53.7 Million Metric Tons
Global AAGRGlobal AAGR
0707--12 = 3.6%12 = 3.6%
1212--17 = 5.1%17 = 5.1%
Year % Change PP Domestic Demand % Change US GDP
2007 -2.6 1.9
2008 9 9 0 3
US PP Resin Demand Growth Vs GDP
2008 - 9.9 -0.3
2009 -7.1 -3.5
2010 10.3 3.0
2011 -5.0 1.7
2012 -0.4 2.2 going to 1.8
AAGR 07-12 -2.6 .6
AAGR 12 -17 0.9 =.31x gdp 2.9
© 2012, IHS Inc. No portion of this presentation may be reproduced, reused, or otherwise distributed in any form without prior written consent.
AAGR 12 17 0.9 .31x gdp 2.9
44
10/10/2012 4:18 PM
23Copyright © 2005 IHS Inc. All Rights Reserved.
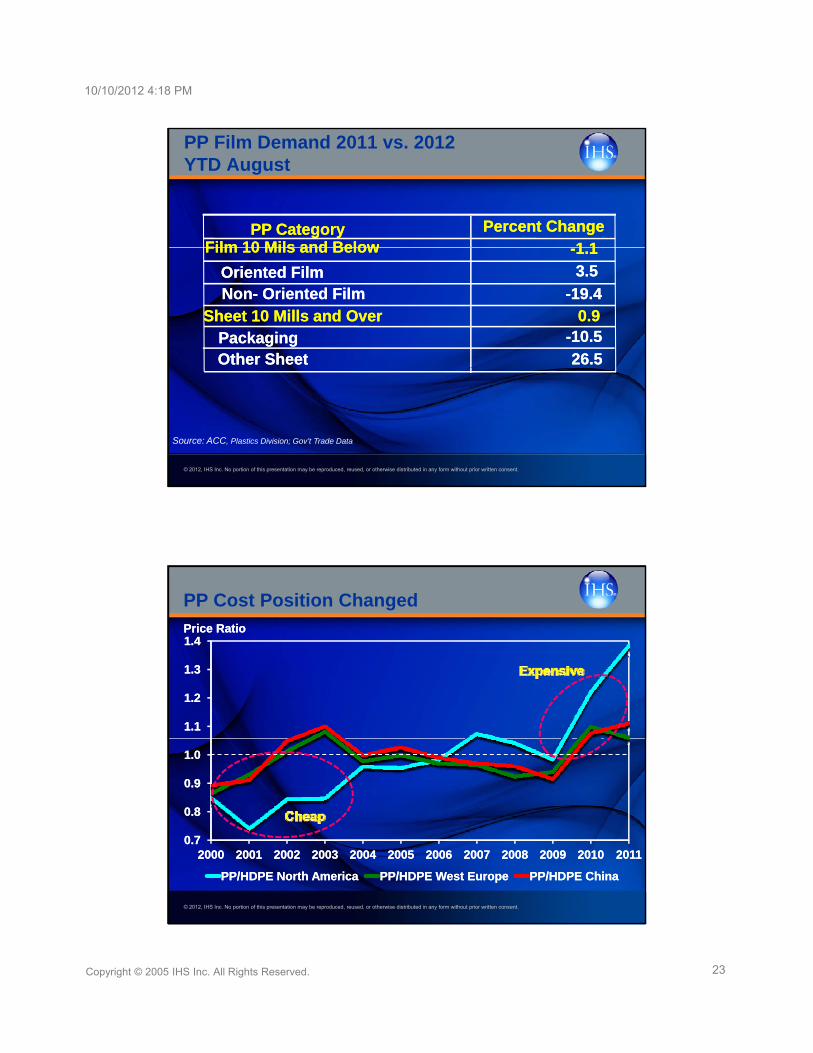
PP Category PP Category Percent ChangePercent ChangeFilmFilm 1010 Mils and BelowMils and Below 1 11 1
PP Film Demand 2011 vs. 2012YTD August
Film Film 10 10 Mils and BelowMils and Below --1.11.1
Oriented FilmOriented Film 3.53.5
NonNon-- Oriented Oriented FilmFilm --19.419.4Sheet 10 Mills and OverSheet 10 Mills and Over
PackagingPackaging26.526.5Other SheetOther Sheet
0.90.9--10.510.5
© 2012, IHS Inc. No portion of this presentation may be reproduced, reused, or otherwise distributed in any form without prior written consent.
Source: ACC, Plastics Division; Gov’t Trade Data
PP Cost Position Changed
1.31.3
1.41.4Price RatioPrice Ratio
0.90.9
1.01.0
1.11.1
1.21.2
© 2012, IHS Inc. No portion of this presentation may be reproduced, reused, or otherwise distributed in any form without prior written consent.
0.70.7
0.80.8
20002000 20012001 20022002 20032003 20042004 20052005 20062006 20072007 20082008 20092009 20102010 20112011
PP/HDPE North AmericaPP/HDPE North America PP/HDPE West EuropePP/HDPE West Europe PP/HDPE ChinaPP/HDPE China
10/10/2012 4:18 PM
24Copyright © 2005 IHS Inc. All Rights Reserved.
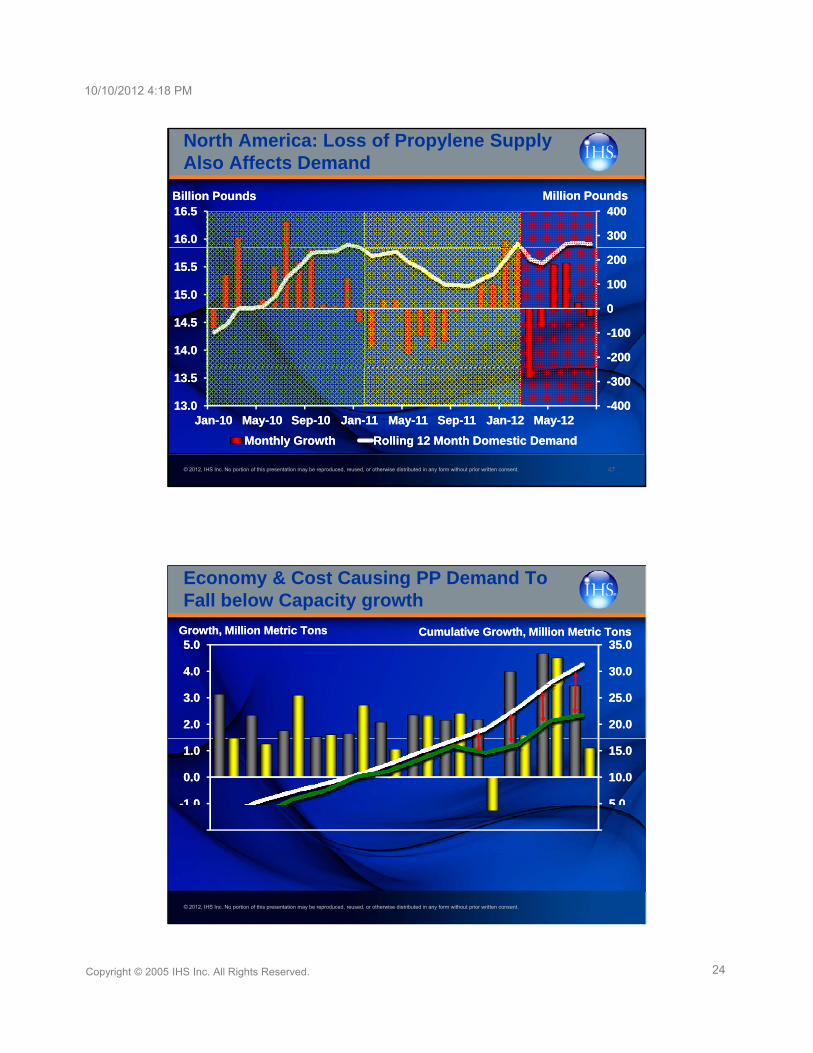
North America: Loss of Propylene Supply Also Affects Demand
300300
400400
16.016.0
16.516.5Billion PoundsBillion Pounds Million PoundsMillion Pounds
--200200
--100100
00
100100
200200
14.014.0
14.514.5
15.015.0
15.515.5
© 2012, IHS Inc. No portion of this presentation may be reproduced, reused, or otherwise distributed in any form without prior written consent. 47
--400400
--300300
13.013.0
13.513.5
JanJan--1010 MayMay--1010 SepSep--1010 JanJan--1111 MayMay--1111 SepSep--1111 JanJan--1212 MayMay--1212
Monthly GrowthMonthly Growth Rolling 12 Month Domestic DemandRolling 12 Month Domestic Demand
Economy & Cost Causing PP Demand To Fall below Capacity growth
30.030.0
35.035.0
4.04.0
5.05.0Growth, Million Metric TonsGrowth, Million Metric Tons Cumulative Growth, Million Metric TonsCumulative Growth, Million Metric Tons
5 05 0
10.010.0
15.015.0
20.020.0
25.025.0
--1 01 0
0.00.0
1.01.0
2.02.0
3.03.0
© 2012, IHS Inc. No portion of this presentation may be reproduced, reused, or otherwise distributed in any form without prior written consent.