Embed Size (px)
Citation preview
EU-28 Tree Nuts Annual 2018 1
THIS REPORT CONTAINS ASSESSMENTS OF COMMODITY AND TRADE ISSUES MADE BY
USDA STAFF AND NOT NECESSARILY STATEMENTS OF OFFICIAL U.S. GOVERNMENT
POLICY
Required Report - public distribution
Date: 9/12/2018
GAIN Report Number: SP1824
EU-28
Tree Nuts Annual 2018
The European Market Continues to Present Opportunities for
U.S. Tree Nuts
Approved By:
Jennifer Clever, Agricultural Attaché
Prepared By:
Arantxa Medina, Marketing and Management Assistant
Report Highlights:
The European Union-28 (EU-28) is the largest export market for U.S. tree nuts. In 2017, tree nut
shipments from the United States to the EU-28 reached $2.7 billion. Sales of U.S. almonds (both in-
shell and shelled) totaled $1.5 billion, followed by pistachios with $446 million and walnuts with
almost $344 million. The growing popularity of healthier snacking and eating habits among European
consumers is expected to continue fueling consumption and sales of U.S. tree nuts.
EU-28 Tree Nuts Annual 2018 2
Disclaimer: This report presents the situation and outlook for tree nuts (almonds, walnuts and
pistachios) in the EU-28. This report presents the views of the authors and does not reflect the official
views of the U.S. Department of Agriculture (USDA). The data are not official USDA data.
This report would not have been possible without the valuable expert contributions from the following
Foreign Agricultural Service analysts: Lucile Lefebvre, FAS/Paris covering France Mila Boshnakova, FAS/Sofia covering Bulgaria Ornella Bettini, FAS/Rome covering Italy Monica Dobrescu, FAS/Bucharest covering Romania Marcel Pinckaers, FAS/The Hague covering the Benelux Gerda Vandercammen, FAS/Brussels covering EU policy
Abbreviations and definitions used in this report: Conversion factors: conversion factor is used to convert shelled to in-shell tree nuts.
Almonds: 0.6 Walnuts: 2.34 Pistachios: 2.0
GTA Global Trade Atlas Ha hectare; 1 ha = 2.471 acres
HS Codes: Harmonized System codes for commodity classification used to calculate trade data.
Almonds: Shelled 080212; In-shell 080211 Walnuts: Shelled 080232; In-shell 080231 Pistachios: In-shell 080251, Shelled 080252 (since January 2012)
MT Metric ton = 1,000 kg EU MS European Union Member State(s) USD U.S. Dollar (Exchange rate at time of publishing €1=US$ 1.16)
EU-28 Tree Nuts Annual 2018 3
Executive Summary:
EU and US: remain key trading partners
The European Union-28 (EU-28) is the largest export market for U.S. tree nuts absorbing 32 percent of
total U.S. tree nuts in 2017. East Asia followed importing 27 percent of total tree nut exports while the
Middle East imported 12 percent.
In 2017, tree nut shipments from the United States to the EU-28 reached $2.7 billion. Sales of U.S.
almonds (both in-shell and shelled) totaled $1.5 billion, followed by pistachios with $446 million and
walnuts with almost $344 million. Within the EU, the most important trade partners for U.S. tree nuts
are (in order of importance) Spain, Germany and the Netherlands, accounting for almost 63 percent of
total EU-28 imports.
The United States continues to be the largest supplier of tree nuts for Europe, with 37 percent of
market share value in 2017. Turkey ranks second with a market share of 20 percent, followed by
Vietnam, Chile and India. Almond continues to be the main imported tree nut with almost 22 percent
of the total EU tree nuts imports.
Food processing and snack industry remain key buyers of tree nuts
The European food processing and snack industry are the large users of tree nuts both as an ingredient,
for traditional sweets and pastries, and for re-processing and re-export to third countries. Almonds are
mainly used as an ingredient for producing marzipan, nougat, turron (Spanish typical Christmas
confection) and many other pastries and sweets. European food manufacturers also use walnuts and
pistachio nuts as an ingredient for manufacturing ice cream and confectionary products.
The snacking industry is making efforts to offer consumers new products and new ways to consume
nuts. However, industry insiders observe that introducing new products is not easy especially in
traditional markets such as Spain and Italy, where consumers have shown that in most occasions they
still prefer more familiar food options.
Thus, due to the mature nature of the European market, manufacturers are focusing their strategies on
launching new value-added products rather than focusing on volume sales. They are also increasing to
highlight the health benefits of tree nuts, both through advertising campaigns and in packaging.
Expanding business in the EU market
Since the EU remains a key export market for U.S. tree nuts, exporters continue to explore ways to
expand their overseas business. Trade shows are an excellent opportunity both to get to know the
market and to meet potential importers. Some of Europe’s leading trade shows for tree nuts are:
USDA-Endorsed Trade Shows
EU-28 Tree Nuts Annual 2018 4
SIAL October 21-25, 2018 Paris, France
One of the largest and most important international marketplace for foodservice professionals, with
7,200 exhibitors and 160,000 visitors.
Fruit Logistica February 6-8, 2019 Berlin, Germany
Europe’s main international fresh produce trade show with more than 3,000 exhibitors and 78,000
visitors.
Biofach February 13-16, 2019 Nuremberg, Germany
Leading trade fair for organic food covering food, drinks and non-food products, with 3,218 exhibitors
and 50,000 trade visitors from 134 countries participating in the previous edition.
Anuga October 5-9, 2019 Cologne, Germany
Trade fair for the international food industry. In 2017, 7,405 exhibitors from 107 countries and
165,000 visitors participated in this show.
Other Relevant (Non-Endorsed) Trade Shows
Snackex June 27-28, 2019 Barcelona, Spain
Alimentaria April 20-23, 2020 Barcelona, Spain
Food Ingredients December 3-5, 2019 Paris, France
Health Ingredients November 27-29, 2018 Frankfurt, Germany
Vitafoods May 17-19, 2019 Geneva, Switzerland
PLMA May 21-22, 2019 Amsterdam, Netherlands
New-to-market exporters interested in getting a better understanding of EU food regulations and market
opportunities are highly encouraged to reference the EU-28 Food and Agricultural Import Regulations
and Standards (FAIRS) reports and Exporter Guides produced at the various EU FAS Offices.
U.S. cooperators active in the EU
Trade associations like the Almond Board of California, American Pistachio Growers and California
Walnut Commission continue to develop strategies for the EU market. These trade associations, or
“cooperators,” in cooperation with FAS offices all over Europe, continuously work to increase market
opportunities for U.S. tree nuts.
Commodities:
Almonds, Shelled Basis
Production:
EU-28 Tree Nuts Annual 2018 5
The European Union is one of the world’s leading producers and consumers of almonds. Furthermore,
the EU is the single largest export market for California almonds with Spain as the leading European
importer. Every year, California almond production is exported to more than 100 countries with the EU-
28 representing approximately one third of all California’s almond exports.
Spanish almond production continues its upward trend. Currently, high almond prices are increasing the
number of hectares of almond production as an alternative to less profitable crops. In recent seasons,
new almond varieties, more modern irrigation techniques, and good prices have made the almond crop
more profitable for investors and improved industry expectations.
For MY 2018/19, the latest official forecast published by the Ministry of Agriculture and Fisheries,
Food and Environment (MAPAMA) estimates a production of 84,000 MT (shelled basis). This
preliminary figure denotes nearly 9 percent increase compared to previous year’s crop. New
production areas with integrated irrigation systems, favorable weather conditions, and higher yield
support the forecast increase.
Xylella fastidiosa represents a growing threat for Spanish tree nuts production. In response, Spain is
putting in place contingency plans to limit the expansion of the outbreaks of this bacterium. Xylella
fastidiosa can devastate fruit trees plantations, including tree nut groves. Following the requirement
established in Article 6 of EU Commission Implementing Decision 2015/879 as amended, thus far,
available phytosanitary solutions include destroying affected plant material, increased border control,
and the ban on the movement of plant material from the affected regions. Please see link (Spanish
language only) for Spain’s containment plan. As of the date of this report, outbreaks in Spanish almond
groves have been declared in the Balearic Islands and the Valencia Region (Valencia and Alicante).
Following Spain, Italy is the second largest EU-28 almond producer. Sicily and Puglia are the main
almond-producing areas, cumulatively accounting for approximately 88 percent of Italy’s total supply.
Tuono, Pizzuta d'Avola, Fascionello, Filippo Ceo, Fragiulio Grande, Genco, Falsa Barese, Ferragnés are
the leading varieties grown in the country. Italy’s MY 2018/19 almond production is forecast to
increase by approximately 2.6 percent compared to the previous marketing year due to new orchards
operating in Puglia compensating for lower volumes in Sicily. Quality is expected to be excellent due to
beneficial rains that occurred from May to August.
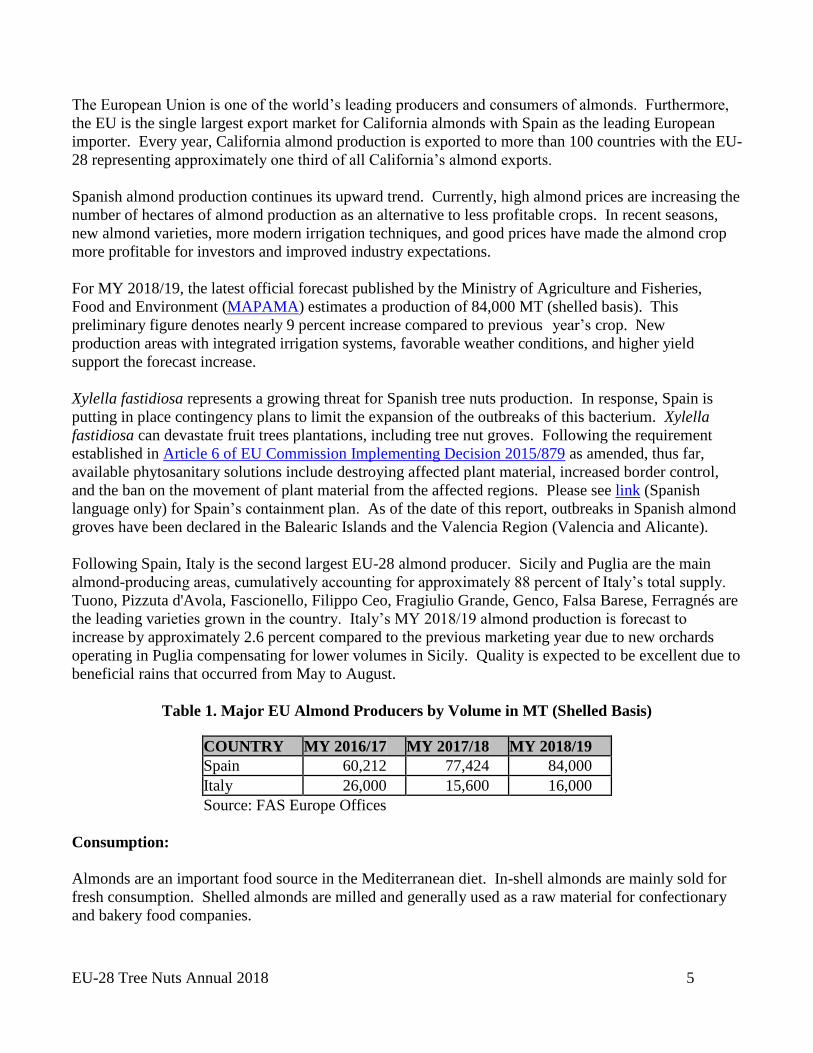
Table 1. Major EU Almond Producers by Volume in MT (Shelled Basis)
COUNTRY MY 2016/17 MY 2017/18 MY 2018/19
Spain 60,212 77,424 84,000
Italy 26,000 15,600 16,000
Source: FAS Europe Offices
Consumption:
Almonds are an important food source in the Mediterranean diet. In-shell almonds are mainly sold for
fresh consumption. Shelled almonds are milled and generally used as a raw material for confectionary
and bakery food companies.
EU-28 Tree Nuts Annual 2018 6
Tree nuts imports are indispensable for EU consumers. The growing popularity of healthier snacking
and eating habits among European consumers is expected to continue driving consumption of tree nuts.
Recent publications of scientific studies highlighting the health benefits of tree nut consumption in
preventing cardiovascular disease are reportedly increasing consumer awareness. Traditionally,
consumers prefer locally grown products mainly due to consumer loyalty and habits, but since local tree
nut production is not enough to satisfy the enormous demand, imports aid in satisfying domestic
consumption. Also, pricing plays a key role as domestic production leads to higher prices, pushing
consumers to look for lower prices in imported varieties.
Trade:
Imports
In MY 2016/17, the United States was the main source of almonds for European importers. U.S.
almonds face competition from locally grown almonds, particularly from Spain. The EU is consistently
increasing their imports from Australia as Australian production increases, but their export numbers to
Europe are still very far from becoming a threat. Highly competitive prices will likely allow U.S.
almonds to maintain a prevailing presence in the EU market.
By volume, the main EU destinations for U.S. almonds were Spain, Germany and Italy. Many countries
import large quantities of almonds destined both for domestic consumption and re-export markets, as
well as for the food and snack industry.
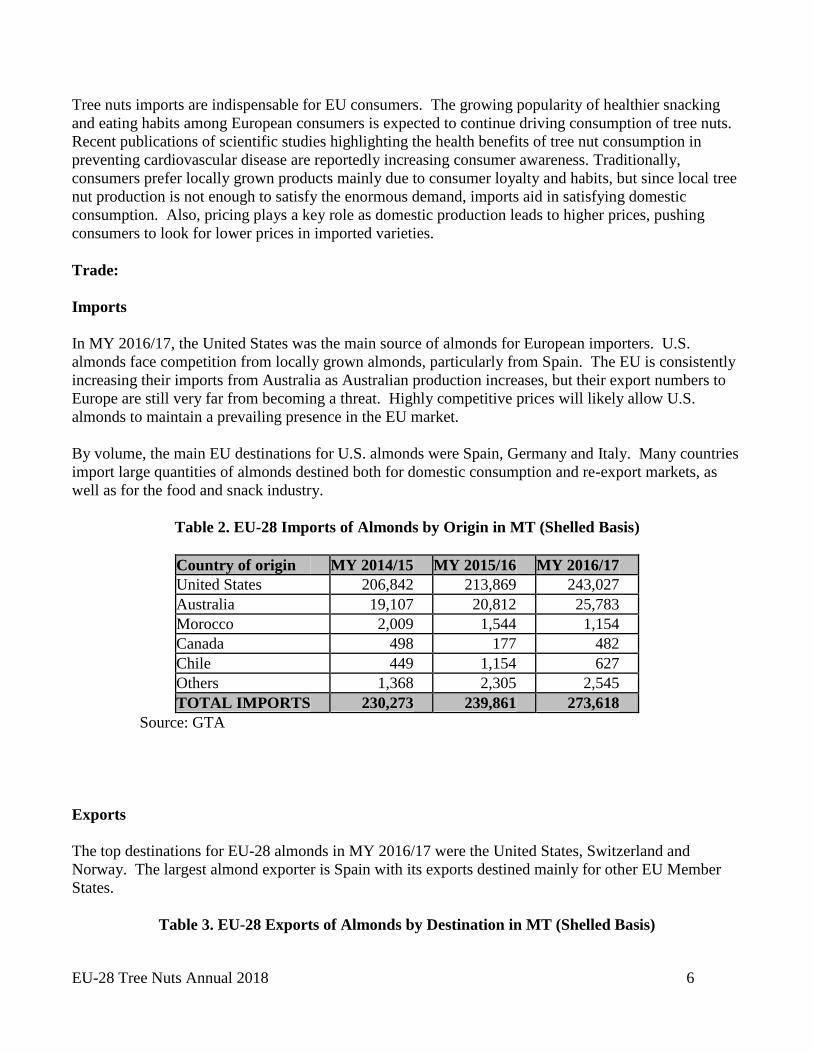
Table 2. EU-28 Imports of Almonds by Origin in MT (Shelled Basis)
Country of origin MY 2014/15 MY 2015/16 MY 2016/17
United States 206,842 213,869 243,027
Australia 19,107 20,812 25,783
Morocco 2,009 1,544 1,154
Canada 498 177 482
Chile 449 1,154 627
Others 1,368 2,305 2,545
TOTAL IMPORTS 230,273 239,861 273,618
Source: GTA
Exports
The top destinations for EU-28 almonds in MY 2016/17 were the United States, Switzerland and
Norway. The largest almond exporter is Spain with its exports destined mainly for other EU Member
States.
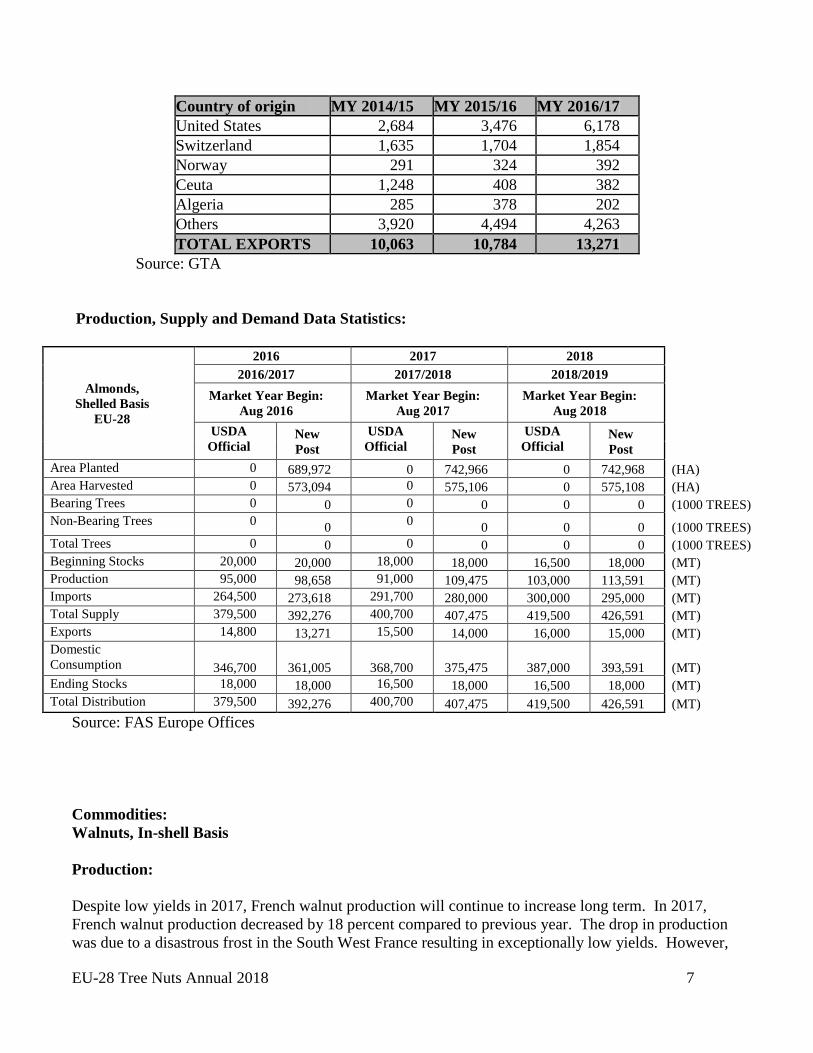
Table 3. EU-28 Exports of Almonds by Destination in MT (Shelled Basis)
EU-28 Tree Nuts Annual 2018 7
Country of origin MY 2014/15 MY 2015/16 MY 2016/17
United States 2,684 3,476 6,178
Switzerland 1,635 1,704 1,854
Norway 291 324 392
Ceuta 1,248 408 382
Algeria 285 378 202
Others 3,920 4,494 4,263
TOTAL EXPORTS 10,063 10,784 13,271
Source: GTA
Production, Supply and Demand Data Statistics:
Almonds,
Shelled Basis
EU-28
2016 2017 2018
2016/2017 2017/2018 2018/2019
Market Year Begin:
Aug 2016
Market Year Begin:
Aug 2017
Market Year Begin:
Aug 2018
USDA
Official New
Post
USDA
Official New
Post
USDA
Official New
Post
Area Planted 0 689,972 0 742,966 0 742,968 (HA)
Area Harvested 0 573,094 0 575,106 0 575,108 (HA)
Bearing Trees 0 0 0 0 0 0 (1000 TREES)
Non-Bearing Trees 0 0
0 0 0 0 (1000 TREES)
Total Trees 0 0 0 0 0 0 (1000 TREES)
Beginning Stocks 20,000 20,000 18,000 18,000 16,500 18,000 (MT)
Production 95,000 98,658 91,000 109,475 103,000 113,591 (MT)
Imports 264,500 273,618 291,700 280,000 300,000 295,000 (MT)
Total Supply 379,500 392,276 400,700 407,475 419,500 426,591 (MT)
Exports 14,800 13,271 15,500 14,000 16,000 15,000 (MT)
Domestic
Consumption 346,700 361,005 368,700 375,475 387,000 393,591 (MT)
Ending Stocks 18,000 18,000 16,500 18,000 16,500 18,000 (MT)
Total Distribution 379,500 392,276 400,700 407,475 419,500 426,591 (MT)
Source: FAS Europe Offices
Commodities:
Walnuts, In-shell Basis
Production:
Despite low yields in 2017, French walnut production will continue to increase long term. In 2017,
French walnut production decreased by 18 percent compared to previous year. The drop in production
was due to a disastrous frost in the South West France resulting in exceptionally low yields. However,
EU-28 Tree Nuts Annual 2018 8
yields are expected to go back to average levels in 2018, due to improved weather conditions. Walnuts
intended for processing reportedly represent 7 to 10 percent of total production. Most walnuts are
exported to Moldova in-shell, then imported back as shelled. Moldova remains France’s leading export
market outside of the EU.
In Romania, despite the cold spell in April 2017, growers harvested a record crop with 35 percent more
than the previous year. In 2018, favorable weather conditions supported an adequate development of
walnut production, which is expected to remain above the five-year average, but four percent below
2017 levels.
A few decades ago, Italy lost its leadership in the walnut market and now is a leading importer, buying
mainly from the United States. Since farmers generally grow walnut trees for both timber and nuts, nut
yields and quality have suffered. Most walnuts are cultivated in the Campania region (Southern Italy),
where the main varieties are Sorrento and Malizia. Farmers in Northern Italy have established efficient
and profitable walnut orchards planted with Lara and Chandler cultivars. Italy’s MY 2018/19 walnut
production is forecast to decrease by 20 percent compared to the previous campaign due to lower
volumes in Campania (-26 percent), because of a sudden spring frost. Production in the North is
forecast to be of good quality and remain stable at 3,000 MT.
In Spain, the main walnut growing regions are Extremadura, Galicia, Valencia, Castilla-La Mancha,
Andalucia, Aragon and Murcia. As of the date of this report, the MAPAMA has not yet published the
official walnut production data for MY2018/19. Therefore, if weather conditions are favorable, Post
expects an average production of 16,000 MT for the current MY.
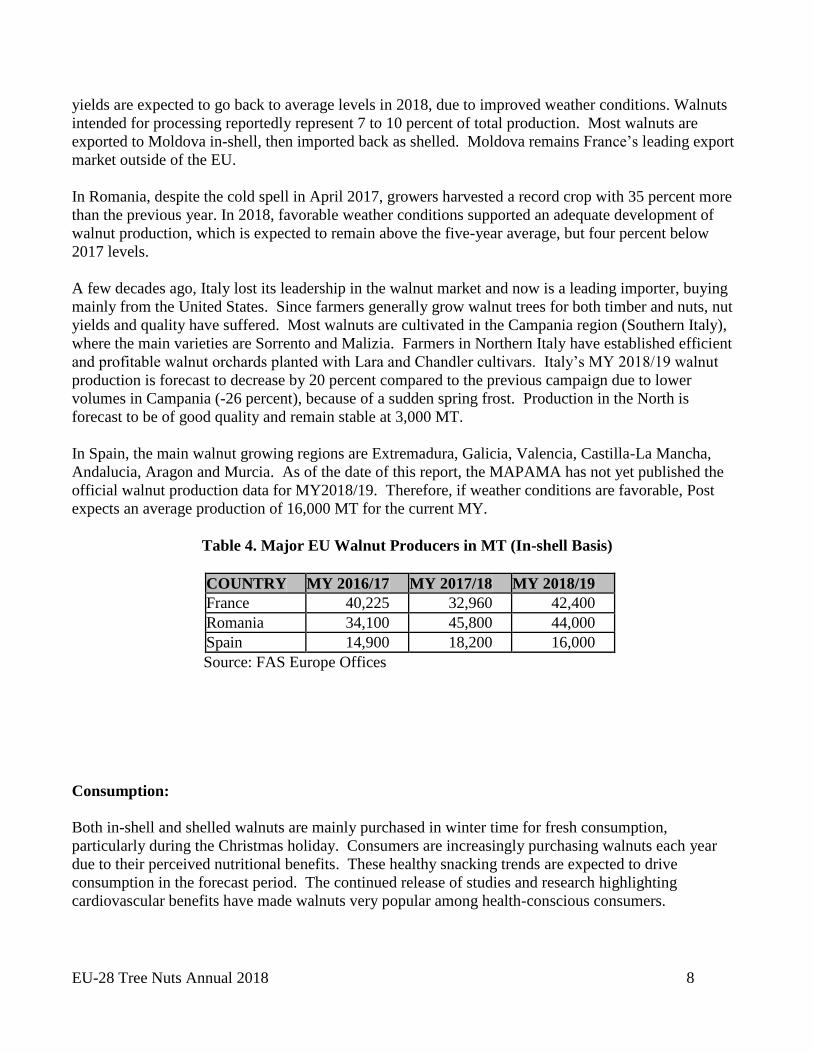
Table 4. Major EU Walnut Producers in MT (In-shell Basis)
COUNTRY MY 2016/17 MY 2017/18 MY 2018/19
France 40,225 32,960 42,400
Romania 34,100 45,800 44,000
Spain 14,900 18,200 16,000
Source: FAS Europe Offices
Consumption:
Both in-shell and shelled walnuts are mainly purchased in winter time for fresh consumption,
particularly during the Christmas holiday. Consumers are increasingly purchasing walnuts each year
due to their perceived nutritional benefits. These healthy snacking trends are expected to drive
consumption in the forecast period. The continued release of studies and research highlighting
cardiovascular benefits have made walnuts very popular among health-conscious consumers.
EU-28 Tree Nuts Annual 2018 9
In this sense, U.S. exporters continue to conduct very appropriate consumer advertising campaigns
focusing on the health benefits of walnuts as well as the key messages of origin, quality and/or
versatility. These actions have a very positive impact on the image of California walnuts and increased
the education on the health benefits of the product.
Trade:
The vast majority of walnuts produced in France are exported in-shell. Production and exports are
expected to increase in the long-term. Over the last ten years, French exports rose by 80 percent.
However, France is a net importer of shelled walnuts. Given high domestic processing costs, some
French walnuts produced in France are shelled abroad then imported back. Currently, imports and
consumption of shelled walnuts are on an upward trend. Walnut production continues to grow slowly
driven by both export demand and the increased consumption of shelled walnuts.
Imports
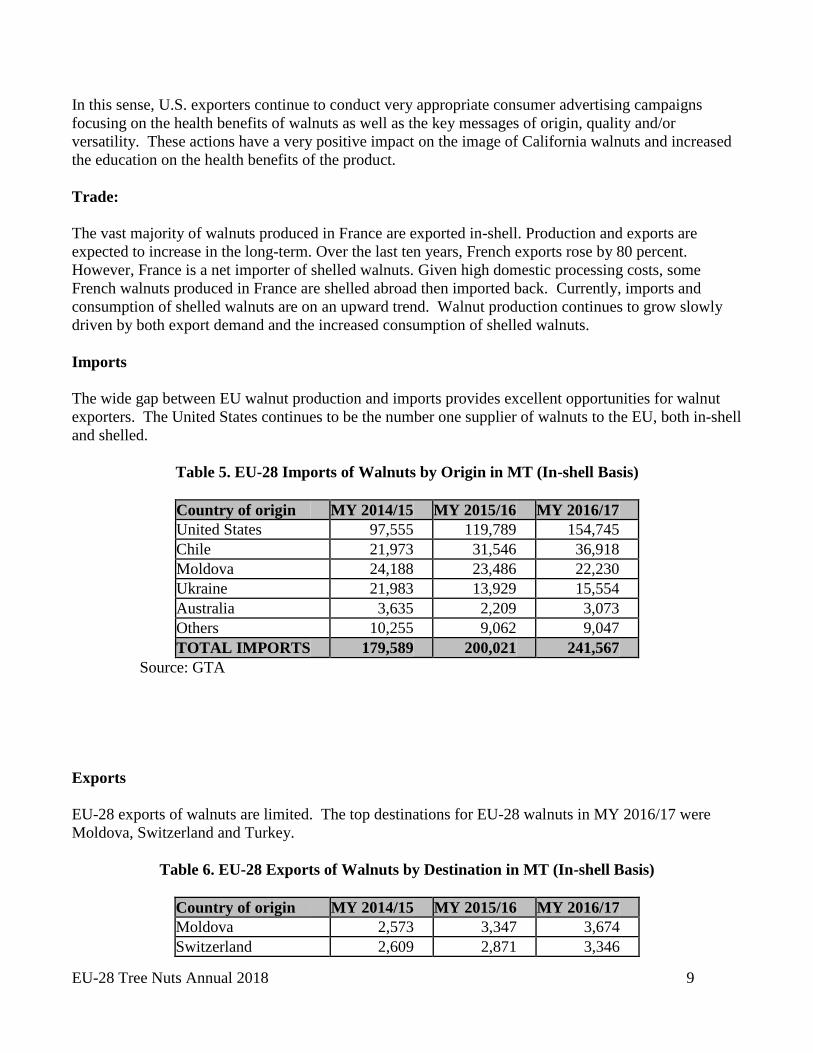
The wide gap between EU walnut production and imports provides excellent opportunities for walnut
exporters. The United States continues to be the number one supplier of walnuts to the EU, both in-shell
and shelled.
Table 5. EU-28 Imports of Walnuts by Origin in MT (In-shell Basis)
Country of origin MY 2014/15 MY 2015/16 MY 2016/17
United States 97,555 119,789 154,745
Chile 21,973 31,546 36,918
Moldova 24,188 23,486 22,230
Ukraine 21,983 13,929 15,554
Australia 3,635 2,209 3,073
Others 10,255 9,062 9,047
TOTAL IMPORTS 179,589 200,021 241,567
Source: GTA
Exports
EU-28 exports of walnuts are limited. The top destinations for EU-28 walnuts in MY 2016/17 were
Moldova, Switzerland and Turkey.
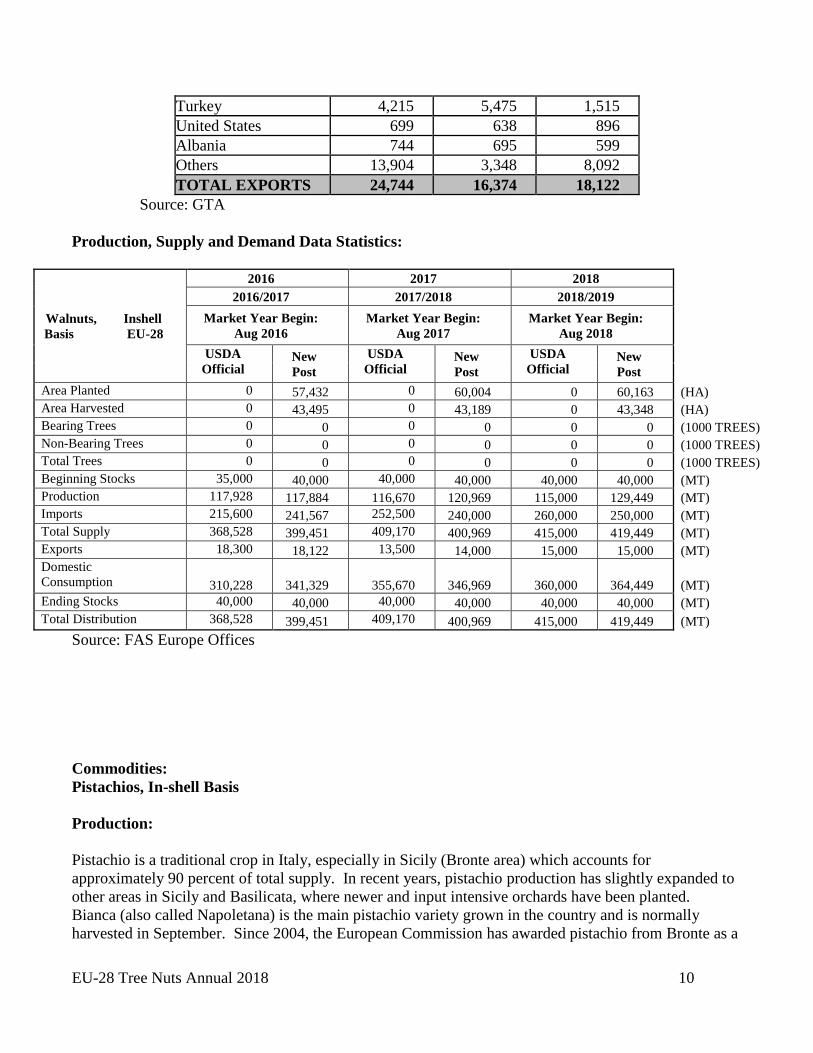
Table 6. EU-28 Exports of Walnuts by Destination in MT (In-shell Basis)
Country of origin MY 2014/15 MY 2015/16 MY 2016/17
Moldova 2,573 3,347 3,674
Switzerland 2,609 2,871 3,346
EU-28 Tree Nuts Annual 2018 10
Turkey 4,215 5,475 1,515
United States 699 638 896
Albania 744 695 599
Others 13,904 3,348 8,092
TOTAL EXPORTS 24,744 16,374 18,122
Source: GTA
Production, Supply and Demand Data Statistics:
Walnuts, Inshell
Basis EU-28
2016 2017 2018
2016/2017 2017/2018 2018/2019
Market Year Begin:
Aug 2016
Market Year Begin:
Aug 2017
Market Year Begin:
Aug 2018
USDA
Official New
Post
USDA
Official New
Post
USDA
Official New
Post
Area Planted 0 57,432 0 60,004 0 60,163 (HA)
Area Harvested 0 43,495 0 43,189 0 43,348 (HA)
Bearing Trees 0 0 0 0 0 0 (1000 TREES)
Non-Bearing Trees 0 0 0 0 0 0 (1000 TREES)
Total Trees 0 0 0 0 0 0 (1000 TREES)
Beginning Stocks 35,000 40,000 40,000 40,000 40,000 40,000 (MT)
Production 117,928 117,884 116,670 120,969 115,000 129,449 (MT)
Imports 215,600 241,567 252,500 240,000 260,000 250,000 (MT)
Total Supply 368,528 399,451 409,170 400,969 415,000 419,449 (MT)
Exports 18,300 18,122 13,500 14,000 15,000 15,000 (MT)
Domestic
Consumption 310,228 341,329 355,670 346,969 360,000 364,449 (MT)
Ending Stocks 40,000 40,000 40,000 40,000 40,000 40,000 (MT)
Total Distribution 368,528 399,451 409,170 400,969 415,000 419,449 (MT)
Source: FAS Europe Offices
Commodities:
Pistachios, In-shell Basis
Production:
Pistachio is a traditional crop in Italy, especially in Sicily (Bronte area) which accounts for
approximately 90 percent of total supply. In recent years, pistachio production has slightly expanded to
other areas in Sicily and Basilicata, where newer and input intensive orchards have been planted.
Bianca (also called Napoletana) is the main pistachio variety grown in the country and is normally
harvested in September. Since 2004, the European Commission has awarded pistachio from Bronte as a
EU-28 Tree Nuts Annual 2018 11
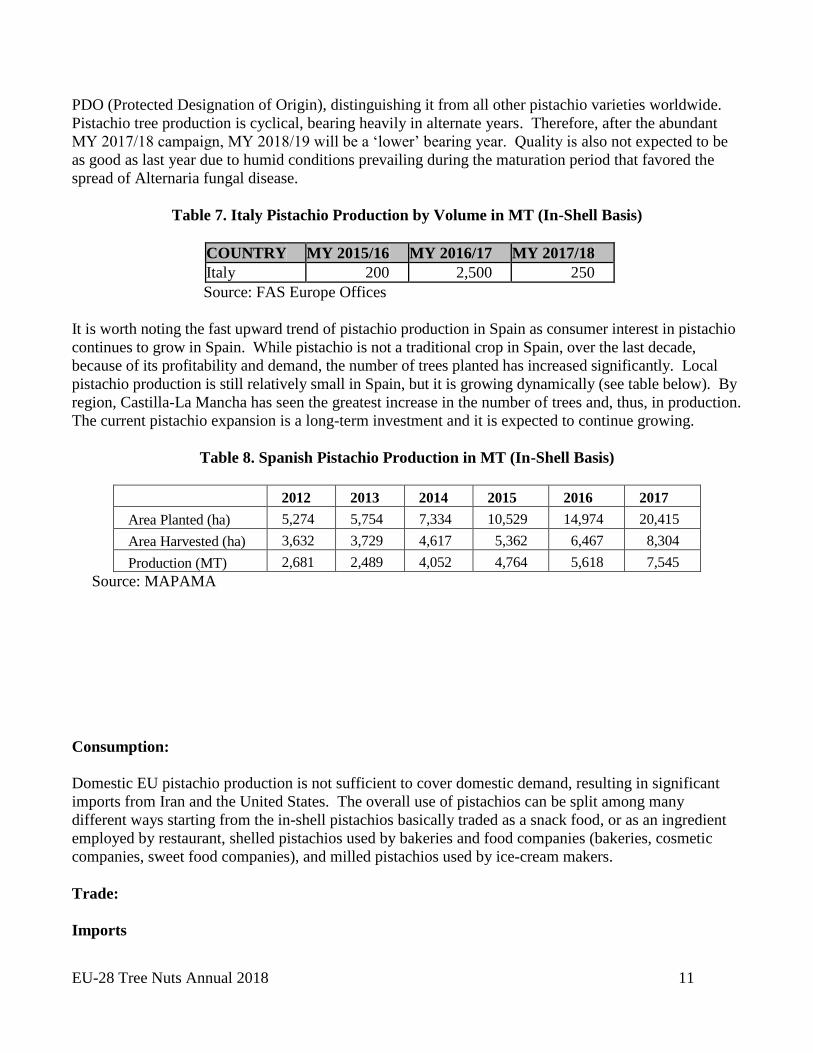
PDO (Protected Designation of Origin), distinguishing it from all other pistachio varieties worldwide.
Pistachio tree production is cyclical, bearing heavily in alternate years. Therefore, after the abundant
MY 2017/18 campaign, MY 2018/19 will be a ‘lower’ bearing year. Quality is also not expected to be
as good as last year due to humid conditions prevailing during the maturation period that favored the
spread of Alternaria fungal disease.
Table 7. Italy Pistachio Production by Volume in MT (In-Shell Basis)
COUNTRY MY 2015/16 MY 2016/17 MY 2017/18
Italy 200 2,500 250
Source: FAS Europe Offices
It is worth noting the fast upward trend of pistachio production in Spain as consumer interest in pistachio
continues to grow in Spain. While pistachio is not a traditional crop in Spain, over the last decade,
because of its profitability and demand, the number of trees planted has increased significantly. Local
pistachio production is still relatively small in Spain, but it is growing dynamically (see table below). By
region, Castilla-La Mancha has seen the greatest increase in the number of trees and, thus, in production.
The current pistachio expansion is a long-term investment and it is expected to continue growing.
Table 8. Spanish Pistachio Production in MT (In-Shell Basis)
2012 2013 2014 2015 2016 2017
Area Planted (ha) 5,274 5,754 7,334 10,529 14,974 20,415
Area Harvested (ha) 3,632 3,729 4,617 5,362 6,467 8,304
Production (MT) 2,681 2,489 4,052 4,764 5,618 7,545
Source: MAPAMA
Consumption:
Domestic EU pistachio production is not sufficient to cover domestic demand, resulting in significant
imports from Iran and the United States. The overall use of pistachios can be split among many
different ways starting from the in-shell pistachios basically traded as a snack food, or as an ingredient
employed by restaurant, shelled pistachios used by bakeries and food companies (bakeries, cosmetic
companies, sweet food companies), and milled pistachios used by ice-cream makers.
Trade:
Imports
EU-28 Tree Nuts Annual 2018 12
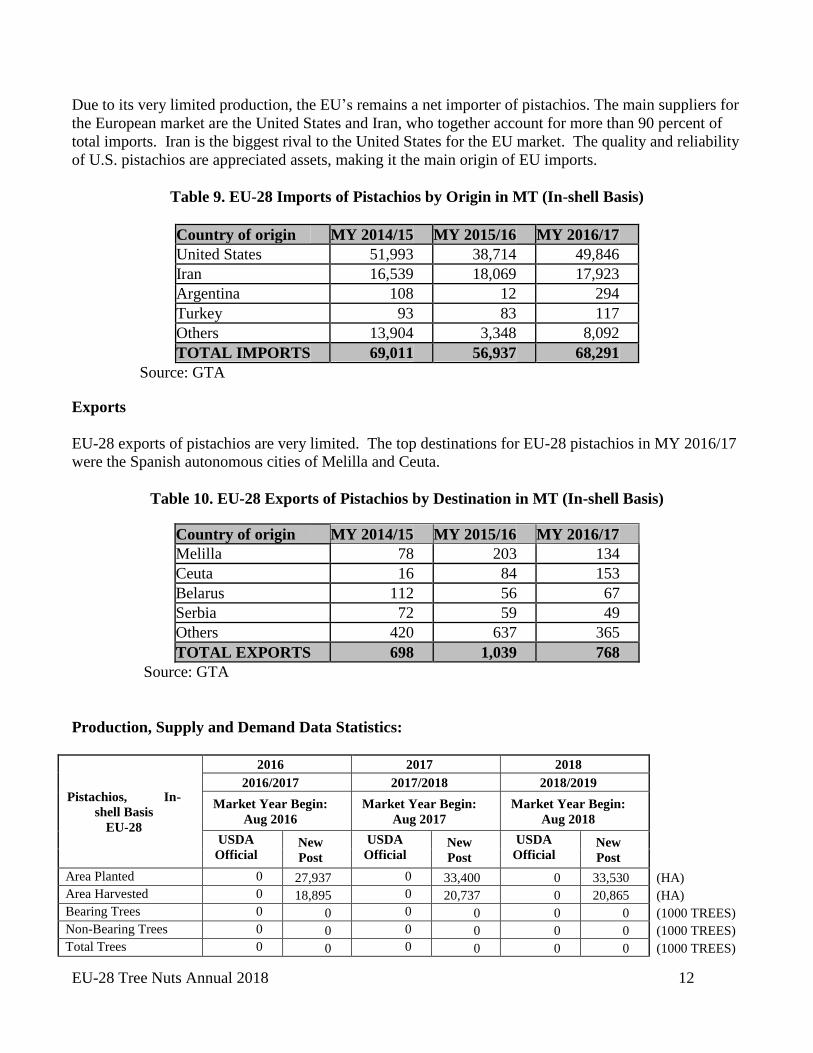
Due to its very limited production, the EU’s remains a net importer of pistachios. The main suppliers for
the European market are the United States and Iran, who together account for more than 90 percent of
total imports. Iran is the biggest rival to the United States for the EU market. The quality and reliability
of U.S. pistachios are appreciated assets, making it the main origin of EU imports.
Table 9. EU-28 Imports of Pistachios by Origin in MT (In-shell Basis)
Country of origin MY 2014/15 MY 2015/16 MY 2016/17
United States 51,993 38,714 49,846
Iran 16,539 18,069 17,923
Argentina 108 12 294
Turkey 93 83 117
Others 13,904 3,348 8,092
TOTAL IMPORTS 69,011 56,937 68,291
Source: GTA
Exports
EU-28 exports of pistachios are very limited. The top destinations for EU-28 pistachios in MY 2016/17
were the Spanish autonomous cities of Melilla and Ceuta.
Table 10. EU-28 Exports of Pistachios by Destination in MT (In-shell Basis)
Country of origin MY 2014/15 MY 2015/16 MY 2016/17
Melilla 78 203 134
Ceuta 16 84 153
Belarus 112 56 67
Serbia 72 59 49
Others 420 637 365
TOTAL EXPORTS 698 1,039 768
Source: GTA
Production, Supply and Demand Data Statistics:
Pistachios, In-
shell Basis
EU-28
2016 2017 2018
2016/2017 2017/2018 2018/2019
Market Year Begin:
Aug 2016
Market Year Begin:
Aug 2017
Market Year Begin:
Aug 2018
USDA
Official New
Post
USDA
Official New
Post
USDA
Official New
Post
Area Planted 0 27,937 0 33,400 0 33,530 (HA)
Area Harvested 0 18,895 0 20,737 0 20,865 (HA)
Bearing Trees 0 0 0 0 0 0 (1000 TREES)
Non-Bearing Trees 0 0 0 0 0 0 (1000 TREES)
Total Trees 0 0 0 0 0 0 (1000 TREES)
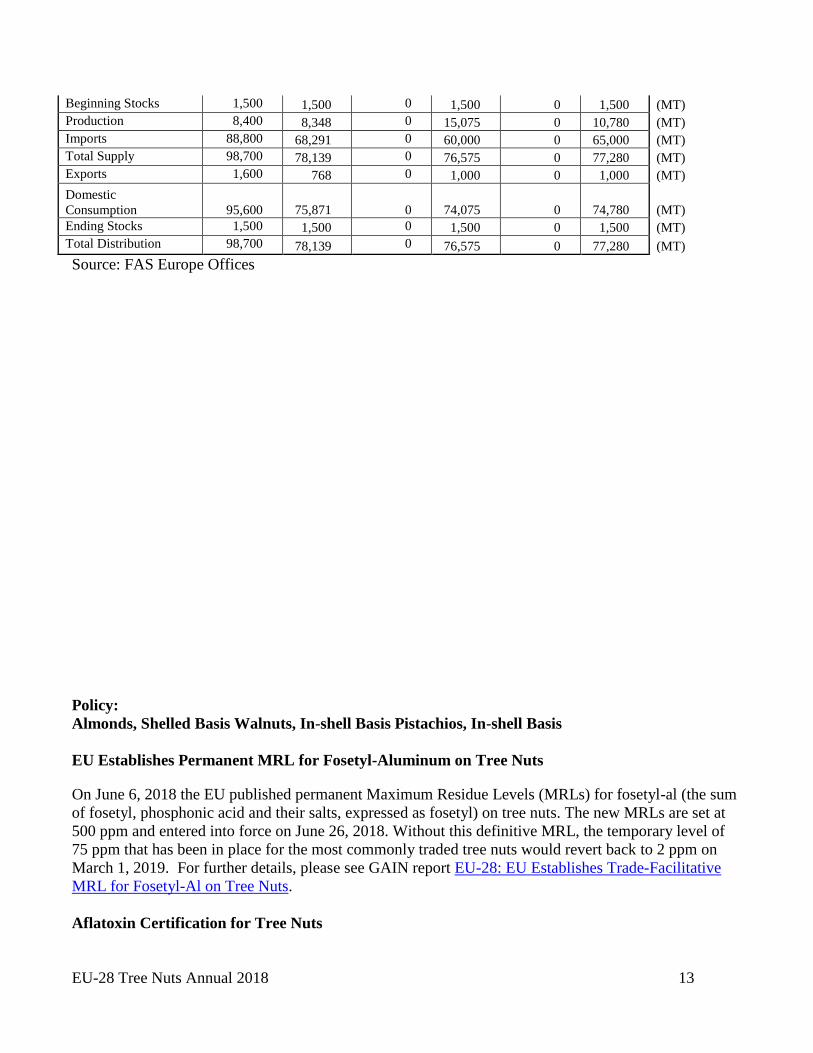
EU-28 Tree Nuts Annual 2018 13
Beginning Stocks 1,500 1,500 0 1,500 0 1,500 (MT)
Production 8,400 8,348 0 15,075 0 10,780 (MT)
Imports 88,800 68,291 0 60,000 0 65,000 (MT)
Total Supply 98,700 78,139 0 76,575 0 77,280 (MT)
Exports 1,600 768 0 1,000 0 1,000 (MT)
Domestic
Consumption 95,600 75,871 0 74,075 0 74,780 (MT)
Ending Stocks 1,500 1,500 0 1,500 0 1,500 (MT)
Total Distribution 98,700 78,139 0 76,575 0 77,280 (MT)
Source: FAS Europe Offices
Policy:
Almonds, Shelled Basis Walnuts, In-shell Basis Pistachios, In-shell Basis
EU Establishes Permanent MRL for Fosetyl-Aluminum on Tree Nuts On June 6, 2018 the EU published permanent Maximum Residue Levels (MRLs) for fosetyl-al (the sum
of fosetyl, phosphonic acid and their salts, expressed as fosetyl) on tree nuts. The new MRLs are set at
500 ppm and entered into force on June 26, 2018. Without this definitive MRL, the temporary level of
75 ppm that has been in place for the most commonly traded tree nuts would revert back to 2 ppm on
March 1, 2019. For further details, please see GAIN report EU-28: EU Establishes Trade-Facilitative
MRL for Fosetyl-Al on Tree Nuts.
Aflatoxin Certification for Tree Nuts
EU-28 Tree Nuts Annual 2018 14
Aflatoxin certification is an import instrument for U.S. exports to the EU of almonds and pistachios.
Information on the product specific programs is available from the respective commodity groups as well
as from the USDA Agricultural Marketing Service (AMS).
Almonds
For additional information on aflatoxin certificates on almonds, please go to:
Almond Board of California (ABC)
USDA-AMS Laboratory Approval Service – Aflatoxin Program
Pistachios
For information on aflatoxin certification on pistachios, please visit:
USDA-AMS Laboratory Approval Service – Aflatoxin Program
Administrative Committee for Pistachios (ACP)
Pre-Export Controls on Aflatoxins in U.S. Almonds
EU legislation on official food and feed controls allows the EU to officially recognize a third country’s
system of pre-export checks (PEC) on feed and food prior to export as long as it meets the EU
requirements.
EU approval of a third country’s system of pre-export checks may only be granted on the condition that
the controls carried out in the third country are considered to be sufficient so that the import controls
upon arrival to the EU can be significantly reduced.
The FVO assessed the U.S. aflatoxin control system on almonds leading to the EU approval of the pre-
export checks program for U.S. almonds in April 2015. EU accepted programs are combined in
Commission Implementing Regulation (EU) 2015/949, as amended. Under the regulation, import
authorities are directed to subject consignments covered by the regulation and accompanied by the
appropriate U.S. Government Pre-Export Check (PEC) certificate to a less than 1% control level at the
border. The PEC program is voluntary; a PEC certificate is not a requirement for import into the EU.
Shipments without a PEC certificate do not benefit from the reduced inspection levels upon import in
the EU.
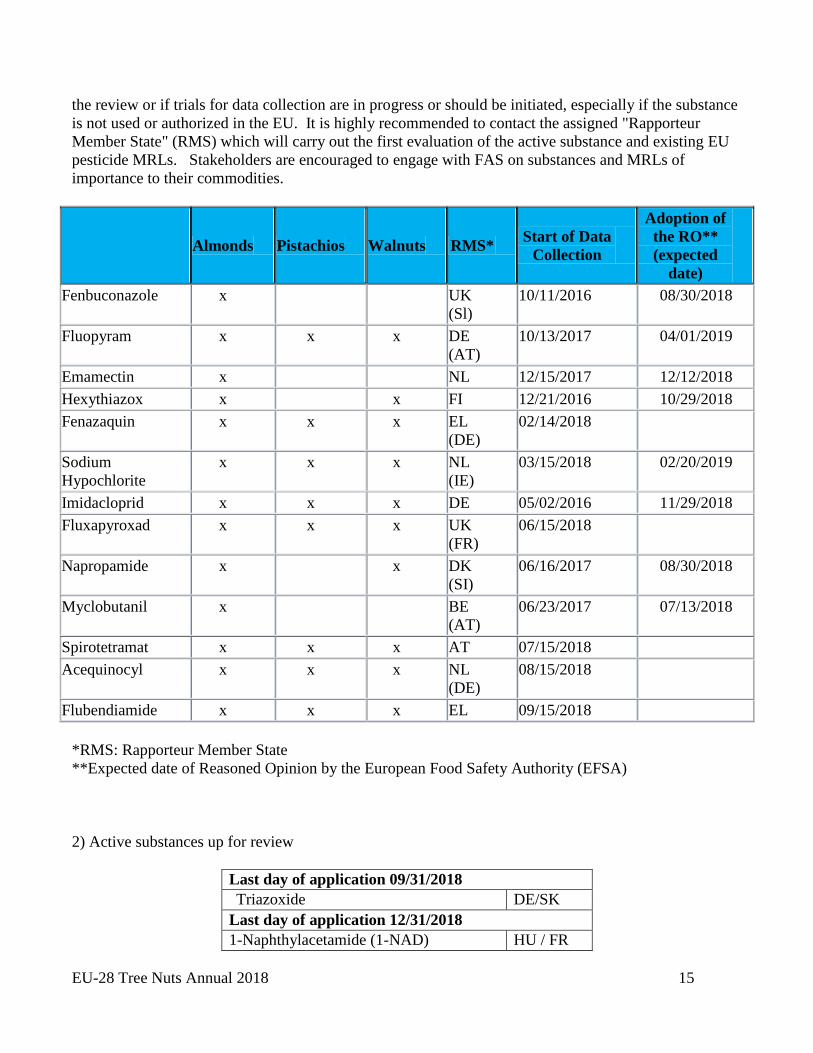
Upcoming MRL reviews under Article 12 of Regulation 396/2005 for tree nuts
Plant protection products (PPPs) along with maximum residue levels (MRLs) and import tolerances are
an increasingly important issue in the EU, since there is a significant reduction in the number of active
substances that are available for use. Regulation (EC) No 1107/2009 and Regulation (EC) No 396/2005
regulate PPPs and MRLs respectively. There is a consistent review of active substances for which the
approval is up for renewal, as well as their associated MRLs. Additionally, existing MRLs are also
being reviewed through a process known as an Article 12 review. The first list below indicates the
upcoming MRL reviews for the main tree nut commodities under this Article 12 process. The second
list includes the active substances which are, or will soon be, up for renewal. It is important to note that
these lists are not all-inclusive. Due to the complexity of the renewal process and the importance of the
issue, stakeholders should actively engage early in these review processes by reaching out to the
applicant. Together with the applicant, they can ensure that the necessary data are already available for
EU-28 Tree Nuts Annual 2018 15
the review or if trials for data collection are in progress or should be initiated, especially if the substance
is not used or authorized in the EU. It is highly recommended to contact the assigned "Rapporteur
Member State" (RMS) which will carry out the first evaluation of the active substance and existing EU
pesticide MRLs. Stakeholders are encouraged to engage with FAS on substances and MRLs of
importance to their commodities.
Almonds Pistachios Walnuts RMS*
Start of Data
Collection
Adoption of
the RO**
(expected
date)
Fenbuconazole x UK
(Sl)
10/11/2016 08/30/2018
Fluopyram x x x DE
(AT)
10/13/2017 04/01/2019
Emamectin x NL 12/15/2017 12/12/2018
Hexythiazox x x FI 12/21/2016 10/29/2018
Fenazaquin x x x EL
(DE)
02/14/2018
Sodium
Hypochlorite
x x x NL
(IE)
03/15/2018 02/20/2019
Imidacloprid x x x DE 05/02/2016 11/29/2018
Fluxapyroxad x x x UK
(FR)
06/15/2018
Napropamide x x DK
(SI)
06/16/2017 08/30/2018
Myclobutanil x BE
(AT)
06/23/2017 07/13/2018
Spirotetramat x x x AT 07/15/2018
Acequinocyl x x x NL
(DE)
08/15/2018
Flubendiamide x x x EL 09/15/2018
*RMS: Rapporteur Member State
**Expected date of Reasoned Opinion by the European Food Safety Authority (EFSA)
2) Active substances up for review
Last day of application 09/31/2018
Triazoxide
DE/SK
Last day of application 12/31/2018
1-Naphthylacetamide (1-NAD) HU / FR
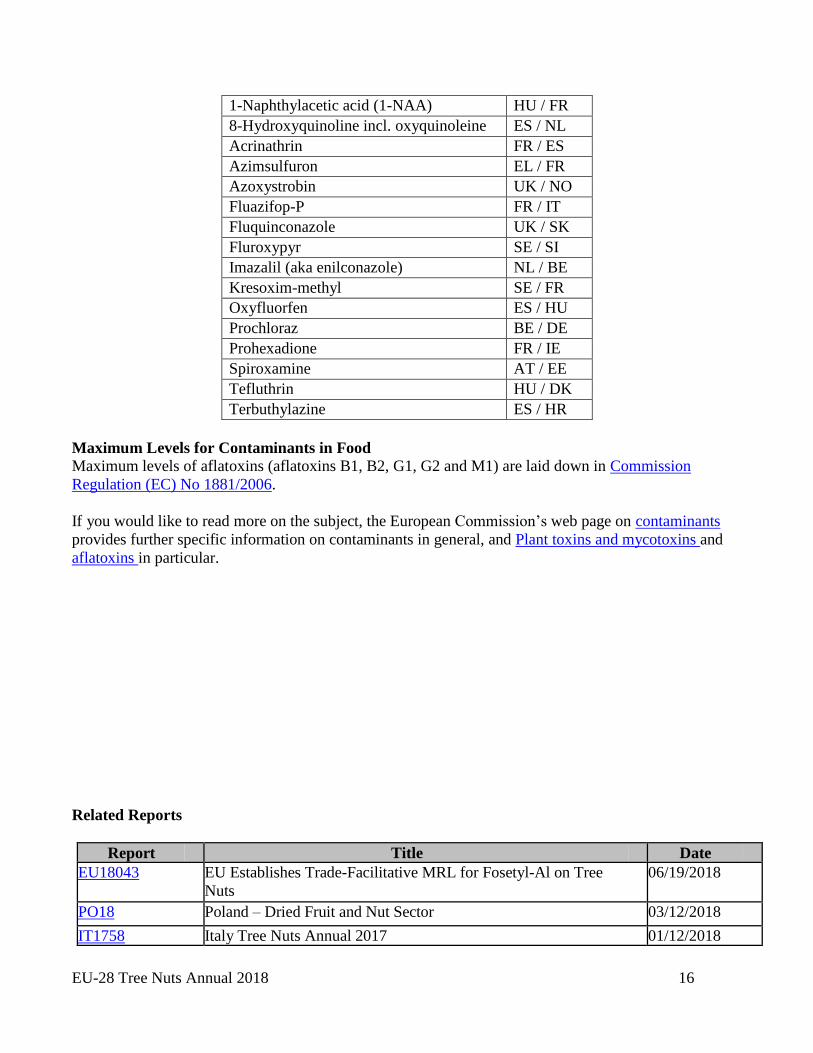
EU-28 Tree Nuts Annual 2018 16
1-Naphthylacetic acid (1-NAA) HU / FR
8-Hydroxyquinoline incl. oxyquinoleine ES / NL
Acrinathrin FR / ES
Azimsulfuron EL / FR
Azoxystrobin UK / NO
Fluazifop-P FR / IT
Fluquinconazole UK / SK
Fluroxypyr SE / SI
Imazalil (aka enilconazole) NL / BE
Kresoxim-methyl SE / FR
Oxyfluorfen ES / HU
Prochloraz BE / DE
Prohexadione FR / IE
Spiroxamine AT / EE
Tefluthrin HU / DK
Terbuthylazine ES / HR
Maximum Levels for Contaminants in Food
Maximum levels of aflatoxins (aflatoxins B1, B2, G1, G2 and M1) are laid down in Commission
Regulation (EC) No 1881/2006.
If you would like to read more on the subject, the European Commission’s web page on contaminants
provides further specific information on contaminants in general, and Plant toxins and mycotoxins and
aflatoxins in particular.
Related Reports
Report
Number
Title Date
Released EU18043 EU Establishes Trade-Facilitative MRL for Fosetyl-Al on Tree
Nuts
06/19/2018
PO18 Poland – Dried Fruit and Nut Sector 03/12/2018
IT1758 Italy Tree Nuts Annual 2017 01/12/2018

EU-28 Tree Nuts Annual 2018 17
BU1721 Bulgaria Tree Nuts Annual 2017 10/19/2017
RO1720 Romania Tree Nuts Annual 2017 10/16/2017
SP1729 EU-28 Tree Nuts Annual 2017 09/21/2017
E17007 USEU – Phytosanitary Requirements for EU Import of Nuts 01/25/2017
These reports can be accessed through the FAS GAIN Reports website