Embed Size (px)
Citation preview
EU CONSUMPTION, GLOBAL POLLUTIONA report written by WWF’s Trade and Investment Programme and the Industrial Ecology Programme at the Norwegian University of Science and Technology
John Kornerup Bang, Eivind Hoff and Glen Peters
EU consumption, global pollution 2
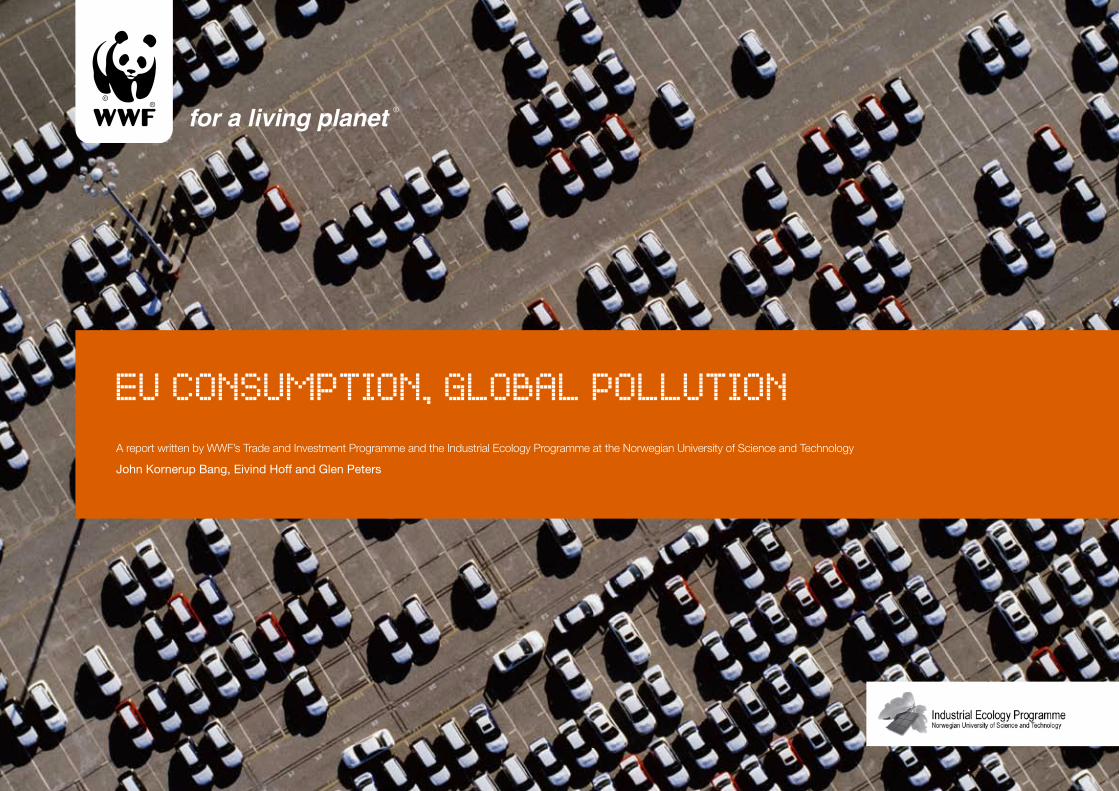
In 2001, European Union (EU) consumption caused global CO2 emissions that were 12% higher than the total CO2 emissions that occurred within the EU. This excess was about 500 million tonnes – more than Italy’s CO2 production that year. The dif-ference is mainly due to the level of emissions in developing countries – particularly China – associated with the manufacture of goods consumed in the EU. Evidence suggests that, since 2001, the global emissions from EU consumption have further increased. Goals to reduce EU emissions by 50-80% by 2050 are pointless if this is done through pollution displacement – by increasingly importing CO2-intensive products from the rest of the world. For the EU to reduce its global CO2 emissions, systemic changes to the European economy are needed. As the EU is the world’s largest economic and trading block, its policies on trade and investment flows are important, but often overlooked, parts of the policy toolbox to achieve change. In particular, the EU should help developing countries introduce technology that ‘leap-frogs’ beyond the inefficient industrial and urban infrastructure in the developed world. European trade and investment flows are too important to disregard their impacts – both positive and negative – on climate change.
EXECUTIVE SUMMARY
The present report is an extended version of ‘EU Consumption, Global Pollution’ printed in January 2008.
EU consumption, global pollution 3
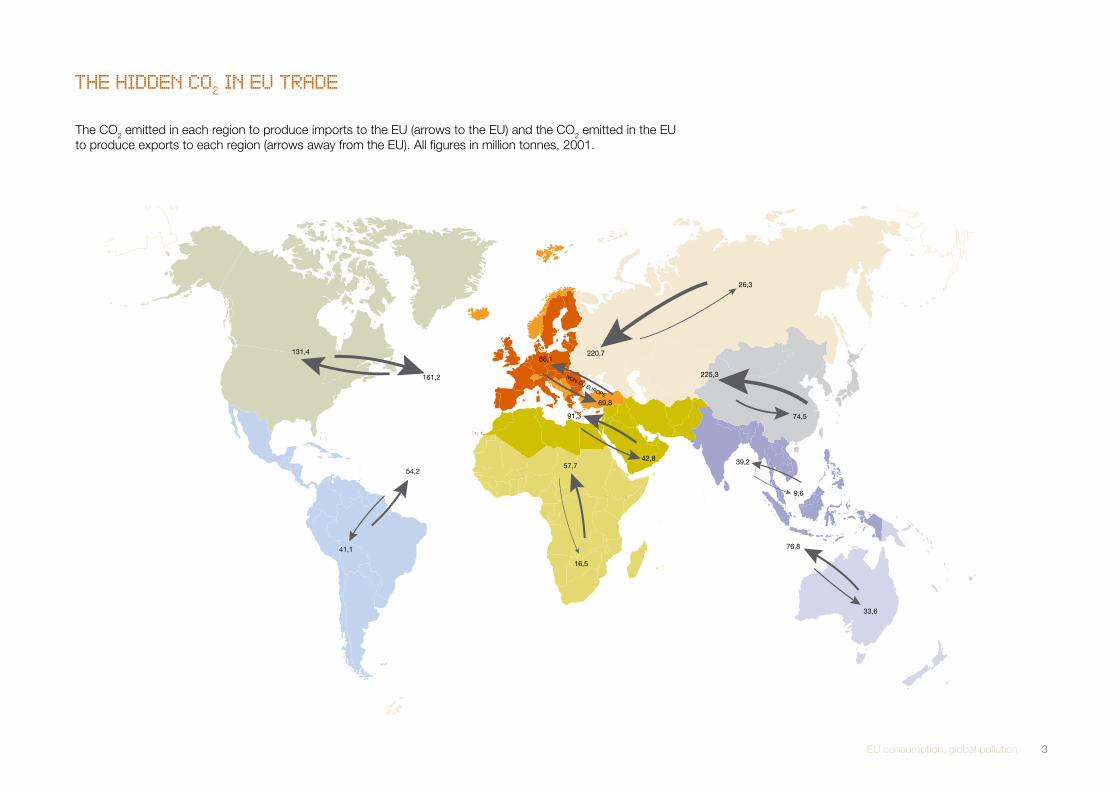
ThE hIddEN CO2 IN EU TRAdE
225,3
74,5
220,7
26,3
161,2
131,4
76,8
33,6
16,5
57,742,8
91,3
54,2
41,1
39,2
9,6
66,1
69,8
NON-EU EUROPE
The CO2 emitted in each region to produce imports to the EU (arrows to the EU) and the CO2 emitted in the EU to produce exports to each region (arrows away from the EU). All figures in million tonnes, 2001.
EU consumption, global pollution 4
Executive summary 1
I. Introduction : Purchasing power, purchasing responsibility 5
II. Deconstructing the footprint 8
II.A. Rich country consumption, emerging economy production 9
II.B. The EU’s carbon-cunning trade pattern 11
II.C. EU exports increasingly carbon-cunning 14
II.D. Western consumers, Eastern producers 15
III. Looking beyond CO2 emitted in production 16
III.A. Emissions due to transport and consumption 17
III.B. Non-CO2 impacts of trade 18
IV. Policy recommendations 19
IV.A. Measuring CO2 consumption 20
IV.B. Encouraging trade and investment flows to speed up systemic economic change 21
IV.B.1. Stop penalising imports of energy-efficient lamps 22
IV.B.2. Lift duties on sustainable biofuels 22
IV.B.3. Lower duties for low-carbon vehicles 23
V. Conclusion : Investing for the future 24
Annex I Glossary 27
Annex II Tables for figures 28
Figures 1-3: Methodology for IEA/BP/WRI 2006 projections and data sets 28
Correspondence table for figure 4 30
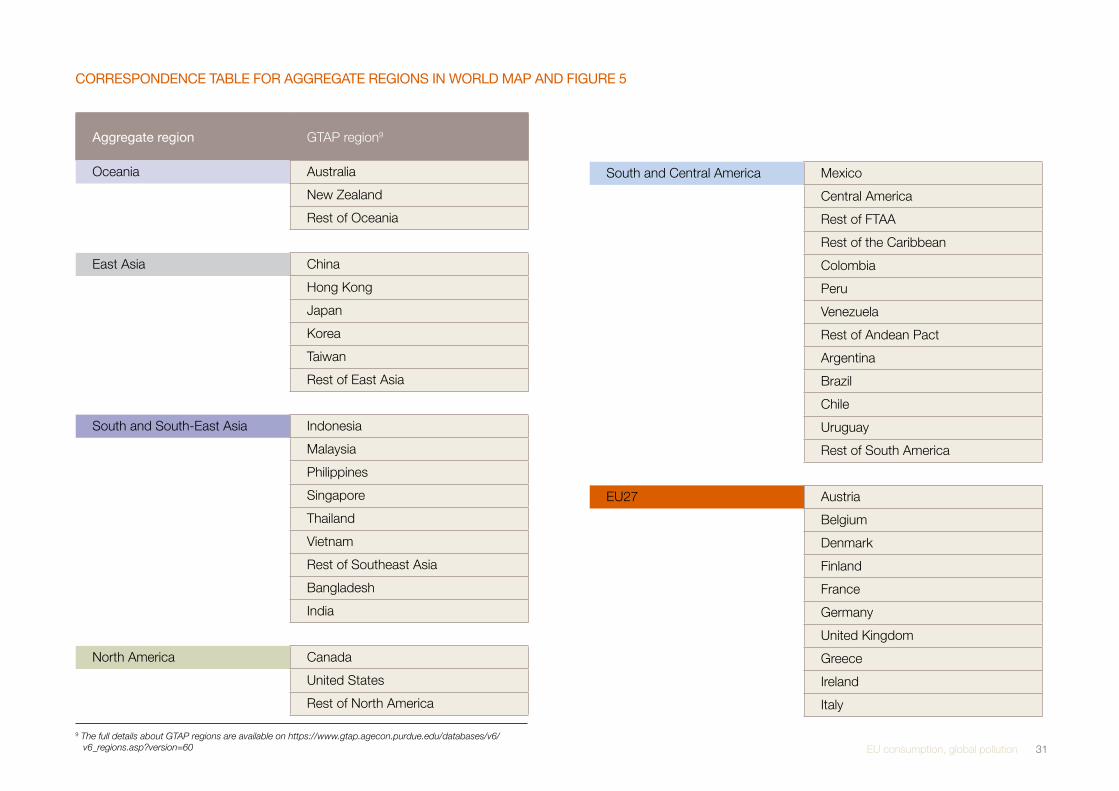
Correspondence table for aggregate regions in world map and figure 5 31
Projections in section II.C: HS-GTAP correspondence table 33
Annex III Methodology 38
What is ‘Pollution Embodied in Trade’? 38
Calculating ‘Pollution Embodied in Trade’ 38
Methodology: Multi-regional Input–Output Analysis 39
Emissions Embodied in Bilateral Trade (EEBT) 40
Emissions Embodied in Consumption (EEC) 41
Choosing EEBT and EEC 42
Uncertainties in this Study 42
References 44
TABLE OF CONTENTS
EU consumption, global pollution 5
I. INTROdUCTION : PURChASING POWER,
PURChASING RESPONSIBILITY
EU consumption, global pollution 6
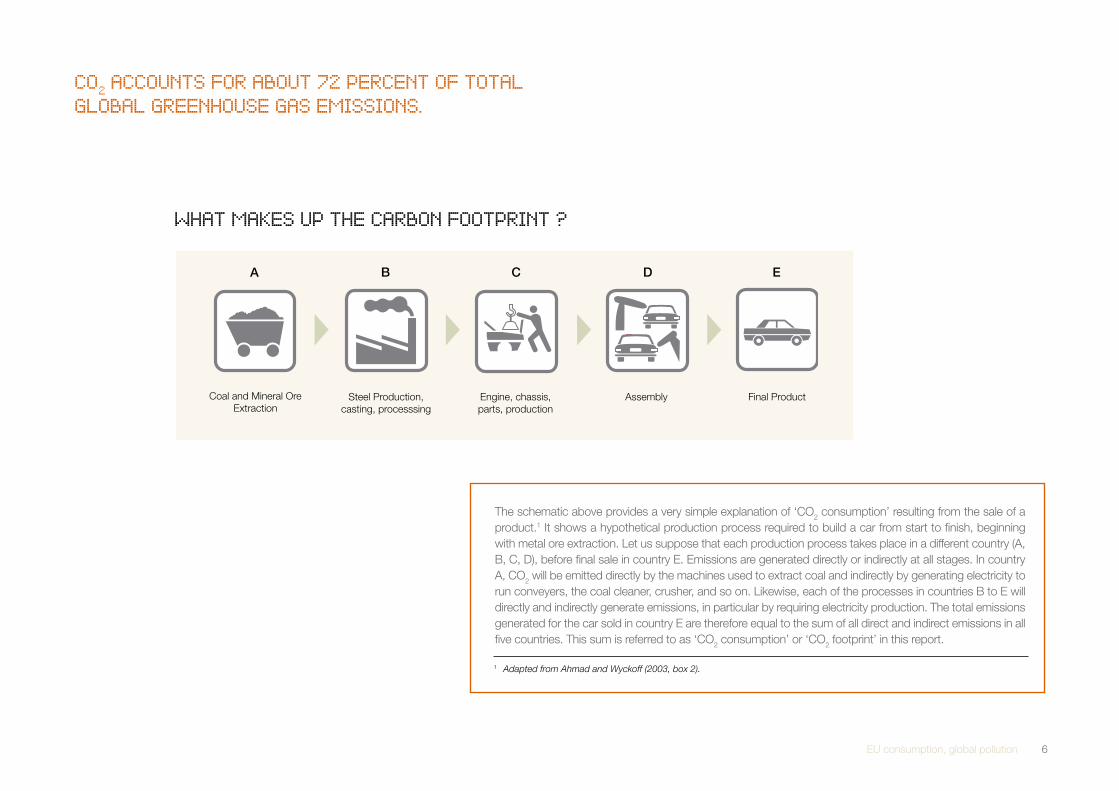
The schematic above provides a very simple explanation of ‘CO2 consumption’ resulting from the sale of a product.1 It shows a hypothetical production process required to build a car from start to finish, beginning with metal ore extraction. Let us suppose that each production process takes place in a different country (A, B, C, D), before final sale in country E. Emissions are generated directly or indirectly at all stages. In country A, CO2 will be emitted directly by the machines used to extract coal and indirectly by generating electricity to run conveyers, the coal cleaner, crusher, and so on. Likewise, each of the processes in countries B to E will directly and indirectly generate emissions, in particular by requiring electricity production. The total emissions generated for the car sold in country E are therefore equal to the sum of all direct and indirect emissions in all five countries. This sum is referred to as ‘CO2 consumption’ or ‘CO2 footprint’ in this report.
Coal and Mineral Ore Extraction
Steel Production, casting, processsing
Engine, chassis, parts, production
Assembly Final Product
A B C D E
CO2 ACCOUNTS FOR ABOUT 72 PERCENT OF TOTALGLOBAL GREENhOUSE GAS EMISSIONS.
WhAT MAKES UP ThE CARBON FOOTPRINT ?
1 Adapted from Ahmad and Wyckoff (2003, box 2).
EU consumption, global pollution 7
The concept of the carbon ‘footprint’ is well established. Many tools exist to help us calculate footprints at a national level (for example, see WWF, 2006). The main contributor to our carbon footprint is the pollution emitted during the production of goods and services. With increased international trade of goods and services, a large share of our carbon footprint occurs abroad.
When buying a television set, consumers share responsibility for the energy used by the shop and for the transport of the TV set from its country of assembly. But it does not stop there. Even those products that carry a ‘Made in EC’ label may have caused significant emissions elsewhere in the world in the production of its components, which typically are produced in numerous other countries. Each com-ponent is produced in a factory that requires electricity, as well as chemicals, plastic or metals. If production is traced back to its origin, it could lead to areas such as a coal mine in China, an iron-ore mine in Australia, a bauxite mine in Brazil, and an oil well in Canada. From these activities in distant lands to the purchase of a TV set in a European shop, considerable pollution is generated. It is this pollution, occurring in global production chains, that lies behind the bulk of carbon footprints. Only about 20% of EU CO2 emissions occur directly from households,2 the remainder occur as a result of the manufacture of consumable goods and services.
Europeans share responsibility for the emissions produced as a result of European consumption, regardless of where the emissions occur. The impact of climate change in Europe will be the same whether CO2 is emitted next door or on the other side of the planet. Taking account of CO2 emitted elsewhere, but caused by European consumption, is therefore both an ethical duty and in Europe’s self-interest.
Furthermore, under the current international climate regime of the Kyoto protocol, emission ceilings are limited to developed countries, which are responsible for the vast majority of historical greenhouse gas emissions. The emissions of developing countries are at present unrestricted. Today, and for some time to come, there will be no emission ceilings in so-called non-Annex I countries, some of which are becom-ing the world’s main manufacturing countries. It means that richer Annex I countries can continue to increase CO2 emissions by simply importing their chemicals, cars and computers from countries without emission ceilings, whilst formally comply-ing with their international climate commitments. This is a worrying prospect, as an
2 Importantly, emissions required to generate electricity for households are accounted for separately (like any other goods or services purchased by households). See https://www.gtap.agecon.purdue.edu/
increasing share of global industrial activity is located in developing countries and trade is increasing at a continuously faster pace than economic growth (Sachs and Santarius, 2005). Conversely, the fact that European countries consume so many goods that are produced in the rest of the world also means these countries have an immense opportunity to use that purchasing power to influence what the rest of the world produces and how they produce it.
Section II provides highlights of new research conducted by NTNU and WWF on how EU consumption through trade shifts CO2 emissions to, in particular, poorer countries where resource extraction and manufacturing are increasingly taking place (for a more complete data set, see Peters and Hertwich, 2008). Section III discusses issues other than greenhouse gas (GHG) emissions from production that need to be taken into account to avoid a short-sighted perspective on trade and climate change. Finally, Section IV offers some policy recommendations to influence EU trade and investment flows in light of these findings.
Annex I contains a glossary. Annex II contains explanations and data tables used for the figures and the map. Annex III explains the methodology used for the research.
The following shorthand expressions are used in this publication :
• CO2 consumption : Strictly speaking it is our consumption that causes CO2 emissions, yet in this report we use ‘CO2 consumption’ as a shorthand expression for this.
• CO2 production : The CO2 emitted in a country – whether to produce exports, goods consumed domestically, or emissions by households.
• CO2 consumption overshoot : CO2 consumption exceeding CO2 production• CO2 production overshoot : CO2 production exceeding CO2 consumption• Mt : Megatonne (million tonnes)
EU consumption, global pollution 8
II. dECONSTRUCTING ThE FOOTPRINT
EU consumption, global pollution 9
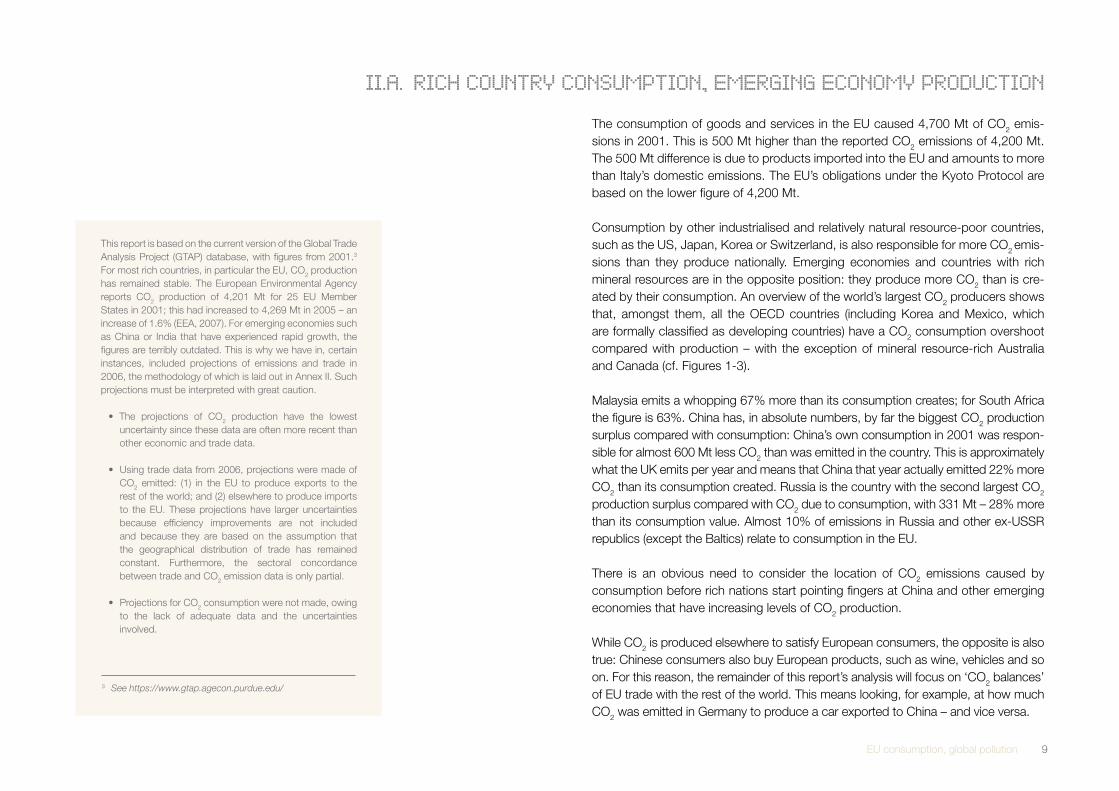
The consumption of goods and services in the EU caused 4,700 Mt of CO2 emis-sions in 2001. This is 500 Mt higher than the reported CO2 emissions of 4,200 Mt. The 500 Mt difference is due to products imported into the EU and amounts to more than Italy’s domestic emissions. The EU’s obligations under the Kyoto Protocol are based on the lower figure of 4,200 Mt.
Consumption by other industrialised and relatively natural resource-poor countries, such as the US, Japan, Korea or Switzerland, is also responsible for more CO2 emis-sions than they produce nationally. Emerging economies and countries with rich mineral resources are in the opposite position: they produce more CO2 than is cre-ated by their consumption. An overview of the world’s largest CO2 producers shows that, amongst them, all the OECD countries (including Korea and Mexico, which are formally classified as developing countries) have a CO2 consumption overshoot compared with production – with the exception of mineral resource-rich Australia and Canada (cf. Figures 1-3).
Malaysia emits a whopping 67% more than its consumption creates; for South Africa the figure is 63%. China has, in absolute numbers, by far the biggest CO2 production surplus compared with consumption: China’s own consumption in 2001 was respon-sible for almost 600 Mt less CO2 than was emitted in the country. This is approximately what the UK emits per year and means that China that year actually emitted 22% more CO2 than its consumption created. Russia is the country with the second largest CO2 production surplus compared with CO2 due to consumption, with 331 Mt – 28% more than its consumption value. Almost 10% of emissions in Russia and other ex-USSR republics (except the Baltics) relate to consumption in the EU.
There is an obvious need to consider the location of CO2 emissions caused by consumption before rich nations start pointing fingers at China and other emerging economies that have increasing levels of CO2 production.
While CO2 is produced elsewhere to satisfy European consumers, the opposite is also true: Chinese consumers also buy European products, such as wine, vehicles and so on. For this reason, the remainder of this report’s analysis will focus on ‘CO2 balances’ of EU trade with the rest of the world. This means looking, for example, at how much CO2 was emitted in Germany to produce a car exported to China – and vice versa.
II.A. RICh COUNTRY CONSUMPTION, EMERGING ECONOMY PROdUCTION
This report is based on the current version of the Global Trade Analysis Project (GTAP) database, with figures from 2001.3
For most rich countries, in particular the EU, CO2 production has remained stable. The European Environmental Agency reports CO2 production of 4,201 Mt for 25 EU Member States in 2001; this had increased to 4,269 Mt in 2005 – an increase of 1.6% (EEA, 2007). For emerging economies such as China or India that have experienced rapid growth, the figures are terribly outdated. This is why we have in, certain instances, included projections of emissions and trade in 2006, the methodology of which is laid out in Annex II. Such projections must be interpreted with great caution.
• The projections of CO2 production have the lowest uncertainty since these data are often more recent than other economic and trade data.
•Usingtradedatafrom2006,projectionsweremadeofCO2 emitted: (1) in the EU to produce exports to the rest of the world; and (2) elsewhere to produce imports to the EU. These projections have larger uncertainties because efficiency improvements are not included and because they are based on the assumption that the geographical distribution of trade has remained constant. Furthermore, the sectoral concordance between trade and CO2 emission data is only partial.
•ProjectionsforCO2 consumption were not made, owing to the lack of adequate data and the uncertainties involved.
3 See https://www.gtap.agecon.purdue.edu/
EU consumption, global pollution 10
25
20
15
10
5
0
Consumption 2001
Production 2001
Production projection 2006
Tonn
es /
cap
ita
US
Can
ada
Aust
ralia
Japa
n
EU27
Kor
ea
Rus
sia
Mid
dle
East
Ex-U
SSR
exc
l.
Rus
sia
and
Bal
tics
Sout
h Af
rica
Mex
ico
Chi
na
Indi
a
Figure 2 : Per capita CO2 consumption and production by main emitting countries
US EU27 China
7,000
6,000
5,000
4,000
3,000
2,000
1,000
0
Milli
on t
onne
s
Consumption 2001
Production 2001
Production projection 2006
(2005 for EU)
Figure 1 : Production and consumption of top three CO2 emitters
7,000.0
6,000.0
5,000.0
4,000.0
3,000.0
2,000.0
1,000.0
0.0
Production
Consumption
US
EU27
Chi
na
Rus
sia
Japa
nM
iddl
e Ea
st e
xcl.
Turk
ey
Indi
a
Ex-U
SSR
exc
l. R
ussi
a &
Bal
tics
Can
ada
Kor
ea
Mex
ico
Aust
ralia
Sout
h Af
rica
Milli
on t
onne
s
Figure 3 : Top producers and consumers of CO2 2001
EU consumption, global pollution 11
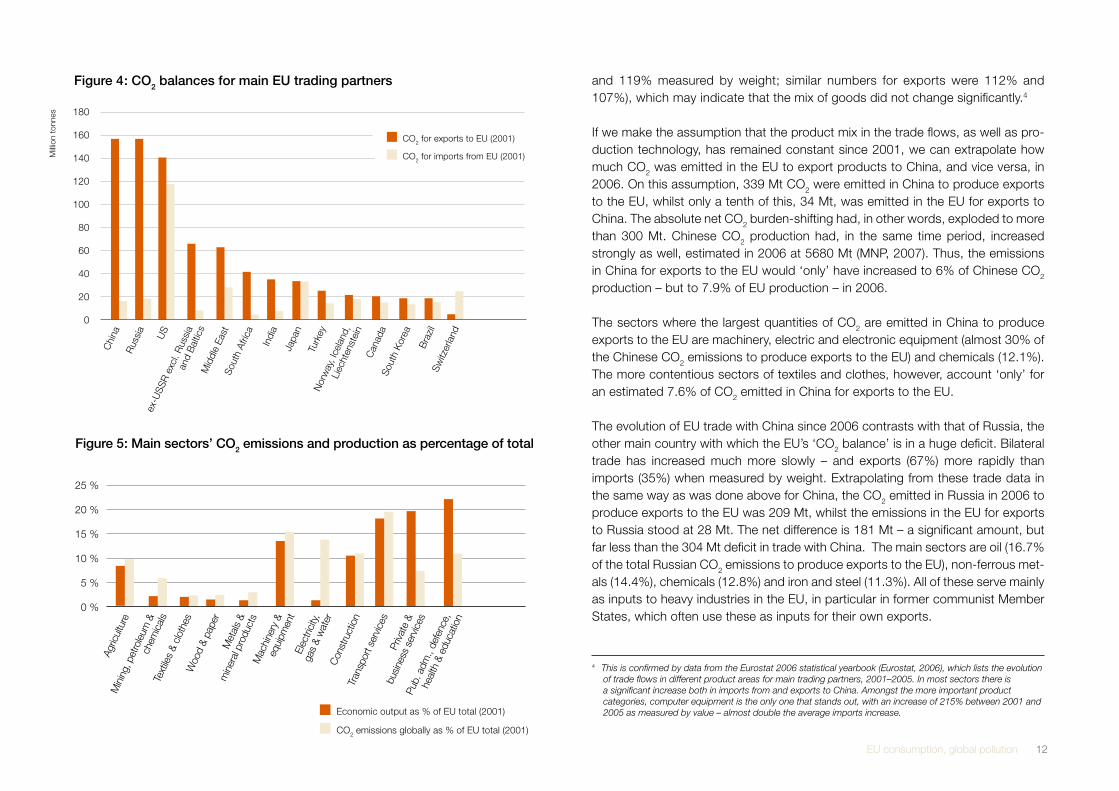
Generally, imports into the EU require far more CO2 emissions in the trading partner country than EU exports require in the EU (see Figure 4). In total, imports to the EU in 2001 caused 992 Mt of CO2 emissions in other countries, while EU exports caused only 446 Mt of CO2 emissions in the EU. However, the values of imported and exported goods and services were roughly the same – imports represented €1,231 billion while exports were worth €1,209 billion.
This reflects the fact that the EU economy is dominated by service industries, which are also increasingly becoming export industries. The finance industry, for instance, requires little more CO2 emissions than those needed to produce the heat and light for their buildings and to power their computers. The difference between different sectors’ contributions to EU GDP and their contributions to the EU’s CO2 footprint is set out in Figure 5.
Furthermore, EU manufacturing industries typically import energy-intensive raw materials (e.g. oil or steel) and turn them into higher-value goods (e.g. petrochemi-cals or machinery). Even though far more CO2-intensive than most service indus-tries, it takes much less energy to produce one euro worth of machinery than one euro worth of steel. In addition, relatively less CO2 is emitted to produce energy in the EU than in many of its trading partners (in particular those with a higher share of coal). Given the CO2 emission caps of the EU under the Kyoto Protocol, this trade pattern is cunning.
China is the EU’s trading partner where the largest amount of CO2 is emitted in order to produce exports to the EU. In 2001, 155 Mt of CO2 (4.7% of Chinese CO2 production; 3.7% of EU production) was emitted in China to produce exports to the EU. The corresponding figure for EU exports to China was only about one tenth of that – 16 Mt. However, trade between the EU and China has increased tremendously since 2001 (China entered the WTO in 2001). Eurostat offers annu-al trade data measured both by weight and value (current prices) up to 2006. Comparisons between trade measured by weight and value show that the two measures evolved quite similarly (imports increased by 137% measured by value
II.B. ThE EU’S CARBON-CUNNING TRAdE PATTERN
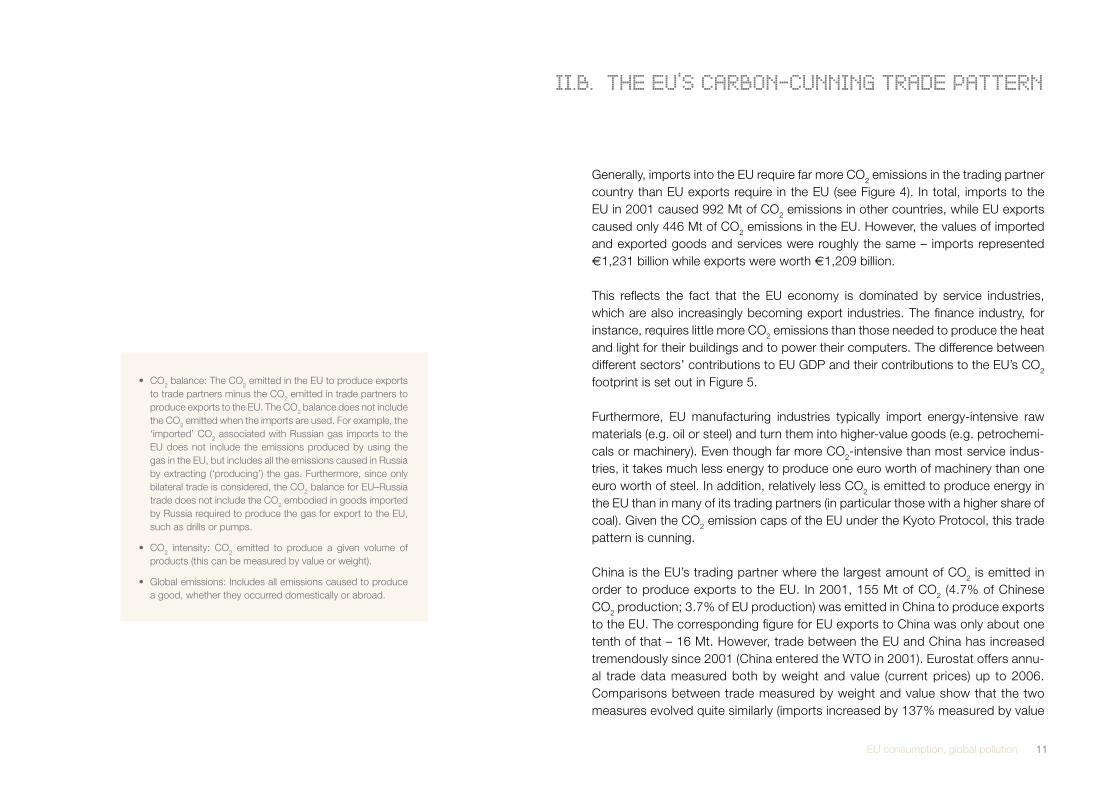
•CO2 balance: The CO2 emitted in the EU to produce exports
to trade partners minus the CO2 emitted in trade partners to produce exports to the EU. The CO2 balance does not include the CO2 emitted when the imports are used. For example, the ‘imported’ CO2 associated with Russian gas imports to the EU does not include the emissions produced by using the gas in the EU, but includes all the emissions caused in Russia by extracting (‘producing’) the gas. Furthermore, since only bilateral trade is considered, the CO2 balance for EU–Russia trade does not include the CO2 embodied in goods imported by Russia required to produce the gas for export to the EU, such as drills or pumps.
•CO2 intensity: CO2 emitted to produce a given volume of products (this can be measured by value or weight).
•Globalemissions:Includesallemissionscausedtoproducea good, whether they occurred domestically or abroad.
EU consumption, global pollution 12
Economic output as % of EU total (2001)
CO2 emissions globally as % of EU total (2001)
Agric
ultu
reM
inin
g, p
etro
leum
&
chem
ical
s
Tex
tiles
& cl
othe
sW
ood
& pa
per
Met
als
&
min
eral
pro
duct
sM
achi
nery
&eq
uipm
ent
Elec
trici
ty,ga
s &
wat
erC
onst
ruct
ion
Tran
spor
t ser
vices
Priva
te &
busin
ess
serv
ices
Pub.
adm
., de
fenc
e,
hea
lth &
edu
catio
n
25 %
20 %
15 %
10 %
5 %
0 %
Figure 5 : Main sectors’ CO2 emissions and production as percentage of total
and 119% measured by weight; similar numbers for exports were 112% and 107%), which may indicate that the mix of goods did not change significantly.4
If we make the assumption that the product mix in the trade flows, as well as pro-duction technology, has remained constant since 2001, we can extrapolate how much CO2 was emitted in the EU to export products to China, and vice versa, in 2006. On this assumption, 339 Mt CO2 were emitted in China to produce exports to the EU, whilst only a tenth of this, 34 Mt, was emitted in the EU for exports to China. The absolute net CO2 burden-shifting had, in other words, exploded to more than 300 Mt. Chinese CO2 production had, in the same time period, increased strongly as well, estimated in 2006 at 5680 Mt (MNP, 2007). Thus, the emissions in China for exports to the EU would ‘only’ have increased to 6% of Chinese CO2 production – but to 7.9% of EU production – in 2006.
The sectors where the largest quantities of CO2 are emitted in China to produce exports to the EU are machinery, electric and electronic equipment (almost 30% of the Chinese CO2 emissions to produce exports to the EU) and chemicals (12.1%). The more contentious sectors of textiles and clothes, however, account ‘only’ for an estimated 7.6% of CO2 emitted in China for exports to the EU.
The evolution of EU trade with China since 2006 contrasts with that of Russia, the other main country with which the EU’s ‘CO2 balance’ is in a huge deficit. Bilateral trade has increased much more slowly – and exports (67%) more rapidly than imports (35%) when measured by weight. Extrapolating from these trade data in the same way as was done above for China, the CO2 emitted in Russia in 2006 to produce exports to the EU was 209 Mt, whilst the emissions in the EU for exports to Russia stood at 28 Mt. The net difference is 181 Mt – a significant amount, but far less than the 304 Mt deficit in trade with China. The main sectors are oil (16.7% of the total Russian CO2 emissions to produce exports to the EU), non-ferrous met-als (14.4%), chemicals (12.8%) and iron and steel (11.3%). All of these serve mainly as inputs to heavy industries in the EU, in particular in former communist Member States, which often use these as inputs for their own exports.
180
160
140
120
100
80
60
40
20
0
CO2 for exports to EU (2001)
CO2 for imports from EU (2001)
Chi
naR
ussi
a
US
ex-U
SSR
exc
l. R
ussi
a an
d B
altic
sM
iddl
e Ea
stSo
uth
Afric
a
Indi
a
Japa
n
Turk
eyN
orw
ay, I
cela
nd,
Liec
hten
stei
nC
anad
aSo
uth
Kor
ea
Bra
zil
Switz
erla
nd
Milli
on t
onne
s
Figure 4 : CO2 balances for main EU trading partners
4 This is confirmed by data from the Eurostat 2006 statistical yearbook (Eurostat, 2006), which lists the evolution of trade flows in different product areas for main trading partners, 2001–2005. In most sectors there is a significant increase both in imports from and exports to China. Amongst the more important product categories, computer equipment is the only one that stands out, with an increase of 215% between 2001 and 2005 as measured by value – almost double the average imports increase.
EU consumption, global pollution 13
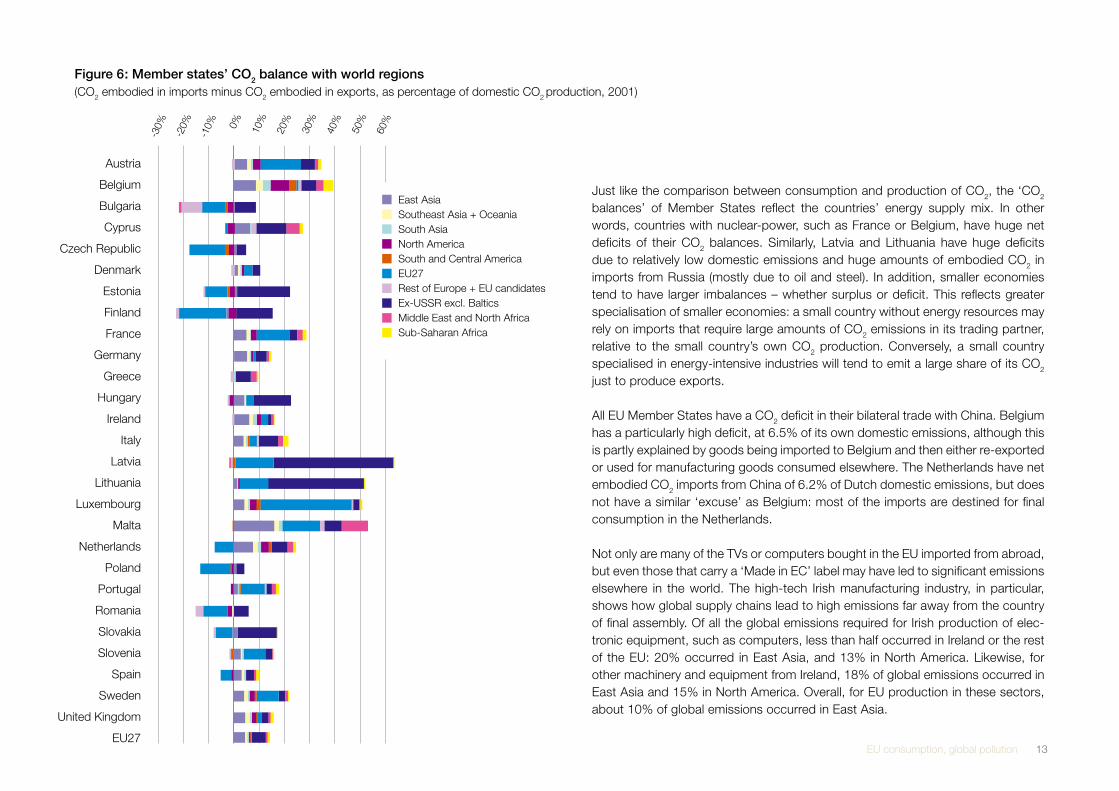
Just like the comparison between consumption and production of CO2, the ‘CO2 balances’ of Member States reflect the countries’ energy supply mix. In other words, countries with nuclear-power, such as France or Belgium, have huge net deficits of their CO2 balances. Similarly, Latvia and Lithuania have huge deficits due to relatively low domestic emissions and huge amounts of embodied CO2 in imports from Russia (mostly due to oil and steel). In addition, smaller economies tend to have larger imbalances – whether surplus or deficit. This reflects greater specialisation of smaller economies: a small country without energy resources may rely on imports that require large amounts of CO2 emissions in its trading partner, relative to the small country’s own CO2 production. Conversely, a small country specialised in energy-intensive industries will tend to emit a large share of its CO2 just to produce exports.
All EU Member States have a CO2 deficit in their bilateral trade with China. Belgium has a particularly high deficit, at 6.5% of its own domestic emissions, although this is partly explained by goods being imported to Belgium and then either re-exported or used for manufacturing goods consumed elsewhere. The Netherlands have net embodied CO2 imports from China of 6.2% of Dutch domestic emissions, but does not have a similar ‘excuse’ as Belgium: most of the imports are destined for final consumption in the Netherlands.
Not only are many of the TVs or computers bought in the EU imported from abroad, but even those that carry a ‘Made in EC’ label may have led to significant emissions elsewhere in the world. The high-tech Irish manufacturing industry, in particular, shows how global supply chains lead to high emissions far away from the country of final assembly. Of all the global emissions required for Irish production of elec-tronic equipment, such as computers, less than half occurred in Ireland or the rest of the EU: 20% occurred in East Asia, and 13% in North America. Likewise, for other machinery and equipment from Ireland, 18% of global emissions occurred in East Asia and 15% in North America. Overall, for EU production in these sectors, about 10% of global emissions occurred in East Asia.
Figure 6 : Member states’ CO2 balance with world regions(CO2 embodied in imports minus CO2 embodied in exports, as percentage of domestic CO2 production, 2001)
East AsiaSoutheast Asia + OceaniaSouth AsiaNorth AmericaSouth and Central AmericaEU27Rest of Europe + EU candidatesEx-USSR excl. BalticsMiddle East and North AfricaSub-Saharan Africa
Austria
Belgium
Bulgaria
Cyprus
Czech Republic
Denmark
Estonia
Finland
France
Germany
Greece
Hungary
Ireland
Italy
Latvia
Lithuania
Luxembourg
Malta
Netherlands
Poland
Portugal
Romania
Slovakia
Slovenia
Spain
Sweden
United Kingdom
EU27
-30%
-20%
-10% 0% 10
%
20%
30%
40%
50%
60%
EU consumption, global pollution 14
There has been much debate about whether polluting activities will gradually move to, or choose to expand in, regions with lower environmental requirements. This is known as the ‘pollution haven’ hypothesis.
In the EU, this debate has recently come to focus on efforts to put a price on carbon in the EU and the possible impact on the competitiveness of EU industries. This report does not include time series – all the data is from 2001. However, a sec-toral correspondence table between, on the one hand, the Global Trade Analysis Project (GTAP) and, on the other hand, the Harmonised System (HS – the inter-national customs classification of goods) and the Extended Balance of Payments Services Classification (EBOPS – used in OECD statistics) was built5 to extrapolate the evolution of the CO2 balance of the EU with the rest of the world between 2000/2001 and 2005/2006.6
This shows that, overall, the CO2 emitted in trading partners per kg of imports to the EU remained, on average, constant. It is indeed unlikely that trade flows are directly impacted by current CO2 regulations in the EU. First, there is no direct carbon price put on operations of EU industries (the industries in the EU’s Emission Trading System have been granted almost all their emission quotas for free). Second, stud-ies (ZEW, 2006) concur that any likely future carbon prices in the EU effectively paid by companies (in the range of 20–30 euros/tonne CO2) will cause only minor competitive distortions even in the most energy-intensive industries.
Interestingly, there was a marked reduction of CO2 emitted in the EU per kg of exports to the rest of the world. While the CO2 emitted to produce exports increased by 17%, the weight of exports grew by 28%. This contrast becomes even starker if service industries are included and emissions for exports are compared with the value of exports. For instance, the exports of relatively ‘carbon-free’ financial serv-ices doubled in value between 2000 and 2005. In other words, the carbon-cunning trade pattern of the EU seems to be becoming increasingly pronounced.
5 See Annex II for details. 6 Comparisons made between HS figures for 2001 and 2006, EBOPS figures for 2000 and 2005.
II..C EU EXPORTS INCREASINGLY CARBON-CUNNING
EU consumption, global pollution 15
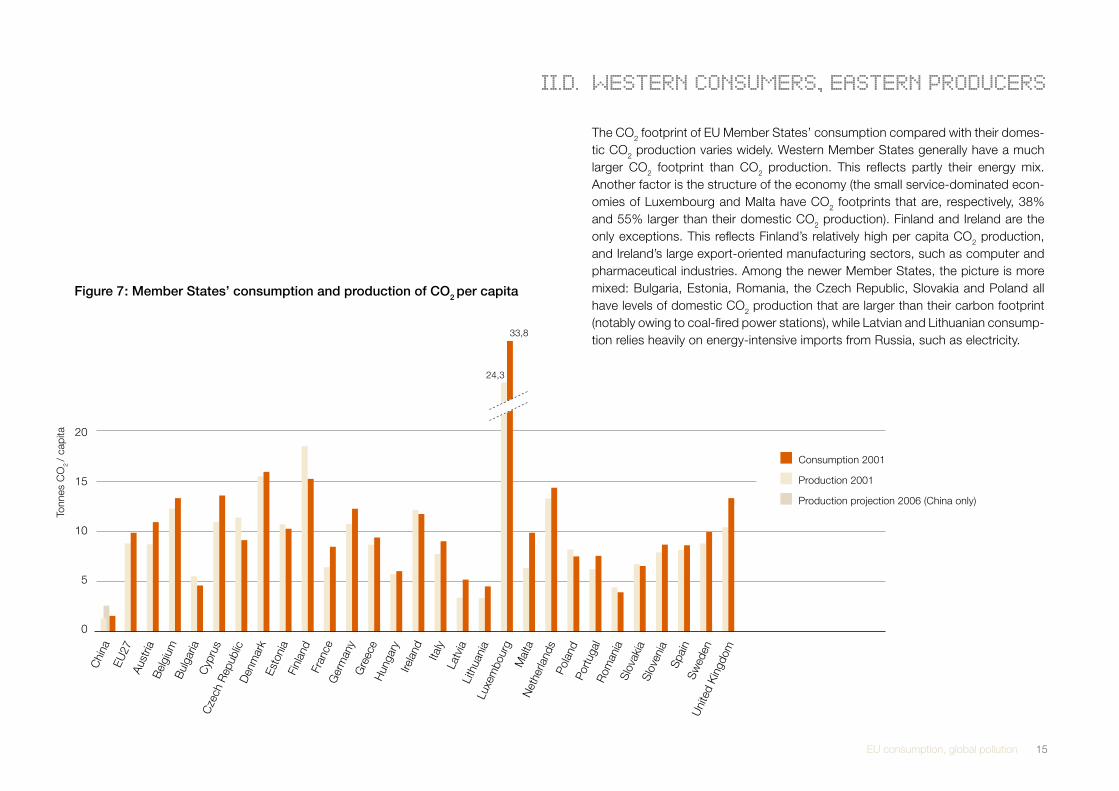
The CO2 footprint of EU Member States’ consumption compared with their domes-tic CO2 production varies widely. Western Member States generally have a much larger CO2 footprint than CO2 production. This reflects partly their energy mix. Another factor is the structure of the economy (the small service-dominated econ-omies of Luxembourg and Malta have CO2 footprints that are, respectively, 38% and 55% larger than their domestic CO2 production). Finland and Ireland are the only exceptions. This reflects Finland’s relatively high per capita CO2 production, and Ireland’s large export-oriented manufacturing sectors, such as computer and pharmaceutical industries. Among the newer Member States, the picture is more mixed: Bulgaria, Estonia, Romania, the Czech Republic, Slovakia and Poland all have levels of domestic CO2 production that are larger than their carbon footprint (notably owing to coal-fired power stations), while Latvian and Lithuanian consump-tion relies heavily on energy-intensive imports from Russia, such as electricity.
II.d. WESTERN CONSUMERS, EASTERN PROdUCERSC
hina
EU27
Aust
riaB
elgi
umB
ulga
riaC
ypru
sC
zech
Rep
ublic
Den
mar
kEs
toni
aFi
nlan
dFr
ance
Ger
man
yG
reec
eH
unga
ryIre
land Italy
Latv
iaLi
thua
nia
Luxe
mbo
urg
Mal
taN
ethe
rland
sPo
land
Portu
gal
Rom
ania
Slov
akia
Slov
enia
Spai
nSw
eden
Uni
ted
Kin
gdom
Tonn
es C
O2 /
capi
ta
24,3
33,8
20
15
10
5
0
Figure 7 : Member States’ consumption and production of CO2 per capita
Consumption 2001
Production 2001
Production projection 2006 (China only)
EU consumption, global pollution 16
III. LOOKING BEYONd CO2 EMITTEd IN PROdUCTION
EU consumption, global pollution 17
This report focuses on CO2 emissions occurring in production. But trade generally requires transport, and air and road transport are very CO2 intensive. The GTAP database, however, does not allocate emissions occurring in transport to sectors and countries in a consistent manner. While the study includes CO2 emissions from all forms of transportation, there is no guarantee that the emissions are correctly allocated to products or countries.
Lifecycle assessment has shown that this may be an important factor in the overall global warming impact of a traded product, but that it depends on a number of var-iables, in particular the mode of transport. Taking the example of UK consumption of lamb, the production and transport emissions associated with imports shipped from New Zealand are significantly smaller than those associated with British lamb (788 and 1609 kg CO2/tonne respectively). This is due to the fact that in New Zealand there is plenty of space for sheep to graze (causing zero CO2 emissions), whereas in the more crowded British countryside, lambs need to be fed inside farms, which is more CO2 intensive.
However, if the lamb is flown from New Zealand to the UK, the total emissions jump 15-fold to 11,913 kg CO2/tonne (European Parliament, 2007). The same study makes other bilateral comparisons of lifecycle CO2 emissions. For an energy-industry product such as steel, about a tenth of the CO2 emissions embodied in imports from China to Germany will be due to shipping emissions. Another study comparing pri-mary energy use through the lifecycle of apples points to the importance of season and mode of transport for determining whether imported or European apples are preferable (Mila i Canals et al., 2007). In most cases, freight transport will not be the main cause of GHG emissions; transport accounts for 14% of emissions globally (WRI, 2006), of which freight represents a bit more than half.
In addition to transportation, many industrial products require energy for their use – ranging from mobile phones to cars. For such products, the overall impact on global warming will be determined mainly by their energy-efficiency in use, not the energy-efficiency of their production or transport.
III.A. EMISSIONS dUE TO TRANSPORT ANd CONSUMPTION
TRANSPORT ACCOUNTS FOR 14 PER CENT OF EMISSIONS GLOBALLY, OF WhICh FREIGhT REPRESENTS A BIT MORE ThAN hALF.
The example of integrated compact fluorescent lamps (CFL-i - energy-efficient lamps that can be screwed into ordinary sockets) shows the relative importance of production, transport and consumption emissions of an energy-using product. The CFL-i manufacturer Philips has carried out a detailed lifecycle assessment of these products based on data from its European factories. This assessment can be adapted to its part-owned factories in China by adjusting for the Chinese elec-tricity7 mix and the known glass requirements (one of the most energy-intensive inputs to CFL-i) of the Chinese factories. To an assumed 500 km lorry transport in Europe from manufacturer to retailer is added 1,000 km lorry transport from factory to harbour and the almost 20,000 km shipping from China to Europe. However, the data are not adjusted for differences between Europe and China in the energy-efficiency of manufacturing.8
These data show that production and transport account for less than 0.6% of the total CO2 emissions through the lifecycle of a CFL-i used in Europe – regard-less of whether it is produced in China or Europe. The use phase causes 99.4% of the CO2 emissions. This is typical for many energy-using lighting appliances. Because CFL-i use only 20% of the energy and last five times longer than an ordinary incandescent lamp, they are by far preferable to the latter. Production accounts for 0.4–0.5% of CO2 through the lifecycle, whereas transport emissions account for as little as 0.014% for a CFL-i produced in the EU and 0.070% for one produced in China.9 In other words, transport emissions are several times higher when imported from China than when manufactured in the EU, but remain in both cases insignificant from a lifecycle perspective.
7 Less efficient Czech Republic energy plants were used as an estimate for Chinese energy plants due to lack of detailed data for Chinese electricity production. 8 Details of LCA method: CML Method 2000 V2.1 used, Normalization data World 1995. IPCC method used for CO2 calculations with a target of 100 years. Generic background data used is from EcoInvent database (ETH 2007, Zurich). Production of lamps based on Philips industry data. 9 Given the small numbers, these percentages should merely be interpreted as providing an order of magnitude of emissions.

EU consumption, global pollution 18
Not only are CFL-i beneficial overall through the replacement of incandescent lamps, as noted above, but in a world with massive labour surplus, labour intensive production makes sense from a sustainable development perspective. Indeed, CFL-i production provides more jobs in China than it does in the EU, because of different labour intensities. Most employees come from rural areas to escape desperate poverty. In CFL-i factories they will typically earn US$ 90-180 per month, although this varies from province to province. Much of the imports of CFL-i come from joint ventures between Chinese producers and multinationals. These will generally offer fairly good labour standards in a Chinese context (several of the lighting multi-nationals have signed up to the UN Global Compact).
Thus, the CFL-i are a ‘win-win’ example, where both social and climate change imperatives can be used as arguments for more trade. But what if trade has a marginally negative impact on climate change and a positive impact on human development?
In the current political context in Europe, it is tempting to single-mindedly focus on climate change. However, climate change is only one of a range of urgent global challenges that are often interconnected. Eliminating extreme poverty and improving child mortality are two of these challenges that need to be dealt with urgently. Their interconnection with climate change is also evident. There is little doubt that people need to afford other energy sources than wood if deforestation in Africa is to stop. Child mortality must be reduced in the poorest countries if people are to dare give birth to fewer children and human population is to stabilise.
In other words, even if imports may cause greater CO2 emissions than domestic production would have caused, we need to consider the impacts of trade versus non-trade on other global challenges. If trade lifts people out of poverty, then that may in some circumstances be overall beneficial – even if it leads to more CO2 intensive production or transport.
An example is air-freight of fresh fruits and vegetables from Sub-Saharan Africa to the UK. This represents less than 0.1% of total UK carbon emissions, but injects about GBP200 million into rural Africa and provides 100,000–120,000 direct jobs. When dependants and service providers are factored in, an estimated 1–1.5 million Africans’ livelihoods depend in part on these exports (IIED, 2006). Clearly, of the UK’s carbon footprint, these air-freight emissions may be amongst the most beneficial to global sustainable development. Conversely, air-freight of grapes from California when they are out of season in Europe epitomises unnecessary GHG emissions. Trade is neither good nor bad – but it is an elephant in the room of the international climate change debate.
III.B. NON-CO2 IMPACTS OF TRAdE

EU consumption, global pollution 19
IV. POLICY RECOMMENdATIONS
EU consumption, global pollution 20
In recent years, the EU has seemingly achieved a reduction in greenhouse gas emissions alongside continuous GDP growth10 – known as decoupling of emis-sions from economic growth. This report does not track the evolution through time of emissions due to EU consumption, and it is thus not possible to say whether or not such a decoupling has happened if we consider emissions due to EU con-sumption. Yet this report does demonstrate that EU trade is structurally responsible for far more CO2 emissions in other countries due to its imports than the EU emits itself to export. In order to prevent ‘leakage’ of emissions to other countries, the EU would do well to include a shadow consumption-based indicator for compliance with its international climate commitments.11
As noted above, the Chinese government is already making the point that ‘countries importing energy-intensive Chinese exports should assume some responsibility for the emissions their manufacture generated’ (FT, 2007a). A shadow consumption-based indicator would respond constructively to such a reproach. Furthermore, if such an indicator were made sector-by-sector, EU decision-makers would get valuable information about the growth potentials of different industries in a future where carbon emissions will be priced globally. Industries causing heavy emissions elsewhere through their supply-chains will be the most likely to need restructuring in the future. An example of this already happening is China’s elimination of its export tax rebates and introduction of new tariffs on energy-intensive goods (FT, 2007b; China Daily, 2006): such imports to EU industries are thus becoming more expensive.
IV.A. MEASURING CO2 CONSUMPTION
10 GHG emissions of the EU27 decreased 10% from 1990 to 2007 (excluding so-called land-use, land-use change and forestation – LULUCF – activities destined to improve the uptake of GHG by vegetation). 11 This line of reasoning has already been used for adjusting production-based inventories: Denmark, under the EU’s burden-sharing agreement to implement the bloc’s commitment under the Kyoto protocol, was allowed to adjust emissions in the base-year of 1990 owing to very high electricity imports (i.e. low domestic production) that year.
EU consumption, global pollution 21
The additional responsibility Europe has for greenhouse gas emissions around the world due to its consumption merely adds to what is already an unsustainable EU economy. If we are to have a reasonable chance of limiting global warming to 2ºC above pre-industrial levels, it is difficult to imagine anything less than an 80% cut in global greenhouse gas emissions by 2050 being sufficient (WWF, 2007; IPCC, 2007). The fact that EU CO2 emissions due to consumption exceeds its CO2 production by 12% merely adds to the size of this challenge, but also offers new opportunities to reduce emissions.
Rich countries must implement radical reductions in emissions and demonstrate the feasibility of achieving high living standards with a low carbon footprint. Without deep emission reductions in rich countries, mankind will face a ‘timebomb’ of CO2 emissions as the five billion people today living in developing countries experience much-needed growth to climb out of poverty.
What should governments do? With a challenge of this magnitude, the entire toolbox of economic policies must be used. The tax regimes and economic policies across Europe were fundamentally reformulated after the Second World War to finance a welfare system and Keynesian growth policies that would prevent a repetition of the depression and the social crises of the 1930s. In a similar vein, governments today need fundamentally to rethink the sticks and carrots (e.g. tax rates or subsidies) that affect consumption, production and investment in order to avoid unprecedented ecological and social upheavals as a result of climate change. This will require coor-dinated efforts both by the EU and by its Member States, in accordance with their respective competencies.
EU and Member State policies that act as sticks and carrots for trade and investment flows are vital due to the sheer size of EU economic interaction with the rest of the world. For instance, as the world’s largest economic and trading block, the EU has
IV.B. ENCOURAGING TRAdE ANd INVESTMENT FLOWS TO SPEEd UP SYSTEMIC ECONOMIC ChANGE
a huge opportunity to stimulate companies around the world that produce ‘climate-friendly’ products. Trade Commissioner Peter Mandelson has already proposed that trade policy should contribute to tackling climate change (Mandelson, 2006).
It is crucial that a ‘pro-climate trade policy’ does not become a veil for solely promoting EU renewable technology exports or buying cheap Clean Development Mechanism12 (CDM) credits. It must rather focus on stimulating innovation in those countries that will be the largest economic powers of the next decades and whose technological ‘leapfrogging’ is the most crucial to prevent future CO2 emissions. Technological leapfrogging in emerging economies depends, to a large extent, on local ownership of the technologies, as national authorities facing development challenges cannot favour foreign-owned technologies over national ones in the longer term. Successful development will require that domestic producers appropriate new technologies. Further, creating the capacity of emerging economies to produce climate-friendly goods will accelerate their uptake in markets around the world.
The EU should eliminate trade barriers to climate-friendly goods and try to agree on common standards for such products with key manufacturing countries such as China, India or Brazil. The definition of ‘climate-friendliness’ needs to consider the entire lifecycle of products and ideally also the goods and services they substi-tute. The data produced for this report is too aggregated to make product-specific recommendations.
Based on other, more detailed data, however, the following are some examples of how the EU could improve its trade policy today.
12 Under the Kyoto Protocol, countries with domestic emission ceilings (Annex I) may finance emission cuts in non-Annex I countries. They may do this by purchasing emission credits under the Clean Development Mechanism. These emission reductions in a non-Annex I country are then counted towards the commitments of the Annex I country.
EU consumption, global pollution 22
In addition to custom duties, countries may – subject to certain WTO-defined rules – apply so-called trade defence instruments (usually in the form of extra duties) against import surges that cause significant damage to the domestic industry, i.e. when imported products are too cheap for domestic industry to compete against. The EU is actively using these tools. Over the last few years, developing countries (in particular China and India) have been the most frequent targets. As trade defence instruments are used to protect the EU’s domestic industries, no regard has been given to whether the price-cutting effect of imports may actually be a good thing that would help to achieve overarching political objectives. In fact, under current EU rules, the Commission is not even allowed to consider non-economic factors when investigating whether trade defence instruments should be applied or not.
A result of this is the EU’s imposition since 2001 of an antidumping duty of up to 66% on imports of compact fluorescent lamps (CFL-i) from China. As mentioned above, (Section III.A), these lamps have a huge energy efficiency potential, even if they are transported from the other side of the planet. CFL-i could save 23 Mt CO2 /year (equivalent to 0.5% of EU greenhouse gas emis-sions) indirectly by replacing conventional incandescent lamps in the EU. But they are three to six times more expensive to purchase than equivalent incandescent lamps, so the strategy of EU retailers and most producers is to sell relatively cheap CFL-i from China in order to get consumers to buy their first CFL-i and discover their benefits.
In October 2007, the EU decided to prolong for another year this blatant example of inconsistency between its trade and climate change policies. Similar cases might emerge in the future. EU rules for applying trade defence instruments should at least allow consideration of consistency between the trade defence instruments and overarching policy objectives for the EU – such as energy efficiency.
The EU has set itself an objective that biofuels must account for 10% of pri-mary energy used in road transport by 2020, provided that their production is sustainable. Sustainability of biofuels involves a number of concerns – for instance in relation to rainforest destruction, freshwater depletion and social impacts, in addition to their greenhouse gas balance throughout their lifecycle. Most studies of the impacts of biofuels have focused on the latter.
Biofuels typically come in the form of bioethanol (which can be blended with gasoline) or biodiesel. Bioethanol is generally made from corn or wheat (from temperate climates) or sugarcane (from tropical climates). Several studies have assessed the net emissions reductions resulting from sugarcane etha-nol in Brazil, and all have concluded that the benefits far exceed those from grain-based ethanol produced in Europe and the US (WWI, 2006). It has been estimated that the total lifecycle greenhouse gas emissions reductions associ-ated with Brazil’s ethanol industry are equivalent to 46.6 Mt CO2 annually, or approximately 20% of Brazil’s fossil fuel emissions (Kaltner et al., 2005).
Today, Brazil is also the only major exporter of bioethanol. However, to enter the EU market a customs duty of €19.2 per hectolitre is put on bioethanol. If it is denatured (meaning that some other component is added to make it unfit to mix in alcoholic beverages), the duty is still €10.2 per hectolitre. However, some Member States grant fuel tax concessions only to undenatured bioetha-nol. Therefore, bioethanol is imported in both forms. The duty effectively brings up the price of Brazilian ethanol to the price of its European competitors. It has been claimed that this safeguards against undesired side effects of Brazilian sugarcane production (e.g. freshwater depletion or slave labour). However, as the duty does not distinguish between responsibly produced and other bioethanol, it is clearly not aimed at meeting such concerns and making best use of Brazil’s natural endowments for biofuel production.
Once a certification system to verify the sustainability of biofuels is in place (the UK government has committed to making biofuels sustainability certification mandatory from 2011, cf. DfT, 2007), these duties should be lifted.
IV.B.1. STOP PENALISING IMPORTS OF ENERGY-EFFICIENT LAMPS
IV.B.2. LIFT DUTIES ON SUSTAINABLE BIOFUELS
EU consumption, global pollution 23
Although biofuels may contribute to reducing the carbon emissions of transport, the EU biofuels target of 10% also demonstrates that biofuels will not by them-selves result in the ‘defossilisation’ of transport. Grid-connected automotive tech-nologies such as battery-electric vehicles (BEVs) and plug-in hybrids (PHEVs), on the other hand, are more easily combined with other renewable energy sources and do not require the construction of any major new infrastructure.
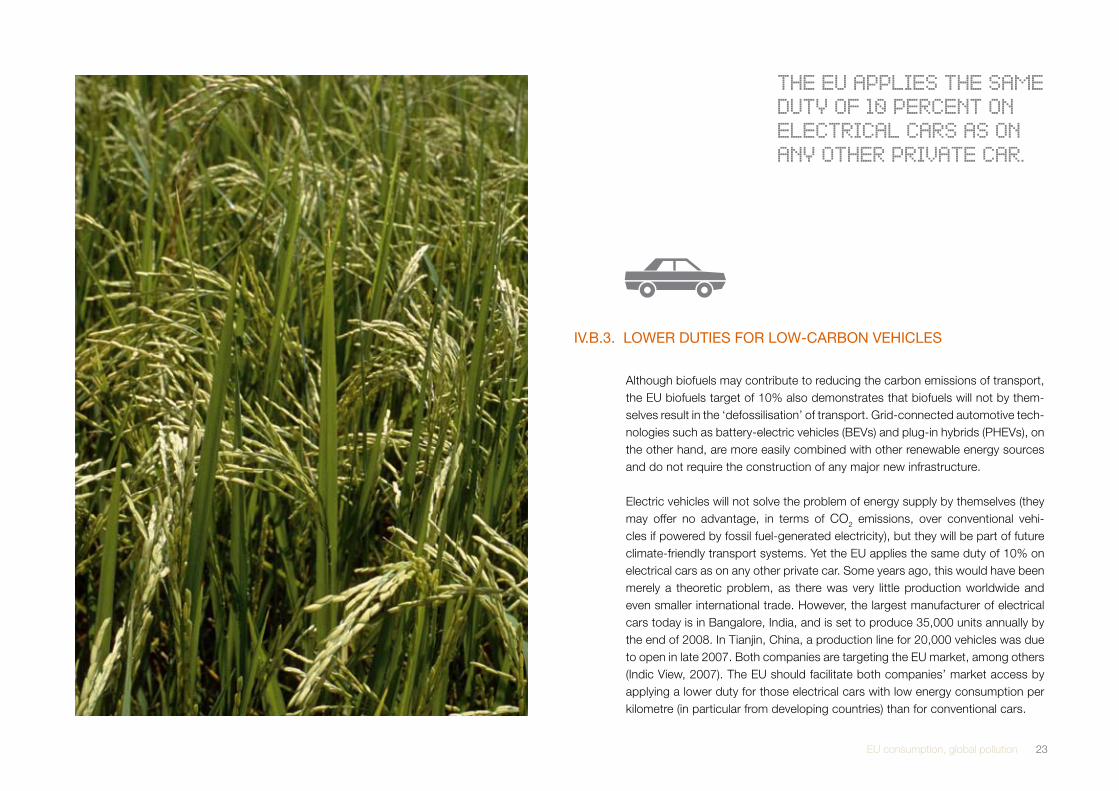
Electric vehicles will not solve the problem of energy supply by themselves (they may offer no advantage, in terms of CO2 emissions, over conventional vehi-cles if powered by fossil fuel-generated electricity), but they will be part of future climate-friendly transport systems. Yet the EU applies the same duty of 10% on electrical cars as on any other private car. Some years ago, this would have been merely a theoretic problem, as there was very little production worldwide and even smaller international trade. However, the largest manufacturer of electrical cars today is in Bangalore, India, and is set to produce 35,000 units annually by the end of 2008. In Tianjin, China, a production line for 20,000 vehicles was due to open in late 2007. Both companies are targeting the EU market, among others (Indic View, 2007). The EU should facilitate both companies’ market access by applying a lower duty for those electrical cars with low energy consumption per kilometre (in particular from developing countries) than for conventional cars.
ThE EU APPLIES ThE SAME dUTY OF 10 PERCENT ON ELECTRICAL CARS AS ON ANY OThER PRIVATE CAR.
Coal and Mineral Ore Extraction
Steel Production, casting, processsing
Engine, chassis, parts, production
Assembly Final Product
A B C D E
IV.B.3. LOWER DUTIES FOR LOW-CARBON VEHICLES
EU consumption, global pollution 24
V. CONCLUSION :INVESTING FOR ThE FUTURE
EU consumption, global pollution 25
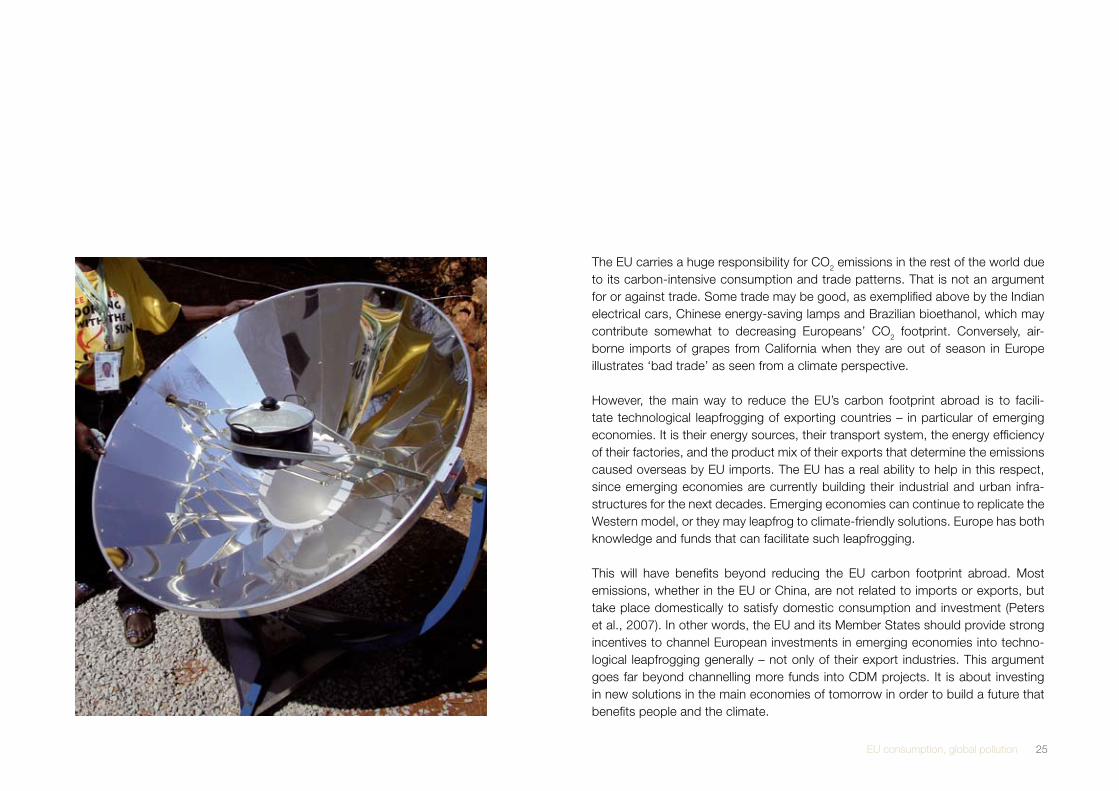
The EU carries a huge responsibility for CO2 emissions in the rest of the world due to its carbon-intensive consumption and trade patterns. That is not an argument for or against trade. Some trade may be good, as exemplified above by the Indian electrical cars, Chinese energy-saving lamps and Brazilian bioethanol, which may contribute somewhat to decreasing Europeans’ CO2 footprint. Conversely, air-borne imports of grapes from California when they are out of season in Europe illustrates ‘bad trade’ as seen from a climate perspective.
However, the main way to reduce the EU’s carbon footprint abroad is to facili-tate technological leapfrogging of exporting countries – in particular of emerging economies. It is their energy sources, their transport system, the energy efficiency of their factories, and the product mix of their exports that determine the emissions caused overseas by EU imports. The EU has a real ability to help in this respect, since emerging economies are currently building their industrial and urban infra-structures for the next decades. Emerging economies can continue to replicate the Western model, or they may leapfrog to climate-friendly solutions. Europe has both knowledge and funds that can facilitate such leapfrogging.
This will have benefits beyond reducing the EU carbon footprint abroad. Most emissions, whether in the EU or China, are not related to imports or exports, but take place domestically to satisfy domestic consumption and investment (Peters et al., 2007). In other words, the EU and its Member States should provide strong incentives to channel European investments in emerging economies into techno-logical leapfrogging generally – not only of their export industries. This argument goes far beyond channelling more funds into CDM projects. It is about investing in new solutions in the main economies of tomorrow in order to build a future that benefits people and the climate.

EU consumption, global pollution 26
ANNEXES
EU consumption, global pollution 27
Bilateral tradeThe direct international trade flow between two countries (for example, Japan and the USA, or France and Germany). In bilateral trade data, the trade to final and inter-mediate consumers is not distinguished.
CO2 balanceCO2 emitted in the EU for exports to trade partner minus CO2 emitted in trade partner for imports to the EU.
CO2 footprint (CO2 consumption)The global CO2 emissions embodied in final domestic consumption. It includes emis-sions occurring domestically and abroad.
CO2 productionThe domestic CO2 emissions embodied in total domestic production, whether des-tined for domestic or foreign consumption.
CO2 consumption overshoot CO2 consumption exceeding CO2 production.
CO2 production overshoot CO2 production exceeding CO2 consumption.
CO2 intensityCO2 emitted to produce an amount of products (this can be measured by value or weight).
Final consumption Final consumption consists of goods and services used up by individual households or the community to satisfy their individual or collective needs or wants. Compare with Intermediate Consumption.
Global emissions Includes all emissions caused to produce a good, whether they occurred domesti-cally or abroad.
Lifecycle assessmentThe compilation and evaluation of the inputs, outputs and the potential environmen-tal impacts of a product system throughout its lifecycle. The lifecycle is defined as the consecutive and interlinked stages of a product system, from raw material acquisi-tion or generation of natural resources to the final disposal.
Intermediate consumptionIntermediate consumption consists of the value of the goods and services consumed as inputs by a process of production, excluding fixed assets whose consumption is recorded as consumption of fixed capital; the goods or services may be either trans-formed or used up by the production process.
Input-Output Analysis (IOA)IOA is the study of the interindustry relationships between sectors of an economy. It can be used as a tool to determine the environmental impacts caused by the pro-duction of goods and services.
Multi-regional input-output (MRIO)MRIO analysis is an extension of IOA to many regions. It describes the relationships between industries both within a nation and between nations.
ANNEX I GLOSSARY
EU consumption, global pollution 28
FIGURES 1-3:
METHODOLOGY FOR IEA/BP/WRI 2006 PROJECTIONS AND DATA SETS
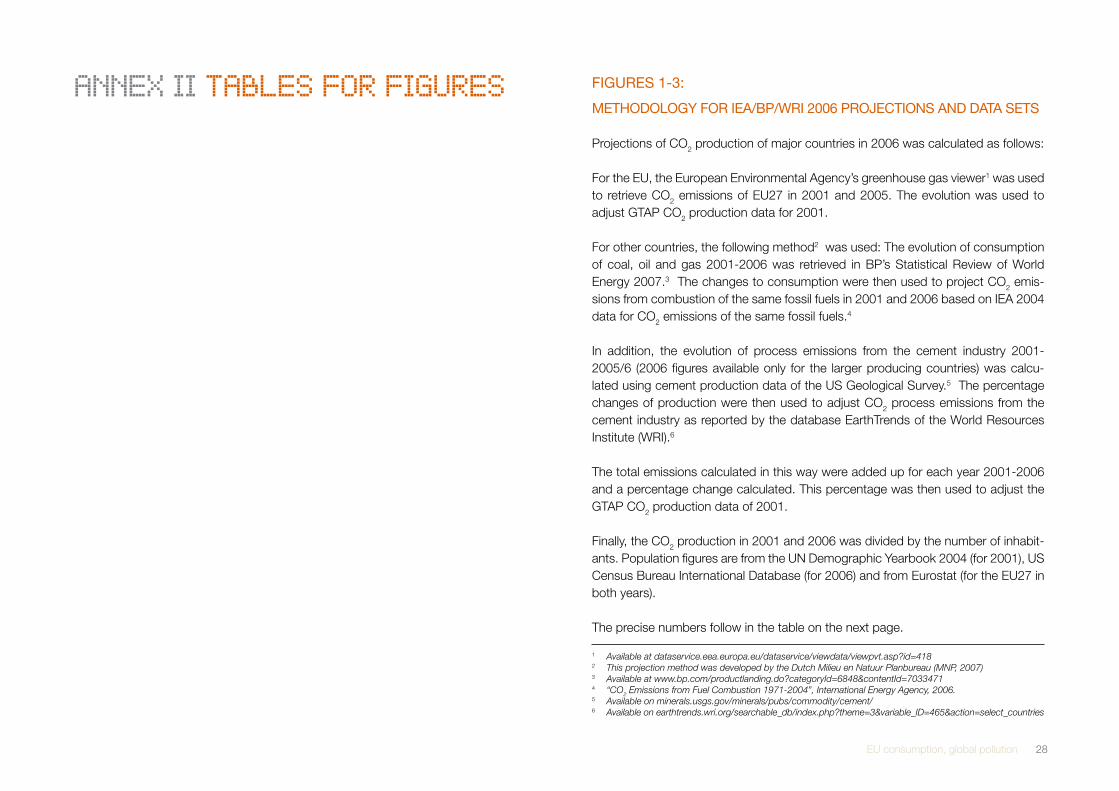
Projections of CO2 production of major countries in 2006 was calculated as follows:
For the EU, the European Environmental Agency’s greenhouse gas viewer1 was used to retrieve CO2 emissions of EU27 in 2001 and 2005. The evolution was used to adjust GTAP CO2 production data for 2001.
For other countries, the following method2 was used: The evolution of consumption of coal, oil and gas 2001-2006 was retrieved in BP’s Statistical Review of World Energy 2007.3 The changes to consumption were then used to project CO2 emis-sions from combustion of the same fossil fuels in 2001 and 2006 based on IEA 2004 data for CO2 emissions of the same fossil fuels.4
In addition, the evolution of process emissions from the cement industry 2001-2005/6 (2006 figures available only for the larger producing countries) was calcu-lated using cement production data of the US Geological Survey.5 The percentage changes of production were then used to adjust CO2 process emissions from the cement industry as reported by the database EarthTrends of the World Resources Institute (WRI).6
The total emissions calculated in this way were added up for each year 2001-2006 and a percentage change calculated. This percentage was then used to adjust the GTAP CO2 production data of 2001.
Finally, the CO2 production in 2001 and 2006 was divided by the number of inhabit-ants. Population figures are from the UN Demographic Yearbook 2004 (for 2001), US Census Bureau International Database (for 2006) and from Eurostat (for the EU27 in both years).
The precise numbers follow in the table on the next page.
ANNEX II TABLES FOR FIGURES
1 Available at dataservice.eea.europa.eu/dataservice/viewdata/viewpvt.asp?id=418 2 This projection method was developed by the Dutch Milieu en Natuur Planbureau (MNP, 2007) 3 Available at www.bp.com/productlanding.do?categoryId=6848&contentId=7033471 4 “CO2 Emissions from Fuel Combustion 1971-2004”, International Energy Agency, 2006. 5 Available on minerals.usgs.gov/minerals/pubs/commodity/cement/ 6 Available on earthtrends.wri.org/searchable_db/index.php?theme=3&variable_ID=465&action=select_countries

EU consumption, global pollution 29
DATASET FIGURES 1-3
Country/regionConsumption
2001 (tonnes/capita)
Production 2001
(tonnes/capita)
Production projection
2006 (tonnes/capita)
Consumption 2001(mt)
Production2001(mt)
Production projection 2006 (assuming GTAP
production %
increase similar to
IEA/BP/WRI. EU
projection based
on EEA data.)
Production est. 2006 based on
IEA/BP/WRI (except EU: EEA data for
2005)
Production 2001
based on IEA/BP/WRI (except EU:
EEA)
Production increase % based on
IEA/BP/WRI (EU: EEA
data 2001-2005)
Population 2001 (1000)
Population 2006 (1000)
US 22.28 20.81 20.31 6,346.6 5,925.3 6,062.3 5,750 5,620 2.3% 284,797 298,444
Canada 16.82 17.33 18.10 521.8 537.5 599.0 577 518 11.5% 31,021 33,099
Australia 15.80 17.74 18.02 306.6 344.4 365.2 361 340 6.1% 19,413 20,264
Japan 11.67 10.20 10.52 1,483.5 1,297.2 1,341.6 1,210 1,170 3.4% 127,130 127,515
EU27 9.84 8.71 8.64 4,753.1 4,206.2 4,274.3 4,269 4,201 1.6% 482,958 494,675
Korea 9.20 8.31 9.11 435.5 393.5 445.1 495 438 13.1% 47,343 48,847
Russia 8.13 10.44 11.28 1,170.5 1,503.4 1,602.3 1,620 1,520 6.6% 143,954 142,069
Middle East 5.67 6.52 7.77 994.9 1,144.2 1,480.3 1,330 1,028 29.4% 175431 190,581
Ex-USSR excl. 4.70 5.44 5.88 629.3 729.3 801.1 807.9 736 9.8% 133,952 136,137 Russia & Baltics
South Africa 4.43 7.20 8.24 196.3 319.1 364.3 344 301 14.2% 44,328 44,188
Mexico 3.80 3.60 3.87 386.7 366.8 416.2 419 369 13.5% 101,754 107,450
China 2.13 2.60 4.49 2,712.1 3,305.3 5,903.8 5,680 3,180 78.6% 1,271,850 1,313,974
India 0.88 0.94 1.15 904.7 970.0 1,278.6 1,301 987 31.8% 1,033,248 1,111,714
EU consumption, global pollution 30
Sector
Economic output
(million USD)
CO2 emissions globally
(1000 tonnes)
Eco-nomic output as %
of total
CO2 emis-sions
globally as % of
total
Paddy rice 190.0 191.2 0.0% 0.0%Wheat 1,450.9 948.5 0.0% 0.0%Cereal grains nec 974.0 594.6 0.0% 0.0%Vegetables, fruit, nuts 36,506.0 22,875.9 0.5% 0.6%Oil seeds 490.7 389.4 0.0% 0.0%Sugar cane, sugar beet 179.4 103.0 0.0% 0.0%Plant-based fibers 167.5 508.3 0.0% 0.0%Crops nec8 18,000.0 11,721.3 0.2% 0.3%Cattle, sheep, goats, horses 3,428.3 2,729.0 0.0% 0.1%Animal products nec 8,929.9 6,917.3 0.1% 0.2%Raw milk 6,536.1 5,145.7 0.1% 0.1%Wool, silk-worm cocoons 70.5 47.8 0.0% 0.0%Forestry 3,568.0 2,074.1 0.0% 0.1%Fishing 22,598.7 12,529.2 0.3% 0.3%Meat: cattle, sheep, goats, horse 49,333.9 28,047.8 0.6% 0.8%Meat products nec 73,519.6 47,857.0 0.9% 1.3%Vegetable oils and fats 25,065.6 14,250.1 0.3% 0.4%Dairy products 83,437.0 43,526.4 1.0% 1.2%Processed rice 1,664.6 1,283.6 0.0% 0.0%Sugar 7,726.5 5,892.3 0.1% 0.2%Food products nec 163,789.8 93,433.5 2.1% 2.5%Beverages and tobacco products 117,837.1 51,384.4 1.5% 1.4%Agriculture 625,464.2 352,450.6 7.8% 9.5%Coal 444.8 913.7 0.0% 0.0%Oil 0.3 0.7 0.0% 0.0%Gas 932.5 834.2 0.0% 0.0%Minerals nec 1,230.8 1,616.8 0.0% 0.0%Mining 2,608.3 3,365.3 0.0% 0.0%Petroleum, coal products 31,940.7 83,109.3 0.4% 2.2%Chemical, rubber, plastic prods 158,897.0 127,752.0 2.0% 3.4%Mining, petroleum & chemicals 196,054.5 217,592.0 2.5% 5.9%Textiles 49,148.3 30,083.9 0.6% 0.8%Wearing apparel 84,766.9 39,561.9 1.1% 1.1%Leather products 37,281.6 18,982.5 0.5% 0.5%
Sector7
Economic output
(million USD)
CO2 emissions globally
(1000 tonnes)
Eco-nomic output as %
of total
CO2 emis-sions
globally as % of
total
Textiles & clothes 171,196.9 88,628.4 2.1% 2.4%Wood products 65,280.4 36,816.7 0.8% 1.0%Paper products, publishing 61,013.3 44,973.6 0.8% 1.2%Wood & paper 126,293.8 81,790.2 1.6% 2.2%Mineral products nec 20,581.6 31,209.3 0.3% 0.8%Ferrous metals 1,671.0 4,017.9 0.0% 0.1%Metals nec 2,128.3 3,144.2 0.0% 0.1%Metal products 78,291.3 63,626.8 1.0% 1.7%Metals & mineral products 102,672.3 101,998.3 1.3% 2.7%Motor vehicles and parts 327,397.3 190,522.9 4.1% 5.1%Transport equipment nec 66,389.9 30,972.9 0.8% 0.8%Electronic equipment 168,651.2 77,750.8 2.1% 2.1%Machinery and equipment nec 379,262.2 202,652.8 4.8% 5.5%Manufactures nec 127,346.6 68,501.0 1.6% 1.8%Machinery & equipment 1,069,047.3 570,400.4 13.4% 15.3%Electricity 81,665.2 463,588.6 1.0% 12.5%Gas manufacture, distribution 7,453.9 28,551.7 0.1% 0.8%Water 16,731.8 12,448.7 0.2% 0.3%Electricity, gas, water 105,850.9 504,589.0 1.3% 13.6%Construction 822,436.4 405,595.1 10.3% 10.9%Trade 1,091,270.0 322,669.8 13.7% 8.7%Transport nec 198,993.2 194,129.5 2.5% 5.2%Sea transport 69,367.7 112,356.7 0.9% 3.0%Air transport 56,762.2 91,392.3 0.7% 2.5%Transport services 1,416,393.0 720,548.3 17.7% 19.4%Communication 90,757.4 17,292.6 1.1% 0.5%Financial services nec 51,943.6 9,035.9 0.7% 0.2%Insurance 101,176.7 22,362.7 1.3% 0.6%Business services nec 586,014.2 120,802.1 7.3% 3.3%Recreation and other services 409,544.2 84,366.5 5.1% 2.3%Dwellings 324,422.4 19,620.7 4.1% 0.5%Private and business services 1,563,858.6 273,480.6 19.6% 7.4%Pub.adm./defence/health/educ 1,781,701.7 399,478.3 22.3% 10.7%Total (excl. households) 7,980,969.6 3,716,551.3
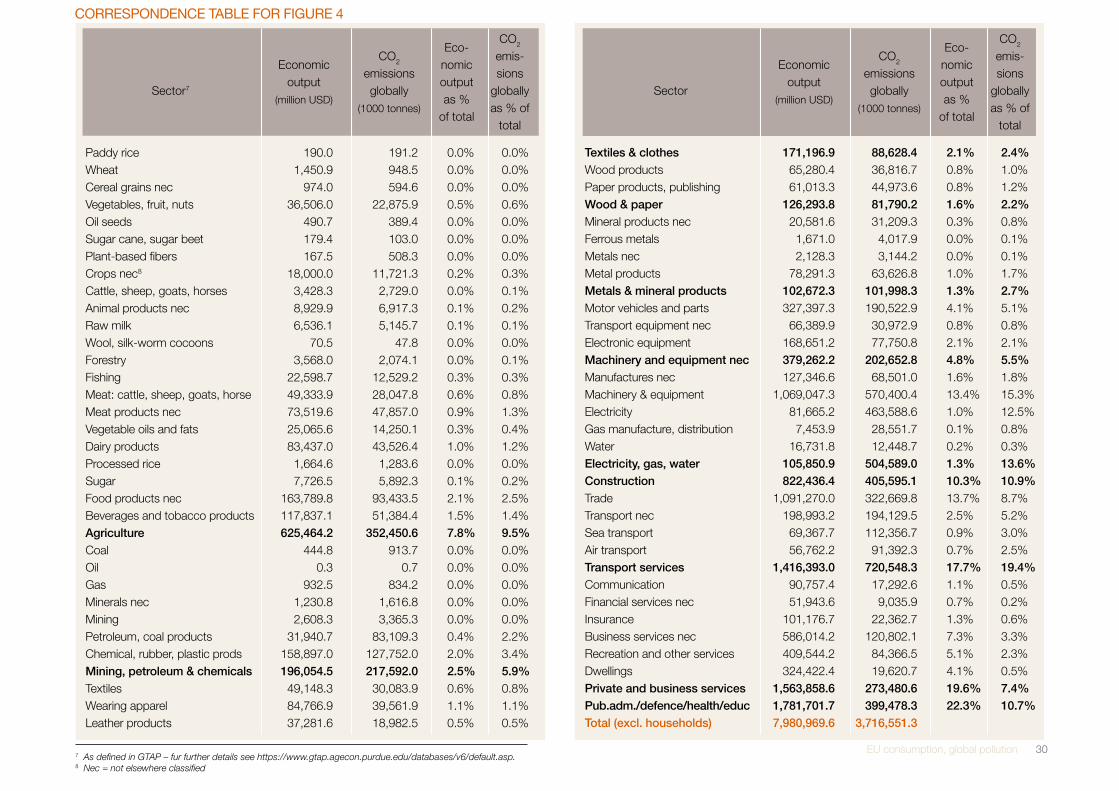
7 As defined in GTAP – fur further details see https://www.gtap.agecon.purdue.edu/databases/v6/default.asp. 8 Nec = not elsewhere classified
CORRESPONDENCE TABLE FOR FIGURE 4
EU consumption, global pollution 31
CORRESPONDENCE TABLE FOR AGGREGATE REGIONS IN WORLD MAP AND FIGURE 5
Aggregate region GTAP region9
Oceania Australia
New Zealand
Rest of Oceania
East Asia China
Hong Kong
Japan
Korea
Taiwan
Rest of East Asia
South and South-East Asia Indonesia
Malaysia
Philippines
Singapore
Thailand
Vietnam
Rest of Southeast Asia
Bangladesh
India
North America Canada
United States
Rest of North America
South and Central America Mexico
Central America
Rest of FTAA
Rest of the Caribbean
Colombia
Peru
Venezuela
Rest of Andean Pact
Argentina
Brazil
Chile
Uruguay
Rest of South America
EU27 Austria
Belgium
Denmark
Finland
France
Germany
United Kingdom
Greece
Ireland
Italy
9 The full details about GTAP regions are available on https://www.gtap.agecon.purdue.edu/databases/v6/ v6_regions.asp?version=60
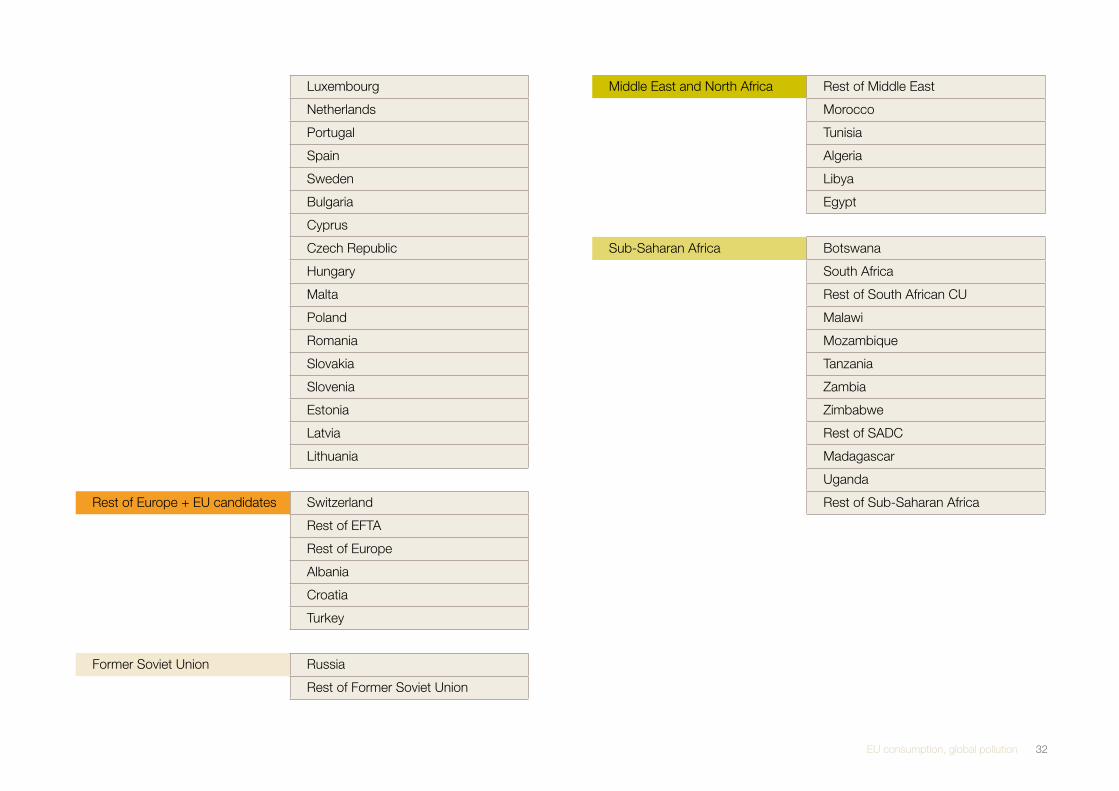
EU consumption, global pollution 32
Luxembourg
Netherlands
Portugal
Spain
Sweden
Bulgaria
Cyprus
Czech Republic
Hungary
Malta
Poland
Romania
Slovakia
Slovenia
Estonia
Latvia
Lithuania
Rest of Europe + EU candidates Switzerland
Rest of EFTA
Rest of Europe
Albania
Croatia
Turkey
Former Soviet Union Russia
Rest of Former Soviet Union
Middle East and North Africa Rest of Middle East
Morocco
Tunisia
Algeria
Libya
Egypt
Sub-Saharan Africa Botswana
South Africa
Rest of South African CU
Malawi
Mozambique
Tanzania
Zambia
Zimbabwe
Rest of SADC
Madagascar
Uganda
Rest of Sub-Saharan Africa
EU consumption, global pollution 33
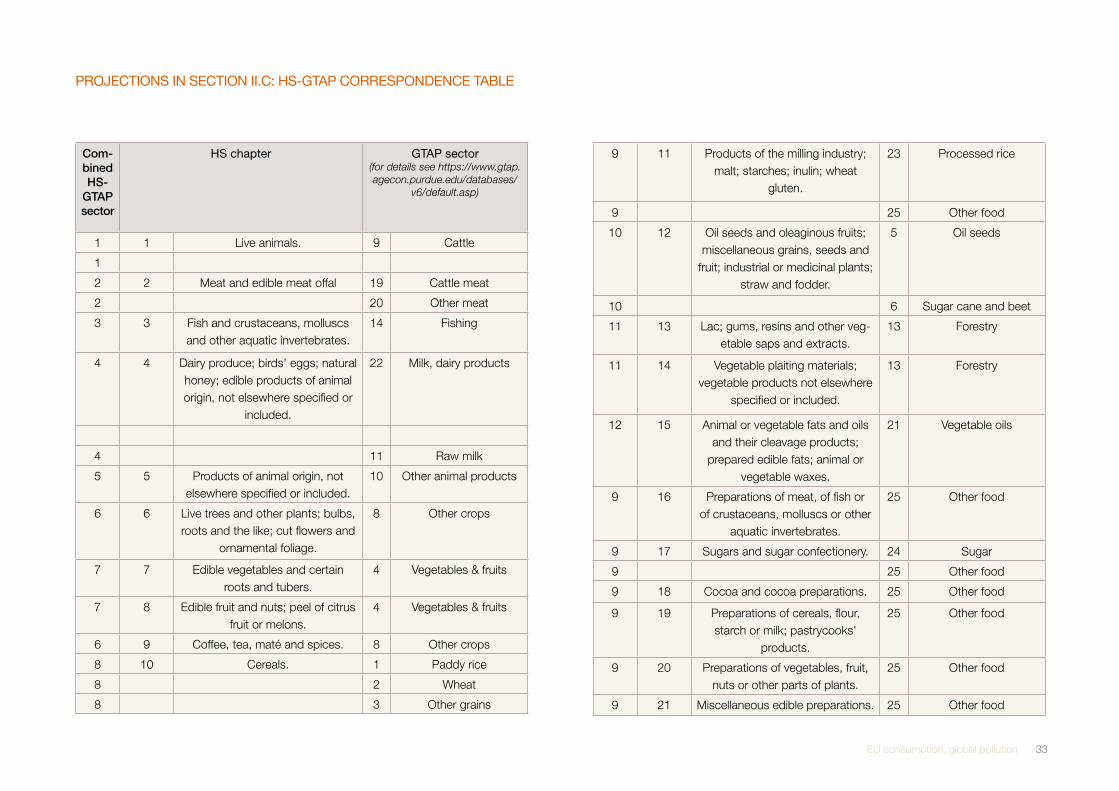
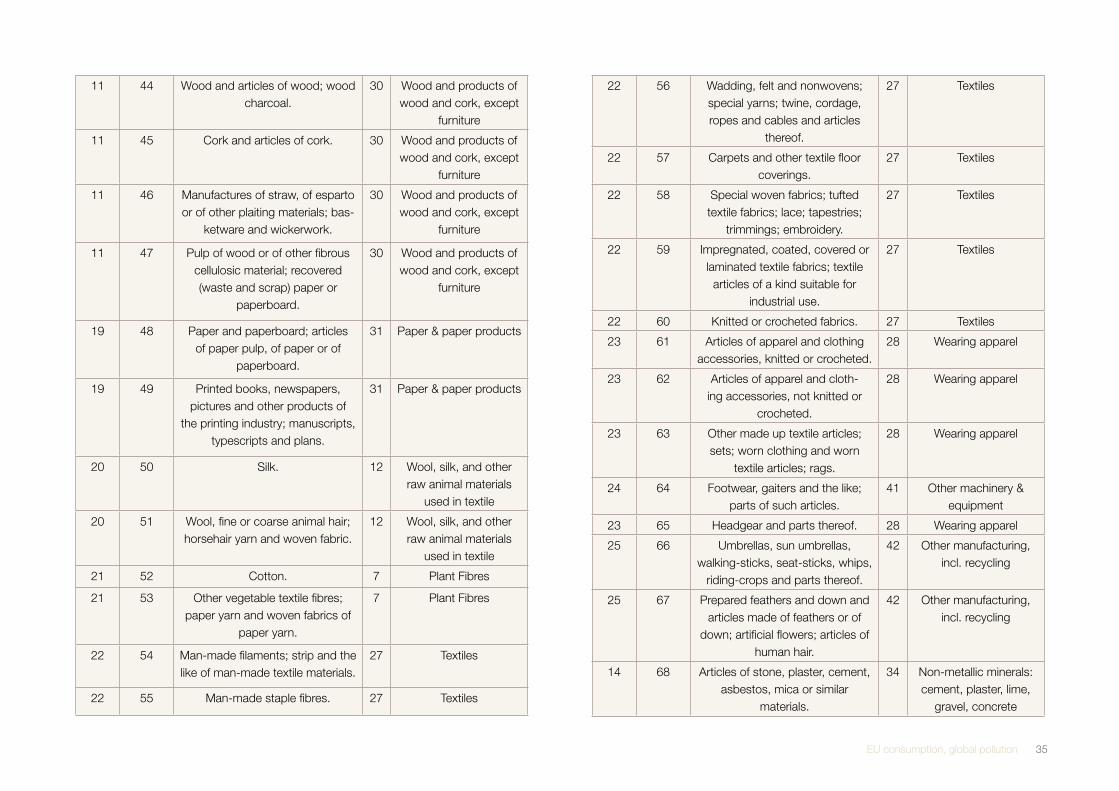
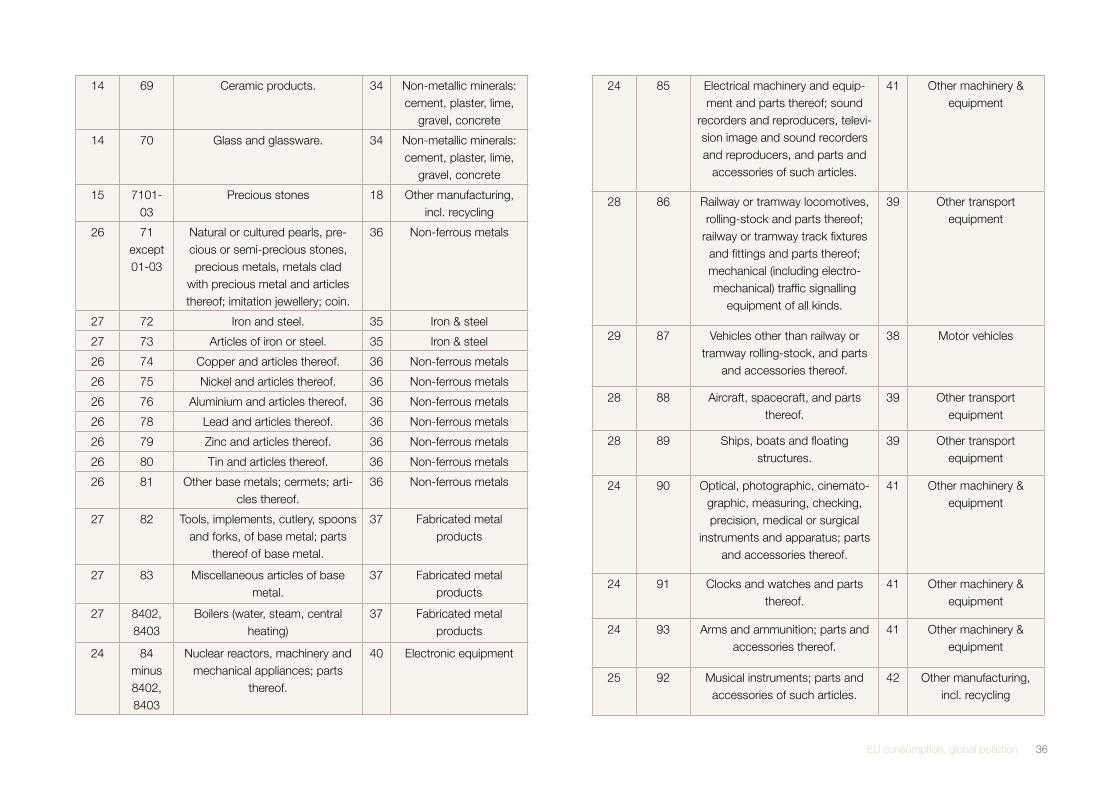
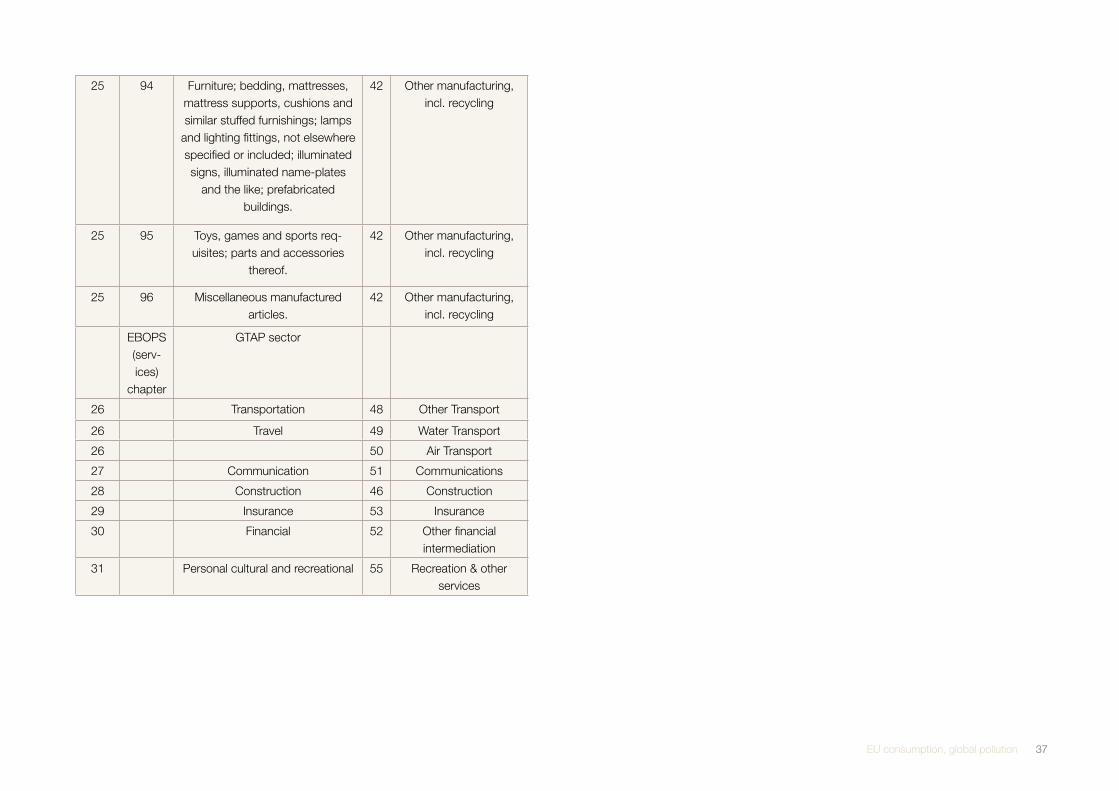
PROJECTIONS IN SECTION II.C: HS-GTAP CORRESPONDENCE TABLE
Com-bined HS-
GTAP sector
HS chapter GTAP sector (for details see https://www.gtap.agecon.purdue.edu/databases/
v6/default.asp)
1 1 Live animals. 9 Cattle
1
2 2 Meat and edible meat offal 19 Cattle meat
2 20 Other meat
3 3 Fish and crustaceans, molluscs and other aquatic invertebrates.
14 Fishing
4 4 Dairy produce; birds' eggs; natural honey; edible products of animal origin, not elsewhere specified or
included.
22 Milk, dairy products
4 11 Raw milk
5 5 Products of animal origin, not elsewhere specified or included.
10 Other animal products
6 6 Live trees and other plants; bulbs, roots and the like; cut flowers and
ornamental foliage.
8 Other crops
7 7 Edible vegetables and certain roots and tubers.
4 Vegetables & fruits
7 8 Edible fruit and nuts; peel of citrus fruit or melons.
4 Vegetables & fruits
6 9 Coffee, tea, maté and spices. 8 Other crops
8 10 Cereals. 1 Paddy rice
8 2 Wheat
8 3 Other grains
9 11 Products of the milling industry; malt; starches; inulin; wheat
gluten.
23 Processed rice
9 25 Other food
10 12 Oil seeds and oleaginous fruits; miscellaneous grains, seeds and
fruit; industrial or medicinal plants; straw and fodder.
5 Oil seeds
10 6 Sugar cane and beet
11 13 Lac; gums, resins and other veg-etable saps and extracts.
13 Forestry
11 14 Vegetable plaiting materials; vegetable products not elsewhere
specified or included.
13 Forestry
12 15 Animal or vegetable fats and oils and their cleavage products;
prepared edible fats; animal or vegetable waxes.
21 Vegetable oils
9 16 Preparations of meat, of fish or of crustaceans, molluscs or other
aquatic invertebrates.
25 Other food
9 17 Sugars and sugar confectionery. 24 Sugar
9 25 Other food
9 18 Cocoa and cocoa preparations. 25 Other food
9 19 Preparations of cereals, flour, starch or milk; pastrycooks'
products.
25 Other food
9 20 Preparations of vegetables, fruit, nuts or other parts of plants.
25 Other food
9 21 Miscellaneous edible preparations. 25 Other food
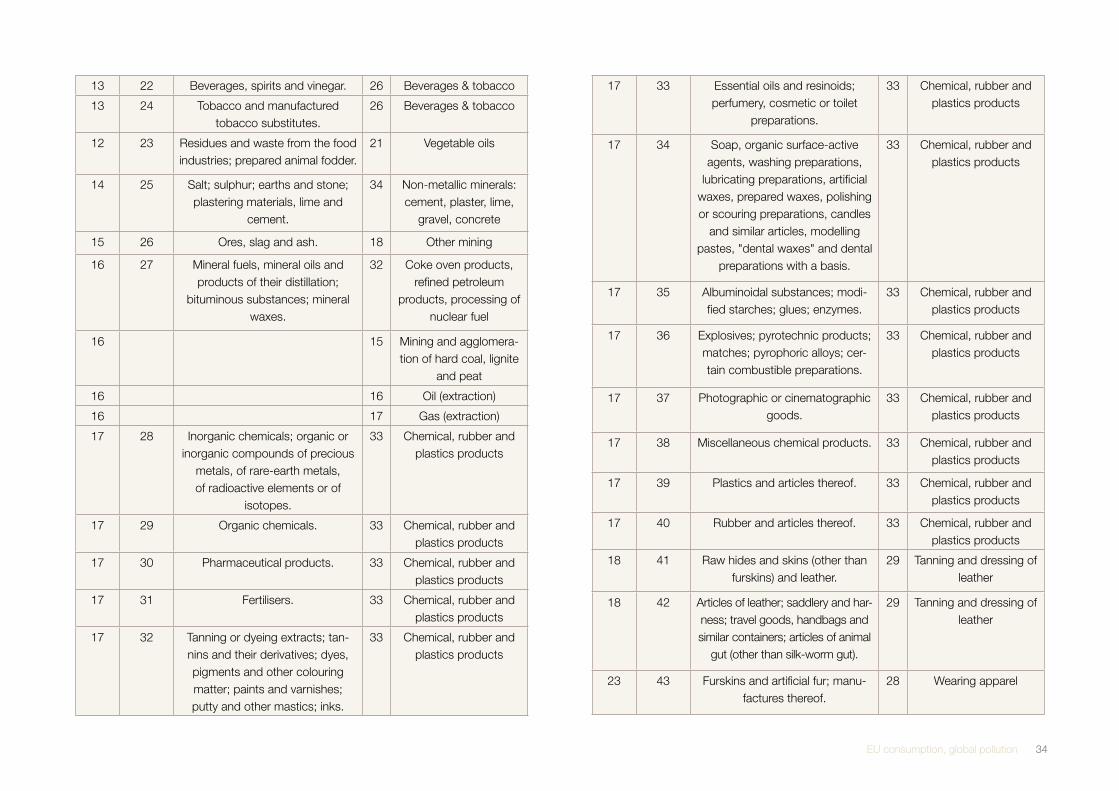
EU consumption, global pollution 34
13 22 Beverages, spirits and vinegar. 26 Beverages & tobacco
13 24 Tobacco and manufactured tobacco substitutes.
26 Beverages & tobacco
12 23 Residues and waste from the food industries; prepared animal fodder.
21 Vegetable oils
14 25 Salt; sulphur; earths and stone; plastering materials, lime and
cement.
34 Non-metallic minerals: cement, plaster, lime,
gravel, concrete
15 26 Ores, slag and ash. 18 Other mining
16 27 Mineral fuels, mineral oils and products of their distillation;
bituminous substances; mineral waxes.
32 Coke oven products, refined petroleum
products, processing of nuclear fuel
16 15 Mining and agglomera-tion of hard coal, lignite
and peat
16 16 Oil (extraction)
16 17 Gas (extraction)
17 28 Inorganic chemicals; organic or inorganic compounds of precious
metals, of rare-earth metals, of radioactive elements or of
isotopes.
33 Chemical, rubber and plastics products
17 29 Organic chemicals. 33 Chemical, rubber and plastics products
17 30 Pharmaceutical products. 33 Chemical, rubber and plastics products
17 31 Fertilisers. 33 Chemical, rubber and plastics products
17 32 Tanning or dyeing extracts; tan-nins and their derivatives; dyes, pigments and other colouring matter; paints and varnishes; putty and other mastics; inks.
33 Chemical, rubber and plastics products
17 33 Essential oils and resinoids; perfumery, cosmetic or toilet
preparations.
33 Chemical, rubber and plastics products
17 34 Soap, organic surface-active agents, washing preparations,
lubricating preparations, artificial waxes, prepared waxes, polishing or scouring preparations, candles
and similar articles, modelling pastes, "dental waxes" and dental
preparations with a basis.
33 Chemical, rubber and plastics products
17 35 Albuminoidal substances; modi-fied starches; glues; enzymes.
33 Chemical, rubber and plastics products
17 36 Explosives; pyrotechnic products; matches; pyrophoric alloys; cer-tain combustible preparations.
33 Chemical, rubber and plastics products
17 37 Photographic or cinematographic goods.
33 Chemical, rubber and plastics products
17 38 Miscellaneous chemical products. 33 Chemical, rubber and plastics products
17 39 Plastics and articles thereof. 33 Chemical, rubber and plastics products
17 40 Rubber and articles thereof. 33 Chemical, rubber and plastics products
18 41 Raw hides and skins (other than furskins) and leather.
29 Tanning and dressing of leather
18 42 Articles of leather; saddlery and har-ness; travel goods, handbags and similar containers; articles of animal
gut (other than silk-worm gut).
29 Tanning and dressing of leather
23 43 Furskins and artificial fur; manu-factures thereof.
28 Wearing apparel
EU consumption, global pollution 35
11 44 Wood and articles of wood; wood charcoal.
30 Wood and products of wood and cork, except
furniture
11 45 Cork and articles of cork. 30 Wood and products of wood and cork, except
furniture
11 46 Manufactures of straw, of esparto or of other plaiting materials; bas-
ketware and wickerwork.
30 Wood and products of wood and cork, except
furniture
11 47 Pulp of wood or of other fibrous cellulosic material; recovered (waste and scrap) paper or
paperboard.
30 Wood and products of wood and cork, except
furniture
19 48 Paper and paperboard; articles of paper pulp, of paper or of
paperboard.
31 Paper & paper products
19 49 Printed books, newspapers, pictures and other products of
the printing industry; manuscripts, typescripts and plans.
31 Paper & paper products
20 50 Silk. 12 Wool, silk, and other raw animal materials
used in textile
20 51 Wool, fine or coarse animal hair; horsehair yarn and woven fabric.
12 Wool, silk, and other raw animal materials
used in textile
21 52 Cotton. 7 Plant Fibres
21 53 Other vegetable textile fibres; paper yarn and woven fabrics of
paper yarn.
7 Plant Fibres
22 54 Man-made filaments; strip and the like of man-made textile materials.
27 Textiles
22 55 Man-made staple fibres. 27 Textiles
22 56 Wadding, felt and nonwovens; special yarns; twine, cordage, ropes and cables and articles
thereof.
27 Textiles
22 57 Carpets and other textile floor coverings.
27 Textiles
22 58 Special woven fabrics; tufted textile fabrics; lace; tapestries;
trimmings; embroidery.
27 Textiles
22 59 Impregnated, coated, covered or laminated textile fabrics; textile
articles of a kind suitable for industrial use.
27 Textiles
22 60 Knitted or crocheted fabrics. 27 Textiles
23 61 Articles of apparel and clothing accessories, knitted or crocheted.
28 Wearing apparel
23 62 Articles of apparel and cloth-ing accessories, not knitted or
crocheted.
28 Wearing apparel
23 63 Other made up textile articles; sets; worn clothing and worn
textile articles; rags.
28 Wearing apparel
24 64 Footwear, gaiters and the like; parts of such articles.
41 Other machinery & equipment
23 65 Headgear and parts thereof. 28 Wearing apparel
25 66 Umbrellas, sun umbrellas, walking-sticks, seat-sticks, whips,
riding-crops and parts thereof.
42 Other manufacturing, incl. recycling
25 67 Prepared feathers and down and articles made of feathers or of
down; artificial flowers; articles of human hair.
42 Other manufacturing, incl. recycling
14 68 Articles of stone, plaster, cement, asbestos, mica or similar
materials.
34 Non-metallic minerals: cement, plaster, lime,
gravel, concrete
EU consumption, global pollution 36
14 69 Ceramic products. 34 Non-metallic minerals: cement, plaster, lime,
gravel, concrete
14 70 Glass and glassware. 34 Non-metallic minerals: cement, plaster, lime,
gravel, concrete
15 7101-03
Precious stones 18 Other manufacturing, incl. recycling
26 71 except 01-03
Natural or cultured pearls, pre-cious or semi-precious stones, precious metals, metals clad
with precious metal and articles thereof; imitation jewellery; coin.
36 Non-ferrous metals
27 72 Iron and steel. 35 Iron & steel
27 73 Articles of iron or steel. 35 Iron & steel
26 74 Copper and articles thereof. 36 Non-ferrous metals
26 75 Nickel and articles thereof. 36 Non-ferrous metals
26 76 Aluminium and articles thereof. 36 Non-ferrous metals
26 78 Lead and articles thereof. 36 Non-ferrous metals
26 79 Zinc and articles thereof. 36 Non-ferrous metals
26 80 Tin and articles thereof. 36 Non-ferrous metals
26 81 Other base metals; cermets; arti-cles thereof.
36 Non-ferrous metals
27 82 Tools, implements, cutlery, spoons and forks, of base metal; parts
thereof of base metal.
37 Fabricated metal products
27 83 Miscellaneous articles of base metal.
37 Fabricated metal products
27 8402, 8403
Boilers (water, steam, central heating)
37 Fabricated metal products
24 84 minus 8402, 8403
Nuclear reactors, machinery and mechanical appliances; parts
thereof.
40 Electronic equipment
24 85 Electrical machinery and equip-ment and parts thereof; sound
recorders and reproducers, televi-sion image and sound recorders and reproducers, and parts and
accessories of such articles.
41 Other machinery & equipment
28 86 Railway or tramway locomotives, rolling-stock and parts thereof;
railway or tramway track fixtures and fittings and parts thereof; mechanical (including electro-mechanical) traffic signalling
equipment of all kinds.
39 Other transport equipment
29 87 Vehicles other than railway or tramway rolling-stock, and parts
and accessories thereof.
38 Motor vehicles
28 88 Aircraft, spacecraft, and parts thereof.
39 Other transport equipment
28 89 Ships, boats and floating structures.
39 Other transport equipment
24 90 Optical, photographic, cinemato-graphic, measuring, checking, precision, medical or surgical
instruments and apparatus; parts and accessories thereof.
41 Other machinery & equipment
24 91 Clocks and watches and parts thereof.
41 Other machinery & equipment
24 93 Arms and ammunition; parts and accessories thereof.
41 Other machinery & equipment
25 92 Musical instruments; parts and accessories of such articles.
42 Other manufacturing, incl. recycling
EU consumption, global pollution 37
25 94 Furniture; bedding, mattresses, mattress supports, cushions and similar stuffed furnishings; lamps
and lighting fittings, not elsewhere specified or included; illuminated signs, illuminated name-plates
and the like; prefabricated buildings.
42 Other manufacturing, incl. recycling
25 95 Toys, games and sports req-uisites; parts and accessories
thereof.
42 Other manufacturing, incl. recycling
25 96 Miscellaneous manufactured articles.
42 Other manufacturing, incl. recycling
EBOPS (serv-ices)
chapter
GTAP sector
26 Transportation 48 Other Transport
26 Travel 49 Water Transport
26 50 Air Transport
27 Communication 51 Communications
28 Construction 46 Construction
29 Insurance 53 Insurance
30 Financial 52 Other financial intermediation
31 Personal cultural and recreational 55 Recreation & other services
EU consumption, global pollution 38
ANNEX III METhOdOLOGY
WHAT IS “POLLUTION EMBODIED IN TRADE”10 ?
The production of goods and services generates pollution through production proc-esses and through the energy consumption required in production. The cumula-tive pollution emitted through the entire chain of production, starting from resource extraction to final sale, is said to be “embodied” in that product. If the product is further traded across national borders, then this is “pollution embodied in trade”.
The concept of pollution embodied in trade shares many characteristics with mate-rial flow analysis. In traditional material flow analysis the physical flow of the material of interest, iron for example, is traced around the globe. For pollution embodied in trade, the pollutant is not physically a part of the traded product, but rather the pollution emitted in the production of that product. Consequently, some published research refers to “hidden” or “virtual” flows of pollution.
The main method for calculating emissions embodied in trade is input-output analy-sis. Input-output analysis originated in economics and is a widely accepted method for analyzing the interconnections between different economic sectors (its founder, Wassily Leontief, received a Nobel Prize). For calculations of pollution embodied in trade, the standard input-output model must be generalized into a multi-regional model to account for the different production technologies in different countries. The main methodological issue for pollution embodied in trade is linking the input-output data from different countries through trade statistics.
The calculation and analysis of the pollution embodied in trade is useful in many areas of environmental system analysis. Pollution embodied in trade gives a good measure of how consumption choices in one country affect the environment in other countries. It also can demonstrate a quantitative change if countries increasingly shift polluting production off-shore while pursuing a less polluting knowledge-based domestic economy. These applications are particularly relevant for addressing the connection between trade and the environment.
10 Adapted from http://www.eoearth.org/article/Pollution_embodied_in_trade
CALCULATING “POLLUTION EMBODIED IN TRADE”
The production of most products for final consumption requires a complex produc-tion network usually spanning numerous countries. For instance, car production in Germany may resemble more car assembly rather than car production. The car pro-ducer in Germany will source the components of the car from numerous suppliers: the leather on the car seat may come from China, the suspension from South Africa, the radio from Japan, the engine from a German manufacturer, and the car tyres from the USA. In addition, the car producer needs to purchase electricity to run the plant, financial and insurance services, human labour, and so on. In turn, each com-pany that supplies to the car producer needs to assemble or produce their products. The leather seat requires inputs from agriculture, chemicals, metals, electricity, and so on. Many of materials in the car ultimately originate in various mines around the world – such as South Africa, Australia, and Chile – and pollution is emitted mining, transporting, and transforming these processes. Each step in the global production chain required to produce one car in Germany requires millions of transactions and each of those transactions releases some pollution.
Calculating the global pollution from complex production systems is a non-trivial task, but was made considerably easier through an economic tool called input-out-put analysis (IOA). The backbone of IOA is an input-output table (IOT) where each row and column represents a different sector of the economy – ranging from tens to hundreds of sectors, depending on the country. Each entry in the IOT describes the relationship between two sectors in the economy, and is constructed in such a way that the columns of the table are like production recipes in a recipe book. For instance, the column to produce a car shows that to produce one car you need, one car frame, one car engine, two front seats, one back seat, four wheels, a steer-ing wheel, radio, electricity, insurance, labour, and so on. Then there is a column to show what is needed to produce a car engine, and so on. In general, these tables are collected in monetary units and account for every monetary flow in the economy. The tables are rather aggregated with sectors such as “car manufacturing”, “tex-tiles”, “insurance”, “electricity”, and so on. Most countries construct these tables with between fifty to one hundred sectors. The construction of the IOT, or variants of it, are central to economic analysis and are the backbone to calculating fundamental
EU consumption, global pollution 39
economic measures such as Gross Domestic Product. It is the economic equivalent of double-entry book keeping in company accounts.
The framework for IOA can be developed in several ways, but it is quite instructive to develop it in an analogous way to the global production system. This can help understand the way global production networks work in addition to IOA. Suppose we want to produce a product such as a car and we call this y. The minimum output, x, of the economy is at least one car, y,
x = y (1)
In general, this relationship is expressed using a column of numbers (a vector), for example, one car, zero agriculture, zero metals, zero insurance, etc. To produce the car requires inputs from other parts of the economy. We can use the IOT in a normalized form – the production recipe for each product (a matrix) – to determine these inputs, Ay,
x = y + A y (2)
To produce the inputs Ay requires inputs from a range of suppliers x = y + Ay + A ( Ay ) = y + Ay + A2y (3)
This, in turn, requires inputs from other suppliers x = y + Ay + A2y + A( A2y ) = y + Ay + A2y + A3y (4)
And this continues infinitely through the global production system, x = y + Ay + A2y + A3y + A4y + … (5)
After some mathematical tricks – the power series expansion – one ends with the standard relationship for IOA,
x = ( I - A )-1 y (6)
which given a demand on products, y, finds the global economic activity in every sector, x, given the production recipes for every product in the economy, A. The I is a matrix with ones on the diagonal (equivalent to the number one). Once we know the global economic activity in every sector, it is possible to determine the environmental impacts given the emission intensity in each sector.
METHODOLOGY: MULTI-REGIONAL INPUT-OUTPUT ANALYSIS
This section gives a detailed description of the two approaches used to define the quantities calculated in this report. These are 1) “emissions embodied in bilateral trade” (EEBT) used to calculate “CO2 - balances” of bilateral trade, and 2) “emissions embodied in consumption” (EEC) used for comparing domestic CO2- production with emissions caused by domestic consumption. It assumes some knowledge of environmental IOA. More details on environmental IOA (Leontief 1986) and environ-mental MRIOA (Peters 2007a; Wiedmann et al 2007) can be found elsewhere.
The standard IOA framework begins with an accounting balance of monetary flows, xr= Ar xr + yr+ er - mr (7)
where x is the vector of total output in each sector, y is a vector with the each ele-ment representing final consumption – households, governments, and capital – in each industry sector (domestic plus imports), e is the vector of total exports, m is the vector of total imports (for both intermediate and final consumption), A is a matrix where the columns represent the input from each industry (domestic plus imports) to produce one unit of output for each domestic industry, Ax is the vector of total intermediate consumption, and r is the region under investigation. This balance equation holds in all regions. The trade components can also be expressed using bilateral trade data
er= ∑se rs (8)
for exports from region r to s and by symmetry the total imports are
mr= ∑se sr (9)
EU consumption, global pollution 40
where ers is the bilateral trade data.
To perform analysis with this model the imports are usually removed from the system, xr=Arrxr+yrr+er (10)
which expresses the same balance using only domestic activities. The domestic final consumption is decomposed as
yr= yrr + ∑sy sr (11)
and the interindustry requirements are decomposed as
Ar= Arr + ∑sAsr (12)
where Arr represents the industry input of domestically produced products and Asr
represents the industry input of products from region s to region r.
The environmental impacts are calculated as,
f r= Fr x r = Fr [I-Arr ]-1 [yrr +∑ ers]
(13)
where F is the CO2 emissions per unit industry output (a row vector). These are the emissions that occur domestically to produce both domestic final consumption and total exports.
At this point two main approaches exist to determine the environmental impacts of imported goods and services. One considers only direct trade between regions and the other considers multilateral trade between regions by separating the trade that goes to final and intermediate consumers.
EMISSIONS EMBODIED IN BILATERAL TRADE (EEBT)
The emissions embodied in bilateral trade (EEBT) are calculated using monetary bilateral trade statistics. This method does not perform a separate calculation for imports as such, rather it determines the emissions in one region, r, to produce the bilateral trade flow ers, and these are the emissions embodied in imports from region r to region s. The method does not distinguish between trade to intermediate and final consumption.
A key assumption employed in IOA is that the production technology is based on fixed proportions (i.e. that in a given sector, the production for domestic demand has the same characteristics as production for exports). This allows (13) to be decom-posed into components for domestic demand on domestic production in region r
f rr= Fr [I-Arr ]-1
y rr
(14)
and the EEBT from region r to region s
f rs= F r [I-Arr ]-1
e rs (15)
Adding these gives the total emissions occurring in region r
f r= f rr+ ∑ f rs (16)
The direct household emissions can be included in f rr.
The total emissions embodied in bilateral trade for exports (EEBT-E) from region to all other regions can be determined by summation,
f r*= ∑ f rs (17)
and reversing the summation gives the emissions embodied in bilateral trade for imports (EEBT-I) into r from all other regions
f *r= ∑ f rs (18)
This method covers all global emissions.
s
s
s
s
EU consumption, global pollution 41
EMISSIONS EMBODIED IN CONSUMPTION (EEC)
While the EEBT methodology is conceptually sound it is not applicable for arbitrary final consumption. The EEBT method determines the emissions occurring in one region to produce the export to another region, but it does not determine the total emissions to produce a given product since some regions require imports to pro-duce exports. For instance, to calculate the emissions embodied in the production of an exported car from region A, one must first determine the production levels and emissions occurring in region A. Then, the shares of imports from B and C into region A to produce the car are required. Given the resulting production and emissions in regions B and C, imports from other regions into B and C are required and so on. This process continues indefinitely through the global production sys-tem. This type of analysis is performed using a Multi-Regional Input Output (MRIO) model and is analogous to Life Cycle Assessment (LCA).
A key difference between the EEBT model and the MRIO model is that the MRIO model needs to distinguish between trade that goes to intermediate and final con-sumption. This can be performed by splitting the bilateral trade data into use by final demand, y, and industry, z, (details below),
ers= zrs+ yrs (19)
The exports to industry can be expressed as
zrs= Ars+ xs (20)
where xs represents the output in region s. By substitution of the decomposed exports into (10) the standard MRIO model results,
x r= Arr x r+y rr+∑ Ars x s+∑ yrs (21)
By considering the equation in each region the matrix form is obtained,
x 1 A11 A12 A13 … A1m x 1
x 2 A21 A22 A23 … A2m x 2
x 3 = A31 A32 A33 … A3m x 3 + (22) M M M M … M M x m Am1 Am2 Am3 … Amm x m
where each “block” in the large matrix represents the interactions between different countries; Ars is the trade between industries from region r to region s and yrs is the trade from industries in region r to final consumers in region s. The final consumption in each region r is given by a vector
y 1r
y 2r
y r = y 3r (23) M
y mr
where yrr is the final demand produced domestically. Given the final consumption, the MRIO model endogenously calculates not only domestic output, but also the output in all other regions resulting from trade. Given the output in each region, the emissions can be calculated,
f=F 1x1+ F 2x2+…+F mxm (24)
The challenge of the MRIO model is to split ers into the desired components. This is possible using the IOT for imports, which has the balance m r= ∑ esr =Z r,imp e+yr,imp (25)
where Zr* represents the collected (or estimated) industry requirements of imported goods and services, yr* is the imports to final consumption, and e is a summation vector. The bilateral trade data, ers, can then be distributed according to the use of imports by industry (25). Each component of the industry requirements of imports then becomes, Z sr=Z r,imp
esr (26)
where the element Zij is the use of sector i by sector j, and Zrs is the import from
region r to region s (that is, Zrsij is the import of sector i from region r to sector j in
region s). Thus, in each region r the bilateral trade data, ers, is distributed across using sectors in the same ratio as in (25). Similarly, the same distribution applies to the final demand categories, y sr=y r,imp
esr (27)
s≠ r s≠ r
∑ y1s
∑ y2s
∑ y3s
M
∑ y mr
s
s
s
s
s
ijij
m ri
i
ijm r i
i
ij
EU consumption, global pollution 42
where j represents different categories of final demand (households, government, etc). Essentially the method distributes the bilateral trade data according to the structure in the import IOT. The advantage of this splitting method is that if the bilat-eral trade data is “pre-balanced” then it is not required to rebalance the MRIO table (using the RAS method, for example).
CHOOSING EEBT AND EEC
The two different methods EEBT and EEC present the same information in a differ-ent way. Neither method is correct or incorrect, they essentially only differ in the way they allocate emissions from imported products – specifically, they allocated imports to produce exports differently. Depending on the application, the analyst will choose one method over the other (for further details see Peters 2007b).
Criteria\Method EEBT EEC
Allocation of imports to produce exports
Allocates all trade to producing country
Allocates all trade to final consumption product
Trade data required Bilateral trade Bilateral trade split between intermediate and final consumption
Equivalent to LCA No Yes
Comparable with bilateral trade
Yes No
Complexity (Transparency) Low High
Applications More relevant for national level issues
More relevant for product specific issues
UNCERTAINTIES IN THIS STUDY
IndEcol constructs the MRIO models using the GTAP database (Dimaranan 2006; https://www.gtap.agecon.purdue.edu/). The GTAP is a collaboration of various insti-tutions with the goal to construct and maintain a global database for economic mod-elling. The database contains input-output, bilateral trade, trade protection, energy,
and other economic data for 87 world regions and 57 sectors. To understand the uncertainty in the GTAP database requires a brief description of how the GTAP data-base is constructed:
1. Input-output data is submitted by database contributors
a. Contributions are voluntary and so the data can be rather old. For instance, Sweden is from 1985, most EU countries are from the early 1990’s. The GTAP scales the data to match 2001 GDP in international dollars, which means the data has the structure of its base-year, but the volume of 2001.
b. The uncertainty in the original data is not reported and different countries might have different “definitions” making comparisons difficult.
2. Input-output data is harmonized
a. The data needs to be converted to the GTAP format. This requires various aggregations and disaggregations. Disaggregation is the main issue with some countries aggregated to as low as 20 sectors (Russia). Further disag-gregations are performed in the food and agriculture sectors.
b. The uncertainty introduced in the harmonization process is unknown
3. GTAP includes various additional data, such as trade and energy volumes, to update the input-output data
a. Once all the data has been linked it has to be “balanced” to obtain a global equilibrium.
b. The uncertainty introduced in the balancing is unknown.
4. The CO2 emissions data are derived from the energy data. GTAP assumed that each country had the same emission factors for fuel combustion. There were also several errors in the data.
a. IndEcol updated most EU countries, Australia, China, Japan, and USA with more recent data. Using the updated information, some other data was cor-rected in other countries.
b. The quality of the CO2 data is poor and may vary 10-20% from other sources at the national level. Variations may be greater at the sector level.
Thus, the GTAP database has considerable uncertainty, but it is unknown how big this uncertainty is (a common problem with economic data). IndEcol uses the GTAP
EU consumption, global pollution 43
database as a starting point to construct the MRIO model. This again introduces some additional uncertainty, but without knowing the uncertainty at the start it is not possible to assign uncertainties to the finished product.
Given all the steps in constructing the GTAP database and then converting into a model for LCA it is difficult to give an accurate measure of uncertainty. Given the steps above, it is understandable that one would be concerned about uncertainty. Yet, the GTAP data is at the core of most global economic models and is used by most international organisations. Put in other words, GTAP is widely accepted as a reputable data source for economic analysis.
Putting a measure on the uncertainty in GTAP is difficult. It is not possible to say “we are 95% confident the emissions lie between two values”. However, it is possible to compare with other studies, other data sets, and other methods. In general most input-output based studies will use similar data and methods, meaning that there will be some agreement in the analysis. So while it is not possible to give a quantitative measure of uncertainty, it is possible to give a more qualitative description.
Comparisons of our results with other studies have shown reasonable agreement. For aggregated emissions embodied in trade, our results lie between the upper and lower estimates of an OECD study (Ahmad & Wyckoff 2003). We recently updated the GTAP data with Norwegian data and found reasonable agreement with our pre-vious work on Norway using a different database (Peters & Hertwich 2006). At the aggregate, similar studies using the same data have shown similar results (Wiedmann et al 2007). In general, the rankings of sectors and countries in terms of clean to dirty producers roughly agree with expected results from, for example, LCA studies.
The aggregated results – national totals – are the most accurate since any “errors” average out. We have reasonable confidence that the national totals lies within about 10% of their expected values (noting that we use the manipulated GTAP data, and not country specific data, to construct national totals). At the more detailed level – such as individual sectors – there will be greater uncertainty. A comparison with other studies gives us reasonable confidence that most emission intensities are within approximately 25% of their expected values.
Apart from the uncertainty of individual data points, a big factor behind uncertainty in MRIO studies is aggregation error. Aggregation error arises since each sector rep-
resents a weighted average of the products produced in that sector in each country. For instance, the lumber sector includes various products such as railway ties, lum-ber and wood of different types, woodchips, plywood, panels, fibreboard, veneer, doors, windows, kitchenware, cork, seats, furniture, mattresses, sawdust, and so on. The “average” product in a sector will vary in different countries based on their product mix. The error in choosing a product that is not the “average” is known as aggregation error. Aggregation error occurs both when choosing a sector to analyse and from interindustry transactions in the production chain.
Due to aggregation error it is also difficult to compare products between countries. Countries have different product mixes and this, at times, may make comparisons between countries difficult. For instance, in the iron and steel sector Russia may produce primarily pig-iron, while Germany may import pig-iron and process it into high-grade steel. Thus, the emission intensity between Germany and Russia may vary, not just because of technology and energy mix differences, but because they have a different product mix within a sector. However, note that in the detailed MRIO model the emissions from the iron and steel sector in Germany include any pig-iron imported from Russia.
EU consumption, global pollution 44
• Ahmad, N. and Wyckoff, A. (2003) Carbon Dioxide Emissions Embodied in International Trade of Goods (Organisation for Economic Co-operation and Development).
• China Daily (2006) Tariffs to reduce energy consumption, China Daily, 31 October 2006, available at www.chinadaily.com.cn/china/2006-10/31/content_720485.htm.
• DfT (2007) Press release: ‘Sustainability of Biofuels under the Renewable Transport Fuel Obligation’. UK Department for Transport, 21 June 2007, available at www.dft.gov.uk/press/speechesstatements/statements/rtfostatement (retrieved 12 September 2007).
• Dimaranan, B.V. (Ed.) (2006) Global Trade, Assistance, and Production: The GTAP 6 Data Base (Center for Global Trade Analysis, Purdue University).
• EEA (2007) GHG viewer, available at dataservice.eea.europa.eu/dataservice/viewdata/viewpvt.asp?id=418, viewed 24 July 2007.
• Eurostat (2006) External and intra-European Union trade – Statistical yearbook – Data 1958–2005 (Eurostat).
• European Parliament (2007) What Contribution Can EU Trade Policy Make Towards Combating Climate Change? Study authored by A. Kraemer, F. Hinterberger and R. Tarasofsky for the European Parliament International Trade Committee.
• FT (2007a) China puts growth ahead of climate change, www.ft.com, published 4 June (quoting Ma Kai, chairman of China’s National Development and Reform Committee).
• FT (2007b) China cuts tax rebates to curb exports, www.ft.com, published 19 June.
• IIED (2006) Fair Miles? The Concept of ‘Food Miles’ through a Sustainable Development Lens. James MacGregor and Bill Vorley (IIED).
• Indic View (2007) Reva – world’s highest selling electrical car, 12 March, indicview.blogspot.com/2007/03/reva-worlds-highest-selling-electric.html.
• IPCC (2007) Summary for policymakers, in: Climate Change 2007: Mitigation. Contribution of Working Group III to the Fourth Assessment Report of the Intergovernmental Panel on Climate Change. B. Metz, O.R. Davidson, P. R. Bosch, R. Dave and L.A. Meyer (eds) (Cambridge, UK and New York: Cambridge University Press).
• Kaltner, F.J. Azevedo, G.F.P., Campos, I.A. and Mundim, A.O.F. (2005) Liquid Biofuels for Transportation in Brazil: Potential and Implications for Sustainable Agriculture and Energy in the 21st Century (Fundação Brasileira para o Desenvolvimento Sustentável).
• Leontief, W. (1986) Input-Output Economics (New York: Oxford University Press).
• Mandelson, P. (2006) Trade and climate change. Speech delivered 18 December 2006 by EU Trade Commissioner Peter Mandelson. Available at ec.europa.eu/commission_barroso/mandelson/speeches_articles/sppm136_en.htm (retrieved 16 August 2007).
• Mila i Canals, L., Cowell, S.J., Sim, S. and Basson, L. (2007) Comparing domestic versus imported apples: a focus on energy use, Env. Sci. Pollut. Res., 14(5), pp. 338–344.
• MNP (2007) Press release 22 June 2007, Netherlands Environmental Assessment Agency, downloadable at www.mnp.nl/en/dossiers/Climatechange/moreinfo/Chinanowno1inCO2emissionsUSAinsecondposition.html
• Peters, G.P. (2007) From production-based to consumption-based national emission inventories, Ecological Economics (in press).
• Peters, G.P. and Hertwich, E.G. (2006) Pollution embodied in trade: the Norwegian case, Global Environmental Change 16, pp. 379–389.
• Peters, G.P. and Hertwich, E.G. (2008) CO2 Embodied in International Trade with Implications for Global Climate Policy, Environmental Science and Technology, Forthcoming.
• Peters, G., Weber, C.L., Guan, D. and Hubacek, K. (2007) China’s growing CO2 emissions – a race between increasing consumption and efficiency gains, Environmental Science and Technology, 41, 5939-5944.
REFERENCES
EU consumption, global pollution 45
• Reinvang, R. and Peters G. (2008) Norwegian Consumption, Chinese pollution. An example of how OECD imports generate CO2 emissions in developing countries - and what we can do about it, WWF Norway, WWF China and Norwegian University of Science and Technology, 2008.
• Sachs, W. and Santarius, T. (2005) Fair Future – begrenzte Ressourcen und globale Gerechtigkeit (Wuppertal Institut, C.H. Beck).
• Wiedmann, T., Lenzen, M. et al. (2007) Examining the global environmental impact of regional consumption activities – part 2: review of input-output models for the assessment of envi-ronmental impacts embodied in trade, Ecological Economics, 61, pp. 15–26.
• WRI (2006) Climate Analysis Indicators Tool (CAIT) on-line database version 3.0., World Resources Institute, available at http://cait.wri.org.
• WWF (2006) Living Planet Report 2006 (WWF, Zoological Society of London and Global Footprint Network).
• WWF (2007) Climate Solutions – WWF’s Vision for 2050 (WWF International, Gland).
• WWI (2006) Biofuels for Transportation. Global Potential and Implications for Sustainable Agriculture and Energy in the 21st Century (Worldwatch Institute).
• ZEW (2006) The Impacts of the European Emissions Trading Scheme on Competitiveness and Employment in Europe – a Literature Review (Zentrum für Europäische Wirtschaftsforschung, Center for European Economic Research). Commissioned by WWF European Policy Office.
EU consumption, global pollution 46
Published February 2008 by WWF-World Wide Fund For Nature (formerly World Wildlife Fund). Any reproduction in full or in part of this publication must mention the title and credit the above-mentioned publisher as the copyright owner.
© text 2008 WWF. All rights reserved.
Design: Imprimerie Les Editions Européennes - Artistic direction Yesmine Lawton
Typography: Bricspixel (Bricspixel is designed for the WWF BRICS project by Volt, www.volt.se), Century Expanded, Futura
Cover : gettyimages P5 © WWF-Canon / Adam OSWELL
P8 © WWF-Canon / Andrew KERRP16 © WWF-Canon / Michel GUNTHER
P19 © Yesmine LAWTONP23 © WWF-Canon / Adam OSWELL
P24 © WWF-Canon / Chris MARTINP25 © WWF-Canon / Chris MARAIS

EU consumption, global pollution 47
WWF’s mission is to stop the degradation of the planet’s natural environment and to build a future in which humans live in harmony with nature, by:
- conserving the world’s biological diversity- ensuring that the use of renewable natural resources is sustainable- promoting the reduction of pollution and wasteful consumption
©1986 P
anda symbol W
WF – W
orld Wide Fund For N
ature (Formerly W
orld Wildlife Fund) ®
“WW
F” and “living planet” are Registered Tradem
arks
WWF International
Avenue du Mont-Blanc1196 GlandSwitzerlandTel: +41 22 364 9111Fax: +41 22 364 5823www.panda.org/[email protected]
Trade and investment issues are global in scope. But different countries and different regions have widely different priorities and perspectives. For this reason, our response to these issues draws on the expertise of staff based in key locations amongst the almost 100 countries where WWF is active worldwide.
This network allows WWF to bring a truly international perspective to trade and investment debates. It allows us to engage not only with governments and companies in centres of influence in the North, but places us to work in partnership with those governments in the South which are becoming increasingly important in shaping the international agenda.
Work with us to find innovative solutions! WWF’s approach is to build and foster alliances with forward-thinking governments, companies and institutions. If you would like to find out more about the innovative solutions we are working on, or would like to contact members of our team around the world, please be in touch.
7491 Trondheim, NorwayPhone: + 47 73 59 89 40Fax: + 47 73 59 89 43www.ntnu.no/[email protected]
Industrial Ecology ProgrammeNorwegian University of Science and Technology