Embed Size (px)
Citation preview

EU EDF – SOPAC Project Report 46 Reducing Vulnerability of Pacific ACP States
Technical Report –
An assessment of coastal processes, impacts, erosion mitigation options and beach mining Bairiki/Nanikai causeway, Tungaru Central Hospital coastline and Bonriki runway – South Tarawa, Kiribati
Fieldwork undertaken from 15th to 25th April 2005 Report released December 2005
Runway eastern coast
Runway north-eastern seawall
Hospital coast Nanikai causeway
EU EDF-SOPAC Reducing Vulnerability of Pacific ACP States Kiribati – Aggregates & Coastal Processes – 2
Prepared by:
Arthur Webb – Coastal Processes & Aggregates Adviser SOPAC Secretariat
September 2005
SOUTH PACIFIC APPLIED GEOSCIENCE COMMISSION c/o SOPAC Secretariat
Private Mail Bag GPO, Suva
FIJI ISLANDS http://www.sopac.org
Phone: +679 338 1377 Fax: +679 337 0040
www.sopac.org [email protected]
Important Notice
This report has been produced with the financial assistance of the European Community; however, the views expressed herein must never be taken to reflect the official opinion of the European Community
[EU-SOPAC Project Report 46 – Webb]

EU EDF-SOPAC Reducing Vulnerability of Pacific ACP States Kiribati – Aggregates & Coastal Processes – 3
TABLE OF CONTENTS
Page
EXECUTIVE SUMMARY ..............................................................................................................5 ACKNOWLEDGEMENTS .............................................................................................................4 INTRODUCTION...........................................................................................................................6 Personnel...............................................................................................................................7 Work Plan ..............................................................................................................................7 Background to coastal studies in Tarawa ..............................................................................8 RESULTS/DISCUSSION 1. Priority coastal protection areas......................................................................................9 2. Nanikai/Bairiki causeway ..............................................................................................11 2.1 Background ............................................................................................................11 2.2 Ocean side causeway failure ..................................................................................15 2.3 Wave over topping on lagoon side eastern end .....................................................16 3. Tungaru Hospital ocean side coast...............................................................................19 3.1 Background ............................................................................................................20 3.2 Re-assessment of these main points .....................................................................20 3.3 Current situation .....................................................................................................21 3.4 Is ENSO the cause of the erosion? ........................................................................26 3.5 Will the beach recover?..........................................................................................28 3.6 Recommendations .................................................................................................29 4. Bonriki Airport Ocean-side seawalls .............................................................................32 4.1 Background ............................................................................................................33 4.2 What is causing wave damage in these areas? .....................................................33 4.3 Recommendations .................................................................................................36 5. Synthesis.......................................................................................................................39 5.1 Nanikai/Bairiki causeway........................................................................................39 5.2 Tungaru Hospital coastline.....................................................................................40 5.3 Bonriki Airport seawalls ..........................................................................................41 6. Beach mining in South Tarawa .....................................................................................41 REFERENCES............................................................................................................................45 ANNEX........................................................................................................................................46
[EU-SOPAC Project Report 46 – Webb]

EU EDF-SOPAC Reducing Vulnerability of Pacific ACP States Kiribati – Aggregates & Coastal Processes – 4
ACKNOWLEDGEMENTS
The author would like to acknowledge the help and assistance of Ms Titeem (Stem) Auatabu, Ms Naomi Biribo-Atauea and Mr Tefau Afeleti, all of the Ministry of Fisheries and Marine Resource Development (MFMRD), during field visits and for providing historical information and images. Thanks also to Mr Robert Smith (SOPAC Marine Geophysicist) for sharing information and ideas and reviewing this report. The proofreading efforts of Dr Russell Howorth, Mr Stephen Booth, Ms Lala Bukarau and Ms Alexis Cartwright-Taylor are also gratefully acknowledged.
[EU-SOPAC Project Report 46 – Webb]

EU EDF-SOPAC Reducing Vulnerability of Pacific ACP States Kiribati – Aggregates & Coastal Processes – 5
EXECUTIVE SUMMARY An assessment of three priority areas of coastal vulnerability was undertaken as part of the SOPAC/EDF Kiribati Work Plan. The outputs from this work seek to complement and add an extra dimension to the previously produced works, some of which have already considered these coastlines. It also seeks to deliver definitive mitigating recommendations, which where possible, aim through “soft’ solutions, to restore coastal integrity and natural processes. This “soft” approach is ultimately considered more appropriate since “hard” solutions frequently results in damage to neighbouring environments, as well as being hugely expensive in terms of both initial cost and ongoing maintenance and are unable to fulfil the ecological or aesthetic roles of natural shoreline systems. Field survey and remote assessment of the present and historical context of these sites, using greatly improved digital manipulation and rectification techniques have been carried out. Consideration of the engineering and rehabilitation options for each location is also discussed in terms of historical and present trends of use and maintenance of environmental and geomorphological coastal function. The recommended mitigation options are outlined in detail for each location however, the services of a coastal engineer will be required as a next step to develop these recommendations into feasible construction plans and costings. Such a next step could logically be part of the KAP (Kiribati Adaptation Project) currently active in Kiribati, as the key locations considered here are parallel to those identified by both KAP and the EU’s KDPP (Kiribati Disaster Preparedness Project). Bairiki/Nanikai The erosion of the Bairiki / Nanikai causeway where it adjoins the south-western tip of Nanikai requires immediate attention. This causeway developed from a natural sand spit, which extended from Bairiki towards Nanikai and does not have an underlying seawall to protect it from further erosion. Erosive processes at this site appear to be related to the continued adjustment of the south Nanikai coastline following the completion of these causeways in the early 1960’s. It is difficult to predict if the processes at this site will remain erosive but this has been the overall pattern for this area since the 1960’s. In view of the importance of the causeway to communications and transport and as a conduit for power, sewerage and water, combined with the vulnerable nature of the unprotected causeway shore, appropriately designed hard engineering mitigation measures are recommended. Such measures are not predicted to cause any significant disturbance to sediment transport regimes on this coast. The wave over topping issue on the lagoon side entrance to Nanikai Village most likely results from continual disturbance of the natural beach crest and widespread beach mining in this area. Realignment of the road, cessation of mining, nourishing of the beach head to form an elevated berm and protection of the site from further human disturbance is recommended. Tungaru Hospital The beach bordering the Tungaru Hospital compound has recovered a degree of volume since 1995. However, the back beach scarp has continued to move inland and now threatens much of the western end of the access road. Wave over topping is now common during storms and unusually high water events and nuisance flooding has occurred in the southern wings of the Hospital. Analysis of historical air photos shows that the current position of the coast was similar in 1943 and the present movement of this coastline appears in part, to be a natural phenomenon (see also; Shorten et al. 1996). However, poor engineering design and location of the Hospital and its associated facilities, combined with diffuse beach disturbances (intense foot traffic, removal of vegetation, mining and reclamation) has resulted in a greatly damaged beach head system which is neither resilient to erosive events nor can it provide protection of the Hospital
[EU-SOPAC Project Report 46 – Webb]

EU EDF-SOPAC Reducing Vulnerability of Pacific ACP States Kiribati – Aggregates & Coastal Processes – 6
facility. Relocation of the inappropriately placed and designed Hospital facilities and re-establishment and protection of the natural beach berm is primarily recommended. Bonriki Airport The coastline position at the eastern end of the Bonriki airstrip was found to be remarkably stable over the last 60 years, however, wave over topping and erosion is reported as a major concern at this site. Both of the vulnerable locations have been protected with seawalls, which are in various states of repair. Nonetheless, wave over topping and subsequent damage to these structures remain issues and due to the close proximity (<10 m) of the sealed airstrip surface, damage to this facility is likely. During a poorly-conceived runway extension and re-engineering programme undertaken in the 1990’s the remains of the protective, elevated berm along this eastern coast was completely flattened and removed. This has left the coast vulnerable to wave over topping and erosion of the upper soft surface of the runway apron. Since protective mitigation to prevent over topping requires elevation above the height of the apron, these two structures, berm and apron, are mutually exclusive. As such, the extension of the sealed runway surface to the west onto a previously reclaimed apron area is recommended and the rehabilitation of a natural beach berm on the eastern coast will prevent further over topping and erosion. Beach Mining An increasingly obvious and essential component of addressing the issues at the three study sites is the prevention of beach aggregate removal. Whilst underlying engineering problems have mostly caused acute damage to these beaches, all sites suffered from beach mining as a compounding problem. Since intense beach mining is evident throughout South Tarawa, it is safe to assume that many of the soft coasts of this island have become chronically degraded through human interference. It is provident to see the study sites as clear examples of the dangers of continuing to disturb these fragile environments and if beach mining is not addressed, widespread, severe and irreversible consequences will develop.
INTRODUCTION
This work was initiated by the SOPAC/EU EDF Reducing Vulnerability of Pacific ACP States Project. The country visit was made at the request of Mr David Yeeting – Permanent Secretary of the MFMRD (Ministry of Fisheries and Marine Resource Development) to address aspects of the tasks outlined in the SOPAC/EU EDF Kiribati Work Plan pertinent to Aggregates and Coastal Process (Task No: KI 3.5.1, 3.5.3, 3.5.4, 3.2.1). These tasks pertain to the following areas:
• Assessment of coastal change (erosion / accretion) and monitoring. • Identify areas vulnerable to storm surge and wave over topping. • Assist in the development of coastal protection guidelines.
The trip was also undertaken at the request of the Kiribati EU Programme Adviser (Ms Helen Jeans), for assistance with the EU’s KDPP (Kiribati Disaster Preparedness Project – see Annex) and also timed to coincide with the presence of the World Bank, KAP (Kiribati Adaptation Project) team to allow the discussion of synergy between these Programmes (liaison between SOPAC/EDF and KAP is also a previously identified task – KI 3.1.6). The KDPP has significant funds to instigate disaster preparedness works and it is proposed to utilise these towards coastal protection at key locations on South Tarawa. The Kiribati EU Programme Adviser has requested the SOPAC/EDF Programme to assist in the assessment of these locations in terms of their vulnerability and to compile a technical assessment of remedial measures to protect and/or rehabilitate these coastlines. Preliminary discussion regarding these locations and site visits were
[EU-SOPAC Project Report 46 – Webb]
EU EDF-SOPAC Reducing Vulnerability of Pacific ACP States Kiribati – Aggregates & Coastal Processes – 7
undertaken jointly with the EU Programme Adviser, KAP team and representatives of the GoK (Government of Kiribati – Ms Naomi Biribo-Atauea, Minerals Officer, MFMRD and Ms Titeem Auatabu, MFMRD/SOPAC/EU EDF Intern). The visit also coincided with a visit from the EU Court of Auditors who were in Kiribati to assess how successfully “environmental aspects and issues” had been incorporated into EU-funded programmes. The author met with the team during their scheduled meeting with the SOPAC/EU EDF Country Intern – Ms Titeem Auatabu and the MFMRD – Ms Naomi Biribo-Atauea. Personnel List of primary people involved during consultation process:
List of People – Tarawa Position SOPAC Dr Arthur Webb SOPAC Coastal Processes & Aggregates Adviser Ms Naomi Biribo-Atauea Minerals Officer, MFMRD/SOPAC Fellowship MSc. Ms Titeem Auatabu SOPAC/EU EDF Kiribati Intern EU KDPP Ms Helen Jeans Kiribati / Nauru EU Programme Adviser GoK Mr David Yeeting Permanent Secretary, MFMRD (SOPAC National Representative) Mr Tefau Afeleti Trainee, Minerals Division MFMRD Mr Tiaon Kabaua Civil Engineer, Public Works Division Ms Tererei Abete-Reema Director of the Environment Division KAP Project Mr Kaiarake Taburuea KAP In-Country Coordinator Mr Chris Cheatham KAP Economist Dr Paul Kench KAP Coast Processes Adviser Mr Tony Hughes KAP Team Leader Mr Maarten Van Aalst KAP / Institute of Marine & Atmospheric Research, Utrecht EU Court of Auditors Mr Emmanuel Hellinakis Mr Mark Marshall
Work Plan Ms Naomi Biribo-Atauea, MFMRD travelled to Tarawa with the author to represent the interests of both SOPAC and the GoK and was present during all site visits and meetings. Similarly, Ms Titeem Auatabu was present at most of the meetings and both Titeem and Mr Tefau Afeleti assisted during field trips. DATE (April) ACTIVITY Friday 15th Arrive, met by Titeem – Government office closed due to public holiday.
Saturday 16th Informal meeting with KAP Team and Helen Jeans. Sunday17th Site visits South Tarawa.
[EU-SOPAC Project Report 46 – Webb]

EU EDF-SOPAC Reducing Vulnerability of Pacific ACP States Kiribati – Aggregates & Coastal Processes – 8
Monday18th am. Brief Mr David Yeeting, Permanent Secretary, MFMRD, on the purpose of the visit, similarly briefed Titeem and Tefau regarding work schedule during the visit.
pm. Meeting with Helen Jeans and KAP Team. Tuesday 19th am. Reviewed Tefau’s image rectification work and uploaded his completed Southth. Tarawa 1969 work. pm. Meeting and site visit with Tiaon Kabaua – Public Works. Wednesday 20th am. Meeting with EU Court of Auditors. pm. KAP team joined Helen and SOPAC team for site visits of coastal areas and infrastructure considered
to be priority locations for protection and rehabilitation. Thursday 21th am. Worked with Tefau and Titeem on aerial photo interpretation and feature identification also undertook
rectification of ’43 air photos and comparisons to ’98 air photos. pm. Meeting with Ms Tererei Abete-Reema – Director of the Environment Division. Friday 22th Field trip to North Tarawa to undertake ground truthing and survey ocean and reef platforms. Saturday 23rd am. Desktop review of satellite and historical air photos of priority locations in South Tarawa identified on
Wednesday. pm. Informal meeting with Helen to discuss preliminary findings of the mission. Sunday 24nd Re-visit priority locations in South Tarawa. Monday 25th am. Planned to debrief Mr David Yeeting (unfortunately unavailable). pm. Return to Nandi, the on to Suva. Background to Coastal Studies in Tarawa Several studies exist regarding erosion in South Tarawa (e.g. Forbes and Hosoi, 1995; Carter, 1983, Holmes, 1979, Shorten et al. 1996 and various works by Howorth in the early 1980’s). These have undertaken extensive geomorphological study and survey of selected areas of the South Tarawa coastline with regard primarily to sediment transport, coastline change (accretion / erosion) and anthropogenic influences over these phenomena. The overall crucial messages to be derived from these works are:
• The soft coast environments of South Tarawa are dynamic and sensitive environments, which are subject to natural change over a great temporal range.
• Disturbance and additional changes have occurred due to engineering on a domestic
(hand-built seawall) and national (causeways, wharves, channels) level. • Estimating the sustainable yield of beach aggregate mining is fraught with complications
when a true account of temporal and spatial variation is considered (hours to decades and metres to kilometres, respectively).
• Population pressure and lack of thorough assessment and policy, has lead to the
settlement and building of infrastructure on inappropriate vulnerable coastal zones. Despite this volume of work and the excellent information to be derived, erosion often appears to be considered in a “piece meal” manner where action takes the form of defence of a particular section of coastline. In the past, this approach has had validity since the problems of one beach were quite often isolated from the next however, in view of several key issues, a more holistic approach must be considered. There are inherent difficulties in this approach in that early definitive indicators to support the argument for a holistic approach to coastal management do not exist, i.e. an acute disturbance or erosion event can be measured and the influencing factors (sometimes) identified, whereas chronic degradation of coastlines is difficult to detect amongst the background of natural variation in these soft beach environments (analogous to measuring sea-level change). Further compounding problems in densely populated South Tarawa are issues
[EU-SOPAC Project Report 46 – Webb]
EU EDF-SOPAC Reducing Vulnerability of Pacific ACP States Kiribati – Aggregates & Coastal Processes – 9
such as water quality change, intense marine organism harvest and the real possibility of anthropogenically influenced climate/sea-level change and the influence that these have over coastal processes and sediment budgets. Nonetheless, to wait for clear irrefutable evidence that practices such as beach mining are causing widespread degradation of Tarawa’s coastlines would be irresponsible in the extreme. The present and increasing pressure on South Tarawa’s coastal environment when considered over a backdrop of uncertainty regarding future sea level and climatic factors, dictates the only responsible coastal management option for South Tarawa is a conservative, precautionary approach. The principal aim of such an approach is to preserve and enhance the natural sea defences of the island and this requires the complete protection of all soft beach environments from aggregate removal and inappropriate engineering. To this end the provision of an appropriate, sustainable, alternative aggregate supply, is an urgent priority. Exploitation of Tarawa’s offshore aggregate resource has been the subject of considerable research and resource exploration, quantification, and qualitative study. In addition, an aggregate extraction economic feasibility and EIA study has been completed (Cruickshank & Morgan, 1998). SOPAC/EDF is excellently placed to support the production of a proposal document to expedite the purchase of equipment and development for this offshore resource and thereby, take a major step towards reducing vulnerability of South Tarawa’s coastal fringe. As mentioned, in many ways this report reiterates what may be gleaned from pre-existing studies of South Tarawa’s coastlines. Yet in view of the lack of action arising from these previous works and the increasingly urgent nature of these problems, it is timely to reassess these key locations and refresh stakeholders awareness. In terms of vulnerability, the South Tarawa community is approaching a precipice, the environment upon which their daily needs, lively hoods and protection depends is breaking down and the added pressure of predicted climate and sealevel change leave the people of this island in an extremely vulnerable position. This report highlights an important aspect of this vulnerability – coastal protection. In many ways the locations considered in more detail in this report, are a alarming preview into South Tarawa’s near future, where sand mining and poorly conceived coastal engineering will combine to critically degrade natural coastal defences and leave the swelling population with inadequate protection. The poorly understood tragedy of this, is that nearly 100% of South Tarawa’s present erosion problems could have been avoided. As is shown in this report, “unexplainable” erosion is not the problem at any of the key locations, but rather, human use or destruction and alteration of natural defence systems is the problem (i.e. beach mining, poorly located or conceived coastal development, reclamation, causeway construction, etc.). The full potential impacts of climate and sealevel change are not yet upon us, however in view of this uncertain future, the protection of South Tarawa’s beaches and shoreline environment from beach mining and poor / ad hoc engineering needs to be an immediate and major priority.
RESULTS/DISCUSSION 1. Priority coastal protection areas As outlined in the SOPAC EDF8 Kiribati Work Plan, liaison with the World Bank’s KAP is an identified EDF8 task (KI 3.1.6). The KAP is in the final stages of developing its Project Document and is scheduled to begin work in early 2006. Coastal protection and “climate proofing” is among KAP’s planned work priorities and the SOPAC team met with the KAP team and the EU’s KDPP (Helen Jeans) to explore synergism in our planned Coastal Processes and Aggregates tasks. The KDPP has significant funds available which are earmarked for use to undertake remedial coastal protection works in urban South Tarawa (see Annex and Figure 1). However, it cannot use these funds to engage expertise to assess, which areas are priorities or what measures are
[EU-SOPAC Project Report 46 – Webb]

EU EDF-SOPAC Reducing Vulnerability of Pacific ACP States Kiribati – Aggregates & Coastal Processes – 10
appropriate in each situation. As such, Helen Jeans has approached KAP and SOPAC / EDF8/9 to ask if we could supply the necessary technical support to produce recommendations which will ultimately support a project document designed to address the proposed protection works. Preliminary coastline assessment by the KAP has identified several coastal protection priority areas on South Tarawa (Figure 1) and these have been adopted by the KDPP as potential intervention sites requiring further assessment and remedial action. The SOPAC / EDF8 tasks regarding the identification and assessment of vulnerable coastline areas in South Tarawa, fit directly with the preparatory needs of the KDPP. Identified priority areas included:
• Western end of the Nanikai/Bairiki causeway – ocean side (structural failure) and lagoon side erosion and wave over topping.
• Tungaru Hospital – Nawerewere, ocean side beach (erosion, wave over topping / seawater flooding).
• Bonriki International Airport north-eastern and eastern seawalls (structural failure – wave over topping).
North Tarawa
N
Bonriki Airstrip seawall South Tarawa
Tungaru Hospital
Nanikai / Bairiki causeway Bikenibeu Temaiku
AmboBetio
Teorereke
Bairiki 5 km
Figure 1. South Tarawa, KDPP priority areas (yellow circles) location map (2004 IKONOS Imagery – SOPAC Archive).
[EU-SOPAC Project Report 46 – Webb]

EU EDF-SOPAC Reducing Vulnerability of Pacific ACP States Kiribati – Aggregates & Coastal Processes – 11
2. Nanikai/Bairiki causeway 2.1 Background Since the completion of the Bairiki/Teorereke causeways in 1963 (Holmes, 1979), wave over topping during high spring tide events and damage during storms have been regular occurrences (pers. comm. Kabaua, 2005) and like all coastal engineering works, design, construction, monitoring and maintenance are key components to minimising the damage and disruption resulting from such events. Considering the original traditional dry-wall construction techniques and materials used (large stones stacked and interlocked methodically by hand without the use of mortar), this causeway has been a hugely successful undertaking. Linking the administrative centre (Bairiki) to the greater part of South Tarawa has allowed the development of satellite centres such as Nanikai, Teorereke and Bikenibeu and has provided ready access to (and therefore development of) facilities and resources such as: Bonriki International Airport, Bikenibeu Hospital, schools, Bonriki Water Reserve, aggregate resources, fishing grounds, etc. During the late 1970’s and early 1980’s projects were undertaken to provide reticulated water, sewerage, communications and mains electricity to much of South Tarawa and again these causeways provided the conduit for all of these services. In view of the increasing population on South Tarawa (approaching 40 000), maintaining these causeways, and the amenities and traffic they carry, is of undisputed importance to the development and security of urban South Tarawa. Parts of the original Nanikai/Teorereke (Andersen causeway) wall can still be seen and provides the footing upon which the present causeway stands (Figure 2). This footing appears some 2-3 m seaward (south) of the present concrete causeway wall and subsequent layers slope at approximately 450 to the upper seaward edge of the causeway. The lagoon side of this wall has been subject to accretion since completion and is now buried behind some 30 m metres sand. The Bairiki/Nanikai causeway was an earlier undertaking and was more simply constructed by taking advantage of a natural sand spit between the Bairiki and Nanikai Islets (pers. comm. Teaotai, 2005; Holmes, 1979). Over time, this was stabilised and capped with a hard surface for foot and vehicular traffic. Again, the original boundaries of this causeway have become indistinct due to accretion particularly at the Bairiki end. Since systematic hard engineering was never undertaken for the Bairiki/Nanikai section of the causeway it is particularly vulnerable when net sediment transport processes remove sand from the beach (erosion).
Upper 2 bags were added in
2004
Lower bags added in late 90’s
Systematically stacked rock thought to be the original
rock causeway wall
Subsequent repairs and rebuilding
Figure 2.. Nanikai/Teorereke exposed causeway wall (ocean side looking west towards Nanikai).
[EU-SOPAC Project Report 46 – Webb]

EU EDF-SOPAC Reducing Vulnerability of Pacific ACP States Kiribati – Aggregates & Coastal Processes – 12
The defences currently in place represent reactionary, ad hoc patching rather than a well-designed and built seawall (see Figure 3b) and as such, are more prone to failure. The Bairiki/Nanikai ocean side coastline has been undergoing continual change since the construction of the causeways and does not yet appear to have stabilised (see Figures 5a and b). An example of this continual movement is the exposed beach rock (fossil beach), which forms the foundation of the recently built KBA (Kiribati Broadcasting Authority) seawall. In 1969, this beach rock was buried and lay many meters inland from the ocean-side shoreline (Figure 4a).
< 1.0 m
Bairiki / Nanikai Causeway
C
A
N
Ocean side reef platform
Bairiki Islet
Nanikai Islet
Lagoon
300 m
B
Figure 3a, b and c. (A) Satellite image detail of Nanikai/Bairiki causeway. The thinnest portion of the causeway (yellow arrow) has failed on the ocean side. The beach on the lagoon side (red arrow) is vulnerable to wave over topping (2004 IKONOS Imagery – SOPAC Archive). Photo (B) shows the failed seawall on the ocean side and the proximity of the erosion scarp to the main east – west South Tarawa road. Photo (C) shows the recently constructed lagoon side seawall at the head of the beach. Beach nourishment has also been undertaken in the foreground on the mean high water mark. The erosion and failure of the ocean side of the Bairiki/Nanikai section and the exposed ocean side face of the Nanikai/Teorereke causeway is in sharp contrast to the lagoon side of the causeways. The lagoon side of the Nanikai/Teorereke section has been subject to net accretion since 1969 and the shoreline now lies some 35 – 40 m north of the original causeway wall (Figure 4b – this land is now used as the new TUC [Tarawa Urban Council] waste facility). Net accretion
[EU-SOPAC Project Report 46 – Webb]

EU EDF-SOPAC Reducing Vulnerability of Pacific ACP States Kiribati – Aggregates & Coastal Processes – 13
is also evident on much of the western end of the Bairiki/Nanikai causeway both on the ocean and lagoon sides (approximately 10 m on both sides since 1969). Indeed anecdotal evidence gathered during consultations with Tarawa elders suggests that Bairiki’s coastline has been subject to large lagoon-ward and ocean-ward accretion and expansion since the construction of the causeways. This is also supported by historical aerial photographs, which have been rectified and layered over present satellite images (Figure 5a and b). One elderly gentleman indicated that the old cemetery near the former British High Commissioner’s residence was once positioned on the eastern extremity (vegetation line) of Bairiki Islet. This would indicate an easterly extension of over 300 m if the thinnest part of the Bairiki/Nanikai causeway is taken as the new end point of the islet.
Figure 4a and b. (A) Now exposed oceanside fossil beach, which in 1969 lay buried many meters from the shoreline. Note the proximity of the causeway to the road and the comparative lack of accretion on the lagoon side at this point in the causeway (Photo taken from the KBA transmitting facility seawall looking west towards Bairiki). (B) Accretion on the ocean side of the Nanikai/Teorereke causeway, the road edge now lies some 30 m from the lagoon shore. Sediment transport patterns inferred from the historical aerial photos and current satellite images and field observation, indicates a net westward longshore drift on the South Tarawa ocean side coast, this corresponds to mean equatorial easterly trade wind patterns and the findings of previous studies (e.g. Forbes and Hosoi, 1995). In contrast, sediment accumulation patterns noted by the author since 1996 on the east Bairiki lagoon longshore indicate predominantly eastward transport patterns. This possibly relates to tidally driven flows rather than wind-dominated transport. It should be noted however that both coastlines are now subject to such intense levels of disturbance (seawalls, groynes, navigation channels, reclamation and beach mining) that net transport patterns are frequently disrupted and difficult to conclusively discern. Without doubt the building of the Bairiki/Nanikai/Teorereke causeway has caused major changes to sediment transport patterns along this coast and overall it has resulted in a pattern of net sand accretion on the lagoon side and significant lagoon-ward movement of the eastern Bairiki, Nanikai and causeway coastline since 1969 (Figure 5a and b). Large changes have also occurred on the ocean side coastline of Nanikai however, this is greatly influenced by human reclamation activity.
[EU-SOPAC Project Report 46 – Webb]

EU EDF-SOPAC Reducing Vulnerability of Pacific ACP States Kiribati – Aggregates & Coastal Processes – 14
200 m Teaorereke Lagoon side
N
Nanikai Bairiki
Ocean side A. 1969 Air photo
KBA transmitting station
Area subject to wave over toppingN
3
2
24
1Failing causeway
wall
Natural raised limestone groynes B. 2004 IKONOS Image
Figures 5a and b. These comparative images graphically demonstrate the degree of change, which has occurred along the Bairiki/Nanikai/Teorereke causeways and coast since the completion of the causeway in the late 1960’s. Both images are of identical scale and orientation with the red line corresponding to the high water mark in 2004 and the blue line in 1969, the grey parallel lines indicate the main road. Overall the causeway has resulted in a net gain in the land area of Nanikai Islet. (approximately 12% since 1969). Of particular interest however is the extended south-western sand spit (1) which has receded approximately 120 m since 1969. Much of the central southern coast of Nanikai which has prograded (2) is the result of active reclamation and seawall building however, the 40 m of accreted sand at the south-eastern end (3) is the result of predominant east to west sediment transport and accumulation. Since there is evidence of westward sediment transport the question remains as to why this does not move along the islet and nourish the area of concern. It is possible that the raised natural groynes divert sediment away from the coast in this area and the offshore sand bank (4) is possibly evidence of this process. It is also possible that the rate of erosion of the spit (1) is slowing which in turn is reducing the supply of sand to the causeway.
[EU-SOPAC Project Report 46 – Webb]

EU EDF-SOPAC Reducing Vulnerability of Pacific ACP States Kiribati – Aggregates & Coastal Processes – 15
It is difficult to predict the eventual position, shape and composition of the Bairiki/Nanikai ocean side coast however, in view of the population on this Islet, the coast will most likely be dictated by humans and their reclamation activities rather than natural processes. It is evident that the southwestern Nanikai coastline has not yet stabilised since the construction of the causeway and considering past trends is likely to remain erosive. It is also interesting to note that Nanikai, whilst having changed significantly since the causeways were constructed, is now some 12 % larger in land area than in 1969, just after the causeways were completed (calculated area was 0.0721 km2 in 2004 and 0.0636 km2 in 1969). 2.2 Ocean side causeway failure The threat to the ocean-side eastern end of the Bairiki/Nanikai causeway (Figure 3a and b) appears to result from two main factors:
1. The continued disturbance of sediment transport patterns resulting from the original building of the causeway and continued disturbance from present-day human activities (reclamation, seawall construction, beach mining, etc.).
2. The lack of a systematically built, primary line of defence for the causeway (i.e. the Bairiki /
Nanikai causeway has no underlying protective seawall). As can be seen in Figure 5a and b, sediments accumulate on the western end of the ocean side Nanikai/Teorerekae causeway and would be expected to continue west around Nanikai Islet and on to the Bairiki/Nanikai causeway, nourishing the area of concern. The apparent break in transport to this site is most likely a combination of localised human disturbances (Nanikai – reclamation, seawalls and beach mining – all evident on the southern Nanikai coastline). A further influencing factor are the natural north-south running groynes which extend from the ocean side beach over the reef platform (Figure 5b). These may act to direct sediment off the beach and disturb longshore transport. The south-eastern spit of Nanikai has receded by some 120 m since 1969 (The Kiribati Govt. has responded to the pattern of erosion by piling unserviceable heavy machinery along the existing coast for protection). The erosive processes in this area appear to be continuing and as discussed are most probably due to the residual effects of the original building of the causeway. Much of Nanikai’s present ocean-side coast is protected by hard engineering and this appears to be a response to both the need for more land and due to the ongoing tendency of this (post causeway) coastline to erode. A further possible explanation is that the eroding spit (see Figure 5a and b) has, through protection and natural processes, begun to stabilise and no longer represents a source of sediment to the “downstream” causeway shoreline starving this beach and causing erosion. The KBA (Kiribati Broadcasting Authority) seawall utilises an existing beach rock platform (fossil beach – see Figure 4a) as a footing for their wall and it is recommended that a new protective structure may do the same, extending from the KBA and following the natural curve of the beach rock towards Bairiki. Using the beach rock will form a natural protective toe for any new structure and care should be taken not to damage this beach rock during construction (see Figure 6a and b). If a seawall is built it is possible that as this coastline continues to adjust that eventually these new protective measures may need to be extended further towards Nanikai or possibly Bairiki and should be designed with this contingency in mind. Recommendations The southern Nanikai coastline is still adjusting to the changes associated with the original causeway construction and the final position of the coast of the Islet and causeways is likely to be dictated by human engineering efforts. Certainly, areas such as the failing causeway will continue to be vulnerable to erosion for the foreseeable future and this results in an unacceptable risk to the main communications link on South Tarawa. Based on the following considerations the failing
[EU-SOPAC Project Report 46 – Webb]

EU EDF-SOPAC Reducing Vulnerability of Pacific ACP States Kiribati – Aggregates & Coastal Processes – 16
Bairiki/Nanikai causeway wall should be replaced with an appropriately designed hard seawall structure as soon as practically possible:
• The causeway is of undisputed importance to communications, services and development in South Tarawa and its maintenance and protection must be a priority undertaking.
• The corresponding lagoon shore has also not prograded significantly in this area and road
realignment closer to the lagoon is not an option. Additionally, reclamation of the lagoon shore to facilitate road realignment is not recommended, as this will disturb the more stable lagoon shore sediment processes.
• The net pattern of ocean-side sediment movement in this area since 1969 has been
erosive and there is no evidence to suggest this will change in the near future.
• Much of Nanikai’s southern ocean-side coast is artificially protected and additional reclamation projects are ongoing. This places ever-greater pressure on beach resources and disturbs sediment transport regimes and it is likely that erosion in this area will become more intense.
• Considering the already unstable nature of this coastline an appropriately placed and
designed seawall is unlikely to significantly impact neighbouring coastal environments or processes.
As a result, the following recommendations are made;
• It is a matter of considerable urgency that the removal of shoreline resources by mining (sand/ gravel/beach rock) ceases immediately.
• Any future coastal engineering (shoreline, inter-tidal and sub-tidal) from a domestic scale
(traditional seawall) to national scale (boat channels, dredging, etc.) needs to be comprehensively assessed by a qualified coastal processes body before approval.
• Any engineered structure or change to the coastline must be designed to appropriate
specifications and be routinely monitored and maintained.
• The newer cement-filled sand bag wall built by the KBA (Kiribati Broadcasting Authority – see Figure 4a) be replaced, as this is not well-designed or built to adequate specifications.
2.3 Wave over topping on lagoon side eastern end On the lagoon side of the western approach to Nanikai Village (approximately 50 m east of the KBA transmitting facility – Figure 3a and c) the crest of the beach head runs parallel to, and only 2 – 5 m from, the road edge. During high water events and westerly storms, wave over topping has occurred causing localised seawater flooding and disrupting traffic flow. The 1969 air photos (Figure 5a) indicate that the road has always been in very close proximity to the beach crest in this area and has probably always been subject to over topping during westerly storms and unusually high astronomical tides. As previously discussed and shown in Figure 5a and b, a significant amount of accretion has occurred along the Bairiki/Nanikai causeway lagoon coast since the causeway’s completion. This coast also appears to have reached a more stable condition in comparison to the ocean side coast. By far the largest threat to this coast is beach mining, the potential building of seawalls (for lagoon reclamation) and boat access channels. More recently in 1994, the Australian High Commission had an access channel dug from the Commissioner’s residence across the reef flat to deep water. Initially, this disturbed longshore transport regimes causing localised erosion but the nearshore end of the channel has become infilled and longshore sediment transport has
[EU-SOPAC Project Report 46 – Webb]

EU EDF-SOPAC Reducing Vulnerability of Pacific ACP States Kiribati – Aggregates & Coastal Processes – 17
recommenced. In the early 2000’s a waste collection facility was built on the Nanikai/Teaorereke causeway. This structure extended well beyond the lagoon shoreline and again disrupted sediment movement processes on this coastline. These factors and beach sand and gravel mining (which was evident everywhere along the lagoon beach), constitute threats to the integrity of this coastline. Continued over exploitation of the sand and gravel resource will lead to a net deficit in the sand/gravel budget of this beach and erosion will occur as a result. It is likely that this mining is a major factor contributing to beach recession and wave over topping in this localised area. It cannot be stressed too strongly that beach mining must cease in these fragile costal systems and similarly any coastal development must be rigorously assessed by a suitably qualified body before approval. It is also strongly recommended that no new boat access channels are dug nor should any form of groyne be built on this beach. Since the overall pattern has been one of net accretion for the lagoon shore since the causeways were completed, it seems that stronger management of the shoreline in terms of development and especially beach mining may alleviate the current beach recession and wave over topping problem. Beach nourishment may also assist in allowing the natural rehabilitation of the beach and beachhead system. Overall, there does not seem to be a need for a hard engineering option and any such option built below the high water mark will likely only serve to aggravate erosion issues on this coast. There is room to realign the road towards the ocean side (south), which would provide a greater buffer area between the road and lagoon shore. The provision of this buffer area will in turn allow a more natural elevated beachhead system to be formed during nourishment (and re-vegetated), which will provide natural protection from over topping. The recently-built wall placed at the top of the beachhead is not recommended and may exacerbate localised erosion during unusually high water or storm events (see Figures 6a and c). Recommendations
• All beach mining must cease and no new boat access channels, groynes or seawalls should be constructed.
• Re-align the road to the south to provide an adequate coastal buffer (5 m minimum).
• Nourish the beach using aggregate sourced offshore (see Section 6) in this area and
rehabilitate the beachhead in terms of width, elevation and vegetative cover.
• Prevent public access in this area whilst vegetation establishes.
• Continue to monitor this coastline.
[EU-SOPAC Project Report 46 – Webb]
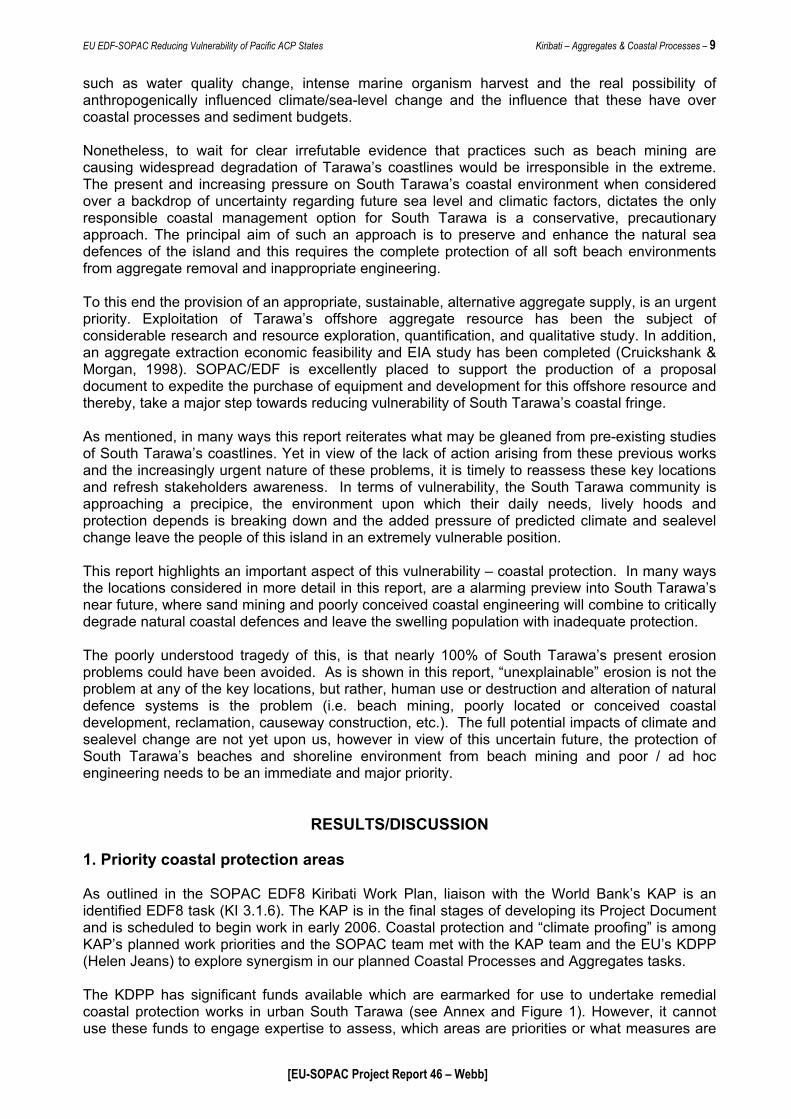
EU EDF-SOPAC Reducing Vulnerability of Pacific ACP States Kiribati – Aggregates & Coastal Processes – 18
Proposed seawall approximately 120 m
providing protection to the causeway and an additional 5 m shoulder for the roadway.
Proposed 220 m road re-alignment allowing a 5 – 10 m buffer for
nourishment and re-establishment of the lagoon-side beachhead profile
and vegetation
Transect C Transect B
A
beach toe
high water mark
road KBA
Nanikai Village
B present eroding
shoreline
reef platform
4 – 5 m shoulder protective revetment
HWM
road lagoon-side beach
C
new road position 5 – 10 m from beach crest
HWM lagoon-side
beach
present road
re-established beach head profile provides a buffer and protection –
also to be replanted with appropriate species
road re-aligned 5 to 10 m inland
new road
Figure 6a, b and c. Conceptual Diagrams of the remedial measures recommended for the Bairiki/Nanikai causeway. (A) Plan view of causeway showing location of both sites and detail of road realignment (see also C), and (B) detail of revetment placement. (It is stressed that these Diagrams have been produced to better explain the identified mitigation options. The full feasibility, cost and design criteria should be the subject of appraisal by a qualified coastal engineer).
[EU-SOPAC Project Report 46 – Webb]

EU EDF-SOPAC Reducing Vulnerability of Pacific ACP States Kiribati – Aggregates & Coastal Processes – 19
3. Tungaru Hospital ocean side coast
milkfish ponds
Lagoon Temaiku
Bikenibeu
Figures 7a, b and c. (A) Satellite image (2004 IKONOS) detail of Tungaru Hospital, Nawerewere ocean side coastline where beach head damage and erosion have resulted in wave over topping and localised flooding of the facility during storms and high water events. Photos (B and C) show details of the erosion scarp on the beachhead (both looking west – note proximity of access road and hospital wing to the right). (C) Photo shows outfall pipe structure – note sand accumulation on the right (eastern) side indicates westward longshore transport. Note also that the beachhead has been nourished with over 1 meter of fill (top right corner – darker grey material) and also note the elevation of the concrete outfall pipe facility which extends across the beach face.
C B
N 300 m
ocean-side reef platform
Nawerewere Hospital
(green roof)
A
[EU-SOPAC Project Report 46 – Webb]

EU EDF-SOPAC Reducing Vulnerability of Pacific ACP States Kiribati – Aggregates & Coastal Processes – 20
3.1 Background This location and issue was comprehensively analysed by Forbes and Hosoi (1995). The main conclusions of their study were:
a) The 1969 – 1992 coastal erosion rates were calculated at approximately 0.2 – 0.4 m/yr. b) The 1992 – 1995 backshore scarp erosion rates were calculated at approximately 1.2 m/yr
and was about 9 m from the southern end of the maternity ward in 1995.
c) Beach nourishment appeared to be effective in retarding erosion in the eastern and central section of the shoreline.
d) Continued erosion was considered likely to result in localised over topping and flooding of
the hospital compound.
e) It was not known if the high rates of erosion were due to: o the 1991 – 1995 persistent (but weak) El Nino conditions; o resulted from a large storm event in December 1992; or o an overall trend towards more rapid erosion on this coast resulting from:
long-term climatic conditions (see Shorten et al. 1996); disrupted transport patterns from the seawater intake and outfall structures
built across the beach face; damage to, and destabilisation of, the original beach profile and
beachhead; “upstream” disturbances to longshore transport (local groynes, seawalls,
etc.); “chronic” disturbance of the beach due to intense levels of foot traffic,
destruction of vegetation and general destabilisation; and ongoing beach mining of sand and gravel disrupting sediment budget and
transport.
f) Some evidence suggesting a cyclic ENSO-driven change in sand volume from 1992 to 1995 was found (accretion at the western end of the beach).
g) Erosion and the vulnerability of the Hospital facility demand close monitoring and “urgent”
attention. 3.2 Re-assessment of these main points Points a & b Comparison of the 1995 aerial photographs used by Forbes and Hosoi (1995) to 1998 aerial photographs and 2004 IKONOS imagery combined with a site visit in 2005 indicate that a degree of beach rebuilding (increase in volume) has occurred since 1995. As such, the overall annual erosion rates derived by Forbes and Hosoi (1995), 0.2 – 0.4 m/yr have not continued, nor has the backshore scarp rate of 1.2 m/yr (this would have placed the scarp several meters into the maternity ward by 2005). The back scarp has continued to move inland (albeit at a slower rate) and, at the western end of the Hospital compound, has reached the southern edge of the access road (see Figure 9).
[EU-SOPAC Project Report 46 – Webb]

EU EDF-SOPAC Reducing Vulnerability of Pacific ACP States Kiribati – Aggregates & Coastal Processes – 21
Point c Similar to the observations of Forbes and Hosoi (1995) the nourished central and eastern end of the beach appeared more resistant to erosion. The beachhead remains significantly higher than that in the western end and this area has not yet been subject to wave over topping. Point d Wave over topping and seawater flooding at the western end of the Hospital compound has occurred several times due to the continued recession of the beach in this area and the loss of the beach head. Points e, f & g Analysis and correlation of the Tarawa wind climate and SOI conditions indicates that strong El Nino wind shifts have occurred since 1995 (see Figure 11) but do not seem to have resulted in the accelerated erosion rates considered by Forbes and Hosoi (1995). It appears in fact that slow recovery of the beach volume has been ongoing since 1995. As such, the weak El Nino conditions of the early 1990’s was likely to be a contributing factor, but is unlikely to have been the main issue which lead to the erosion described by Forbes and Hosoi (1995). As a cause of the erosion this leaves; 1) the storm event of 1992 (of which little is known except for the comments by Forbes and Hosoi – 1995); 2) the original disturbance of the beach during Hospital construction; and 3) the ongoing diffuse human disturbances of the beach head, vegetation, sediment budget and longshore transport patterns. No additional data regarding erosion rates at this site have been gathered since 1995 however, aerial photography undertaken in 1998 provides valuable information for further assessment. It should also be noted that the 1998 photos were taken immediately following a particularly strong El Nino event during 1997. 3.3 Current situation Forbes and Hosoi’s 1995 photos show that the back beach scarp is approximately 1.5 m high and beach rock is exposed over much of the length of the beach toe. Additionally, both the seawater intake and outfall pipes are exposed over the entire profile of the beach (Figure 8).
Seawater intake
Outfall pipe Exposed beach rock
West East
Figure 8. Tungaru Hospital shoreline 1995 (Forbes and Hosoi, 1995).
[EU-SOPAC Project Report 46 – Webb]

EU EDF-SOPAC Reducing Vulnerability of Pacific ACP States Kiribati – Aggregates & Coastal Processes – 22
In comparison, the 1998 air photos indicate a significant recovery of beach volume and a less pronounced back beach scarp. The seawater intake and outfall pipes are both buried with sand in the mid and upper beach positions. Similarly, the upper edge of the large concrete platform of the outfall pipe is well above the level of the beach in 1995 with the scarp cutting in behind the upper edge. In the 1998 air photo (Figure 9), sand appears to have accreted to a similar level as the top of this platform on the upper edge of the beach Our 2005 site visit confirmed this pattern of beach volume recovery and accretion, as no beach rock (other than the lower seaward end of the headland in front of the maternity ward) was exposed and sand has now covered the lower part of both the intake and outfall on their eastern edges. The larger outfall platform remains exposed, however, sand has accreted to within 0.4 m of the upper edge of the platform on the eastern upper slope of the beach. The 1998, ’69 and ‘43 rectified air photos (Figure 10) show that the horizontal width of the beach was on average 20% wider in ’69 and ‘43 than in ‘98 (27.5 ± 4.2 m, 27.4 ± 2.5 m and 22.5 ± 4.1 m, respectively). Measuring 27.5 m meters inland from the toe of the 1998 beach places the back beach scarp on the access road surface and only 2 to 3 meters from the rear wall of the maternity ward, this is in line with Forbes and Hosoi (1995) predictions had the road not acted as a barrier to landward back scarp movement. The maternity ward extends approximately 7 m further south than the neighbouring wards and has necessitated the seaward bow in the access road (see Figure 9) this is now vulnerable to over topping and the present beach head (the road edge) in this area is in immediate need of remedial action. At the very least this area should be nourished at the earliest opportunity as a temporary measure to provide protection to the road and prevent flooding of the Hospital. This would also buy a little time whilst a decision is made regarding remedial action on this coastline.
[EU-SOPAC Project Report 46 – Webb]

EU EDF-SOPAC Reducing Vulnerability of Pacific ACP States Kiribati – Aggregates & Coastal Processes – 23
N
Access road
Exposed beach rock
West East Waste outfall
Exposed beach rock
mortuary
maternity ward
N
West
Figure 9. Comparison of the 1995 oblique air phoshow the degree of beach volume recovery. Notback beach scarp is less pronounced in the cenaccess road in front and to the right (east) of thehas gained volume (buried beach rock) the erosiotank is completely exposed in ’98. The area in froerosion and the lower elevation or disappearancflooding of the Hospital on several occasions inclusand has accumulated on the eastern (right) sid2005.
[EU-SO
Seawater intake
Maternity ward
wastestorage t
to (Forbes and Hosoi, 19e that much of the beachtral and eastern end of maternity ward and frontn scarp has continued to nt and just east of the me of the beach head in tding early 2005. Note alsoe of the seawater intake
PAC Project Report 46 –
Area previously nourished
Waste storage facility built into beach head
Wave over topping
1995
1998
ank
East
95) and 1998 vertical air photo is not optimal but does rock exposed in ’95 is buried by sand in ’98. Also the the beach in ’98, however, the scarp has reached the of the mortuary in ’98. Note also that whilst the beach regress landward and the concrete wastewater storage aternity ward in particular appears vulnerable to further his area has allowed wave over topping and localised evidence of a net westward longshore transport where
pipeline in 1998. This pattern was similarly evident in
Webb]
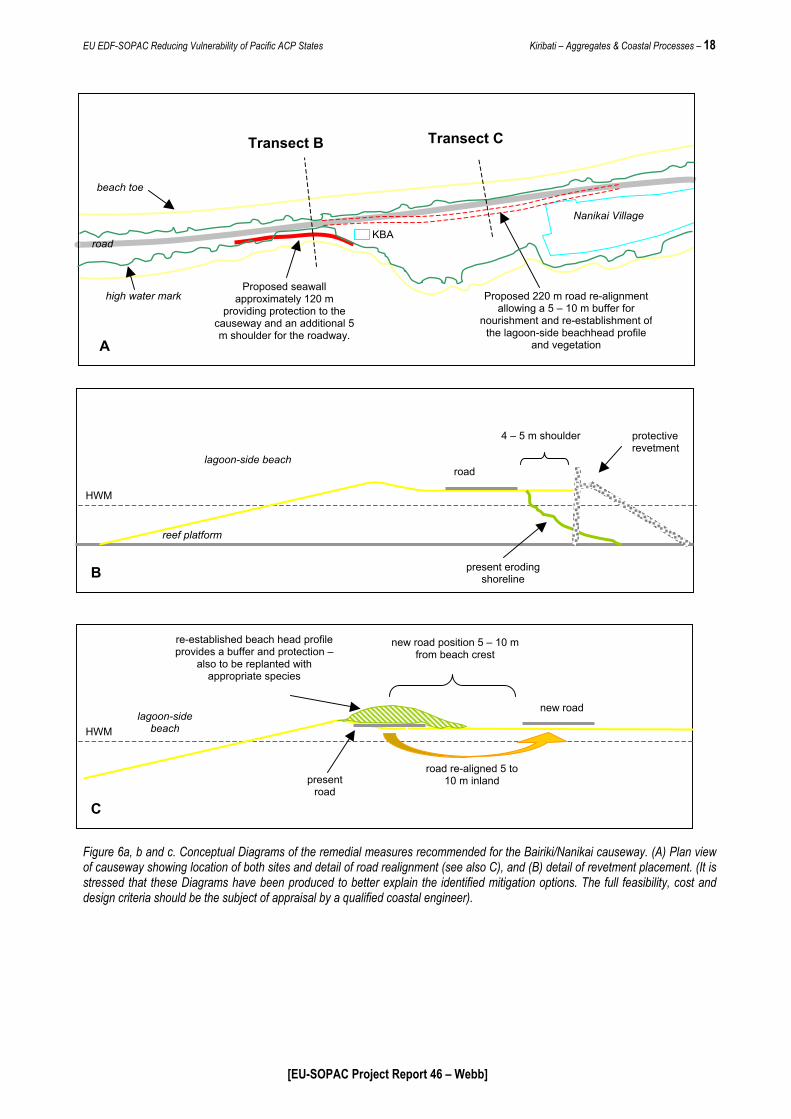
EU EDF-SOPAC Reducing Vulnerability of Pacific ACP States Kiribati – Aggregates & Coastal Processes – 24
N
50 m
A. 1998
West East
Key: Red – 1943 Blue – 1969 Green – 1998
Exposed beach rock outline Toe of beach (sand/reef-platform boundary) Back beach scarp (upper extent of active beach face)
Figure 10a, b and c (see also following page). 1998, 1969 and 1943 comparative, digitally rectified images of the Hospital coastline, all images are of identical orientation and scale. The outline position of the waste and seawater pipe lines and reservoir (yellow), the access road (grey) and hospital buildings (red) are all identical. Note that the 1998 (green) and 1943 (red) upper beach scarp lines are not significantly different, where as the 1969 (blue) scarp is on average positioned 10.5 ± 1.6 m further south over the length of the beach (This agrees well with Forbes and Hosoi 1995 who found that the beach had receded some 9.0 m from 1969 to 1995). This indicates that during the 26 years between 1943 and 1969 the beach prograded approximately 10 m and has since retreated land-ward to approximately the same 1943 position (red line). Assuming that the beach was relatively unperturbed in the period until the building of the Hospital, it appears that significant shoreline shift is a natural pattern on this coast. In 1943 and 1969, the average beach width is 27.4 ± 2.5 m and 27.5 ± 4.2 m, respectively. In comparison, the 1998 beach width is 22.5 ± 4.1 m. This approximate 20% reduction in width suggests this beach remains in an unstable condition.
[EU-SOPAC Project Report 46 – Webb]

EU EDF-SOPAC Reducing Vulnerability of Pacific ACP States Kiribati – Aggregates & Coastal Processes – 25
B. 1969
Back beach scarp (upper extent of active beach face) Toe of beach (sand/reef-platform boundary) Exposed beach rock outline
Red – 1943 Blue – 1969 Green – 1998
Key:
N
N
C. 1943
[EU-SOPAC Project Report 46 – Webb]
EU EDF-SOPAC Reducing Vulnerability of Pacific ACP States Kiribati – Aggregates & Coastal Processes – 26
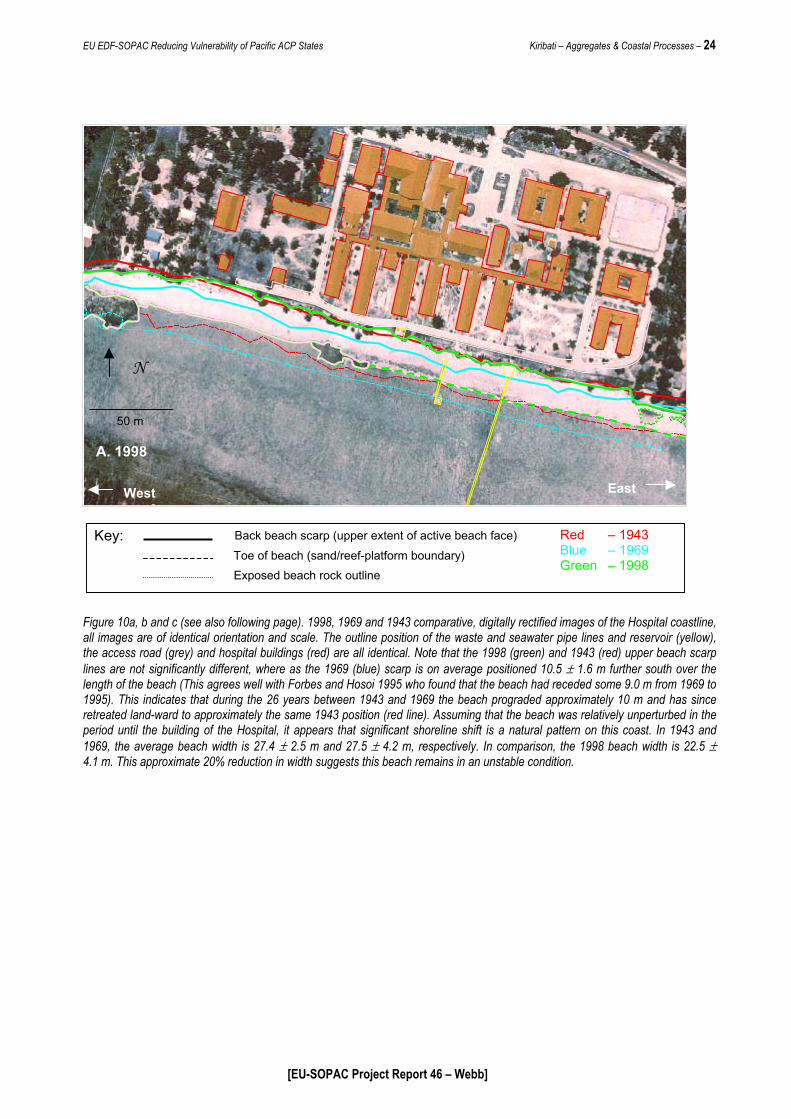
3.4 Is ENSO the cause of the erosion? ENSO (El Niño – Southern Oscillation) is cited by Forbes and Hosoi (1995) as a likely factor effecting sediment transport (erosion) at the Hospital site. In essence, this premise assumes that during neutral (and possibly La Nina) ENSO conditions the prevailing easterly winds produce east to west longshore transport regimes on the South Tarawa coast (south to north on the North Tarawa oceanside coast). These prevailing conditions are thought to be associated with periods of beach building and recovery / stability. During El Niño events the easterly trade winds weaken and may reverse and it is assumed that these less frequent conditions result in disruptions to westward sediment transport processes and consequently erosion in soft shore environments. El Niño is also associated with lower (0.1 – 0.4 m) than average sea levels in the western Pacific (data sourced from the South Pacific Sea Level and Climate Monitoring Project – Phase III). SOI (Southern Oscillation Index) values are used to describe the ENSO phenomenon’s shifting atmospheric pressure patterns where the value of 0 equates with neutral conditions, positive (+) values with La Nina and negative (–) with El Niño. The “Troup” SOI system (used by the Australian Bureau of Meteorology – BoM) has maximum and minimum values of +35 and –35. The SOI graph in Figure 11 was constructed using 3-month averages of BoM’s monthly SOI values. Three-month averages are used as raw monthly fluctuations in SOI are less meaningful when considering significant ENSO shifts, however averaging also diminishes the extreme ENSO values with a strong El Niño value approaching only –25 and strong La Nina approaching around +20. By comparing measured wind data (South Pacific Climate and Sea Level Monitoring Project – 2005) to SOI values over the 1990 to 2004 period, the tendency of ENSO events to affect wind direction and therefore longshore transport process was analysed (see Figure 11). Analysis of the SOI/wind data shows, as Forbes and Hosoi (1995) expected, that the persistent El Niño (1990 – 1994) produced a weakening of the easterly trades and a significant percentage of wind from the western quarter. This is followed in 1995 / ’96 (Figure 11 – b and c) by predominant easterly trade wind conditions which were hypothesized to have produced the partial beach recovery apparent in the 1995 study. However, during 1996 – 1997 strong El Niño conditions prevailed (Figure 11 – d) which resulted in approximately 50% of the wind during this period to originate from the western quarter. If the hypothesis of greater erosion during El Niño conditions was correct then it would be expected that the intense El Niño of ’96 – ’97 with corresponding measured westerly winds would have produced a further significant erosion episode on the Hospital coast. Aerial photography was fortuitously undertaken in 1998 following this El Niño event and this shows no evidence of recent or enhanced erosion compared to 1995. Indeed features shown on the 1998 air photo are consistent with the continuation of the recovery of the beach since 1995 (see Figures 9 and 10). Analysis of wind gust data (South Pacific Climate and Sea Level Monitoring Project – 2005) for the same period mirrored that of the mean wind climate. During the period 1990 – 1994 gusts (> 10 m / sec) were more frequent than in “normal” and La Nina years, however, this pattern was similarly evident in both the 1996 – 1997 (Figure 11 – d) and the 2002 (Figure 11 – I) El Niño events. Again, there is no evidence to suggest increased erosion on this shoreline during these later events, which in turn diminishes the likelihood of ENSO being the main contributing factor to erosion at the Hospital site since 1991.
[EU-SOPAC Project Report 46 – Webb]

EU EDF-SOPAC Reducing Vulnerability of Pacific ACP States Kiribati – Aggregates & Coastal Processes – 27
Troup SOI values 1990 - 2005 (3 month means)
-25
-20
-15
-10
-5
0
5
10
15
20
25
2005
2004
2003
2002
2001
2000
1999
1998
1997
1996
1995
1994
1993
1992
1991
1990
A B C D E F G H I J La Nina
El Nino
Figure 11. Wind roses of local Tarawa mean wind climate for the period 1990 to 2004. Rather than representing annual cycles the time period of each rose corresponds to changes in SOI values (indicated by the red boundaries on the SOI graph – inset). This gives a better indication of ENSO influence over Tarawa wind climate and therefore its potential impact over longshore sediment transport processes (data sourced from Bureau of Meteorology Australia and the South Pacific Sea Level and Climate Monitoring Project – Phase III).
[EU-SOPAC Project Report 46 – Webb]

EU EDF-SOPAC Reducing Vulnerability of Pacific ACP States Kiribati – Aggregates & Coastal Processes – 28
Whilst no doubt a contributing factor, ENSO-related wind shifts seem unlikely to explain the intense erosion of the Hospital coast following its completion in 1991 and additional factors must be considered. It is also important to note casual observations made by the current author (who lived on this coast from 1988 to 1994) and anecdotal evidence from I’Kiribati elders from this area. Both agree that the movement of sand away from the beach is associated more with infrequent storm events. The exposure of beach rock following such events and its subsequent burial is a common occurrence over much of this coastline; however, wave over topping is far less frequently experienced. No I’Kiribati interviewed from the Nawerewere area had any memory of the Hospital coastline being an area particularly prone to erosion nor had anyone experienced wave over topping in this area prior to the Hospital’s construction. These observations go a long way to understanding the source of the present problems on this coastline and the points below reconstruct the likely sequence of events leading to the present situation:
1. The pre-construction beach has no history of unusual erosion or wave over topping and is essentially a stable coastal feature providing protection to the land resources behind the beach.
2. Hospital construction with its associated facilities results in the destabilisation, disturbance, realignment and changed elevation of the beach and beach head system.
3. Construction of facilitates through the beach profile (seawater intake, waste outfall and waste storage tank) act as groynes, which contribute chronic destabilising effects on the beach. They disrupt transport processes and further lower the beach head profile.
4. A storm event (December 1992) caused severe erosion to the now vulnerable and destabilised beach profile and structure.
5. The damaged beach is subject to increasingly intense use and foot traffic by the public using the hospital facility.
6. “Chronic” disturbances continue (groyne effects of seawater pipes) and intensify (foot traffic and removal of vegetation) and significant increases occur in the perturbation of “upstream” and neighbouring beach areas due to increased settlement in this area (seawall construction, beach mining, reclamation, etc.).
In summary, the “acute” disturbances caused during the Hospital’s construction and subsequent storms, left the coastline greatly damaged and vulnerable to further erosion. Additional and intensifying “chronic” disturbances have lead to the beach’s inability to fully recover, resulting in a damaged eroding beach environment which can no longer provide protection to the land and facilities built behind it. 3.5 Will the beach recover? There is considerable evidence to suggest this beach has been recovering since the mid 1990’s. However, the continued movement and eventual alignment of the beach and the position of the beach head is unlikely to be compatible with the current land use in this area. As previously mentioned, without intervention the natural position of the active back beach scarp would probably lie within 1 or 2 m of the southern wall of the maternity ward. Irrespective of whether this coastline may eventually stabilise, overwhelming evidence shows that during the last 10 years it has not been able to recover to its former position, size or shape and therefore cannot provide protection for the Hospital. This chronic state of vulnerability appears to be due to a range of anthropogenic disruptive factors. The comparison of the historical air photos shows that this is a naturally dynamic and changing environment and the Hospital (particularly the maternity ward and access road) should never have been located so close to the active beach environment. Therefore, the question is not whether the beach will recover but rather “is the Hospital in a zone which is likely to leave it
[EU-SOPAC Project Report 46 – Webb]

EU EDF-SOPAC Reducing Vulnerability of Pacific ACP States Kiribati – Aggregates & Coastal Processes – 29
vulnerable to wave damage and flooding?” The answer to this question is yes, in its present condition the beach does not offer adequate protection for the Hospital facility, and the occurrence of serious flooding and / or structural damage is simply a matter of time. 3.6 Recommendations To protect the hospital facility two main options, one “soft” and one “hard” are recommended. The differing methods have their particular merits and ultimately cost will probably dictate which option is pursued. If appropriately designed and positioned (as suggested here) no significant adverse “down stream” effects should occur. Both options will necessitate the relocation of the southern end of the maternity ward, seawater facilities and the realignment of the access road. Soft Option (Preferred) A soft approach is recommended however, this will still involve significant engineering costs due to the relocation of inappropriately designed and located hospital facilities (Figure 12).
1. Relocate the maternity ward (or at least the southern end) and the access road to provide an adequate buffer area to rehabilitate the beach system.
2. Redesign/relocate the large upper beach outfall platform and waste reservoir tank (presently located in the centre of the beach crest), to reduce the disruption to longshore transport (outfall) and allow the rebuilding of the beach profile (tank).
3. Bury the outfall and intake pipes below the reef platform surface. 4. Nourish the entire length of the beach with sand of appropriate quality and build up the
beach profile to its original state in terms of its width and height, with the beach crest falling approximately in line with the southern edge of the former access road.
5. Re-vegetate with appropriate pioneer and coastal species and prevent all access to and over the rehabilitated beach profile. Possibly provide one or two beach access ways. These must be fenced and have chain linked wooden battened foot surfaces to prevent beach erosion and damage.
6. Monitor the beach particularly with regard to performance during and after storm and unusually high water events.
Hard Option (Not Preferred) Replace the existing beach face with a hard surface and extend an artificial beach head to an adequate elevation to prevent wave over topping. It is strongly recommended that any such structure should follow the existing gradient of the beach face and utilise the existing beach rock as a footing. By maintaining the natural gradient, this artificial surface will act very much like the fossil beach faces which become occasionally exposed along neighbouring beach areas. It will also allow the natural burial by sand during periods of accretion and should not significantly disturb long-shore transport patterns (Figure 12). The following management points should however be considered as precursory to any remedial action – hard or soft:
• It is a matter of considerable urgency that the removal of shoreline resources (sand / gravel / beach rock mining) on this and neighbouring beaches ceases immediately.
[EU-SOPAC Project Report 46 – Webb]

EU EDF-SOPAC Reducing Vulnerability of Pacific ACP States Kiribati – Aggregates & Coastal Processes – 30
• Any future coastal engineering (shoreline, inter-tidal and sub-tidal) from a domestic scale (traditional seawall) to national scale (boat channels, dredging, etc.) needs to be comprehensively assessed by a qualified coastal processes body before approval.
• Any engineered structure or change to the coastline must be designed to appropriate
specifications and be routinely monitored and maintained.
• Human foot traffic over this beach and beach use must be controlled, as such fragile soft beach systems simply cannot sustain such intensive use.
[EU-SOPAC Project Report 46 – Webb]

EU EDF-SOPAC Reducing Vulnerability of Pacific ACP States Kiribati – Aggregates & Coastal Processes – 31
Beach profile is re-established over
former access road. Vegetation is planted over new beach crest and area is fenced to
prevent access
Southern end of maternity ward
relocated
hwm
access road reef present back beach
scarp within 1 m of access road
7 m 3 m
2 m
Figure 1ocean-sireservoirrelocatio
A
beach
present back beach scarp within 1 m of
access road
reef platform
beach rock
Beach profile is re-placed with concrete surface. Revetment includes a wall to prevent over topping during
wave run up
hwm
7 m
access road realigned
Southern end of maternity ward
relocated
B
Southern end of maternity ward
relocated
C
Reservoir tank
relocated
Approximate position of re-
established beach berm. Access road re-
aligned
Exposed beach rock
Present back beach scarp position
2a, b and c. Conceptual Diagrams of the (A) soft and (B) hard remedial options recommended for the Tungaru Hospital de coastline. Diagram (C) gives detail of the relocation of the southern end of the maternity ward, access road and tank (and possible destinations). The green band represents the position of the re-established beach berm. Redesign / n of the reservoir tank and seawater intake and outfall pipes must also be addressed.
[EU-SOPAC Project Report 46 – Webb]
EU EDF-SOPAC Reducing Vulnerability of Pacific ACP States Kiribati – Aggregates & Coastal Processes – 32
4. Bonriki Airport Ocean-side Seawalls
N
300 m
Lagoo
A
B – Site 1
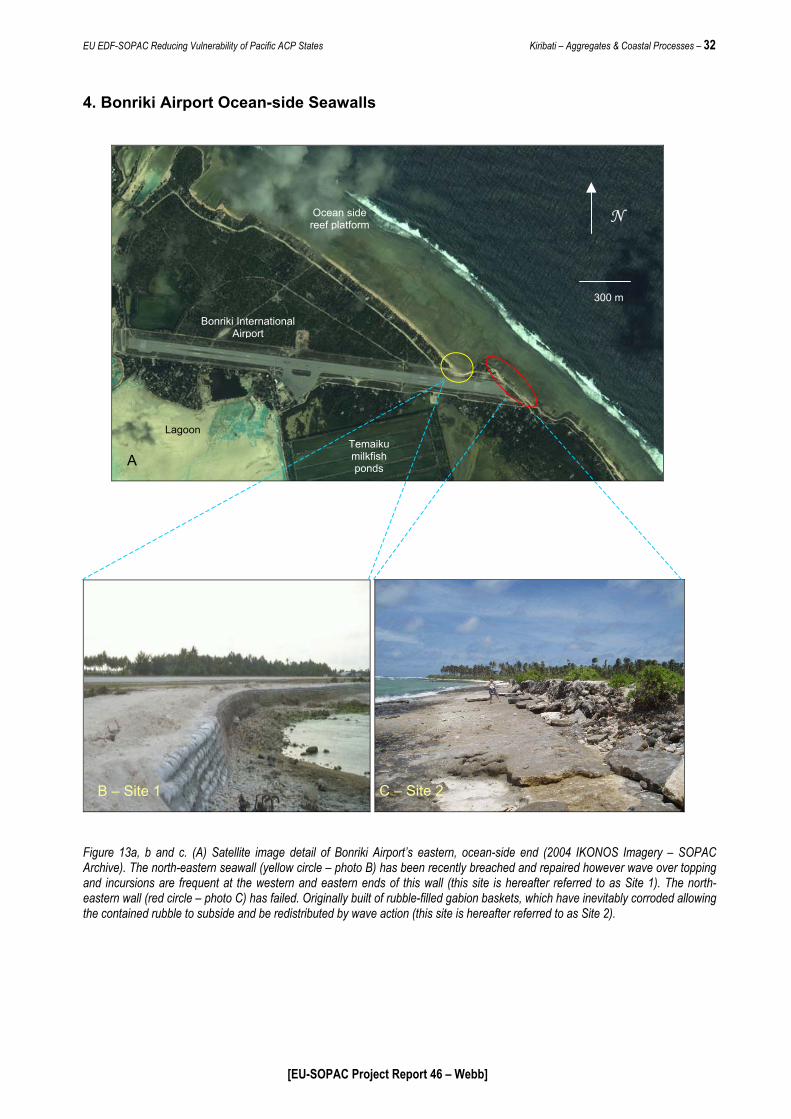
Figure 13a, b and c. (Archive). The north-easand incursions are freqeastern wall (red circle the contained rubble to
Bonriki International Airport
n
A) Satellite image detatern seawall (yellow ciruent at the western an– photo C) has failed. Osubside and be redistri
[EU
Ocean side reef platform
Temaiku milkfish ponds
C – Site 2
il of Bonriki Airport’s eastern, ocean-side end (2004 IKONOS Imagery – SOPAC cle – photo B) has been recently breached and repaired however wave over topping d eastern ends of this wall (this site is hereafter referred to as Site 1). The north-riginally built of rubble-filled gabion baskets, which have inevitably corroded allowing
buted by wave action (this site is hereafter referred to as Site 2).
-SOPAC Project Report 46 – Webb]

EU EDF-SOPAC Reducing Vulnerability of Pacific ACP States Kiribati – Aggregates & Coastal Processes – 33
4.1 Background As with the previous locations discussed in this report, the Bonriki airstrip facility is of undisputed national importance to the Republic of Kiribati and its protection is a matter of urgent concern. It should also be noted that delaying remedial action will result in damage to the sealed airstrip surface, which will add substantially to the overall repair bill and may disrupt international flight schedules. Whilst there is little doubt that better design and analysis of this coastline during the 1993 project would have prevented much of the problems presently experienced, the ongoing damage to these beaches caused by intensive sand, gravel and rock removal cannot be overlooked. The coastline at the eastern (ocean-side) end of the Bonriki airstrip has been subject to wave over topping and erosion since the completion of the 1993 airport renovation and extension project (pers. comm. Biribo-Atauea, 2005). The PWD has responded to these problems by building a mortar-filled sandbag seawall at the north-eastern embayment (Site 1) and a gabion basket seawall along the eastern shore (Site 2). The concrete seawall was damaged in early 2005 and has since been repaired however over topping and wave incursions at the northern end of the wall continues. The gabion basket wall at Site 2 has also failed due to corrosion of the baskets and redistribution of the rubble fill by waves. As with the previous two locations discussed in this report, the study of the history of this coastline gives an important perspective to understanding the root cause of these problems. The Bonriki airstrip was first constructed by the US Army in 1943 and consisted of a compacted lagoon rubble surface 1220 m long by 45 m wide and other than the clearing of tall vegetation it did not disturb the lagoon or oceanside coastline. During the period between the late 40’s and late 60’s the airstrip was significantly lengthened and widened (approximately 2000 m x 100 m in 1969 – see Figure 15) and is thought to have been tar sealed during the 70’s. Various surface maintenance projects have been undertaken since the 70’s and in 1993 the airstrip surface, apron and taxiway was completely re-engineered. The resulting runway facility has remained more or less unchanged and has a tar sealed length of approximately 2130 m x 55 m wide and a total length (including unsealed approaches and aprons) of 2260 m x 165 m wide (Figure 13a). The 1993 expansion project necessitated the extension of the lagoon side (western) unsealed approach by some 80 m which was achieved by filling and reclaiming the lagoon shoreline. The eastern (ocean side) tar seal was extended by over 100 m bringing the tar seal to within 10 m of the active ocean-side beach face. 4.2 What is causing wave damage in these areas? Digital rectification of 1943 and 1969 aerial photographs was undertaken and over laid on more recent satellite imagery (IKONOS 2004). Analysis of these images indicates that the coast at both sites have remained relatively stable over the last 60 years and in short, appear not to be subject to significant natural regimes of erosion and accretion (Figure 15). The raised limestone (coral conglomerate) headland which separates the two Sites and the fossil beach face which forms the foot of the disintegrating gabion basket seawall are also features associated with a more stable coastline. This is in direct contrast to the problems highlighted by the GoK who indicate that these are vulnerable coastlines and it is a matter of some urgency that appropriate mitigating measures are undertaken before damage occurs to the tar seal of the airstrip and in turn closes the facility to international flights. Whilst the historical images indicate that there has been little or no coastline shift since 1943 to the present; these images, particularly the 1969 air photo, show that significant changes have been made to the beach profile (see Figure 14a and b), this was also evident during our site visit. In the 1969 image, a small turn-around area can be seen extending into the headland separating the two sites. This is bordered on the east (right) by a steep cutting, which highlights the original height of the beach profile in comparison to the airstrip surface elevation. In 1969, the airstrip did
[EU-SOPAC Project Report 46 – Webb]

EU EDF-SOPAC Reducing Vulnerability of Pacific ACP States Kiribati – Aggregates & Coastal Processes – 34
not extend to the ocean-side beach and the access road (which marks the end of the strip) remained some 20 m inland from the active beach face. It appears that although vegetation had been cleared from the back beach berm, over the whole width of the beach the elevation of the beach profile had not been disturbed. Similarly, a strip of mature vegetation (approximately 15 m wide) remained between the apron / access road and the inside embayment beach at Site 1. In view of this vegetation it can also be assumed that the beach profile in this area was also intact (particularly in terms of elevation) in 1969. The present access road skirts the edge of the now greatly enlarged apron and then proceeds NE and runs parallel to the coast approximately 60 m from the oceanside beach. Immediately after leaving the apron, the road climbs approximately 2 m in elevation onto a broad beach crest (60 – 80 m wide) which is a predominant feature of the comparatively undisturbed coast north of the airstrip. It appears that when the airstrip was lengthened and widened during the early 90’s the remnants of this higher beach berm at sites 1 and 2 were levelled to conform with the elevation of the present airstrip apron (see Figure 14). Additionally, the previous buffer of 15 – 20 m between the apron and the active beach was greatly reduced and the airstrip tar surface now lies less than 10 m from the active beach. It is difficult to reconstruct the actual elevation lost from the levelled beach berm, but since this coast receives more energy than the comparatively undisturbed coast north of the airstrip (note the reef platform is over 100 m narrower at Site 2 in comparison with the sandy north Bonriki beach – Figure 13a), it seems likely that at least 1.5 – 2 m of elevation was lost from these beach berm profiles. This has left the eastern end of the airstrip extremely vulnerable to wave over topping during storms and high water events and regression of the soft beach face (erosion and wave over topping) above the level of the beach rock will continue as there is no longer a complete beach crest to dissipate wave run up and energy.
apron tar seal
Approximately 2.0 m
Figure 14a and b. (A) Taken in 1995 (kindly supplied by R. Smith – SOPAC) shortly after the completion of the airstrip renovation, this photo looks across Site 1 towards Site 2 (facing south-west). Note that the beach head has been flattened to the same level as the airstrip apron (barely 1 m above the high water mark). (B) This photo taken at the edge of the airstrip apron (100 m north of Site 1) gives an indication of the elevation of the unperturbed beach berm (note tack climbing to the left). Since coastal energy regimes and exposure at sites 1 and 2 are similar or greater than those which formed the berm obvious in photo B, it is likely that the original beach berm at sites 1 and 2 were once of similar or greater elevation (i.e. 1.5 – 2.0 m above the apron height). The embayment at Site 1 is subject to a degree of natural movement and this is consistent with the northern soft beach environment. The rectified images indicate that the 1943 vegetation line is similar to the present position but that in 1969 the northern soft beach edge had accreted eastwards by some 10 m (Figure 15). Since the 1993 redevelopment of the runway, erosion in this embayment has been ongoing and the apparent similarity of the 2004 and 1943 beach head position is most likely related to the more recently built, repaired and back filled seawall (Figure 15). In turn, the more recent trend of beach recession in this area is most likely linked to the intensive aggregate removal from the “upstream” headland. Predominant south-easterly trade winds would produce a net northerly sediment transport from the point of Temaiku towards North
[EU-SOPAC Project Report 46 – Webb]

EU EDF-SOPAC Reducing Vulnerability of Pacific ACP States Kiribati – Aggregates & Coastal Processes – 35
Tarawa and the intense aggregate mining activity evident on the headland between sites 1 and 2 would starve this embayment of transported gravel and sand, causing beach erosion. The intensive level of aggregate mining in this area is of great concern. Again this is evident everywhere on this coast and is not only hastening the disintegration of this already disturbed beach system but the excavation pits which lay just behind the beach scarp, greatly weaken the beach structure and it is likely that a large storm will result in the loss of many meters of land and flooding (see Figure 17). Beach rock has also been quarried in this area, beach rock represents the last line of defence and is the only reason this coast has persisted as well as it has. It cannot be stressed too strongly that both activities – aggregate removal and beach rock quarrying, must cease before any remedial action can be considered or this activity will continue to jeopardise any attempt to stabilise these coasts.
Site 1. Note former 15 m buffer between apron and
beach face – note also protective, mature vegetation
here and on headland.
Cutting scarp indicating elevation of former beach
berm.
N
1943 Key:
2004 1969
Figure 15. This digitally rectified 1969 air photo has the 194positions are quite stable over time. The 1969 airstrip and beach berms at Sites 1 and 2 and the elevation of these bermsuperimposed present airstrip position, the apron extends to berm at sites 1 and 2 and the headland (see also Figurapproximately 5 m from the active beach face.
[EU-SOPAC Proje
Beach rock platform.
Site 2. In 1969 at the centre of the
strip there is a 20 mbuffer between the road edge and the active beach (35 m
for the airstrip).
Extent of 2004 airstrip apron.
1969 lagoon shoreline (red – 1943) Extent of 2004 tar sealed airstrip.
3 and 2004 coastline positions superimposed – note that the coastline surrounding apron appears to have avoided damaging the protective
s is indicated by the cutting into the headland. As can be seen by the the beach face and necessitated the destruction of the elevated beach e 14). Note also that the north-eastern corner of the tar seal lies
ct Report 46 – Webb]

EU EDF-SOPAC Reducing Vulnerability of Pacific ACP States Kiribati – Aggregates & Coastal Processes – 36
4.3 Recommendations Some of the remedial options considered here will have large engineering costs and will ultimately “lock” the GoK into the ongoing costs of coastal protection monitoring and maintenance. As a priority recommendation and by far the easiest component of any remedial strategy, which will return significant benefits, would be the banning of aggregate removal from this and neighbouring coastlines. Again, it is stressed that this activity must cease before any remedial activity is considered. Site 1. Reclamation and protective wall This embayment cuts some 25 m into the apron area of the airstrip and lying some 250 meters from the eastern end of the strip would mean that shifting the tar seal strip west by approximately 50 m (as discussed below) would not be sufficient to avoid this area. It is likely that civil aviation regulations require a continuous, unbroken apron and in view of the hazard that this hole in the apron presents and the erosion and wave over topping issues experienced in this area, reclamation beyond the apron boundary appears the best option (Figure 16c). The present protective wall is not well designed and has proven vulnerable to over topping and subsidence. Even if a better designed, replacement wall was built in front of this it would still suffer from the same elevation restrictions as the existing wall, leaving it vulnerable to over topping and erosion. As such, it is recommended that reclamation of the inside corner of this embayment out to the apron boundary with an appropriate wall lining the newly reclaimed area would not only complete the apron, it will allow the vertical extension of the new protective wall. This will prevent over topping and will not add significantly to the length of the wall in comparison to replacing the existing wall. The reclamation would require approximately 3500 m3 of fill material which could be supplied by an appropriate lagoon sediment extraction operation (dredging). Whist there is good argument for the reclamation option at Site 1, there are concerns regarding the potential of the new wall position to cause scouring of the soft beach environment immediately north of the proposed wall position. This may occur due to the changes that the new orientation of the wall would make to wave energy reflection and the possible transference of this energy to the northern end of the wall. As such, beach monitoring (profiles) before and following construction should be undertaken to ensure that mitigating measures are pursued if this becomes an issue. Such measures may include an offshore breakwater system in front of the wall. Additionally, riprap construction of the revetment face (stacked boulders, e.g. imported basalt) is recommended since this will greatly assist in absorbing and reducing wave energy transfer. It is important that this concern is addressed by the engineering body that produces the working plans for this proposal. Site 2. “Soft Option” (Airstrip westward extension & rehabilitation of beach berm - Preferred) Civil aviation regulations will dictate that the immediate approaches to the airstrip must be of a specified elevation (i.e. equivalent to the height of the apron). However, the removal of the beach berms in the early 1990’s should never have occurred and further extension of the airstrip into the lagoon would have been a far better option. This remains an option and ultimately may be cheaper than undertaking engineering works to attempt to protect the eastern end of the airstrip. If relocated, the westward extension of the airstrip should be sufficient to allow an appropriate buffer zone between the present active beach and the apron. There is a 70 m unsealed apron area at the western, lagoon side approach (in comparison to the eastern end with <10 m), which presumably could accommodate a western extension of the sealed runway surface (the road could be diverted outside this extension). This relocation would allow an adequate buffer at the eastern end of the runway to be re-established with an elevated beach berm. Again, civil aviation regulations will ultimately guide the positions and elevations allowable.
[EU-SOPAC Project Report 46 – Webb]

EU EDF-SOPAC Reducing Vulnerability of Pacific ACP States Kiribati – Aggregates & Coastal Processes – 37
A reconstructed berm should be planted with low-growing pioneer species (e.g. Ipomoea littoralis, Vigna marina, etc.) and all human traffic and activities (especially mining) removed from the area (Figure 16c). The advantages of this “soft” approach is that a natural coastline would be encouraged to re-establish and if successful, will greatly reduce future costs associated with the maintenance of hard engineering protective measures. It should also be recognised that the positioning of the runway surface within a few metres of the active beach face on the eastern coast was from the outset inappropriate. Ultimately, keeping the runway in this vulnerable position will result in ongoing costs of hard mitigation measures and occasional unavoidable wave incursions. As such, the westward relocation of the runway will directly address the issue of vulnerability and provide the opportunity for beach rehabilitation rather than engineering. Site 2. “Hard Option” (Shoreline Protection – Not Prefered) Similar to Site 1, addressing this coastline issue with hard engineering alone is difficult, as without sufficient elevation of a revetment structure the runway will remain vulnerable to wave incursions. Adequate elevation of a new structure cannot be incorporated due to the proximity of the runway to the coast, therefore the two are mutually exclusive. In essence, even if the shoreline is stabilised by engineering, this high-energy coast will remain vulnerable to over topping during unusually high water, storm and large swell conditions. The only recourse is to use methods to reduce wave run up and to break up wave energy offshore, before it reaches the shoreline. It is possible that a system of breakwaters (e.g. tetrapods – like the system used on Betio wharf), may assist in protecting this shoreline and prevent most over topping episodes. However, extension or placement of any structure onto lower beach or reef platform may antagonise the already disrupted sediment transport processes in this area. Whatever methods are used, the break up of wave energy and therefore wave run-up potential, before it reaches the shoreline will be the main objective, rather than an attempt to reconstruct the natural protective beach profile. Again, the pursuit of this hard option will lock the GoK into ongoing maintenance and monitoring costs which may be avoided if the natural beach berm can be successfully re-established. For Site 2, the recommended approach is the extension of the runway west and initially the re-establishment and rehabilitation of the oceanside beach berm. There is a strong likelihood that with good management practices and protection of this coastline, the re-establishment of a natural berm and active beach face system will be successful in protecting this coast. The additional long-term advantages of a naturally protective barrier eliminating ongoing maintenance costs associated with hard structures and the benefits of maintaining natural sediment transport regimes are far reaching. However, the importance of the implementation of protective coastal management practices (i.e. stopping all beach mining activity) is crucial to the success of this approach. As a contingency, in the unlikely event that the re-established beach berm proved unsuccessful, the relocation of the runway would facilitate the appropriate design of a revetment structure on this shoreline and would subsequently provide adequate protection to the runway facility.
[EU-SOPAC Project Report 46 – Webb]

EU EDF-SOPAC Reducing Vulnerability of Pacific ACP States Kiribati – Aggregates & Coastal Processes – 38
Airstrip is extended west approximately 70 m, utilising the
reclaimed apron area. Road is also
realigned.
Site 2 beach berm is re-established and
protected from mining. Road is also
realigned.
Site 1 bay is reclaimed and
protected with hard revetment. Road is
also realigned.
N
500 m A
Coarse sand
B
Approximately 10 m
hwm
Reef platform
Natural beach rock face
Failing gabion baskets
Present extent of runway tar seal
Re-established beach berm
Fence to protect rehabilitated
berm
1.0 – 1.5 m increase in berm
height.
Figure 16a, b and c. (see also next page) Conceptual Diagrams (over 2004 IKONOS image and 1969 B/W air photo backdrops). (A) Outlines the proposed relocation of the runway tar seal westward by some 60 – 70 m onto the already reclaimed lagoon apron area. This will provide an adequate buffer to re-establish an elevated beach face berm (B) at site two. (C) Detail of Site 1 reclamation, revetment placement and road realignment options which provides an uninterrupted apron area and the potential for an adequately designed seawall in terms of height to prevent wave over topping.
[EU-SOPAC Project Report 46 – Webb]

EU EDF-SOPAC Reducing Vulnerability of Pacific ACP States Kiribati – Aggregates & Coastal Processes – 39
Raised upper wall of revetment to prevent over
topping.
Fill approximately 3500 m3
Apron Present position
of seawall Present road position
Re-aligned road
Revetment approximately
120 m in length.
27 m
Tar sealed runway C
5. Synthesis 5.1 Nanikai/Bairiki Causeway The Nanikai/Bairiki causeway is from the outset a man-made structure which was necessitated by the need for greater access to land and enhanced communications on South Tarawa. The completion of this causeway stopped all tidal water flow between the ocean and lagoon at this site and greatly changed sediment transport patterns particularly on the coastlines of Nanikai and Bairiki. Fortuitously, these changes (combined with human reclamation activity) have resulted in significant net gains in land area of both Nanikai (approximately 12% from 6.36Ha to 7.21Ha) and Bairiki (approximately 15% from 35.46Ha to 41.25Ha) from 1969 to 2004. However, it appears that the southern coastline of Nanikai and particularly the western point have not yet reached a stable state and this process of coastline readjustment is now threatening the causeway where it adjoins Nanikai’s south-western corner. Sediment transport patterns have been greatly changed in this area and natural shoreline adjustment has resulted in erosion at this unprotected section of the causeway coast. The causeway is narrow (< 20 m wide) at this location, which precludes road realignment and disturbance of the lagoon side beach (reclamation) is not recommended. In view of the ongoing trend of erosion at this location and the nature of the threatened facility, hard engineering measures are considered appropriate (so long as the considerations outlined in this report are followed). As an additional note, perceived water quality concerns within Tarawa Lagoon have prompted discussion of reinstating flow through this and other causeways along South Tarawa, by the provision of bridged channels or tunnels between the ocean and lagoon. These would serve to augment the volume of fresh marine waters entering and leaving the lagoon on each tidal cycle with the intention to enhancing exchange of lagoon waters. Whilst the notion to protect or improve water quality within Tarawa Lagoon is applauded, any approach which includes opening these established causeways must be treated with the utmost caution.
[EU-SOPAC Project Report 46 – Webb]

EU EDF-SOPAC Reducing Vulnerability of Pacific ACP States Kiribati – Aggregates & Coastal Processes – 40
As discussed, large increases in land area have occurred since 1969 due to changes in sediment transport brought about by the construction of the Teaorereke / Nanikai / Bairiki causeways. In short, with the closing of these ocean passages, sediment that was previously lost by being caught in the former tidal channels and swept to the ocean dropoff or lagoon basin is now added to the reef and beach systems of these islets. These additional sediments have moved continuously along the Teaorereke / Nanikai / Bairiki coasts and have resulted in accretion (the Betio causeway is also an excellent example of this type of accretion). In light of the trends outlined in this study, an attempt to open these causeways will almost certainly result in large losses of land (erosion), particularly on Nanikai and Bairiki. Since there are many additional factors which affect water quality in Tarawa Lagoon, it is recommended that these are tackled before any serious consideration of re-instating channel flow is undertaken. In both regards, it is strongly recommended that the GoK seek expert advice to assist in developing the best possible solutions to these issues. 5.2 Tungaru Hospital Coastline Early assessment of the 1943 historical images of this coastline may have forewarned of the natural propensity for this shore to shift depending on ambient environmental and climatic conditions. As shown, the 1943 coast alignment closely resembles the present coast position and since significant human interference can be ruled out in the interim between 1943 and 1969 it must be assumed this degree of shift is a natural phenomena. This being the case, the hospital should never have encroached so closely to the coastline (particularly the maternity ward and access road) and as discussed by Forbes and Hosoi (1995), better study of this coast before construction would have saved the huge expense and inconvenience of implementing mitigating measures. Whilst there is evidence that significant coastline shift is a natural process at this site, additional factors have combined to increase the vulnerability of the coast to erosion and have diminished the beach’s ability to provide adequate protection to the Hospital facility. Namely, the construction of the seawater and outfall pipes which act as groynes diverting sediment off the beach face and the construction of the waste reservoir tank into the beach head, which has lowered the profile of the beach significantly and allows wave over topping. A second factor is the intense degree of use and foot traffic this beach receives by the resident population of accompanying and visiting family and less incapacitated patients of the Hospital. This results in the removal of vegetation and the destabilisation, lowering and enhanced erosion of the beach profile and protective beach crest. Thirdly, is the unquantified but significant disturbance to the longshore sediment budget by the widespread removal of sand (beach mining) and “upstream” (east) reclamation efforts, which act to further reduce transport and the ability of the beach to recover. These later points are broader community and policy-related issues but their importance in terms of protecting this and other South Tarawa coasts is critical. The protection of the national Hospital facility is a priority. However, the cost of placing appropriately-designed and built hard protective measures along the length of this coastline are prohibitive (a quick estimate based on costs outlined in SOPAC’s Coastal Protection Feasibility Study – 2005 (Cook Islands) indicates a cost of AUD $ 6100 / lineal metre of revetment. If we use this figure as a guide and multiply by the length of damaged coast, approximately 300 m, it totals around AUD $ 1.83 million). Since there are facilities and buildings associated with the Hospital, which are known to be inappropriately placed and/or designed, their relocation and the re-establishment of a new beach berm appears the best and cheapest option. Again if successful, the benefits of establishing a natural defence system will pay great dividends with regard to saved future maintenance and monitoring costs associated with hard engineering.
[EU-SOPAC Project Report 46 – Webb]

EU EDF-SOPAC Reducing Vulnerability of Pacific ACP States Kiribati – Aggregates & Coastal Processes – 41
5.3 Bonriki Airport Seawalls The position of this coastline has remained relatively stable over the last 60 years as this higher energy coast is naturally protected by beach rock outcrops. However, protection from wave over topping was previously supplied by a naturally-raised beach berm, which was removed and/or flattened in the early 90’s. This resulted in the eastern end of the runway being left vulnerable to wave over topping and erosion. Again, this highlights the need for a comprehensive assessment of these environments before engineering is undertaken. As indicated, this coast is a comparatively higher energy environment and even if hard revetments of adequate design strength are built to prevent erosion, the runway will remain susceptible to wave incursions since the close proximity (<10 m) of the tar sealed runway to the shore prevents elevation of a seawall beyond that of the apron. As such, it is more effective to relocate the tar seal towards the lagoon (west) and provide an adequate buffer between the sealed runway and the eastern shoreline. This will allow a natural berm of adequate elevation to be re-established to provide natural protection to this facility. Again, if successful, the cost benefits of natural protection on this coast greatly outweigh the inconvenience and expense of relocation. Additionally, an independent assessment of the condition of the runway surface (Becca Co Ltd. NZ, 1995 and 2003) indicated that the runway is due for re-surfacing and it would be expedient to consider these recommendations before work is undertaken and the incorporation of this comparatively minor relocation effort during resurfacing may prove very cost effective. The assistance of the civil aviation authority should also be obtained to provide advice on the maximum allowable height and distances from the sealed runway to the proposed rehabilitated beach berm, as it is not presently known if the available space at the lagoon end of the airstrip is inadequate. 6. Beach mining in South Tarawa During the field work undertaken for these assessments of vulnerable coastal areas in South Tarawa, it became increasingly apparent that the issue of coastal vulnerability can no longer be viewed in a piece- meal manner. Few areas of the South Tarawa coastline remain undisturbed and beach sand and gravel mining occurs on a regular basis over the greater part of the island’s soft coastlines. Evidence of beach rock quarrying and removal of reef platform rock was also frequently seen (Figure 17). Biribo and Smith (1994) conservatively estimated that in 1993, “private” aggregate extraction (meaning individuals selling/using aggregate, of which practically 100% would be sourced from the beach environment) was 4100 m3 and 8800 m3 of sand and gravel, respectively. Commercial aggregate extraction (undertaken mostly by the Public Works Department) during the same year was approximately 2300 and 27 500 m3 of sand and gravel, however much of this was sourced from intertidal lagoon platforms (e.g. Temaiku Bight) and terrestrial gravel quarries again in Temaiku (Biribo and Smith, 1994). Since the population of South Tarawa has nearly doubled during the intervening period (approximately 25 000 in 1990 and approaching 40 000 in 2005) the availability of traditional building materials has greatly declined. Additionally, the perceived suitability of traditional buildings in a security-conscious urban community has also sadly changed. These factors combined with the ever-increasing need to provide basic services and facilities for the urban population have resulted in a huge increase in aggregate demand. As early as 1983, Carter (1983) had already highlighted the sensitivity of the soft coastal environments in South Tarawa, concluding that no aggregate mining should occur on the ocean-side coast, and communicated a need for caution in the mining of the lagoon coasts.
[EU-SOPAC Project Report 46 – Webb]

EU EDF-SOPAC Reducing Vulnerability of Pacific ACP States Kiribati – Aggregates & Coastal Processes – 42
1 2
3 4
5 6 Figure 17. A summary of beach mining activity in South Tarawa (from top left). (1) Typical urban beach sand mine (these disappear with each tide – their reliable reappearance gives some indication of frequency). (2) Sand and gravel mining behind the ocean side beach crest. (3) Screening facility for hand mined beach aggregates. (4) Beach rock quarrying (note the fresh bathtub size hole and litter of gravel). (5) Bagged gravel for sale. (6) Reef rock collected for sale.
[EU-SOPAC Project Report 46 – Webb]

EU EDF-SOPAC Reducing Vulnerability of Pacific ACP States Kiribati – Aggregates & Coastal Processes – 43
Similarly, Biribo and Smith (1994) cite a major purpose of their 1994 report was a response to concerns of coastal erosion and damage resulting from beach mining. Twenty years later, one of the three core components of this present SOPAC EU-funded Project (Reducing Vulnerability in Pacific ACP States) is Aggregate Supply, in recognition of the broad and urgent nature of this issue. It is imperative that this report is not added to the list of documents that warn of, but cannot quantify what the actual or eventual impacts and costs of beach mining will be. Quantification is problematic because diffuse activities that contribute to chronic erosive processes (e.g. beach mining) are insidious, in that immediate (quantifiable) consequences are not usually perceived. However, the gradual disruption which beach mining causes to sediment budgets leaves the shoreline more vulnerable especially to unusual events (e.g. storms, high astrological tides, ENSO shifts) and reduces the resilience of the beach environment following such events. In short, beach mining and other inappropriate coastal developments in South Tarawa will result in large areas requiring artificial coastal defence structures and this process of degradation is occurring now.
Requesamountsuch asthat in “surplusquestion1996; Cdevelopthe impprecaut The Sopatternspressurcoastal resiliencquantifia
Consider the following;
South Tarawa’s urban coastline is approximately 87km in length. Much of this is soft coastline and it is conceivable that most of it is impacted, however let’s say 25% (21.75km) will eventually require protection if beaches continue to degrade, 21 750 m (21.75km) x AUD $ 6000* / m = AUD $ 130.5 million.
This example is obviously not the result of an extensive resource study, however it is most likely anunderestimation since it does not account for the loss of amenity and ecological function of beaches,projected maintenance costs and the impact on aesthetics (sandy beaches replaced with concrete). Nordoes it consider where such a vast amount of aggregate will come from or the design requirements forfuture sea-level rise. *Revetment costs derived from SOPAC – GHD/SEA Coastal Protection Feasibility Study (Cook Is) –Harper and Jones, 2005.
ts have been made by Kiribati and other similar small island nations to quantify the of sand which may be sustainably “harvested” from the beach environment and studies Carter (1983) have considered this question for certain locations. It must be understood a densely-populated atoll context, quantifying how much beach sand and gravel is ” to environmental function is in fact a nonsense. In the mostly pristine environments, this is deeply complex in terms of spatial and temporal resolution (e.g. see Shorten et al arter 1983, etc.). However, the additional anthropogenic stresses imposed by urban ment (e.g. intensive marine harvest, changed water quality, changed flow regimes and acts of future sea-level change) point to an overwhelming need for a highly-conservative, ionary approach.
uth Tarawa community has departed from a traditional mode of life and resource use and the carrying capacity of the island has been greatly exceeded. In view of the huge
es on the marine environment in South Tarawa and the high probability of increasing vulnerability in the near future, every strategy available to protect and enhance the e of the coastal environment must be considered a priority. Waiting for definitive, ble indicators will be too late.
[EU-SOPAC Project Report 46 – Webb]

EU EDF-SOPAC Reducing Vulnerability of Pacific ACP States Kiribati – Aggregates & Coastal Processes – 44
Urgent Recommendations The critical and severe nature of this issue necessitates an alternative approach to resource use and acquisition including aggregate supply. Offshore (lagoon) resource exploration, quantification and qualitative studies have already been undertaken by Smith and Biribo (1995) and in summary, they have identified an appropriate aggregate resource area approximately 2.5 km north of Betio islet (Vinstra Shoal). A comprehensive economic and environmental impact assessment has also been completed and in essence, this document supports the exploitation of this resource (Cruickshank & Morgan 1998). A conservative estimate of this resource indicates a net yield 5.2 million m3 of mixed aggregate (approximate composition, 17.2% coral rubble and the remainder a mixture of course and finer sands). Taking gravel demand as the main limiting factor (36 000 m3/year in 1994 – this was however an abnormally high value due to the resurfacing of the road and Hospital construction – Biribo and Smith, 1994), the resource area has the capacity to supply aggregates for at least 25 years. In recognition of the limited life of this resource additional exploration work is scheduled by SOPAC/EDF for late 2005. The urgency to develop this resource is recognised by the Ministry of Fisheries and Marine Resource Development (MRMRD), as without an adequate alternative supply of aggregates beach mining in South Tarawa will necessarily continue. A Project Proposal produced by the same, has to date failed to attract funds to initiate and provide the initial purchase costs of offshore dredging equipment. This is possibly since the true environmental costs and commensurate increase in vulnerability of South Tarawa’s coastlines have not been seen as the major benefit of developing the offshore resource and extraction operation. In view of the urgency of this issue, the SOPAC/EDF Reducing Vulnerability Project will work closely with the MFMRD to rework this proposal in the hope of facilitating a successful conclusion. Additionally, SOPAC has experience in the development of offshore aggregate extraction guidelines and monitoring procedures in similar Pacific Island States and can assist in this area as the Proposal develops. In conclusion, the locations considered in this report, particularly the Hospital and Bonriki Airport, represent a “preview” of the likely problems that will gradually become common along much of South Tarawa’s coast, if the soft beach environments continue to be disturbed by mining and inappropriate engineering. It is strongly recommended that;
• In order to effectively regulate and implement a complete ban on beach mining a major requirement is to secure an appropriate alternative aggregate supply - this has been identified but not yet exploited.
• Kiribati procures the services of a coastal processes expert to assess all coastal
engineering before it is undertaken.
• It is imperative that prolonged and effective community outreach programmes explaining the implications of beach mining and poor costal engineering must be carried out.
_________________________________________________________________
[EU-SOPAC Project Report 46 – Webb]

EU EDF-SOPAC Reducing Vulnerability of Pacific ACP States Kiribati – Aggregates & Coastal Processes – 45
References Biribo N & Smith R (1994) Sand and Gravel Usage (in) South Tarawa, Kiribati 1989-1993.
SOPAC Preliminary Report 75. Biribo-Atauea N (2005) Minerals Officer – Minerals Division. Ministry of Fisheries & Marine
Resource Development. Personal Communication. SOPAC EDF 8/9 mission, April 2005. Carter R (1983) Coastal Erosion in Kiribati. SOPAC Cruise Report CR76/1983. Cruikshank MJ & Morgan CL (1998) Economic Feasibility and Environmental Impact Assessment
for Extraction of Sand, Offshore Tarawa. Final Report, Ministry of Natural Resources Development. Kiribati.
Forbes DL & Hosoi Y (1995) Costal Erosion in South Tarawa, Kiribati. SOPAC Technical Report
225. Harper B & Jones C (2005) Coastal Protection Feasibility Study (Cook Islands). DRAFT SOPAC
Technical Report, February 2005. Holmes DW (1979) Gilbert Islands: Land Reclamation and Sea Defences on Tarawa Atoll. Report
No. OD 18 Hydraulics Research Station, England. Howorth R (1982a) Coastal erosion in Kiribati: visit to South Tarawa (22 Jan – 10 Feb).
CCOP/SOPAC Technical Report 22. Howorth R (1982b) Coastal erosion in Kiribati: visit to South Tarawa (10 – 18 June).
CCOP/SOPAC Technical Report 22. Howorth R (1983) Coastal erosion in Kiribati: visit to South Tarawa (23 Aug – 8 Sept).
CCOP/SOPAC Technical Report 22. Kabaua, T (2005) Civil Engineer, PWD. Personal Communication. SOPAC EDF 8/9 mission, April
2005. Shorten G, Forbes DL & Etuati B (1996) ENSO, erosion and sealevel change in Tarawa.
Preliminary Report No. 167 SHOR. SOPAC. Smith R & Biribo N (1995) Marine aggregate resources Tarawa Lagoon, Kiribati – including
current meter studies at three localities. SOPAC Technical Report 217. Teaotai, A (2005) Former Secretary to State (and long term resident of South Tarawa). Personal
Communication. SOPAC EDF 8/9 mission, April 2005.
______________________________________________
[EU-SOPAC Project Report 46 – Webb]

EU EDF-SOPAC Reducing Vulnerability of Pacific ACP States Kiribati – Aggregates & Coastal Processes – 46
Annex
EUROPEAN UNION DELEGATION OF THE EUROPEAN COMMISSION FOR THE PACIFIC Kiribati and Nauru Office
10 February 2005
BRIEFING NOTE TO SOPAC
Kiribati Disaster Preparedness Project
Background There are two climate change projects currently being implemented in Kiribati. The World Bank’s 'Kiribati Adaptation Project' (KAP) and UNDP National Adaptation Programme of Action (NAPA). The aim of KAP is to mainstream climate change adaptation into the planning processes of the Government of Kiribati. In addition the project will request from the Global Environment Fund funding for activities related to climate change including awareness raising, climate proofing of capital investments, protecting water reserves, etc. Any activities to be funded by the GEF must be included in government ministerial operational plans (called MOPS) which are put together at the beginning of each year; these are now being finalised by Ministries. The World Bank obtained Japanese grant funding to support the preparation of the GEF project document which has included a wide ranging consultation process and technical input from a number of experts (anthropologists, economist and coastal engineers) to identify priorities for GEF funding. The World Bank team has made a number of missions to Kiribati to prepare the GEF project document. A team was last in Kiribati in February 2005 and will return in April/May 2005 to finalise the project document to be submitted to GEF. NAPA is another mechanism to assist Kiribati in obtaining GEF funding. Operationally the NAPA and KAP projects have been merged. The UNDP Project merely finances the facilitation of the planning/mainstreaming process without actual funds for investments associated with it. EC funds available The B envelope of the 9th European Development Fund (EDF) is set aside for disaster relief or disaster preparedness. A total of 2.2 million Euro is available for Kiribati for 4 years which must be programmed before December 2007. The EC is of the opinion that disaster relief in the form of urgent humanitarian aid is unlikely to be required in Kiribati, however disaster preparedness is highly relevant to enable Kiribati to manage the needs of a growing population dependant on a fragile environment. ‘Disaster prevention’ the phrase used in Article 72 (e) of the ACP EU Cotonou Agreement, although a different concept to that of climate change adaptation, does involve complementary activity. Some causeways and infrastructure identified through the KAP preparation process require protection to preserve communication and transport routes however they are not threatened by climate change but by natural processes. These processes need to be monitored in the same way as threats caused by climate change and determining the appropriate response should entail the same analysis and planning mechanisms. By combining with KAP-NAPA, the EC’s input into disaster preparedness will take place within a policy context which supports monitoring and informed planning thus ensuring appropriate responses and sustainability of results. Discussion with the World Bank team, SOPAC and within the Pacific Delegation of the EC has established a preliminary project concept, which has yet to be discussed with the GoK via the National Authorising Officer (NAO) who is the Permanent Secretary of Finance. The NAO in consultation with appropriate Ministries will determine the project to be submitted to the European Commission. The current project concept is that the EC will provide a grant to the GoK from the B envelope allocation of 2.2 million Euro for: • The costs of engineering works to improve identified causeways/seawalls in South Tarawa
(possibly the rehabilitation of Nanakai causeway and the seawall at the ocean side of Bonriki airport).
[EU-SOPAC Project Report 46 – Webb]

EU EDF-SOPAC Reducing Vulnerability of Pacific ACP States Kiribati – Aggregates & Coastal Processes – 47
[EU-SOPAC Project Report 46 – Webb]
• Additional equipment for monitoring and planning, building upon the regional Reducing Vulnerability of PICS project.
• Short and possibly long term technical assistance (via a contribution agreement with SOPAC). Technical assistance to the Ministry of Works is required in the design and construction of appropriate coastal protection measures and in the monitoring of coastal changes, analysis of information and planning.
• SOPAC’s project management costs. • Development of a skills based course for our ‘Outer Island Mobile Training Programme’, in use of
soft approaches to coastal protection, climate monitoring and protection of fresh water reserves, building water tanks for rain water catchment and gutter construction and maintenance.
Any activity undertaken by the EC must be linked to and supportive of the policy context that KAP-NAPA is promoting. SOPAC input The Delegation of the European Commission for the Pacific would seek a contribution agreement with SOPAC as a preferred alternative to tendering for technical assistance. There is no guarantee that Brussels will agree with the approach and may prefer that the TA component is tendered although this is unlikely given the very good reasons for using SOPAC including its expertise in coastal protection and in monitoring of environmental changes, experience in providing technical support to PICS, knowledge of Kiribati and its long term role in supporting PICS including Kiribati in climate change adaptation and related matters. By building on SOPAC’s strong relationship with the GoK and on its expertise generally and that gained through implementation of the related Reducing Vulnerability Programme, the EC’s support of disaster prevention will also support wider policy and planning development and will contribute to the longer term objective of climate change adaptation. Next steps 1. Confirm GoK support of concept through the NAO 2. If possible arrange for SOPAC and World Bank teams to meet in Kiribati to confirm the details of
the EC project. 3. Prepare EC project document and submit to Brussels. As there is no funding available for TA
support in developing the project document this will be done by the EC office in Kiribati, which will need to draw upon materials developed by the World Bank, the Reducing Vulnerability Financing Agreement and reports and advice from SOPAC. The main difficulty will be the costing of engineering works.
Helen Jeans Programme Adviser, Kiribati and Nauru Office, Delegation of the European Commission for the Pacific
![Assessment of the vulnerability of Bairiki and Bikenibeu ... · [SOPAC Technical Report 322 – Chaoxiong He] [2] SOPAC Library Cataloguing-In-Publication He, C., 2001. Assessment](https://img.pdfslide.net/doc/110x75/5dd0cf11d6be591ccb62cd4e/assessment-of-the-vulnerability-of-bairiki-and-bikenibeu-sopac-technical-report.jpg)


![SOPAC - WordPress.com · [3] TABLE OF CONTENTS ACKNOWLEDGEMENTS 4 ACRONYMS 4 1 INTRODUCTION 5 2 SOURCES OF TSUNAMI HAZARD 6 3 VULNERABILITY /EXPOSURE 8 4 OVERVIEW OF TSUNAMI HAZARD](https://img.pdfslide.net/doc/110x75/6007a51218319b71703a2f17/sopac-3-table-of-contents-acknowledgements-4-acronyms-4-1-introduction-5-2-sources.jpg)