Embed Size (px)
Citation preview

EU Financial System Perspectives
BNP Paribas Securities (Japan) LimitedHead of Investment Research DepartmentChief Credit AnalystMana Nakazora [email protected]
2015/2 2
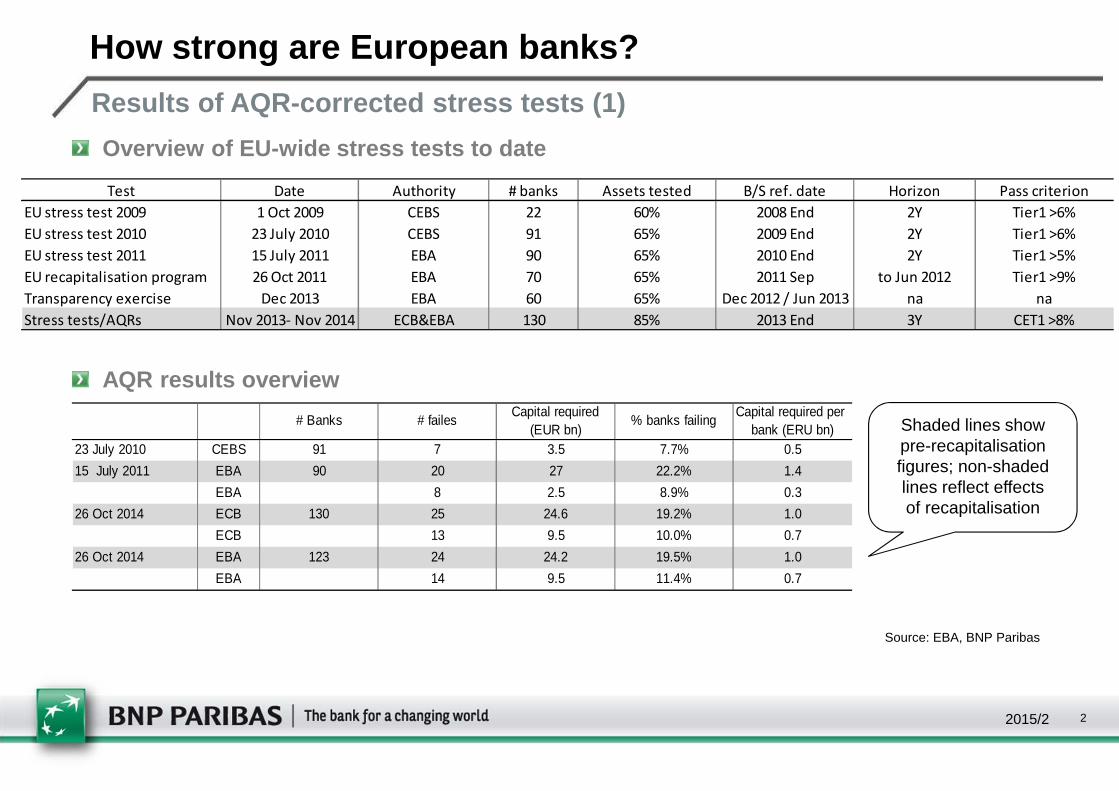
Results of AQR-corrected stress tests (1)
How strong are European banks?
Overview of EU-wide stress tests to date
Source: EBA, BNP Paribas
AQR results overview
Shaded lines showpre-recapitalisationfigures; non-shadedlines reflect effectsof recapitalisation
# Banks # failesCapital required
(EUR bn)% banks failing
Capital required per bank (ERU bn)
23 July 2010 CEBS 91 7 3.5 7.7% 0.5
15 July 2011 EBA 90 20 27 22.2% 1.4
EBA 8 2.5 8.9% 0.3
26 Oct 2014 ECB 130 25 24.6 19.2% 1.0
ECB 13 9.5 10.0% 0.7
26 Oct 2014 EBA 123 24 24.2 19.5% 1.0
EBA 14 9.5 11.4% 0.7
Test Date Authority # banks Assets tested B/S ref. date Horizon Pass criterion
EU stress test 2009 1 Oct 2009 CEBS 22 60% 2008 End 2Y Tier1 >6%
EU stress test 2010 23 July 2010 CEBS 91 65% 2009 End 2Y Tier1 >6%
EU stress test 2011 15 July 2011 EBA 90 65% 2010 End 2Y Tier1 >5%
EU recapitalisation program 26 Oct 2011 EBA 70 65% 2011 Sep to Jun 2012 Tier1 >9%
Transparency exercise Dec 2013 EBA 60 65% Dec 2012 / Jun 2013 na na
Stress tests/AQRs Nov 2013- Nov 2014 ECB&EBA 130 85% 2013 End 3Y CET1 >8%
2015/2 3
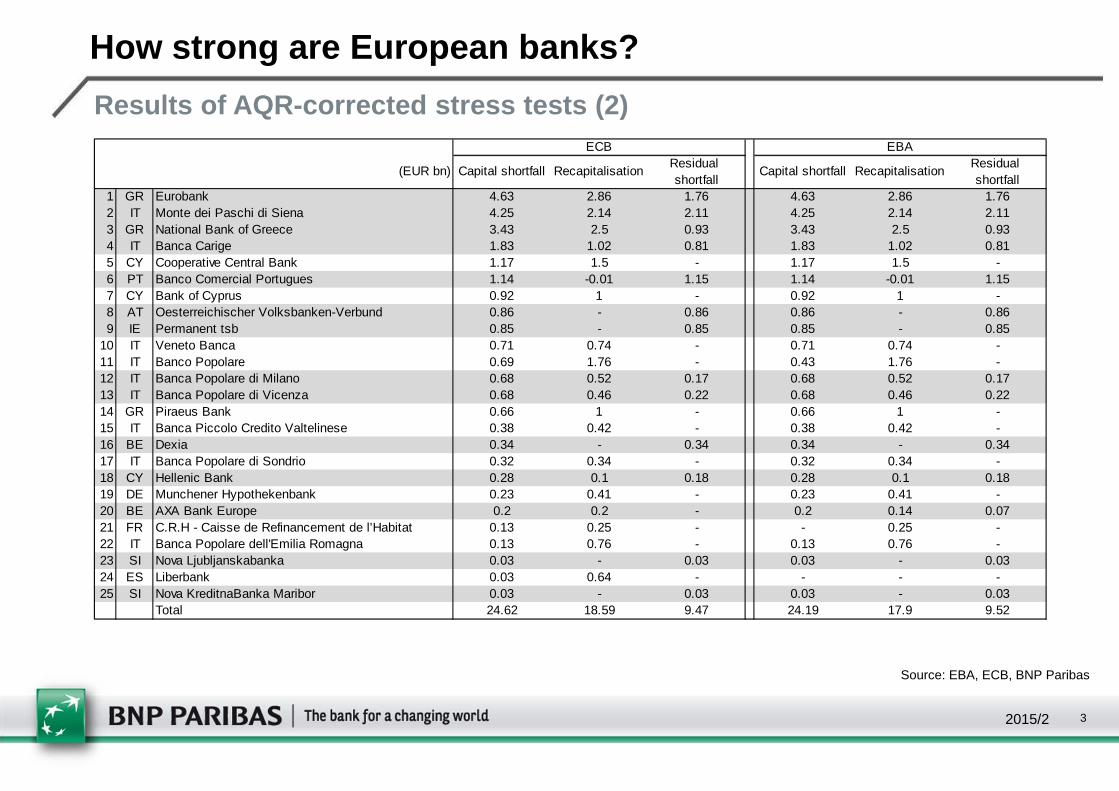
Results of AQR-corrected stress tests (2)
How strong are European banks?
Source: EBA, ECB, BNP Paribas
(EUR bn) Capital shortfall RecapitalisationResidual shortfall
Capital shortfall RecapitalisationResidual shortfall
1 GR Eurobank 4.63 2.86 1.76 4.63 2.86 1.762 IT Monte dei Paschi di Siena 4.25 2.14 2.11 4.25 2.14 2.113 GR National Bank of Greece 3.43 2.5 0.93 3.43 2.5 0.934 IT Banca Carige 1.83 1.02 0.81 1.83 1.02 0.815 CY Cooperative Central Bank 1.17 1.5 - 1.17 1.5 -6 PT Banco Comercial Portugues 1.14 -0.01 1.15 1.14 -0.01 1.157 CY Bank of Cyprus 0.92 1 - 0.92 1 -8 AT Oesterreichischer Volksbanken-Verbund 0.86 - 0.86 0.86 - 0.869 IE Permanent tsb 0.85 - 0.85 0.85 - 0.85
10 IT Veneto Banca 0.71 0.74 - 0.71 0.74 -11 IT Banco Popolare 0.69 1.76 - 0.43 1.76 -12 IT Banca Popolare di Milano 0.68 0.52 0.17 0.68 0.52 0.1713 IT Banca Popolare di Vicenza 0.68 0.46 0.22 0.68 0.46 0.2214 GR Piraeus Bank 0.66 1 - 0.66 1 -15 IT Banca Piccolo Credito Valtelinese 0.38 0.42 - 0.38 0.42 -16 BE Dexia 0.34 - 0.34 0.34 - 0.3417 IT Banca Popolare di Sondrio 0.32 0.34 - 0.32 0.34 -18 CY Hellenic Bank 0.28 0.1 0.18 0.28 0.1 0.1819 DE Munchener Hypothekenbank 0.23 0.41 - 0.23 0.41 -20 BE AXA Bank Europe 0.2 0.2 - 0.2 0.14 0.0721 FR C.R.H - Caisse de Refinancement de l’Habitat 0.13 0.25 - - 0.25 -22 IT Banca Popolare dell'Emilia Romagna 0.13 0.76 - 0.13 0.76 -23 SI Nova Ljubljanskabanka 0.03 - 0.03 0.03 - 0.0324 ES Liberbank 0.03 0.64 - - - -25 SI Nova KreditnaBanka Maribor 0.03 - 0.03 0.03 - 0.03
Total 24.62 18.59 9.47 24.19 17.9 9.52
ECB EBA
2015/2 4
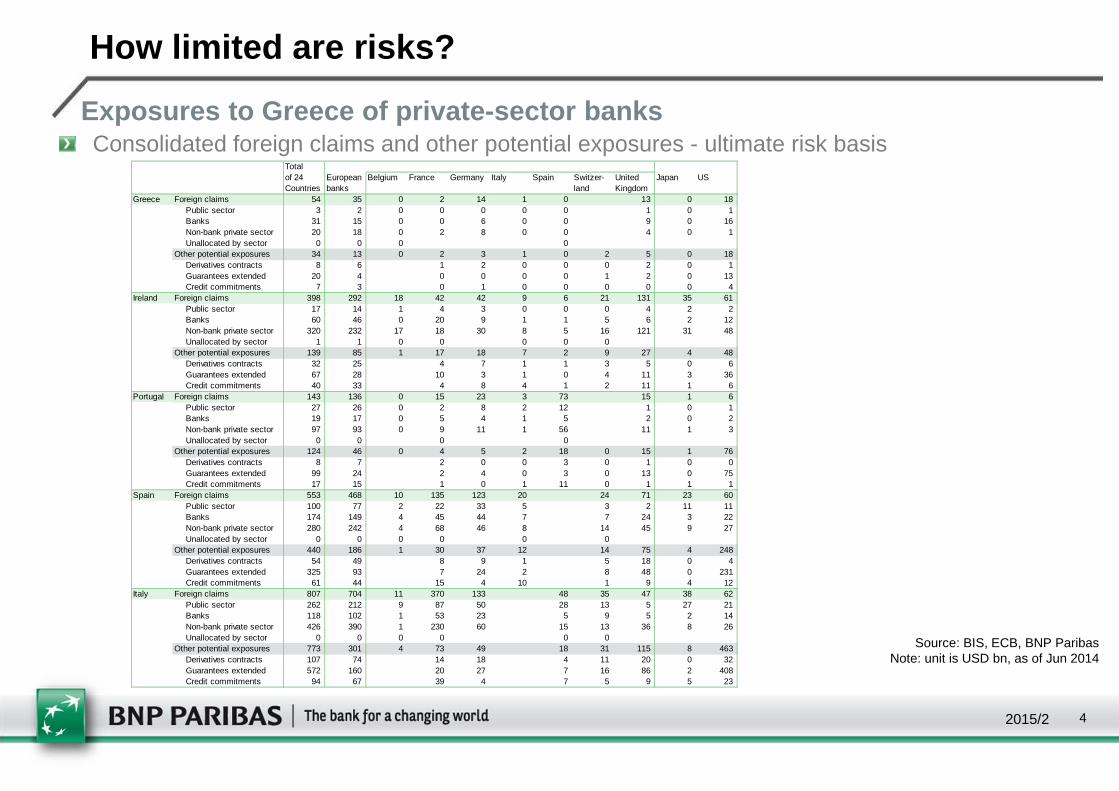
Consolidated foreign claims and other potential exposures - ultimate risk basisTotalof 24 European Belgium France Germany Italy Spain Switzer- United Japan USCountries banks land Kingdom
Greece Foreign claims 54 35 0 2 14 1 0 13 0 18 Public sector 3 2 0 0 0 0 0 1 0 1 Banks 31 15 0 0 6 0 0 9 0 16 Non-bank private sector 20 18 0 2 8 0 0 4 0 1 Unallocated by sector 0 0 0 0Other potential exposures 34 13 0 2 3 1 0 2 5 0 18 Derivatives contracts 8 6 1 2 0 0 0 2 0 1 Guarantees extended 20 4 0 0 0 0 1 2 0 13 Credit commitments 7 3 0 1 0 0 0 0 0 4
Ireland Foreign claims 398 292 18 42 42 9 6 21 131 35 61 Public sector 17 14 1 4 3 0 0 0 4 2 2 Banks 60 46 0 20 9 1 1 5 6 2 12 Non-bank private sector 320 232 17 18 30 8 5 16 121 31 48 Unallocated by sector 1 1 0 0 0 0 0Other potential exposures 139 85 1 17 18 7 2 9 27 4 48 Derivatives contracts 32 25 4 7 1 1 3 5 0 6 Guarantees extended 67 28 10 3 1 0 4 11 3 36 Credit commitments 40 33 4 8 4 1 2 11 1 6
Portugal Foreign claims 143 136 0 15 23 3 73 15 1 6 Public sector 27 26 0 2 8 2 12 1 0 1 Banks 19 17 0 5 4 1 5 2 0 2 Non-bank private sector 97 93 0 9 11 1 56 11 1 3 Unallocated by sector 0 0 0 0Other potential exposures 124 46 0 4 5 2 18 0 15 1 76 Derivatives contracts 8 7 2 0 0 3 0 1 0 0 Guarantees extended 99 24 2 4 0 3 0 13 0 75 Credit commitments 17 15 1 0 1 11 0 1 1 1
Spain Foreign claims 553 468 10 135 123 20 24 71 23 60 Public sector 100 77 2 22 33 5 3 2 11 11 Banks 174 149 4 45 44 7 7 24 3 22 Non-bank private sector 280 242 4 68 46 8 14 45 9 27 Unallocated by sector 0 0 0 0 0 0Other potential exposures 440 186 1 30 37 12 14 75 4 248 Derivatives contracts 54 49 8 9 1 5 18 0 4 Guarantees extended 325 93 7 24 2 8 48 0 231 Credit commitments 61 44 15 4 10 1 9 4 12
Italy Foreign claims 807 704 11 370 133 48 35 47 38 62 Public sector 262 212 9 87 50 28 13 5 27 21 Banks 118 102 1 53 23 5 9 5 2 14 Non-bank private sector 426 390 1 230 60 15 13 36 8 26 Unallocated by sector 0 0 0 0 0 0Other potential exposures 773 301 4 73 49 18 31 115 8 463 Derivatives contracts 107 74 14 18 4 11 20 0 32 Guarantees extended 572 160 20 27 7 16 86 2 408 Credit commitments 94 67 39 4 7 5 9 5 23
How limited are risks?
Exposures to Greece of private-sector banks
Source: BIS, ECB, BNP ParibasNote: unit is USD bn, as of Jun 2014
2015/2 5
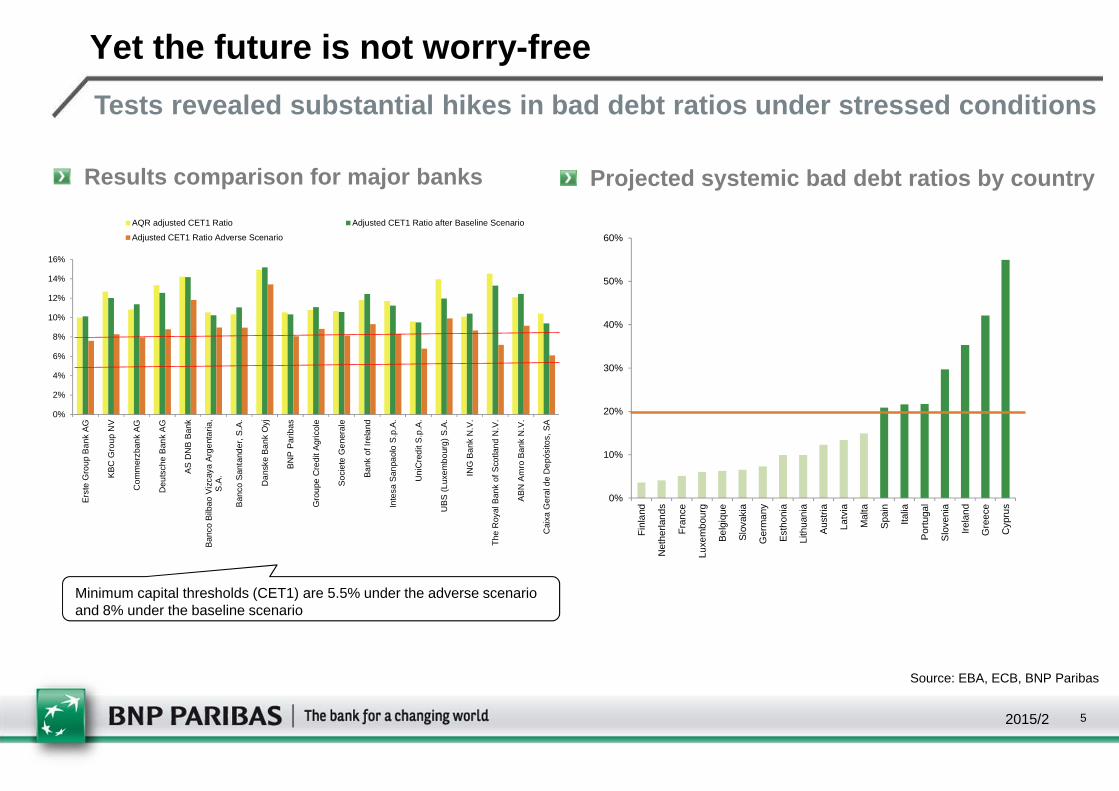
Tests revealed substantial hikes in bad debt ratios under stressed conditions
Projected systemic bad debt ratios by countryResults comparison for major banks
Minimum capital thresholds (CET1) are 5.5% under the adverse scenario and 8% under the baseline scenario
Yet the future is not worry-free
0%
10%
20%
30%
40%
50%
60%
Fin
land
Net
herla
nds
Fra
nce
Luxe
mbo
urg
Bel
giqu
e
Slo
vaki
a
Ger
man
y
Est
honi
a
Lith
uani
a
Aus
tria
Latv
ia
Mal
ta
Spa
in
Italia
Por
tuga
l
Slo
veni
a
Irel
and
Gre
ece
Cyp
rus
Source: EBA, ECB, BNP Paribas
0%
2%
4%
6%
8%
10%
12%
14%
16%
Ers
te G
roup
Ban
k A
G
KB
C G
roup
NV
Com
mer
zban
k A
G
Deu
tsch
e B
ank
AG
AS
DN
B B
ank
Ban
co B
ilbao
Viz
caya
Arg
enta
ria,
S.A
.
Ban
co S
anta
nder
, S.A
.
Dan
ske
Ban
k O
yj
BN
P P
arib
as
Gro
upe
Cre
dit A
gric
ole
Soc
iete
Gen
eral
e
Ban
k of
Irel
and
Inte
sa S
anpa
olo
S.p
.A.
Uni
Cre
dit S
.p.A
.
UB
S (
Luxe
mbo
urg)
S.A
.
ING
Ban
k N
.V.
The
Roy
al B
ank
of S
cotla
nd N
.V.
AB
N A
mro
Ban
k N
.V.
Cai
xa G
eral
de
Dep
ósito
s, S
A
AQR adjusted CET1 Ratio Adjusted CET1 Ratio after Baseline Scenario
Adjusted CET1 Ratio Adverse Scenario
2015/2 6
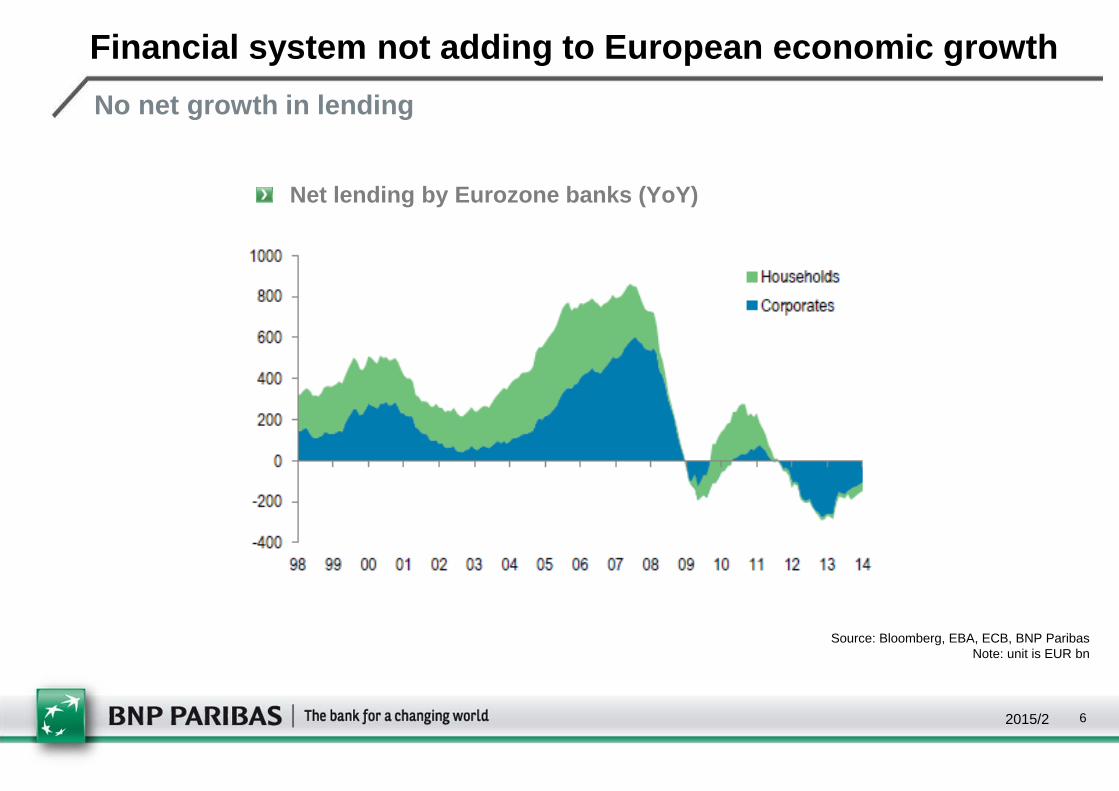
Net lending by Eurozone banks (YoY)
Financial system not adding to European economic gr owth
No net growth in lending
Source: Bloomberg, EBA, ECB, BNP ParibasNote: unit is EUR bn
2015/2 7
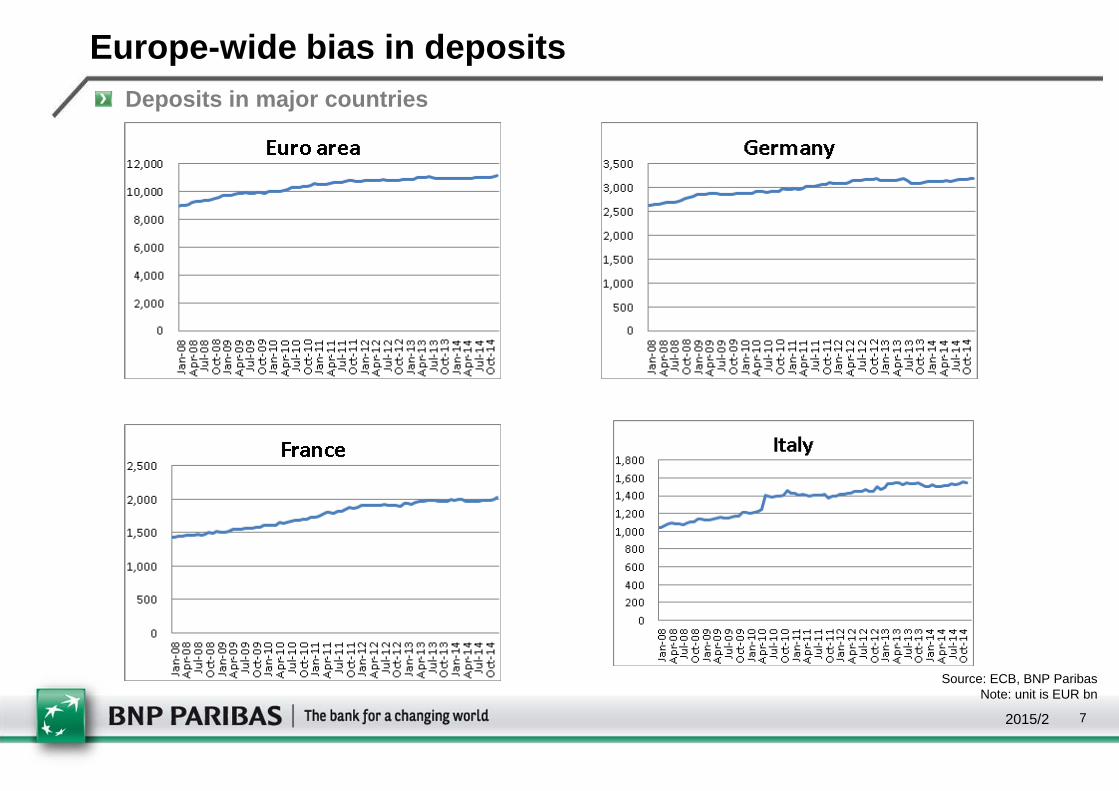
Europe-wide bias in depositsDeposits in major countries
Source: ECB, BNP ParibasNote: unit is EUR bn
2015/2 8
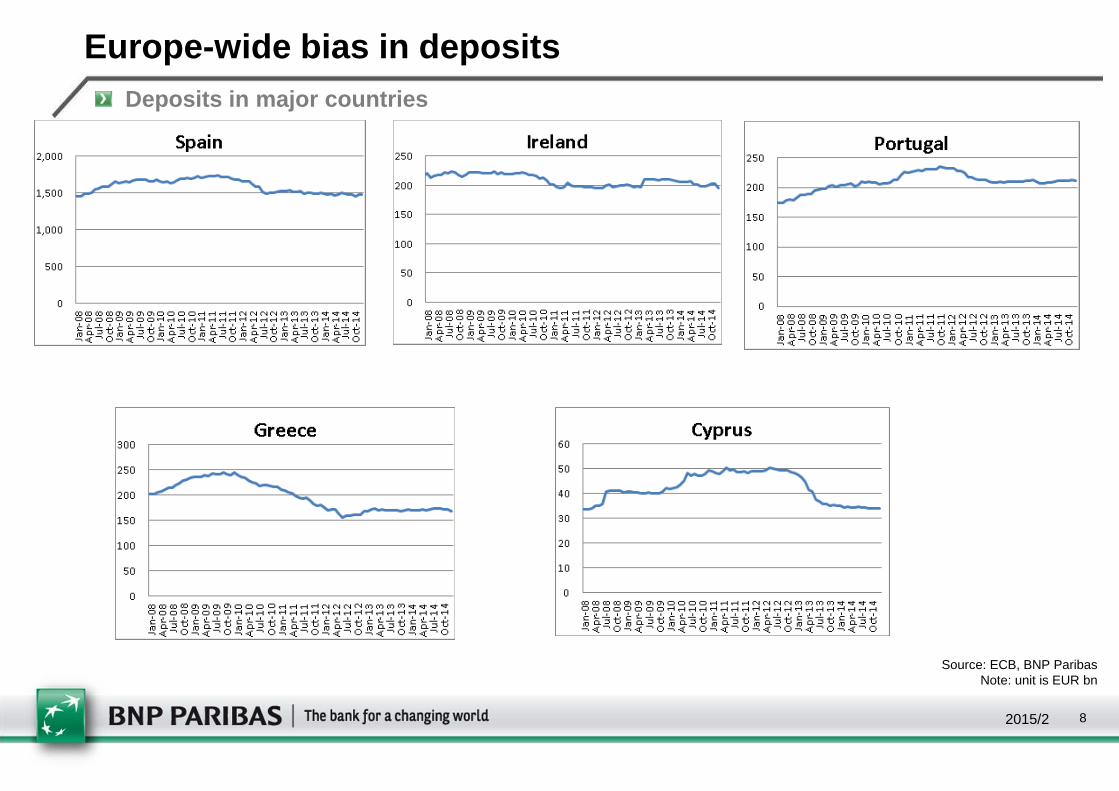
Europe-wide bias in depositsDeposits in major countries
Source: ECB, BNP ParibasNote: unit is EUR bn
2015/2 9
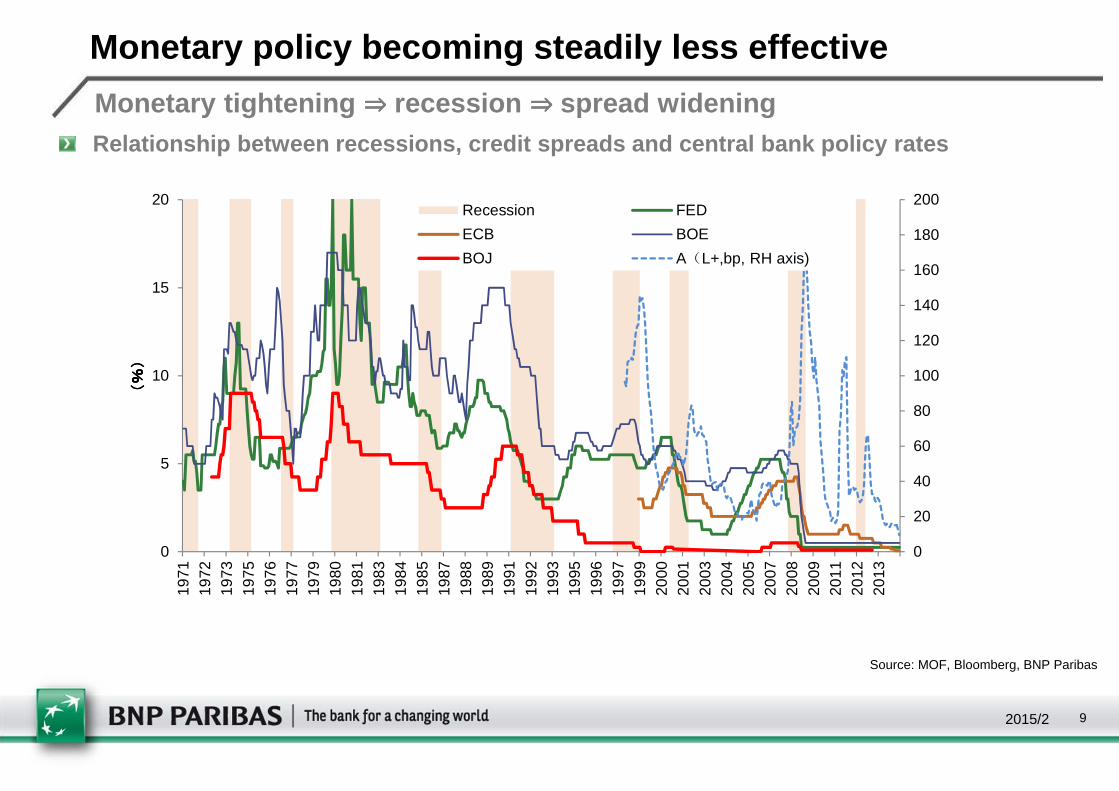
Monetary policy becoming steadily less effective
Monetary tightening ⇒⇒⇒⇒ recession ⇒⇒⇒⇒ spread widening Relationship between recessions, credit spreads and central bank policy rates
0
20
40
60
80
100
120
140
160
180
200
0
5
10
15
2019
7119
7219
7319
7519
7619
7719
7919
8019
8119
8319
8419
8519
8719
8819
8919
9119
9219
9319
9519
9619
9719
9920
0020
0120
0320
0420
0520
0720
0820
0920
1120
1220
13
(%)
(%)
(%)
(%)
Recession FED
ECB BOE
BOJ A(L+,bp, RH axis)
Source: MOF, Bloomberg, BNP Paribas
2015/2 10
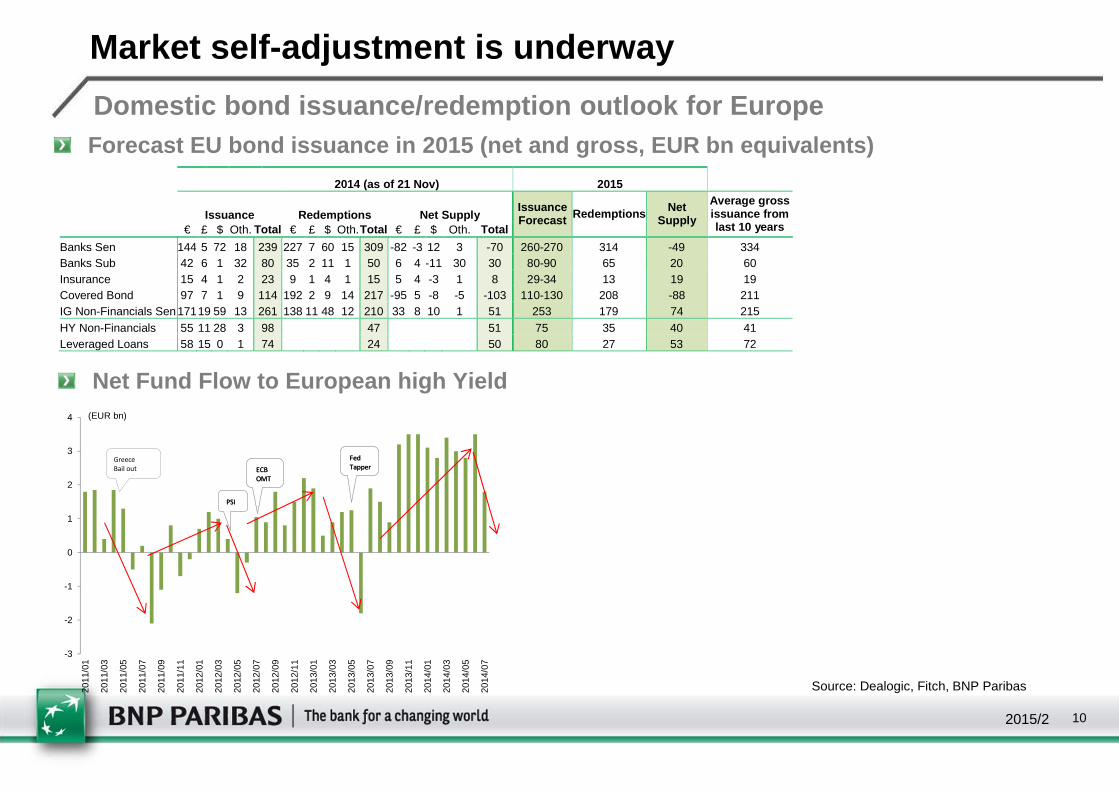
Domestic bond issuance/redemption outlook for Europ eForecast EU bond issuance in 2015 (net and gross, E UR bn equivalents)
Net Fund Flow to European high Yield
2014 (as of 21 Nov) 2015
Issuance Redemptions Net Supply Issuance Forecast Redemptions Net
Supply
Average gross issuance from last 10 years € £ $ Oth. Total € £ $ Oth. Total € £ $ Oth. Total
Banks Sen 144 5 72 18 239 227 7 60 15 309 -82 -3 12 3 -70 260-270 314 -49 334 Banks Sub 42 6 1 32 80 35 2 11 1 50 6 4 -11 30 30 80-90 65 20 60 Insurance 15 4 1 2 23 9 1 4 1 15 5 4 -3 1 8 29-34 13 19 19 Covered Bond 97 7 1 9 114 192 2 9 14 217 -95 5 -8 -5 -103 110-130 208 -88 211 IG Non-Financials Sen 17119 59 13 261 138 11 48 12 210 33 8 10 1 51 253 179 74 215 HY Non-Financials 55 11 28 3 98 47 51 75 35 40 41 Leveraged Loans 58 15 0 1 74 24 50 80 27 53 72
Market self-adjustment is underway
Source: Dealogic, Fitch, BNP Paribas
-3
-2
-1
0
1
2
3
4
2011
/01
2011
/03
2011
/05
2011
/07
2011
/09
2011
/11
2012
/01
2012
/03
2012
/05
2012
/07
2012
/09
2012
/11
2013
/01
2013
/03
2013
/05
2013
/07
2013
/09
2013
/11
2014
/01
2014
/03
2014
/05
2014
/07
(EUR bn)
Greece
Bail out
PSI
ECB
OMT
Fed
Tapper
PSI
ECB
OMT
Fed
Tapper
2015/2 11
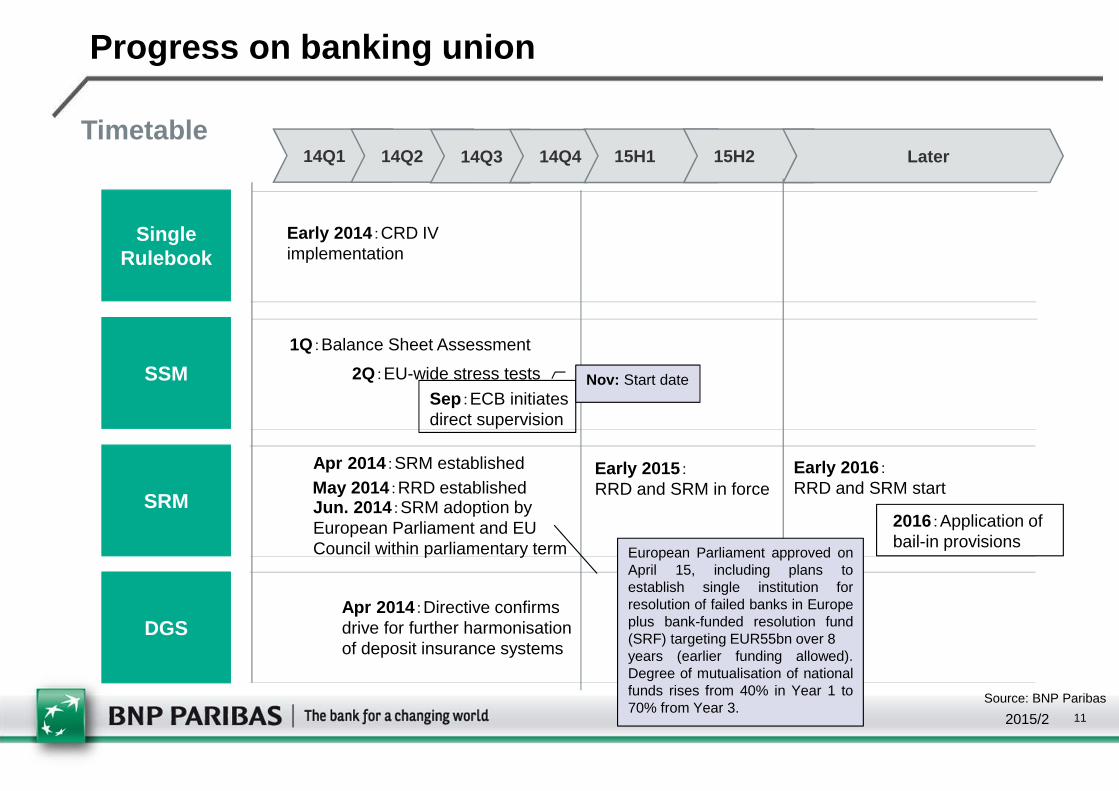
Timetable
SingleRulebook
SRM
DGS
SSM
14Q1 14Q2 14Q3 14Q4 15H1 15H2
Apr 2014 :Directive confirmsdrive for further harmonisationof deposit insurance systems
Early 2014 :CRD IV implementation
1Q:Balance Sheet Assessment
2Q:EU-wide stress tests
Sep:ECB initiatesdirect supervision
2016:Application ofbail-in provisions
Early 2015 :RRD and SRM in force
Later
Jun. 2014 :SRM adoption byEuropean Parliament and EU Council within parliamentary term
Nov: Start date
European Parliament approved onApril 15, including plans toestablish single institution forresolution of failed banks in Europeplus bank-funded resolution fund(SRF) targeting EUR55bn over 8years (earlier funding allowed).Degree of mutualisation of nationalfunds rises from 40% in Year 1 to70% from Year 3.
Progress on banking union
Apr 2014 :SRM establishedMay 2014:RRD established
Early 2016 :RRD and SRM start
Source: BNP Paribas
2015/2 12
� Consistency of bank supervision and resolution across SRM and non-SRM states
� Feasibility of cross-border resolution of failed banks under current framework if financial crisis were to occur in near future
� How deposit insurance would work for fiscally strapped countries
� Feasibility of accumulating DGS funding
Points at issue
Source: BCBS, BNP Paribas