Embed Size (px)
Citation preview
European Commission1-Mar-10 Directorate-General for Employment, Social Affairs and Equal Opportunities ─ Unit D1 1
EU labour markets in time of economic crisis
Main Topics
• Economic setting
• LM reaction to crisis
• Impact on population groups
• Outlook
European Commission1-Mar-10 Directorate-General for Employment, Social Affairs and Equal Opportunities ─ Unit D1
Economic activity
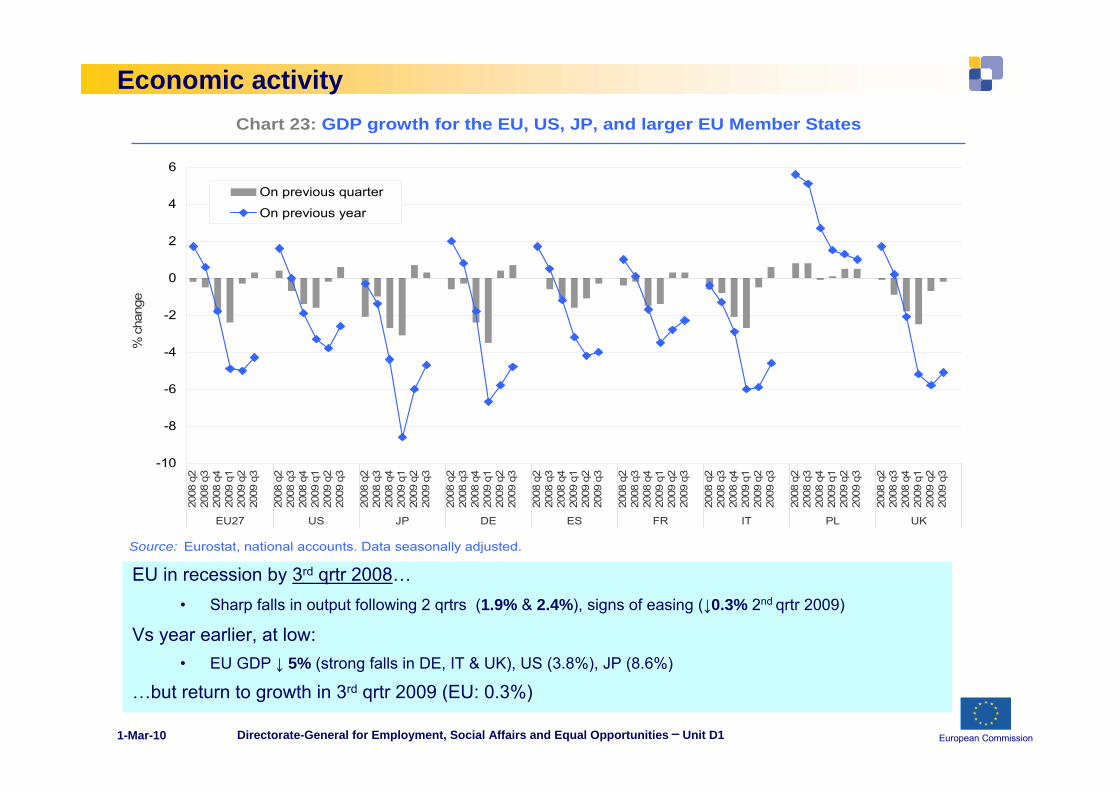
EU in recession by 3rd qrtr 2008…• Sharp falls in output following 2 qrtrs (1.9% & 2.4%), signs of easing (↓0.3% 2nd qrtr 2009)
Vs year earlier, at low:• EU GDP ↓ 5% (strong falls in DE, IT & UK), US (3.8%), JP (8.6%)
…but return to growth in 3rd qrtr 2009 (EU: 0.3%)
Chart 23: GDP growth for the EU, US, JP, and larger EU Member States
-10
-8
-6
-4
-2
0
2
4
6
2008
q2
2008
q3
2008
q4
2009
q1
2009
q2
2009
q3
2008
q2
2008
q3
2008
q4
2009
q1
2009
q2
2009
q3
2008
q2
2008
q3
2008
q4
2009
q1
2009
q2
2009
q3
2008
q2
2008
q3
2008
q4
2009
q1
2009
q2
2009
q3
2008
q2
2008
q3
2008
q4
2009
q1
2009
q2
2009
q3
2008
q2
2008
q3
2008
q4
2009
q1
2009
q2
2009
q3
2008
q2
2008
q3
2008
q4
2009
q1
2009
q2
2009
q3
2008
q2
2008
q3
2008
q4
2009
q1
2009
q2
2009
q3
2008
q2
2008
q3
2008
q4
2009
q1
2009
q2
2009
q3
EU27 US JP DE ES FR IT PL UK
Source: Eurostat, national accounts. Data seasonally adjusted.
% c
hang
e
On previous quarter
On previous year
European Commission1-Mar-10 Directorate-General for Employment, Social Affairs and Equal Opportunities ─ Unit D1 3
Employment has contracted
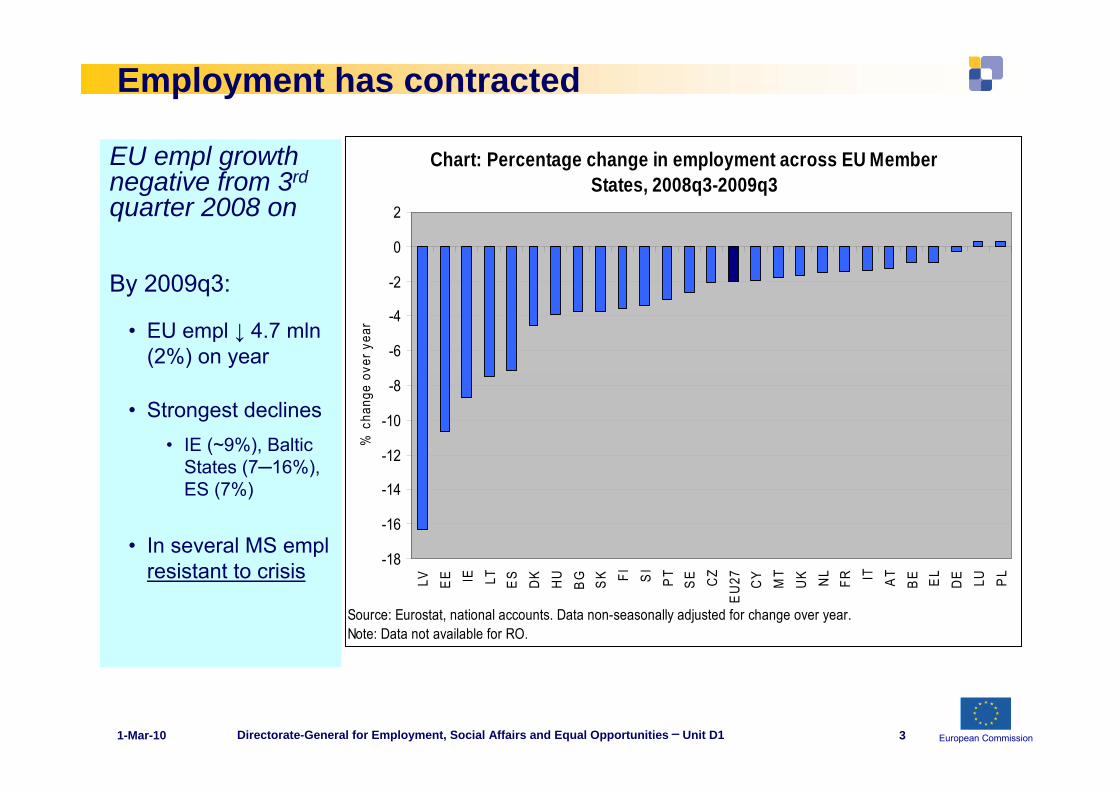
EU empl growth negative from 3rd
quarter 2008 on
By 2009q3:
• EU empl ↓ 4.7 mln(2%) on year
• Strongest declines• IE (~9%), Baltic
States (7─16%), ES (7%)
• In several MS emplresistant to crisis
Chart: Percentage change in employment across EU Member States, 2008q3-2009q3
-18
-16
-14
-12
-10
-8
-6
-4
-2
0
2
LV EE IE LT ES
DK
HU
BG SK FI SI
PT
SE CZ
EU
27 CY
MT
UK NL
FR IT AT
BE EL
DE LU PL
Source: Eurostat, national accounts. Data non-seasonally adjusted for change over year. Note: Data not available for RO.
% c
hang
e ov
er y
ear
European Commission1-Mar-10 Directorate-General for Employment, Social Affairs and Equal Opportunities ─ Unit D1 4
Employment response to falls in economic activity
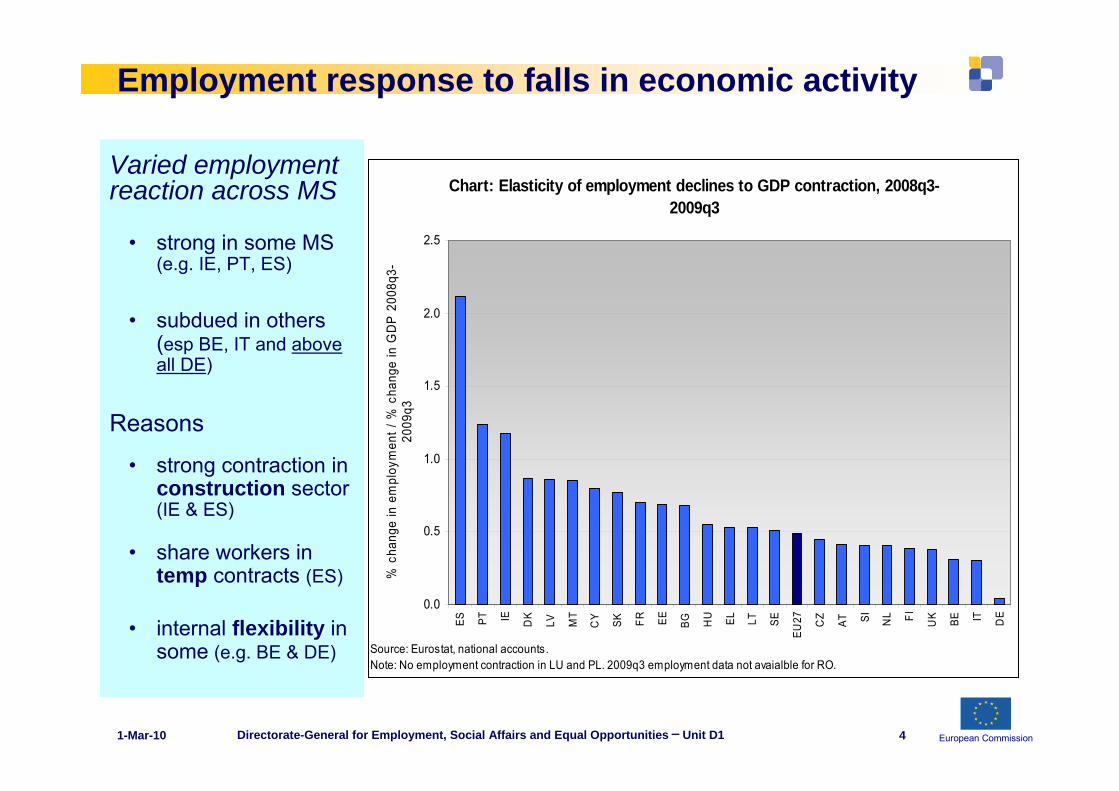
Varied employment reaction across MS
• strong in some MS (e.g. IE, PT, ES)
• subdued in others (esp BE, IT and above all DE)
Reasons
• strong contraction in construction sector(IE & ES)
• share workers in temp contracts (ES)
• internal flexibility in some (e.g. BE & DE)
Chart: Elasticity of employment declines to GDP contraction, 2008q3-2009q3
0.0
0.5
1.0
1.5
2.0
2.5
ES PT IE DK
LV MT
CY SK FR EE BG HU EL LT SE
EU27 CZ
AT SI NL FI UK BE IT DE
Source: Eurostat, national accounts. Note: No employment contraction in LU and PL. 2009q3 employment data not avaialble for RO.
% c
hang
e in
em
ploy
men
t / %
cha
nge
in G
DP
200
8q3-
2009
q3
European Commission1-Mar-10 Directorate-General for Employment, Social Affairs and Equal Opportunities ─ Unit D1 5
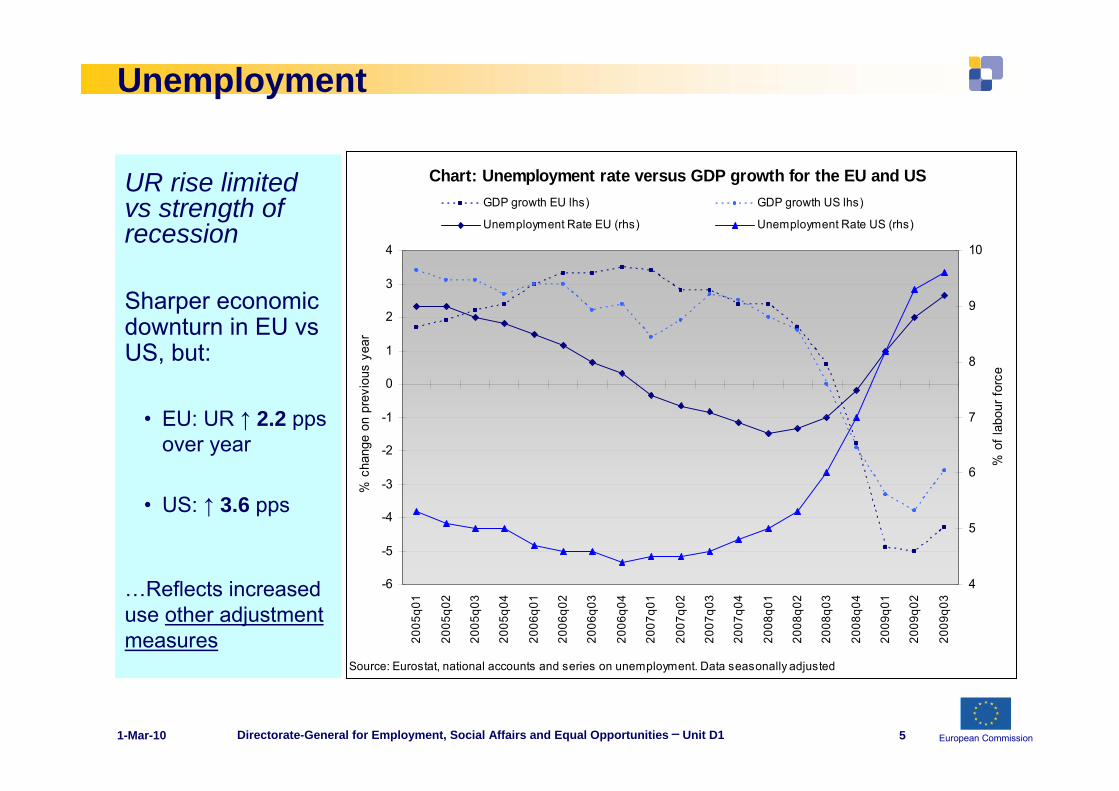
Unemployment
UR rise limited vs strength of recession
Sharper economic downturn in EU vsUS, but:
• EU: UR ↑ 2.2 ppsover year
• US: ↑ 3.6 pps
…Reflects increased use other adjustment measures
Chart: Unemployment rate versus GDP growth for the EU and US
-6
-5
-4
-3
-2
-1
0
1
2
3
4
2005
q01
2005
q02
2005
q03
2005
q04
2006
q01
2006
q02
2006
q03
2006
q04
2007
q01
2007
q02
2007
q03
2007
q04
2008
q01
2008
q02
2008
q03
2008
q04
2009
q01
2009
q02
2009
q03
Source: Eurostat, national accounts and series on unemployment. Data seasonally adjusted
% c
hang
e on
pre
viou
s ye
ar
4
5
6
7
8
9
10
% o
f lab
our f
orce
GDP growth EU lhs) GDP growth US lhs)
Unemployment Rate EU (rhs) Unemployment Rate US (rhs)
European Commission1-Mar-10 Directorate-General for Employment, Social Affairs and Equal Opportunities ─ Unit D1 6
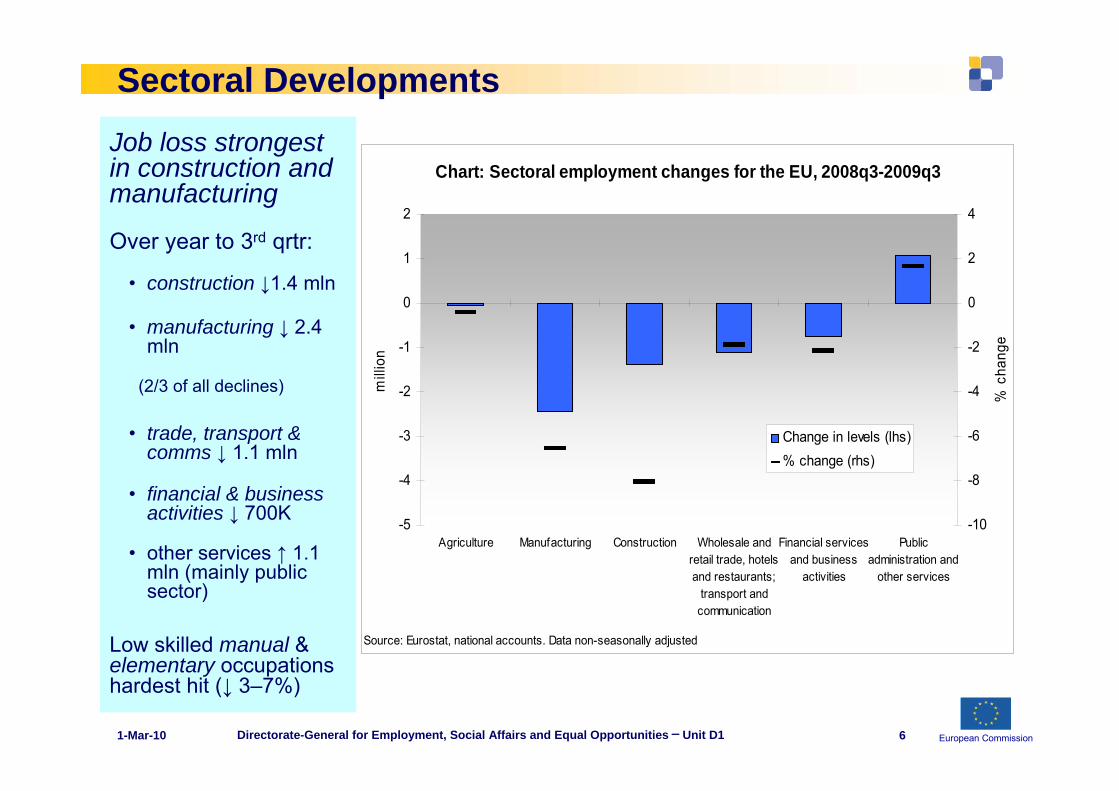
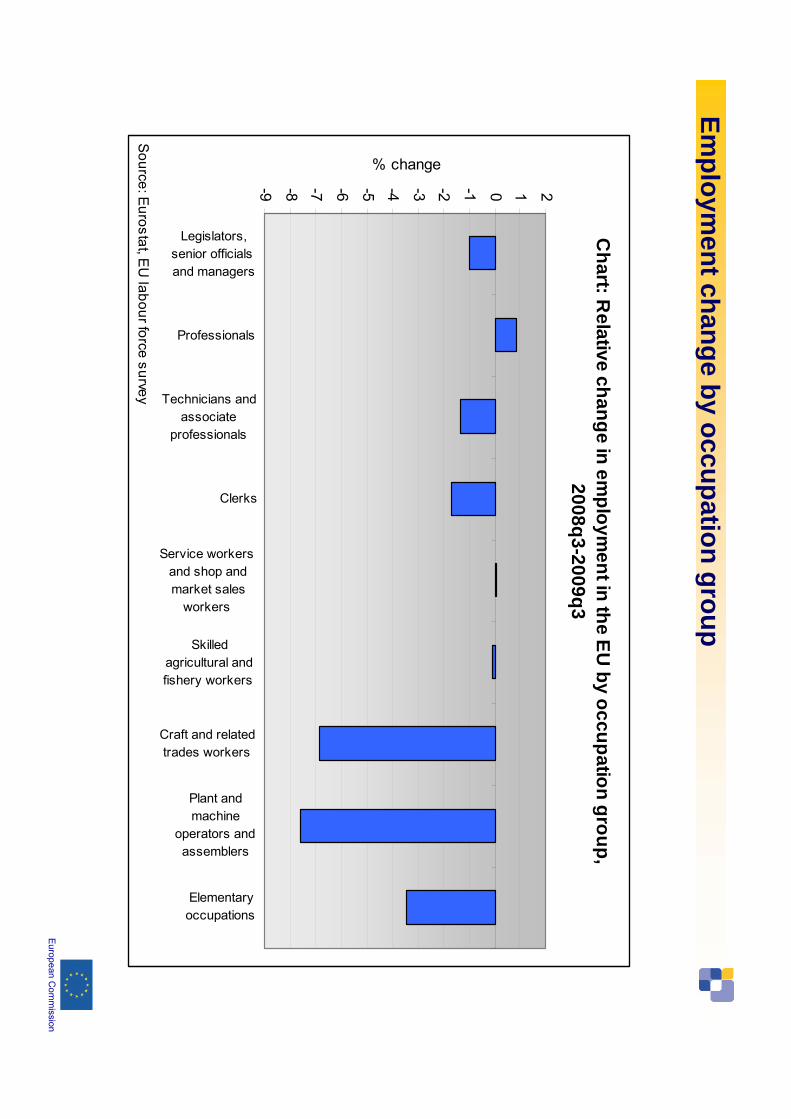
Sectoral DevelopmentsJob loss strongest in construction and manufacturing
Over year to 3rd qrtr:
• construction ↓1.4 mln
• manufacturing ↓ 2.4 mln
(2/3 of all declines)
• trade, transport & comms ↓ 1.1 mln
• financial & business activities ↓ 700K
• other services ↑ 1.1 mln (mainly public sector)
Low skilled manual & elementary occupations hardest hit (↓ 3–7%)
Chart: Sectoral employment changes for the EU, 2008q3-2009q3
-5
-4
-3
-2
-1
0
1
2
Agriculture Manufacturing Construction Wholesale andretail trade, hotelsand restaurants;
transport andcommunication
Financial servicesand business
activities
Publicadministration and
other services
Source: Eurostat, national accounts. Data non-seasonally adjusted
mill
ion
-10
-8
-6
-4
-2
0
2
4
% c
hang
e
Change in levels (lhs)% change (rhs)
European Commission1-Mar-10 Directorate-General for Employment, Social Affairs and Equal Opportunities ─ Unit D1
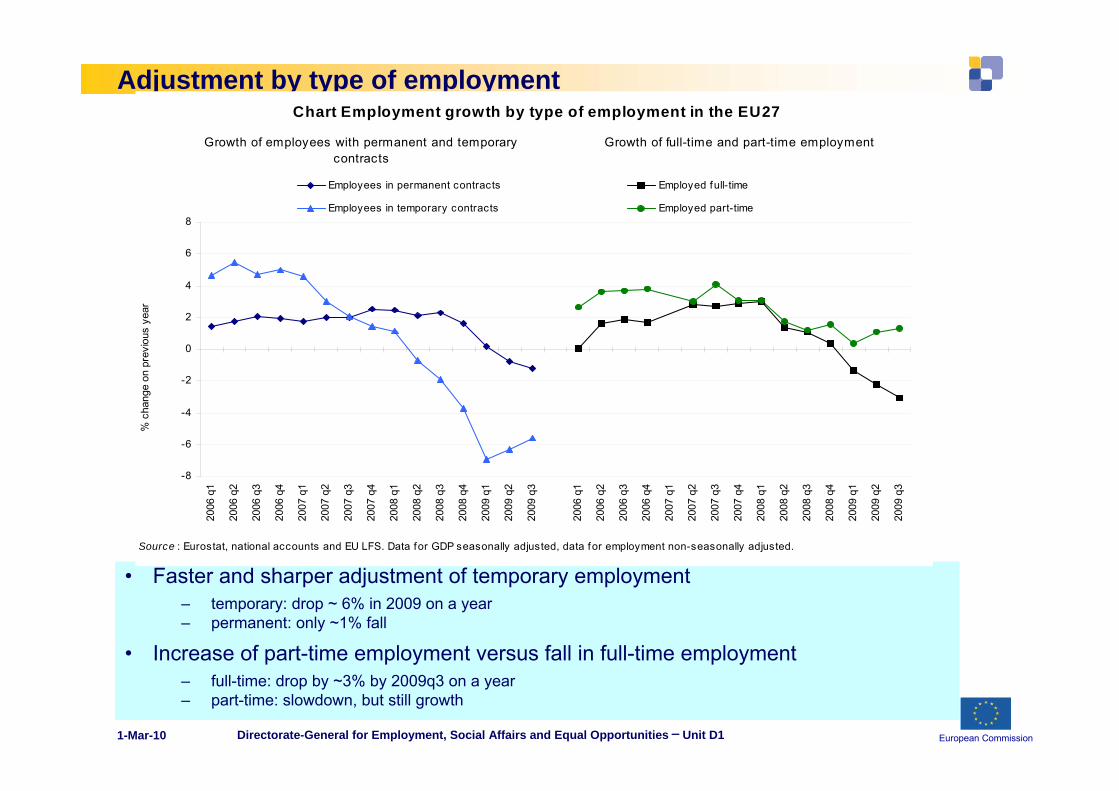
Adjustment by type of employment
• Faster and sharper adjustment of temporary employment– temporary: drop ~ 6% in 2009 on a year– permanent: only ~1% fall
• Increase of part-time employment versus fall in full-time employment– full-time: drop by ~3% by 2009q3 on a year– part-time: slowdown, but still growth
Chart Employment growth by type of employment in the EU27
-8
-6
-4
-2
0
2
4
6
820
06 q
1
2006
q2
2006
q3
2006
q4
2007
q1
2007
q2
2007
q3
2007
q4
2008
q1
2008
q2
2008
q3
2008
q4
2009
q1
2009
q2
2009
q3
2006
q1
2006
q2
2006
q3
2006
q4
2007
q1
2007
q2
2007
q3
2007
q4
2008
q1
2008
q2
2008
q3
2008
q4
2009
q1
2009
q2
2009
q3
% c
hang
e on
pre
viou
s ye
ar
Employees in permanent contracts Employed full-time
Employees in temporary contracts Employed part-time
Source : Eurostat, national accounts and EU LFS. Data for GDP seasonally adjusted, data for employment non-seasonally adjusted.
Growth of employees with permanent and temporary contracts
Growth of full-time and part-time employment
European Commission1-Mar-10 Directorate-General for Employment, Social Affairs and Equal Opportunities ─ Unit D1
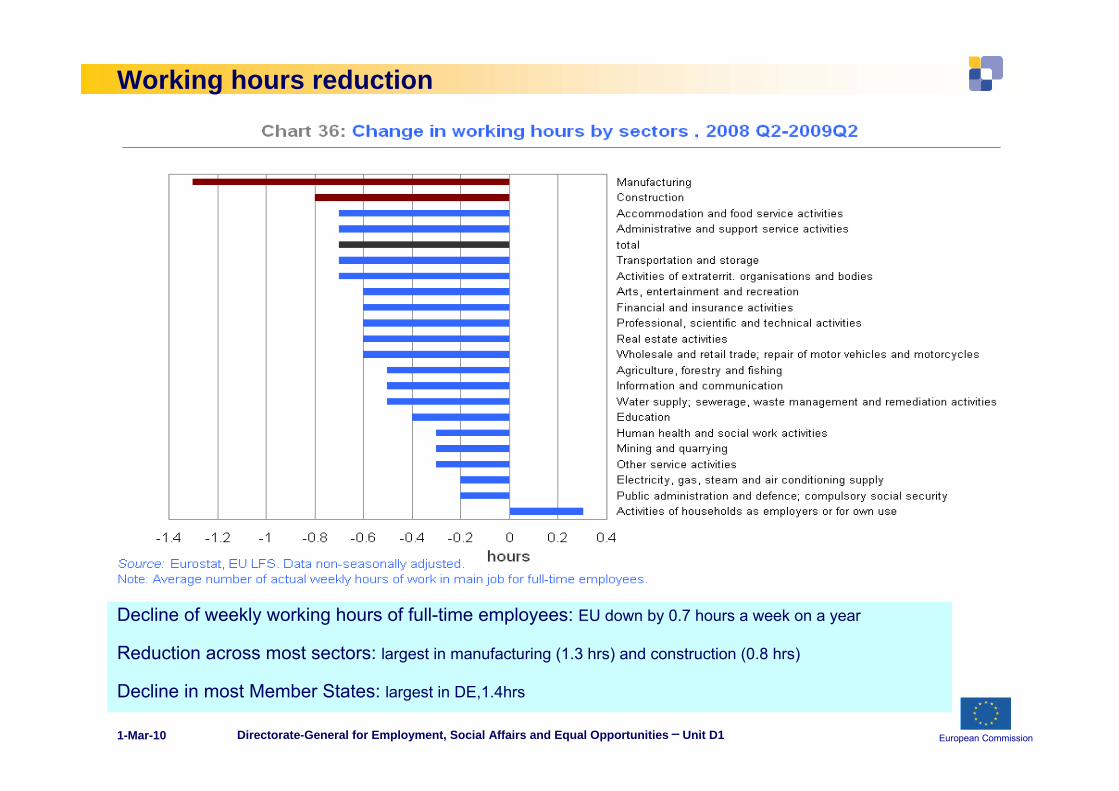
Working hours reduction
Decline of weekly working hours of full-time employees: EU down by 0.7 hours a week on a year
Reduction across most sectors: largest in manufacturing (1.3 hrs) and construction (0.8 hrs)
Decline in most Member States: largest in DE,1.4hrs
European Commission
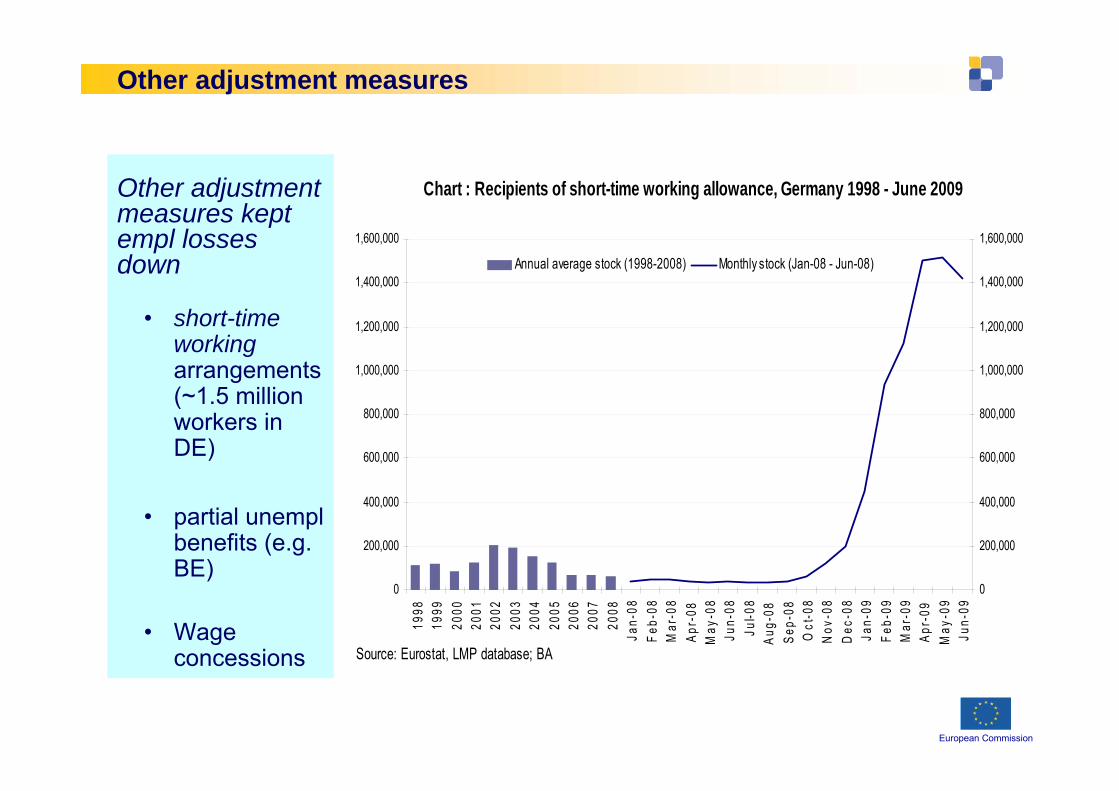
Other adjustment measures
Other adjustment measures kept empl losses down
• short-time workingarrangements (~1.5 million workers in DE)
• partial unemplbenefits (e.g. BE)
• Wage concessions
Chart : Recipients of short-time working allowance, Germany 1998 - June 2009
0
200,000
400,000
600,000
800,000
1,000,000
1,200,000
1,400,000
1,600,000
1998
1999
2000
2001
2002
2003
2004
2005
2006
2007
2008
Jan-
08Fe
b-08
Mar
-08
Apr-
08M
ay-0
8Ju
n-08
Jul-0
8Au
g-08
Sep-
08O
ct-0
8N
ov-0
8D
ec-0
8Ja
n-09
Feb-
09M
ar-0
9Ap
r-09
May
-09
Jun-
09
0
200,000
400,000
600,000
800,000
1,000,000
1,200,000
1,400,000
1,600,000
Annual average stock (1998-2008) Monthly stock (Jan-08 - Jun-08)
Source: Eurostat, LMP database; BA
European Commission1-Mar-10 Directorate-General for Employment, Social Affairs and Equal Opportunities ─ Unit D1 10
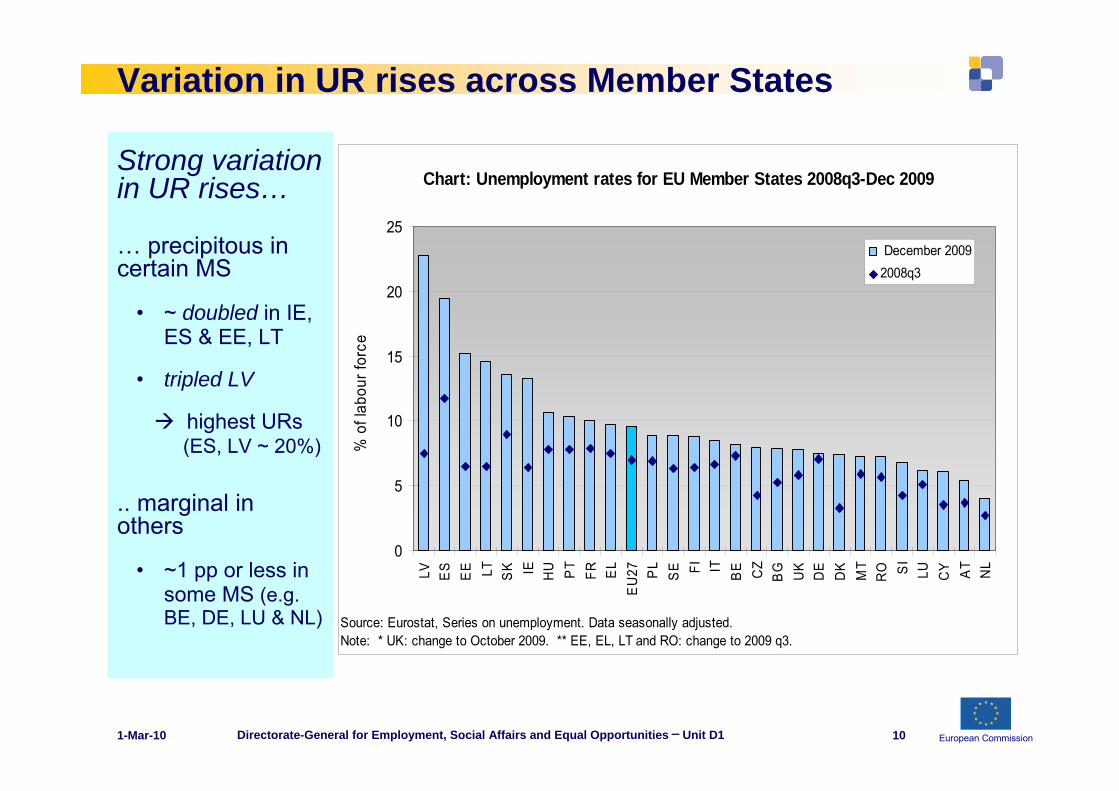
Variation in UR rises across Member States
Strong variation in UR rises…
… precipitous in certain MS
• ~ doubled in IE, ES & EE, LT
• tripled LV
highest URs(ES, LV ~ 20%)
.. marginal in others
• ~1 pp or less in some MS (e.g. BE, DE, LU & NL)
Chart: Unemployment rates for EU Member States 2008q3-Dec 2009
0
5
10
15
20
25
LV ES
EE LT SK IE HU PT
FR EL
EU
27 PL
SE FI IT BE CZ
BG UK
DE
DK
MT
RO S
ILU C
Y AT
NL
Source: Eurostat, Series on unemployment. Data seasonally adjusted. Note: * UK: change to October 2009. ** EE, EL, LT and RO: change to 2009 q3.
% o
f lab
our f
orce
December 20092008q3
European Commission1-Mar-10 Directorate-General for Employment, Social Affairs and Equal Opportunities ─ Unit D1 11
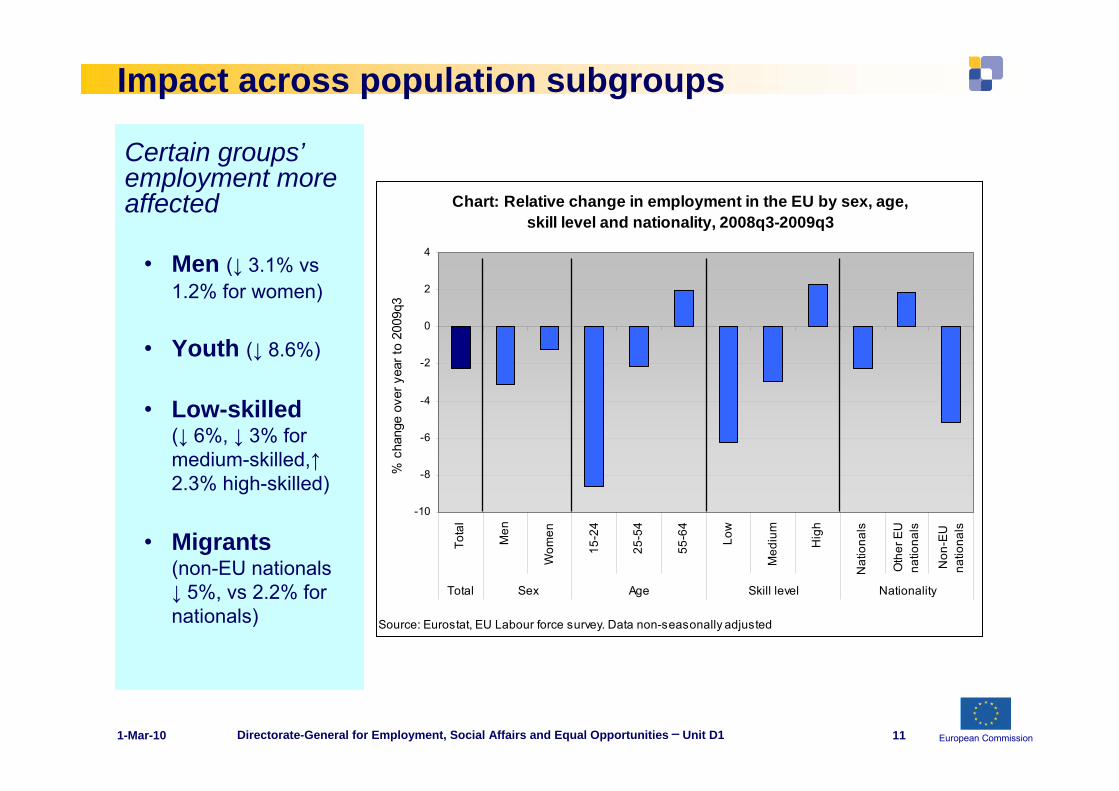
Impact across population subgroups
Certain groups’employment more affected
• Men (↓ 3.1% vs1.2% for women)
• Youth (↓ 8.6%)
• Low-skilled (↓ 6%, ↓ 3% for medium-skilled,↑2.3% high-skilled)
• Migrants (non-EU nationals ↓ 5%, vs 2.2% for nationals)
Chart: Relative change in employment in the EU by sex, age, skill level and nationality, 2008q3-2009q3
-10
-8
-6
-4
-2
0
2
4
Tota
l
Men
Wom
en
15-2
4
25-5
4
55-6
4
Low
Med
ium
Hig
h
Nat
iona
ls
Oth
er E
Una
tiona
ls
Non
-EU
natio
nals
Total Sex Age Skill level Nationality
Source: Eurostat, EU Labour force survey. Data non-seasonally adjusted
% c
hang
e ov
er y
ear t
o 20
09q3
European Commission
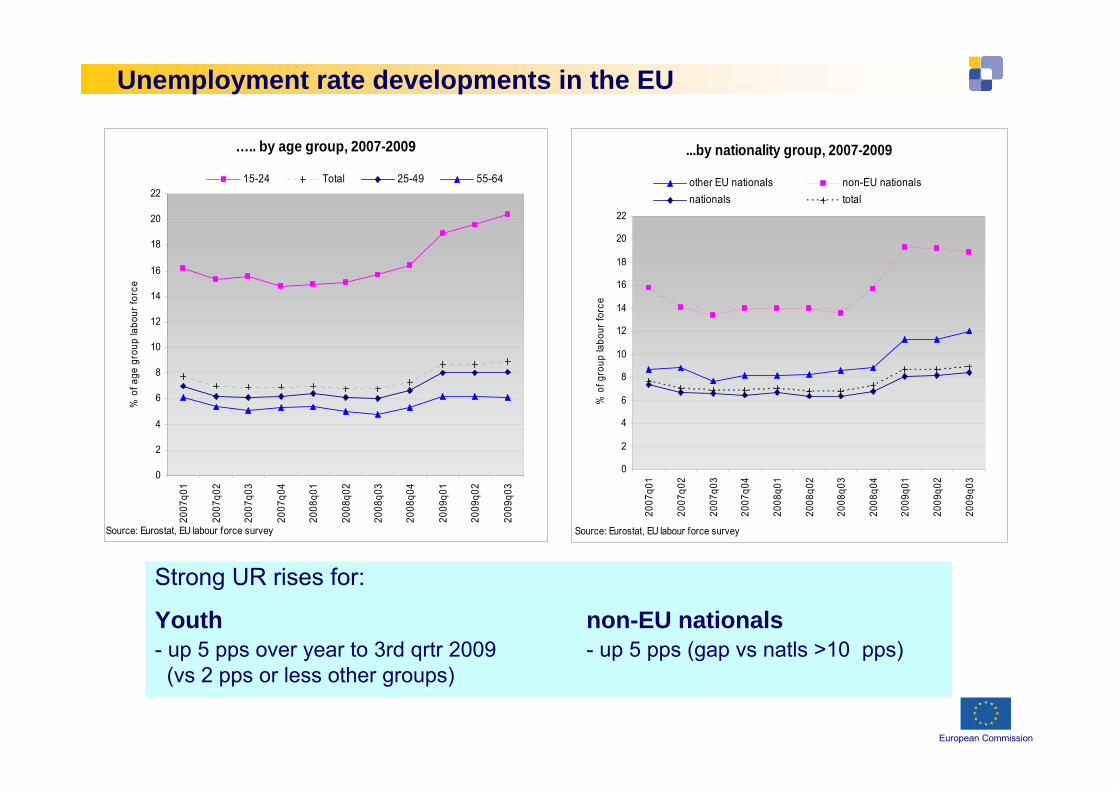
Unemployment rate developments in the EU
Strong UR rises for:
Youth non-EU nationals- up 5 pps over year to 3rd qrtr 2009 - up 5 pps (gap vs natls >10 pps)
(vs 2 pps or less other groups)
...by nationality group, 2007-2009
0
2
4
6
8
10
12
14
16
18
20
22
2007
q01
2007
q02
2007
q03
2007
q04
2008
q01
2008
q02
2008
q03
2008
q04
2009
q01
2009
q02
2009
q03
Source: Eurostat, EU labour force survey
% o
f gro
up la
bour
forc
e
other EU nationals non-EU nationalsnationals total
….. by age group, 2007-2009
0
2
4
6
8
10
12
14
16
18
20
2220
07q0
1
2007
q02
2007
q03
2007
q04
2008
q01
2008
q02
2008
q03
2008
q04
2009
q01
2009
q02
2009
q03
Source: Eurostat, EU labour force survey
% o
f age
gro
up la
bour
forc
e
15-24 Total 25-49 55-64
European Commission1-Mar-10 Directorate-General for Employment, Social Affairs and Equal Opportunities ─ Unit D1 13
Outlook
• Deterioration in EU LM moderating– UR rising more slowly since Aug ( 9.6% in Dec)
• but still strong for young people ( 21.4% in Dec)
• LM outlook remains unfavourable– UR expected to deteriorate further risk of strong rise in LTU
• Commission's autumn economic forecast
– EU empl: -1.2 % in 2010
– EU UR: up to 10.3% for 2010
– recovery likely to be modest (& job creation subdued)
European Commission1-Mar-10 Directorate-General for Employment, Social Affairs and Equal Opportunities ─ Unit D1 14
Conclusions
1. Most severe recession since WWII, clearly impacted on LMs
2. Effect on LM less than feared, in part due to adjustment through flexible working arrangements and nominal wage concessions
3. Unemployment has grown strongly – but severity of the increase varies widely across countries
4. Crisis has affected some groups more than others (youth, low-skilled, migrants, men, mainly those on temp contracts)
5. LM deterioration moderating, but further employment losses expected, while job creation for the EU as a whole likely to be subdued in the recovery
European Commission1-Mar-10 Directorate-General for Employment, Social Affairs and Equal Opportunities ─ Unit D1 15
Thank you for your attention

European Commission
European Commission1-Mar-10 Directorate-General for Employment, Social Affairs and Equal Opportunities ─ Unit D1 17
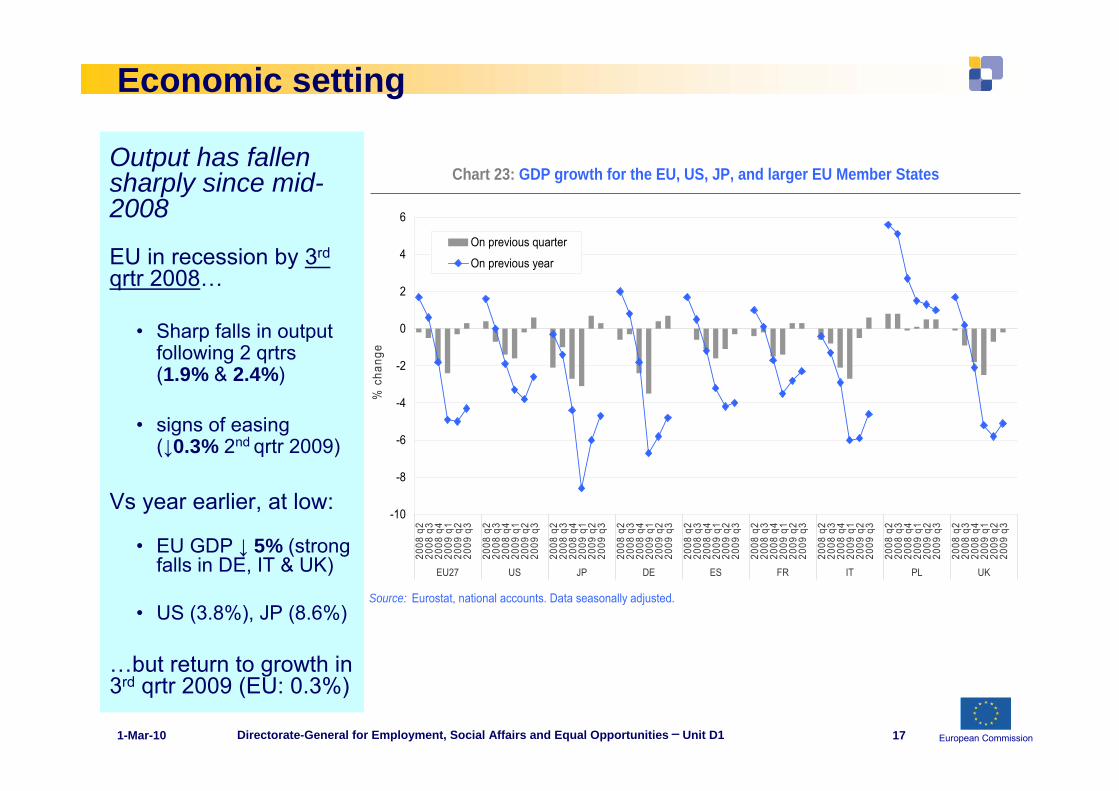
Economic setting
Output has fallen sharply since mid-2008
EU in recession by 3rd
qrtr 2008…
• Sharp falls in output following 2 qrtrs(1.9% & 2.4%)
• signs of easing (↓0.3% 2nd qrtr 2009)
Vs year earlier, at low:
• EU GDP ↓ 5% (strong falls in DE, IT & UK)
• US (3.8%), JP (8.6%)
…but return to growth in 3rd qrtr 2009 (EU: 0.3%)
Chart 23: GDP growth for the EU, US, JP, and larger EU Member States
-10
-8
-6
-4
-2
0
2
4
6
2008
q2
2008
q3
2008
q4
2009
q1
2009
q2
2009
q3
2008
q2
2008
q3
2008
q4
2009
q1
2009
q2
2009
q3
2008
q2
2008
q3
2008
q4
2009
q1
2009
q2
2009
q3
2008
q2
2008
q3
2008
q4
2009
q1
2009
q2
2009
q3
2008
q2
2008
q3
2008
q4
2009
q1
2009
q2
2009
q3
2008
q2
2008
q3
2008
q4
2009
q1
2009
q2
2009
q3
2008
q2
2008
q3
2008
q4
2009
q1
2009
q2
2009
q3
2008
q2
2008
q3
2008
q4
2009
q1
2009
q2
2009
q3
2008
q2
2008
q3
2008
q4
2009
q1
2009
q2
2009
q3
EU27 US JP DE ES FR IT PL UK
Source: Eurostat, national accounts. Data seasonally adjusted.
% c
hang
e
On previous quarter
On previous year
European C
omm
ission
Employm
ent change by occupation group
Chart: R
elative change in employm
ent in the EU by occupation group,
2008q3-2009q3
-9 -8 -7 -6 -5 -4 -3 -2 -1 0 1 2Legislators,
senior officialsand managers
Professionals
Technicians andassociate
professionals
Clerks
Service workersand shop andmarket sales
workers
Skilledagricultural andfishery workers
Craft and relatedtrades workers
Plant andmachine
operators andassemblers
Elementaryoccupations
Source: Eurostat, EU
labour force survey
% change
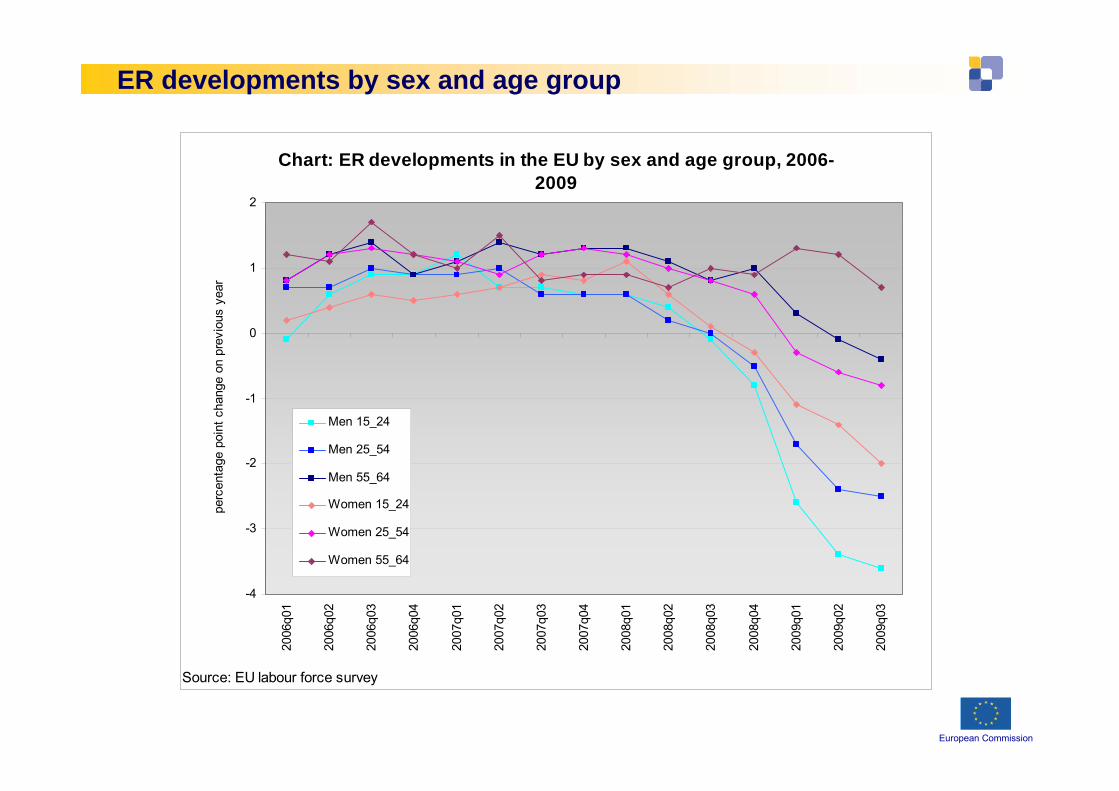
European Commission
ER developments by sex and age group
Chart: ER developments in the EU by sex and age group, 2006-2009
-4
-3
-2
-1
0
1
2
2006
q01
2006
q02
2006
q03
2006
q04
2007
q01
2007
q02
2007
q03
2007
q04
2008
q01
2008
q02
2008
q03
2008
q04
2009
q01
2009
q02
2009
q03
Source: EU labour force survey
perc
enta
ge p
oint
cha
nge
on p
revi
ous
year
Men 15_24
Men 25_54
Men 55_64
Women 15_24
Women 25_54
Women 55_64
European Commission1-Mar-10 Directorate-General for Employment, Social Affairs and Equal Opportunities ─ Unit D1 20
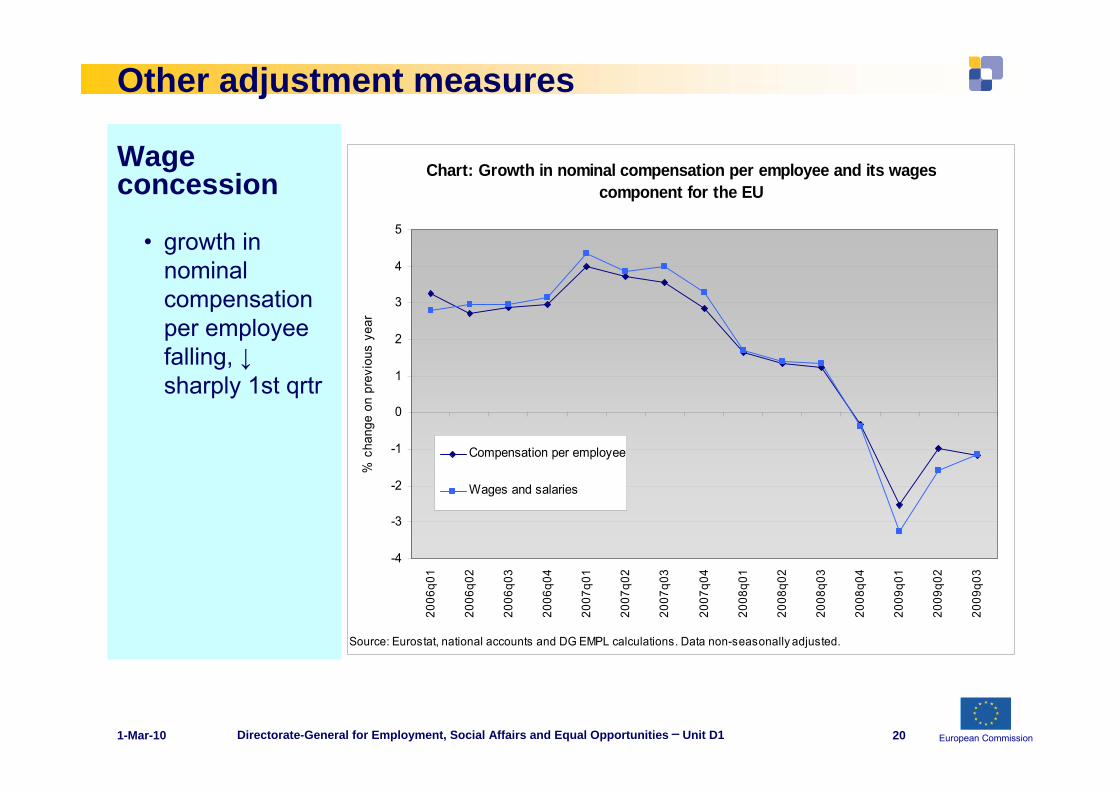
Other adjustment measures
Wage concession
• growth in nominal compensation per employee falling, ↓sharply 1st qrtr
Chart: Growth in nominal compensation per employee and its wages component for the EU
-4
-3
-2
-1
0
1
2
3
4
5
2006
q01
2006
q02
2006
q03
2006
q04
2007
q01
2007
q02
2007
q03
2007
q04
2008
q01
2008
q02
2008
q03
2008
q04
2009
q01
2009
q02
2009
q03
Source: Eurostat, national accounts and DG EMPL calculations. Data non-seasonally adjusted.
% c
hang
e on
pre
viou
s ye
ar
Compensation per employee
Wages and salaries
European Commission
European Commission1-Mar-10 Directorate-General for Employment, Social Affairs and Equal Opportunities ─ Unit D1 22
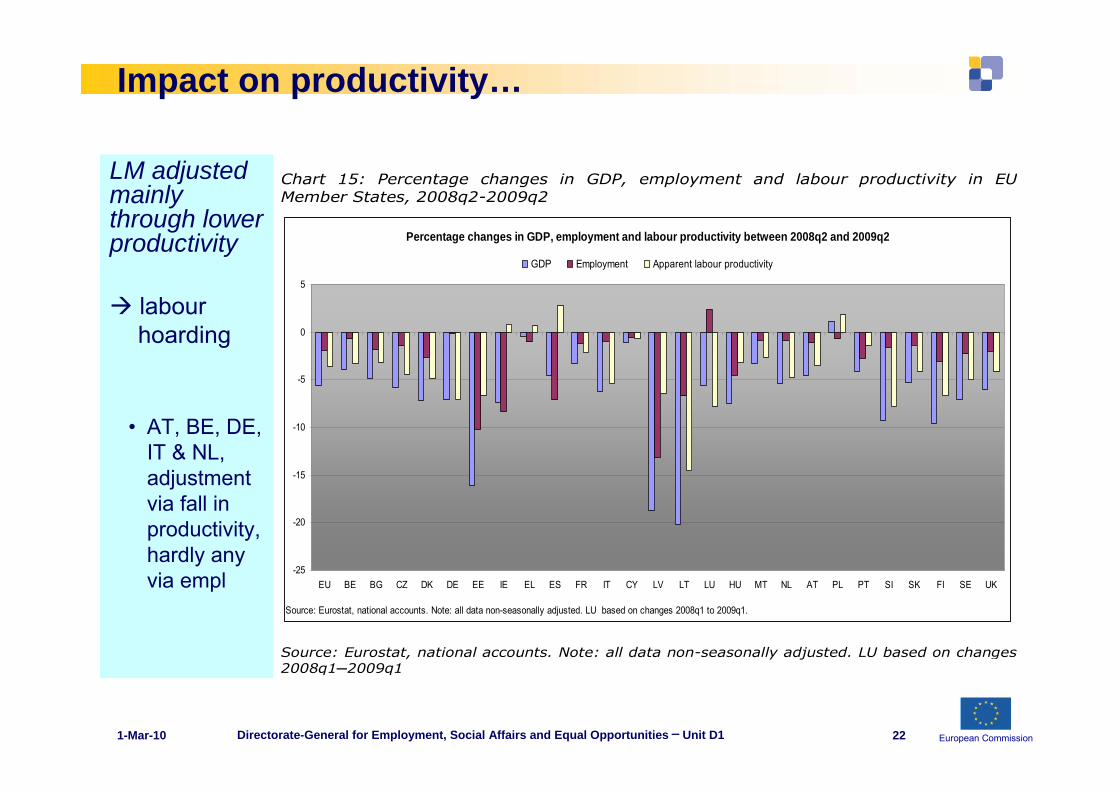
Impact on productivity…
LM adjusted mainly through lower productivity
labour hoarding
• AT, BE, DE, IT & NL, adjustment via fall in productivity, hardly any via empl
Chart 15: Percentage changes in GDP, employment and labour productivity in EU Member States, 2008q2-2009q2
Percentage changes in GDP, employment and labour productivity between 2008q2 and 2009q2
-25
-20
-15
-10
-5
0
5
EU BE BG CZ DK DE EE IE EL ES FR IT CY LV LT LU HU MT NL AT PL PT SI SK FI SE UK
Source: Eurostat, national accounts. Note: all data non-seasonally adjusted. LU based on changes 2008q1 to 2009q1.
GDP Employment Apparent labour productivity
Source: Eurostat, national accounts. Note: all data non-seasonally adjusted. LU based on changes 2008q1─2009q1
European Commission1-Mar-10 Directorate-General for Employment, Social Affairs and Equal Opportunities ─ Unit D1 23
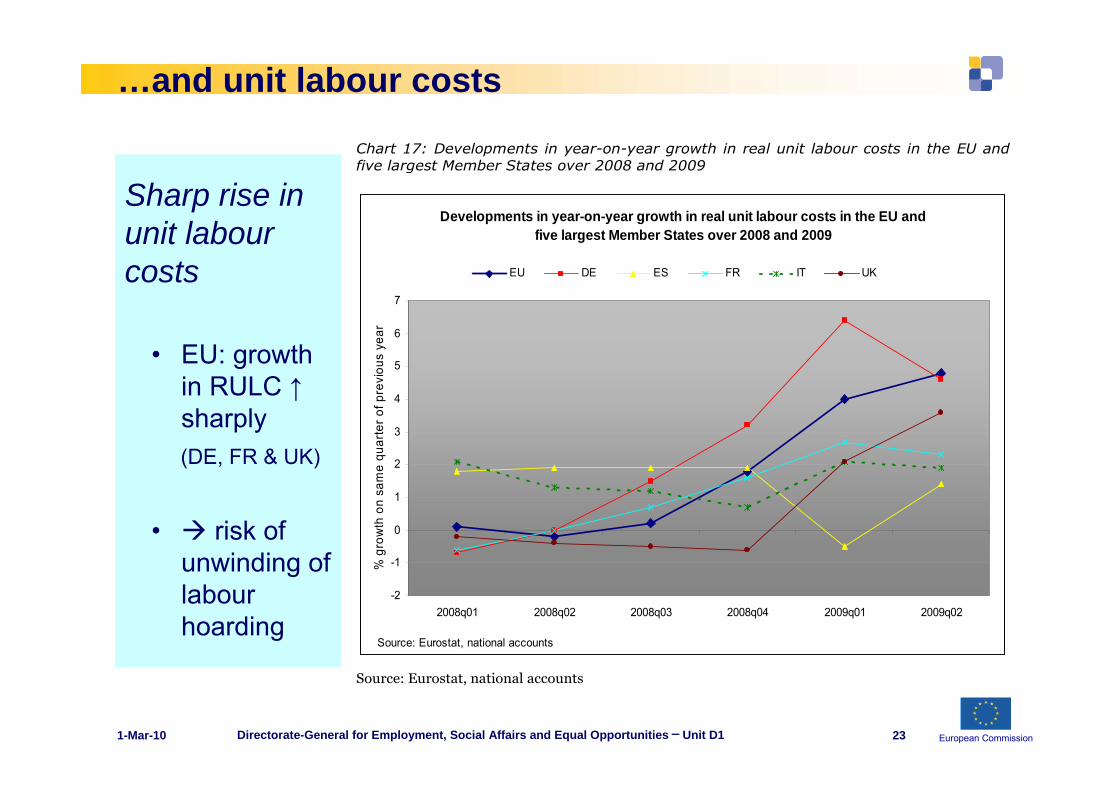
…and unit labour costs
Sharp rise in unit labour costs
• EU: growth in RULC ↑sharply (DE, FR & UK)
• risk of unwinding of labour hoarding
Chart 17: Developments in year-on-year growth in real unit labour costs in the EU and five largest Member States over 2008 and 2009
Developments in year-on-year growth in real unit labour costs in the EU and five largest Member States over 2008 and 2009
-2
-1
0
1
2
3
4
5
6
7
2008q01 2008q02 2008q03 2008q04 2009q01 2009q02
Source: Eurostat, national accounts
% g
row
th o
n sa
me
quar
ter o
f pre
viou
s ye
ar
EU DE ES FR IT UK
Source: Eurostat, national accounts
European Commission1-Mar-10 Directorate-General for Employment, Social Affairs and Equal Opportunities ─ Unit D1 24
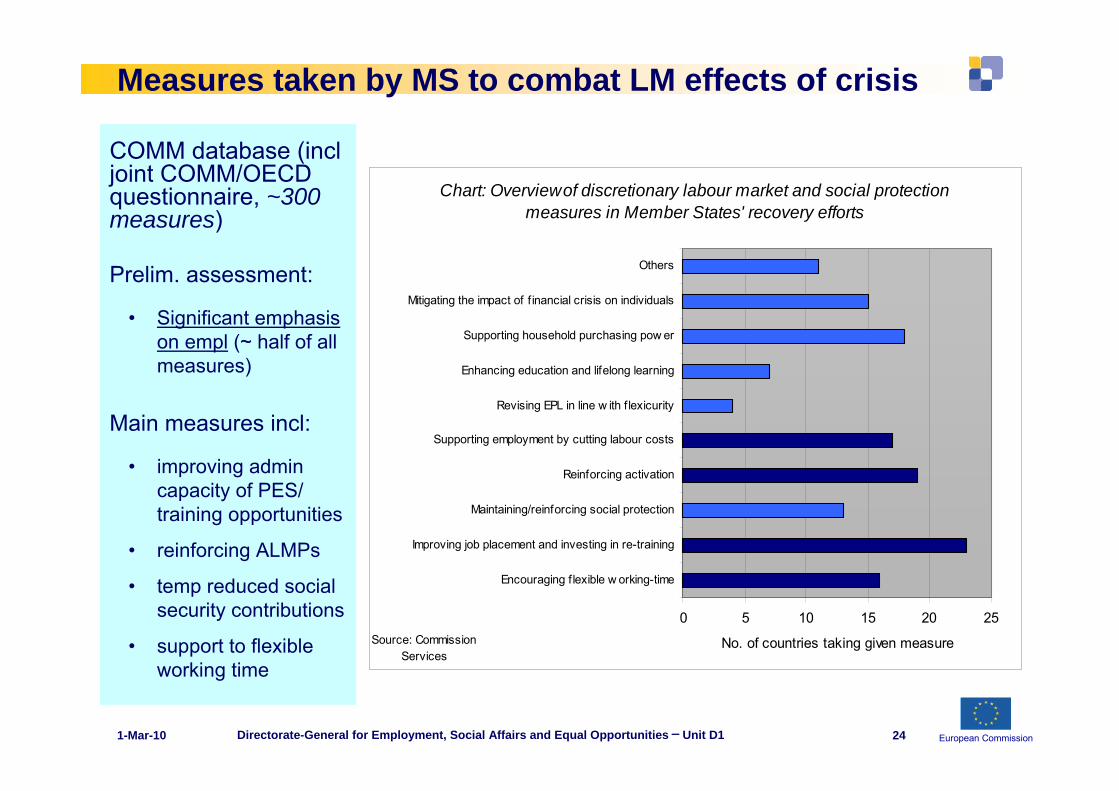
Measures taken by MS to combat LM effects of crisis
COMM database (incljoint COMM/OECD questionnaire, ~300 measures)
Prelim. assessment:
• Significant emphasis on empl (~ half of allmeasures)
Main measures incl:
• improving admin capacity of PES/ training opportunities
• reinforcing ALMPs
• temp reduced social security contributions
• support to flexible working time
Chart: Overview of discretionary labour market and social protection measures in Member States' recovery efforts
0 5 10 15 20 25
Encouraging f lexible w orking-time
Improving job placement and investing in re-training
Maintaining/reinforcing social protection
Reinforcing activation
Supporting employment by cutting labour costs
Revising EPL in line w ith f lexicurity
Enhancing education and lifelong learning
Supporting household purchasing pow er
Mitigating the impact of f inancial crisis on individuals
Others
Source: Commission Services
No. of countries taking given measure
European Commission1-Mar-10 Directorate-General for Employment, Social Affairs and Equal Opportunities ─ Unit D1 25
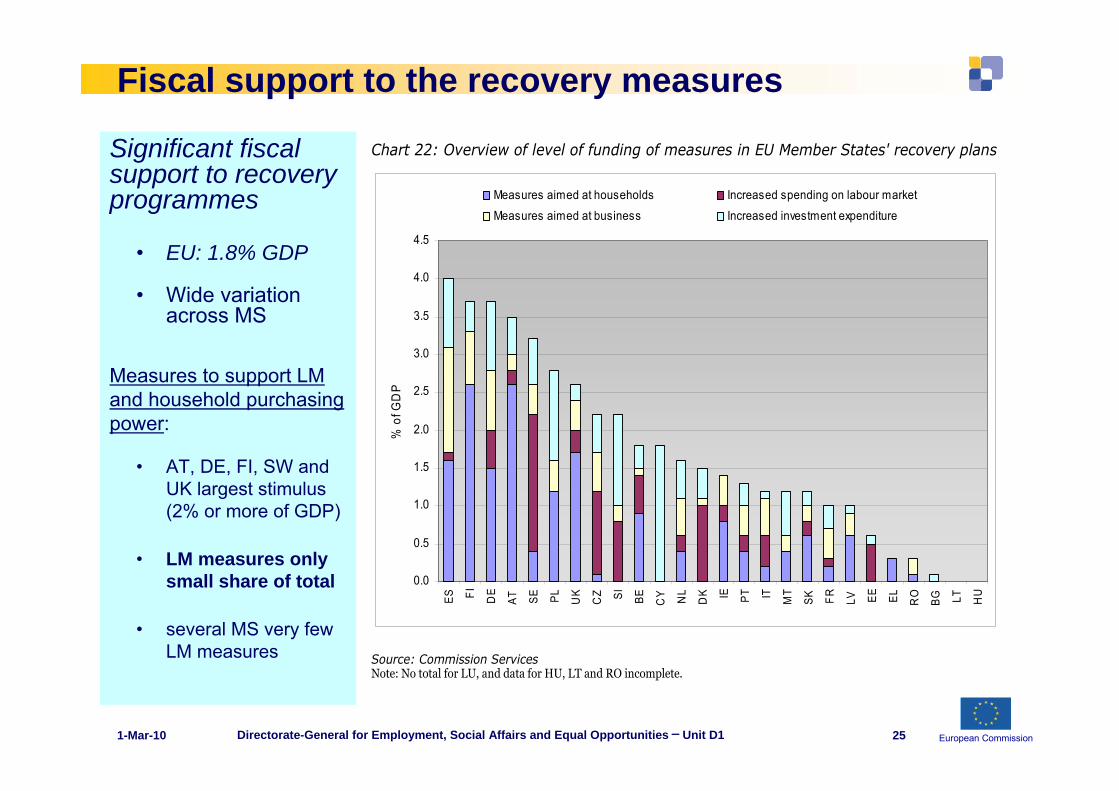
Fiscal support to the recovery measures
Significant fiscal support to recovery programmes
• EU: 1.8% GDP
• Wide variation across MS
Measures to support LM and household purchasing power:
• AT, DE, FI, SW and UK largest stimulus (2% or more of GDP)
• LM measures only small share of total
• several MS very few LM measures
Chart 22: Overview of level of funding of measures in EU Member States' recovery plans
0.0
0.5
1.0
1.5
2.0
2.5
3.0
3.5
4.0
4.5
ES FI DE
AT SE PL UK
CZ SI BE CY NL
DK IE PT IT MT
SK FR LV EE EL RO
BG LT HU
% o
f GD
P
Measures aimed at households Increased spending on labour market
Measures aimed at business Increased investment expenditure
Source: Commission Services Note: No total for LU, and data for HU, LT and RO incomplete.
European Commission1-Mar-10 Directorate-General for Employment, Social Affairs and Equal Opportunities ─ Unit D1
EU initiatives to mitigate crisis
European Economic Recovery Plan (EERP)Communication “Driving European Recovery”Employment Summit on 7th MayCommunication “A shared commitment for employment”Mobilising EU founding
– €200 billion recovery package– changes in European Social Fund and in European Globalisation
Adjustment Fund– new micro-finance facility
Promoting employment continues– EURES– New skills for new jobs initiative– European Employment Strategy as part of Strategy for Growth and
Jobs– Monthly monitoring reports