Embed Size (px)
Citation preview

EU Pollinators Initiative
Summary of the results of the Public Consultation
Environment

Neither the European Commission nor any person acting on behalf of the Commission is responsible for the use that might be made of the following information.
Luxembourg: Publications Office of the European Union, 2018
© European Union, 2018Reuse is authorised provided the source is acknowledged. The reuse policy of European Commission documents is regulated by Decision 2011/833/EU (OJ L 330, 14.12.2011, p. 39).For any use or reproduction of photos or other material that is not under the EU copyright, permission must be sought directly from the copyright holders.
PDF ISBN 978-92-79-86630-2 KH-03-18-007-EN-N doi:10.2779/795085
Getting in touch with the EUIn personAll over the European Union there are hundreds of Europe Direct information centres. You can find the address of the centre nearest you at: https://europa.eu/european-union/contact_enOn the phone or by emailEurope Direct is a service that answers your questions about the European Union. You can contact this service:– by freephone: 00 800 6 7 8 9 10 11 (certain operators may charge for these calls),– at the following standard number: +32 22999696 or– by email via: https://europa.eu/european-union/contact_enFinding information about the EUOnlineInformation about the European Union in all the official languages of the EU is available on the Europa website at: https://europa.eu/european-union/index_enEU publications You can download or order free and priced EU publications at: https://publications.europa.eu/en/publications. Multiple copies of free publications may be obtained by contacting Europe Direct or your local information centre (see https://europa.eu/european-union/contact_en).EU law and related documentsFor access to legal information from the EU, including all EU law since 1952 in all the official language versions, go to EUR-Lex at: http://eur-lex.europa.euOpen data from the EUThe EU Open Data Portal (http://data.europa.eu/euodp/en) provides access to datasets from the EU. Data can be downloaded and reused for free, both for commercial and non-commercial purposes.

1
Table of content
1 Introduction ................................................................................................................................................................. 2
2 Methodology ................................................................................................................................................................ 3
3 General information about the respondents ............................................................................................................... 4
3.1 Country of respondents ...................................................................................................................................... 4
3.2 Distribution of individual and organisational respondents ................................................................................. 5
3.3 Specific information about the respondents: Individuals ................................................................................... 6
3.4 Specific information about the respondents: Organisations .............................................................................. 7
3.5 Summary of responses by country and stakeholder group .............................................................................. 10
4 Pollinators and their role ........................................................................................................................................... 12
4.1 Q1. How well do you consider yourself informed about pollinators: their importance, status and trends, and the threats they are facing? ........................................................................................................................................... 12
4.2 Q2. What are your main sources of information on pollinators? ..................................................................... 13
4.3 Q3. The importance of pollinators .................................................................................................................... 15
4.4 Q4. In your opinion, how do the potential costs of pollinator protection compare with the socio-economic benefits that they provide? ............................................................................................................................................ 18
4.5 Q5. Both wild and domesticated pollinators pollinate agricultural crops in the EU. In your opinion, how do their respective contributions to crop pollination compare? ........................................................................................ 19
5 The decline of pollinators, its causes and consequences........................................................................................... 21
5.1 Q6. In your opinion, the current decline of pollinators in abundance and diversity is ..................................... 21
5.2 Q7. The causes of pollinator decline ................................................................................................................. 22
5.3 Q8. To which extent do you consider that the decline of pollinators affects you in your private life? ............ 28
5.4 Q9. To which extent do you consider that the decline of pollinators affects you professionally? ................... 29
6 How to halt the decline of pollinators ....................................................................................................................... 30
6.1 Q10. In your opinion, how do EU policies currently address the decline of pollinators? ................................. 30
6.2 Q11. In your opinion, how do the policies of your country or region currently address the decline of pollinators? ..................................................................................................................................................................... 31
6.3 Q12. In your opinion, how much should the efforts to halt the decline of pollinators be stepped up at the following levels? ............................................................................................................................................................. 32
6.4 Q13. In your opinion, how important is it to include the following actions in the EU Pollinators Initiative? ... 35
6.4.1 Pillar I: Actions to improve knowledge ..................................................................................................... 35
6.4.2 Pillar II: Actions to tackle the causes of decline ........................................................................................ 37
6.4.3 Pillar III: Actions to raise awareness, improve collaboration and knowledge sharing ............................. 43
7 Open question ............................................................................................................................................................ 45
7.1 Individual responses to the open question ....................................................................................................... 45
7.2 Agri-food sector responses to the open question ............................................................................................. 45
7.3 Nature & Environment sector responses to the open question ....................................................................... 46
7.4 Apiculture sector responses to the open question ........................................................................................... 47
7.5 Other sectors responses to the open question ................................................................................................. 47

2
1 Introduction
The public consultation on the EU Pollinators Initiative was launched on 11 January 2018 and closed on 5 April 2018. It was open to all interested citizens and interest groups and available on EU survey in 23 EU languages. The questionnaire included 13 closed questions and respondents could provide comments in one open question with a maximum of 2000 characters, as well as submit supporting documents. This report provides a summary of the answers to each question.
Section 2 discusses the methodology that has been used to analyse the responses to the survey.
Section 3 provides an overview of the profile of the respondents who participated to the consultation and explains the grouping of stakeholders for the analysis of the results.
Section 4, 5 and 6 provide a summary of the results to each question. Each closed question contains a textbox with the main observations on differences or similarities in the answers by the various stakeholder groups, the most frequently selected options, and some key outcomes. In addition, the results of each closed question are presented through a graph showing the outcomes in percentages as well as through a table that shows the frequency by which options were selected according to the different stakeholder groups.
Section 7 presents key results and a summary of the topics covered by the respondents in the open question.

3
2 Methodology
A total of 66 579 replies were received through EU survey. The replies were analysed using the European Commission’s internal DORIS tool, EU survey, and Excel. Respondents also submitted 112 position papers.
To identify duplicates in the public consultation, first and last names were cross referenced with email addresses, as identical first and last names does not signify a respondent has submitted a survey twice. Of the total number of respondents, 26 duplicates were identified and removed from the results.
For the purpose of the analysis, the respondents were categorized in five broad stakeholder groups: individuals and four broad sector groups for organisations (agri-food sector, nature & environment sector, apiculture and other).
38 381 replies to the open question were submitted. 5% of these were analysed including 1789 comments from individuals, 155 from the agri-food sector, 260 from the nature & environment sector, 136 from the apiculture sector and 140 comments from other sectors. The analysis was done as follows:
Samples were randomly selected
Responses were then read, and grouped into one of four possible categories: o Responses were placed into Category A if the response discussed a lack of, or
recommended improvement on, knowledge of any kind related to pollinators, o Category B if the response discussed a lack of, or recommended improvement on,
awareness raising and collaboration, o Category C-A if the response discussed a lack of, or recommended action on tackling the
causes of decline and, o Category C-B if the response discussed the impact of pesticides on pollinators
The replies to the open question were screened for potential public campaigns using DORIS. A public campaign is defined as a number of identical replies to the questions, which were coordinated. In line with the European Commission’s Better Regulation Toolbox1, the threshold for exclusion of campaigns was put at 10 observations, meaning a campaign contains more than 10 replies with similar content.
Table 2.1: Overview of identified public campaigns in the open question
Campaign ID Main country of campaign Number of observations
1 UK 12
2 UK 10
3 UK, various 22
4 Belgium 15
Total observations 59
The main campaign keywords as identified by DORIS were:
pollinator (370), bee (311), neonicotinoids (184), support (151), wild (145), agricultural (137), ban (132), pesticide (123), decline (116), insect (107), include (82), protection (81), policy (79), reverse (77), full (67), full ban (67), plant protection products (ppps) (65), European (64), action (59), honey (53), measure (53), great (52), currently (50), area (48), negative (47), specie (47), harm (47), wide (46), organic (45), rdps (43), pose (43), food (43), harming (43), commission (42), member (42), payment (41), farming (41), harming neonicotinoids (41), pollination (40), practice (40), domesticated (40), crop (39), habitat (39), flower (38), wild bee (38), environmental (37), pollinate (37), essential (37) long-term (30),
1 https://ec.europa.eu/info/better-regulation-toolbox_en

4
3 General information about the respondents
Most respondents indicated Germany as their country of residence, followed by France, the UK, Italy, Belgium, the Netherlands, Spain and Austria (Table 3.1 and Figure 3.1).
3.1 Country of respondents
Table 3.1. Respondents by country (frequency and %)
Country of residence Frequency Percentage
Austria 2729 4.10 %
Belgium 4852 7.29 %
Bulgaria 196 0.29 %
Croatia 168 0.25 %
Cyprus 43 0.06 %
Czech Republic 147 0.22 %
Denmark 610 0.92 %
Estonia 164 0.25 %
Finland 301 0.45 %
France 11292 16.96 %
Germany 18058 27.12 %
Greece 175 0.26 %
Hungary 185 0.28 %
Ireland 935 1.40 %
Italy 6526 9.80 %
Latvia 52 0.08 %
Lithuania 67 0.10 %
Luxembourg 205 0.31 %
Malta 78 0.12 %
Netherlands 4402 6.61 %
Poland 414 0.62 %
Portugal 472 0.71 %
Romania 157 0.24 %
Slovak Republic 177 0.27 %
Slovenia 267 0.40 %
Spain 4267 6.41 %
Sweden 1244 1.87 %
United Kingdom 8197 12.31 %
Other 199 0.30 %
Total 66579 100%

5
Figure 3.1: Replies by country (frequency)
3.2 Distribution of individual and organisational respondents Figure 3.2 and Table 3.2 show that 98% of all replies came from individuals and 2% from organisations or on behalf of an organisation from various sectors.
Figure 3.2: Distribution of respondents (in %) Table 3.2 Distribution of respondents (frequency and %)
Respondent Frequency Percentage
Individuals 65190 98%
Organisations 1389 2%
Total 66579 100%

6
3.3 Specific information about the respondents: Individuals
Figure 3.3a shows that slightly more than half (56%) of the individual respondents live in urban areas. The majority of individuals (59%) were involved in farming or gardening activities on a personal capacity as shown in Figure 3.3b. However, Figure 3.3c shows that only 11% participated in voluntary data collection schemes related to pollinators. Almost half of those (43%) that have not participated in such activities indicated that they would consider participation in the future (Figure 3.3d). Figure 3.3: Specific information about individual respondents (in %)
a. Do you live in an urban or rural area? b. Are you involved in farming or gardening in your personal capacity?
c. Do you participate in a voluntary collection of scientific data (citizen science) related to pollinators?
d. If "no", would you consider participating in such activities in the future?

7
3.4 Specific information about the respondents: Organisations
Most organisations were private enterprises, followed by NGOs, research and academia, and others, as shown in Table 3.3 and Figure 3.4.
Table 3.3: Replies by type of organisation (frequency and %)
Type of organisation Frequency Percentage
Private enterprise 398 28.65 %
NGO, platform or network 297 21.38 %
Research & academia 184 13.25 %
Other 176 12.67 %
Trade, business or professional association
116 8.35 %
Professional consultancy, law firm, self-employed consultant
83 5.98 %
Regional or local authority 72 5.18 %
National public authority 35 2.52 %
International organisation 22 1.58 %
Churches and religious communities
6 0.43 %
Figure 3.4: Replies by type of organisation (in %)

8
Table 3.4 shows that while most respondents from organisations chose not to indicate their size (71%), those that did were mostly self-employed (17%) or microenterprises (9%).
Table 3.4: Replies by size of organisation (frequency and %) Size of organisation Frequency Percentage
Large enterprise (250 employees or more) 13 0.94 %
Medium-sized enterprise (50-249 employees) 15 1.08 %
Small enterprise (10-49 employees) 16 1.15 %
Microenterprise (under 10 employees) 125 9.00 %
Microenterprise (self-employed) 229 16.49 %
No Answer 991 71.35 %
Within these organisations, 302 (22%) respondents indicated apiculture as their main field of interest, followed by environment with 280 (20%), agriculture with 234 (17%), nature with 209 (15%), science with 88 (6%), horticulture with 57 (4%) and education with 40 (3%) as shown in Figure 3.5 and Table 3.5.
Figure 3.5: Replies by main field of activity of organisation (frequency)

9
Table 3.5: Respondents by main field of activity (sector) of organisation (frequency and %)
Main field of activity (sector) of organisation Frequency Percentage
Apiculture 302 21,74%
Environment 280 20,16%
Agriculture 234 16,85%
Nature 209 15,05%
Science 88 6,34%
Horticulture 57 4,10%
Education 40 2,88%
Other 33 2,38%
Health 24 1,73%
Agro-industry (chemical, seed or machinery) 21 1,51%
Bio-economy 17 1,22%
Culture 13 0,94%
Food/beverage industry 12 0,86%
Extractive industry 10 0,72%
Forestry 9 0,65%
Urban planning and development 9 0,65%
Hunting 6 0,43%
Energy 5 0,36%
Recreation 5 0,36%
Finance 4 0,29%
Media and communication 3 0,22%
Tourism 3 0,22%
Architecture 2 0,14%
Construction & development 2 0,14%
Transport 1 0,07%
The organisations were grouped into four broad sector groups (Figure 3.6 and Figure 3.7).
Figure 3.6: Grouping of sectors into categories

10
Figure 3.7: Replies from organisations by sector group (frequency and %)
3.5 Summary of responses by country and stakeholder group Table 3.6 presents the number of respondents by country and by stakeholder group. It shows that most replies from individuals came from Germany (27%), followed by France (17) and the UK (12%). Most replies from organisations in the Agri-food sector came from Germany (23%), followed by Italy and France (15%), and the UK (11%). For the Nature&Env sector, by far most replies came from Germany (29%), followed by France (13%). Most replies from the apiculture sector came from France (19%), followed by Germany 10%). For the category ‘others’, most replies came from Germany (28%), followed by Spain (11%), France (10%) and the UK (9%).

11
Table 3.6: Respondents by country of residence and stakeholder group (frequency and %)
Country Individuals Agri-food sector Nature&Env Apiculture Others Frequency % Frequency % Frequency % Frequency % Frequency %
Austria 2693 4,1% 10 3,1% 11 2,3% 9 3,0% 6 2,2%
Belgium 4774 7,3% 19 5,9% 28 5,7% 10 3,3% 21 7,7%
Bulgaria 184 0,3% 3 0,9% 1 0,2% 5 1,7% 3 1,1%
Croatia 163 0,3% 0 0,0% 2 0,4% 2 0,7% 1 0,4%
Cyprus 39 0,1% 0 0,0% 3 0,6% 1 0,3% 0 0,0%
Czech Republic
140 0,2% 2 0,6% 2 0,4% 3 1,0% 0 0,0%
Denmark 588 0,9% 2 0,6% 14 2,9% 3 1,0% 3 1,1%
Estonia 142 0,2% 7 2,2% 6 1,2% 7 2,3% 2 0,7%
Finland 291 0,4% 2 0,6% 3 0,6% 3 1,0% 2 0,7%
France 11094 17,0% 49 15,1% 64 13,1% 58 19,2% 27 9,9%
Germany 17735 27,2% 76 23,5% 140 28,6% 31 10,3% 76 27,7%
Greece 161 0,2% 3 0,9% 2 0,4% 9 3,0% 0 0,0%
Hungary 177 0,3% 0 0,0% 4 0,8% 2 0,7% 2 0,7%
Ireland 890 1,4% 12 3,7% 17 3,5% 5 1,7% 11 4,0%
Italy 6363 9,8% 50 15,4% 40 8,2% 52 17,2% 21 7,7%
Latvia 47 0,1% 2 0,6% 2 0,4% 1 0,3% 0 0,0%
Lithuania 66 0,1% 1 0,3% 0 0,0% 0 0,0% 0 0,0%
Luxem-bourg
197 0,3% 1 0,3% 3 0,6% 4 1,3% 0 0,0%
Malta 74 0,1% 1 0,3% 1 0,2% 1 0,3% 1 0,4%
Nether-lands
4327 6,6% 8 2,5% 36 7,4% 13 4,3% 18 6,6%
Poland 378 0,6% 3 0,9% 12 2,5% 17 5,6% 4 1,5%
Portugal 451 0,7% 3 0,9% 7 1,4% 6 2,0% 5 1,8%
Romania 152 0,2% 0 0,0% 2 0,4% 2 0,7% 1 0,4%
Slovak Republic
166 0,3% 3 0,9% 0 0,0% 7 2,3% 1 0,4%
Slovenia 256 0,4% 1 0,3% 4 0,8% 2 0,7% 4 1,5%
Spain 4160 6,4% 15 4,6% 31 6,3% 33 10,9% 28 10,2%
Sweden 1212 1,9% 15 4,6% 9 1,8% 4 1,3% 4 1,5%
United Kingdom
8091 12,4% 34 10,5% 40 8,2% 7 2,3% 25 9,1%
Other 179 0,3% 2 0,6% 5 1,0% 5 1,7% 8 2,9%
Total 65190 100% 324 100% 489 100% 302 100% 274 100%
All total: 66579

12
4 Pollinators and their role
This section covers five questions (Q1-Q5), which address the level of understanding of the respondents regarding pollinators and their decline, as well as respondents’ sources of information, their views on the importance of pollinators, on the costs of protecting pollinators, and on the contribution of pollinators to crop pollination.
4.1 Q1. How well do you consider yourself informed about pollinators: their importance, status and trends, and the threats they are facing?
The first question of the survey asked for a self-assessment by the respondent about the level of information on pollinators. Respondents could select different levels:
a. Very well informed b. Well informed c. Somewhat informed d. Not well informed e. Not at all informed
Figure 4.1: Q1. Awareness of pollinators, their importance, status and threats (in %)
Main observations Q1
Overall, most respondents considered themselves to be very well or well informed The apiculture sector could be identified as the most informed group of respondents with almost
60% indicating to be very well informed The majority of individuals considered themselves to be well informed (53%) A large majority of respondents of the Nature&Env sector (89%) and Agri-food sector (93%) were
well or very well informed

13
Table 4.1: Q1. Awareness of pollinators, their importance, status and threats (frequency)
All
individuals All sectors
Grouped sectors
Options Nature&Env Agri-food
sector Apiculture Others
Very well informed 10539 638 215 145 178 100
Well informed 34689 606 221 154 99 132
Somewhat informed 17220 111 48 23 13 27
Not well informed 2412 30 4 2 11 13
Not at all informed 330 4 1 0 1 2
4.2 Q2. What are your main sources of information on pollinators?
Respondents were asked to select a maximum of three of the listed options:
a. National newspapers b. Regional or local newspapers c. Magazines d. Television news e. The radio f. Films and documentaries on television g. Family, friends or neighbours h. Colleagues i. Professional contacts j. Brochures or information materials k. Books or scientific literature l. Events (conferences, fairs, exhibitions, festivals, etc.) m. Museums, national or regional parks n. Online social networks o. The internet (other websites, blogs, forums, etc.) p. Other
Main observations Q2
Organisations and individuals indicated the use of different sources of information on pollinators The most common source of information used by both groups are books or scientific literature and
the internet The most popular sources of information for individuals were the internet and films and
documentaries on television The most popular sources of information for organisations were books or scientific literature and
professional contacts Professional contacts were much more important for organisations (ranked 2nd) than individuals
(ranked 11th) National newspapers were much more important for individuals (ranked 4th) than organisations
(ranked 9th)

14
Table 3.2: Q2. Sources of information – individuals (frequency and %)
Source of information Frequency Percentage
The Internet 35609 55%
Films and documentaries on television
26545 41%
Books or scientific literature
19498 30%
National newspapers 16845 26%
Brochures or information materials
10452 16%
Magazines 10440 16%
Online social networks 9890 15%
Family, friends or neighbours
9715 15%
Television news 9095 14%
The radio 7470 11%
Professional contacts 7397 11%
Regional or local newspapers
5923 9%
Events 5080 8%
Other 3641 6%
Museums, national or regional parks
3269 5%
Colleagues 2427 4%
Table 3.3: Q2. Sources of information – organisations (frequency and %)
Source of information Frequency Percentage
Books or scientific literature
906 65%
Professional contacts 831 60%
The Internet 520 37%
Events 368 26%
Colleagues 254 18%
Brochures or information materials
185 13%
Films and documentaries on television
165 12%
Magazines 145 10%
National newspapers 141 10%
Online social networks 98 7%
Other 90 6%
Museums, national or regional parks
45 3%
Regional or local newspapers
40 3%
Television news 39 3%
The radio 36 3%
Family, friends or neighbours
28 2%
Figure 4.2: Q2. Sources of information – Individuals (in%)

15
Figure 4.3: Q2. Sources of information – Organisations (in %)
4.3 Q3. The importance of pollinators Respondents were asked to rate the level of importance of pollinators by selecting one among five options (indispensable, important, somewhat important, not important, no opinion/not sure) on each of the following statements:
In your opinion, how important…. …are pollinators for human well-being? ...is the role of pollinators in natural systems? …is the service provided by pollinators to agricultural systems? …are pollinators for the sustainability of rural livelihoods? …are pollinators for our food security? …is it to protect pollinators for their intrinsic and cultural value, and not only for their economic value? …is it to protect pollinators for future generations?
Main observations Q3
Overall, a large majority of respondents of all groups considered pollinators indispensable in all cases Individuals rated the highest the role of pollinators for human well-being; 94% found it indispensable On average, 93% of all groups rated pollinators as indispensable for natural systems In all statements, the Agri-food sector considered the role pollinators less indispensable compared
to all other groups 67% of the Agri-food sector considered pollinators indispensable for food security compared to 90%
of individuals Almost all respondents from all groups thought it is indispensable to protect pollinators for future
generations (average 93%)

16
Figure 4.4: Q3. The importance of pollinators (in %)

17
Table 4.4: Q3. The importance of pollinators (frequency)
Q3. In your opinion, how important….
Groups
Total number
of replies
Indispen-sable
Important Somewhat important
Not important
No opinion / Not sure
...is the role of pollinators in
natural systems?
All individuals 65190 63463 1593 70 25 39
All sectors 1389 1296 88 5 0 0
Agri-food sector 324 272 50 2 0 0
Nature & Env 489 473 15 1 0 0
Apiculture 302 295 7 0 0 0
Other 274 256 16 2 0 0
…is the service provided by
pollinators to agricultural systems?
All individuals 65190 59403 5253 347 57 130
All sectors 1389 1097 262 28 2 0
Agri-food sector 324 251 60 12 1 0
Nature & Env 489 390 94 4 1 0
Apiculture 302 236 62 4 0 0
Other 274 220 46 8 0 0
…are pollinators for the
sustainability of rural livelihoods?
All individuals 65190 57989 6397 539 65 200
All sectors 1389 1003 454 254 204 205
Agri-food sector 324 204 86 31 3 0
Nature & Env 489 370 104 12 0 3
Apiculture 302 228 63 10 0 1
Other 274 201 201 201 201 201
…are pollinators for our food
security?
All individuals 65190 58586 5614 632 115 243
All sectors 1389 1057 272 44 12 4
Agri-food sector 324 217 79 20 8 0
Nature & Env 489 397 85 7 0 0
Apiculture 302 226 62 10 2 2
Other 274 217 46 7 2 2
…is it to protect pollinators for their intrinsic and cultural
value, and not only for their
economic value?
All individuals 65190 54950 8721 1114 169 236
All sectors 1389 1009 294 77 7 2
Agri-food sector 324 197 83 37 6 1
Nature & Env 489 378 100 10 0 1
Apiculture 302 228 62 11 1 0
Other 274 206 49 19 0 0
…is it to protect pollinators for
future generations?
All individuals 65190 63259 1712 135 32 52
All sectors 1389 1214 149 23 3 0
Agri-food sector 324 260 53 9 2 0
Nature & Env 489 466 22 1 0 0
Apiculture 302 228 62 11 1 0
Other 274 260 12 2 0 0

18
4.4 Q4. In your opinion, how do the potential costs of pollinator protection compare with the socio-economic benefits that they provide?
Respondents were asked to read the following text and choose one among the six options: Pollinators contribute to human society in different ways. For instance, their contribution to EU agriculture sector has been estimated at around EUR 15 billion per year. Protecting pollinators also involves costs. In your opinion, how do the potential costs of their protection compare with the socio-economic benefits that they provide?
a. The costs and benefits are more or less equal b. The costs are much higher than the benefits c. The costs are higher than the benefits d. The costs are lower than the benefits e. The costs are much lower than the benefits f. No opinion/Not sure
Figure 4.5: Q4. Costs versus benefits of protecting pollinators (in %)
Main observations Q4
The large majority of respondents of all groups considered that the costs of protecting pollinators are much lower than the benefits they provide
Individuals expressed the highest ranking (75%) and the Agri-food sector the lowest (55%) in this category
The lowest number of respondents thought that the costs of protecting pollinators is much higher than the benefits they provide

19
Table 4.5: Q4. Costs versus benefits of protecting pollinators (frequency)
All
individuals All sectors
Grouped sectors
Options Nature&Env Agri-food
sector Apiculture Others
The costs and benefits are more or less equal
2191 66 12 23 18 13
The costs are much higher than the benefits
871 19 1 8 6 4
The costs are higher than the benefits
453 23 3 11 6 3
The costs are lower than the benefits
10274 285 93 72 51 69
The costs are much lower than the benefits
48647 917 359 178 210 170
No opinion/Not sure 2754 79 21 32 11 15
Total 65190 1389 489 324 302 274
4.5 Q5. Both wild and domesticated pollinators pollinate agricultural crops in the EU. In your opinion, how do their respective contributions to crop pollination compare?
Respondents were asked to choose one of the six options concerning the contributions of wild and domesticated pollinators to agricultural crop pollination in the EU:
a. Their contributions are more or less equal b. Domesticated pollinators contribute a lot more than wild pollinators c. Domesticated pollinators contribute more than wild pollinators d. Domesticated pollinators contribute less than wild pollinators e. Domesticated pollinators contribute a lot less than wild pollinators f. No opinion/Not sure
Main observations Q5
The replies vary significantly between stakeholder groups Almost half of all individual respondents (45%) thought that the contributions of wild pollinators is
much higher than those of domesticated pollinators The apiculture sector tends to considered the opposite; 49% indicated that domesticated pollinators
contribute either more or a lot more than wild pollinators A majority of respondents (67%) from the Nature%Env group considered that domesticated
pollinators contribute less or much less than wild pollinators, while only 10% indicated the opposite About a third of the Agri-food sector group (33%) indicated that domesticated pollinators contribute
less than wild pollinators

20
Figure 4.6: Q5. Contributions of wild vs domesticated pollinators to agricultural crop pollination in the EU (in %)
Table 4.6: Q5. Contributions of wild vs domesticated pollinators to agricultural crop pollination in the EU (frequency)
All
individuals All sectors
Grouped sectors
Options Nature&Env Agri-food
sector Apiculture Others
Their contributions are more or less equal
7722 286 78 66 91 51
Domesticated pollinators contribute a lot more than wild pollinators
2525 130 12 28 72 18
Domesticated pollinators contribute more than wild pollinators
3929 190 40 43 77 30
Domesticated pollinators contribute less than wild pollinators
11185 394 182 106 33 73
Domesticated pollinators contribute a lot less than wild pollinators
32045 290 148 60 17 65
No opinion/Not sure 7784 99 29 21 12 37
Total 65190 1389 489 324 302 274

21
5 The decline of pollinators, its causes and consequences
This section covers three questions (Q6 to Q9) related to the decline of pollinators, its extent, causes and consequences. Q6 addresses the degree of seriousness of pollinator decline and Q7 considers the various drivers of pollinator decline. Q8 and Q9 address the extent to which the respondent feels affected in his/her private and professional life by pollinator decline.
5.1 Q6. In your opinion, the current decline of pollinators in abundance and diversity is Respondents were asked to choose one of the following five options:
a. Alarming b. Serious c. Moderate d. Negligible e. No opinion / Not sure
Figure 5.1: Q6. The decline of pollinators (in %)
Main observations Q6
The large majority within all groups considered the decline of pollinators to be alarming There were not many differences among the replies in different groups Among those that considered the decline of pollinators to be alarming, the highest rate was for
individuals (94%) and the lowest for the Agri-food sector (63%)

22
Table 5.1: Q6. The decline of pollinators (frequency)
All individuals
All sectors
Grouped sectors
Options Nature&Env Agri-food
sector Apiculture Others
Alarming 61048 1118 434 203 251 230
Serious 3847 239 52 98 48 41
Moderate 175 25 2 17 3 3
Negligible 43 6 1 5 0 0
No opinion/Not sure 77 1 0 1 0 0
Total 65190 1389 489 324 302 274
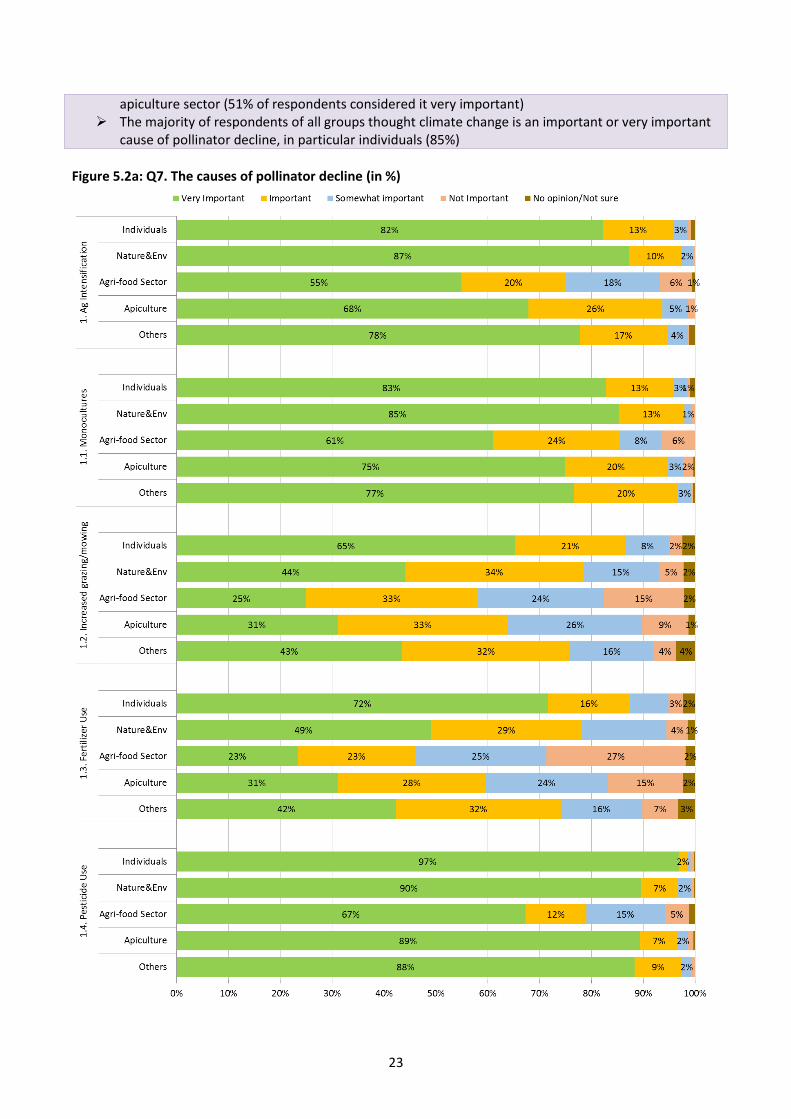
5.2 Q7. The causes of pollinator decline
Respondents were asked to rate the level of importance of various causes contributing to pollinator decline. They could rate the listed different causes according to five options (very important, important, somewhat important, not important, no opinion/not sure):
1. Agricultural intensification 1.1 Simplification of agricultural landscapes (e.g. monoculture) 1.2 Increased grazing/mowing of grasslands 1.3 Use of fertilizers 1.4 Use of pesticides 2. Farmland abandonment 3. Urbanization 4. Pollution (including light pollution) 5. Invasive alien species 6. Diseases (e.g. pathogens, parasites) 7. Climate change 8. Other
Main observations Q7
Agricultural intensification was seen as a very important cause of pollinator decline. Nature&Env rated its importance the highest (97% considering it very important or important) and the Agri-food sector the lowest (75%)
In regards to monoculture, the results were very similar with minor differences among the groups At least 60% of all groups considered increased grazing/mowing as a very important or important
cause The use of fertilizers was seen as very important cause in particular by individuals (72%). In contrast
to this, only 23% of the Agri-food sector considered this to be a very important cause Among all causes, pesticide use was considered the most important cause; at least 80% of all groups
indicated this to be a very important or important cause. Individuals placed the highest importance (99%) and the Agri-food sector the lowest (79%) on this factor
Farmland abandonment was not seen as a very important cause. There were no significant differences among the groups in this regard
Urbanisation was mostly perceived as an important cause, in particular by individuals (61%) The majority of respondents considered environmental pollution as a very important or important
cause. While there were no significant differences between stakeholder groups, individuals stood out in this category (94%)
Around 50% of all respondents indicated invasive alien species as a very important or important cause. Individuals particularly considered it important (76%)
Most respondents considered diseases as an important or very important cause, in particular the
23
Figure 5.2a: Q7. The causes of pollinator decline (in %)
apiculture sector (51% of respondents considered it very important) The majority of respondents of all groups thought climate change is an important or very important
cause of pollinator decline, in particular individuals (85%)

24
Figure 5.2b: Q7. The causes of pollinator decline (in %)

25
Figure 5.2c: Q7. The causes of pollinator decline (in %)

26
Table 5.2: Q7. The causes of pollinator decline (frequency) Please indicate how important
you consider the following causes
Groups
Total number
of replies
Very important
Important Somewhat important
Not important
No opinion/Not
sure
1. Agricultural intensification
All individuals 65190 53636 8781 1864 362 547
All sectors 1389 1023 238 96 27 5
Agri-food sector 324 178 65 59 20 2
Nature & Env 489 427 49 11 2 0
Apiculture 302 205 78 15 4 0
Other 274 213 46 11 1 3
1.1 Simplification of agricultural
landscapes (e.g. monoculture)
All individuals 65190 53968 8517 1668 347 690
All sectors 1389 1051 256 49 31 2
Agri-food sector 324 198 79 26 21 0
Nature & Env 489 417 62 7 3 0
Apiculture 302 226 60 9 6 1
Other 274 210 55 7 1 1
1.2 Increased grazing/mowing
of grasslands
All individuals 65190 42594 13842 5506 1623 1625
All sectors 1389 510 462 273 112 32
Agri-food sector 324 81 107 79 50 7
Nature & Env 489 216 167 72 23 11
Apiculture 302 94 99 78 27 4
Other 274 119 89 44 12 10
1.3 Use of fertilizers
All individuals 65190 46721 10251 4844 1869 1505
All sectors 1389 526 388 276 170 29
Agri-food sector 324 76 73 82 87 6
Nature & Env 489 240 142 80 20 7
Apiculture 302 94 86 71 44 7
Other 274 116 87 43 19 9
1.4 Use of pesticides
All individuals 65190 63117 1123 355 440 155
All sectors 1389 1168 120 72 23 6
Agri-food sector 324 218 38 49 15 4
Nature & Env 489 438 35 12 3 1
Apiculture 302 270 22 6 3 1
Other 274 242 25 5 2 0
2. Farmland abandonment
All individuals 65190 6196 8624 11514 34970 3886
All sectors 1389 202 349 358 425 55
Agri-food sector 324 26 60 79 137 22
Nature & Env 489 120 199 132 35 3
Apiculture 302 29 57 80 129 7
Other 274 27 33 67 124 23
3. Urbanization All individuals 65190 13393 39803 9101 2170 723
All sectors 1389 269 443 350 280 47

27
Please indicate how important
you consider the following causes
Groups
Total number
of replies
Very important
Important Somewhat important
Not important
No opinion/Not
sure
Agri-food sector 324 86 149 66 16 7
Nature & Env 489 38 80 134 202 35
Apiculture 302 74 107 86 35 0
Other 274 71 107 64 27 5
4. Pollution (including light
pollution)
All individuals 65190 50291 10868 3072 337 622
All sectors 1389 643 473 228 32 13
Agri-food sector 324 143 123 51 2 5
Nature & Env 489 239 152 79 16 3
Apiculture 302 138 106 52 5 1
Other 274 123 92 46 9 4
5. Invasive alien species
All individuals 65190 10072 39756 9663 2942 2757
All sectors 1389 274 470 376 211 58
Agri-food sector 324 77 103 91 37 16
Nature & Env 489 62 177 144 91 15
Apiculture 302 85 93 73 44 7
Other 274 50 97 68 39 20
6. Diseases (e.g. pathogens, parasites)
All individuals 65190 15774 40212 6434 1295 1475
All sectors 1389 480 537 286 68 18
Agri-food sector 324 129 120 59 12 4
Nature & Env 489 107 216 121 37 8
Apiculture 302 153 88 52 9 0
Other 274 91 113 54 10 6
7. Climate change
All individuals 65190 41261 14602 6199 1640 1488
All sectors 1389 461 501 306 93 28
Agri-food sector 324 93 129 83 13 6
Nature & Env 489 157 161 116 48 7
Apiculture 302 116 107 58 18 3
Other 274 95 104 49 14 12
8. Other
All individuals 65190 4711 30264 6849 1368 21998
All sectors 1389 188 293 220 71 617
Agri-food sector 324 47 62 51 8 156
Nature & Env 489 64 103 82 29 211
Apiculture 302 45 59 54 21 123
Other 274 32 69 33 13 127

28
5.3 Q8. To which extent do you consider that the decline of pollinators affects you in your private life?
For the analysis of Q8, only the replies of individuals were taken into account, as the question refers to the impact on respondent’s private life. Respondents could choose one option indicating the extent to which the decline of pollinators affects them in their private life:
a. A lot b. Significantly c. Somewhat d. Not at all e. No opinion / Not sure
Figure 5.3: Q8. Impact of pollinator decline on respondents’ private life (frequency and %)
Table 5.3: Q8: Impact of pollinator decline on respondents’ private life (in %)
All individuals
All sectors
Grouped sectors
Options Nature&Env Agri-food
sector Apiculture Others
A lot 23294 509 188 99 143 79
Significantly 28025 512 191 90 108 123
Somewhat 11207 292 94 96 44 58
Not at all 808 47 4 35 5 3
No opinion/Not sure 1856 29 12 4 2 11
Total 65190 1389 489 324 302 274
Main observations Q8
Almost 80% of individuals felt affected at least significantly by the decline of pollinators (43% feel significantly affected and 36% a lot). Only 1% of respondents did not feel affected at all.

29
5.4 Q9. To which extent do you consider that the decline of pollinators affects you professionally?
Respondents could choose one option indicating the extent to which the decline of pollinators affects them in their professional life:
a. A lot b. Significantly c. Somewhat d. Not at all e. No opinion / Not sure
Figure 5.4: Q9. Impact of pollinator decline on respondents’ professional life (in %)
Table 5.4: Q9. Impact of pollinator decline on respondents’ professional life (frequency)
All
individuals All sectors
Grouped sectors
Options Nature&Env Agri-food
sector Apiculture Others
A lot 8555 574 167 131 188 88
Significantly 13187 452 167 121 75 89
Somewhat 17647 254 101 58 29 66
Not at all 14988 64 31 11 7 15
No opinion/Not sure 10813 45 23 3 3 16
Total 65190 1389 489 324 302 274
Main observations Q9
The replies between stakeholder groups varied More than 60% of the respondents from the Apiculture sector indicated that they are affected a
lot by pollinator decline. They were by far the group feeling the most affected About 77% of the respondents from the Agri-food sector felt a lot or significantly affected by
pollinator decline Compared to other groups, individuals felt the least affected professionally

30
6 How to halt the decline of pollinators
This section covers four questions (Q10 to Q13) related to solutions for addressing the decline of pollinators. Q10 and Q11 ask how current EU and national or regional policies address pollinator decline. Q12 asks at which governance level (local, regional, national, EU, international) efforts should be stepped up to halt the decline of pollinators. The final question Q13 provides a list of possible actions that could help mitigate pollinator decline and requests respondents to rate their importance.
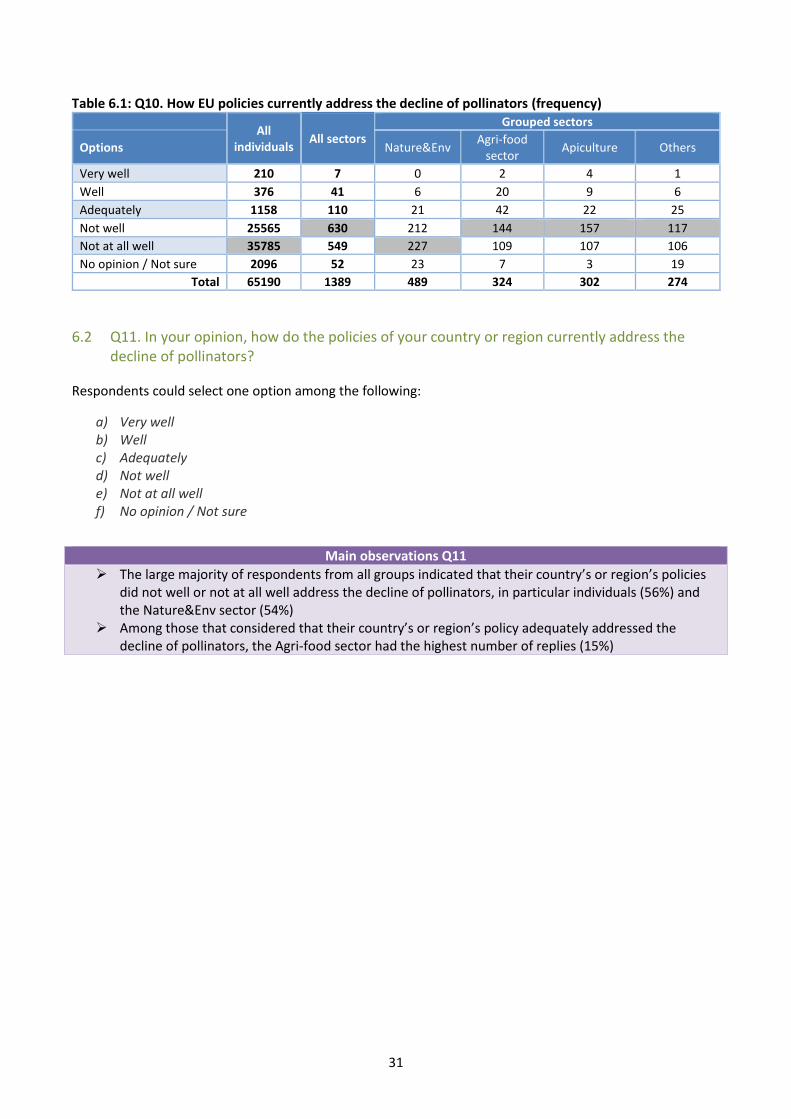
6.1 Q10. In your opinion, how do EU policies currently address the decline of pollinators?
Respondents could select one option among the following:
a) Very well b) Well c) Adequately d) Not well e) Not at all well f) No opinion / Not sure
Figure 6.1: Q10. How EU policies currently address the decline of pollinators (in %)
Main observations Q10
The large majority of respondents from all groups indicated that EU policies did not well or not at all well address the decline of pollinators
Individuals in particular considered that the policies did not at all address well problem (55%), followed by the Nature&Env sector (46%)
31
Table 6.1: Q10. How EU policies currently address the decline of pollinators (frequency)
All individuals
All sectors
Grouped sectors
Options Nature&Env Agri-food
sector Apiculture Others
Very well 210 7 0 2 4 1
Well 376 41 6 20 9 6
Adequately 1158 110 21 42 22 25
Not well 25565 630 212 144 157 117
Not at all well 35785 549 227 109 107 106
No opinion / Not sure 2096 52 23 7 3 19
Total 65190 1389 489 324 302 274
6.2 Q11. In your opinion, how do the policies of your country or region currently address the decline of pollinators?
Respondents could select one option among the following:
a) Very well b) Well c) Adequately d) Not well e) Not at all well f) No opinion / Not sure
Main observations Q11
The large majority of respondents from all groups indicated that their country’s or region’s policies did not well or not at all well address the decline of pollinators, in particular individuals (56%) and the Nature&Env sector (54%)
Among those that considered that their country’s or region’s policy adequately addressed the decline of pollinators, the Agri-food sector had the highest number of replies (15%)

32
Figure 6.2: Q11. How policies of respondents’ countries or regions currently address the decline of pollinators (in %)
Table 6.2: Q11. How policies of respondents’ countries or regions currently address the decline of pollinators (frequency)
All
individuals All sectors
Grouped sectors
Options Nature&Env Agri-food
sector Apiculture Others
Very well 161 12 1 4 4 3
Well 394 34 10 18 2 4
Adequately 1395 117 25 48 24 20
Not well 25016 563 181 137 132 113
Not at all well 36715 639 263 112 138 126
No opinion / Not sure 1509 24 9 5 2 8
Total 65190 1389 489 324 302 274
6.3 Q12. In your opinion, how much should the efforts to halt the decline of pollinators be stepped up at the following levels?
Respondents were asked to rate the significance of efforts to be stepped up by selecting one among five options (a lot, significantly, somewhat, not at all, no opinion/not sure) on each of the following governance levels: international, EU, national, regional, and local.
Main observations Q12
Overall, the international level was not seen as the priority level to step up efforts a lot Most individuals expected efforts to be stepped up a lot at national levels (82%) and at EU level
(82%) Similarly, the Nature%Env sector also rated the highest an increase of efforts at national (89%) and

33
Figure 6.3: Q12. Stepping up efforts to halt the decline of pollinators at different governance levels (in %)
EU level (87%) The Agri-food sector expected a lot more efforts at local (56%) and regional (56%) level, which is
slightly less than at national (53%), EU (53%) and international level (53%) The Apiculture sector expects a lot more efforts at national level (80%), regional (78%) and EU (78%)
level

34
Table 6.3: Q12. Stepping up efforts to halt the decline of pollinators at different governance levels (frequency) International
Total number of
replies A lot Significantly Somewhat
Not at all
No opinion / Not sure
All individuals 65190 58155 5565 875 258 337
All sectors 1389 996 282 81 17 13
Nature&Env 324 378 81 21 2 7
Agri-food Sector 489 204 79 30 10 1
Apiculture 302 213 68 16 2 3
Others 274 201 54 14 3 2
EU
Total number of
replies A lot Significantly Somewhat
Not at all
No opinion / Not sure
All individuals 65190 60277 4068 431 212 202
All sectors 1389 1091 233 47 12 6
Nature&Env 324 426 56 4 2 1
Agri-food Sector 489 200 88 28 7 1
Apiculture 302 243 50 6 1 2
Others 274 222 39 9 2 2
National
Total number of
replies A lot Significantly Somewhat
Not at all
No opinion / Not sure
All individuals 65190 59948 4327 491 250 174
All sectors 1389 1109 211 51 17 1
Nature&Env 324 435 44 8 2 0
Agri-food Sector 489 205 76 34 8 1
Apiculture 302 248 44 7 3 0
Others 274 221 47 2 4 0
Regional
Total number of
replies A lot Significantly Somewhat
Not at all
No opinion / Not sure
All individuals 65190 57185 6268 1150 267 320
All sectors 1389 1017 284 61 24 3
Nature&Env 324 402 74 9 4 0
Agri-food Sector 489 196 82 31 12 3
Apiculture 302 228 57 12 5 0
Others 274 191 71 9 3 0
Local
Total number of
replies A lot Significantly Somewhat
Not at all
No opinion / Not sure
All individuals 65190 55743 6771 1924 331 421

35
All sectors 1389 968 304 82 27 7
Nature&Env 324 380 93 12 2 1
Agri-food Sector 489 192 76 36 14 6
Apiculture 302 213 62 20 7 0
Others 274 183 73 14 4 0
6.4 Q13. In your opinion, how important is it to include the following actions in the EU Pollinators
Initiative? Respondents were asked to rate the level of importance of 18 different actions by selecting one among five options (very important, important, somewhat important, not important, no opinion/not sure). The actions were grouped into three pillars, which were set out in the Roadmap2 of the EU Pollinators Initiative:
I. Actions to improve knowledge 1. Assess and monitor the decline of pollinators 2. Analyse threats to pollinators and the consequences of their decline 3. Promote innovation for the conservation of pollinators
II. Actions to tackle the causes of decline
1. Protect and restore pollinator habitats in Natura 2000 sites 2. Protect and restore pollinator habitats in rural areas outside Natura 2000 sites 3. Protect and restore pollinator habitats in urban areas outside Natura 2000 sites 4. Assess risks of pesticides to pollinators 5. Implement Integrated Pest Management 6. Combat invasive alien species 7. Mitigate climate change impacts on pollinators 8. Reduce pollution (including light pollution) 9. Protect pollinators from diseases 10. Support the efforts of the private sector 11. Create market incentives for pollinator friendly activities
III. Actions to raise awareness, improve collaboration and knowledge sharing
1. Engage local communities 2. Support knowledge sharing among stakeholders 3. Support collaboration among Member States 4. Support the development of local/regional/national strategies
6.4.1 Pillar I: Actions to improve knowledge
2 http://ec.europa.eu/environment/nature/pdf/roadmap-for-the-eu-pollinators-initiative.pdf
Main observations Q13
More than 92% of respondents in all groups considered the assessment and monitoring of the decline of pollinators as an important action
Similarly, at least 95% of respondents in all groups indicated that an analysis of the threats and the consequences of pollinator decline is important
Although more than half of the respondents in each group considered the promotion of innovation for the conservation of pollinators as very important, it was particularly the Apiculture sector that supported this view (73%)

36
Figure 6.4: Q13 Actions to improve knowledge (in %)

37
Table 6.4: Q13. Actions to improve knowledge (frequency)
Q13. Actions to improve
knowledge Groups
Total Number of replies
Very important
Important Somewhat important
Not important
No opinion
/Not sure
1. Assess and monitor the
decline of pollinators
All individuals 65190 56440 7540 986 108 116
All sectors 1389 1033 293 48 12 3
Agri-food sector 324 236 68 14 6 0
Nature & Env 489 380 93 13 2 1
Apiculture 302 217 71 11 3 0
Others 274 200 61 10 1 2
2. Analyse threats to pollinators and the consequences
of their decline
All individuals 65190 59500 5029 514 59 88
All sectors 1389 1120 216 43 8 2
Agri-food sector 324 251 59 11 3 0
Nature & Env 489 402 73 12 2 0
Apiculture 302 249 41 10 2 0
Others 274 218 43 10 1 2
3. Promote innovation for the
conservation of pollinators
All individuals 65190 35081 27586 1828 355 340
All sectors 1389 925 339 85 28 12
Agri-food sector 324 197 91 28 6 2
Nature & Env 489 322 130 24 9 4
Apiculture 302 221 55 15 7 4
Others 274 185 63 18 6 2
6.4.2 Pillar II: Actions to tackle the causes of decline
Main observations Q13
Regarding the protection and restoration of pollinator habitats in Natura 2000 sites, there was a large difference between individuals - where 84% of respondents considered this as very important - and the Agri-food sector, where only 45% of respondents considered this to be very important
Regarding the protection and restoration of pollinator habitats outside of Natura 2000 sites, most individual respondents (88%) and the Nature%Env group indicated this as very important (89%). In the Agri-food sector 56% of respondents considered this to be very important
Although slightly less than actions 4 and 5, most respondents in all groups still considered the protection and restoration of pollinator habitats in urban areas outside of Natura 2000 sites important
The importance of assessing risks of pesticides to pollinators was rated the highest by all groups. The largest difference in this regard was between individuals (95%) and the Agri-food sector (72%)
More than 80% of respondents in all groups considered the implementation of Integrated Pest Management as an important action. 39% of individual respondents rated this as very important, compared to 65% of respondents in the Apiculture sector
More than 60% of respondents across all groups considered it important to mitigate the impacts of climate change on pollinators, while 80% of them found it important to reduce the impacts of environmental pollution,
68% of individual respondents considered protecting pollinators from diseases as a very important action, compared to 31% in the Nature&Env group

38
Figure 6.5a: Q13. Actions to tackle the causes of decline (in %)
Actions to support the efforts of the private sector were overall rated as important. The Apiculture group stood out with 50% of respondents indicating this as a very important action.
Similarly, respondents of the Apiculture sector put the highest emphasis on market incentives for pollinator friendly activities. This was seen as very important by 67% of respondents in this sector, significantly higher than in other groups (43%-55%)
Overall, respondents found the actions to protect pollinator habitats and assess the risk of pesticides to pollinators as the most important

39
Figure 6.5b: Q13. Actions to tackle the causes of decline (in %)

40
Figure 6.5c: Q13. Actions to tackle the causes of decline (in %)

41
Table 6.5: Q13. Actions to tackle the causes of decline (frequency)
Q13. Actions to tackle the causes
of decline Groups
Total number
of replies
Very important
Important Somewhat important
Not important
No opinion
/ Not sure
4. Protect and restore pollinator habitats in Natura
2000 sites
All individuals 65190 54677 8129 1398 199 787
All sectors 1389 819 377 151 29 13
Agri-food sector 324 147 112 47 13 5
Nature & Env 489 343 102 39 5 0
Apiculture 302 174 81 34 8 5
Others 274 155 82 31 3 3
5. Protect and restore pollinator habitats in rural
areas outside Natura 2000 sites
All individuals 65190 57283 6496 629 125 657
All sectors 1389 1037 267 56 20 9
Agri-food sector 324 180 91 34 16 3
Nature & Env 489 434 49 6 0 0
Apiculture 302 215 70 9 4 4
Others 274 208 57 7 0 2
6. Protect and restore pollinator habitats in urban
areas outside Natura 2000 sites
All individuals 65190 49252 11816 2996 348 778
All sectors 1389 718 414 198 49 10
Agri-food sector 324 139 114 53 16 2
Nature & Env 489 297 118 60 13 1
Apiculture 302 138 102 43 14 5
Others 274 144 80 42 6 2
7. Assess risks of pesticides to pollinators
All individuals 65190 61941 2644 405 80 120
All sectors 1389 1161 164 46 13 5
Agri-food sector 324 232 56 25 9 2
Nature & Env 489 412 61 12 3 1
Apiculture 302 281 17 2 1 1
Others 274 236 30 7 0 1
8. Implement Integrated Pest Management
All individuals 65190 25542 33243 2884 516 3005
All sectors 1389 788 378 143 33 47
Agri-food sector 324 162 96 48 10 8
Nature & Env 489 267 139 55 12 16
Apiculture 302 195 74 19 6 8
Others 274 164 69 21 5 15
9. Combat invasive alien species
All individuals 65190 13528 17141 30137 2155 2229
All sectors 1389 392 435 376 147 39
Agri-food sector 324 101 116 79 19 9
Nature & Env 489 116 135 160 65 13
Apiculture 302 112 91 64 30 5

42
Q13. Actions to tackle the causes
of decline Groups
Total number
of replies
Very important
Important Somewhat important
Not important
No opinion
/ Not sure
Others 274 63 93 73 33 12
10. Mitigate climate change
impacts on pollinators
All individuals 65190 21879 35020 5688 1120 1483
All sectors 1389 514 462 264 107 42
Agri-food sector 324 103 122 68 22 9
Nature & Env 489 188 135 109 41 16
Apiculture 302 126 105 43 23 5
Others 274 97 100 44 21 12
11. Reduce pollution (including
light pollution)
All individuals 65190 31657 30317 2551 221 444
All sectors 1389 680 478 192 21 18
Agri-food sector 324 145 123 48 3 5
Nature & Env 489 256 147 70 13 3
Apiculture 302 154 103 39 3 3
Others 274 125 105 35 2 7
12. Protect pollinators from
diseases
All individuals 65190 44391 14435 4799 813 752
All sectors 1389 582 459 261 66 21
Agri-food sector 324 141 112 60 6 5
Nature & Env 489 151 186 110 35 7
Apiculture 302 167 82 39 13 1
Others 274 123 79 52 12 8
13. Support the efforts of the private sector
All individuals 65190 19591 37640 5281 884 1794
All sectors 1389 510 531 241 45 62
Agri-food sector 324 107 136 52 9 20
Nature & Env 489 163 193 103 13 17
Apiculture 302 150 93 37 9 13
Others 274 90 109 49 14 12
14. Create market incentives for
pollinator friendly activities
All individuals 65190 28164 33323 2784 352 567
All sectors 1389 802 423 111 33 20
Agri-food sector 324 178 103 26 10 7
Nature & Env 489 270 161 45 10 3
Apiculture 302 202 71 17 8 4
Others 274 152 88 23 5 6

43
6.4.3 Pillar III: Actions to raise awareness, improve collaboration and knowledge sharing
Figure 6.6: Q13. Actions to raise awareness, improve collaboration and knowledge sharing (in %)
Main observations Q13
The importance of all four actions (engaging local communities, supporting knowledge sharing among stakeholders, supporting collaboration among Member States, and supporting the development of national/regional/local pollinator strategies) was rated high (more than 90%) by respondents across stakeholder groups
The respondents in particular emphasized the importance of supporting the development of national/regional/local pollinator strategies

44
Table 6.6: Q13. Actions to raise awareness, improve collaboration and knowledge sharing (frequency) Q13. Actions to raise awareness, improve
collaboration and knowledge sharing
Groups Total
number of replies
Very important
Important Somewhat important
Not impor-
tant
No opinion
/ Not sure
15. Engage local communities
All individuals 65190 30607 32748 1568 102 165
All sectors 1389 901 400 71 11 6
Agri-food sector 324 176 117 21 7 3
Nature & Env 489 337 129 22 0 1
Apiculture 302 212 72 16 2 0
Others 274 176 82 12 2 2
16. Support knowledge sharing
among stakeholders
All individuals 65190 29086 34127 1524 83 370
All sectors 1389 917 398 61 5 8
Agri-food sector 324 199 102 21 1 1
Nature & Env 489 331 135 20 0 3
Apiculture 302 204 89 6 2 1
Others 274 183 72 14 2 3
17. Support collaboration among
Member States
All individuals 65190 54252 9399 1225 99 215
All sectors 1389 898 374 100 11 6
Agri-food sector 324 190 105 23 5 1
Nature & Env 489 320 128 38 1 2
Apiculture 302 202 73 22 4 1
Others 274 186 68 17 1 2
18. Support the development of
local/regional/national strategies
All individuals 65190 57401 6988 606 53 142
All sectors 1389 1085 254 33 13 4
Agri-food sector 324 213 88 14 8 1
Nature & Env 489 414 67 5 2 1
Apiculture 302 239 54 7 1 1
Others 274 219 45 7 2 1

45
7 Open question
The final section of the survey allowed respondents to provide final remarks or upload a document that they thought was relevant to better explain their views. A total of 38 381 comments were received and 112 position papers were submitted.
7.1 Individual responses to the open question 1789 responses to the open question by citizens were analysed, which represents around 5% of the total number of responses to the open question received from citizens. More than half of the respondents directly mentioned the importance of pollinators, either to them personally or to society as a whole. Almost one quarter highlighted personal experience pointing to pollinator decline. Almost a third of respondents identified pesticides as a cause of pollinator decline, and well over a third called for their ban. A quarter of respondents requested explicitly an EU action to protect pollinators.
The five most frequently mentioned line of actions to protect wild pollinators were:
ensuring a strategic position for pollinators and pollination service in agricultural policies;
implementing the full ban on neonicotinoid pesticides harmful to bees;
promoting low pesticide farming systems (e.g. organic farming) ;
scaling up pollinator-relevant measures in agricultural programmes and
raising awareness about the importance of pollinators and promoting education and knowledge transfer, in particular through farm advisors.
In addition, it was suggested to monitor pollination deficit in agricultural areas to avoid economic losses due to insufficient pollination, to strengthen regulation on trade of pollinators to prevent diseases and introduction of alien species, to support compulsory training of farmers on pollinators and pollination. Several respondents also mentioned the importance of labelling pollinator-friendly gardening products (e.g. pot plants) to ensure they are indeed beneficial and not harmful to pollinators.
7.2 Agri-food sector responses to the open question All 155 responses to the open question from agri-food sector were analysed. Of these, 37 were from Germany, 26 from France, 21 from the UK, 20 from Italy, and the rest from 16 other Member States.
One third of the responses referred to reducing pesticide use and increasing integrated pest management, and/or raising standards of pesticide risk assessment of pollinators. In particular, responses highlighted the proposed total ban on neonicotinoids and increased research and risk assessment of impacts of pesticide combinations on pollinators, including a review of impacts of all currently authorised pesticides. Two responses called specifically for more support for SMEs developing nonchemical pest control methods.
Others pointed out that pesticide use can be compatible with a healthy pollinator population. Around a quarter referred to creating more habitats, particularly through increased support for pollinator-relevant measures in rural development programmes and support for organic farming. Two agricultural organisation responses stated that enough CAP money is already available for biodiversity (in greening and rural development budgets) and more for pollinators is not needed. A tenth of responses called for increased support for apiculture, particularly disease and pest control and advice or training, and controls on honey imports.
Specific ideas included: more incentives and advice for farmers to plant flowering field margins, or obligatory margins with no fertiliser or pesticide and no cutting or mulching till end June, season-long flowering cover crops or patches (borage, phacelia and lime trees were mentioned), with a call for ‘an insect sensor which can count and distinguish pollinator species to improve recommendations on which flower strip should be
46
sown along the field’. One response said that application and control must be simpler (e.g. machinery crossing the margin when managing the main crop, unsuitable field boundaries, walkers picking the flowers, poor germination of the seed mix).
Several responses pointed to the need for landscape scale habitat creation, with incentives for the nature conservation sector to work together with farmers (with economically interesting payments) and with local and regional government to improve habitat management in protected areas and other non-farm areas. Others called for more research on the impacts on pollinators of climate change (changed average wind speeds), badgers (Meles meles), mobile phone radiation, and light pollution. One stated that the EU should communicate clearly what is known and where there is still some uncertainty about the effectiveness of actions or impact of pressures.
7.3 Nature & Environment sector responses to the open question All 260 responses to the open question from the nature and environment sector were analysed. Of these, 72 were from Germany, 40 from France, 22 from the Netherlands, 22 from the UK, 17 from Spain, 16 from Italy, and the rest from 17 other Member States.
Ensuring a more strategic role for pollinators and pollination service in the post 2020 CAP by defining objectives and indicators of impacts on pollinators, monitor and evaluate impacts of CAP measures on pollinators, was most frequently mentioned. Over a third of the responses referred to creating more pollinator friendly habitats in agricultural areas. Increasing the uptake of pollinator-relevant measures (agri-env-climate, organic farming, other grassland support measures) - increasing the support for organic farming, agroforestry, and low pesticide farming approaches was most frequently mentioned -, whilst others called for actions and measures to create pollinator habitat under both CAP pillars, including increased environmental conditionality on area payments and more effective greening measures. One response specifically mentioned providing farmers with advice on pollinator habitat creation, and a few mentioned the importance of better protecting species rich grassland. The need for an EU wide landscape scale network of pollinator habitats was mentioned by one sixth of responses.
Specific ideas included targeting CAP payments to species rich habitats only, to extensive grassland management or extensive dairy systems, mandatory long crop rotations and Integrated Pest Management (IPM), better quality control and monitoring of newly created habitats. One suggestion was that Member States should align their post 2020 CAP and rural development programmes to their national or regional pollinator strategies.
A third of the responses referred to reducing the impact of pesticides on pollinators. The implementation of a full ban on neonicotinoids was most frequently mentioned, followed by raising standards of pollinator risk assessment of pesticides generally, reducing pesticide use, and banning glyphosate use. Several called for enforcing a stronger implementation of the Sustainable Use of Pesticides Directive (SUPD), with ambitious national plans to cut pesticide use with infringement proceedings against Member States, and to investigate and report on traceability of pesticide use records.
Specific ideas included a stop to derogations under the Plant Protection Products (PPP) regulation that allow the use of unauthorized pesticides, reviewing pesticide authorisations more frequently than every ten years, more intensive monitoring of pesticide residues in the environment, requiring all horticultural and garden centre plants to be free of pesticides, stopping prophylactic use of vermicides in livestock, etc. Respondents also called for mandatory monitoring of bee exposure to pesticides, and ensuring beekeepers have access to farm spray records.
Promoting awareness of pollinators was mentioned frequently, particularly the role of wild pollinators. 5% of responses stated the need for a long-term, taxonomically broad, systematic EU wide pollinator monitoring programme and training for species identification experts and species research. Several highlighted the need

47
to promote breeding of local bumblebee species for commercialisation, and to stop the trade with and escape of non-native subspecies (e.g. Bombus terrestris dalmatinus in Spain).
Specific ideas included ensuring that pollinator experts are consulted in planning and monitoring interventions, creating more refuge/protection zones for pollinators, better protection of extensive orchards and other species rich grassland from destruction by urban sprawl, more pollinator-friendly hedge management, promotion of cross-border and regional collaborative projects (with local authorities and protected area managers), and pollinator friendly golf course management. One respondent suggested an assessment of the Habitats Directive and Natura 2000 network to see that bee species/pollinators and plants species they depend upon are adequately included.
7.4 Apiculture sector responses to the open question All 136 responses to the open question from the apicultural sector were analysed. Of these, 28 were from France, 27 from Italy, 17 from Spain, 13 from Germany, and the rest from 19 other Member States.
A third of the actions referred to pesticides, mainly to ban neonicotinoids (and stop derogations to the PPP regulation for continued use), to ban glyphosate, and to reduce pesticide use in general. Ten responses called for more rigorous risk assessment of pesticides regarding pollinators, full implementation of the European Food Safety Authority (EFSA) bee guidance, assessment of synergistic effects and realistic field exposure to combined chemicals. Several respondents called for comprehensive training of farmers on IPM and for developing specific pesticide risk assessment protocols to address sublethal effects on pollinators, chronic toxicity, synergistic effects between different pesticides, interactions between different pesticide components, impacts under field conditions, and impact on wild pollinator species.
A third of the suggested actions referred to the apiculture sector (principally more advice and training for beekeepers on managing pests and diseases, more direct payments to beekeepers, addressing government corruption in payments to beekeepers, payments for pollination services following the US model, which enables beekeepers to earn from pollination service as well as honey, legal protection of local subspecies and ban to international bee trade). One called for recognition of the importance of wild unmanaged honeybee colonies. A few called for restrictions to beekeeping in certain areas to prevent negative effects on wild pollinators.
Responses included several calls for more cooperation between beekeepers and farmers or biogas plant operators to produce more flowering landscapes (with more flowering fallows, hedges, woodlands, meadows, dead wood), stop drainage of wet grassland, stop farmers destroying hedges and scrub to qualify their land for direct payments, support extensive grazing with no fertiliser and herbicide use. Other suggested measures concerned raising awareness and access to expertise in local authorities, setting clear national rules on road margin and green space management for pollinators (not only guidance from the nature conservation sector as this is not listened to). There was one call for more research on wild pollinators (mentioning the desperate lack of literature on insect pollinators in the Czech Republic).
7.5 Other sectors responses to the open question All 140 responses to the open question from other sectors were analysed. Of these, 42 were from Germany, 17 from UK, 15 from France, 12 from Spain, 10 from Belgium, and the rest from 13 other Member States. The responses came from the science sector (42), education (23), culture (11), health (11), forestry (8), energy (3), finance (3), hunting (2), recreation (2), architecture (1), and 18 other.
The largest proportion (a quarter) of responses called for more rigorous risk assessment of pesticides with regard to pollinators, with most of those calling for the total ban on neonicotinoid use on outdoor crops and/or a glyphosate ban. Specific calls were to research combined effects, effects in combination with lack of food resources, chronic and sublethal effects. Around a tenth of responses also referred to measures to reduce pesticide use, including more stringent national controls and action plans, more IPM/integrated crop management research and advice, and restrictions on non-professional pesticide use.

48
A tenth focused on raising awareness among public authorities and stakeholders on status, needs and benefits of pollinators – general calls for more awareness of benefits (e.g. to public health), on wild pollinators rather than honeybees, and the need for stronger evidence of the actual benefits of certain actions e.g. creating bee hotels.
Around a tenth called for more action for pollinator-friendly habitats in agricultural areas, particularly through a reform of the CAP approach towards payment for public goods and pollinator targets for post-2020. One response called for alternative to greening measures that are more focused on biodiversity benefits, another for support of extensive livestock systems (sheep and cattle).
Specific suggestions included: CAP support for pollinator fallows (set-aside) in arable areas, promotion of local community projects to plant willow and other spring flowering trees and shrubs, more collaborative action between local organisations, farmers, other land managers, local government. Respondents pointed out that some invasive alien plant species benefit pollinators, so action regarding invasive alien species should focus on introduced alien managed pollinators and invasive alien species directly affecting pollinators such as the Asian hornet (Vespa Velutina). Responses from science pointed to the need for systematic monitoring, training of more species experts and identification tools, more taxonomic research (e.g. on hoverflies (Syrphidae) which deserve a special attention), and to the importance of ensuring bee specimens from research projects are archived in museums, etc.
A number of the responses drew attention to initiatives of local organisations, foundations, business (golf courses, extractive industry, financial/investment sector), and beekeepers.


![RHS - Grass Roots: The RHS Community Update Newsletter · 13/14 INTERVIEW dr Mark goddard, Urban Pollinators 15/ RHS AFFILIATED SOCIETIES gardening with disabilities [Norfolk] Grass](https://img.pdfslide.net/doc/110x75/603810148fdd74003d6ed3c0/rhs-grass-roots-the-rhs-community-update-newsletter-1314-interview-dr-mark-goddard.jpg)