Embed Size (px)
Citation preview

EUPT – SRM12March/April 2017
EU Proficiency Test on the Analysis of Pesticides Residues
Requiring Single Residue Methods
in Strawberry Purée
Chemisches und Veterinäruntersuchungsamt
Stuttgart
Final Report
EU Reference Laboratories for Residues of Pesticides Single Residue MethodsEURL-SRM

EU PROFICIENCY TESTEUPT-SRM12, 2017
Residues of PesticidesRequiring
Single Residue Methods
Test Item: Strawberry Purée
Final Report
Michelangelo AnastassiadesPat Schreiter
Anne BenkensteinHubert Zipper
December 2017

The EURL-SRM is accredited by the DAkkS according to EN ISO/IEC 17043. The accreditation is valid for the proficiency testing programs listed in the certificate.
Publication of parts of this EUPT-SRM12 final report by individuals or organizations shall always refer to the original document that can be found under: http://www.eurl-pesticides.eu/library/docs/srm/EUPT_SRM12_FinalReport.pdf
Picture on the book cover: Denis and Yulia Pogostins, www.123rf.com, 24752496

Organisers
Michelangelo Anastassiades
Head of EURL-SRM (Single Residue Methods)CVUA StuttgartDepartment of Residues and ContaminantsSchaflandstrasse 3/2D-70736 Fellbach
Phone: +49-711-3426-1124Fax: +49-711-588176E-Mail: [email protected]
Advisory Group:
Amadeo Fernández-Alba EURL-FV, University of Almería (UAL), ES
Miguel Gamón EURL-FV, Laboratorio Agroalimentario Generalitat Valenciana (LAGV), ES
Mette Erecius Poulsen EURL-CF, National Food Institute (DTU), Søborg, DK
Ralf Lippold EURL-AO, CVUA Freiburg, DE
Philippe Gros Service Commun des Laboratoires (SCL) / Laboratoire de Montpellier, FR
Magnus Jezussek Bavarian Health and Food Safety Authority (LGL), Erlangen, DE
André de Kok Netherlands Food and Consumer Product Safety Authority (NVWA), Wageningen, NL
Sonja Masselter Austrian Agency for Health and Food Safety (AGES), Innsbruck, AT
Finbarr O’Regan Pesticide Control Laboratory (PCL), Department of Agriculture, Food and the Marine, IE
Tuija Pihlström National Food Agency (Livsmedelsverket), Uppsala, SE
Carmelo Rodríguez University of Almería (UAL), ES
Quality Control Group:
Antonio Valverde University of Almería, ES
Paula Medina European Food Safety Authority (EFSA)
Organising Team:
EURL for Pesticides Requiring Single Residue Methods hosted by CVUA Stuttgart
Pat Schreiter, Senior Food Chemist
Anne Benkenstein, Food Chemist
Hubert Zipper, Senior Food Chemist
Erik Eichhorn, Food Chemist
Anja Barth, Chemical Technician
Giovanna Cerchia, Chemical Technician
Sigrid Schüler, Chemical Technician
Cristin Wildgrube, Chemical Technician
EURL for Pesticides in Cereals and Feedingstuff, National Food Institute, Technical University of DenmarkJens-Ole Frimann, Software Programmer
EUPT-Coordinator:

Intr
od
uct
Ion
FOREWORD
v
Fore
wo
rd
FOREWORD
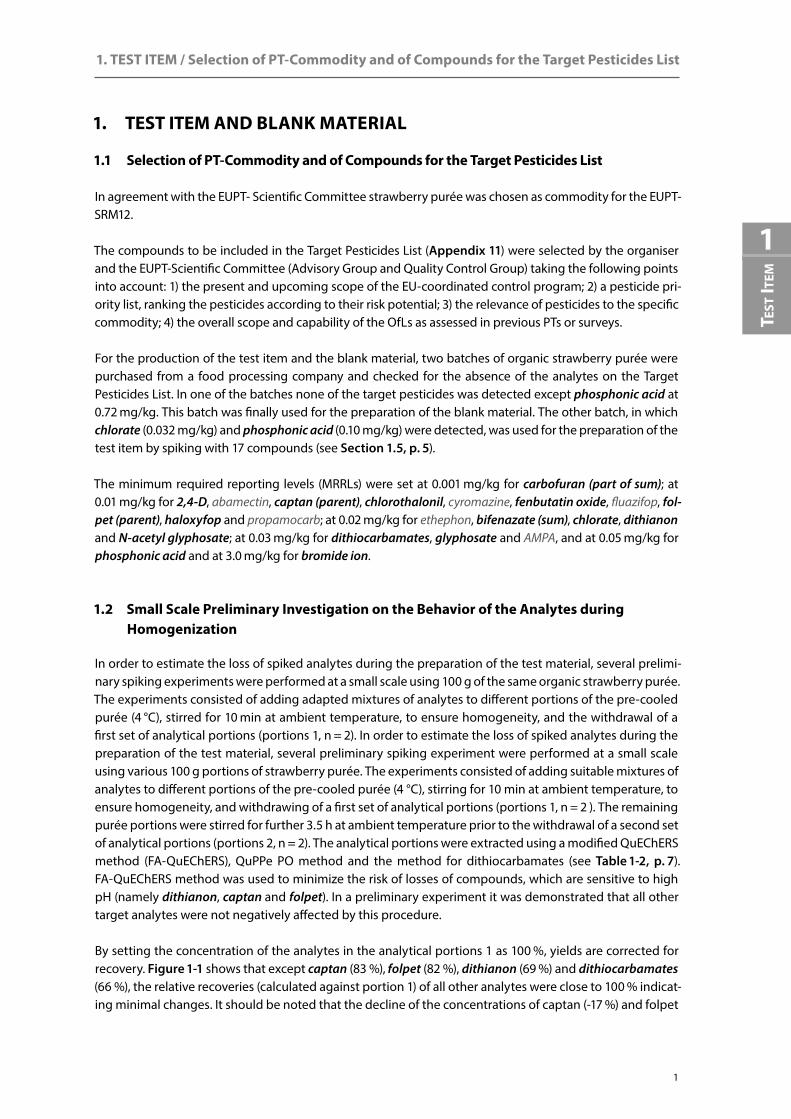
Regulation 882/2004/EC [1] defines the general tasks and duties of the EU Reference Laboratories (EURLs) for Food, Feed and Animal Health1 including the organisation of comparative tests (proficiency tests = PTs). These PTs are carried out on an annual basis and aim to improve the quality, accuracy and comparability of the analytical results generated by EU Member States within the framework of the EU coordinated control programs as well as national monitoring programs. By participating in PTs laboratories can assess and at the same time demonstrate their analytical performance. The attention to details paid by laboratories during PT-analysis, together with the need to identify errors and to take corrective actions in cases of underper-formance, typically lead to improvements in the quality of analytical results.
According to Article 28 of Regulation 396/2005/EC on maximum residue levels of pesticides in or on food and feed of plant and animal origin [2], all laboratories analysing for pesticide residues within the frame-work of official controls shall participate in the European Union Comparative Proficiency Tests (EUPTs) for pesticide residues. Each Official Laboratory (OfL) must participate in EUPTs concerning the commodities included in its area of competence.
Since 2006 the EURL for pesticide residues requiring the use of Single Residue Methods, EURL-SRM, has an-nually conducted one scheduled Proficiency Test. Five of those twelve EUPT-SRMs were conducted in col-laboration with the EURL for pesticide residues in Fruits and Vegetables (EURL-FV) with apple juice (EUPT-SRM1, 2006), carrot homogenate (EUPT-SRM3, 2008), apple purée (EUPT-SRM5, 2010), potato homogenate (EUPT-SRM8, 2013) and spinach homogenate (EUPT-SRM11, 2016) as test items. Further four EUPT-SRMs were conducted in collaboration with the EURL for pesticide residues in Cereals and Feeding Stuff (EURL-CF) with wheat flour (EUPT-C1/SRM2, 2007), oat flour (EUPT-C3/SRM4, 2009), rice flour (EUPT-C5/SRM6, 2011) and maize flour (EUPT-C9/SRM10, 2015) as test items. The EUPT-SRM9 was the only EUPT-SRM so far, in which a commodity of animal origin was used. The remaining three EUPT-SRMs, the EUPT-SRM7 (2012) based on milled dry lentils, the EUPT-SRM9 (2014) based on cow’s milk and the present one, the EUPT-SRM12 based on strawberry purée were organized by the EURL-SRM unilaterally.
Participation in the respective EUPTs is mandatory for all NRLs for pesticides requiring Single Residue Meth- ods (NRL-SRMs) and for all OfLs analysing pesticide residues within the framework of national or EU control programs in commodities represented by the respective EUPT test item. Laboratories in EU Member States analysing pesticide residues within the frame of import controls according to Reg. 669/2009/EC are also considered as performing official controls in the sense of Reg. 882/2005/EC and 396/2005/EC and are thus also obliged to take part in EUPTs. OfLs from EFTA countries (Iceland, Norway and Switzerland) contributing data to the EU-coordinated community control programs, EU laboratories analysing official organic samples within the frame of Reg. 889/2008/EC, as well as OfLs from EU-acceding or -candidate countries (FYROM, Montenegro, Serbia and Turkey) are also invited to take part. A limited number of laboratories from third countries are allowed to take part in this exercise, too. However, only results submitted by labs from EU and EFTA countries are included in the calculation of the assigned values.
Based on information about the commodity scope and labs’ NRL-status a tentative list of EU-labs consid-ered as being obliged to participate in the EUPTs is published at the beginning of each year. The pesticide scope is not taken into account in these lists. NRLs and OfLs listed as being obliged to participate in an EUPT exercise in a given year but deciding not to take part, are always asked to state the reason(s) for their non-participation. The same applies to laboratories originally registering to participate in a certain EUPT but finally not submitting results.
1 Formerly known as Community Reference Laboratories (CRLs)

DG-SANTE has full access to all data of EUPTs including the lab-code/lab-name key. The same applies to all NRLs as far as laboratories belonging to their own country networks are concerned. Results for this EUPT or a series of EUPTs, evaluated on a country by country basis, may be further presented to the European Commission Standing Committee on Plants, Animals, Food and Feed (PAFF)-Section Pesticides Residues ,or during the EURL-Workshops.

Intr
od
uct
Ion
CONTENT
vii
Con
ten
t
CONTENT
FOREWORD ................................................................................................................................................................................v
INTRODUCTION ..................................................................................................................................................................ix
1. TEST ITEM AND BLANk MATERIAL ..............................................................................................1
1.1 Selection of PT-Commodity and of Compounds for the Target Pesticides List ................1
1.2 Small Scale Preliminary Investigation on the Behavior of the Analytes ...............................1
1.3 Preliminary Investigation of Homogeneity ................................................................................................5
1.4 Preparation and Bottling of the Blank Material ......................................................................................5
1.5 Preparation and Bottling of the Test Item ....................................................................................................5
1.6 Packaging and Delivery of PT Materials to Participants ..................................................................5
1.7 Analytical Methods ........................................................................................................................................................7
1.8 Homogeneity Test ..........................................................................................................................................................8
1.9 Storage Stability Test ..................................................................................................................................................8
1.10 Transport Stability Test .......................................................................................................................................... 10
1.11 Organisational Aspects ........................................................................................................................................... 10
2. EVALUATION RULES ....................................................................................................................................... 15
2.1 False Positives and Negatives ............................................................................................................................. 15
2.2 Assigned Values (xpt) and Calculation of the Respective Uncertainties (u(xpt)) ............ 15
2.3 Fixed Target Standard Deviation using FFP-Approach (FFP-σpt) .............................................. 16
2.4 z-Scores ............................................................................................................................................................................... 16
2.5 Laboratory Classification ...................................................................................................................................... 16
3. PARTICIPATION ................................................................................................................................................. 19
4. RESULTS .........................................................................................................................................................................23
4.1 Overview of Results ...................................................................................................................................................23
4.2 Analysis of Blank Material .....................................................................................................................................34
4.3 Assigned Values and Target Standard Deviations ............................................................................. 37
4.4 Assessment of Laboratory Performance ................................................................................................... 37
4.5 Methodological Information ..............................................................................................................................64
4.6 Critical Points in this PT and Post-PT Advices to Participants ....................................................94
4.7 Survey to Collect the Participant’s Feedback on EUPT-SRM12 .................................................95
4.8 Summary, Conclusions, Retrospect and Prospect ..............................................................................95
5. ACkNOWLEDGEMENTS ...........................................................................................................................101
6. REFERENCES ...........................................................................................................................................................101

EUPT-SRM12 | 2017 (Strawberry Purée)
viii
7. APPENDICES .......................................................................................................................................................... A-1
Appendix 1 ................. List of Laboratories Registered to Participate in the EUPT-SRM12 A-1
Appendix 2 ................. Shipment Evaluation .........................................................................................................A-5
Appendix 3 ................. Data of Homogeneity Test ...........................................................................................A-6
Appendix 4 ................. Data of Stability Test ........................................................................................................A-8
Appendix 5 ................. Histograms and kernel Density Estimates of z-score Distributions A-11
Appendix 6 ................. Graphic Presentation of z-Scores ...........................................................................A-14
Appendix 7 ................. Possible Reasons Reported for Poor Performance ..................................A-34
Appendix 8 ................. General EUPT Protocol (7th Ed.) ...............................................................................A-47
Appendix 9 ................. Specific Protocol of EUPT-SRM12 ...........................................................................A-56
Appendix 10 ............... Calendar and Target Pesticides List of EUPT-SRM12 ...............................A-59
EUPT-SRM12: Supplementary Information on Analytical Methodshttp://www.eurl-pesticides.eu/library/docs/srm/EUPT-SRM12_Supplementary_Information.pdf
Evaluation Report on the Feedback Survey on EUPT-SRM12http://www.eurl-pesticides.eu/library/docs/srm/SRM12_Survey_Statistics_Evaluation.pdf

Intr
od
uct
Ion
INTRODUCTION
ix
Intr
od
uCt
Ion
european CommIssIon – eu-proFICIenCy test on resIdues oF pestICIdes
requIrIng sIngle resIdue methods
test Item: strawberry purée
EUPT-SRM12, 2017
INTRODUCTION
On 16 December, 2016 all relevant National Reference Laboratories (NRLs) of the 28 EU-Member States (MS), as well as all relevant EU-Official Laboratories (OfLs) whose contact details were available to the organis-ers (EURL-SRM) were invited to participate in the 12th European Commission‘s Proficiency Test Requiring Single Residue Methods (EUPT-SRM12). The EUPT-SRM12-Website contained links to the Announcement/Invitation Letter, the Calendar, as well as to the Target Pesticides List (see Appendix 11). The Target Pesti-cides List contained 25 compounds potentially being present in the test item. 13 of them were compulsory compounds and were thus considered in the Category A/B classification (based on scope). The compounds of the Target Pesticides List were selected based on a number of criteria and following consultation with the EUPT-Scientific Committee. For each compound a residue definition valid for the PT and the minimum required reporting level (MRRL) were stipulated. Links to the latest version of the “General Protocol” (see Appendix 9) containing information common to all EUPTs and to the “Specific Protocol” (see Appendix 10) valid for the current PT were also provided. The laboratories were able to register on-line from 17 January to 10 February, 2017.
Based on their commodity scope (fruit and vegetables) and their NRL-status (NRL-SRMs) a tentative list of the laboratories considered as being obliged to participate in the EUPT-SRM12 was published on the EURL-Website as well as on the CIRCA BC-platform. To ensure that all relevant official laboratories were informed about this EUPT, the NRLs were asked to forward the invitation to all relevant official laboratories within their countries. It was made clear that the list of obliged laboratories prepared by the EURLs was only tenta-tive, and the real obligation to participate was based on Reg. 396/2005/EC and Reg. 882/2004/EC. Obliged labs that did not intend to participate were asked to provide an explanation.
In total 129 laboratories from EU and EFTA countries agreed to participate in the test. Two laboratories from EU-candidate countries and seven laboratories from third countries have also registered for the present EUPT, and all of them have submitted results.
The proficiency test EUPT-SRM12 was conducted using organic strawberry purée purchased from a food processing company. The test item was prepared by spiking the strawberry purée with 17 compounds dissolved in standard solutions. More details are given in Chapter 1 “Test Materials and Blank Material”.

1
TesT
ITem
1
1. TEST ITEM / Selection of PT-Commodity and of Compounds for the Target Pesticides List
1. TEST ITEM AND BLANk MATERIAL
1.1 Selection of PT-Commodity and of Compounds for the Target Pesticides List
In agreement with the EUPT- Scientific Committee strawberry purée was chosen as commodity for the EUPT-SRM12.
The compounds to be included in the Target Pesticides List (Appendix 11) were selected by the organiser and the EUPT-Scientific Committee (Advisory Group and Quality Control Group) taking the following points into account: 1) the present and upcoming scope of the EU-coordinated control program; 2) a pesticide pri-ority list, ranking the pesticides according to their risk potential; 3) the relevance of pesticides to the specific commodity; 4) the overall scope and capability of the OfLs as assessed in previous PTs or surveys.
For the production of the test item and the blank material, two batches of organic strawberry purée were purchased from a food processing company and checked for the absence of the analytes on the Target Pesticides List. In one of the batches none of the target pesticides was detected except phosphonic acid at 0.72 mg/kg. This batch was finally used for the preparation of the blank material. The other batch, in which chlorate (0.032 mg/kg) and phosphonic acid (0.10 mg/kg) were detected, was used for the preparation of the test item by spiking with 17 compounds (see Section 1.5, p. 5).
The minimum required reporting levels (MRRLs) were set at 0.001 mg/kg for carbofuran (part of sum); at 0.01 mg/kg for 2,4-D, abamectin, captan (parent), chlorothalonil, cyromazine, fenbutatin oxide, fluazifop, fol-pet (parent), haloxyfop and propamocarb; at 0.02 mg/kg for ethephon, bifenazate (sum), chlorate, dithianon and N-acetyl glyphosate; at 0.03 mg/kg for dithiocarbamates, glyphosate and AMPA, and at 0.05 mg/kg for phosphonic acid and at 3.0 mg/kg for bromide ion.
1.2 Small Scale Preliminary Investigation on the Behavior of the Analytes during Homogenization
In order to estimate the loss of spiked analytes during the preparation of the test material, several prelimi-nary spiking experiments were performed at a small scale using 100 g of the same organic strawberry purée. The experiments consisted of adding adapted mixtures of analytes to different portions of the pre-cooled purée (4 °C), stirred for 10 min at ambient temperature, to ensure homogeneity, and the withdrawal of a first set of analytical portions (portions 1, n = 2). In order to estimate the loss of spiked analytes during the preparation of the test material, several preliminary spiking experiment were performed at a small scale using various 100 g portions of strawberry purée. The experiments consisted of adding suitable mixtures of analytes to different portions of the pre-cooled purée (4 °C), stirring for 10 min at ambient temperature, to ensure homogeneity, and withdrawing of a first set of analytical portions (portions 1, n = 2 ). The remaining purée portions were stirred for further 3.5 h at ambient temperature prior to the withdrawal of a second set of analytical portions (portions 2, n = 2). The analytical portions were extracted using a modified QuEChERS method (FA-QuEChERS), QuPPe PO method and the method for dithiocarbamates (see Table 1-2, p. 7). FA-QuEChERS method was used to minimize the risk of losses of compounds, which are sensitive to high pH (namely dithianon, captan and folpet). In a preliminary experiment it was demonstrated that all other target analytes were not negatively affected by this procedure.
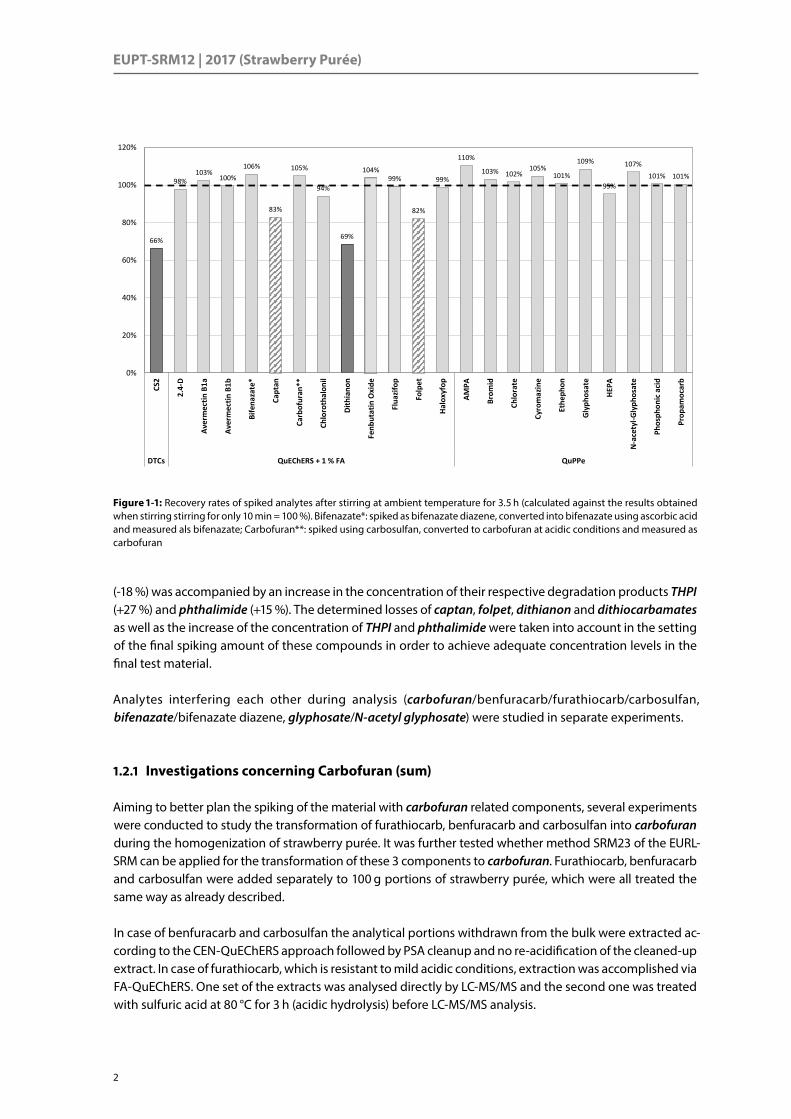
By setting the concentration of the analytes in the analytical portions 1 as 100 %, yields are corrected for recovery. Figure 1-1 shows that except captan (83 %), folpet (82 %), dithianon (69 %) and dithiocarbamates (66 %), the relative recoveries (calculated against portion 1) of all other analytes were close to 100 % indicat-ing minimal changes. It should be noted that the decline of the concentrations of captan (-17 %) and folpet
EUPT-SRM12 | 2017 (Strawberry Purée)
2
66%
98%103%
100%106%
83%
105%
94%
69%
104%99%
82%
99%
110%
103% 102%105%
101%
109%
95%
107%101% 101%
0%
20%
40%
60%
80%
100%
120%CS
2
2.4-
D
Aver
mec
tin B
1a
Aver
mec
tin B
1b
Bife
naza
te*
Capt
an
Carb
ofur
an**
Chlo
roth
alon
il
Dith
iano
n
Fenb
utat
in O
xide
Flua
zifo
p
Folp
et
Halo
xyfo
p
AMPA
Brom
id
Chlo
rate
Cyro
maz
ine
Ethe
phon
Glyp
hosa
te
HEPA
N-a
cety
l-Gly
phos
ate
Phos
phon
ic a
cid
Prop
amoc
arb
DTCs QuEChERS + 1 % FA QuPPe
Figure 1-1: Recovery rates of spiked analytes after stirring at ambient temperature for 3.5 h (calculated against the results obtained when stirring stirring for only 10 min = 100 %). Bifenazate*: spiked as bifenazate diazene, converted into bifenazate using ascorbic acid and measured als bifenazate; Carbofuran**: spiked using carbosulfan, converted to carbofuran at acidic conditions and measured as carbofuran
(-18 %) was accompanied by an increase in the concentration of their respective degradation products THPI (+27 %) and phthalimide (+15 %). The determined losses of captan, folpet, dithianon and dithiocarbamates as well as the increase of the concentration of THPI and phthalimide were taken into account in the setting of the final spiking amount of these compounds in order to achieve adequate concentration levels in the final test material.
Analytes interfering each other during analysis (carbofuran/benfuracarb/furathiocarb/carbosulfan, bifenazate/bifenazate diazene, glyphosate/N-acetyl glyphosate) were studied in separate experiments.
1.2.1 Investigations concerning Carbofuran (sum)
Aiming to better plan the spiking of the material with carbofuran related components, several experiments were conducted to study the transformation of furathiocarb, benfuracarb and carbosulfan into carbofuran during the homogenization of strawberry purée. It was further tested whether method SRM23 of the EURL-SRM can be applied for the transformation of these 3 components to carbofuran. Furathiocarb, benfuracarb and carbosulfan were added separately to 100 g portions of strawberry purée, which were all treated the same way as already described.
In case of benfuracarb and carbosulfan the analytical portions withdrawn from the bulk were extracted ac-cording to the CEN-QuEChERS approach followed by PSA cleanup and no re-acidification of the cleaned-up extract. In case of furathiocarb, which is resistant to mild acidic conditions, extraction was accomplished via FA-QuEChERS. One set of the extracts was analysed directly by LC-MS/MS and the second one was treated with sulfuric acid at 80 °C for 3 h (acidic hydrolysis) before LC-MS/MS analysis.
3
TesT
ITem
1
1. TEST ITEM and Blank Material / Investigation on Analysis of Carbofuran and Bifenazate
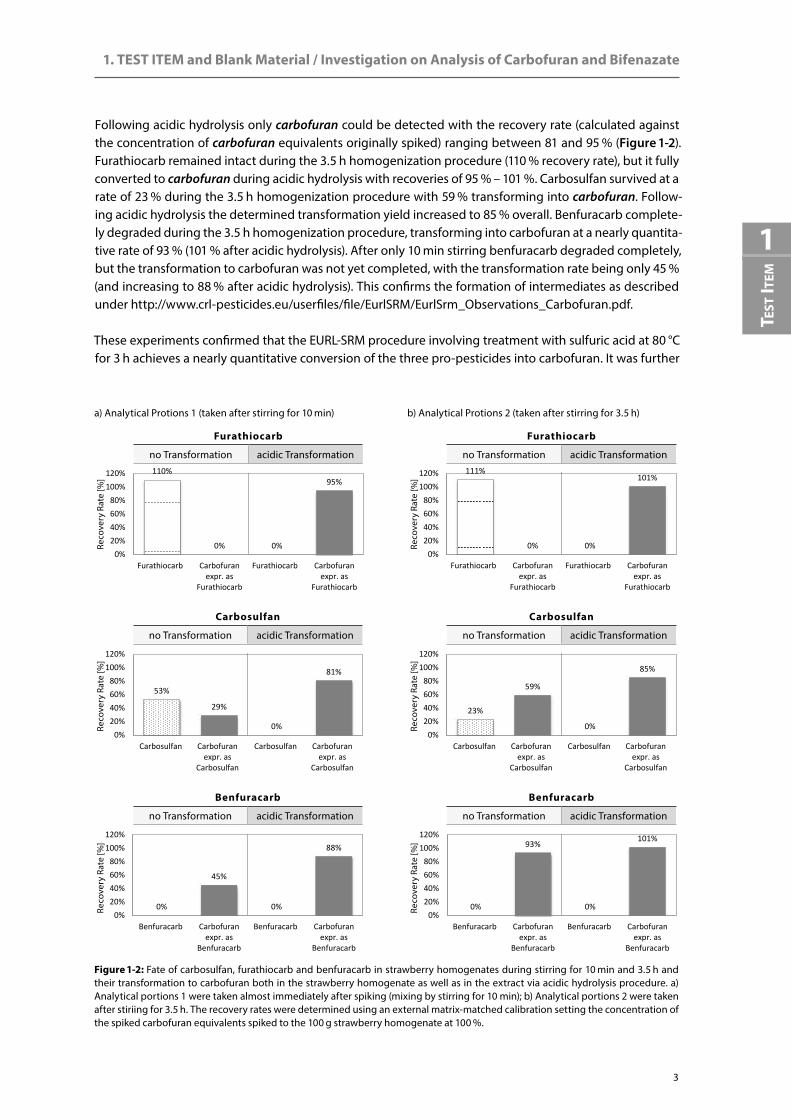
Figure 1-2: Fate of carbosulfan, furathiocarb and benfuracarb in strawberry homogenates during stirring for 10 min and 3.5 h and their transformation to carbofuran both in the strawberry homogenate as well as in the extract via acidic hydrolysis procedure. a) Analytical portions 1 were taken almost immediately after spiking (mixing by stirring for 10 min); b) Analytical portions 2 were taken after stiriing for 3.5 h. The recovery rates were determined using an external matrix-matched calibration setting the concentration of the spiked carbofuran equivalents spiked to the 100 g strawberry homogenate at 100 %.
110%
0% 0%
95%
0%20%40%60%80%
100%120%
Furathiocarb Carbofuranexpr. as
Furathiocarb
Furathiocarb Carbofuranexpr. as
Furathiocarb
Furathiocarb
no Transformation acidic Transformation
53%
29%
0%
81%
0%20%40%60%80%
100%120%
Carbosulfan Carbofuranexpr. as
Carbosulfan
Carbosulfan Carbofuranexpr. as
Carbosulfan
Carbosulfan
no Transformation acidic Transformation
0%
45%
0%
88%
0%20%40%60%80%
100%120%
Benfuracarb Carbofuranexpr. as
Benfuracarb
Benfuracarb Carbofuranexpr. as
Benfuracarb
Benfuracarb
no Transformation acidic Transformation
111%
0% 0%
101%
0%20%40%60%80%
100%120%
Furathiocarb Carbofuranexpr. as
Furathiocarb
Furathiocarb Carbofuranexpr. as
Furathiocarb
Furathiocarb
no Transformation acidic Transformation
23%
59%
0%
85%
0%20%40%60%80%
100%120%
Carbosulfan Carbofuranexpr. as
Carbosulfan
Carbosulfan Carbofuranexpr. as
Carbosulfan
Carbosulfan
no Transformation acidic Transformation
0%
93%
0%
101%
0%20%40%60%80%
100%120%
Benfuracarb Carbofuranexpr. as
Benfuracarb
Benfuracarb Carbofuranexpr. as
Benfuracarb
Benfuracarb
no Transformation acidic Transformation
a) Analytical Protions 1 (taken after stirring for 10 min) b) Analytical Protions 2 (taken after stirring for 3.5 h)
Reco
very
Rat
e [%
]Re
cove
ry R
ate
[%]
Reco
very
Rat
e [%
]
Reco
very
Rat
e [%
]Re
cove
ry R
ate
[%]
Reco
very
Rat
e [%
]
Following acidic hydrolysis only carbofuran could be detected with the recovery rate (calculated against the concentration of carbofuran equivalents originally spiked) ranging between 81 and 95 % (Figure 1-2). Furathiocarb remained intact during the 3.5 h homogenization procedure (110 % recovery rate), but it fully converted to carbofuran during acidic hydrolysis with recoveries of 95 % – 101 %. Carbosulfan survived at a rate of 23 % during the 3.5 h homogenization procedure with 59 % transforming into carbofuran. Follow-ing acidic hydrolysis the determined transformation yield increased to 85 % overall. Benfuracarb complete-ly degraded during the 3.5 h homogenization procedure, transforming into carbofuran at a nearly quantita-tive rate of 93 % (101 % after acidic hydrolysis). After only 10 min stirring benfuracarb degraded completely, but the transformation to carbofuran was not yet completed, with the transformation rate being only 45 % (and increasing to 88 % after acidic hydrolysis). This confirms the formation of intermediates as described under http://www.crl-pesticides.eu/userfiles/file/EurlSRM/EurlSrm_Observations_Carbofuran.pdf.
These experiments confirmed that the EURL-SRM procedure involving treatment with sulfuric acid at 80 °C for 3 h achieves a nearly quantitative conversion of the three pro-pesticides into carbofuran. It was further
EUPT-SRM12 | 2017 (Strawberry Purée)
4
observed that furathiocarb remains stable during homogenization whereas benfuracarb rapidly degrades with intermediates being formed, which are gradually transformed to carbofuran. Based on the results it was decided to add carbosulfan to the sample as it results in a challenging residue situation where both carbosulfan and carbofuran are present in the sample.
1.2.2 Investigations concerning Bifenazate (sum)
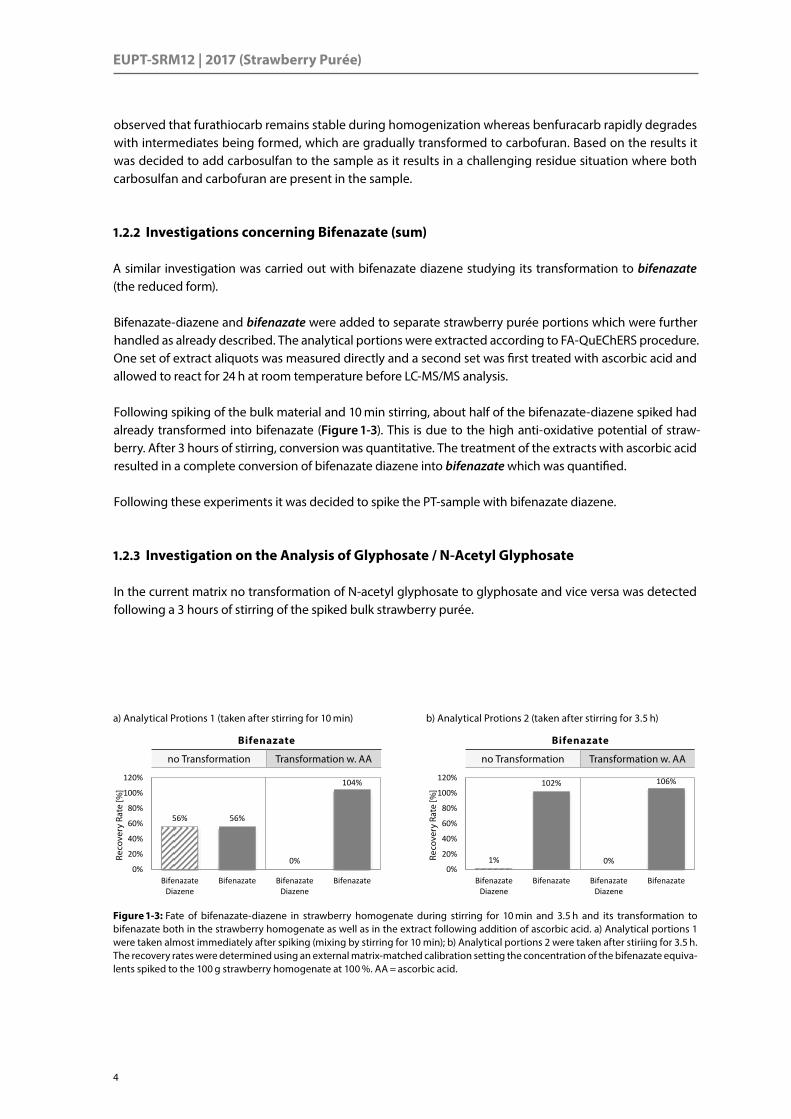
A similar investigation was carried out with bifenazate diazene studying its transformation to bifenazate (the reduced form).
Bifenazate-diazene and bifenazate were added to separate strawberry purée portions which were further handled as already described. The analytical portions were extracted according to FA-QuEChERS procedure. One set of extract aliquots was measured directly and a second set was first treated with ascorbic acid and allowed to react for 24 h at room temperature before LC-MS/MS analysis.
Following spiking of the bulk material and 10 min stirring, about half of the bifenazate-diazene spiked had already transformed into bifenazate (Figure 1-3). This is due to the high anti-oxidative potential of straw-berry. After 3 hours of stirring, conversion was quantitative. The treatment of the extracts with ascorbic acid resulted in a complete conversion of bifenazate diazene into bifenazate which was quantified.
Following these experiments it was decided to spike the PT-sample with bifenazate diazene.
1.2.3 Investigation on the Analysis of Glyphosate / N-Acetyl Glyphosate
In the current matrix no transformation of N-acetyl glyphosate to glyphosate and vice versa was detected following a 3 hours of stirring of the spiked bulk strawberry purée.
Figure 1-3: Fate of bifenazate-diazene in strawberry homogenate during stirring for 10 min and 3.5 h and its transformation to bifenazate both in the strawberry homogenate as well as in the extract following addition of ascorbic acid. a) Analytical portions 1 were taken almost immediately after spiking (mixing by stirring for 10 min); b) Analytical portions 2 were taken after stiriing for 3.5 h. The recovery rates were determined using an external matrix-matched calibration setting the concentration of the bifenazate equiva-lents spiked to the 100 g strawberry homogenate at 100 %. AA = ascorbic acid.
1%
102%
0%
106%
0%
20%
40%
60%
80%
100%
120%
BifenazateDiazene
Bifenazate BifenazateDiazene
Bifenazate
56% 56%
0%
104%
0%
20%
40%
60%
80%
100%
120%
BifenazateDiazene
Bifenazate BifenazateDiazene
Bifenazate
Bifenazate
no Transformation Transformation w. AA
Bifenazate
no Transformation Transformation w. AA
a) Analytical Protions 1 (taken after stirring for 10 min) b) Analytical Protions 2 (taken after stirring for 3.5 h)
Reco
very
Rat
e [%
]
Reco
very
Rat
e [%
]

1. TEST ITEM and Blank Material / Preliminary Investigation of Homogeneity
5
TesT
ITem
1
1.3 Preliminary Investigation of Homogeneity
On one hand the homogeneity of the sample portions can be reached by long and thorough mixing, on the other hand the procedure of mixing should be kept as short as necessary to keep degradation at tolerable levels. In order to estimate the stirring duration required to achieve satisfactory homogeneity, 75 kg organic strawberry purée were precooled over night at 4 °C. The material was spiked with a mixture of compounds covering a broad polarity range: fenbutatin oxide (logP 18.4), chlorpyrifos (logP 4.7), dimethoate (logP 0.34), linuron (logP 2.3), thiacloprid (logP 2.1), carbofuran (logP 2.1) and pyraclostrobin (logP 4.7). After spiking with different pesticides and mixing for 30 min at ambient temperature, two sample portions were withdrawn from each the top, the middle and the bottom layer of the container for analysis. As the results showed satisfactory homogeneity for all compounds already after 30 min of stirring, no further investigations were deemed necessary. Precooling over night at 4 °C and mixing for 60 min was considered appropriate for the preparation of the test item.
1.4 Preparation and Bottling of the Blank Material
Approximately 99 kg organic strawberry purée from 68 packages, each containing 1.5 kg, were pooled in a large plastic vessel, mixed intensively for 30 min using a large mixer and placed in a walk-in refrigerator over night at 4 °C for pre-cooling. On the following day 100 ml of a solvent mixture were slowly added to the cold material, while gently stirring with the mixer. The solvent mixture consisted of 50 ml acetonitrile and 50 ml of water and corresponded both in volume and composition to the spiking solution (see below). Following the addition of the solvent the mixture was gently stirred for 60 min to ensure homogeneity. The mixture was portioned into pressure lock plastic bags and frozen at −20 °C in thin layers over night. The frozen straw-berry purée layers were cryogenically milled using dry ice and filled into the bottles in a snow-like state. Ap-proximately 400 g portions of the well-mixed blank strawberry purée were weighed out into labelled and leak-proof screw-capped polyethylene plastic bottles, sealed and stored in a freezer at about −20 °C until distribution to participants.
1.5 Preparation and Bottling of the Test Item
The test item was prepared exactly in the same way as the blank material described above, but instead of adding pure solvent 100 ml of an equally composed mixture containing the target analytes was added. The mixture contained 17 different compounds and was prepared as described in Table 1-1 (p. 6). The following steps of homogenisation, portioning and storage were conducted in exactly the same way as for the blank material described above.
1.6 Packaging and Delivery of PT Materials to Participants
On the day of shipment, two frozen bottles, one with test item and the other one with blank material, as well as two vials, one containing isotope labelled chlorate solution and the other one containing isotope labelled phosphonate solution, were packed into thermo-insulated polystyrene boxes, filled-up with dry ice pellets (approx. 2 kg in each box) and shipped by DHL-Express to the laboratories. Where the dry ice transport was not allowed (due to IATA regulations), bigger and thick-walled thermo-insulated polystyrene boxes were used. Sufficient cooling elements were added to the boxes, and the filled packages were deep frozen at −70 °C for three days until shortly before shipment. Once the parcel was picked up by DHL, the recipient received an e-mail from the shipping company entailing the individual tracking number.

EUPT-SRM12 | 2017 (Strawberry Purée)
6
Among the 130 shipments to destinations in EU and EFTA countries 110 (85 %) of the packages arrived at the participating labs within 24 hours and 20 (15 %) of the packages within 48 hours. The delivery to coun-tries outside the EU and EFTA zones was accomplished within 48 hours in 5 cases, within 72 hours in 2 cases, and within 4 days in 2 cases. The main reason for the long delivery times were delays at customs clearance. Details on the shipments and the condition of the Test Items upon arrival are shown in Appendix 2. 17 laboratories reported that the labels had come off both of the bottles. Except one laboratory, all other 16 laboratories accepted the materials and could distinguish the bottles by a preliminary screening. In another 4 cases the labels had come off one of the bottles. The organisers will re-test the labels to make sure that this problem will not be repeated in the future.
The participants were asked to describe the condition of the test samples upon arrival. The materials in the 110 parcels arriving the participants within one day were fully frozen and embedded in dry ice. The materials in the 18 of the 25 parcels that arrived the participants within two days were in most cases still fully frozen, even in those cases where no more dry ice was left in the boxes or where the parcels were sent with only gel packs. Another 5 participants receiving their parcels within 2 days reported that the mate-rial was mostly frozen (in 3 cases) or mostly defrosted (in 2 cases). In the two cases that the parcels arrived the participants within 3 days, the material of one parcel was still mostly frozen and the other one mostly defrosted. In the two cases where the parcels arrived after 4 days, the materials were fully defrosted and even at ambient temperature in one case. However, no noticeable negative influence due to the condition of material on arrival on the results was observed.
At this point organisers would like to appeal to the participants to follow their own parcels via the online tracking tool of the shipping company in order to maintain the ability to take the necessary measures in case of delays, e.g., contacting the customs to ask for an acceleration of the clearance procedure or to place the parcel in a cool place until clearance is granted. The participants are furthermore encouraged to con-tact the local office of the shipping company to ensure optimal delivery.
Table 1-1: Analytes spiked into 99 kg strawberry purèe for the preparation of the test material
Analytes dissolved in 50 ml ACN Theor. Conc. Analytes dissolved in 50 ml H2O Theor. Conc.
Compound Amount [mg/kg] Compound Amount [mg/kg]
Thiram 59.5 mg 0.601 1) Glyphosate 30.5 mg 0.308
Captan 10.5 mg 0.106 Potassium bromide 2985 mg 30.2 3)
Chlorothalonil 15.6 mg 0.158 Sodium chlorate 63.0 mg 0.636 4)
Folpet 42.4 mg 0.428 Phosphonic acid 2031 mg 20.5
THPI 10.0 mg 0.101 N-Acetyl glyphosate 10.0 mg 5) 0.101
Phthalimide 39.5 mg 0.399
2,4-D (free acid) 8.1 mg 0.082
Haloxyfop (free acid) 7.2 mg 0.073
Dithianon 34.9 mg 0.353
Fenbutatin oxide 10.6 mg 0.107
Bifenazate-Diazene 29.2 mg 0.295 2)
Carbosulfan (1.0 mg/ml ACN) 0.9 ml 0.0091
1) as CS2 0.380 mg/kg; 2) as bifenazate 0.293 mg/kg; 3) as bromide ion 20.3 mg/kg; 4) as chlorate 0.510 mg/kg; 5) one packing unit of 10 mg

1. TEST ITEM and Blank Material / Analytical Methods
7
TesT
ITem
1Table 1-2: Analytical methods used by the organisers to check for the homogeneity and storage-stability of the pesticides present in the test item and to demonstrate the absence of other pesticides in the blank material.
Compound Extraction IS Determinative analysis Notes
Bifenazate 1) Modified QuEChERS-method [3] involving: weighing of 10 g strawberry purée into a sealable vessel, addition of IS / ILISs, extraction with ACN + 1 % formic acid (15 min), addition of par-titioning salts (4 g MgSO4, 1 g NaCl), 1 min shaking, centrifugation (twice with interval of 30 min and cooling down to 5 °C), and direct determina-tion by LC-MS/MS in the ESI (neg.) and ESI (pos) mode.
Chlorpyrifos D10 LC-MS/MS ESI (pos)
Carbofuran 2) Carbofuran D3 LC-MS/MS ESI (pos)
Fenbutatin Oxide
Fenbutatin Oxide D30 LC-MS/MS ESI (pos)
2,4-D 2,4-D D3 LC-MS/MS ESI (neg)
Dithianon Dithianon D4 LC-MS/MS ESI (neg)
Haloxyfop Haloxyfop D4 LC-MS/MS ESI (neg)
Chlorothalonil Chlorpyrifos D10 GC-MS/MS EI (pos)
Captan (parent) Captan D6 GC-MS/MS EI (pos)
Folpet (parent) Folpet D4 GC-MS/MS EI (pos)
Phthalimide Chlorpyrifos D10 GC-MS/MS EI (pos)
THPI Chlorpyrifos D10 GC-MS/MS EI (pos)
Captan (sum) calculated from captan (parent) and THPI
Folpet (sum) calculated from folpet (parent) and phthalimide
Abamectin* Chlorpyrifos D10 LC-MS/MS ESI (pos)
Fluazifop* BNPU LC-MS/MS ESI (neg)
Bromide ion QuPPe-PO method [5] involving: weighing of 10 g strawberry purée into a sealable vessel, addition of ILISs, addition of methanol containing 1 % formic acid, shaking, centrifuga-tion, filtration and direct determina-tion by LC-MS/MS in the ESI (neg.) or ESI (pos.) mode.
LC-MS/MS ESI (neg) QuPPe M1.4
Chlorate Chlorate 18O3 LC-MS/MS ESI (neg) QuPPe M1.4
Glyphosate Glyphosate 1,2-13C2, 15N LC-MS/MS ESI (neg) QuPPe M1.3
N-Acetyl glypho-sate
N-Acetyl glyphosate 13C2, 15N LC-MS/MS ESI (neg) QuPPe M1.4
Phosphonic acid Phosphonic acid 18O3 LC-MS/MS ESI (neg) QuPPe M1.4
AMPA* AMPA 13C 15N LC-MS/MS ESI (neg) QuPPe M1.3
Cyromazine* Cyromazine D4 LC-MS/MS ESI (pos) QuPPe M4.2
Ethephon* Ethephon D4 LC-MS/MS ESI (neg) QuPPe M1.3
Propamocarb* Propamocarb D7 LC-MS/MS ESI (pos) QuPPe M4.2
CS2 Dithiocarbamate method involving: weighing of 20 g strawberry purée into a sealable glass vessel, addition of chloroform (as IS), 25 ml iso-octane and 150 ml SnCl2/HCl, followed by cleavage to CS2 in a shaking water bath for 2 h at 80º C and GC-ECD analysis.
Chloroform GC-ECD –
* : To check for absence in Blank Material1) Conversion of bifenazate-diazene, possibly present in the final QuEChERS extract, into bifenazate with ascorbic acid.2) Conversion of carbosulfan, benfuracarb and furathiocarb, possibly present in the QuEChERS extract, into carbofuran with 5 N H2SO4 at 80 °C.
1.7 Analytical Methods
The analytical methods used by the organisers to check the homogeneity and storage-stability of the tar-get analytes contained in the test item as well as the absence of target analytes in the blank material are summarized in Table 1-2. For more details on the methods used, please refer to the EURL-SRM website: http://www.eurl-pesticides.eu (EURL-SRM-website Services Methods).
EUPT-SRM12 | 2017 (Strawberry Purée)
8
1.8 Homogeneity Test
After filling the test item in the bottles, 10 bottles were randomly chosen for the homogeneity test and two analytical portions were taken from each for analysis. Both the order of sample preparation and the order of extract injection into the analytical instruments were random. Matrix-matched calibration using extract prepared from blank material or procedural calibration using blank material were applied for quantifica-tion. Analytical portions of 20 g for dithiocarbamates and 10 g for all other compounds were used.
The statistical evaluation of the homogeneity test data was performed according to the International Har- monized Protocols published by IUPAC, ISO and AOAC [4, 6]. An overview of the statistical evaluations of the homogeneity test is shown in Table 1-3. The individual residue data of the homogeneity test is given in Appendix 3.
The acceptance criterion for the test item to be sufficiently homogeneous for the Proficiency Test was that ssam
2 is smaller than c with ssam being the between-bottle sampling standard deviation and c = F1 × σall
2 + F2 × san2, F1 and F2 being constants with values of 1.88 and 1.01, respectively, and applying
when duplicate samples are taken from 10 bottles. σall2 = 0.3 × FFP-RSD (25 %) × the analytical sampling
mean of the analyte, and san is the estimate of the analytical standard deviation.
As all target compounds passed the homogeneity test, the test item was considered to be sufficiently ho-mogenous and suitable for the EUPT-SRM12.
1.9 Storage Stability Test
In the Specific Protocol laboratories were recommended storing the samples in the freezer until analysis. The stability test samples were thus also stored under the same conditions. Shortly after the shipment of the samples to the participants, three of the spare test item bottles were chosen randomly and all analyti-cal portions necessary for all three stability tests were weighed into the vessels in which the analysis was to be conducted. The portions of stability tests 1 were extracted immediately and those of stability tests 2 and 3 were placed in the freezer at −20 °C until analysis as described in Section 1.7 (p. 7). The extracts of all stability tests corresponding to one method were stored in the freezer at −20 °C and measured iso-chronically (within the same sequence) at a day suitable for the laboratory.
Stability test 1 (extraction shortly after shipment): 24 March 2017 (analytes via QuPPe-Methods) 29 March 2017 (analytes via QuEChERS-Methods) 06 April 2017 (dithiocarbamates)
Stability test 2 (extraction five weeks after shipment): 13 April 2017 (analytes via QuPPe-Methods) 19 April 2017 (analytes via QuEChERS-Methods) 27 April 2017 (dithiocarbamates)
Stability test 3 (extraction four weeks after deadline for results submission): 12 May 2017 (analytes via QuPPe-Methods) 11 May 2017 (analytes via QuEChERS-Methods) 18 May 2017 (dithiocarbamates)

1. TEST ITEM and Blank Material / Storage Stability Test
9
TesT
ITem
1
COMPULSORY COMPOUNDS
2,4-
D
Capt
an (p
aren
t)
Chlo
roth
alon
il
Dit
hioc
arba
mat
es
Fenb
utat
in o
xide
Folp
et (p
aren
t)
Gly
phos
ate
Hal
oxyo
p
Analytical portion size [g] 10 10 10 20 10 10 10 10
Mean [mg/kg] 0.079 0.094 0.135 0.261 0.096 0.395 0.305 0.074
ssam2 8.72 × 10⁻⁷ 0.00 0.00 0.00 0.00 0.00 2.66 × 10⁻⁴ 6.44 × 10⁻⁷
c 6.76 × 10⁻⁵ 1.02 × 10⁻⁴ 2.34 × 10⁻⁴ 1.23 × 10⁻³ 1.01 × 10⁻⁴ 1.72 × 10⁻⁴ 1.64 × 10⁻³ 6.20 × 10⁻⁵
Passed/Failed passed passed passed passed passed passed passed passed
Table 1-3: Statistical evaluation of homogeneity test data (n = 20), details please see Appendix 3.
OPTIONAL COMPOUNDS
Bife
naza
te (s
um)
Brom
ide
ion
Carb
ofur
an
(par
t of s
um)
Chlo
rate
Dit
hian
on
Phos
phon
ic a
cid
N-A
cety
l-
glyp
hosa
te
Analytical portion size [g] 10 10 10 10 10 10 10
Mean [mg/kg] 0.275 21.0 0.0043 0.489 0.314 18.5 0.088
ssam2 3.78 × 10⁻⁷ 0.00 9.44 × 10⁻¹⁰ 1.18 × 10⁻⁴ 3.87 × 10⁻⁵ 0.00 1.49 × 10⁻⁶
c 8.89 × 10⁻⁴ 5.96 2.13 × 10⁻⁷ 2.74 × 10⁻³ 1.13 × 10⁻³ 3.99 9.89 × 10⁻⁵
Passed/Failed passed passed passed passed passed passed passed
ADDITIONAL COMPOUNDS
Capt
an (s
um)
Folp
et (s
um)
Phth
alim
ide
THPI
Analytical portion size [g] 10 10 10 10
Mean [mg/kg] 0.288 1.196 0.099 0.396
ssam2 0.00 2.86 × 10⁻⁵ 0.00 0.00
c 9.63 × 10⁻⁴ 1.70 × 10⁻² 1.25 × 10⁻⁴ 2.18 × 10⁻³
Passed/Failed passed passed passed passed
ssam2 : sampling variance; c: critical value
A target compound is considered to be adequately stable if |yi − y| ≤ 0.3 × σpt, where yi is the mean value of the last period of the stability test, y is the mean value of the first period of the stability test and σpt the standard deviation used for proficiency assessment, typically 25 % of the assigned value. With the excep-tion of phthalimide and THPI, all other analytes contained in the test item showed a stability within the acceptable limits when stored under the recommended conditions (−18 °C) within a period exceeding the duration of the exercise by two weeks (Table 1-4, p. 10). For the compounds passing the test it is as-sumed that, if the recommended storage conditions were followed, the influence of sample storage on the results of these analytes was negligible at least throughout the duration of the EUPT.

EUPT-SRM12 | 2017 (Strawberry Purée)
10
Table 1-4: Results of storage stability test (storage at -18 ºC). Please see the text or Appendix 4 for the dates of analysis for each analytes.
COMPULSORY COMPOUNDS
2,4-
D
Capt
an (p
aren
t)
Chlo
roth
alon
il
Dit
hioc
arba
mat
es
Fenb
utat
in o
xide
Folp
et (p
aren
t)
Gly
phos
ate
Hal
oxyo
p
Storage at −18 ºC (mean values in mg/kg)
Analysis 1 24. + 29.03.2017 + 06.04.2017
0.079 0.087 0.141 0.258 0.097 0.398 0.306 0.075
Analysis 2 13. + 19. + 27.04.2017
0.079 0.093 0.134 0.260 0.098 0.393 0.292 0.074
Analysis 3 11. + 12. + 18.05.2017
0.078 0.088 0.137 0.244 0.099 0.388 0.287 0.073
Deviation [mg/kg] ([%]) Analysis 3 vs. Analysis 1
0.001 (-0,8 %)
0.001 (1.3 %)
0.004 (-3.4 %)
0.014 (-5.6 %)
0.002 (2.0 %)
0.010 (-2.5 %)
0.019 (-6.3 %)
0.001 (-1,8 %)
0.3 × σpt [mg/kg] 0.006 0.006 0.009 0.020 0.006 0.025 0.023 0.005
Passed/Failed passed passed passed passed passed passed passed passed
OPTIONAL COMPOUNDS
Bife
naza
te (s
um)
Brom
ide
ion
Carb
ofur
an
(par
t of s
um)
Chlo
rate
Dit
hian
on
Phos
phon
ic a
cid
N-A
cety
l-
glyp
hosa
te
Storage at −18 ºC (mean values in mg/kg)
Analysis 1 24. + 29.03.2017
0.290 20.1 0.0043 0.431 0.322 18.4 0.087
Analysis 2 13. + 19.04.2017
0.284 20.0 0.0042 0.451 0.318 19.0 0.087
Analysis 3 11. + 12.05.2017
0.283 19.8 0.0045 0.434 0.325 18.4 0.085
Deviation [mg/kg] ([%]) Analysis 3 vs. Analysis 1
0.007 (-2.4 %)
0.383 (-1.9 %)
0.0002 (4.0 %)
0.002 (0.5 %)
0.003 (0,9 %)
0.057 (-0.3 %)
0.001 (-1.7 %)
0.3 × σpt [mg/kg] 0.020 1.433 0.0002 0.037 0.022 1.448 0.008
Passed/Failed passed passed passed passed passed passed passed
ADDITIONAL COMPOUNDS
Capt
an (s
um)
Folp
et (s
um)
Phth
alim
ide
THPI
Storage at −18 ºC (mean values in mg/kg)
Analysis 1 29.03.2017
0.286 1.182 0.389 0.100
Analysis 2 19.04.2017
0.293 1.199 0.400 0.101
Analysis 3 11.05.2017
0.268 1.081 0.344 0.090
Deviation [mg/kg] ([%]) Analysis 3 vs. Analysis 1
0.018 (-6.3 %)
0.101 (-8.5 %)
0.045 (-11.6 %)
0.010 (-9.7 %)
0.3 × σpt [mg/kg] 0.023 0.090 0.033 0.008
Passed/Failed passed failed failed failed

1. TEST ITEM and Blank Material / Transport Stability Test
11
TesT
ITem
1
In the case of phthalimide and THPI the determined concentrations in day 3 were by 11.6 and 9.7 %, respec-tively, lower than those determined in day 1. This decline was a bit higher than the tolerance of 8.725 %. Based on experience with these compounds, however, the more likely scenario would have actually been the degradation of the parents with a parallel increase of the THPI and phthalimide concentrations (see also preliminary test under Section 1.2). It should be emphasized, however, that the analysis of THPI and phthalimide is quite challenging as these compounds are additionally formed during the thermal degrada-tion of captan and folpet in the GC-injector. The analytical results of THPI and phthalimide are thus associ-ated with a considerable uncertainty and it is not unlikely that the determined deviations are more related to spurious analytical errors rather than to degradation. The higher concentration in day 2 compared to day 1 also points towards this direction. As THPI and phthalimide are only shown for informative purposes in the PT ("additional compounds"), no further measures were deemed necessary.
The results of all analyses conducted within the framework of the stability test are shown in Table 1-4 and Appendix 4.
1.10 Transport Stability Test
With the exception of 4 laboratories where the shipments were retarded due to customs clearance delays or remote location, all other 135 laboratories (97 %) received their test items within 48 hours. Among these 135 laboratories 110 received the parcels within one day, all of them reporting that the material was embed-ded in dry ice. 18 among the 25 laboratories receiving the parcels between 24 and 48 hours reported that the material was received in fully frozen state, 5 laboratories reported that it was mostly frozen, and only 2 laboratories reported that it was mostly defrosted.
As the vast majority of the laboratories received their samples in frozen state, the organisers decided not to conduct the transport stability test in the current PT.
1.11 Organisational Aspects
1.11.1 Preparation and Distribution of a Tentative List of Obliged Laboratories
A tentative list of laboratories (NRLs and OfLs) obliged to participate in the current EUPT was compiled based on available information on NRL-status and commodity scope as recorded in the EURL-DataPool. The available information on the pesticide scope covered by the laboratories was not considered when drafting this list due to concerns that it might not be up-to-date and/or not applicable to the present commodity (strawberry). The tentative list was distributed to the OfLs and the NRLs so that all laborato-ries could check their own data including their status and contact information and report any errors. The reported errors were corrected, and a new version was released. The NRLs were reminded of their respon-sibility for their network and were prompted to carefully check the status, commodity scope and contact data of the OfLs within their network. They were also asked to amend and complement the list, if necessary, and to ensure that all obliged OfLs within their network were informed of this EUPT. It was made clear to all NRLs and OfLs that the list of obliged laboratories was tentative and that the real obligation for participa-tion is deriving from Art. 28 of Reg. 396/2005/EC (for OfLs) and Art. 33 of Reg. 882/2004/EC (for NRL-SRMs). Following DG-SANTE instructions, obliged labs that were not intending to participate in the EUPT-SRM12 were instructed to provide explanations for their non-participation.

EUPT-SRM12 | 2017 (Strawberry Purée)
12
1.11.2 Announcement / Invitation and EUPT-SRM12-Website
Within the EURL-Web-Portal an EUPT-SRM12-Website was constructed with links to all documents relevant to this EUPT (i.e., Announcement/Invitation Letter, Calendar, Target Pesticides List, Specific Protocol and General EUPT Protocol). These documents were uploaded to the EURL-Web-Portal and the CIRCA BC.
The Announcement/Invitation Letter for the EUPT-SRM12 was published on the EUPT-SRM12-Website in December 2016 and was sent to all NRL-SRMs, all OfLs analysing pesticide residues in food and feeding stuff within the framework of official controls, all laboratories performing import controls according to Reg. 669/2009/EC, as far as they were tracked in the EURL-DataPool, as well as to EU laboratories analys-ing official organic samples within the frame of Reg. 889/2008/EC. The latter laboratories were considered eligible but not obliged to participate. It was indicated to the OfLs that their obligation to participate in EUPTs arises from Reg. 396/2005/EC, irrespective of the content of the tentative list of obliged laboratories. NRLs and OfLs from EFTA and EU-candidate countries were also invited if their contact data was available. A number of laboratories from third countries were also invited to take part in this exercise. The acceptance of their registration was decided, however, on a case by case basis, and the laboratories were informed indi-vidually of the acceptance or rejection of their registration.
1.11.3 Registration and Confidentiality
For the first time the participants were able to register for the EUPT via a website connected to the EURL-DataPool. It is intended to apply this concept to all EUPTs organized by the 4 EURLs dealing with pesticides in order to reduce the burden of labs participating in more than one EUPT per year and to avoid the ad-ministrative effort of crosschecking and updating data between different databases. All laboratories listed in the tentative list as being obliged to participate in the current EUPT, regardless of whether they were intending to participate in this exercise or not, were requested to either register or to state their reasons for non-participation using the same website.
Upon registration or change of registration status, the labs received an electronic confirmation about their participation or non-participation in the current PT. On the day of sample shipment, participating labs were provided via e-mail with a unique laboratory code as well as with unique, automatically generated login data to access the online Result-Submission-Website. This ensured confidentiality throughout the entire duration of the PT.
For further information on confidentiality please refer to the General EUPT Protocol (Appendix 9).
1.11.4 Distribution of the Test Items and the Blank Material
One bottle of test item (approx. 400 g), one bottle of blank material (approx. 400 g) and two vials contain-ing isotope labelled internal standards (ILISs) of (chlorate/perchlorate and phosphonic acid) were shipped on 13 March, 2017 to each participant in thermo-insulated polystyrene boxes with dry ice. The packages for laboratories in countries where according to IATA Dangerous Goods Regulations shipments with dry ice were not allowed contained cooling elements instead of dry ice.
Three days prior to the shipment, detailed instructions on how to treat the test item and blank material upon receipt were provided to the participating laboratories in the Specific Protocol (Appendix 10). The participants were also informed on how the ILISs enclosed in the parcel could be employed in the analysis.
1. TEST ITEM and Blank Material / Organisational Aspects
13
TesT
ITem
1
1.11.5 Submission of Results and Additional Information
An online submission tool allowed participants to submit their results via the Internet. Using their individ-ual login data, all participants had access to the Result-Submission-Website from a week after the sample shipment until the result submission deadline (21 April, 2017). Participants were asked not only to report their analytical results but also to state whether the compounds on the Target Pesticides List were part of their routine scope and to indicate their experience with the analysis of these compounds. In addition, laboratories had to provide details about the methods applied and to state their own reporting limits (RLs) for each target compound they had analysed. The participants had furthermore the possibility to make statements as regards the condition of the material received. This information could be submitted from the day of shipment onwards.
1.11.6 Actions following Results Submission and Distribution Preliminary Report
Where information on analytical methods or results was inconsistent, laboratories were contacted. One laboratory, that had originally registered to participate in the current PT but finally did not submit any results, was asked to provide explanations. On 11 May, 2017, the preliminary report on the EUPT-SRM12 with the preliminary assigned values was released and sent to the participants. Laboratories having sub-mitted false positive or negative results were asked to provide information on the methods used for ana-lysing those compounds. In addition, participants were asked to investigate the reasons for results with | z-score | > 2 and to report them. In order to have the complete and correct data for the evaluation, a re-minder was sent to the participants again to fill in all the data requested on the submission page for the methodological information.
In order to obtain feedback from the participants and to improve the service quality in the future, parallel to the release of the preliminary report the organisers invited the participants to participate in a survey on EUPT-SRM12. The survey contained 5 questions on the organisation (general, registration, information and instruction provided, shipment/delivery, test item, blank material, ILIS standards provided and results submission pages), on the relevance of the used matrix (strawberry) to the routine work, on the assigned values of the analytes, as well as on the preliminary report and wishes as regards the commodities and/or analytes to be included in the upcoming two EUPT-SRMs. 127 of 139 participants (91 %) took part in the survey. The evaluation and compilation of comments was published on 27 July and can be downloaded via http://www.eurl-pesticides.eu/library/docs/srm/SRM12_Survey_Statistics_Evaluation.pdf.

2. EVALUATION RULES / False Positives and Negatives
15
Eva
luat
ion
Ru
lE
2
2. EVALUATION RULES
2.1 False Positives and Negatives
2.1.1 False Positives (FPs)
Any reported result with a concentration at or above the Minimum Required Reporting Level (MRRL) of an analyte in the Target Pesticides List which was (a) not detected by the organiser, even following repetitive analysis, and/or (b) not detected by the overwhelming majority (e.g. > 95 %) of the participants that ana-lysed for this compound, is treated as a false positive result. Results of an analyte absent in the test item but with a value lower than the MRRL are excluded by the organiser and not considered as false positives. No z-scores are calculated for false positive results.
2.1.2 False Negatives (FNs)
These are results of target analytes reported as “analysed” but without reporting numerical values, al-though they were used by the organiser to prepare the test item and were detected, at or above the MRRL, by the organiser and the overwhelming majority of the participating laboratories. In accordance with the General Protocol z-scores for false negatives are calculated using the MRRL as the result, or using the lab’s reporting-limit (RL), if this is lower. Any RLs that are higher than the MRRL are not taken into account. Fol-lowing the General Protocol, results reported as “< RL” without providing a numerical value are also judged as false negatives if the RL exceeds the MRRL.
2.2 Assigned Values (xpt) and Calculation of the Respective Uncertainties (u(xpt))
In accordance with EUPT-General Protocol (Appendix 8) the assigned values xpt of each pesticide in the PT is established using the mean value of robust statistics using Algorithms A (x*) [6] of all reported results from EU and EFTA countries. Results associated with obvious mistakes and gross errors may be excluded from the population for the establishment of the assigned values. The add-in “RobStat” provided by Royal Society of Chemistry was used to calculate the assigned values with the convergence criterion = 10-6.
The uncertainty of the assigned values of each analyte is calculated according to ISO 13528:2015 [6] using the following equation:
u(xpt) = 1.25 × [(s*)/ p ]
Where u(xpt) is the uncertainty of the assigned value in mg/kg, s* is the robust standard deviation estimate in mg/kg and p is the number of data points considered (= the number of results used to calculate the assigned value). The factor 1.25 is based on the standard deviation of the median, or the efficiency of the median as an estimate of the mean, in a large set of results drawn from a normal distribution.
The tolerance for the uncertainty of the assigned value of each pesticide is calculated as 0.3 × FFP-σpt, where FFP-σpt is the target standard deviation of the assigned value derived using a fixed standard deviation of 25 % (see Section 2.3). If u(xpt) < 0.3 × FFP-σpt, is met, then the uncertainty of the assigned value is consi-dered to be negligible and not needed to be considered in the interpretation of the proficiency test results.

EUPT-SRM12 | 2017 (Strawberry Purée)
16
2.3 Fixed Target Standard Deviation using FFP-Approach (FFP-σpt)
Based on experience from previous EU Proficiency Tests on fruit and vegetables and cereals, the EUPT-Sci-entific Committee agreed to apply a fixed fit-for-purpose relative standard deviation (FFP-RSD) of 25 % for calculating the z-scores. The fixed target standard deviation using the fit-for-purpose approach (FFP-σpt), for each individual target analyte is calculated by multiplying the assigned value by the FFP-RSD of 25 %. In addition, the robust relative standard deviation of the assigned value (CV*) is calculated for informative purposes.
2.4 z-Scores
For each combination of laboratory and target analyte a z-score is calculated according to the following equation:
zi = (xi – xpt) / FFP-σpt
Where − xi is the result for the target analyte (i) as reported by the participant
(For results considered as false negatives, xi is set as equal to the respective minimum required reporting level (MRRL) or the laboratory reporting level (RL), if RL < MRRL.)
− xpt is the assigned value for the target analyte (i) − FFP-σpt is the standard deviation for proficiency assessment using the fit-for-purpose approach
(see above).
Any z-scores > 5 are set at 5 in calculations of combined z-scores (see 2.5.2).
The z-scores are classified as follows:
|z| ≤ 2 acceptable 2 < |z| < 3 questionable |z| ≥ 3 unacceptable
For results considered as false negatives, z-scores are calculated using the MRRL or the RL, if RL < MRRL. No z-scores are allocated to false positive results.
2.5 Laboratory Classification
2.5.1 Category A and B classification
Based on the scope of target analytes covered by the laboratories in this exercise, laboratories are subdi-vided into Categories (A and B) in accordance with the rules in the General Protocol (Appendix 8). To be classified into Category A a laboratory should
a) have analysed at least 90 % of the compulsory pesticides on the Target Pesticides List,b) have correctly reported concentration values for at least 90 % of the compulsory pesticides pre-
sent in the test item, c) not have reported any false positive results.

2. EVALUATION RULES / Laboratory Classification
17
Eva
luat
ion
Ru
lE
2
2.5.2 Combined z-Scores
For informative purposes and to allow comparison of the overall performance of the laboratories the Av-erage of the Absolute z-Scores (AAZ) is calculated for laboratories with 5 or more z-scores. Combined z-scores are, however, considered to be of lesser importance than the individual z-scores.
Average of the Absolute z-Scores (AAZ)
The AAZ is calculated using the following formula:
where “n” is the number of each laboratory’s z-scores that are considered in this formula. This includes z-scores assigned for false negative results. For the calculation, any z-score > 5 is set at 5.
AAZn
nz
AAZ ii∑
== 1

3. Participation
19
Part
iciP
atio
n
3
3. PARTICIPATION
139 laboratories from 39 countries (28 EU-Member States, 3 EFTA- countries, 1 EU-candidate country and 7 third countries) originally registered for participation in the EUPT-SRM12. Out of those laboratories only one EU-Member State laboratory failed to submit any results, reporting after the PT that the analytes on the Target Pesticides List were out of its routine scope and due to a lack of analytical standards the two analytes detected in a screening could not be quantified. This lab was therefore retroactively regarded as non-participating. An overview of the participating laboratories and countries is given in Table 3-1.
A list of all individual laboratories that registered for this EUPT is presented in Appendix 1. Croatia was the only EU-country not represented by an NRL-SRM. Malta was represented by its proxy-NRL-SRM based in the United Kingdom.
All 13 laboratories from non-EU countries submitted results (4 from EFTA countries, 2 from one EU-can-didate country and 7 from third countries). For the first time one OfL from Iceland has participated in an EUPT-SRM. The results submitted by the laboratories based in Serbia (EU candidate country) and by the 7 laboratories based in third countries were not taken into account when calculating the assigned values.
In total, 174 EU-OfLs (including NRL-SRMs) were originally considered as being obliged to participate in the present EUPT and were included on a tentative list of obliged labs that was distributed to the labs of the network prior to the registration period for this EUPT. The list included all NRL-SRMs, regardless of their commodity scope, and all EU-OfLs analysing for pesticide residues in cereals or feed.
All labs tentatively considered as obliged to participate were invited to log in the registration page and register for their participation in the current PT or to provide an explanation for their non-participation.
26 obliged laboratories explained their non-participation with the fact that the matrix (strawberry) or the SRM12 target pesticides or both were out of their routine scope, partly due to a lack of required instru-ments. Excluding those 26 laboratories that provided sufficient explanations, the number of EU-laborato-ries considered as being obliged decreased to 148. Out of the 110 obliged laboratories that have registered for this PT 109 laboratories finally submitted result. The laboratory which failed to report any results was retrospectively classified as not obliged to participate, since the analytes were reportedly out of its routine scope. The number of EU-laboratories considered as being obliged thus decreased to 147. Out of the 147 obliged OfLs 38 (26 %) did neither register for the PT nor provide any explanation for non-participation. These laboratories originated from 12 countries as follows: BG 1, HR 2, FR 2, DE 3, IT 5, NL 1, PL 6, PT 1, RO 2, SK 1, ES 11 and UK 3.

EUPT-SRM12 | 2017 (Strawberry Purée)
20
EU: NRLs and OfLs
Contracting Country 1)
Labs originally
considered as obliged (*based on
scope)
Labs providing sufficient expl.
for non-participation Finally considered as
obliged
Registered for Participation
Submitted Results Obliged labs
non particip. w/o
giving expl.
NotesPrior to
PTDuring the
PT All NRL- SRMs All NRL-
SRMs
AT 2 0 0 2 2 + [1] 1 2 + [1] 1
BE 6 0 0 6 6 + [1] 1 6 + [1] 1
BE/NL 1 0 0 1 1 0 1 0
BE/BG/FR/LU 1 0 0 1 1 0 1 0
BG 3 1 0 2 1 1 1 1 1
HR 9 2 0 7 5 0 5 0 2 HR has not yet estab-lished an NRL-SRM.
CY 1 0 0 1 1 1 1 1
CZ 2 0 0 2 2 + [1] 1 2 + [1] 1
DK 1 0 0 1 1 1 1 1
EE 2 0 0 2 2 1 2 1
FI 3 1 0 2 2 1 2 1
FR 10 0 0 10 8 + [1] 1 8 + [1] 1 2
DE 21 2 0 19 16 + [2] 1 16 + [2] 1 3
DE/MT 1 0 0 1 1 0 1
GR 3 1 0 2 2 + [1] 2 2 + [1] 2 GR has appointed two NRL-SRMs.
HU 5 0 0 5 5 1 5 1
IE 1 0 0 1 1 1 1 1
IT 20 5 1 14 9 + {1} 1 9 1 5
IT/MT 1 0 0 1 1 0 1 0
LV 1 0 0 1 1 1 1 1
LT 1 0 0 1 1 + [1] 1 1 + [1] 1
LU 1 0 0 1 1 1 1 1
MT 0* 0* 0* 0* 0* 0* 0* 0* *MT-NRL-SRM represented by proxy by the UK-NRL-SRM; MT subcontracted routine analysis to an OfLs in DE and IT
NL 2 0 0 2 1 1 1 1 1
PL 11 1 0 10 4 + [4] 1 4 + [4] 1 6
PT 4 0 0 4 3 1 3 1 1
RO 5 1 0 4 2 + [1] 1 2 + [1] 1 2
SK 2 0 0 2 1 1 1 1 1
SI 3 0 0 3 3 1 3 1
ES 41 10 0 31 20 + [2] 2 20 + [2] 2 11 ES has appointed two NRL-SRMs
ES/MT 1 10 0 1 1 + [2] 0 1 + [2] 0
SE 2 0 0 2 2 1 2 1
UK/MT 1 0 0 1 1 1 1 1 UK-NRL-SRM repre-sents also MT
UK 4 0 0 4 1 + [1] 1 + [1] 3
EU-total 172 24 1 147 110 + [16] 28 109 + [16] 28 38
Table 3-1: Number of laboratories listed as being obliged to participate in the EUPT-SRM12, labs that registered to participate, and labs that finally submitted results (grouped by contracting country)

3. Participation
21
Part
iciP
atio
n
3
Table 3-1 (cont.): Number of laboratories listed as being obliged to participate in the EUPT-SRM12, labs that registered to partici-pate, and labs that finally submitted results (grouped by contracting country)
EFTA
Contracting Country 1)
Labs originally
considered as obliged (*based on
scope)
Labs providing sufficient expl.
for non-participation Finally considered as
obliged
Registered for Participation
Submitted Results Obliged labs
non particip. w/o
giving expl.
NotesPrior to
PTDuring the
PT All NRL- SRMs All NRL-
SRMs
NO [1] 1 [1] 1
IS [1] – [1] –
CH [2] – [2] –
EU+EFTA Total 110 + [20] 29 109 + [20] 29
Third Countries / EU candidate country
SR 2 – 2 –
CA 1 – 1 –
CR 1 – 1 –
EG 1 – 1 –
HK 1 – 1 –
MY 1 – 1 –
KR 1 – 1 –
TW 1 – 1 –
Third Countries / EU candidate country Total 9 9
Overall Sum 147 139 29 138 29


4. RESULTS / Overview of Results
23
Resu
lts
4
4. RESULTS
4.1 Overview of Results
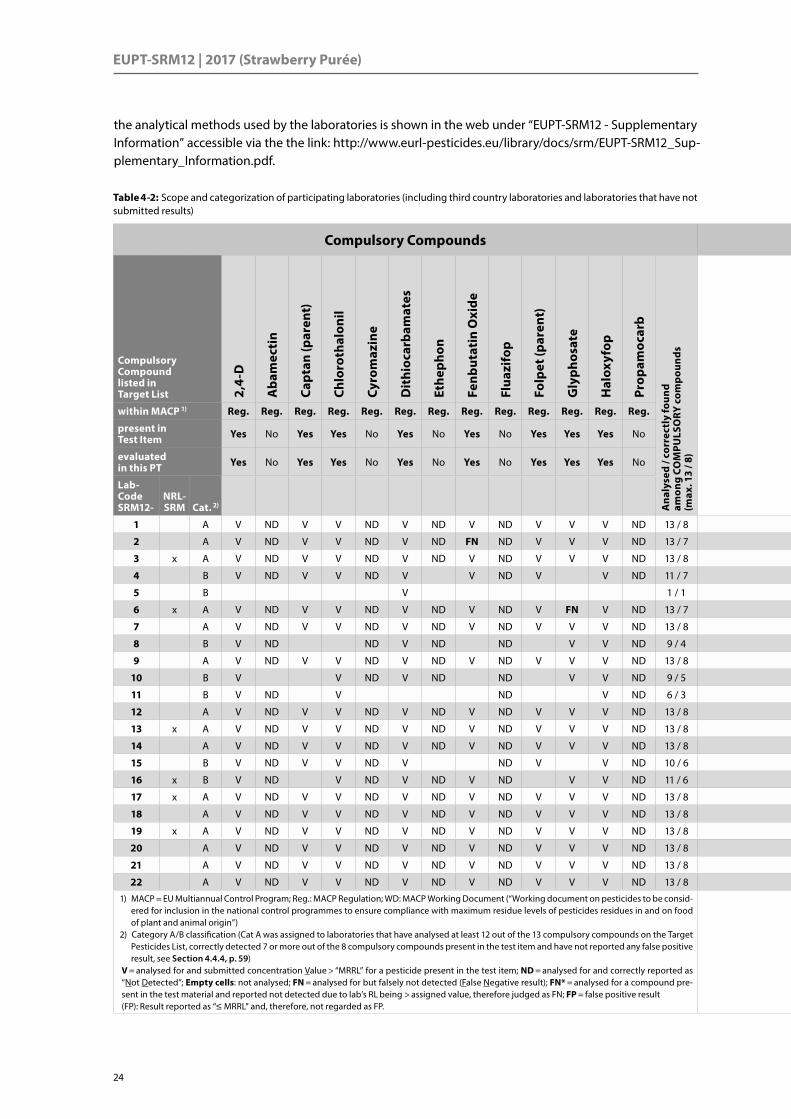
An overview of the percentage of laboratories having targeted each of the analytes present in the Target Pesticides List is shown in Table 4-1.
Table 4-2 (p. 24) gives an overview of all results submitted by each laboratory. The individual numerical re-sults reported by the laboratories are shown in Table 4-8 (p. 42), Table 4-9 (p. 48) and Table 4-10 (p. 56) for compulsory, optional and additonal compounds, respectively. Originally, four analytes, captan (sum), folpet (sum), THPI and phthalimid, were considered for data collection only and regarded as “additional compounds”. Since the number and the quality of the submitted results was high, finally, the organizers decided to proceed with a laboratory-based evaluation of the assiged values, z-scores, FNs and FPs also for these four analytes and to show this data for informative purposes only. Detailed information about
Labs analysed for the compound
CompoundsPresent
in test item
EU 1)- and EFTA-Labs EU obliged Labs only
No. 2) % (based on n = 129 3)) No. 2) % (based on n = 147 4))
Com
puls
ory
Com
poun
ds
2,4-D Yes 98 76 % 82 56 %
Abamectin No 97 75 % 81 55 %
Captan (parent) Yes 93 72 % 77 52 %
Chlorothalonil Yes 111 86 % 94 64 %
Cyromazine No 97 75 % 82 56 %
Dithiocarbamates Yes 107 83 % 90 61 %
Ethephon No 76 59 % 64 44 %
Fenbutatin Oxide Yes 82 64 % 70 48 %
Fluazifop No 99 77 % 83 56 %
Folpet (parent) Yes 98 76 % 81 55 %
Glyphosate Yes 86 67 % 72 49 %
Haloxyfop Yes 97 75 % 82 56 %
Propamocarb No 109 84 % 92 63 %
Opt
iona
l Com
poun
ds
AMPA No 58 45 % 48 33 %
Bifenazate (sum) Yes 54 42 % 42 29 %
Bromide ion Yes 52 40 % 44 30 %
Carbofuran (part of sum) Yes 74 57 % 62 42 %
Chlorate Yes 60 47 % 47 32 %
Dithianon Yes 64 50 % 52 35 %
Phosphonic acid Yes 50 39 % 39 27 %
N-Acetyl glyphosate Yes 16 12 % 13 9 %
Add
itio
nal
Com
poun
ds Captan (sum) Yes 65 50 % 52 35 %
Folpet (sum) Yes 66 51 % 53 36 %
THPI Yes 67 52 % 54 37 %
Phthalimide Yes 67 52 % 54 37 %
1) Including official laboratories participating on voluntary basis2) Laboratories representing more than one country were counted only once.3) 129 is the number of participating OfLs from EU and EFTA countries (including NRLs and official laboratories participating on voluntary basis)
having registered for the present PT and submitted at least one result.4) 147 is the number of OfLs (including NRLs) from EU countries, which were finally considered as obliged to participate in the EUPT-SRM12 (taking
into account any explanations for non-participation).
Table 4-1: Percentage of EU and EFTA laboratories that have analysed for the compounds in the Target Pesticides List
EUPT-SRM12 | 2017 (Strawberry Purée)
24
Compulsory Compounds Optional Compounds Total Additional Compounds
Compulsory Compound listed in Target List 2,
4-D
Aba
mec
tin
Capt
an (p
aren
t)
Chlo
roth
alon
il
Cyro
maz
ine
Dit
hioc
arba
mat
es
Ethe
phon
Fenb
utat
in O
xide
Flua
zifo
p
Folp
et (p
aren
t)
Gly
phos
ate
Hal
oxyf
op
Prop
amoc
arb
Ana
lyse
d / c
orre
ctly
foun
d am
ong
COM
PULS
ORY
com
poun
ds
(max
. 13
/ 8)
Optional / Additional Compound listed in Target List A
MPA
Bife
naza
te
Brom
ide
ion
Carb
ofur
an
Chlo
rate
Dit
hian
on
Phos
phon
ic a
cid
N-A
cety
l gly
phos
ate
Ana
lyse
d / c
orre
ctly
foun
d am
ong
OPT
ION
AL
com
poun
ds
(max
. 8 /
7)
Ana
lyse
d / c
orre
ctly
foun
d am
ong
COM
PULS
ORY
and
OP
TIO
NA
L co
mpo
unds
(m
ax. 2
1 / 1
5)
Capt
an (s
um)
Folp
et (s
um)
THPI
Phth
alim
ide
Ana
lyse
d / c
orre
ctly
foun
d am
ong
AD
DIT
ION
AL
com
poun
ds
wit
hin
the
EUPT
-Tar
get P
esti
cide
s Li
st (m
ax. 4
/ 4)
within MACP 1) Reg. Reg. Reg. Reg. Reg. Reg. Reg. Reg. Reg. Reg. Reg. Reg. Reg. within MACP 1) WD WD Reg. Reg. WD Reg. Reg. WD Reg. Reg. Reg. Reg.
present in Test Item Yes No Yes Yes No Yes No Yes No Yes Yes Yes No present in
Test Item No Yes Yes Yes Yes Yes Yes Yes Yes Yes Yes Yes
evaluated in this PT Yes No Yes Yes No Yes No Yes No Yes Yes Yes No evaluated
in this PT No Yes Yes No Yes Yes Yes Yes Yes Yes Yes Yes
Lab- Code SRM12-
NRL- SRM Cat. 2)
Lab- Code SRM12-
NRL- SRM Cat. 2)
1 A V ND V V ND V ND V ND V V V ND 13 / 8 1 A ND V V V V V V 7 / 6 20 / 14 V V V V 4 / 4
2 A V ND V V ND V ND FN ND V V V ND 13 / 7 2 A ND V V FN V V V 7 / 5 20 / 12 V V V V 4 / 4
3 x A V ND V V ND V ND V ND V V V ND 13 / 8 3 x A ND V V V 4 / 3 17 / 11 0 / 0
4 B V ND V V ND V V ND V V ND 11 / 7 4 B V V 2 / 2 13 / 9 V V V V 4 / 4
5 B V 1 / 1 5 B 0 / 0 1 / 1 0 / 0
6 x A V ND V V ND V ND V ND V FN V ND 13 / 7 6 x A ND V FN* V V V FN 7 / 4 20 / 11 0 / 0
7 A V ND V V ND V ND V ND V V V ND 13 / 8 7 A ND V V V V 5 / 4 18 / 12 V V V V 4 / 4
8 B V ND ND V ND ND V V ND 9 / 4 8 B ND V V V V V 6 / 5 15 / 9 0 / 0
9 A V ND V V ND V ND V ND V V V ND 13 / 8 9 A V V V 3 / 3 16 / 11 V V 2 / 2
10 B V V ND V ND ND V V ND 9 / 5 10 B ND V V V 4 / 3 13 / 8 0 / 0
11 B V ND V ND V ND 6 / 3 11 B 0 / 0 6 / 3 0 / 0
12 A V ND V V ND V ND V ND V V V ND 13 / 8 12 A ND V V FN* V V V 7 / 5 20 / 13 0 / 0
13 x A V ND V V ND V ND V ND V V V ND 13 / 8 13 x A ND V V V 4 / 3 17 / 11 V V 2 / 2
14 A V ND V V ND V ND V ND V V V ND 13 / 8 14 A ND V V V 4 / 3 17 / 11 V V V V 4 / 4
15 B V ND V V ND V ND V V ND 10 / 6 15 B V 1 / 1 11 / 7 0 / 0
16 x B V ND V ND V ND V ND V V ND 11 / 6 16 x B ND V 2 / 1 13 / 7 0 / 0
17 x A V ND V V ND V ND V ND V V V ND 13 / 8 17 x A V V 2 / 2 15 / 10 V V V V 4 / 4
18 A V ND V V ND V ND V ND V V V ND 13 / 8 18 A ND V V V V V V 7 / 6 20 / 14 V V V V 4 / 4
19 x A V ND V V ND V ND V ND V V V ND 13 / 8 19 x A V V V 3 / 3 16 / 11 V V V V 4 / 4
20 A V ND V V ND V ND V ND V V V ND 13 / 8 20 A V V V V 4 / 4 17 / 12 V V V V 4 / 4
21 A V ND V V ND V ND V ND V V V ND 13 / 8 21 A ND V V V V V 6 / 5 19 / 13 V V V V 4 / 4
22 A V ND V V ND V ND V ND V V V ND 13 / 8 22 A V V V V V 5 / 5 18 / 13 V V V V 4 / 4
1) MACP = EU Multiannual Control Program; Reg.: MACP Regulation; WD: MACP Working Document (“Working document on pesticides to be consid-ered for inclusion in the national control programmes to ensure compliance with maximum residue levels of pesticides residues in and on food of plant and animal origin”)
2) Category A/B classification (Cat A was assigned to laboratories that have analysed at least 12 out of the 13 compulsory compounds on the Target Pesticides List, correctly detected 7 or more out of the 8 compulsory compounds present in the test item and have not reported any false positive result, see Section 4.4.4, p. 59)
V = analysed for and submitted concentration Value > “MRRL” for a pesticide present in the test item; ND = analysed for and correctly reported as “Not Detected”; Empty cells: not analysed; FN = analysed for but falsely not detected (False Negative result); FN* = analysed for a compound pre-sent in the test material and reported not detected due to lab’s RL being > assigned value, therefore judged as FN; FP = false positive result(FP): Result reported as “≤ MRRL” and, therefore, not regarded as FP.
1) MACP = EU Multiannual Control Program; Reg.: MACP Regulation; WD: MACP Working Document (“Working document on pesticides to be con-sidered for inclusion in the national control programmes to ensure compliance with maximum residue levels of pesticides residues in and on food of plant and animal origin”)
2) Category A/B classification (Cat A was assigned to laboratories that have analysed at least 9 out of the 11 compulsory compounds on the Target Pesticides List, correctly detected 7 or more out of the 8 compulsory compounds present in the test item and have not reported any false positive result, see Section 4.4.4, p. 59)
V = analysed for and submitted concentration Value > “MRRL” for a pesticide present in the test item; ND = analysed for and correctly reported as “Not Detected”; Empty cells: not analysed; FN = analysed for but falsely not detected (False Negative result); FN* = analysed for a compound pre-sent in the test material and reported not detected due to lab’s RL > assigned value, therefore judged as FN; FP = false positive result(FP): Result reported as “≤ MRRL” and, therefore, not regarded as FP.
Table 4-2: Scope and categorization of participating laboratories (including third country laboratories and laboratories that have not submitted results)
the analytical methods used by the laboratories is shown in the web under “EUPT-SRM12 - Supplementary Information” accessible via the the link: http://www.eurl-pesticides.eu/library/docs/srm/EUPT-SRM12_Sup-plementary_Information.pdf.

4. RESULTS / Overview of Results
25
Resu
lts
4
Table 4-2 (cont.): Scope and categorization of participating laboratories (including third country laboratories and laboratories that have not submitted results)
Compulsory Compounds Optional Compounds Total Additional Compounds
Compulsory Compound listed in Target List 2,
4-D
Aba
mec
tin
Capt
an (p
aren
t)
Chlo
roth
alon
il
Cyro
maz
ine
Dit
hioc
arba
mat
es
Ethe
phon
Fenb
utat
in O
xide
Flua
zifo
p
Folp
et (p
aren
t)
Gly
phos
ate
Hal
oxyf
op
Prop
amoc
arb
Ana
lyse
d / c
orre
ctly
foun
d am
ong
COM
PULS
ORY
com
poun
ds
(max
. 13
/ 8)
Optional / Additional Compound listed in Target List A
MPA
Bife
naza
te
Brom
ide
ion
Carb
ofur
an
Chlo
rate
Dit
hian
on
Phos
phon
ic a
cid
N-A
cety
l gly
phos
ate
Ana
lyse
d / c
orre
ctly
foun
d am
ong
OPT
ION
AL
com
poun
ds
(max
. 8 /
7)
Ana
lyse
d / c
orre
ctly
foun
d am
ong
COM
PULS
ORY
and
OP
TIO
NA
L co
mpo
unds
(m
ax. 2
1 / 1
5)
Capt
an (s
um)
Folp
et (s
um)
THPI
Phth
alim
ide
Ana
lyse
d / c
orre
ctly
foun
d am
ong
AD
DIT
ION
AL
com
poun
ds
wit
hin
the
EUPT
-Tar
get P
esti
cide
s Li
st (m
ax. 4
/ 4)
within MACP 1) Reg. Reg. Reg. Reg. Reg. Reg. Reg. Reg. Reg. Reg. Reg. Reg. Reg. within MACP 1) WD WD Reg. Reg. WD Reg. Reg. WD Reg. Reg. Reg. Reg.
present in Test Item Yes No Yes Yes No Yes No Yes No Yes Yes Yes No present in
Test Item No Yes Yes Yes Yes Yes Yes Yes Yes Yes Yes Yes
evaluated in this PT Yes No Yes Yes No Yes No Yes No Yes Yes Yes No evaluated
in this PT No Yes Yes No Yes Yes Yes Yes Yes Yes Yes Yes
Lab- Code SRM12-
NRL- SRM Cat. 2)
Lab- Code SRM12-
NRL- SRM Cat. 2)
1 A V ND V V ND V ND V ND V V V ND 13 / 8 1 A ND V V V V V V 7 / 6 20 / 14 V V V V 4 / 4
2 A V ND V V ND V ND FN ND V V V ND 13 / 7 2 A ND V V FN V V V 7 / 5 20 / 12 V V V V 4 / 4
3 x A V ND V V ND V ND V ND V V V ND 13 / 8 3 x A ND V V V 4 / 3 17 / 11 0 / 0
4 B V ND V V ND V V ND V V ND 11 / 7 4 B V V 2 / 2 13 / 9 V V V V 4 / 4
5 B V 1 / 1 5 B 0 / 0 1 / 1 0 / 0
6 x A V ND V V ND V ND V ND V FN V ND 13 / 7 6 x A ND V FN* V V V FN 7 / 4 20 / 11 0 / 0
7 A V ND V V ND V ND V ND V V V ND 13 / 8 7 A ND V V V V 5 / 4 18 / 12 V V V V 4 / 4
8 B V ND ND V ND ND V V ND 9 / 4 8 B ND V V V V V 6 / 5 15 / 9 0 / 0
9 A V ND V V ND V ND V ND V V V ND 13 / 8 9 A V V V 3 / 3 16 / 11 V V 2 / 2
10 B V V ND V ND ND V V ND 9 / 5 10 B ND V V V 4 / 3 13 / 8 0 / 0
11 B V ND V ND V ND 6 / 3 11 B 0 / 0 6 / 3 0 / 0
12 A V ND V V ND V ND V ND V V V ND 13 / 8 12 A ND V V FN* V V V 7 / 5 20 / 13 0 / 0
13 x A V ND V V ND V ND V ND V V V ND 13 / 8 13 x A ND V V V 4 / 3 17 / 11 V V 2 / 2
14 A V ND V V ND V ND V ND V V V ND 13 / 8 14 A ND V V V 4 / 3 17 / 11 V V V V 4 / 4
15 B V ND V V ND V ND V V ND 10 / 6 15 B V 1 / 1 11 / 7 0 / 0
16 x B V ND V ND V ND V ND V V ND 11 / 6 16 x B ND V 2 / 1 13 / 7 0 / 0
17 x A V ND V V ND V ND V ND V V V ND 13 / 8 17 x A V V 2 / 2 15 / 10 V V V V 4 / 4
18 A V ND V V ND V ND V ND V V V ND 13 / 8 18 A ND V V V V V V 7 / 6 20 / 14 V V V V 4 / 4
19 x A V ND V V ND V ND V ND V V V ND 13 / 8 19 x A V V V 3 / 3 16 / 11 V V V V 4 / 4
20 A V ND V V ND V ND V ND V V V ND 13 / 8 20 A V V V V 4 / 4 17 / 12 V V V V 4 / 4
21 A V ND V V ND V ND V ND V V V ND 13 / 8 21 A ND V V V V V 6 / 5 19 / 13 V V V V 4 / 4
22 A V ND V V ND V ND V ND V V V ND 13 / 8 22 A V V V V V 5 / 5 18 / 13 V V V V 4 / 4
1) MACP = EU Multiannual Control Program; Reg.: MACP Regulation; WD: MACP Working Document (“Working document on pesticides to be consid-ered for inclusion in the national control programmes to ensure compliance with maximum residue levels of pesticides residues in and on food of plant and animal origin”)
2) Category A/B classification (Cat A was assigned to laboratories that have analysed at least 12 out of the 13 compulsory compounds on the Target Pesticides List, correctly detected 7 or more out of the 8 compulsory compounds present in the test item and have not reported any false positive result, see Section 4.4.4, p. 59)
V = analysed for and submitted concentration Value > “MRRL” for a pesticide present in the test item; ND = analysed for and correctly reported as “Not Detected”; Empty cells: not analysed; FN = analysed for but falsely not detected (False Negative result); FN* = analysed for a compound pre-sent in the test material and reported not detected due to lab’s RL being > assigned value, therefore judged as FN; FP = false positive result(FP): Result reported as “≤ MRRL” and, therefore, not regarded as FP.
1) MACP = EU Multiannual Control Program; Reg.: MACP Regulation; WD: MACP Working Document (“Working document on pesticides to be con-sidered for inclusion in the national control programmes to ensure compliance with maximum residue levels of pesticides residues in and on food of plant and animal origin”)
2) Category A/B classification (Cat A was assigned to laboratories that have analysed at least 9 out of the 11 compulsory compounds on the Target Pesticides List, correctly detected 7 or more out of the 8 compulsory compounds present in the test item and have not reported any false positive result, see Section 4.4.4, p. 59)
V = analysed for and submitted concentration Value > “MRRL” for a pesticide present in the test item; ND = analysed for and correctly reported as “Not Detected”; Empty cells: not analysed; FN = analysed for but falsely not detected (False Negative result); FN* = analysed for a compound pre-sent in the test material and reported not detected due to lab’s RL > assigned value, therefore judged as FN; FP = false positive result(FP): Result reported as “≤ MRRL” and, therefore, not regarded as FP.

EUPT-SRM12 | 2017 (Strawberry Purée)
26
Compulsory Compounds Optional Compounds Total Additional Compounds
Compulsory Compound listed in Target List 2,
4-D
Aba
mec
tin
Capt
an (p
aren
t)
Chlo
roth
alon
il
Cyro
maz
ine
Dit
hioc
arba
mat
es
Ethe
phon
Fenb
utat
in O
xide
Flua
zifo
p
Folp
et (p
aren
t)
Gly
phos
ate
Hal
oxyf
op
Prop
amoc
arb
Ana
lyse
d / c
orre
ctly
foun
d am
ong
COM
PULS
ORY
com
poun
ds
(max
. 13
/ 8)
Optional / Additional Compound listed in Target List A
MPA
Bife
naza
te
Brom
ide
ion
Carb
ofur
an
Chlo
rate
Dit
hian
on
Phos
phon
ic a
cid
N-A
cety
l gly
phos
ate
Ana
lyse
d / c
orre
ctly
foun
d am
ong
OPT
ION
AL
com
poun
ds
(max
. 8 /
7)
Ana
lyse
d / c
orre
ctly
foun
d am
ong
COM
PULS
ORY
and
OP
TIO
NA
L co
mpo
unds
(m
ax. 2
1 / 1
5)
Capt
an (s
um)
Folp
et (s
um)
THPI
Phth
alim
ide
Ana
lyse
d / c
orre
ctly
foun
d am
ong
AD
DIT
ION
AL
com
poun
ds
wit
hin
the
EUPT
-Tar
get P
esti
cide
s Li
st (m
ax. 4
/ 4)
within MACP 1) Reg. Reg. Reg. Reg. Reg. Reg. Reg. Reg. Reg. Reg. Reg. Reg. Reg. within MACP 1) WD WD Reg. Reg. WD Reg. Reg. WD Reg. Reg. Reg. Reg.
present in Test Item Yes No Yes Yes No Yes No Yes No Yes Yes Yes No present in
Test Item No Yes Yes Yes Yes Yes Yes Yes Yes Yes Yes Yes
evaluated in this PT Yes No Yes Yes No Yes No Yes No Yes Yes Yes No evaluated
in this PT No Yes Yes No Yes Yes Yes Yes Yes Yes Yes Yes
Lab- Code SRM12-
NRL- SRM Cat. 2)
Lab- Code SRM12-
NRL- SRM Cat. 2)
23 B ND V V ND ND ND V V V ND 10 / 5 23 B 0 / 0 10 / 5 0 / 0
24 B V ND V V ND V V ND V V ND 11 / 7 24 B V V 2 / 2 13 / 9 0 / 0
25 A V ND V V ND V ND V ND V V V ND 13 / 8 25 A ND V V V V 5 / 4 18 / 12 V V V V 4 / 4
26 A V ND V V ND V ND V ND V V V ND 13 / 8 26 A ND V V V V V V 7 / 6 20 / 14 V V V V 4 / 4
27 B V FN ND ND V ND 6 / 2 27 B V FN* 2 / 1 8 / 3 V V 2 / 2
28 x B V ND V ND V V ND V V ND 10 / 6 28 x B V 1 / 1 11 / 7 0 / 0
29 x B V ND V V ND V ND V V ND 10 / 6 29 x B V V 2 / 2 12 / 8 V V V V 4 / 4
30 x A V ND V V ND V ND V ND V V V ND 13 / 8 30 x A ND V V 3 / 2 16 / 10 0 / 0
31 B V V V V 4 / 4 31 B 0 / 0 4 / 4 V 1 / 1
32 B V V V ND V ND ND V V V ND 11 / 7 32 B 0 / 0 11 / 7 0 / 0
33 x A V ND V V ND V ND V ND V V V ND 13 / 8 33 x A ND V V V V V V V 8 / 7 21 / 15 V V V V 4 / 4
34 B V ND V ND V ND V ND V V ND 11 / 6 34 B ND V V V V V V 7 / 6 18 / 12 V V 2 / 2
35 x A V ND V V ND V ND FN ND V V V ND 13 / 7 35 x A ND V V V V V V V 8 / 7 21 / 14 V V V V 4 / 4
37 B ND V V V V ND 6 / 4 37 B 0 / 0 6 / 4 0 / 0
38 B V ND V V V V V ND 8 / 6 38 B V V 2 / 2 10 / 8 0 / 0
39 A V ND V V ND V ND V ND V V V ND 13 / 8 39 A ND V V FN* V V V 7 / 5 20 / 13 V V V V 4 / 4
40 B ND V ND V V ND V V ND 9 / 5 40 B ND V V 3 / 2 12 / 7 0 / 0
41 A V ND V V ND V ND V ND V V V ND 13 / 8 41 A ND V V V V V 6 / 5 19 / 13 V V V V 4 / 4
42 A V ND V V ND V ND V ND V V V ND 13 / 8 42 A ND V V V V V 6 / 5 19 / 13 V V V V 4 / 4
43 B V V 2 / 2 43 B ND V 2 / 1 4 / 3 0 / 0
44 x B FN ND V V V ND V FN 8 / 4 44 x B 0 / 0 8 / 4 0 / 0
45 A V ND V V ND V ND V ND V V V ND 13 / 8 45 A V V V V 4 / 4 17 / 12 0 / 0
46 A V ND V V ND V ND V ND V V V ND 13 / 8 46 A ND V V 3 / 2 16 / 10 V V V V 4 / 4
47 A V ND V V ND V ND V ND V V V ND 13 / 8 47 A ND V V V V V 6 / 5 19 / 13 V V V FN 4 / 3
48 A V ND V V ND V ND ND V V V ND 12 / 7 48 A ND V V V V 5 / 4 17 / 11 V V V V 4 / 4
49 x A V ND V V ND V ND V ND V V V ND 13 / 8 49 x A V V 2 / 2 15 / 10 V V V V 4 / 4
1) MACP = EU Multiannual Control Program; Reg.: MACP Regulation; WD: MACP Working Document (“Working document on pesticides to be consid-ered for inclusion in the national control programmes to ensure compliance with maximum residue levels of pesticides residues in and on food of plant and animal origin”)
2) Category A/B classification (Cat A was assigned to laboratories that have analysed at least 12 out of the 13 compulsory compounds on the Target Pesticides List, correctly detected 7 or more out of the 8 compulsory compounds present in the test item and have not reported any false positive result, see Section 4.4.4, p. 59)
V = analysed for and submitted concentration Value > “MRRL” for a pesticide present in the test item; ND = analysed for and correctly reported as “Not Detected”; Empty cells: not analysed; FN = analysed for but falsely not detected (False Negative result); FN* = analysed for a compound pre-sent in the test material and reported not detected due to lab’s RL being > assigned value, therefore judged as FN; FP = false positive result(FP): Result reported as “≤ MRRL” and, therefore, not regarded as FP.
1) MACP = EU Multiannual Control Program; Reg.: MACP Regulation; WD: MACP Working Document (“Working document on pesticides to be con-sidered for inclusion in the national control programmes to ensure compliance with maximum residue levels of pesticides residues in and on food of plant and animal origin”)
2) Category A/B classification (Cat A was assigned to laboratories that have analysed at least 9 out of the 11 compulsory compounds on the Target Pesticides List, correctly detected 7 or more out of the 8 compulsory compounds present in the test item and have not reported any false positive result, see Section 4.4.4, p. 59)
V = analysed for and submitted concentration Value > “MRRL” for a pesticide present in the test item; ND = analysed for and correctly reported as “Not Detected”; Empty cells: not analysed; FN = analysed for but falsely not detected (False Negative result); FN* = analysed for a compound pre-sent in the test material and reported not detected due to lab’s RL > assigned value, therefore judged as FN; FP = false positive result(FP): Result reported as “≤ MRRL” and, therefore, not regarded as FP.
Table 4-2 (cont.): Scope and categorization of participating laboratories (including third country laboratories and laboratories that have not submitted results)

4. RESULTS / Overview of Results
27
Resu
lts
4
Compulsory Compounds Optional Compounds Total Additional Compounds
Compulsory Compound listed in Target List 2,
4-D
Aba
mec
tin
Capt
an (p
aren
t)
Chlo
roth
alon
il
Cyro
maz
ine
Dit
hioc
arba
mat
es
Ethe
phon
Fenb
utat
in O
xide
Flua
zifo
p
Folp
et (p
aren
t)
Gly
phos
ate
Hal
oxyf
op
Prop
amoc
arb
Ana
lyse
d / c
orre
ctly
foun
d am
ong
COM
PULS
ORY
com
poun
ds
(max
. 13
/ 8)
Optional / Additional Compound listed in Target List A
MPA
Bife
naza
te
Brom
ide
ion
Carb
ofur
an
Chlo
rate
Dit
hian
on
Phos
phon
ic a
cid
N-A
cety
l gly
phos
ate
Ana
lyse
d / c
orre
ctly
foun
d am
ong
OPT
ION
AL
com
poun
ds
(max
. 8 /
7)
Ana
lyse
d / c
orre
ctly
foun
d am
ong
COM
PULS
ORY
and
OP
TIO
NA
L co
mpo
unds
(m
ax. 2
1 / 1
5)
Capt
an (s
um)
Folp
et (s
um)
THPI
Phth
alim
ide
Ana
lyse
d / c
orre
ctly
foun
d am
ong
AD
DIT
ION
AL
com
poun
ds
wit
hin
the
EUPT
-Tar
get P
esti
cide
s Li
st (m
ax. 4
/ 4)
within MACP 1) Reg. Reg. Reg. Reg. Reg. Reg. Reg. Reg. Reg. Reg. Reg. Reg. Reg. within MACP 1) WD WD Reg. Reg. WD Reg. Reg. WD Reg. Reg. Reg. Reg.
present in Test Item Yes No Yes Yes No Yes No Yes No Yes Yes Yes No present in
Test Item No Yes Yes Yes Yes Yes Yes Yes Yes Yes Yes Yes
evaluated in this PT Yes No Yes Yes No Yes No Yes No Yes Yes Yes No evaluated
in this PT No Yes Yes No Yes Yes Yes Yes Yes Yes Yes Yes
Lab- Code SRM12-
NRL- SRM Cat. 2)
Lab- Code SRM12-
NRL- SRM Cat. 2)
23 B ND V V ND ND ND V V V ND 10 / 5 23 B 0 / 0 10 / 5 0 / 0
24 B V ND V V ND V V ND V V ND 11 / 7 24 B V V 2 / 2 13 / 9 0 / 0
25 A V ND V V ND V ND V ND V V V ND 13 / 8 25 A ND V V V V 5 / 4 18 / 12 V V V V 4 / 4
26 A V ND V V ND V ND V ND V V V ND 13 / 8 26 A ND V V V V V V 7 / 6 20 / 14 V V V V 4 / 4
27 B V FN ND ND V ND 6 / 2 27 B V FN* 2 / 1 8 / 3 V V 2 / 2
28 x B V ND V ND V V ND V V ND 10 / 6 28 x B V 1 / 1 11 / 7 0 / 0
29 x B V ND V V ND V ND V V ND 10 / 6 29 x B V V 2 / 2 12 / 8 V V V V 4 / 4
30 x A V ND V V ND V ND V ND V V V ND 13 / 8 30 x A ND V V 3 / 2 16 / 10 0 / 0
31 B V V V V 4 / 4 31 B 0 / 0 4 / 4 V 1 / 1
32 B V V V ND V ND ND V V V ND 11 / 7 32 B 0 / 0 11 / 7 0 / 0
33 x A V ND V V ND V ND V ND V V V ND 13 / 8 33 x A ND V V V V V V V 8 / 7 21 / 15 V V V V 4 / 4
34 B V ND V ND V ND V ND V V ND 11 / 6 34 B ND V V V V V V 7 / 6 18 / 12 V V 2 / 2
35 x A V ND V V ND V ND FN ND V V V ND 13 / 7 35 x A ND V V V V V V V 8 / 7 21 / 14 V V V V 4 / 4
37 B ND V V V V ND 6 / 4 37 B 0 / 0 6 / 4 0 / 0
38 B V ND V V V V V ND 8 / 6 38 B V V 2 / 2 10 / 8 0 / 0
39 A V ND V V ND V ND V ND V V V ND 13 / 8 39 A ND V V FN* V V V 7 / 5 20 / 13 V V V V 4 / 4
40 B ND V ND V V ND V V ND 9 / 5 40 B ND V V 3 / 2 12 / 7 0 / 0
41 A V ND V V ND V ND V ND V V V ND 13 / 8 41 A ND V V V V V 6 / 5 19 / 13 V V V V 4 / 4
42 A V ND V V ND V ND V ND V V V ND 13 / 8 42 A ND V V V V V 6 / 5 19 / 13 V V V V 4 / 4
43 B V V 2 / 2 43 B ND V 2 / 1 4 / 3 0 / 0
44 x B FN ND V V V ND V FN 8 / 4 44 x B 0 / 0 8 / 4 0 / 0
45 A V ND V V ND V ND V ND V V V ND 13 / 8 45 A V V V V 4 / 4 17 / 12 0 / 0
46 A V ND V V ND V ND V ND V V V ND 13 / 8 46 A ND V V 3 / 2 16 / 10 V V V V 4 / 4
47 A V ND V V ND V ND V ND V V V ND 13 / 8 47 A ND V V V V V 6 / 5 19 / 13 V V V FN 4 / 3
48 A V ND V V ND V ND ND V V V ND 12 / 7 48 A ND V V V V 5 / 4 17 / 11 V V V V 4 / 4
49 x A V ND V V ND V ND V ND V V V ND 13 / 8 49 x A V V 2 / 2 15 / 10 V V V V 4 / 4
1) MACP = EU Multiannual Control Program; Reg.: MACP Regulation; WD: MACP Working Document (“Working document on pesticides to be consid-ered for inclusion in the national control programmes to ensure compliance with maximum residue levels of pesticides residues in and on food of plant and animal origin”)
2) Category A/B classification (Cat A was assigned to laboratories that have analysed at least 12 out of the 13 compulsory compounds on the Target Pesticides List, correctly detected 7 or more out of the 8 compulsory compounds present in the test item and have not reported any false positive result, see Section 4.4.4, p. 59)
V = analysed for and submitted concentration Value > “MRRL” for a pesticide present in the test item; ND = analysed for and correctly reported as “Not Detected”; Empty cells: not analysed; FN = analysed for but falsely not detected (False Negative result); FN* = analysed for a compound pre-sent in the test material and reported not detected due to lab’s RL being > assigned value, therefore judged as FN; FP = false positive result(FP): Result reported as “≤ MRRL” and, therefore, not regarded as FP.
1) MACP = EU Multiannual Control Program; Reg.: MACP Regulation; WD: MACP Working Document (“Working document on pesticides to be con-sidered for inclusion in the national control programmes to ensure compliance with maximum residue levels of pesticides residues in and on food of plant and animal origin”)
2) Category A/B classification (Cat A was assigned to laboratories that have analysed at least 9 out of the 11 compulsory compounds on the Target Pesticides List, correctly detected 7 or more out of the 8 compulsory compounds present in the test item and have not reported any false positive result, see Section 4.4.4, p. 59)
V = analysed for and submitted concentration Value > “MRRL” for a pesticide present in the test item; ND = analysed for and correctly reported as “Not Detected”; Empty cells: not analysed; FN = analysed for but falsely not detected (False Negative result); FN* = analysed for a compound pre-sent in the test material and reported not detected due to lab’s RL > assigned value, therefore judged as FN; FP = false positive result(FP): Result reported as “≤ MRRL” and, therefore, not regarded as FP.
Table 4-2 (cont.): Scope and categorization of participating laboratories (including third country laboratories and laboratories that have not submitted results)

EUPT-SRM12 | 2017 (Strawberry Purée)
28
Compulsory Compounds Optional Compounds Total Additional Compounds
Compulsory Compound listed in Target List 2,
4-D
Aba
mec
tin
Capt
an (p
aren
t)
Chlo
roth
alon
il
Cyro
maz
ine
Dit
hioc
arba
mat
es
Ethe
phon
Fenb
utat
in O
xide
Flua
zifo
p
Folp
et (p
aren
t)
Gly
phos
ate
Hal
oxyf
op
Prop
amoc
arb
Ana
lyse
d / c
orre
ctly
foun
d am
ong
COM
PULS
ORY
com
poun
ds
(max
. 13
/ 8)
Optional / Additional Compound listed in Target List A
MPA
Bife
naza
te
Brom
ide
ion
Carb
ofur
an
Chlo
rate
Dit
hian
on
Phos
phon
ic a
cid
N-A
cety
l gly
phos
ate
Ana
lyse
d / c
orre
ctly
foun
d am
ong
OPT
ION
AL
com
poun
ds
(max
. 8 /
7)
Ana
lyse
d / c
orre
ctly
foun
d am
ong
COM
PULS
ORY
and
OP
TIO
NA
L co
mpo
unds
(m
ax. 2
1 / 1
5)
Capt
an (s
um)
Folp
et (s
um)
THPI
Phth
alim
ide
Ana
lyse
d / c
orre
ctly
foun
d am
ong
AD
DIT
ION
AL
com
poun
ds
wit
hin
the
EUPT
-Tar
get P
esti
cide
s Li
st (m
ax. 4
/ 4)
within MACP 1) Reg. Reg. Reg. Reg. Reg. Reg. Reg. Reg. Reg. Reg. Reg. Reg. Reg. within MACP 1) WD WD Reg. Reg. WD Reg. Reg. WD Reg. Reg. Reg. Reg.
present in Test Item Yes No Yes Yes No Yes No Yes No Yes Yes Yes No present in
Test Item No Yes Yes Yes Yes Yes Yes Yes Yes Yes Yes Yes
evaluated in this PT Yes No Yes Yes No Yes No Yes No Yes Yes Yes No evaluated
in this PT No Yes Yes No Yes Yes Yes Yes Yes Yes Yes Yes
Lab- Code SRM12-
NRL- SRM Cat. 2)
Lab- Code SRM12-
NRL- SRM Cat. 2)
50 B V ND V V ND V V ND V V ND 11 / 7 50 B V V V V 4 / 4 15 / 11 V V V V 4 / 4
51 B V ND V ND V ND V ND 8 / 4 51 B V 1 / 1 9 / 5 V V 2 / 2
52 A V ND V V ND V ND V ND V V V ND 13 / 8 52 A ND V V FN* V V V V 8 / 6 21 / 14 V V V V 4 / 4
53 A V ND V V ND V ND V ND V V V ND 13 / 8 53 A ND V V V V V V 7 / 6 20 / 14 V V V V 4 / 4
54 B V ND ND V V ND 6 / 3 54 B 0 / 0 6 / 3 0 / 0
55 B V ND 2 / 1 55 B 0 / 0 2 / 1 0 / 0
56 B ND V V V ND V ND 7 / 4 56 B 0 / 0 7 / 4 0 / 0
57 A V ND V V ND V ND V ND V V V ND 13 / 8 57 A V V V V 4 / 4 17 / 12 V V V V 4 / 4
58 A V ND V V ND V ND V ND V V V ND 13 / 8 58 A ND V V V V V V 7 / 6 20 / 14 V V V V 4 / 4
59 B V 1 / 1 59 B 0 / 0 1 / 1 0 / 0
60 B V ND V 3 / 2 60 B 0 / 0 3 / 2 0 / 0
61 B V V ND V V ND 6 / 4 61 B 0 / 0 6 / 4 V V V V 4 / 4
62 x B V V V V ND V V FN ND 9 / 6 62 x B ND FN* 2 / 0 11 / 6 0 / 0
63 A V ND V V ND V ND V ND V V ND 12 / 7 63 A V V V V V V 6 / 6 18 / 13 0 / 0
64 B V V ND V ND ND V V V ND 10 / 6 64 B V V 2 / 2 12 / 8 V V V V 4 / 4
65 B V 1 / 1 65 B 0 / 0 1 / 1 0 / 0
66 x A V ND V V ND V ND V ND V V V ND 13 / 8 66 x A ND V V V 4 / 3 17 / 11 V V V V 4 / 4
67 A V ND V V ND V ND V ND V V V ND 13 / 8 67 A ND V V V V 5 / 4 18 / 12 0 / 0
68 B V ND ND V ND V V ND 8 / 4 68 B ND 1 / 0 9 / 4 0 / 0
69 B V ND V V ND V ND V V ND 10 / 6 69 B V V 2 / 2 12 / 8 0 / 0
70 A V ND V V ND V ND V ND V V V ND 13 / 8 70 A ND V V V V V 6 / 5 19 / 13 V V V V 4 / 4
71 B V ND V ND V ND V ND V V ND 11 / 6 71 B ND V V V V V 6 / 5 17 / 11 V V V V 4 / 4
72 A V ND V V ND V ND V ND V V V ND 13 / 8 72 A ND V V V V V 6 / 5 19 / 13 V V V V 4 / 4
73 x B ND V V ND V V V ND 8 / 5 73 x B FN* V 2 / 1 10 / 6 V V V V 4 / 4
74 A V ND V V ND V ND V ND V V V ND 13 / 8 74 A ND V V V V 5 / 4 18 / 12 V V V V 4 / 4
75 x A V ND V V ND V ND V ND V V V ND 13 / 8 75 x A FN* V 2 / 1 15 / 9 0 / 0
1) MACP = EU Multiannual Control Program; Reg.: MACP Regulation; WD: MACP Working Document (“Working document on pesticides to be consid-ered for inclusion in the national control programmes to ensure compliance with maximum residue levels of pesticides residues in and on food of plant and animal origin”)
2) Category A/B classification (Cat A was assigned to laboratories that have analysed at least 12 out of the 13 compulsory compounds on the Target Pesticides List, correctly detected 7 or more out of the 8 compulsory compounds present in the test item and have not reported any false positive result, see Section 4.4.4, p. 59)
V = analysed for and submitted concentration Value > “MRRL” for a pesticide present in the test item; ND = analysed for and correctly reported as “Not Detected”; Empty cells: not analysed; FN = analysed for but falsely not detected (False Negative result); FN* = analysed for a compound pre-sent in the test material and reported not detected due to lab’s RL being > assigned value, therefore judged as FN; FP = false positive result(FP): Result reported as “≤ MRRL” and, therefore, not regarded as FP.
1) MACP = EU Multiannual Control Program; Reg.: MACP Regulation; WD: MACP Working Document (“Working document on pesticides to be con-sidered for inclusion in the national control programmes to ensure compliance with maximum residue levels of pesticides residues in and on food of plant and animal origin”)
2) Category A/B classification (Cat A was assigned to laboratories that have analysed at least 9 out of the 11 compulsory compounds on the Target Pesticides List, correctly detected 7 or more out of the 8 compulsory compounds present in the test item and have not reported any false positive result, see Section 4.4.4, p. 59)
V = analysed for and submitted concentration Value > “MRRL” for a pesticide present in the test item; ND = analysed for and correctly reported as “Not Detected”; Empty cells: not analysed; FN = analysed for but falsely not detected (False Negative result); FN* = analysed for a compound pre-sent in the test material and reported not detected due to lab’s RL > assigned value, therefore judged as FN; FP = false positive result(FP): Result reported as “≤ MRRL” and, therefore, not regarded as FP.
Table 4-2 (cont.): Scope and categorization of participating laboratories (including third country laboratories and laboratories that have not submitted results)
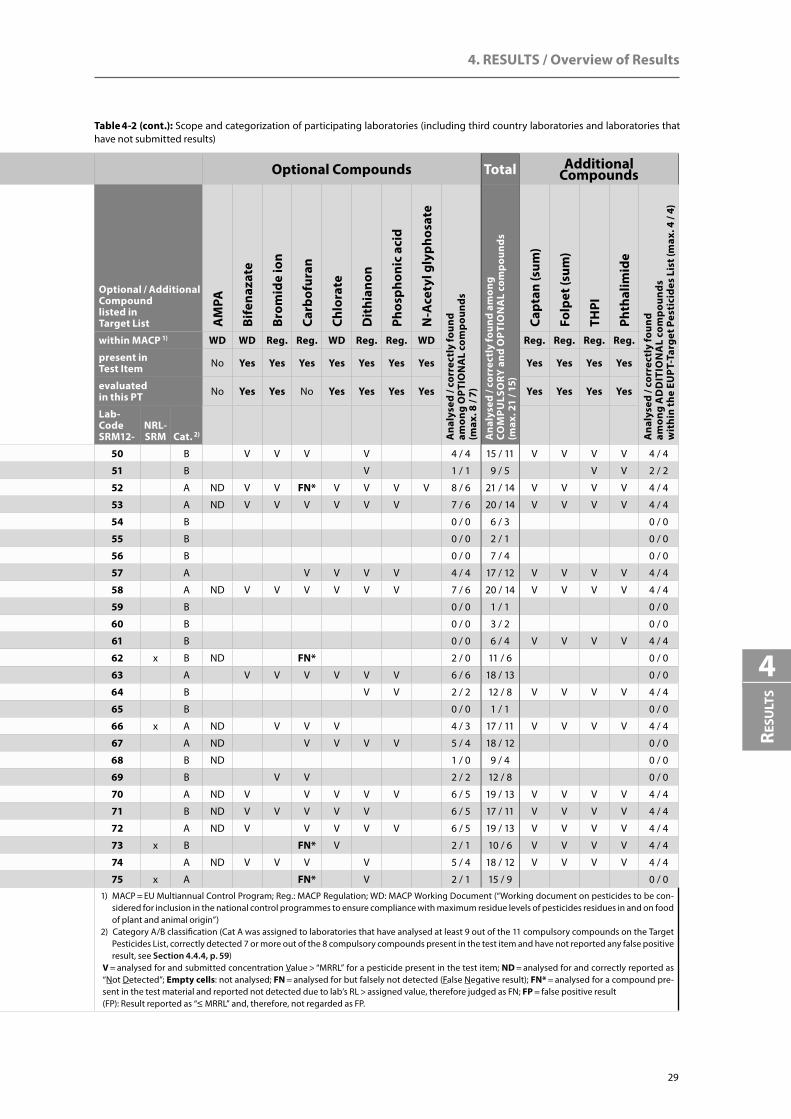
4. RESULTS / Overview of Results
29
Resu
lts
4
Compulsory Compounds Optional Compounds Total Additional Compounds
Compulsory Compound listed in Target List 2,
4-D
Aba
mec
tin
Capt
an (p
aren
t)
Chlo
roth
alon
il
Cyro
maz
ine
Dit
hioc
arba
mat
es
Ethe
phon
Fenb
utat
in O
xide
Flua
zifo
p
Folp
et (p
aren
t)
Gly
phos
ate
Hal
oxyf
op
Prop
amoc
arb
Ana
lyse
d / c
orre
ctly
foun
d am
ong
COM
PULS
ORY
com
poun
ds
(max
. 13
/ 8)
Optional / Additional Compound listed in Target List A
MPA
Bife
naza
te
Brom
ide
ion
Carb
ofur
an
Chlo
rate
Dit
hian
on
Phos
phon
ic a
cid
N-A
cety
l gly
phos
ate
Ana
lyse
d / c
orre
ctly
foun
d am
ong
OPT
ION
AL
com
poun
ds
(max
. 8 /
7)
Ana
lyse
d / c
orre
ctly
foun
d am
ong
COM
PULS
ORY
and
OP
TIO
NA
L co
mpo
unds
(m
ax. 2
1 / 1
5)
Capt
an (s
um)
Folp
et (s
um)
THPI
Phth
alim
ide
Ana
lyse
d / c
orre
ctly
foun
d am
ong
AD
DIT
ION
AL
com
poun
ds
wit
hin
the
EUPT
-Tar
get P
esti
cide
s Li
st (m
ax. 4
/ 4)
within MACP 1) Reg. Reg. Reg. Reg. Reg. Reg. Reg. Reg. Reg. Reg. Reg. Reg. Reg. within MACP 1) WD WD Reg. Reg. WD Reg. Reg. WD Reg. Reg. Reg. Reg.
present in Test Item Yes No Yes Yes No Yes No Yes No Yes Yes Yes No present in
Test Item No Yes Yes Yes Yes Yes Yes Yes Yes Yes Yes Yes
evaluated in this PT Yes No Yes Yes No Yes No Yes No Yes Yes Yes No evaluated
in this PT No Yes Yes No Yes Yes Yes Yes Yes Yes Yes Yes
Lab- Code SRM12-
NRL- SRM Cat. 2)
Lab- Code SRM12-
NRL- SRM Cat. 2)
50 B V ND V V ND V V ND V V ND 11 / 7 50 B V V V V 4 / 4 15 / 11 V V V V 4 / 4
51 B V ND V ND V ND V ND 8 / 4 51 B V 1 / 1 9 / 5 V V 2 / 2
52 A V ND V V ND V ND V ND V V V ND 13 / 8 52 A ND V V FN* V V V V 8 / 6 21 / 14 V V V V 4 / 4
53 A V ND V V ND V ND V ND V V V ND 13 / 8 53 A ND V V V V V V 7 / 6 20 / 14 V V V V 4 / 4
54 B V ND ND V V ND 6 / 3 54 B 0 / 0 6 / 3 0 / 0
55 B V ND 2 / 1 55 B 0 / 0 2 / 1 0 / 0
56 B ND V V V ND V ND 7 / 4 56 B 0 / 0 7 / 4 0 / 0
57 A V ND V V ND V ND V ND V V V ND 13 / 8 57 A V V V V 4 / 4 17 / 12 V V V V 4 / 4
58 A V ND V V ND V ND V ND V V V ND 13 / 8 58 A ND V V V V V V 7 / 6 20 / 14 V V V V 4 / 4
59 B V 1 / 1 59 B 0 / 0 1 / 1 0 / 0
60 B V ND V 3 / 2 60 B 0 / 0 3 / 2 0 / 0
61 B V V ND V V ND 6 / 4 61 B 0 / 0 6 / 4 V V V V 4 / 4
62 x B V V V V ND V V FN ND 9 / 6 62 x B ND FN* 2 / 0 11 / 6 0 / 0
63 A V ND V V ND V ND V ND V V ND 12 / 7 63 A V V V V V V 6 / 6 18 / 13 0 / 0
64 B V V ND V ND ND V V V ND 10 / 6 64 B V V 2 / 2 12 / 8 V V V V 4 / 4
65 B V 1 / 1 65 B 0 / 0 1 / 1 0 / 0
66 x A V ND V V ND V ND V ND V V V ND 13 / 8 66 x A ND V V V 4 / 3 17 / 11 V V V V 4 / 4
67 A V ND V V ND V ND V ND V V V ND 13 / 8 67 A ND V V V V 5 / 4 18 / 12 0 / 0
68 B V ND ND V ND V V ND 8 / 4 68 B ND 1 / 0 9 / 4 0 / 0
69 B V ND V V ND V ND V V ND 10 / 6 69 B V V 2 / 2 12 / 8 0 / 0
70 A V ND V V ND V ND V ND V V V ND 13 / 8 70 A ND V V V V V 6 / 5 19 / 13 V V V V 4 / 4
71 B V ND V ND V ND V ND V V ND 11 / 6 71 B ND V V V V V 6 / 5 17 / 11 V V V V 4 / 4
72 A V ND V V ND V ND V ND V V V ND 13 / 8 72 A ND V V V V V 6 / 5 19 / 13 V V V V 4 / 4
73 x B ND V V ND V V V ND 8 / 5 73 x B FN* V 2 / 1 10 / 6 V V V V 4 / 4
74 A V ND V V ND V ND V ND V V V ND 13 / 8 74 A ND V V V V 5 / 4 18 / 12 V V V V 4 / 4
75 x A V ND V V ND V ND V ND V V V ND 13 / 8 75 x A FN* V 2 / 1 15 / 9 0 / 0
1) MACP = EU Multiannual Control Program; Reg.: MACP Regulation; WD: MACP Working Document (“Working document on pesticides to be consid-ered for inclusion in the national control programmes to ensure compliance with maximum residue levels of pesticides residues in and on food of plant and animal origin”)
2) Category A/B classification (Cat A was assigned to laboratories that have analysed at least 12 out of the 13 compulsory compounds on the Target Pesticides List, correctly detected 7 or more out of the 8 compulsory compounds present in the test item and have not reported any false positive result, see Section 4.4.4, p. 59)
V = analysed for and submitted concentration Value > “MRRL” for a pesticide present in the test item; ND = analysed for and correctly reported as “Not Detected”; Empty cells: not analysed; FN = analysed for but falsely not detected (False Negative result); FN* = analysed for a compound pre-sent in the test material and reported not detected due to lab’s RL being > assigned value, therefore judged as FN; FP = false positive result(FP): Result reported as “≤ MRRL” and, therefore, not regarded as FP.
1) MACP = EU Multiannual Control Program; Reg.: MACP Regulation; WD: MACP Working Document (“Working document on pesticides to be con-sidered for inclusion in the national control programmes to ensure compliance with maximum residue levels of pesticides residues in and on food of plant and animal origin”)
2) Category A/B classification (Cat A was assigned to laboratories that have analysed at least 9 out of the 11 compulsory compounds on the Target Pesticides List, correctly detected 7 or more out of the 8 compulsory compounds present in the test item and have not reported any false positive result, see Section 4.4.4, p. 59)
V = analysed for and submitted concentration Value > “MRRL” for a pesticide present in the test item; ND = analysed for and correctly reported as “Not Detected”; Empty cells: not analysed; FN = analysed for but falsely not detected (False Negative result); FN* = analysed for a compound pre-sent in the test material and reported not detected due to lab’s RL > assigned value, therefore judged as FN; FP = false positive result(FP): Result reported as “≤ MRRL” and, therefore, not regarded as FP.
Table 4-2 (cont.): Scope and categorization of participating laboratories (including third country laboratories and laboratories that have not submitted results)

EUPT-SRM12 | 2017 (Strawberry Purée)
30
Compulsory Compounds Optional Compounds Total Additional Compounds
Compulsory Compound listed in Target List 2,
4-D
Aba
mec
tin
Capt
an (p
aren
t)
Chlo
roth
alon
il
Cyro
maz
ine
Dit
hioc
arba
mat
es
Ethe
phon
Fenb
utat
in O
xide
Flua
zifo
p
Folp
et (p
aren
t)
Gly
phos
ate
Hal
oxyf
op
Prop
amoc
arb
Ana
lyse
d / c
orre
ctly
foun
d am
ong
COM
PULS
ORY
com
poun
ds
(max
. 13
/ 8)
Optional / Additional Compound listed in Target List A
MPA
Bife
naza
te
Brom
ide
ion
Carb
ofur
an
Chlo
rate
Dit
hian
on
Phos
phon
ic a
cid
N-A
cety
l gly
phos
ate
Ana
lyse
d / c
orre
ctly
foun
d am
ong
OPT
ION
AL
com
poun
ds
(max
. 8 /
7)
Ana
lyse
d / c
orre
ctly
foun
d am
ong
COM
PULS
ORY
and
OP
TIO
NA
L co
mpo
unds
(m
ax. 2
1 / 1
5)
Capt
an (s
um)
Folp
et (s
um)
THPI
Phth
alim
ide
Ana
lyse
d / c
orre
ctly
foun
d am
ong
AD
DIT
ION
AL
com
poun
ds
wit
hin
the
EUPT
-Tar
get P
esti
cide
s Li
st (m
ax. 4
/ 4)
within MACP 1) Reg. Reg. Reg. Reg. Reg. Reg. Reg. Reg. Reg. Reg. Reg. Reg. Reg. within MACP 1) WD WD Reg. Reg. WD Reg. Reg. WD Reg. Reg. Reg. Reg.
present in Test Item Yes No Yes Yes No Yes No Yes No Yes Yes Yes No present in
Test Item No Yes Yes Yes Yes Yes Yes Yes Yes Yes Yes Yes
evaluated in this PT Yes No Yes Yes No Yes No Yes No Yes Yes Yes No evaluated
in this PT No Yes Yes No Yes Yes Yes Yes Yes Yes Yes Yes
Lab- Code SRM12-
NRL- SRM Cat. 2)
Lab- Code SRM12-
NRL- SRM Cat. 2)
76 A V ND V V ND V ND V ND V V V ND 13 / 8 76 A ND V V V V V V V 8 / 7 21 / 15 V V V V 4 / 4
77 B ND V V V V V 6 / 5 77 B 0 / 0 6 / 5 0 / 0
78 A V ND V V ND V ND V ND V V V ND 13 / 8 78 A V V V V V 5 / 5 18 / 13 V V V V 4 / 4
79 B V ND V ND V ND V ND V V ND 11 / 6 79 B ND V V V V V 6 / 5 17 / 11 V V 2 / 2
80 B V 1 / 1 80 B 0 / 0 1 / 1 0 / 0
81 x B V ND V ND V ND V ND V V ND 11 / 6 81 x B V V V V V V 6 / 6 17 / 12 V V V V 4 / 4
82 B V 1 / 1 82 B 0 / 0 1 / 1 0 / 0
83 x A V ND V V ND ND V ND V V V ND 12 / 7 83 x A 0 / 0 12 / 7 0 / 0
84 A V ND V V ND V ND V ND V V V ND 13 / 8 84 A ND V V V V V V 7 / 6 20 / 14 V V V V 4 / 4
85 x B V ND ND 3 / 1 85 x B 0 / 0 3 / 1 0 / 0
86 B V ND V V ND V ND V V V ND 11 / 7 86 B ND V V V 4 / 3 15 / 10 V V V V 4 / 4
87 B V 1 / 1 87 B 0 / 0 1 / 1 0 / 0
88 A V ND V V ND V ND V ND V V V ND 13 / 8 88 A V 1 / 1 14 / 9 V V V V 4 / 4
89 B V ND V ND V V ND 7 / 4 89 B V V 2 / 2 9 / 6 0 / 0
90 A V ND V V ND V ND V ND V V V ND 13 / 8 90 A ND V V V V 5 / 4 18 / 12 V V V V 4 / 4
91 x B V ND V V ND V V ND V V ND 11 / 7 91 x B V V 2 / 2 13 / 9 0 / 0
92 x A V ND V V ND V ND V ND V V V ND 13 / 8 92 x A V V V V V 5 / 5 18 / 13 V V V V 4 / 4
93 B V ND V V ND V ND V V ND 10 / 6 93 B 0 / 0 10 / 6 0 / 0
94 A V ND V V ND V ND V ND V V V ND 13 / 8 94 A V V V V 4 / 4 17 / 12 V V V V 4 / 4
95 A V ND V V ND V ND V ND V V V ND 13 / 8 95 A ND V V V V FN V 7 / 5 20 / 13 V V V V 4 / 4
96 x A V ND V V ND V ND V ND V V V ND 13 / 8 96 x A 0 / 0 13 / 8 0 / 0
97 A V ND V V ND V ND V ND V V V ND 13 / 8 97 A ND V V FN* V V V V 8 / 6 21 / 14 V V V V 4 / 4
98 x A V ND V V ND V ND V ND V V V ND 13 / 8 98 x A V FN V V V 5 / 4 18 / 12 V V V V 4 / 4
99 A V ND V V ND V ND FN ND V V V ND 13 / 7 99 A ND V V V V V V 7 / 6 20 / 13 V V V V 4 / 4
100 B V 1 / 1 100 B 0 / 0 1 / 1 0 / 0
101 B V 1 / 1 101 B 0 / 0 1 / 1 0 / 0
1) MACP = EU Multiannual Control Program; Reg.: MACP Regulation; WD: MACP Working Document (“Working document on pesticides to be consid-ered for inclusion in the national control programmes to ensure compliance with maximum residue levels of pesticides residues in and on food of plant and animal origin”)
2) Category A/B classification (Cat A was assigned to laboratories that have analysed at least 12 out of the 13 compulsory compounds on the Target Pesticides List, correctly detected 7 or more out of the 8 compulsory compounds present in the test item and have not reported any false positive result, see Section 4.4.4, p. 59)
V = analysed for and submitted concentration Value > “MRRL” for a pesticide present in the test item; ND = analysed for and correctly reported as “Not Detected”; Empty cells: not analysed; FN = analysed for but falsely not detected (False Negative result); FN* = analysed for a compound pre-sent in the test material and reported not detected due to lab’s RL being > assigned value, therefore judged as FN; FP = false positive result(FP): Result reported as “≤ MRRL” and, therefore, not regarded as FP.
1) MACP = EU Multiannual Control Program; Reg.: MACP Regulation; WD: MACP Working Document (“Working document on pesticides to be con-sidered for inclusion in the national control programmes to ensure compliance with maximum residue levels of pesticides residues in and on food of plant and animal origin”)
2) Category A/B classification (Cat A was assigned to laboratories that have analysed at least 9 out of the 11 compulsory compounds on the Target Pesticides List, correctly detected 7 or more out of the 8 compulsory compounds present in the test item and have not reported any false positive result, see Section 4.4.4, p. 59)
V = analysed for and submitted concentration Value > “MRRL” for a pesticide present in the test item; ND = analysed for and correctly reported as “Not Detected”; Empty cells: not analysed; FN = analysed for but falsely not detected (False Negative result); FN* = analysed for a compound pre-sent in the test material and reported not detected due to lab’s RL > assigned value, therefore judged as FN; FP = false positive result(FP): Result reported as “≤ MRRL” and, therefore, not regarded as FP.
Table 4-2 (cont.): Scope and categorization of participating laboratories (including third country laboratories and laboratories that have not submitted results)

4. RESULTS / Overview of Results
31
Resu
lts
4
Compulsory Compounds Optional Compounds Total Additional Compounds
Compulsory Compound listed in Target List 2,
4-D
Aba
mec
tin
Capt
an (p
aren
t)
Chlo
roth
alon
il
Cyro
maz
ine
Dit
hioc
arba
mat
es
Ethe
phon
Fenb
utat
in O
xide
Flua
zifo
p
Folp
et (p
aren
t)
Gly
phos
ate
Hal
oxyf
op
Prop
amoc
arb
Ana
lyse
d / c
orre
ctly
foun
d am
ong
COM
PULS
ORY
com
poun
ds
(max
. 13
/ 8)
Optional / Additional Compound listed in Target List A
MPA
Bife
naza
te
Brom
ide
ion
Carb
ofur
an
Chlo
rate
Dit
hian
on
Phos
phon
ic a
cid
N-A
cety
l gly
phos
ate
Ana
lyse
d / c
orre
ctly
foun
d am
ong
OPT
ION
AL
com
poun
ds
(max
. 8 /
7)
Ana
lyse
d / c
orre
ctly
foun
d am
ong
COM
PULS
ORY
and
OP
TIO
NA
L co
mpo
unds
(m
ax. 2
1 / 1
5)
Capt
an (s
um)
Folp
et (s
um)
THPI
Phth
alim
ide
Ana
lyse
d / c
orre
ctly
foun
d am
ong
AD
DIT
ION
AL
com
poun
ds
wit
hin
the
EUPT
-Tar
get P
esti
cide
s Li
st (m
ax. 4
/ 4)
within MACP 1) Reg. Reg. Reg. Reg. Reg. Reg. Reg. Reg. Reg. Reg. Reg. Reg. Reg. within MACP 1) WD WD Reg. Reg. WD Reg. Reg. WD Reg. Reg. Reg. Reg.
present in Test Item Yes No Yes Yes No Yes No Yes No Yes Yes Yes No present in
Test Item No Yes Yes Yes Yes Yes Yes Yes Yes Yes Yes Yes
evaluated in this PT Yes No Yes Yes No Yes No Yes No Yes Yes Yes No evaluated
in this PT No Yes Yes No Yes Yes Yes Yes Yes Yes Yes Yes
Lab- Code SRM12-
NRL- SRM Cat. 2)
Lab- Code SRM12-
NRL- SRM Cat. 2)
76 A V ND V V ND V ND V ND V V V ND 13 / 8 76 A ND V V V V V V V 8 / 7 21 / 15 V V V V 4 / 4
77 B ND V V V V V 6 / 5 77 B 0 / 0 6 / 5 0 / 0
78 A V ND V V ND V ND V ND V V V ND 13 / 8 78 A V V V V V 5 / 5 18 / 13 V V V V 4 / 4
79 B V ND V ND V ND V ND V V ND 11 / 6 79 B ND V V V V V 6 / 5 17 / 11 V V 2 / 2
80 B V 1 / 1 80 B 0 / 0 1 / 1 0 / 0
81 x B V ND V ND V ND V ND V V ND 11 / 6 81 x B V V V V V V 6 / 6 17 / 12 V V V V 4 / 4
82 B V 1 / 1 82 B 0 / 0 1 / 1 0 / 0
83 x A V ND V V ND ND V ND V V V ND 12 / 7 83 x A 0 / 0 12 / 7 0 / 0
84 A V ND V V ND V ND V ND V V V ND 13 / 8 84 A ND V V V V V V 7 / 6 20 / 14 V V V V 4 / 4
85 x B V ND ND 3 / 1 85 x B 0 / 0 3 / 1 0 / 0
86 B V ND V V ND V ND V V V ND 11 / 7 86 B ND V V V 4 / 3 15 / 10 V V V V 4 / 4
87 B V 1 / 1 87 B 0 / 0 1 / 1 0 / 0
88 A V ND V V ND V ND V ND V V V ND 13 / 8 88 A V 1 / 1 14 / 9 V V V V 4 / 4
89 B V ND V ND V V ND 7 / 4 89 B V V 2 / 2 9 / 6 0 / 0
90 A V ND V V ND V ND V ND V V V ND 13 / 8 90 A ND V V V V 5 / 4 18 / 12 V V V V 4 / 4
91 x B V ND V V ND V V ND V V ND 11 / 7 91 x B V V 2 / 2 13 / 9 0 / 0
92 x A V ND V V ND V ND V ND V V V ND 13 / 8 92 x A V V V V V 5 / 5 18 / 13 V V V V 4 / 4
93 B V ND V V ND V ND V V ND 10 / 6 93 B 0 / 0 10 / 6 0 / 0
94 A V ND V V ND V ND V ND V V V ND 13 / 8 94 A V V V V 4 / 4 17 / 12 V V V V 4 / 4
95 A V ND V V ND V ND V ND V V V ND 13 / 8 95 A ND V V V V FN V 7 / 5 20 / 13 V V V V 4 / 4
96 x A V ND V V ND V ND V ND V V V ND 13 / 8 96 x A 0 / 0 13 / 8 0 / 0
97 A V ND V V ND V ND V ND V V V ND 13 / 8 97 A ND V V FN* V V V V 8 / 6 21 / 14 V V V V 4 / 4
98 x A V ND V V ND V ND V ND V V V ND 13 / 8 98 x A V FN V V V 5 / 4 18 / 12 V V V V 4 / 4
99 A V ND V V ND V ND FN ND V V V ND 13 / 7 99 A ND V V V V V V 7 / 6 20 / 13 V V V V 4 / 4
100 B V 1 / 1 100 B 0 / 0 1 / 1 0 / 0
101 B V 1 / 1 101 B 0 / 0 1 / 1 0 / 0
1) MACP = EU Multiannual Control Program; Reg.: MACP Regulation; WD: MACP Working Document (“Working document on pesticides to be consid-ered for inclusion in the national control programmes to ensure compliance with maximum residue levels of pesticides residues in and on food of plant and animal origin”)
2) Category A/B classification (Cat A was assigned to laboratories that have analysed at least 12 out of the 13 compulsory compounds on the Target Pesticides List, correctly detected 7 or more out of the 8 compulsory compounds present in the test item and have not reported any false positive result, see Section 4.4.4, p. 59)
V = analysed for and submitted concentration Value > “MRRL” for a pesticide present in the test item; ND = analysed for and correctly reported as “Not Detected”; Empty cells: not analysed; FN = analysed for but falsely not detected (False Negative result); FN* = analysed for a compound pre-sent in the test material and reported not detected due to lab’s RL being > assigned value, therefore judged as FN; FP = false positive result(FP): Result reported as “≤ MRRL” and, therefore, not regarded as FP.
1) MACP = EU Multiannual Control Program; Reg.: MACP Regulation; WD: MACP Working Document (“Working document on pesticides to be con-sidered for inclusion in the national control programmes to ensure compliance with maximum residue levels of pesticides residues in and on food of plant and animal origin”)
2) Category A/B classification (Cat A was assigned to laboratories that have analysed at least 9 out of the 11 compulsory compounds on the Target Pesticides List, correctly detected 7 or more out of the 8 compulsory compounds present in the test item and have not reported any false positive result, see Section 4.4.4, p. 59)
V = analysed for and submitted concentration Value > “MRRL” for a pesticide present in the test item; ND = analysed for and correctly reported as “Not Detected”; Empty cells: not analysed; FN = analysed for but falsely not detected (False Negative result); FN* = analysed for a compound pre-sent in the test material and reported not detected due to lab’s RL > assigned value, therefore judged as FN; FP = false positive result(FP): Result reported as “≤ MRRL” and, therefore, not regarded as FP.
Table 4-2 (cont.): Scope and categorization of participating laboratories (including third country laboratories and laboratories that have not submitted results)

EUPT-SRM12 | 2017 (Strawberry Purée)
32
Compulsory Compounds Optional Compounds Total Additional Compounds
Compulsory Compound listed in Target List 2,
4-D
Aba
mec
tin
Capt
an (p
aren
t)
Chlo
roth
alon
il
Cyro
maz
ine
Dit
hioc
arba
mat
es
Ethe
phon
Fenb
utat
in O
xide
Flua
zifo
p
Folp
et (p
aren
t)
Gly
phos
ate
Hal
oxyf
op
Prop
amoc
arb
Ana
lyse
d / c
orre
ctly
foun
d am
ong
COM
PULS
ORY
com
poun
ds
(max
. 13
/ 8)
Optional / Additional Compound listed in Target List A
MPA
Bife
naza
te
Brom
ide
ion
Carb
ofur
an
Chlo
rate
Dit
hian
on
Phos
phon
ic a
cid
N-A
cety
l gly
phos
ate
Ana
lyse
d / c
orre
ctly
foun
d am
ong
OPT
ION
AL
com
poun
ds
(max
. 8 /
7)
Ana
lyse
d / c
orre
ctly
foun
d am
ong
COM
PULS
ORY
and
OP
TIO
NA
L co
mpo
unds
(m
ax. 2
1 / 1
5)
Capt
an (s
um)
Folp
et (s
um)
THPI
Phth
alim
ide
Ana
lyse
d / c
orre
ctly
foun
d am
ong
AD
DIT
ION
AL
com
poun
ds
wit
hin
the
EUPT
-Tar
get P
esti
cide
s Li
st (m
ax. 4
/ 4)
within MACP 1) Reg. Reg. Reg. Reg. Reg. Reg. Reg. Reg. Reg. Reg. Reg. Reg. Reg. within MACP 1) WD WD Reg. Reg. WD Reg. Reg. WD Reg. Reg. Reg. Reg.
present in Test Item Yes No Yes Yes No Yes No Yes No Yes Yes Yes No present in
Test Item No Yes Yes Yes Yes Yes Yes Yes Yes Yes Yes Yes
evaluated in this PT Yes No Yes Yes No Yes No Yes No Yes Yes Yes No evaluated
in this PT No Yes Yes No Yes Yes Yes Yes Yes Yes Yes Yes
Lab- Code SRM12-
NRL- SRM Cat. 2)
Lab- Code SRM12-
NRL- SRM Cat. 2)
102 A V ND V V ND V ND V ND FN V V ND 13 / 7 102 A ND V V V V V V 7 / 6 20 / 13 V V V V 4 / 4
103 x A V ND V V ND V ND V ND V V V ND 13 / 8 103 x A ND V V V V V V V 8 / 7 21 / 15 V V V V 4 / 4
104 A V ND V V ND V ND V ND V V V ND 13 / 8 104 A ND V V 3 / 2 16 / 10 V V V V 4 / 4
105 x B V V ND V V ND 6 / 4 105 x B 0 / 0 6 / 4 V V V V 4 / 4
106 B V ND FN FN ND V ND FN ND FN V V ND 13 / 4 106 B ND V FN* 3 / 1 16 / 5 V V V V 4 / 4
107 x A V ND V V ND V ND V ND V V V ND 13 / 8 107 x A V FN V 3 / 2 16 / 10 0 / 0
108 B V ND V V ND V ND V V V ND 11 / 7 108 B 0 / 0 11 / 7 0 / 0
109 A V ND V V ND V ND V ND V V V ND 13 / 8 109 A ND V V V V V V 7 / 6 20 / 14 V V V V 4 / 4
110 B V V V 3 / 3 110 B 0 / 0 3 / 3 0 / 0
111 B V 1 / 1 111 B 0 / 0 1 / 1 0 / 0
112 B V V V 3 / 3 112 B 0 / 0 3 / 3 0 / 0
113 A V ND V V ND V V ND V V V ND 12 / 8 113 A ND V V V V 5 / 4 17 / 12 V V V V 4 / 4
114 B V 1 / 1 114 B 0 / 0 1 / 1 0 / 0
115 A V ND V V ND V ND V ND V V V ND 13 / 8 115 A ND V V V V V V V 8 / 7 21 / 15 V V V V 4 / 4
116 A V ND V V ND V ND V ND V V V ND 13 / 8 116 A ND V V V V 5 / 4 18 / 12 V V V V 4 / 4
117 B V ND V V ND ND V V ND 9 / 5 117 B V 1 / 1 10 / 6 0 / 0
118 B V V V V FP 5 / 4 118 B V V V 3 / 3 8 / 7 0 / 0
119 B V 1 / 1 119 B 0 / 0 1 / 1 0 / 0
120 B ND FN* V V ND 5 / 2 120 B FN* 1 / 0 6 / 2 0 / 0
121 B V ND ND 3 / 1 121 B V 1 / 1 4 / 2 0 / 0
122 B V ND V 3 / 2 122 B ND 1 / 0 4 / 2 0 / 0
123 B V ND 2 / 1 123 B V 1 / 1 3 / 2 0 / 0
124 x B V ND V V V ND V V ND 9 / 6 124 x B FN* 1 / 0 10 / 6 0 / 0
125 A V ND V V ND ND V ND V V V ND 12 / 7 125 A ND V V V V V V V 8 / 7 20 / 14 V V V V 4 / 4
126 B V V V V ND V V V ND 9 / 7 126 B V FN* 2 / 1 11 / 8 V V V V 4 / 4
127 A V ND V V ND V ND V ND V V V ND 13 / 8 127 A ND V V V V V 6 / 5 19 / 13 V V V V 4 / 4
1) MACP = EU Multiannual Control Program; Reg.: MACP Regulation; WD: MACP Working Document (“Working document on pesticides to be consid-ered for inclusion in the national control programmes to ensure compliance with maximum residue levels of pesticides residues in and on food of plant and animal origin”)
2) Category A/B classification (Cat A was assigned to laboratories that have analysed at least 12 out of the 13 compulsory compounds on the Target Pesticides List, correctly detected 7 or more out of the 8 compulsory compounds present in the test item and have not reported any false positive result, see Section 4.4.4, p. 59)
V = analysed for and submitted concentration Value > “MRRL” for a pesticide present in the test item; ND = analysed for and correctly reported as “Not Detected”; Empty cells: not analysed; FN = analysed for but falsely not detected (False Negative result); FN* = analysed for a compound pre-sent in the test material and reported not detected due to lab’s RL being > assigned value, therefore judged as FN; FP = false positive result(FP): Result reported as “≤ MRRL” and, therefore, not regarded as FP.
1) MACP = EU Multiannual Control Program; Reg.: MACP Regulation; WD: MACP Working Document (“Working document on pesticides to be con-sidered for inclusion in the national control programmes to ensure compliance with maximum residue levels of pesticides residues in and on food of plant and animal origin”)
2) Category A/B classification (Cat A was assigned to laboratories that have analysed at least 9 out of the 11 compulsory compounds on the Target Pesticides List, correctly detected 7 or more out of the 8 compulsory compounds present in the test item and have not reported any false positive result, see Section 4.4.4, p. 59)
V = analysed for and submitted concentration Value > “MRRL” for a pesticide present in the test item; ND = analysed for and correctly reported as “Not Detected”; Empty cells: not analysed; FN = analysed for but falsely not detected (False Negative result); FN* = analysed for a compound pre-sent in the test material and reported not detected due to lab’s RL > assigned value, therefore judged as FN; FP = false positive result(FP): Result reported as “≤ MRRL” and, therefore, not regarded as FP.
Table 4-2 (cont.): Scope and categorization of participating laboratories (including third country laboratories and laboratories that have not submitted results)

4. RESULTS / Overview of Results
33
Resu
lts
4
Table 4-2 (cont.): Scope and categorization of participating laboratories (including third country laboratories and laboratories that have not submitted results)
Compulsory Compounds Optional Compounds Total Additional Compounds
Compulsory Compound listed in Target List 2,
4-D
Aba
mec
tin
Capt
an (p
aren
t)
Chlo
roth
alon
il
Cyro
maz
ine
Dit
hioc
arba
mat
es
Ethe
phon
Fenb
utat
in O
xide
Flua
zifo
p
Folp
et (p
aren
t)
Gly
phos
ate
Hal
oxyf
op
Prop
amoc
arb
Ana
lyse
d / c
orre
ctly
foun
d am
ong
COM
PULS
ORY
com
poun
ds
(max
. 13
/ 8)
Optional / Additional Compound listed in Target List A
MPA
Bife
naza
te
Brom
ide
ion
Carb
ofur
an
Chlo
rate
Dit
hian
on
Phos
phon
ic a
cid
N-A
cety
l gly
phos
ate
Ana
lyse
d / c
orre
ctly
foun
d am
ong
OPT
ION
AL
com
poun
ds
(max
. 8 /
7)
Ana
lyse
d / c
orre
ctly
foun
d am
ong
COM
PULS
ORY
and
OP
TIO
NA
L co
mpo
unds
(m
ax. 2
1 / 1
5)
Capt
an (s
um)
Folp
et (s
um)
THPI
Phth
alim
ide
Ana
lyse
d / c
orre
ctly
foun
d am
ong
AD
DIT
ION
AL
com
poun
ds
wit
hin
the
EUPT
-Tar
get P
esti
cide
s Li
st (m
ax. 4
/ 4)
within MACP 1) Reg. Reg. Reg. Reg. Reg. Reg. Reg. Reg. Reg. Reg. Reg. Reg. Reg. within MACP 1) WD WD Reg. Reg. WD Reg. Reg. WD Reg. Reg. Reg. Reg.
present in Test Item Yes No Yes Yes No Yes No Yes No Yes Yes Yes No present in
Test Item No Yes Yes Yes Yes Yes Yes Yes Yes Yes Yes Yes
evaluated in this PT Yes No Yes Yes No Yes No Yes No Yes Yes Yes No evaluated
in this PT No Yes Yes No Yes Yes Yes Yes Yes Yes Yes Yes
Lab- Code SRM12-
NRL- SRM Cat. 2)
Lab- Code SRM12-
NRL- SRM Cat. 2)
102 A V ND V V ND V ND V ND FN V V ND 13 / 7 102 A ND V V V V V V 7 / 6 20 / 13 V V V V 4 / 4
103 x A V ND V V ND V ND V ND V V V ND 13 / 8 103 x A ND V V V V V V V 8 / 7 21 / 15 V V V V 4 / 4
104 A V ND V V ND V ND V ND V V V ND 13 / 8 104 A ND V V 3 / 2 16 / 10 V V V V 4 / 4
105 x B V V ND V V ND 6 / 4 105 x B 0 / 0 6 / 4 V V V V 4 / 4
106 B V ND FN FN ND V ND FN ND FN V V ND 13 / 4 106 B ND V FN* 3 / 1 16 / 5 V V V V 4 / 4
107 x A V ND V V ND V ND V ND V V V ND 13 / 8 107 x A V FN V 3 / 2 16 / 10 0 / 0
108 B V ND V V ND V ND V V V ND 11 / 7 108 B 0 / 0 11 / 7 0 / 0
109 A V ND V V ND V ND V ND V V V ND 13 / 8 109 A ND V V V V V V 7 / 6 20 / 14 V V V V 4 / 4
110 B V V V 3 / 3 110 B 0 / 0 3 / 3 0 / 0
111 B V 1 / 1 111 B 0 / 0 1 / 1 0 / 0
112 B V V V 3 / 3 112 B 0 / 0 3 / 3 0 / 0
113 A V ND V V ND V V ND V V V ND 12 / 8 113 A ND V V V V 5 / 4 17 / 12 V V V V 4 / 4
114 B V 1 / 1 114 B 0 / 0 1 / 1 0 / 0
115 A V ND V V ND V ND V ND V V V ND 13 / 8 115 A ND V V V V V V V 8 / 7 21 / 15 V V V V 4 / 4
116 A V ND V V ND V ND V ND V V V ND 13 / 8 116 A ND V V V V 5 / 4 18 / 12 V V V V 4 / 4
117 B V ND V V ND ND V V ND 9 / 5 117 B V 1 / 1 10 / 6 0 / 0
118 B V V V V FP 5 / 4 118 B V V V 3 / 3 8 / 7 0 / 0
119 B V 1 / 1 119 B 0 / 0 1 / 1 0 / 0
120 B ND FN* V V ND 5 / 2 120 B FN* 1 / 0 6 / 2 0 / 0
121 B V ND ND 3 / 1 121 B V 1 / 1 4 / 2 0 / 0
122 B V ND V 3 / 2 122 B ND 1 / 0 4 / 2 0 / 0
123 B V ND 2 / 1 123 B V 1 / 1 3 / 2 0 / 0
124 x B V ND V V V ND V V ND 9 / 6 124 x B FN* 1 / 0 10 / 6 0 / 0
125 A V ND V V ND ND V ND V V V ND 12 / 7 125 A ND V V V V V V V 8 / 7 20 / 14 V V V V 4 / 4
126 B V V V V ND V V V ND 9 / 7 126 B V FN* 2 / 1 11 / 8 V V V V 4 / 4
127 A V ND V V ND V ND V ND V V V ND 13 / 8 127 A ND V V V V V 6 / 5 19 / 13 V V V V 4 / 4
1) MACP = EU Multiannual Control Program; Reg.: MACP Regulation; WD: MACP Working Document (“Working document on pesticides to be consid-ered for inclusion in the national control programmes to ensure compliance with maximum residue levels of pesticides residues in and on food of plant and animal origin”)
2) Category A/B classification (Cat A was assigned to laboratories that have analysed at least 12 out of the 13 compulsory compounds on the Target Pesticides List, correctly detected 7 or more out of the 8 compulsory compounds present in the test item and have not reported any false positive result, see Section 4.4.4, p. 59)
V = analysed for and submitted concentration Value > “MRRL” for a pesticide present in the test item; ND = analysed for and correctly reported as “Not Detected”; Empty cells: not analysed; FN = analysed for but falsely not detected (False Negative result); FN* = analysed for a compound pre-sent in the test material and reported not detected due to lab’s RL being > assigned value, therefore judged as FN; FP = false positive result(FP): Result reported as “≤ MRRL” and, therefore, not regarded as FP.
1) MACP = EU Multiannual Control Program; Reg.: MACP Regulation; WD: MACP Working Document (“Working document on pesticides to be con-sidered for inclusion in the national control programmes to ensure compliance with maximum residue levels of pesticides residues in and on food of plant and animal origin”)
2) Category A/B classification (Cat A was assigned to laboratories that have analysed at least 9 out of the 11 compulsory compounds on the Target Pesticides List, correctly detected 7 or more out of the 8 compulsory compounds present in the test item and have not reported any false positive result, see Section 4.4.4, p. 59)
V = analysed for and submitted concentration Value > “MRRL” for a pesticide present in the test item; ND = analysed for and correctly reported as “Not Detected”; Empty cells: not analysed; FN = analysed for but falsely not detected (False Negative result); FN* = analysed for a compound pre-sent in the test material and reported not detected due to lab’s RL > assigned value, therefore judged as FN; FP = false positive result(FP): Result reported as “≤ MRRL” and, therefore, not regarded as FP.
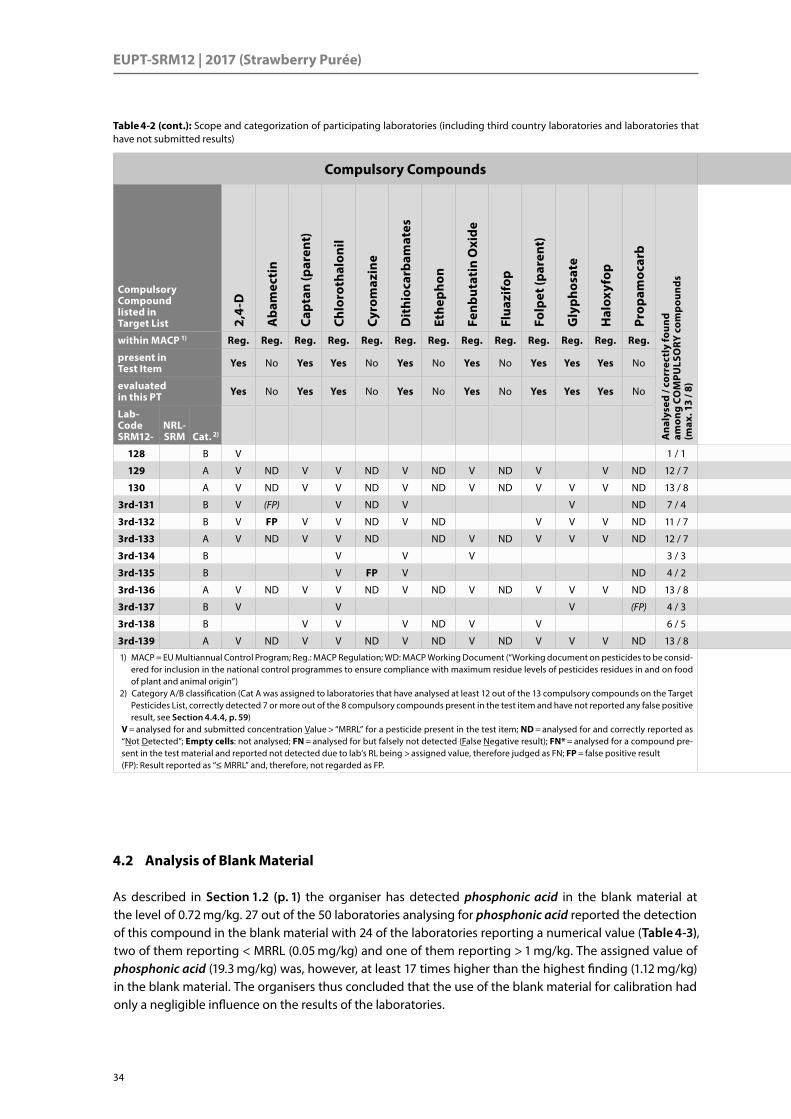
EUPT-SRM12 | 2017 (Strawberry Purée)
34
Compulsory Compounds Optional Compounds Total Additional Compounds
Compulsory Compound listed in Target List 2,
4-D
Aba
mec
tin
Capt
an (p
aren
t)
Chlo
roth
alon
il
Cyro
maz
ine
Dit
hioc
arba
mat
es
Ethe
phon
Fenb
utat
in O
xide
Flua
zifo
p
Folp
et (p
aren
t)
Gly
phos
ate
Hal
oxyf
op
Prop
amoc
arb
Ana
lyse
d / c
orre
ctly
foun
d am
ong
COM
PULS
ORY
com
poun
ds
(max
. 13
/ 8)
Optional / Additional Compound listed in Target List A
MPA
Bife
naza
te
Brom
ide
ion
Carb
ofur
an
Chlo
rate
Dit
hian
on
Phos
phon
ic a
cid
N-A
cety
l gly
phos
ate
Ana
lyse
d / c
orre
ctly
foun
d am
ong
OPT
ION
AL
com
poun
ds
(max
. 8 /
7)
Ana
lyse
d / c
orre
ctly
foun
d am
ong
COM
PULS
ORY
and
OP
TIO
NA
L co
mpo
unds
(m
ax. 2
1 / 1
5)
Capt
an (s
um)
Folp
et (s
um)
THPI
Phth
alim
ide
Ana
lyse
d / c
orre
ctly
foun
d am
ong
AD
DIT
ION
AL
com
poun
ds
wit
hin
the
EUPT
-Tar
get P
esti
cide
s Li
st (m
ax. 4
/ 4)
within MACP 1) Reg. Reg. Reg. Reg. Reg. Reg. Reg. Reg. Reg. Reg. Reg. Reg. Reg. within MACP 1) WD WD Reg. Reg. WD Reg. Reg. WD Reg. Reg. Reg. Reg.
present in Test Item Yes No Yes Yes No Yes No Yes No Yes Yes Yes No present in
Test Item No Yes Yes Yes Yes Yes Yes Yes Yes Yes Yes Yes
evaluated in this PT Yes No Yes Yes No Yes No Yes No Yes Yes Yes No evaluated
in this PT No Yes Yes No Yes Yes Yes Yes Yes Yes Yes Yes
Lab- Code SRM12-
NRL- SRM Cat. 2)
Lab- Code SRM12-
NRL- SRM Cat. 2)
128 B V 1 / 1 128 B 0 / 0 1 / 1 0 / 0
129 A V ND V V ND V ND V ND V V ND 12 / 7 129 A V V V V V 5 / 5 17 / 12 V V V V 4 / 4
130 A V ND V V ND V ND V ND V V V ND 13 / 8 130 A ND V V V V V 6 / 5 19 / 13 V V V V 4 / 4
3rd-131 B V (FP) V ND V V ND 7 / 4 3rd-131 B ND V 2 / 1 9 / 5 0 / 0
3rd-132 B V FP V V ND V ND V V V ND 11 / 7 3rd-132 B V FN* 2 / 1 13 / 8 V V 2 / 2
3rd-133 A V ND V V ND ND V ND V V V ND 12 / 7 3rd-133 A ND V 2 / 1 14 / 8 0 / 0
3rd-134 B V V V 3 / 3 3rd-134 B V V 2 / 2 7 / 5 0 / 0
3rd-135 B V FP V ND 4 / 2 3rd-135 B FN* 1 / 0 5 / 2 0 / 0
3rd-136 A V ND V V ND V ND V ND V V V ND 13 / 8 3rd-136 A 0 / 0 13 / 8 0 / 0
3rd-137 B V V V (FP) 4 / 3 3rd-137 B 0 / 0 4 / 3 0 / 0
3rd-138 B V V V ND V V 6 / 5 3rd-138 B V V V 3 / 3 9 / 8 0 / 0
3rd-139 A V ND V V ND V ND V ND V V V ND 13 / 8 3rd-139 A 0 / 0 13 / 8 0 / 0
1) MACP = EU Multiannual Control Program; Reg.: MACP Regulation; WD: MACP Working Document (“Working document on pesticides to be consid-ered for inclusion in the national control programmes to ensure compliance with maximum residue levels of pesticides residues in and on food of plant and animal origin”)
2) Category A/B classification (Cat A was assigned to laboratories that have analysed at least 12 out of the 13 compulsory compounds on the Target Pesticides List, correctly detected 7 or more out of the 8 compulsory compounds present in the test item and have not reported any false positive result, see Section 4.4.4, p. 59)
V = analysed for and submitted concentration Value > “MRRL” for a pesticide present in the test item; ND = analysed for and correctly reported as “Not Detected”; Empty cells: not analysed; FN = analysed for but falsely not detected (False Negative result); FN* = analysed for a compound pre-sent in the test material and reported not detected due to lab’s RL being > assigned value, therefore judged as FN; FP = false positive result(FP): Result reported as “≤ MRRL” and, therefore, not regarded as FP.
1) MACP = EU Multiannual Control Program; Reg.: MACP Regulation; WD: MACP Working Document (“Working document on pesticides to be con-sidered for inclusion in the national control programmes to ensure compliance with maximum residue levels of pesticides residues in and on food of plant and animal origin”)
2) Category A/B classification (Cat A was assigned to laboratories that have analysed at least 9 out of the 11 compulsory compounds on the Target Pesticides List, correctly detected 7 or more out of the 8 compulsory compounds present in the test item and have not reported any false positive result, see Section 4.4.4, p. 59)
V = analysed for and submitted concentration Value > “MRRL” for a pesticide present in the test item; ND = analysed for and correctly reported as “Not Detected”; Empty cells: not analysed; FN = analysed for but falsely not detected (False Negative result); FN* = analysed for a compound pre-sent in the test material and reported not detected due to lab’s RL > assigned value, therefore judged as FN; FP = false positive result(FP): Result reported as “≤ MRRL” and, therefore, not regarded as FP.
Table 4-2 (cont.): Scope and categorization of participating laboratories (including third country laboratories and laboratories that have not submitted results)
4.2 Analysis of Blank Material
As described in Section 1.2 (p. 1) the organiser has detected phosphonic acid in the blank material at the level of 0.72 mg/kg. 27 out of the 50 laboratories analysing for phosphonic acid reported the detection of this compound in the blank material with 24 of the laboratories reporting a numerical value (Table 4-3), two of them reporting < MRRL (0.05 mg/kg) and one of them reporting > 1 mg/kg. The assigned value of phosphonic acid (19.3 mg/kg) was, however, at least 17 times higher than the highest finding (1.12 mg/kg) in the blank material. The organisers thus concluded that the use of the blank material for calibration had only a negligible influence on the results of the laboratories.

4. RESULTS / Analysis of Blank Material
35
Resu
lts
4
Compulsory Compounds Optional Compounds Total Additional Compounds
Compulsory Compound listed in Target List 2,
4-D
Aba
mec
tin
Capt
an (p
aren
t)
Chlo
roth
alon
il
Cyro
maz
ine
Dit
hioc
arba
mat
es
Ethe
phon
Fenb
utat
in O
xide
Flua
zifo
p
Folp
et (p
aren
t)
Gly
phos
ate
Hal
oxyf
op
Prop
amoc
arb
Ana
lyse
d / c
orre
ctly
foun
d am
ong
COM
PULS
ORY
com
poun
ds
(max
. 13
/ 8)
Optional / Additional Compound listed in Target List A
MPA
Bife
naza
te
Brom
ide
ion
Carb
ofur
an
Chlo
rate
Dit
hian
on
Phos
phon
ic a
cid
N-A
cety
l gly
phos
ate
Ana
lyse
d / c
orre
ctly
foun
d am
ong
OPT
ION
AL
com
poun
ds
(max
. 8 /
7)
Ana
lyse
d / c
orre
ctly
foun
d am
ong
COM
PULS
ORY
and
OP
TIO
NA
L co
mpo
unds
(m
ax. 2
1 / 1
5)
Capt
an (s
um)
Folp
et (s
um)
THPI
Phth
alim
ide
Ana
lyse
d / c
orre
ctly
foun
d am
ong
AD
DIT
ION
AL
com
poun
ds
wit
hin
the
EUPT
-Tar
get P
esti
cide
s Li
st (m
ax. 4
/ 4)
within MACP 1) Reg. Reg. Reg. Reg. Reg. Reg. Reg. Reg. Reg. Reg. Reg. Reg. Reg. within MACP 1) WD WD Reg. Reg. WD Reg. Reg. WD Reg. Reg. Reg. Reg.
present in Test Item Yes No Yes Yes No Yes No Yes No Yes Yes Yes No present in
Test Item No Yes Yes Yes Yes Yes Yes Yes Yes Yes Yes Yes
evaluated in this PT Yes No Yes Yes No Yes No Yes No Yes Yes Yes No evaluated
in this PT No Yes Yes No Yes Yes Yes Yes Yes Yes Yes Yes
Lab- Code SRM12-
NRL- SRM Cat. 2)
Lab- Code SRM12-
NRL- SRM Cat. 2)
128 B V 1 / 1 128 B 0 / 0 1 / 1 0 / 0
129 A V ND V V ND V ND V ND V V ND 12 / 7 129 A V V V V V 5 / 5 17 / 12 V V V V 4 / 4
130 A V ND V V ND V ND V ND V V V ND 13 / 8 130 A ND V V V V V 6 / 5 19 / 13 V V V V 4 / 4
3rd-131 B V (FP) V ND V V ND 7 / 4 3rd-131 B ND V 2 / 1 9 / 5 0 / 0
3rd-132 B V FP V V ND V ND V V V ND 11 / 7 3rd-132 B V FN* 2 / 1 13 / 8 V V 2 / 2
3rd-133 A V ND V V ND ND V ND V V V ND 12 / 7 3rd-133 A ND V 2 / 1 14 / 8 0 / 0
3rd-134 B V V V 3 / 3 3rd-134 B V V 2 / 2 7 / 5 0 / 0
3rd-135 B V FP V ND 4 / 2 3rd-135 B FN* 1 / 0 5 / 2 0 / 0
3rd-136 A V ND V V ND V ND V ND V V V ND 13 / 8 3rd-136 A 0 / 0 13 / 8 0 / 0
3rd-137 B V V V (FP) 4 / 3 3rd-137 B 0 / 0 4 / 3 0 / 0
3rd-138 B V V V ND V V 6 / 5 3rd-138 B V V V 3 / 3 9 / 8 0 / 0
3rd-139 A V ND V V ND V ND V ND V V V ND 13 / 8 3rd-139 A 0 / 0 13 / 8 0 / 0
1) MACP = EU Multiannual Control Program; Reg.: MACP Regulation; WD: MACP Working Document (“Working document on pesticides to be consid-ered for inclusion in the national control programmes to ensure compliance with maximum residue levels of pesticides residues in and on food of plant and animal origin”)
2) Category A/B classification (Cat A was assigned to laboratories that have analysed at least 12 out of the 13 compulsory compounds on the Target Pesticides List, correctly detected 7 or more out of the 8 compulsory compounds present in the test item and have not reported any false positive result, see Section 4.4.4, p. 59)
V = analysed for and submitted concentration Value > “MRRL” for a pesticide present in the test item; ND = analysed for and correctly reported as “Not Detected”; Empty cells: not analysed; FN = analysed for but falsely not detected (False Negative result); FN* = analysed for a compound pre-sent in the test material and reported not detected due to lab’s RL being > assigned value, therefore judged as FN; FP = false positive result(FP): Result reported as “≤ MRRL” and, therefore, not regarded as FP.
1) MACP = EU Multiannual Control Program; Reg.: MACP Regulation; WD: MACP Working Document (“Working document on pesticides to be con-sidered for inclusion in the national control programmes to ensure compliance with maximum residue levels of pesticides residues in and on food of plant and animal origin”)
2) Category A/B classification (Cat A was assigned to laboratories that have analysed at least 9 out of the 11 compulsory compounds on the Target Pesticides List, correctly detected 7 or more out of the 8 compulsory compounds present in the test item and have not reported any false positive result, see Section 4.4.4, p. 59)
V = analysed for and submitted concentration Value > “MRRL” for a pesticide present in the test item; ND = analysed for and correctly reported as “Not Detected”; Empty cells: not analysed; FN = analysed for but falsely not detected (False Negative result); FN* = analysed for a compound pre-sent in the test material and reported not detected due to lab’s RL > assigned value, therefore judged as FN; FP = false positive result(FP): Result reported as “≤ MRRL” and, therefore, not regarded as FP.
Table 4-2 (cont.): Scope and categorization of participating laboratories (including third country laboratories and laboratories that have not submitted results)
Among the other target analytes there were further three cases where participants reported detections in the blank material at levels at or above the MRRL (Table 4-3, p. 36). These were two cases of dithi-ocarbamates (MRRL = 0.03 mg/kg) at 0.134 mg/kg (SRM12-44) and 0.04 mg/kg (SRM12-40), and two cases of glyphosate (MRRL = 0.03 mg/kg) at 0.1 mg/kg (SRM12-40) and 0.03 mg/kg (SRM12-83). Since the organisers and all other laboratories having analysed for these compounds did not detect them in the blank material, these findings were regarded as analytical errors. The affected laboratories are encouraged to find the rea-sons behind these errors. Interestingly, none of these three laboratories reporting “false positive” results in the blank reported any false positive in the test item.
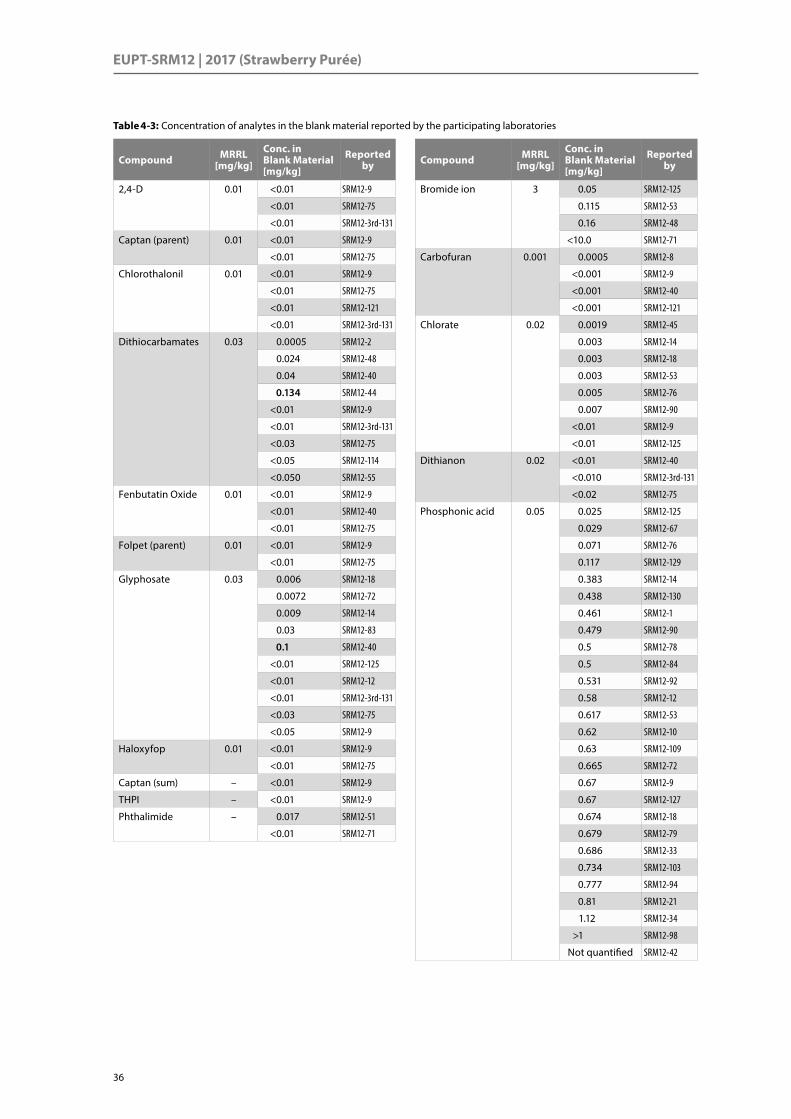
EUPT-SRM12 | 2017 (Strawberry Purée)
36
Table 4-3: Concentration of analytes in the blank material reported by the participating laboratories
Compound MRRL
[mg/kg]
Conc. in Blank Material
[mg/kg]
Reported by
2,4-D 0.01 <0.01 SRM12-9
<0.01 SRM12-75
<0.01 SRM12-3rd-131
Captan (parent) 0.01 <0.01 SRM12-9
<0.01 SRM12-75
Chlorothalonil 0.01 <0.01 SRM12-9
<0.01 SRM12-75
<0.01 SRM12-121
<0.01 SRM12-3rd-131
Dithiocarbamates 0.03 0.0005 SRM12-2
0.024 SRM12-48
0.04 SRM12-40
0.134 SRM12-44
<0.01 SRM12-9
<0.01 SRM12-3rd-131
<0.03 SRM12-75
<0.05 SRM12-114
<0.050 SRM12-55
Fenbutatin Oxide 0.01 <0.01 SRM12-9
<0.01 SRM12-40
<0.01 SRM12-75
Folpet (parent) 0.01 <0.01 SRM12-9
<0.01 SRM12-75
Glyphosate 0.03 0.006 SRM12-18
0.0072 SRM12-72
0.009 SRM12-14
0.03 SRM12-83
0.1 SRM12-40
<0.01 SRM12-125
<0.01 SRM12-12
<0.01 SRM12-3rd-131
<0.03 SRM12-75
<0.05 SRM12-9
Haloxyfop 0.01 <0.01 SRM12-9
<0.01 SRM12-75
Captan (sum) – <0.01 SRM12-9
THPI – <0.01 SRM12-9
Phthalimide – 0.017 SRM12-51
<0.01 SRM12-71
Compound MRRL
[mg/kg]
Conc. in Blank Material
[mg/kg]
Reported by
Bromide ion 3 0.05 SRM12-125
0.115 SRM12-53
0.16 SRM12-48
<10.0 SRM12-71
Carbofuran 0.001 0.0005 SRM12-8
<0.001 SRM12-9
<0.001 SRM12-40
<0.001 SRM12-121
Chlorate 0.02 0.0019 SRM12-45
0.003 SRM12-14
0.003 SRM12-18
0.003 SRM12-53
0.005 SRM12-76
0.007 SRM12-90
<0.01 SRM12-9
<0.01 SRM12-125
Dithianon 0.02 <0.01 SRM12-40
<0.010 SRM12-3rd-131
<0.02 SRM12-75
Phosphonic acid 0.05 0.025 SRM12-125
0.029 SRM12-67
0.071 SRM12-76
0.117 SRM12-129
0.383 SRM12-14
0.438 SRM12-130
0.461 SRM12-1
0.479 SRM12-90
0.5 SRM12-78
0.5 SRM12-84
0.531 SRM12-92
0.58 SRM12-12
0.617 SRM12-53
0.62 SRM12-10
0.63 SRM12-109
0.665 SRM12-72
0.67 SRM12-9
0.67 SRM12-127
0.674 SRM12-18
0.679 SRM12-79
0.686 SRM12-33
0.734 SRM12-103
0.777 SRM12-94
0.81 SRM12-21
1.12 SRM12-34
>1 SRM12-98
Not quantified SRM12-42

4. RESULTS / Assigned Values and Target Standard Deviations
37
Resu
lts
4
Compound PT-Code Analysed Reported Result [mg/kg]
RL [mg/kg]
MRRL [mg/kg] Judgement
Abamectin SRM12-3rd-132 Yes 0.023 0.01 0.01 FP
SRM12-3rd-131 Yes 0.0045 0.01 0.01 –
Cyromazine SRM12-3rd-135 Yes 0.03 0.01 0.01 FP
Propamocarb SRM12-118 Yes 0.034 0.01 0.01 FP
SRM12-3rd-137 Yes < RL (= MRRL) 0.01 0.01 –
Table 4-4: Overview of false positive and potentially false positive results reported by participating laboratories
4.3 Assigned Values and Target Standard Deviations
The assigned value (xpt) of each analyte present in the test item was established as the mean of robust sta-tistics (x*) of all numerical results submitted by laboratories from EU and EFTA countries calculated using Algorithm A [6, Appendix 8]. Results from third country laboratories were not taken into account. Based on these assigned values, z-scores were calculated for all submitted results using the FFP-approach (Sec-tion 4.4.3, p. 41), and a preliminary report was released on 11 May, 2017. The uncertainties (u(xpt)) of the assigned values were calculated as described under Section 2.2, p. 15.
In the case of carbofuran (part of sum) the very wide distribution of participants’ results (CV* 47.1 %) re-sulted in the robust mean being assosiated with a statistical uncertainty exceeding the tolerance (Table 4-5, p. 38). The Scientific Committee therefore decided to evaluate the robust mean and z-scores for carbo-furan (part of sum) using different scenarios and for informative purposes only.
The CV*-value of phosphonic acid (27.0 %), captan (parent) (28.1 %) and THPI (30.5 %) was higher than the FFP-RSD of 25 %, but all of them met the criterion for the statistical certainty. The CV*-values of all other compulsory analytes were lower or just slightly higher than 25 %. The average CV*s of compulsory ana-lytes based on the entire population of EU-and EFTA-laboratories was 21.2 %, and the average CV*s of op-tional analytes based on the entire population excluding carbofuran (part of sum) was 21.6 %. Both were clearly lower than the FFP-RSD of 25 %.
Originally captan (parent), folpet (parent), phthalimide and THPI were considered only for data collection. Due to high quality of the results submitted by the participants these four addtional analytes were finally evaluated, incl. assigned values, CV* and z-scores as well as FNs and FPs, but for infromative purpose only.
4.4 Assessment of Laboratory Performance
4.4.1 False Positives
Among EU- and EFTA-laboratories only one laboratory reported one numerical result for an analyte (pro-pamocarb) on the Target Pesticides List but not present in the test material. Two other false positive results (abamectin and cyromazine) were reported by two laboratories from third countries. Propamocarb, abamec-tin and cyromazine were neither detected by the organisers nor by the overwhelming majority of the par-ticipants (Table 4-4). These three results exceeded the laboratories’ reporting limits for these compounds, were higher than the respective MRRLs in the Target Pesticides List, and were, therefore, judged as false positives.
One laboratory (SRM-3rd-131) reported in one case a numerical result for abamectin (0.0045 mg/kg) that was lower than the MRRL. Another laboratory reported “< MRRL” for propamocarb. Following the rules in the General Protocol these two results were not judged as false positives.

EUPT-SRM12 | 2017 (Strawberry Purée)
38
Table 4-5: Assigned values, uncertainties of assigned values and CV* values calculated for all compounds present in the test item
Assigned Value and CV* Based on the Entire Population of Results from EU and EFTA Laboratories
Compound No. of FNs
No. of numerical
results (EU+EFTA)
Assigned Value
[mg/kg]
u(xpt) 1) [mg/kg]
u(xpt) Tolerance
[mg/kg]
Judgementfor
UAV-testCV* 2)
[%]
Com
puls
ory
Co
mpo
unds
2,4-D 1 97 0.079 +/- 0.00133 0.0059 passed 13.3
Captan (parent) 1 5)+1 91 0.085 +/- 0.00313 0.0064 passed 28.1
Chlorothalonil 2 109 0.125 +/- 0.00378 0.0094 passed 25.2
Dithiocarbamates 0 107 0.267 +/- 0.00717 0.0200 passed 22.2
Fenbutatin Oxide 4 78 0.086 +/- 0.00255 0.0064 passed 21.0
Folpet (parent) 2 96 0.334 +/- 0.01066 0.0251 passed 25.0
Glyphosate 1 85 0.306 +/- 0.00867 0.0230 passed 20.9
Haloxyfop 2 95 0.070 +/- 0.00125 0.0053 passed 13.9
Average 3) CV* 21.2
Opt
iona
l Co
mpo
unds
Bifenazate (sum) 0 54 0.270 +/- 0.01013 0.0202 passed 22.1
Bromide ion 0 52 19.1 +/- 0.53064 1.4337 passed 16.0
Carbofuran (part of sum) 4) 13 5)+3 58 0.0030 +/- 0.00023 0.0023 failed 47.1
Chlorate 0 60 0.490 +/- 0.01283 0.0367 passed 16.2
Dithianon 1 63 0.294 +/- 0.01170 0.0220 passed 25.3
Phosphonic acid 0 50 19.2 +/- 0.9180 1.4443 passed 27.0
N-Acetyl-glyphosate 1 15 0.100 +/- 0.00751 0.00753 passed 23.2
Average 3) CV* 21.6
Add
itio
nal
Com
poun
ds
Captan (sum) 0 65 0.302 +/- 0.0181 0.0226 passed 25.2
Folpet (sum) 0 66 1.195 +/- 0.03871 0.0896 passed 21.1
THPI 0 67 0.110 +/- 0.00515 0.0083 passed 30.5
Phthalimide 1 66 0.446 +/- 0.01485 0.0334 passed 21.6
Average 3) CV* 24.6
1: u(xpt) : Uncertainty of assigned value calculated as shown under Section 2.2 (p. 15)2: CV* : Relative standard deviation based on robust statistics3: The average CV* is given for information purposes only. CV*s of individual compounds or average CV*s of individual compounds or related
compounds over many PTs are more meaningfull and conclusive.4: Excluded from the calculation of the average CV*s and the assigned values were calculated for informative purpose only.5: Laboratories had a reporting limit higher than the assigned value and reported “not detected”. Following the General Protocol, these results were
judged as “false positive”.
4.4.2 False Negatives
Among the compulsory compounds there were 14 cases (4× fenbutatin oxide, 2× captan (parent), 2× fol-pet (parent), 2× chlorothalonil, 2× haloxyfop, 1× glyphosate and 1× 2,4-D) where the participants reported
“analysed, but not detected” for target compounds which were spiked to the test item and detected by the majority of the laboratories targeting them (Table 4-6). All these results were reported by laboratories from EU and EFTA countries. As the assigned values for these seven analytes were sufficiently distant from the MRRLs, these results were judged as false negatives. In one case of captan (parent) the “false negative” judgement resulted from the fact that the laboratory had a higher reporting limit than the assigned value, as this is the rule stated in the General Protocol. These 14 false negative results represented 1.8 % of the total 772 results reported by the EU/EFTA laboratories for compulsory target compounds present in the test item and 1.7 % of the total 819 results from all participating laboratories.

4. RESULTS / Assessment of Laboratory Performance
39
Resu
lts
4
Compound PT-Code Analysed Detected RL [mg/kg]
MRRL [mg/kg]
Assigned Value
[mg/kg]Judgement
Com
puls
ory
Com
poun
ds
2,4-D SRM12-44 Yes No 0.05 0.01 0.079 False Negative
Captan (parent) SRM12-106 Yes No 0.01 0.01 0.085 False Negative
SRM12-120 Yes No 0.2 False Negative
Chlorothalonil SRM12-27 Yes No 0.01 0.01 0.125 False Negative
SRM12-106 Yes No 0.01 False Negative
Fenbutatin Oxide SRM12-2 Yes No 0.01 0.01 0.086 False Negative
SRM12-35 Yes No 0.01 False Negative
SRM12-99 Yes No 0.01 False Negative
SRM12-106 Yes No 0.01 False Negative
Folpet (parent) SRM12-102 Yes No 0.01 0.01 0.334 False Negative
SRM12-106 Yes No 0.01 False Negative
Glyphosate SRM12-6 Yes No 0.1 0.03 0.306 False Negative
Haloxyfop SRM12-44 Yes No 0.05 0.01 0.070 False Negative
SRM12-62 Yes No 0.05 False Negative
Opt
iona
l Com
poun
ds
Carbofuran SRM12-62 Yes No 0.05 0.001 0.0030 False Negative
SRM12-6 Yes No 0.01 False Negative
SRM12-12 Yes No 0.01 False Negative
SRM12-27 Yes No 0.01 False Negative
SRM12-39 Yes No 0.01 False Negative
SRM12-52 Yes No 0.01 False Negative
SRM12-73 Yes No 0.01 False Negative
SRM12-97 Yes No 0.01 False Negative
SRM12-106 Yes No 0.01 False Negative
SRM12-120 Yes No 0.01 False Negative
SRM12-124 Yes No 0.01 False Negative
SRM12-126 Yes No 0.01 False Negative
SRM12-3rd-132 Yes No 0.01 False Negative
SRM12-3rd-135 Yes No 0.01 False Negative
SRM12-75 Yes No 0.005 False Negative
SRM12-2 Yes No 0.001 False Negative
SRM12-98 Yes No 0.001 False Negative
SRM12-107 Yes No 0.001 False Negative
Dithianon SRM12-95 Yes No 0.01 0.294 False Negative
N-Acetyl glyphosate SRM12-6 Yes No 0.1 0.100 False Negative
Phthalimide SRM12-47 Yes No 0.01 – 0.446 False Negative
Table 4-6: Overview of false negative results reported by participating laboratories (including 3rd country laboratories)

EUPT-SRM12 | 2017 (Strawberry Purée)
40
Table 4-7: Overall performance based on z-score classification
EU and EFTA laboratories
Compound No. of results 1)
Acceptable Questionable Unacceptable 1) FNs
No. (%) No. (%) No. (%) No.
Com
puls
ory
Com
poun
ds
2,4-D 98 93 (95 %) 2 (2 %) 3 (3 %) 1
Captan (parent) 93 77 (83 %) 6 (6 %) 10 (11 %) 2
Chlorothalonil 111 97 (87 %) 5 (5 %) 9 (8 %) 2
Dithiocarbamates 107 101 (94 %) 2 (2 %) 4 (4 %)
Fenbutatin Oxide 82 72 (88 %) 3 (4 %) 7 (9 %) 4
Folpet (parent) 98 82 (84 %) 6 (6 %) 10 (10 %) 2
Glyphosate 86 77 (90 %) 3 (3 %) 6 (7 %) 1
Haloxyfop 97 89 (92 %) 3 (3 %) 5 (5 %) 2
Subtotal (average) 772 688 (89 %) 30 (4 %) 54 (7 %) 14
Opt
iona
l Co
mpo
unds
2)
Bifenazate 54 52 (96 %) 1 (2 %) 1 (2 %)
Bromide ion 52 47 (90 %) 4 (8 %) 1 (2 %)
Chlorate 60 54 (90 %) 3 (5 %) 3 (5 %)
Dithianon 64 54 (84 %) 2 (3 %) 8 (13 %) 1
Phosphonic acid 50 43 (86 %) 4 (8 %) 3 (6 %)
N-Acetyl glyphosate 16 15 (94 %) (0 %) 1 (6 %) 1
Subtotal (average) 296 265 (90 %) 14 (5 %) 17 (6 %) 2
Add
itio
nal
Com
poun
ds
Captan (sum) 65 61 (94 %) 3 (5 %) 1 (2 %)
Folpet (sum) 66 58 (88 %) 4 (6 %) 4 (6 %)
THPI 67 58 (87 %) 4 (6 %) 5 (7 %)
Phthalimide 67 61 (91 %) (0 %) 6 (9 %) 1
Subtotal (average) 265 238 (90 %) 11 (4 %) 16 (6 %) 1
Overall EU/EFTA (Average) 1333 1191 (89 %) 55 (4 %) 87 (7 %) 17
1) including false negatives (FNs)2) excluding carbofuran
Among the optional compounds there were 20 cases (18× carbofuran, 1× dithianon, 3× N-acetyl glypho-sate) where the participants reported “analysed, but not detected” for target compounds that were spiked to the test item and detected by the majority of the laboratories targeting them (Table 4-6, p. 39). All of these false negative results but two, concerning carbofuran (part of sum), were reported by participants from EU and EFTA countries. In 15 among the 18 cases of false negatives concerning carbofuran (part of sum) the reporting limits were higher than the assigned value. According to the rule in the General Proto-col, these results were still judged as fase negatives.
The 18 false negative results reported by EU/EFTA laboratories accounted for 4.9 % of the total 370 results reported by the EU/EFTA laboratories for optional target compounds. The 20 false negative results report-ed in total represented 5.3 % of the results reported by all participating labs for optional compounds.
Among the additional compounds there was only one false negative result, concerning phthalimide, which was reported by an EU/EFTA-laboratory. That accounted for 0.8 % of the total 265 results reported by the EU/EFTA laboratories for additional target compounds present in the test item.
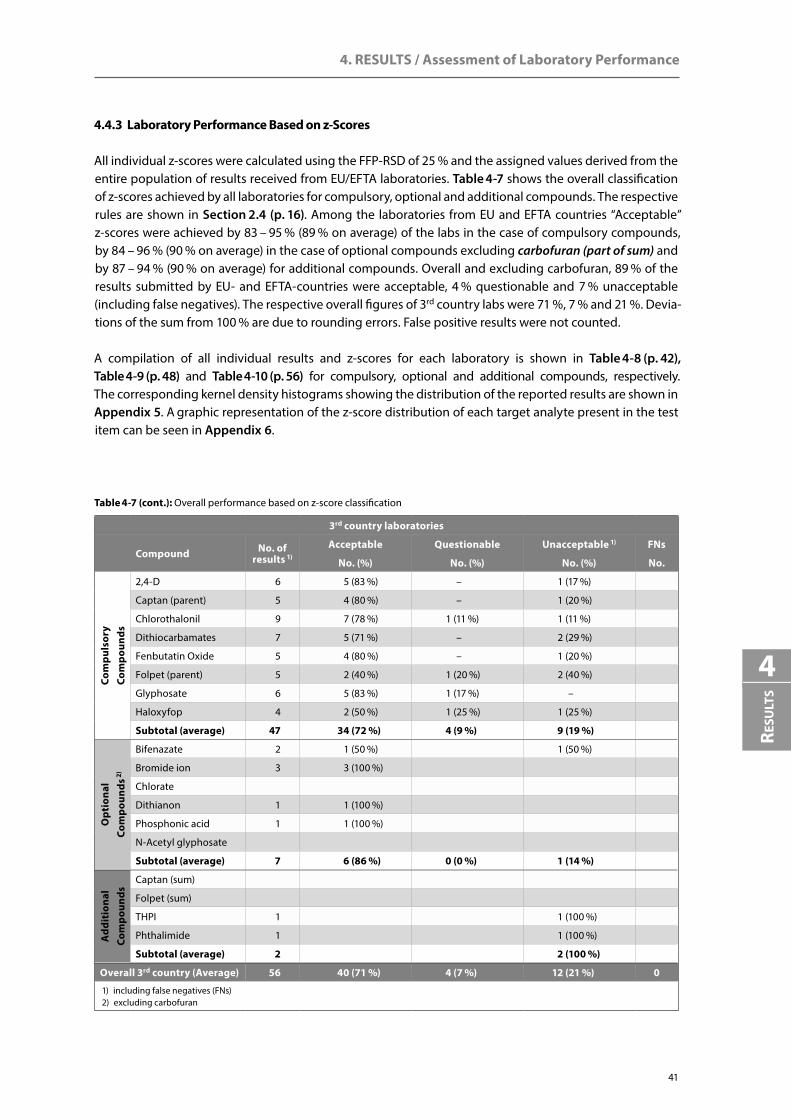
4. RESULTS / Assessment of Laboratory Performance
41
Resu
lts
4
3rd country laboratories
Compound No. of results 1)
Acceptable Questionable Unacceptable 1) FNs
No. (%) No. (%) No. (%) No.
Com
puls
ory
Com
poun
ds
2,4-D 6 5 (83 %) – 1 (17 %)
Captan (parent) 5 4 (80 %) – 1 (20 %)
Chlorothalonil 9 7 (78 %) 1 (11 %) 1 (11 %)
Dithiocarbamates 7 5 (71 %) – 2 (29 %)
Fenbutatin Oxide 5 4 (80 %) – 1 (20 %)
Folpet (parent) 5 2 (40 %) 1 (20 %) 2 (40 %)
Glyphosate 6 5 (83 %) 1 (17 %) –
Haloxyfop 4 2 (50 %) 1 (25 %) 1 (25 %)
Subtotal (average) 47 34 (72 %) 4 (9 %) 9 (19 %)
Opt
iona
l Co
mpo
unds
2)
Bifenazate 2 1 (50 %) 1 (50 %)
Bromide ion 3 3 (100 %)
Chlorate
Dithianon 1 1 (100 %)
Phosphonic acid 1 1 (100 %)
N-Acetyl glyphosate
Subtotal (average) 7 6 (86 %) 0 (0 %) 1 (14 %)
Add
itio
nal
Com
poun
ds
Captan (sum)
Folpet (sum)
THPI 1 1 (100 %)
Phthalimide 1 1 (100 %)
Subtotal (average) 2 2 (100 %)
Overall 3rd country (Average) 56 40 (71 %) 4 (7 %) 12 (21 %) 0
1) including false negatives (FNs)2) excluding carbofuran
4.4.3 Laboratory Performance Based on z-Scores
All individual z-scores were calculated using the FFP-RSD of 25 % and the assigned values derived from the entire population of results received from EU/EFTA laboratories. Table 4-7 shows the overall classification of z-scores achieved by all laboratories for compulsory, optional and additional compounds. The respective rules are shown in Section 2.4 (p. 16). Among the laboratories from EU and EFTA countries “Acceptable” z-scores were achieved by 83 – 95 % (89 % on average) of the labs in the case of compulsory compounds, by 84 – 96 % (90 % on average) in the case of optional compounds excluding carbofuran (part of sum) and by 87 – 94 % (90 % on average) for additional compounds. Overall and excluding carbofuran, 89 % of the results submitted by EU- and EFTA-countries were acceptable, 4 % questionable and 7 % unacceptable (including false negatives). The respective overall figures of 3rd country labs were 71 %, 7 % and 21 %. Devia-tions of the sum from 100 % are due to rounding errors. False positive results were not counted.
A compilation of all individual results and z-scores for each laboratory is shown in Table 4-8 (p. 42), Table 4-9 (p. 48) and Table 4-10 (p. 56) for compulsory, optional and additional compounds, respectively. The corresponding kernel density histograms showing the distribution of the reported results are shown in Appendix 5. A graphic representation of the z-score distribution of each target analyte present in the test item can be seen in Appendix 6.
Table 4-7 (cont.): Overall performance based on z-score classification
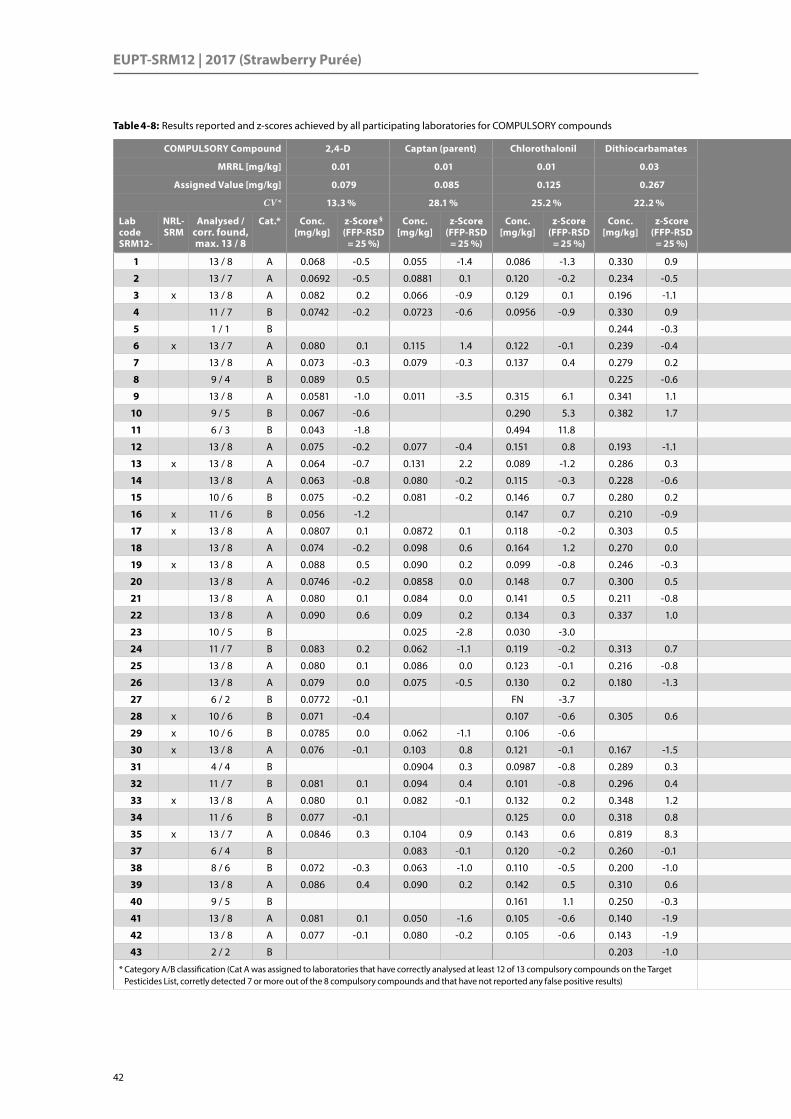
EUPT-SRM12 | 2017 (Strawberry Purée)
42
COMPULSORY Compound 2,4-D Captan (parent) Chlorothalonil Dithiocarbamates COMPULSORY Compound Fenbutatin Oxide Folpet (parent) Glyphosate Haloxyfop
MRRL [mg/kg] 0.01 0.01 0.01 0.03 MRRL [mg/kg] 0.01 0.01 0.03 0.01
Assigned Value [mg/kg] 0.079 0.085 0.125 0.267 Assigned Value [mg/kg] 0.086 0.334 0.306 0.070
CV* 13.3 % 28.1 % 25.2 % 22.2 % CV* 21.0 % 25.0 % 20.9 % 13.9 %
Lab code SRM12-
NRL-SRM
Analysed / corr. found, max. 13 / 8
Cat.* Conc. [mg/kg]
z-Score § (FFP-RSD
= 25 %)
Conc. [mg/kg]
z-Score (FFP-RSD
= 25 %)
Conc. [mg/kg]
z-Score (FFP-RSD
= 25 %)
Conc. [mg/kg]
z-Score (FFP-RSD
= 25 %)
Lab code SRM12-
NRL-SRM
Analysed / corr. found, max. 13 / 8
Cat.* Conc. [mg/kg]
z-Score § (FFP-RSD
= 25 %)
Conc. [mg/kg]
z-Score (FFP-RSD
= 25 %)
Conc. [mg/kg]
z-Score (FFP-RSD
= 25 %)
Conc. [mg/kg]
z-Score (FFP-RSD
= 25 %)
1 13 / 8 A 0.068 -0.5 0.055 -1.4 0.086 -1.3 0.330 0.9 1 13 / 8 A 0.076 -0.4 0.190 -1.7 0.629 4.2 0.056 -0.8
2 13 / 7 A 0.0692 -0.5 0.0881 0.1 0.120 -0.2 0.234 -0.5 2 13 / 7 A FN -3.5 0.349 0.2 0.317 0.1 0.058 -0.7
3 x 13 / 8 A 0.082 0.2 0.066 -0.9 0.129 0.1 0.196 -1.1 3 x 13 / 8 A 0.111 1.2 0.292 -0.5 0.320 0.2 0.070 0.0
4 11 / 7 B 0.0742 -0.2 0.0723 -0.6 0.0956 -0.9 0.330 0.9 4 11 / 7 B 0.0576 -1.3 0.295 -0.5 0.0641 -0.3
5 1 / 1 B 0.244 -0.3 5 1 / 1 B
6 x 13 / 7 A 0.080 0.1 0.115 1.4 0.122 -0.1 0.239 -0.4 6 x 13 / 7 A 0.089 0.2 0.317 -0.2 FN -3.6 0.080 0.6
7 13 / 8 A 0.073 -0.3 0.079 -0.3 0.137 0.4 0.279 0.2 7 13 / 8 A 0.083 -0.1 0.286 -0.6 0.355 0.6 0.070 0.0
8 9 / 4 B 0.089 0.5 0.225 -0.6 8 9 / 4 B 0.394 1.1 0.082 0.7
9 13 / 8 A 0.0581 -1.0 0.011 -3.5 0.315 6.1 0.341 1.1 9 13 / 8 A 0.0624 -1.1 0.172 -1.9 0.779 6.2 0.0688 -0.1
10 9 / 5 B 0.067 -0.6 0.290 5.3 0.382 1.7 10 9 / 5 B 0.312 0.1 0.066 -0.2
11 6 / 3 B 0.043 -1.8 0.494 11.8 11 6 / 3 B 0.041 -1.7
12 13 / 8 A 0.075 -0.2 0.077 -0.4 0.151 0.8 0.193 -1.1 12 13 / 8 A 0.11 1.1 0.420 1.0 0.3 -0.1 0.070 0.0
13 x 13 / 8 A 0.064 -0.7 0.131 2.2 0.089 -1.2 0.286 0.3 13 x 13 / 8 A 0.081 -0.2 0.292 -0.5 0.290 -0.2 0.064 -0.4
14 13 / 8 A 0.063 -0.8 0.080 -0.2 0.115 -0.3 0.228 -0.6 14 13 / 8 A 0.080 -0.3 0.355 0.2 0.311 0.1 0.069 -0.1
15 10 / 6 B 0.075 -0.2 0.081 -0.2 0.146 0.7 0.280 0.2 15 10 / 6 B 0.290 -0.5 0.060 -0.6
16 x 11 / 6 B 0.056 -1.2 0.147 0.7 0.210 -0.9 16 x 11 / 6 B 0.091 0.3 0.240 -0.9 0.064 -0.4
17 x 13 / 8 A 0.0807 0.1 0.0872 0.1 0.118 -0.2 0.303 0.5 17 x 13 / 8 A 0.089 0.2 0.298 -0.4 0.331 0.3 0.0763 0.3
18 13 / 8 A 0.074 -0.2 0.098 0.6 0.164 1.2 0.270 0.0 18 13 / 8 A 0.104 0.9 0.382 0.6 0.299 -0.1 0.064 -0.4
19 x 13 / 8 A 0.088 0.5 0.090 0.2 0.099 -0.8 0.246 -0.3 19 x 13 / 8 A 0.080 -0.3 0.413 0.9 0.291 -0.2 0.068 -0.1
20 13 / 8 A 0.0746 -0.2 0.0858 0.0 0.148 0.7 0.300 0.5 20 13 / 8 A 0.0793 -0.3 0.401 0.8 0.299 -0.1 0.0706 0.0
21 13 / 8 A 0.080 0.1 0.084 0.0 0.141 0.5 0.211 -0.8 21 13 / 8 A 0.087 0.1 0.349 0.2 0.279 -0.4 0.073 0.2
22 13 / 8 A 0.090 0.6 0.09 0.2 0.134 0.3 0.337 1.0 22 13 / 8 A 0.091 0.3 0.386 0.6 0.360 0.7 0.054 -0.9
23 10 / 5 B 0.025 -2.8 0.030 -3.0 23 10 / 5 B 0.040 -3.5 0.180 -1.6 0.040 -1.7
24 11 / 7 B 0.083 0.2 0.062 -1.1 0.119 -0.2 0.313 0.7 24 11 / 7 B 0.068 -0.8 0.333 0.0 0.065 -0.3
25 13 / 8 A 0.080 0.1 0.086 0.0 0.123 -0.1 0.216 -0.8 25 13 / 8 A 0.077 -0.4 0.449 1.4 0.370 0.8 0.072 0.1
26 13 / 8 A 0.079 0.0 0.075 -0.5 0.130 0.2 0.180 -1.3 26 13 / 8 A 0.092 0.3 0.950 7.4 0.250 -0.7 0.072 0.1
27 6 / 2 B 0.0772 -0.1 FN -3.7 27 6 / 2 B 0.0759 -3.1
28 x 10 / 6 B 0.071 -0.4 0.107 -0.6 0.305 0.6 28 x 10 / 6 B 0.120 1.6 0.259 -0.6 0.061 -0.5
29 x 10 / 6 B 0.0785 0.0 0.062 -1.1 0.106 -0.6 29 x 10 / 6 B 0.0875 0.1 0.163 -2.1 0.0678 -0.1
30 x 13 / 8 A 0.076 -0.1 0.103 0.8 0.121 -0.1 0.167 -1.5 30 x 13 / 8 A 0.134 2.3 0.453 1.4 0.299 -0.1 0.074 0.2
31 4 / 4 B 0.0904 0.3 0.0987 -0.8 0.289 0.3 31 4 / 4 B 0.321 -0.2
32 11 / 7 B 0.081 0.1 0.094 0.4 0.101 -0.8 0.296 0.4 32 11 / 7 B 0.373 0.5 0.297 -0.1 0.072 0.1
33 x 13 / 8 A 0.080 0.1 0.082 -0.1 0.132 0.2 0.348 1.2 33 x 13 / 8 A 0.097 0.5 0.340 0.1 0.289 -0.2 0.076 0.3
34 11 / 6 B 0.077 -0.1 0.125 0.0 0.318 0.8 34 11 / 6 B 0.085 0.0 0.314 0.1 0.058 -0.7
35 x 13 / 7 A 0.0846 0.3 0.104 0.9 0.143 0.6 0.819 8.3 35 x 13 / 7 A FN -3.5 0.559 2.7 0.268 -0.5 0.0726 0.1
37 6 / 4 B 0.083 -0.1 0.120 -0.2 0.260 -0.1 37 6 / 4 B 0.320 -0.2
38 8 / 6 B 0.072 -0.3 0.063 -1.0 0.110 -0.5 0.200 -1.0 38 8 / 6 B 0.320 -0.2 0.130 -2.3
39 13 / 8 A 0.086 0.4 0.090 0.2 0.142 0.5 0.310 0.6 39 13 / 8 A 0.083 -0.1 0.360 0.3 0.282 -0.3 0.060 -0.6
40 9 / 5 B 0.161 1.1 0.250 -0.3 40 9 / 5 B 0.0845 -0.1 0.619 3.4 0.199 -1.4
41 13 / 8 A 0.081 0.1 0.050 -1.6 0.105 -0.6 0.140 -1.9 41 13 / 8 A 0.082 -0.2 0.230 -1.2 0.320 0.2 0.072 0.1
42 13 / 8 A 0.077 -0.1 0.080 -0.2 0.105 -0.6 0.143 -1.9 42 13 / 8 A 0.080 -0.3 0.260 -0.9 0.275 -0.4 0.076 0.3
43 2 / 2 B 0.203 -1.0 43 2 / 2 B 0.246 -0.8
* Category A/B classification (Cat A was assigned to laboratories that have correctly analysed at least 12 of 13 compulsory compounds on the Target Pesticides List, corretly detected 7 or more out of the 8 compulsory compounds and that have not reported any false positive results)
* Category A/B classification (Cat A was assigned to laboratories that have correctly analysed at least 12 of 13 compulsory compounds on the Target Pesticides List, corretly detected 7 or more out of the 8 compulsory compounds and that have not reported any false positive results)
Table 4-8: Results reported and z-scores achieved by all participating laboratories for COMPULSORY compounds

4. RESULTS / Assessment of Laboratory Performance
43
Resu
lts
4
COMPULSORY Compound 2,4-D Captan (parent) Chlorothalonil Dithiocarbamates COMPULSORY Compound Fenbutatin Oxide Folpet (parent) Glyphosate Haloxyfop
MRRL [mg/kg] 0.01 0.01 0.01 0.03 MRRL [mg/kg] 0.01 0.01 0.03 0.01
Assigned Value [mg/kg] 0.079 0.085 0.125 0.267 Assigned Value [mg/kg] 0.086 0.334 0.306 0.070
CV* 13.3 % 28.1 % 25.2 % 22.2 % CV* 21.0 % 25.0 % 20.9 % 13.9 %
Lab code SRM12-
NRL-SRM
Analysed / corr. found, max. 13 / 8
Cat.* Conc. [mg/kg]
z-Score § (FFP-RSD
= 25 %)
Conc. [mg/kg]
z-Score (FFP-RSD
= 25 %)
Conc. [mg/kg]
z-Score (FFP-RSD
= 25 %)
Conc. [mg/kg]
z-Score (FFP-RSD
= 25 %)
Lab code SRM12-
NRL-SRM
Analysed / corr. found, max. 13 / 8
Cat.* Conc. [mg/kg]
z-Score § (FFP-RSD
= 25 %)
Conc. [mg/kg]
z-Score (FFP-RSD
= 25 %)
Conc. [mg/kg]
z-Score (FFP-RSD
= 25 %)
Conc. [mg/kg]
z-Score (FFP-RSD
= 25 %)
1 13 / 8 A 0.068 -0.5 0.055 -1.4 0.086 -1.3 0.330 0.9 1 13 / 8 A 0.076 -0.4 0.190 -1.7 0.629 4.2 0.056 -0.8
2 13 / 7 A 0.0692 -0.5 0.0881 0.1 0.120 -0.2 0.234 -0.5 2 13 / 7 A FN -3.5 0.349 0.2 0.317 0.1 0.058 -0.7
3 x 13 / 8 A 0.082 0.2 0.066 -0.9 0.129 0.1 0.196 -1.1 3 x 13 / 8 A 0.111 1.2 0.292 -0.5 0.320 0.2 0.070 0.0
4 11 / 7 B 0.0742 -0.2 0.0723 -0.6 0.0956 -0.9 0.330 0.9 4 11 / 7 B 0.0576 -1.3 0.295 -0.5 0.0641 -0.3
5 1 / 1 B 0.244 -0.3 5 1 / 1 B
6 x 13 / 7 A 0.080 0.1 0.115 1.4 0.122 -0.1 0.239 -0.4 6 x 13 / 7 A 0.089 0.2 0.317 -0.2 FN -3.6 0.080 0.6
7 13 / 8 A 0.073 -0.3 0.079 -0.3 0.137 0.4 0.279 0.2 7 13 / 8 A 0.083 -0.1 0.286 -0.6 0.355 0.6 0.070 0.0
8 9 / 4 B 0.089 0.5 0.225 -0.6 8 9 / 4 B 0.394 1.1 0.082 0.7
9 13 / 8 A 0.0581 -1.0 0.011 -3.5 0.315 6.1 0.341 1.1 9 13 / 8 A 0.0624 -1.1 0.172 -1.9 0.779 6.2 0.0688 -0.1
10 9 / 5 B 0.067 -0.6 0.290 5.3 0.382 1.7 10 9 / 5 B 0.312 0.1 0.066 -0.2
11 6 / 3 B 0.043 -1.8 0.494 11.8 11 6 / 3 B 0.041 -1.7
12 13 / 8 A 0.075 -0.2 0.077 -0.4 0.151 0.8 0.193 -1.1 12 13 / 8 A 0.11 1.1 0.420 1.0 0.3 -0.1 0.070 0.0
13 x 13 / 8 A 0.064 -0.7 0.131 2.2 0.089 -1.2 0.286 0.3 13 x 13 / 8 A 0.081 -0.2 0.292 -0.5 0.290 -0.2 0.064 -0.4
14 13 / 8 A 0.063 -0.8 0.080 -0.2 0.115 -0.3 0.228 -0.6 14 13 / 8 A 0.080 -0.3 0.355 0.2 0.311 0.1 0.069 -0.1
15 10 / 6 B 0.075 -0.2 0.081 -0.2 0.146 0.7 0.280 0.2 15 10 / 6 B 0.290 -0.5 0.060 -0.6
16 x 11 / 6 B 0.056 -1.2 0.147 0.7 0.210 -0.9 16 x 11 / 6 B 0.091 0.3 0.240 -0.9 0.064 -0.4
17 x 13 / 8 A 0.0807 0.1 0.0872 0.1 0.118 -0.2 0.303 0.5 17 x 13 / 8 A 0.089 0.2 0.298 -0.4 0.331 0.3 0.0763 0.3
18 13 / 8 A 0.074 -0.2 0.098 0.6 0.164 1.2 0.270 0.0 18 13 / 8 A 0.104 0.9 0.382 0.6 0.299 -0.1 0.064 -0.4
19 x 13 / 8 A 0.088 0.5 0.090 0.2 0.099 -0.8 0.246 -0.3 19 x 13 / 8 A 0.080 -0.3 0.413 0.9 0.291 -0.2 0.068 -0.1
20 13 / 8 A 0.0746 -0.2 0.0858 0.0 0.148 0.7 0.300 0.5 20 13 / 8 A 0.0793 -0.3 0.401 0.8 0.299 -0.1 0.0706 0.0
21 13 / 8 A 0.080 0.1 0.084 0.0 0.141 0.5 0.211 -0.8 21 13 / 8 A 0.087 0.1 0.349 0.2 0.279 -0.4 0.073 0.2
22 13 / 8 A 0.090 0.6 0.09 0.2 0.134 0.3 0.337 1.0 22 13 / 8 A 0.091 0.3 0.386 0.6 0.360 0.7 0.054 -0.9
23 10 / 5 B 0.025 -2.8 0.030 -3.0 23 10 / 5 B 0.040 -3.5 0.180 -1.6 0.040 -1.7
24 11 / 7 B 0.083 0.2 0.062 -1.1 0.119 -0.2 0.313 0.7 24 11 / 7 B 0.068 -0.8 0.333 0.0 0.065 -0.3
25 13 / 8 A 0.080 0.1 0.086 0.0 0.123 -0.1 0.216 -0.8 25 13 / 8 A 0.077 -0.4 0.449 1.4 0.370 0.8 0.072 0.1
26 13 / 8 A 0.079 0.0 0.075 -0.5 0.130 0.2 0.180 -1.3 26 13 / 8 A 0.092 0.3 0.950 7.4 0.250 -0.7 0.072 0.1
27 6 / 2 B 0.0772 -0.1 FN -3.7 27 6 / 2 B 0.0759 -3.1
28 x 10 / 6 B 0.071 -0.4 0.107 -0.6 0.305 0.6 28 x 10 / 6 B 0.120 1.6 0.259 -0.6 0.061 -0.5
29 x 10 / 6 B 0.0785 0.0 0.062 -1.1 0.106 -0.6 29 x 10 / 6 B 0.0875 0.1 0.163 -2.1 0.0678 -0.1
30 x 13 / 8 A 0.076 -0.1 0.103 0.8 0.121 -0.1 0.167 -1.5 30 x 13 / 8 A 0.134 2.3 0.453 1.4 0.299 -0.1 0.074 0.2
31 4 / 4 B 0.0904 0.3 0.0987 -0.8 0.289 0.3 31 4 / 4 B 0.321 -0.2
32 11 / 7 B 0.081 0.1 0.094 0.4 0.101 -0.8 0.296 0.4 32 11 / 7 B 0.373 0.5 0.297 -0.1 0.072 0.1
33 x 13 / 8 A 0.080 0.1 0.082 -0.1 0.132 0.2 0.348 1.2 33 x 13 / 8 A 0.097 0.5 0.340 0.1 0.289 -0.2 0.076 0.3
34 11 / 6 B 0.077 -0.1 0.125 0.0 0.318 0.8 34 11 / 6 B 0.085 0.0 0.314 0.1 0.058 -0.7
35 x 13 / 7 A 0.0846 0.3 0.104 0.9 0.143 0.6 0.819 8.3 35 x 13 / 7 A FN -3.5 0.559 2.7 0.268 -0.5 0.0726 0.1
37 6 / 4 B 0.083 -0.1 0.120 -0.2 0.260 -0.1 37 6 / 4 B 0.320 -0.2
38 8 / 6 B 0.072 -0.3 0.063 -1.0 0.110 -0.5 0.200 -1.0 38 8 / 6 B 0.320 -0.2 0.130 -2.3
39 13 / 8 A 0.086 0.4 0.090 0.2 0.142 0.5 0.310 0.6 39 13 / 8 A 0.083 -0.1 0.360 0.3 0.282 -0.3 0.060 -0.6
40 9 / 5 B 0.161 1.1 0.250 -0.3 40 9 / 5 B 0.0845 -0.1 0.619 3.4 0.199 -1.4
41 13 / 8 A 0.081 0.1 0.050 -1.6 0.105 -0.6 0.140 -1.9 41 13 / 8 A 0.082 -0.2 0.230 -1.2 0.320 0.2 0.072 0.1
42 13 / 8 A 0.077 -0.1 0.080 -0.2 0.105 -0.6 0.143 -1.9 42 13 / 8 A 0.080 -0.3 0.260 -0.9 0.275 -0.4 0.076 0.3
43 2 / 2 B 0.203 -1.0 43 2 / 2 B 0.246 -0.8
* Category A/B classification (Cat A was assigned to laboratories that have correctly analysed at least 12 of 13 compulsory compounds on the Target Pesticides List, corretly detected 7 or more out of the 8 compulsory compounds and that have not reported any false positive results)
* Category A/B classification (Cat A was assigned to laboratories that have correctly analysed at least 12 of 13 compulsory compounds on the Target Pesticides List, corretly detected 7 or more out of the 8 compulsory compounds and that have not reported any false positive results)
Table 4-8 (cont.): Results reported and z-scores achieved by all participating laboratories for COMPULSORY compounds

EUPT-SRM12 | 2017 (Strawberry Purée)
44
COMPULSORY Compound 2,4-D Captan (parent) Chlorothalonil Dithiocarbamates COMPULSORY Compound Fenbutatin Oxide Folpet (parent) Glyphosate Haloxyfop
MRRL [mg/kg] 0.01 0.01 0.01 0.03 MRRL [mg/kg] 0.01 0.01 0.03 0.01
Assigned Value [mg/kg] 0.079 0.085 0.125 0.267 Assigned Value [mg/kg] 0.086 0.334 0.306 0.070
CV* 13.3 % 28.1 % 25.2 % 22.2 % CV* 21.0 % 25.0 % 20.9 % 13.9 %
Lab code SRM12-
NRL-SRM
Analysed / corr. found, max. 13 / 8
Cat.* Conc. [mg/kg]
z-Score § (FFP-RSD
= 25 %)
Conc. [mg/kg]
z-Score (FFP-RSD
= 25 %)
Conc. [mg/kg]
z-Score (FFP-RSD
= 25 %)
Conc. [mg/kg]
z-Score (FFP-RSD
= 25 %)
Lab code SRM12-
NRL-SRM
Analysed / corr. found, max. 13 / 8
Cat.* Conc. [mg/kg]
z-Score § (FFP-RSD
= 25 %)
Conc. [mg/kg]
z-Score (FFP-RSD
= 25 %)
Conc. [mg/kg]
z-Score (FFP-RSD
= 25 %)
Conc. [mg/kg]
z-Score (FFP-RSD
= 25 %)
44 x 8 / 4 B FN -3.5 0.085 0.0 0.067 -1.9 0.323 0.8 44 x 8 / 4 B 0.305 -0.4 FN -3.4
45 13 / 8 A 0.0691 -0.5 0.107 1.0 0.171 1.5 0.236 -0.5 45 13 / 8 A 0.0788 -0.3 0.462 1.5 0.301 -0.1 0.0857 0.9
46 13 / 8 A 0.085 0.3 0.0748 -0.5 0.130 0.2 0.203 -1.0 46 13 / 8 A 0.0738 -0.6 0.326 -0.1 0.235 -0.9 0.064 -0.4
47 13 / 8 A 0.076 -0.1 0.063 -1.0 0.170 1.4 0.306 0.6 47 13 / 8 A 0.114 1.3 0.260 -0.9 0.323 0.2 0.063 -0.4
48 12 / 7 A 0.084 0.3 0.0745 -0.5 0.131 0.2 0.284 0.3 48 12 / 7 A 0.329 -0.1 0.239 -0.9 0.067 -0.2
49 x 13 / 8 A 0.0812 0.1 0.0436 -1.9 0.0952 -1.0 0.259 -0.1 49 x 13 / 8 A 0.0796 -0.3 0.225 -1.3 0.396 1.2 0.0749 0.3
50 11 / 7 B 0.085 0.3 0.080 -0.2 0.192 2.1 0.314 0.7 50 11 / 7 B 0.087 0.1 0.379 0.5 0.070 0.0
51 8 / 4 B 0.0725 -0.3 0.230 3.3 51 8 / 4 B 0.104 0.9 0.0655 -0.3
52 13 / 8 A 0.069 -0.5 0.137 2.5 0.132 0.2 0.500 3.5 52 13 / 8 A 0.036 -2.3 0.862 6.3 0.388 1.1 0.075 0.3
53 13 / 8 A 0.073 -0.3 0.072 -0.6 0.119 -0.2 0.298 0.5 53 13 / 8 A 0.111 1.2 0.326 -0.1 0.280 -0.3 0.074 0.2
54 6 / 3 B 0.069 -1.8 54 6 / 3 B 0.269 -0.8 0.084 0.8
55 2 / 1 B 0.227 -0.6 55 2 / 1 B
56 7 / 4 B 0.055 -1.4 0.105 -0.6 0.250 -0.3 56 7 / 4 B 0.304 -0.4
57 13 / 8 A 0.069 -0.5 0.073 -0.6 0.094 -1.0 0.270 0.0 57 13 / 8 A 0.103 0.8 0.270 -0.8 1.300 13.0 0.071 0.0
58 13 / 8 A 0.0617 -0.9 0.106 1.0 0.144 0.6 0.271 0.1 58 13 / 8 A 0.0695 -0.8 0.271 -0.8 0.255 -0.7 0.078 0.4
59 1 / 1 B 0.256 -0.2 59 1 / 1 B
60 3 / 2 B 0.278 0.2 60 3 / 2 B 0.313 0.1
61 6 / 4 B 0.075 -0.2 0.0815 -0.2 61 6 / 4 B 0.385 0.6 0.070 0.0
62 x 9 / 6 B 0.071 -0.4 0.062 -1.1 0.087 -1.2 0.208 -0.9 62 x 9 / 6 B 0.377 0.5 0.256 -0.7 FN -4.0
63 12 / 7 A 0.082 0.2 0.050 -1.6 0.171 1.5 0.219 -0.7 63 12 / 7 A 0.231 6.8 0.085 -3.0 0.067 -0.2
64 10 / 6 B 0.082 0.2 0.151 0.8 0.255 -0.2 64 10 / 6 B 0.350 0.2 0.418 1.5 0.067 -0.2
65 1 / 1 B 0.259 -0.1 65 1 / 1 B
66 x 13 / 8 A 0.0765 -0.1 0.0842 0.0 0.154 0.9 0.268 0.0 66 x 13 / 8 A 0.0785 -0.3 0.440 1.3 0.281 -0.3 0.0649 -0.3
67 13 / 8 A 0.102 1.2 0.096 0.5 0.106 -0.6 0.287 0.3 67 13 / 8 A 0.068 -0.8 0.286 -0.6 0.485 2.3 0.0743 0.2
68 8 / 4 B 0.080 0.1 0.280 0.2 68 8 / 4 B 0.055 -3.3 0.072 0.1
69 10 / 6 B 0.089 0.5 0.0843 0.0 0.0995 -0.8 0.308 0.6 69 10 / 6 B 0.362 0.3 0.073 0.2
70 13 / 8 A 0.056 -1.2 0.020 -3.1 0.120 -0.2 0.270 0.0 70 13 / 8 A 0.065 -1.0 0.330 -0.1 0.283 -0.3 0.066 -0.2
71 11 / 6 B 0.791 36.2 0.0995 -0.8 0.247 -0.3 71 11 / 6 B 0.0679 -0.8 0.326 0.3 0.748 38.6
72 13 / 8 A 0.094 0.8 0.137 2.5 0.175 1.6 0.265 0.0 72 13 / 8 A 0.108 1.0 0.434 1.2 0.325 0.2 0.073 0.2
73 x 8 / 5 B 0.131 2.2 0.126 0.0 0.342 1.1 73 x 8 / 5 B 0.365 0.4 0.359 0.7
74 13 / 8 A 0.0836 0.2 0.0741 -0.5 0.133 0.2 0.372 1.6 74 13 / 8 A 0.105 0.9 0.344 0.1 0.228 -1.0 0.0772 0.4
75 x 13 / 8 A 0.128 2.5 0.122 1.7 0.172 1.5 0.476 3.1 75 x 13 / 8 A 0.288 9.5 0.371 0.4 0.288 -0.2 0.121 2.9
76 13 / 8 A 0.084 0.3 0.100 0.7 0.133 0.2 0.376 1.6 76 13 / 8 A 0.072 -0.6 0.360 0.3 0.268 -0.5 0.070 0.0
77 6 / 5 B 0.080 -0.2 0.105 -0.6 0.191 -1.1 77 6 / 5 B 0.076 -0.4 0.296 -0.5
78 13 / 8 A 0.073 -0.3 0.092 0.3 0.122 -0.1 0.211 -0.8 78 13 / 8 A 0.107 1.0 0.377 0.5 0.510 2.7 0.070 0.0
79 11 / 6 B 0.070 -0.4 0.089 -1.2 0.092 -2.6 79 11 / 6 B 0.074 -0.5 0.270 -0.5 0.060 -0.6
80 1 / 1 B 0.050 -2.4 80 1 / 1 B
81 x 11 / 6 B 0.0769 -0.1 0.125 0.0 0.251 -0.2 81 x 11 / 6 B 0.0695 -0.8 0.266 -0.5 0.0665 -0.2
82 1 / 1 B 0.210 -0.9 82 1 / 1 B
83 x 12 / 7 A 0.980 45.8 0.080 -0.2 0.010 -3.7 83 x 12 / 7 A 0.020 -3.1 0.440 1.3 0.170 -1.8 0.810 42.2
84 13 / 8 A 0.075 -0.2 0.080 -0.2 0.150 0.8 0.290 0.3 84 13 / 8 A 0.100 0.7 0.320 -0.2 0.280 -0.3 0.070 0.0
85 x 3 / 1 B 0.212 2.8 85 x 3 / 1 B
86 11 / 7 B 0.083 0.2 0.193 5.1 0.096 -0.9 0.420 2.3 86 11 / 7 B 0.231 -1.2 0.456 2.0 0.066 -0.2
87 1 / 1 B 0.231 -0.5 87 1 / 1 B
* Category A/B classification (Cat A was assigned to laboratories that have correctly analysed at least 12 of 13 compulsory compounds on the Target Pesticides List, corretly detected 7 or more out of the 8 compulsory compounds and that have not reported any false positive results)
* Category A/B classification (Cat A was assigned to laboratories that have correctly analysed at least 12 of 13 compulsory compounds on the Target Pesticides List, corretly detected 7 or more out of the 8 compulsory compounds and that have not reported any false positive results)
Table 4-8 (cont.): Results reported and z-scores achieved by all participating laboratories for COMPULSORY compounds

4. RESULTS / Assessment of Laboratory Performance
45
Resu
lts
4
COMPULSORY Compound 2,4-D Captan (parent) Chlorothalonil Dithiocarbamates COMPULSORY Compound Fenbutatin Oxide Folpet (parent) Glyphosate Haloxyfop
MRRL [mg/kg] 0.01 0.01 0.01 0.03 MRRL [mg/kg] 0.01 0.01 0.03 0.01
Assigned Value [mg/kg] 0.079 0.085 0.125 0.267 Assigned Value [mg/kg] 0.086 0.334 0.306 0.070
CV* 13.3 % 28.1 % 25.2 % 22.2 % CV* 21.0 % 25.0 % 20.9 % 13.9 %
Lab code SRM12-
NRL-SRM
Analysed / corr. found, max. 13 / 8
Cat.* Conc. [mg/kg]
z-Score § (FFP-RSD
= 25 %)
Conc. [mg/kg]
z-Score (FFP-RSD
= 25 %)
Conc. [mg/kg]
z-Score (FFP-RSD
= 25 %)
Conc. [mg/kg]
z-Score (FFP-RSD
= 25 %)
Lab code SRM12-
NRL-SRM
Analysed / corr. found, max. 13 / 8
Cat.* Conc. [mg/kg]
z-Score § (FFP-RSD
= 25 %)
Conc. [mg/kg]
z-Score (FFP-RSD
= 25 %)
Conc. [mg/kg]
z-Score (FFP-RSD
= 25 %)
Conc. [mg/kg]
z-Score (FFP-RSD
= 25 %)
44 x 8 / 4 B FN -3.5 0.085 0.0 0.067 -1.9 0.323 0.8 44 x 8 / 4 B 0.305 -0.4 FN -3.4
45 13 / 8 A 0.0691 -0.5 0.107 1.0 0.171 1.5 0.236 -0.5 45 13 / 8 A 0.0788 -0.3 0.462 1.5 0.301 -0.1 0.0857 0.9
46 13 / 8 A 0.085 0.3 0.0748 -0.5 0.130 0.2 0.203 -1.0 46 13 / 8 A 0.0738 -0.6 0.326 -0.1 0.235 -0.9 0.064 -0.4
47 13 / 8 A 0.076 -0.1 0.063 -1.0 0.170 1.4 0.306 0.6 47 13 / 8 A 0.114 1.3 0.260 -0.9 0.323 0.2 0.063 -0.4
48 12 / 7 A 0.084 0.3 0.0745 -0.5 0.131 0.2 0.284 0.3 48 12 / 7 A 0.329 -0.1 0.239 -0.9 0.067 -0.2
49 x 13 / 8 A 0.0812 0.1 0.0436 -1.9 0.0952 -1.0 0.259 -0.1 49 x 13 / 8 A 0.0796 -0.3 0.225 -1.3 0.396 1.2 0.0749 0.3
50 11 / 7 B 0.085 0.3 0.080 -0.2 0.192 2.1 0.314 0.7 50 11 / 7 B 0.087 0.1 0.379 0.5 0.070 0.0
51 8 / 4 B 0.0725 -0.3 0.230 3.3 51 8 / 4 B 0.104 0.9 0.0655 -0.3
52 13 / 8 A 0.069 -0.5 0.137 2.5 0.132 0.2 0.500 3.5 52 13 / 8 A 0.036 -2.3 0.862 6.3 0.388 1.1 0.075 0.3
53 13 / 8 A 0.073 -0.3 0.072 -0.6 0.119 -0.2 0.298 0.5 53 13 / 8 A 0.111 1.2 0.326 -0.1 0.280 -0.3 0.074 0.2
54 6 / 3 B 0.069 -1.8 54 6 / 3 B 0.269 -0.8 0.084 0.8
55 2 / 1 B 0.227 -0.6 55 2 / 1 B
56 7 / 4 B 0.055 -1.4 0.105 -0.6 0.250 -0.3 56 7 / 4 B 0.304 -0.4
57 13 / 8 A 0.069 -0.5 0.073 -0.6 0.094 -1.0 0.270 0.0 57 13 / 8 A 0.103 0.8 0.270 -0.8 1.300 13.0 0.071 0.0
58 13 / 8 A 0.0617 -0.9 0.106 1.0 0.144 0.6 0.271 0.1 58 13 / 8 A 0.0695 -0.8 0.271 -0.8 0.255 -0.7 0.078 0.4
59 1 / 1 B 0.256 -0.2 59 1 / 1 B
60 3 / 2 B 0.278 0.2 60 3 / 2 B 0.313 0.1
61 6 / 4 B 0.075 -0.2 0.0815 -0.2 61 6 / 4 B 0.385 0.6 0.070 0.0
62 x 9 / 6 B 0.071 -0.4 0.062 -1.1 0.087 -1.2 0.208 -0.9 62 x 9 / 6 B 0.377 0.5 0.256 -0.7 FN -4.0
63 12 / 7 A 0.082 0.2 0.050 -1.6 0.171 1.5 0.219 -0.7 63 12 / 7 A 0.231 6.8 0.085 -3.0 0.067 -0.2
64 10 / 6 B 0.082 0.2 0.151 0.8 0.255 -0.2 64 10 / 6 B 0.350 0.2 0.418 1.5 0.067 -0.2
65 1 / 1 B 0.259 -0.1 65 1 / 1 B
66 x 13 / 8 A 0.0765 -0.1 0.0842 0.0 0.154 0.9 0.268 0.0 66 x 13 / 8 A 0.0785 -0.3 0.440 1.3 0.281 -0.3 0.0649 -0.3
67 13 / 8 A 0.102 1.2 0.096 0.5 0.106 -0.6 0.287 0.3 67 13 / 8 A 0.068 -0.8 0.286 -0.6 0.485 2.3 0.0743 0.2
68 8 / 4 B 0.080 0.1 0.280 0.2 68 8 / 4 B 0.055 -3.3 0.072 0.1
69 10 / 6 B 0.089 0.5 0.0843 0.0 0.0995 -0.8 0.308 0.6 69 10 / 6 B 0.362 0.3 0.073 0.2
70 13 / 8 A 0.056 -1.2 0.020 -3.1 0.120 -0.2 0.270 0.0 70 13 / 8 A 0.065 -1.0 0.330 -0.1 0.283 -0.3 0.066 -0.2
71 11 / 6 B 0.791 36.2 0.0995 -0.8 0.247 -0.3 71 11 / 6 B 0.0679 -0.8 0.326 0.3 0.748 38.6
72 13 / 8 A 0.094 0.8 0.137 2.5 0.175 1.6 0.265 0.0 72 13 / 8 A 0.108 1.0 0.434 1.2 0.325 0.2 0.073 0.2
73 x 8 / 5 B 0.131 2.2 0.126 0.0 0.342 1.1 73 x 8 / 5 B 0.365 0.4 0.359 0.7
74 13 / 8 A 0.0836 0.2 0.0741 -0.5 0.133 0.2 0.372 1.6 74 13 / 8 A 0.105 0.9 0.344 0.1 0.228 -1.0 0.0772 0.4
75 x 13 / 8 A 0.128 2.5 0.122 1.7 0.172 1.5 0.476 3.1 75 x 13 / 8 A 0.288 9.5 0.371 0.4 0.288 -0.2 0.121 2.9
76 13 / 8 A 0.084 0.3 0.100 0.7 0.133 0.2 0.376 1.6 76 13 / 8 A 0.072 -0.6 0.360 0.3 0.268 -0.5 0.070 0.0
77 6 / 5 B 0.080 -0.2 0.105 -0.6 0.191 -1.1 77 6 / 5 B 0.076 -0.4 0.296 -0.5
78 13 / 8 A 0.073 -0.3 0.092 0.3 0.122 -0.1 0.211 -0.8 78 13 / 8 A 0.107 1.0 0.377 0.5 0.510 2.7 0.070 0.0
79 11 / 6 B 0.070 -0.4 0.089 -1.2 0.092 -2.6 79 11 / 6 B 0.074 -0.5 0.270 -0.5 0.060 -0.6
80 1 / 1 B 0.050 -2.4 80 1 / 1 B
81 x 11 / 6 B 0.0769 -0.1 0.125 0.0 0.251 -0.2 81 x 11 / 6 B 0.0695 -0.8 0.266 -0.5 0.0665 -0.2
82 1 / 1 B 0.210 -0.9 82 1 / 1 B
83 x 12 / 7 A 0.980 45.8 0.080 -0.2 0.010 -3.7 83 x 12 / 7 A 0.020 -3.1 0.440 1.3 0.170 -1.8 0.810 42.2
84 13 / 8 A 0.075 -0.2 0.080 -0.2 0.150 0.8 0.290 0.3 84 13 / 8 A 0.100 0.7 0.320 -0.2 0.280 -0.3 0.070 0.0
85 x 3 / 1 B 0.212 2.8 85 x 3 / 1 B
86 11 / 7 B 0.083 0.2 0.193 5.1 0.096 -0.9 0.420 2.3 86 11 / 7 B 0.231 -1.2 0.456 2.0 0.066 -0.2
87 1 / 1 B 0.231 -0.5 87 1 / 1 B
* Category A/B classification (Cat A was assigned to laboratories that have correctly analysed at least 12 of 13 compulsory compounds on the Target Pesticides List, corretly detected 7 or more out of the 8 compulsory compounds and that have not reported any false positive results)
* Category A/B classification (Cat A was assigned to laboratories that have correctly analysed at least 12 of 13 compulsory compounds on the Target Pesticides List, corretly detected 7 or more out of the 8 compulsory compounds and that have not reported any false positive results)
Table 4-8 (cont.): Results reported and z-scores achieved by all participating laboratories for COMPULSORY compounds

EUPT-SRM12 | 2017 (Strawberry Purée)
46
COMPULSORY Compound 2,4-D Captan (parent) Chlorothalonil Dithiocarbamates COMPULSORY Compound Fenbutatin Oxide Folpet (parent) Glyphosate Haloxyfop
MRRL [mg/kg] 0.01 0.01 0.01 0.03 MRRL [mg/kg] 0.01 0.01 0.03 0.01
Assigned Value [mg/kg] 0.079 0.085 0.125 0.267 Assigned Value [mg/kg] 0.086 0.334 0.306 0.070
CV* 13.3 % 28.1 % 25.2 % 22.2 % CV* 21.0 % 25.0 % 20.9 % 13.9 %
Lab code SRM12-
NRL-SRM
Analysed / corr. found, max. 13 / 8
Cat.* Conc. [mg/kg]
z-Score § (FFP-RSD
= 25 %)
Conc. [mg/kg]
z-Score (FFP-RSD
= 25 %)
Conc. [mg/kg]
z-Score (FFP-RSD
= 25 %)
Conc. [mg/kg]
z-Score (FFP-RSD
= 25 %)
Lab code SRM12-
NRL-SRM
Analysed / corr. found, max. 13 / 8
Cat.* Conc. [mg/kg]
z-Score § (FFP-RSD
= 25 %)
Conc. [mg/kg]
z-Score (FFP-RSD
= 25 %)
Conc. [mg/kg]
z-Score (FFP-RSD
= 25 %)
Conc. [mg/kg]
z-Score (FFP-RSD
= 25 %)
88 13 / 8 A 0.075 -0.2 0.088 0.1 0.122 -0.1 0.255 -0.2 88 13 / 8 A 0.080 -0.3 0.301 -0.4 0.312 0.1 0.056 -0.8
89 7 / 4 B 0.102 1.2 0.148 0.7 89 7 / 4 B 0.076 -0.4 0.322 0.2
90 13 / 8 A 0.086 0.4 0.090 0.2 0.127 0.1 0.566 4.5 90 13 / 8 A 0.095 0.4 0.253 -1.0 0.271 -0.5 0.080 0.6
91 x 11 / 7 B 0.120 2.1 0.088 0.1 0.140 0.5 0.280 0.2 91 x 11 / 7 B 0.079 -0.3 0.360 0.3 0.054 -0.9
92 x 13 / 8 A 0.0905 0.6 0.0852 0.0 0.106 -0.6 0.281 0.2 92 x 13 / 8 A 0.0842 -0.1 0.355 0.2 0.346 0.5 0.0803 0.6
93 10 / 6 B 0.0722 -0.3 0.0471 -1.8 0.111 -0.5 93 10 / 6 B 0.085 0.0 0.287 -0.6 0.0545 -0.9
94 13 / 8 A 0.076 -0.1 0.078 -0.3 0.135 0.3 0.295 0.4 94 13 / 8 A 0.079 -0.3 0.346 0.1 0.364 0.8 0.072 0.1
95 13 / 8 A 0.078 0.0 0.149 3.0 0.116 -0.3 0.212 -0.8 95 13 / 8 A 0.073 -0.6 0.751 5.0 0.350 0.6 0.076 0.3
96 x 13 / 8 A 0.071 -0.4 0.099 0.7 0.103 -0.7 0.307 0.6 96 x 13 / 8 A 0.080 -0.3 0.117 -2.6 0.284 -0.3 0.064 -0.4
97 13 / 8 A 0.087 0.4 0.086 0.0 0.173 1.5 0.348 1.2 97 13 / 8 A 0.104 0.9 0.424 1.1 0.775 6.1 0.087 1.0
98 x 13 / 8 A 0.069 -0.5 0.0213 -3.0 0.0353 -2.9 0.247 -0.3 98 x 13 / 8 A 0.0561 -1.4 0.141 -2.3 0.301 -0.1 0.0515 -1.1
99 13 / 7 A 0.079 0.0 0.188 4.9 0.116 -0.3 0.282 0.2 99 13 / 7 A FN -3.5 0.375 0.5 0.200 -1.4 0.077 0.4
100 1 / 1 B 0.330 0.9 100 1 / 1 B
101 1 / 1 B 0.080 -1.4 101 1 / 1 B
102 13 / 7 A 0.064 -0.7 0.089 0.2 0.310 5.9 0.240 -0.4 102 13 / 7 A 0.059 -1.2 FN -3.9 0.290 -0.2 0.032 -2.2
103 x 13 / 8 A 0.0782 0.0 0.105 0.9 0.138 0.4 0.263 -0.1 103 x 13 / 8 A 0.0951 0.4 0.440 1.3 0.295 -0.1 0.0727 0.1
104 13 / 8 A 0.0907 0.6 0.0818 -0.1 0.102 -0.7 0.296 0.4 104 13 / 8 A 0.0765 -0.4 0.328 -0.1 0.341 0.5 0.0753 0.3
105 x 6 / 4 B 0.120 1.7 0.160 1.1 0.260 -0.1 105 x 6 / 4 B 0.450 1.4
106 13 / 4 B 0.100 1.1 FN -3.5 FN -3.7 0.181 -1.3 106 13 / 4 B FN -3.5 FN -3.9 0.350 0.6 0.120 2.8
107 x 13 / 8 A 0.112 1.7 0.063 -1.0 0.161 1.1 0.147 -1.8 107 x 13 / 8 A 0.107 1.0 0.307 -0.3 0.212 -1.2 0.0856 0.9
108 11 / 7 B 0.087 0.4 0.450 17.2 0.114 -0.4 0.270 0.0 108 11 / 7 B 0.350 0.2 0.193 -1.5 0.047 -1.3
109 13 / 8 A 0.075 -0.2 0.076 -0.4 0.145 0.6 0.302 0.5 109 13 / 8 A 0.086 0.0 0.351 0.2 0.260 -0.6 0.070 0.0
110 3 / 3 B 0.313 10.7 0.167 1.3 110 3 / 3 B 1.23 10.7
111 1 / 1 B 0.240 -0.4 111 1 / 1 B
112 3 / 3 B 0.042 -2.0 0.037 -2.8 112 3 / 3 B 0.132 -2.4
113 12 / 8 A 0.085 0.3 0.063 -1.0 0.094 -1.0 0.340 1.1 113 12 / 8 A 0.087 0.1 0.285 -0.6 0.300 -0.1 0.076 0.3
114 1 / 1 B 0.290 0.3 114 1 / 1 B
115 13 / 8 A 0.059 -1.0 0.090 0.2 0.135 0.3 0.280 0.2 115 13 / 8 A 0.075 -0.5 0.347 0.2 0.270 -0.5 0.071 0.0
116 13 / 8 A 0.0833 0.2 0.0792 -0.3 0.131 0.2 0.253 -0.2 116 13 / 8 A 0.107 1.0 0.246 -1.1 0.351 0.6 0.0752 0.3
117 9 / 5 B 0.0918 0.7 0.126 1.9 0.102 -0.7 117 9 / 5 B 0.258 -0.9 0.0949 1.4
118 5 / 4 B 0.086 -1.3 0.150 -1.8 118 5 / 4 B 0.292 -0.5 0.134 3.6
119 1 / 1 B 0.269 0.0 119 1 / 1 B
120 5 / 2 B FN -3.5 0.111 -0.5 120 5 / 2 B 0.330 -0.1
121 3 / 1 B 0.121 -0.1 121 3 / 1 B
122 3 / 2 B 0.274 0.1 122 3 / 2 B 0.345 0.5
123 2 / 1 B 123 2 / 1 B 0.080 -0.3
124 x 9 / 6 B 0.0766 -0.1 0.095 0.5 0.131 0.2 0.221 -0.7 124 x 9 / 6 B 0.323 -0.1 0.0728 0.1
125 12 / 7 A 0.094 0.8 0.137 2.5 0.137 0.4 125 12 / 7 A 0.102 0.8 0.526 2.3 0.442 1.8 0.082 0.7
126 9 / 7 B 0.059 -1.0 0.072 -0.6 0.131 0.2 126 9 / 7 B 0.036 -2.3 0.295 -0.5 0.291 -0.2 0.047 -1.3
127 13 / 8 A 0.073 -0.3 0.104 0.9 0.154 0.9 0.336 1.0 127 13 / 8 A 0.078 -0.4 0.375 0.5 0.371 0.8 0.068 -0.1
128 1 / 1 B 0.0658 -0.7 128 1 / 1 B
129 12 / 7 A 0.086 0.4 0.069 -0.8 0.101 -0.8 0.142 -1.9 129 12 / 7 A 0.072 -0.6 0.259 -0.9 0.067 -0.2
130 13 / 8 A 0.101 1.1 0.089 0.2 0.105 -0.6 0.181 -1.3 130 13 / 8 A 0.123 1.7 0.389 0.7 0.371 0.8 0.087 1.0
* Category A/B classification (Cat A was assigned to laboratories that have correctly analysed at least 12 of 13 compulsory compounds on the Target Pesticides List, corretly detected 7 or more out of the 8 compulsory compounds and that have not reported any false positive results)
* Category A/B classification (Cat A was assigned to laboratories that have correctly analysed at least 12 of 13 compulsory compounds on the Target Pesticides List, corretly detected 7 or more out of the 8 compulsory compounds and that have not reported any false positive results)
Table 4-8 (cont.): Results reported and z-scores achieved by all participating laboratories for COMPULSORY compounds
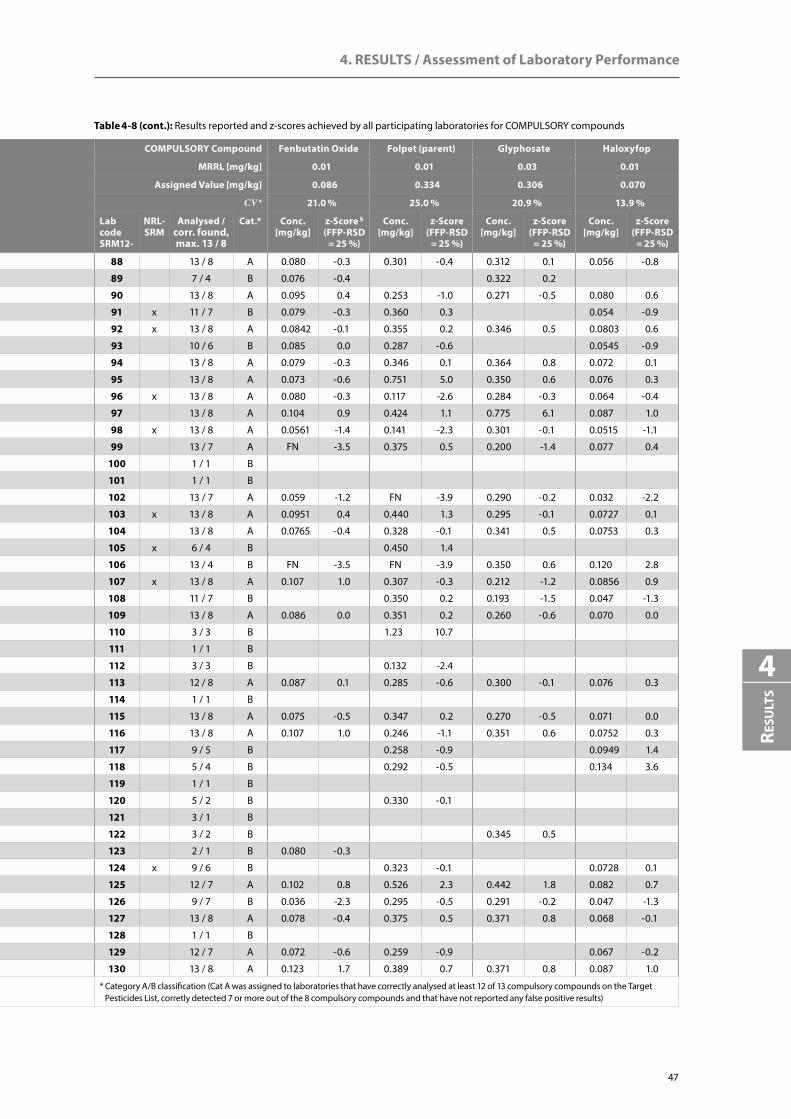
4. RESULTS / Assessment of Laboratory Performance
47
Resu
lts
4
COMPULSORY Compound 2,4-D Captan (parent) Chlorothalonil Dithiocarbamates COMPULSORY Compound Fenbutatin Oxide Folpet (parent) Glyphosate Haloxyfop
MRRL [mg/kg] 0.01 0.01 0.01 0.03 MRRL [mg/kg] 0.01 0.01 0.03 0.01
Assigned Value [mg/kg] 0.079 0.085 0.125 0.267 Assigned Value [mg/kg] 0.086 0.334 0.306 0.070
CV* 13.3 % 28.1 % 25.2 % 22.2 % CV* 21.0 % 25.0 % 20.9 % 13.9 %
Lab code SRM12-
NRL-SRM
Analysed / corr. found, max. 13 / 8
Cat.* Conc. [mg/kg]
z-Score § (FFP-RSD
= 25 %)
Conc. [mg/kg]
z-Score (FFP-RSD
= 25 %)
Conc. [mg/kg]
z-Score (FFP-RSD
= 25 %)
Conc. [mg/kg]
z-Score (FFP-RSD
= 25 %)
Lab code SRM12-
NRL-SRM
Analysed / corr. found, max. 13 / 8
Cat.* Conc. [mg/kg]
z-Score § (FFP-RSD
= 25 %)
Conc. [mg/kg]
z-Score (FFP-RSD
= 25 %)
Conc. [mg/kg]
z-Score (FFP-RSD
= 25 %)
Conc. [mg/kg]
z-Score (FFP-RSD
= 25 %)
88 13 / 8 A 0.075 -0.2 0.088 0.1 0.122 -0.1 0.255 -0.2 88 13 / 8 A 0.080 -0.3 0.301 -0.4 0.312 0.1 0.056 -0.8
89 7 / 4 B 0.102 1.2 0.148 0.7 89 7 / 4 B 0.076 -0.4 0.322 0.2
90 13 / 8 A 0.086 0.4 0.090 0.2 0.127 0.1 0.566 4.5 90 13 / 8 A 0.095 0.4 0.253 -1.0 0.271 -0.5 0.080 0.6
91 x 11 / 7 B 0.120 2.1 0.088 0.1 0.140 0.5 0.280 0.2 91 x 11 / 7 B 0.079 -0.3 0.360 0.3 0.054 -0.9
92 x 13 / 8 A 0.0905 0.6 0.0852 0.0 0.106 -0.6 0.281 0.2 92 x 13 / 8 A 0.0842 -0.1 0.355 0.2 0.346 0.5 0.0803 0.6
93 10 / 6 B 0.0722 -0.3 0.0471 -1.8 0.111 -0.5 93 10 / 6 B 0.085 0.0 0.287 -0.6 0.0545 -0.9
94 13 / 8 A 0.076 -0.1 0.078 -0.3 0.135 0.3 0.295 0.4 94 13 / 8 A 0.079 -0.3 0.346 0.1 0.364 0.8 0.072 0.1
95 13 / 8 A 0.078 0.0 0.149 3.0 0.116 -0.3 0.212 -0.8 95 13 / 8 A 0.073 -0.6 0.751 5.0 0.350 0.6 0.076 0.3
96 x 13 / 8 A 0.071 -0.4 0.099 0.7 0.103 -0.7 0.307 0.6 96 x 13 / 8 A 0.080 -0.3 0.117 -2.6 0.284 -0.3 0.064 -0.4
97 13 / 8 A 0.087 0.4 0.086 0.0 0.173 1.5 0.348 1.2 97 13 / 8 A 0.104 0.9 0.424 1.1 0.775 6.1 0.087 1.0
98 x 13 / 8 A 0.069 -0.5 0.0213 -3.0 0.0353 -2.9 0.247 -0.3 98 x 13 / 8 A 0.0561 -1.4 0.141 -2.3 0.301 -0.1 0.0515 -1.1
99 13 / 7 A 0.079 0.0 0.188 4.9 0.116 -0.3 0.282 0.2 99 13 / 7 A FN -3.5 0.375 0.5 0.200 -1.4 0.077 0.4
100 1 / 1 B 0.330 0.9 100 1 / 1 B
101 1 / 1 B 0.080 -1.4 101 1 / 1 B
102 13 / 7 A 0.064 -0.7 0.089 0.2 0.310 5.9 0.240 -0.4 102 13 / 7 A 0.059 -1.2 FN -3.9 0.290 -0.2 0.032 -2.2
103 x 13 / 8 A 0.0782 0.0 0.105 0.9 0.138 0.4 0.263 -0.1 103 x 13 / 8 A 0.0951 0.4 0.440 1.3 0.295 -0.1 0.0727 0.1
104 13 / 8 A 0.0907 0.6 0.0818 -0.1 0.102 -0.7 0.296 0.4 104 13 / 8 A 0.0765 -0.4 0.328 -0.1 0.341 0.5 0.0753 0.3
105 x 6 / 4 B 0.120 1.7 0.160 1.1 0.260 -0.1 105 x 6 / 4 B 0.450 1.4
106 13 / 4 B 0.100 1.1 FN -3.5 FN -3.7 0.181 -1.3 106 13 / 4 B FN -3.5 FN -3.9 0.350 0.6 0.120 2.8
107 x 13 / 8 A 0.112 1.7 0.063 -1.0 0.161 1.1 0.147 -1.8 107 x 13 / 8 A 0.107 1.0 0.307 -0.3 0.212 -1.2 0.0856 0.9
108 11 / 7 B 0.087 0.4 0.450 17.2 0.114 -0.4 0.270 0.0 108 11 / 7 B 0.350 0.2 0.193 -1.5 0.047 -1.3
109 13 / 8 A 0.075 -0.2 0.076 -0.4 0.145 0.6 0.302 0.5 109 13 / 8 A 0.086 0.0 0.351 0.2 0.260 -0.6 0.070 0.0
110 3 / 3 B 0.313 10.7 0.167 1.3 110 3 / 3 B 1.23 10.7
111 1 / 1 B 0.240 -0.4 111 1 / 1 B
112 3 / 3 B 0.042 -2.0 0.037 -2.8 112 3 / 3 B 0.132 -2.4
113 12 / 8 A 0.085 0.3 0.063 -1.0 0.094 -1.0 0.340 1.1 113 12 / 8 A 0.087 0.1 0.285 -0.6 0.300 -0.1 0.076 0.3
114 1 / 1 B 0.290 0.3 114 1 / 1 B
115 13 / 8 A 0.059 -1.0 0.090 0.2 0.135 0.3 0.280 0.2 115 13 / 8 A 0.075 -0.5 0.347 0.2 0.270 -0.5 0.071 0.0
116 13 / 8 A 0.0833 0.2 0.0792 -0.3 0.131 0.2 0.253 -0.2 116 13 / 8 A 0.107 1.0 0.246 -1.1 0.351 0.6 0.0752 0.3
117 9 / 5 B 0.0918 0.7 0.126 1.9 0.102 -0.7 117 9 / 5 B 0.258 -0.9 0.0949 1.4
118 5 / 4 B 0.086 -1.3 0.150 -1.8 118 5 / 4 B 0.292 -0.5 0.134 3.6
119 1 / 1 B 0.269 0.0 119 1 / 1 B
120 5 / 2 B FN -3.5 0.111 -0.5 120 5 / 2 B 0.330 -0.1
121 3 / 1 B 0.121 -0.1 121 3 / 1 B
122 3 / 2 B 0.274 0.1 122 3 / 2 B 0.345 0.5
123 2 / 1 B 123 2 / 1 B 0.080 -0.3
124 x 9 / 6 B 0.0766 -0.1 0.095 0.5 0.131 0.2 0.221 -0.7 124 x 9 / 6 B 0.323 -0.1 0.0728 0.1
125 12 / 7 A 0.094 0.8 0.137 2.5 0.137 0.4 125 12 / 7 A 0.102 0.8 0.526 2.3 0.442 1.8 0.082 0.7
126 9 / 7 B 0.059 -1.0 0.072 -0.6 0.131 0.2 126 9 / 7 B 0.036 -2.3 0.295 -0.5 0.291 -0.2 0.047 -1.3
127 13 / 8 A 0.073 -0.3 0.104 0.9 0.154 0.9 0.336 1.0 127 13 / 8 A 0.078 -0.4 0.375 0.5 0.371 0.8 0.068 -0.1
128 1 / 1 B 0.0658 -0.7 128 1 / 1 B
129 12 / 7 A 0.086 0.4 0.069 -0.8 0.101 -0.8 0.142 -1.9 129 12 / 7 A 0.072 -0.6 0.259 -0.9 0.067 -0.2
130 13 / 8 A 0.101 1.1 0.089 0.2 0.105 -0.6 0.181 -1.3 130 13 / 8 A 0.123 1.7 0.389 0.7 0.371 0.8 0.087 1.0
* Category A/B classification (Cat A was assigned to laboratories that have correctly analysed at least 12 of 13 compulsory compounds on the Target Pesticides List, corretly detected 7 or more out of the 8 compulsory compounds and that have not reported any false positive results)
* Category A/B classification (Cat A was assigned to laboratories that have correctly analysed at least 12 of 13 compulsory compounds on the Target Pesticides List, corretly detected 7 or more out of the 8 compulsory compounds and that have not reported any false positive results)
Table 4-8 (cont.): Results reported and z-scores achieved by all participating laboratories for COMPULSORY compounds

EUPT-SRM12 | 2017 (Strawberry Purée)
48
COMPULSORY Compound 2,4-D Captan (parent) Chlorothalonil Dithiocarbamates COMPULSORY Compound Fenbutatin Oxide Folpet (parent) Glyphosate Haloxyfop
MRRL [mg/kg] 0.01 0.01 0.01 0.03 MRRL [mg/kg] 0.01 0.01 0.03 0.01
Assigned Value [mg/kg] 0.079 0.085 0.125 0.267 Assigned Value [mg/kg] 0.086 0.334 0.306 0.070
CV* 13.3 % 28.1 % 25.2 % 22.2 % CV* 21.0 % 25.0 % 20.9 % 13.9 %
Lab code SRM12-
NRL-SRM
Analysed / corr. found, max. 13 / 8
Cat.* Conc. [mg/kg]
z-Score § (FFP-RSD
= 25 %)
Conc. [mg/kg]
z-Score (FFP-RSD
= 25 %)
Conc. [mg/kg]
z-Score (FFP-RSD
= 25 %)
Conc. [mg/kg]
z-Score (FFP-RSD
= 25 %)
Lab code SRM12-
NRL-SRM
Analysed / corr. found, max. 13 / 8
Cat.* Conc. [mg/kg]
z-Score § (FFP-RSD
= 25 %)
Conc. [mg/kg]
z-Score (FFP-RSD
= 25 %)
Conc. [mg/kg]
z-Score (FFP-RSD
= 25 %)
Conc. [mg/kg]
z-Score (FFP-RSD
= 25 %)
3rd-131 7 / 4 B 0.085 0.3 0.135 0.3 0.235 -0.5 3rd-131 7 / 4 B 0.204 -1.3
3rd-132 11 / 7 B 0.083 0.2 0.089 0.2 0.070 -1.8 0.290 0.3 3rd-132 11 / 7 B 0.394 0.7 0.098 -2.7 0.032 -2.2
3rd-133 12 / 7 A 0.0797 0.1 0.0844 0.0 0.133 0.2 3rd-133 12 / 7 A 0.0893 0.2 0.355 0.2 0.299 -0.1 0.0733 0.2
3rd-134 3 / 3 B 0.110 -0.5 0.270 0.0 3rd-134 3 / 3 B 0.090 0.2
3rd-135 4 / 2 B 0.090 -1.1 1.96 25.4 3rd-135 4 / 2 B
3rd-136 13 / 8 A 0.077 -0.1 0.111 1.2 0.0422 -2.7 0.232 -0.5 3rd-136 13 / 8 A 0.0899 0.2 0.665 4.0 0.315 0.1 0.0658 -0.3
3rd-137 4 / 3 B 0.087 0.4 0.285 5.1 3rd-137 4 / 3 B 0.179 -1.7
3rd-138 6 / 5 B 0.265 8.5 0.095 -1.0 0.304 0.6 3rd-138 6 / 5 B 0.110 1.1 0.745 4.9
3rd-139 13 / 8 A 0.208 6.6 0.0775 -0.4 0.118 -0.2 0.473 3.1 3rd-139 13 / 8 A 0.249 7.6 0.0953 -2.9 0.317 0.1 0.016 -3.1
* Category A/B classification (Cat A was assigned to laboratories that have correctly analysed at least 12 of 13 compulsory compounds on the Target Pesticides List, corretly detected 7 or more out of the 8 compulsory compounds and that have not reported any false positive results)
* Category A/B classification (Cat A was assigned to laboratories that have correctly analysed at least 12 of 13 compulsory compounds on the Target Pesticides List, corretly detected 7 or more out of the 8 compulsory compounds and that have not reported any false positive results)
Table 4-8 (cont.): Results reported and z-scores achieved by all participating laboratories for COMPULSORY compounds
OPTIONAL Compound Bifenazate Bromide ion Chlorate Dithianon OPTIONAL Compound Phosphonic acid N-Acetyl glyphosate Carbofuran ‘
(z-scores for information only)
MRRL [mg/kg] 0.02 3 0.02 0.02 MRRL [mg/kg] 0.05 0.02 0.001
Assigned Value [mg/kg] 0.270 19.1 0.490 0.294 Assigned Value [mg/kg] 19.3 0.100 0.0030(based on
entire population,58 numerical results)
0.0039(based on 13 results
with acidic transformation)
CV* 22.1 % 16.0 % 16.2 % 25.3 % CV* 27.0 % 23.2 % 47.1 % 50.2 %
Lab code SRM12-
NRL-SRM
Analysed / corr. found max. 8 / 7
Cat.* Conc. [mg/kg]
z-Score (FFP-RSD
= 25 %)
Conc. [mg/kg]
z-Score (FFP-RSD
= 25 %)
Conc. [mg/kg]
z-Score (FFP-RSD
= 25 %)
Conc. [mg/kg]
z-Score (FFP-RSD
= 25 %)
Lab code SRM12-
NRL-SRM
Analysed / corr. found max. 8 / 7
Cat.* Conc. [mg/kg]
z-Score (FFP-RSD
= 25 %)
Conc. [mg/kg]
z-Score (FFP-RSD
= 25 %)
Conc. [mg/kg]
z-score (FFP-RSD
= 25 %)
z-score (FFP-RSD
= 25 %)
1 7 / 6 A 0.172 -1.5 22.0 0.6 0.452 -0.3 0.160 -1.8 1 7 / 6 A 15.9 -0.7 0.0027 -0.4 -1.2
2 7 / 5 A 0.198 -1.1 17.3 -0.4 0.470 -0.2 0.268 -0.3 2 7 / 5 A 17.9 -0.3 FN -2.7 -3.0
3 x 4 / 3 A 0.201 -1.0 0.104 -2.6 3 x 4 / 3 A 0.0020 -1.3 -2.0
4 2 / 2 B 0.284 -0.1 4 2 / 2 B 0.00163 -1.8 -2.3
5 0 / 0 B 5 0 / 0 B
6 x 7 / 4 A 0.184 -1.3 0.700 1.7 0.275 -0.3 6 x 7 / 4 A 20.9 0.3 FN -3.2 FN -2.7 -3.0
7 5 / 4 A 0.385 1.7 13.2 -1.2 0.504 0.1 7 5 / 4 A 20.34 0.2
8 6 / 5 B 21.2 0.4 0.790 2.5 8 6 / 5 B 16.7 -0.5 0.093 -0.3 0.0027 -0.4 -1.2
9 3 / 3 A 0.525 0.3 9 3 / 3 A 51.7 6.7 0.0034 0.5 -0.5
10 4 / 3 B 0.546 0.5 10 4 / 3 B 27.9 1.8 0.0067 4.9 2.8
11 0 / 0 B 11 0 / 0 B
12 7 / 5 A 0.220 -0.7 21.0 0.4 0.470 -0.2 0.290 0.0 12 7 / 5 A 21.0 0.4 FN -2.7 -3.0
13 x 4 / 3 A 28.5 2.0 0.280 -0.2 13 x 4 / 3 A 0.0019 -1.5 -2.1
14 4 / 3 A 0.525 0.3 0.306 0.2 14 4 / 3 A 17.78 -0.3
15 1 / 1 B 18.0 -0.2 15 1 / 1 B
16 x 2 / 1 B 20.2 0.2 16 x 2 / 1 B
17 x 2 / 2 A 0.308 0.6 17 x 2 / 2 A 0.0057 3.6 1.8
18 7 / 6 A 0.249 -0.3 17.1 -0.4 0.490 0.0 0.287 -0.1 18 7 / 6 A 20.1 0.2 0.0018 -1.6 -2.2
* Category A/B classification (Cat A was assigned to laboratories that have correctly analysed at least 12 of 13 compulsory compounds on the Target Pesticides List, corretly detected 7 or more out of the 8 compulsory compounds and that have not reported any false positive result)
* Category A/B classification (Cat A was assigned to laboratories that have correctly analysed at least 12 of 13 compulsory compounds on the Target Pesticides List, corretly detected 7 or more out of the 8 compulsory compounds and that have not reported any false positive result)
Table 4-9: Results reported and z-scores achieved by all participating laboratories for OPTIONAL compounds

4. RESULTS / Assessment of Laboratory Performance
49
Resu
lts
4
Table 4-8 (cont.): Results reported and z-scores achieved by all participating laboratories for COMPULSORY compounds
Table 4-9 (cont.): Results reported and z-scores achieved by all participating laboratories for OPTIONAL compounds
COMPULSORY Compound 2,4-D Captan (parent) Chlorothalonil Dithiocarbamates COMPULSORY Compound Fenbutatin Oxide Folpet (parent) Glyphosate Haloxyfop
MRRL [mg/kg] 0.01 0.01 0.01 0.03 MRRL [mg/kg] 0.01 0.01 0.03 0.01
Assigned Value [mg/kg] 0.079 0.085 0.125 0.267 Assigned Value [mg/kg] 0.086 0.334 0.306 0.070
CV* 13.3 % 28.1 % 25.2 % 22.2 % CV* 21.0 % 25.0 % 20.9 % 13.9 %
Lab code SRM12-
NRL-SRM
Analysed / corr. found, max. 13 / 8
Cat.* Conc. [mg/kg]
z-Score § (FFP-RSD
= 25 %)
Conc. [mg/kg]
z-Score (FFP-RSD
= 25 %)
Conc. [mg/kg]
z-Score (FFP-RSD
= 25 %)
Conc. [mg/kg]
z-Score (FFP-RSD
= 25 %)
Lab code SRM12-
NRL-SRM
Analysed / corr. found, max. 13 / 8
Cat.* Conc. [mg/kg]
z-Score § (FFP-RSD
= 25 %)
Conc. [mg/kg]
z-Score (FFP-RSD
= 25 %)
Conc. [mg/kg]
z-Score (FFP-RSD
= 25 %)
Conc. [mg/kg]
z-Score (FFP-RSD
= 25 %)
3rd-131 7 / 4 B 0.085 0.3 0.135 0.3 0.235 -0.5 3rd-131 7 / 4 B 0.204 -1.3
3rd-132 11 / 7 B 0.083 0.2 0.089 0.2 0.070 -1.8 0.290 0.3 3rd-132 11 / 7 B 0.394 0.7 0.098 -2.7 0.032 -2.2
3rd-133 12 / 7 A 0.0797 0.1 0.0844 0.0 0.133 0.2 3rd-133 12 / 7 A 0.0893 0.2 0.355 0.2 0.299 -0.1 0.0733 0.2
3rd-134 3 / 3 B 0.110 -0.5 0.270 0.0 3rd-134 3 / 3 B 0.090 0.2
3rd-135 4 / 2 B 0.090 -1.1 1.96 25.4 3rd-135 4 / 2 B
3rd-136 13 / 8 A 0.077 -0.1 0.111 1.2 0.0422 -2.7 0.232 -0.5 3rd-136 13 / 8 A 0.0899 0.2 0.665 4.0 0.315 0.1 0.0658 -0.3
3rd-137 4 / 3 B 0.087 0.4 0.285 5.1 3rd-137 4 / 3 B 0.179 -1.7
3rd-138 6 / 5 B 0.265 8.5 0.095 -1.0 0.304 0.6 3rd-138 6 / 5 B 0.110 1.1 0.745 4.9
3rd-139 13 / 8 A 0.208 6.6 0.0775 -0.4 0.118 -0.2 0.473 3.1 3rd-139 13 / 8 A 0.249 7.6 0.0953 -2.9 0.317 0.1 0.016 -3.1
* Category A/B classification (Cat A was assigned to laboratories that have correctly analysed at least 12 of 13 compulsory compounds on the Target Pesticides List, corretly detected 7 or more out of the 8 compulsory compounds and that have not reported any false positive results)
* Category A/B classification (Cat A was assigned to laboratories that have correctly analysed at least 12 of 13 compulsory compounds on the Target Pesticides List, corretly detected 7 or more out of the 8 compulsory compounds and that have not reported any false positive results)
OPTIONAL Compound Bifenazate Bromide ion Chlorate Dithianon OPTIONAL Compound Phosphonic acid N-Acetyl glyphosate Carbofuran ‘
(z-scores for information only)
MRRL [mg/kg] 0.02 3 0.02 0.02 MRRL [mg/kg] 0.05 0.02 0.001
Assigned Value [mg/kg] 0.270 19.1 0.490 0.294 Assigned Value [mg/kg] 19.3 0.100 0.0030(based on
entire population,58 numerical results)
0.0039(based on 13 results
with acidic transformation)
CV* 22.1 % 16.0 % 16.2 % 25.3 % CV* 27.0 % 23.2 % 47.1 % 50.2 %
Lab code SRM12-
NRL-SRM
Analysed / corr. found max. 8 / 7
Cat.* Conc. [mg/kg]
z-Score (FFP-RSD
= 25 %)
Conc. [mg/kg]
z-Score (FFP-RSD
= 25 %)
Conc. [mg/kg]
z-Score (FFP-RSD
= 25 %)
Conc. [mg/kg]
z-Score (FFP-RSD
= 25 %)
Lab code SRM12-
NRL-SRM
Analysed / corr. found max. 8 / 7
Cat.* Conc. [mg/kg]
z-Score (FFP-RSD
= 25 %)
Conc. [mg/kg]
z-Score (FFP-RSD
= 25 %)
Conc. [mg/kg]
z-score (FFP-RSD
= 25 %)
z-score (FFP-RSD
= 25 %)
1 7 / 6 A 0.172 -1.5 22.0 0.6 0.452 -0.3 0.160 -1.8 1 7 / 6 A 15.9 -0.7 0.0027 -0.4 -1.2
2 7 / 5 A 0.198 -1.1 17.3 -0.4 0.470 -0.2 0.268 -0.3 2 7 / 5 A 17.9 -0.3 FN -2.7 -3.0
3 x 4 / 3 A 0.201 -1.0 0.104 -2.6 3 x 4 / 3 A 0.0020 -1.3 -2.0
4 2 / 2 B 0.284 -0.1 4 2 / 2 B 0.00163 -1.8 -2.3
5 0 / 0 B 5 0 / 0 B
6 x 7 / 4 A 0.184 -1.3 0.700 1.7 0.275 -0.3 6 x 7 / 4 A 20.9 0.3 FN -3.2 FN -2.7 -3.0
7 5 / 4 A 0.385 1.7 13.2 -1.2 0.504 0.1 7 5 / 4 A 20.34 0.2
8 6 / 5 B 21.2 0.4 0.790 2.5 8 6 / 5 B 16.7 -0.5 0.093 -0.3 0.0027 -0.4 -1.2
9 3 / 3 A 0.525 0.3 9 3 / 3 A 51.7 6.7 0.0034 0.5 -0.5
10 4 / 3 B 0.546 0.5 10 4 / 3 B 27.9 1.8 0.0067 4.9 2.8
11 0 / 0 B 11 0 / 0 B
12 7 / 5 A 0.220 -0.7 21.0 0.4 0.470 -0.2 0.290 0.0 12 7 / 5 A 21.0 0.4 FN -2.7 -3.0
13 x 4 / 3 A 28.5 2.0 0.280 -0.2 13 x 4 / 3 A 0.0019 -1.5 -2.1
14 4 / 3 A 0.525 0.3 0.306 0.2 14 4 / 3 A 17.78 -0.3
15 1 / 1 B 18.0 -0.2 15 1 / 1 B
16 x 2 / 1 B 20.2 0.2 16 x 2 / 1 B
17 x 2 / 2 A 0.308 0.6 17 x 2 / 2 A 0.0057 3.6 1.8
18 7 / 6 A 0.249 -0.3 17.1 -0.4 0.490 0.0 0.287 -0.1 18 7 / 6 A 20.1 0.2 0.0018 -1.6 -2.2
* Category A/B classification (Cat A was assigned to laboratories that have correctly analysed at least 12 of 13 compulsory compounds on the Target Pesticides List, corretly detected 7 or more out of the 8 compulsory compounds and that have not reported any false positive result)
* Category A/B classification (Cat A was assigned to laboratories that have correctly analysed at least 12 of 13 compulsory compounds on the Target Pesticides List, corretly detected 7 or more out of the 8 compulsory compounds and that have not reported any false positive result)

EUPT-SRM12 | 2017 (Strawberry Purée)
50
OPTIONAL Compound Bifenazate Bromide ion Chlorate Dithianon OPTIONAL Compound Phosphonic acid N-Acetyl glyphosate Carbofuran ‘
(z-scores for information only)
MRRL [mg/kg] 0.02 3 0.02 0.02 MRRL [mg/kg] 0.05 0.02 0.001
Assigned Value [mg/kg] 0.270 19.1 0.490 0.294 Assigned Value [mg/kg] 19.3 0.100 0.0030(based on
entire population,58 numerical results)
0.0039(based on 13 results
with acidic transformation)
CV* 22.1 % 16.0 % 16.2 % 25.3 % CV* 27.0 % 23.2 % 47.1 % 50.2 %
Lab code SRM12-
NRL-SRM
Analysed / corr. found max. 8 / 7
Cat.* Conc. [mg/kg]
z-Score (FFP-RSD
= 25 %)
Conc. [mg/kg]
z-Score (FFP-RSD
= 25 %)
Conc. [mg/kg]
z-Score (FFP-RSD
= 25 %)
Conc. [mg/kg]
z-Score (FFP-RSD
= 25 %)
Lab code SRM12-
NRL-SRM
Analysed / corr. found max. 8 / 7
Cat.* Conc. [mg/kg]
z-Score (FFP-RSD
= 25 %)
Conc. [mg/kg]
z-Score (FFP-RSD
= 25 %)
Conc. [mg/kg]
z-score (FFP-RSD
= 25 %)
z-score (FFP-RSD
= 25 %)
19 x 3 / 3 A 20.2 0.2 0.551 0.5 0.277 -0.2 19 x 3 / 3 A
20 4 / 4 A 0.545 0.5 0.305 0.2 20 4 / 4 A 0.069 -1.2 0.0024 -0.8 -1.6
21 6 / 5 A 0.241 -0.4 0.524 0.3 0.390 1.3 21 6 / 5 A 16.4 -0.6 0.0031 0.1 -0.8
22 5 / 5 A 18.9 0.0 0.510 0.2 0.340 0.6 22 5 / 5 A 22.4 0.7 0.0053 3.1 1.4
23 0 / 0 B 23 0 / 0 B
24 2 / 2 B 18.2 -0.2 0.329 0.5 24 2 / 2 B
25 5 / 4 A 0.320 0.7 0.320 0.4 25 5 / 4 A 0.093 -0.3 0.0061 4.1 2.2
26 7 / 6 A 0.300 0.4 18.0 -0.2 0.570 0.7 0.330 0.5 26 7 / 6 A 25.3 1.3 0.0020 -1.3 -2.0
27 2 / 1 B 0.239 -0.5 27 2 / 1 B FN -2.7 -3.0
28 x 1 / 1 B 0.267 -0.4 28 x 1 / 1 B
29 x 2 / 2 B 0.218 -0.8 29 x 2 / 2 B 0.0034 0.5 -0.5
30 x 3 / 2 A 0.748 6.2 30 x 3 / 2 A 0.0016 -1.9 -2.4
31 0 / 0 B 31 0 / 0 B
32 0 / 0 B 32 0 / 0 B
33 x 8 / 7 A 0.204 -1.0 17.3 -0.4 0.527 0.3 0.307 0.2 33 x 8 / 7 A 17.3 -0.4 0.134 1.3 0.0039 1.2 0.0
34 7 / 6 B 0.326 0.8 10.1 -1.9 1.17 5.6 0.242 -0.7 34 7 / 6 B 67.6 10.0 0.0021 -1.2 -1.9
35 x 8 / 7 A 0.316 0.7 18.0 -0.2 0.447 -0.3 0.306 0.2 35 x 8 / 7 A 19.9 0.1 0.125 1.0 0.0047 2.3 0.8
37 0 / 0 B 37 0 / 0 B
38 2 / 2 B 0.510 0.2 38 2 / 2 B 0.0018 -1.6 -2.2
39 7 / 5 A 0.280 0.1 18.0 -0.2 0.560 0.6 0.410 1.6 39 7 / 5 A 0.121 0.8 FN -2.7 -3.0
40 3 / 2 B 0.325 0.4 40 3 / 2 B 0.0090 8.0 5.2
41 6 / 5 A 0.280 0.1 16.9 -0.5 1.40 15.1 41 6 / 5 A 25.0 1.2 0.0025 -0.7 -1.5
42 6 / 5 A 0.275 0.1 0.160 -4.0 0.529 0.3 42 6 / 5 A 18.85 -0.1 0.00435 1.8 0.4
43 2 / 1 B 0.340 -1.2 43 2 / 1 B
44 x 0 / 0 B 44 x 0 / 0 B
45 4 / 4 A 0.377 1.6 29.6 2.2 0.248 -2.0 45 4 / 4 A 0.0023 -0.9 -1.7
46 3 / 2 A 0.490 0.0 0.0407 -3.4 46 3 / 2 A
47 6 / 5 A 0.285 0.2 19.5 0.1 0.492 0.0 0.297 0.0 47 6 / 5 A 14.2 -1.1
48 5 / 4 A 0.295 0.4 20.79 0.4 0.348 -1.2 48 5 / 4 A 0.0039 1.2 0.0
49 x 2 / 2 A 19.0 0.0 49 x 2 / 2 A 0.0012 -2.4 -2.8
50 4 / 4 B 0.285 0.2 20.3 0.2 0.323 0.4 50 4 / 4 B 0.0015 -2.0 -2.5
51 1 / 1 B 0.380 1.2 51 1 / 1 B
52 8 / 6 A 0.257 -0.2 21.5 0.5 0.488 0.0 0.024 -3.7 52 8 / 6 A 15.3 -0.8 0.139 1.5 FN -2.7 -3.0
53 7 / 6 A 0.234 -0.5 21.483 0.5 0.494 0.0 0.317 0.3 53 7 / 6 A 21.026 0.4 0.0040 1.3 0.1
54 0 / 0 B 54 0 / 0 B
55 0 / 0 B 55 0 / 0 B
56 0 / 0 B 56 0 / 0 B
57 4 / 4 A 0.547 0.5 0.107 -2.5 57 4 / 4 A 5.14 -2.9 0.0046 2.1 0.7
58 7 / 6 A 0.423 2.3 27.4 1.7 0.102 -3.2 0.189 -1.4 58 7 / 6 A 28.0 1.8 0.0041 1.5 0.2
59 0 / 0 B 59 0 / 0 B
60 0 / 0 B 60 0 / 0 B
61 0 / 0 B 61 0 / 0 B
* Category A/B classification (Cat A was assigned to laboratories that have correctly analysed at least 12 of 13 compulsory compounds on the Target Pesticides List, corretly detected 7 or more out of the 8 compulsory compounds and that have not reported any false positive result)
* Category A/B classification (Cat A was assigned to laboratories that have correctly analysed at least 12 of 13 compulsory compounds on the Target Pesticides List, corretly detected 7 or more out of the 8 compulsory compounds and that have not reported any false positive result)
Table 4-9 (cont.): Results reported and z-scores achieved by all participating laboratories for OPTIONAL compounds

4. RESULTS / Assessment of Laboratory Performance
51
Resu
lts
4
OPTIONAL Compound Bifenazate Bromide ion Chlorate Dithianon OPTIONAL Compound Phosphonic acid N-Acetyl glyphosate Carbofuran ‘
(z-scores for information only)
MRRL [mg/kg] 0.02 3 0.02 0.02 MRRL [mg/kg] 0.05 0.02 0.001
Assigned Value [mg/kg] 0.270 19.1 0.490 0.294 Assigned Value [mg/kg] 19.3 0.100 0.0030(based on
entire population,58 numerical results)
0.0039(based on 13 results
with acidic transformation)
CV* 22.1 % 16.0 % 16.2 % 25.3 % CV* 27.0 % 23.2 % 47.1 % 50.2 %
Lab code SRM12-
NRL-SRM
Analysed / corr. found max. 8 / 7
Cat.* Conc. [mg/kg]
z-Score (FFP-RSD
= 25 %)
Conc. [mg/kg]
z-Score (FFP-RSD
= 25 %)
Conc. [mg/kg]
z-Score (FFP-RSD
= 25 %)
Conc. [mg/kg]
z-Score (FFP-RSD
= 25 %)
Lab code SRM12-
NRL-SRM
Analysed / corr. found max. 8 / 7
Cat.* Conc. [mg/kg]
z-Score (FFP-RSD
= 25 %)
Conc. [mg/kg]
z-Score (FFP-RSD
= 25 %)
Conc. [mg/kg]
z-score (FFP-RSD
= 25 %)
z-score (FFP-RSD
= 25 %)
19 x 3 / 3 A 20.2 0.2 0.551 0.5 0.277 -0.2 19 x 3 / 3 A
20 4 / 4 A 0.545 0.5 0.305 0.2 20 4 / 4 A 0.069 -1.2 0.0024 -0.8 -1.6
21 6 / 5 A 0.241 -0.4 0.524 0.3 0.390 1.3 21 6 / 5 A 16.4 -0.6 0.0031 0.1 -0.8
22 5 / 5 A 18.9 0.0 0.510 0.2 0.340 0.6 22 5 / 5 A 22.4 0.7 0.0053 3.1 1.4
23 0 / 0 B 23 0 / 0 B
24 2 / 2 B 18.2 -0.2 0.329 0.5 24 2 / 2 B
25 5 / 4 A 0.320 0.7 0.320 0.4 25 5 / 4 A 0.093 -0.3 0.0061 4.1 2.2
26 7 / 6 A 0.300 0.4 18.0 -0.2 0.570 0.7 0.330 0.5 26 7 / 6 A 25.3 1.3 0.0020 -1.3 -2.0
27 2 / 1 B 0.239 -0.5 27 2 / 1 B FN -2.7 -3.0
28 x 1 / 1 B 0.267 -0.4 28 x 1 / 1 B
29 x 2 / 2 B 0.218 -0.8 29 x 2 / 2 B 0.0034 0.5 -0.5
30 x 3 / 2 A 0.748 6.2 30 x 3 / 2 A 0.0016 -1.9 -2.4
31 0 / 0 B 31 0 / 0 B
32 0 / 0 B 32 0 / 0 B
33 x 8 / 7 A 0.204 -1.0 17.3 -0.4 0.527 0.3 0.307 0.2 33 x 8 / 7 A 17.3 -0.4 0.134 1.3 0.0039 1.2 0.0
34 7 / 6 B 0.326 0.8 10.1 -1.9 1.17 5.6 0.242 -0.7 34 7 / 6 B 67.6 10.0 0.0021 -1.2 -1.9
35 x 8 / 7 A 0.316 0.7 18.0 -0.2 0.447 -0.3 0.306 0.2 35 x 8 / 7 A 19.9 0.1 0.125 1.0 0.0047 2.3 0.8
37 0 / 0 B 37 0 / 0 B
38 2 / 2 B 0.510 0.2 38 2 / 2 B 0.0018 -1.6 -2.2
39 7 / 5 A 0.280 0.1 18.0 -0.2 0.560 0.6 0.410 1.6 39 7 / 5 A 0.121 0.8 FN -2.7 -3.0
40 3 / 2 B 0.325 0.4 40 3 / 2 B 0.0090 8.0 5.2
41 6 / 5 A 0.280 0.1 16.9 -0.5 1.40 15.1 41 6 / 5 A 25.0 1.2 0.0025 -0.7 -1.5
42 6 / 5 A 0.275 0.1 0.160 -4.0 0.529 0.3 42 6 / 5 A 18.85 -0.1 0.00435 1.8 0.4
43 2 / 1 B 0.340 -1.2 43 2 / 1 B
44 x 0 / 0 B 44 x 0 / 0 B
45 4 / 4 A 0.377 1.6 29.6 2.2 0.248 -2.0 45 4 / 4 A 0.0023 -0.9 -1.7
46 3 / 2 A 0.490 0.0 0.0407 -3.4 46 3 / 2 A
47 6 / 5 A 0.285 0.2 19.5 0.1 0.492 0.0 0.297 0.0 47 6 / 5 A 14.2 -1.1
48 5 / 4 A 0.295 0.4 20.79 0.4 0.348 -1.2 48 5 / 4 A 0.0039 1.2 0.0
49 x 2 / 2 A 19.0 0.0 49 x 2 / 2 A 0.0012 -2.4 -2.8
50 4 / 4 B 0.285 0.2 20.3 0.2 0.323 0.4 50 4 / 4 B 0.0015 -2.0 -2.5
51 1 / 1 B 0.380 1.2 51 1 / 1 B
52 8 / 6 A 0.257 -0.2 21.5 0.5 0.488 0.0 0.024 -3.7 52 8 / 6 A 15.3 -0.8 0.139 1.5 FN -2.7 -3.0
53 7 / 6 A 0.234 -0.5 21.483 0.5 0.494 0.0 0.317 0.3 53 7 / 6 A 21.026 0.4 0.0040 1.3 0.1
54 0 / 0 B 54 0 / 0 B
55 0 / 0 B 55 0 / 0 B
56 0 / 0 B 56 0 / 0 B
57 4 / 4 A 0.547 0.5 0.107 -2.5 57 4 / 4 A 5.14 -2.9 0.0046 2.1 0.7
58 7 / 6 A 0.423 2.3 27.4 1.7 0.102 -3.2 0.189 -1.4 58 7 / 6 A 28.0 1.8 0.0041 1.5 0.2
59 0 / 0 B 59 0 / 0 B
60 0 / 0 B 60 0 / 0 B
61 0 / 0 B 61 0 / 0 B
* Category A/B classification (Cat A was assigned to laboratories that have correctly analysed at least 12 of 13 compulsory compounds on the Target Pesticides List, corretly detected 7 or more out of the 8 compulsory compounds and that have not reported any false positive result)
* Category A/B classification (Cat A was assigned to laboratories that have correctly analysed at least 12 of 13 compulsory compounds on the Target Pesticides List, corretly detected 7 or more out of the 8 compulsory compounds and that have not reported any false positive result)
Table 4-9 (cont.): Results reported and z-scores achieved by all participating laboratories for OPTIONAL compounds

EUPT-SRM12 | 2017 (Strawberry Purée)
52
OPTIONAL Compound Bifenazate Bromide ion Chlorate Dithianon OPTIONAL Compound Phosphonic acid N-Acetyl glyphosate Carbofuran ‘
(z-scores for information only)
MRRL [mg/kg] 0.02 3 0.02 0.02 MRRL [mg/kg] 0.05 0.02 0.001
Assigned Value [mg/kg] 0.270 19.1 0.490 0.294 Assigned Value [mg/kg] 19.3 0.100 0.0030(based on
entire population,58 numerical results)
0.0039(based on 13 results
with acidic transformation)
CV* 22.1 % 16.0 % 16.2 % 25.3 % CV* 27.0 % 23.2 % 47.1 % 50.2 %
Lab code SRM12-
NRL-SRM
Analysed / corr. found max. 8 / 7
Cat.* Conc. [mg/kg]
z-Score (FFP-RSD
= 25 %)
Conc. [mg/kg]
z-Score (FFP-RSD
= 25 %)
Conc. [mg/kg]
z-Score (FFP-RSD
= 25 %)
Conc. [mg/kg]
z-Score (FFP-RSD
= 25 %)
Lab code SRM12-
NRL-SRM
Analysed / corr. found max. 8 / 7
Cat.* Conc. [mg/kg]
z-Score (FFP-RSD
= 25 %)
Conc. [mg/kg]
z-Score (FFP-RSD
= 25 %)
Conc. [mg/kg]
z-score (FFP-RSD
= 25 %)
z-score (FFP-RSD
= 25 %)
62 x 2 / 0 B 62 x 2 / 0 B FN -2.7 -3.0
63 6 / 6 A 0.304 0.5 31.0 2.5 0.221 -2.2 0.252 -0.6 63 6 / 6 A 0.185 -4.0 0.0090 8.0 5.2
64 2 / 2 B 0.299 0.1 64 2 / 2 B 19.1 0.0
65 0 / 0 B 65 0 / 0 B
66 x 4 / 3 A 19.7 0.1 0.695 1.7 66 x 4 / 3 A 0.0026 -0.5 -1.4
67 5 / 4 A 0.402 -0.7 0.317 0.3 67 5 / 4 A 13.7 -1.2 0.0025 -0.7 -1.5
68 1 / 0 B 68 1 / 0 B
69 2 / 2 B 19.4 0.1 69 2 / 2 B 0.0021 -1.2 -1.9
70 6 / 5 A 0.630 5.3 0.128 -3.0 0.350 0.8 70 6 / 5 A 9.10 -2.1 0.0051 2.8 1.2
71 6 / 5 B 0.245 -0.4 29.3 2.1 0.411 -0.6 0.179 -1.6 71 6 / 5 B 0.0028 -0.3 -1.1
72 6 / 5 A 0.187 -1.2 0.554 0.5 0.384 1.2 72 6 / 5 A 18.95 -0.1 0.0018 -1.6 -2.2
73 x 2 / 1 B 0.391 -0.8 73 x 2 / 1 B FN -2.7 -3.0
74 5 / 4 A 0.340 1.0 19.9 0.2 0.277 -0.2 74 5 / 4 A 0.0029 -0.1 -1.0
75 x 2 / 1 A 0.019 -3.7 75 x 2 / 1 A FN -2.7 -3.0
76 8 / 7 A 0.227 -0.6 16.35 -0.6 0.480 -0.1 0.285 -0.1 76 8 / 7 A 18.05 -0.3 0.093 -0.3 0.0021 -1.2 -1.9
77 0 / 0 B 77 0 / 0 B
78 5 / 5 A 0.245 -0.4 18.1 -0.2 0.471 -0.2 78 5 / 5 A 17.4 -0.4 0.00411 1.5 0.2
79 6 / 5 B 10.6 -1.8 0.501 0.1 0.868 7.8 79 6 / 5 B 23.03 0.8 0.0020 -1.3 -2.0
80 0 / 0 B 80 0 / 0 B
81 x 6 / 6 B 19.7 0.1 0.400 -0.7 0.282 -0.2 81 x 6 / 6 B 21.0 0.4 0.106 0.2 0.0027 -0.4 -1.2
82 0 / 0 B 82 0 / 0 B
83 x 0 / 0 A 83 x 0 / 0 A
84 7 / 6 A 0.290 0.3 20.0 0.2 0.540 0.4 0.280 -0.2 84 7 / 6 A 22.0 0.6 0.0049 2.5 1.0
85 x 0 / 0 B 85 x 0 / 0 B
86 4 / 3 B 0.239 -0.5 0.468 -0.2 86 4 / 3 B 14.5 -1.0
87 0 / 0 B 87 0 / 0 B
88 1 / 1 A 0.485 0.0 88 1 / 1 A
89 2 / 2 B 0.397 1.9 0.238 -0.8 89 2 / 2 B
90 5 / 4 A 0.482 -0.1 2.57 31.0 90 5 / 4 A 9.95 -1.9 0.0038 1.1 -0.1
91 x 2 / 2 B 14.8 -0.9 0.260 -0.5 91 x 2 / 2 B
92 x 5 / 5 A 0.293 0.3 0.507 0.1 0.313 0.3 92 x 5 / 5 A 20.0 0.2 0.0024 -0.8 -1.6
93 0 / 0 B 93 0 / 0 B
94 4 / 4 A 11.9 -1.5 0.549 0.5 0.405 1.5 94 4 / 4 A 22.7 0.7
95 7 / 5 A 0.237 -0.5 21.2 0.4 0.433 -0.5 -3.9 95 7 / 5 A 14.6 -1.0 0.0007 -3.1 -3.3
96 x 0 / 0 A 96 x 0 / 0 A
97 8 / 6 A 0.350 1.2 24.4 1.1 0.502 0.1 0.300 0.1 97 8 / 6 A 20.9 0.3 0.093 -0.3 FN -2.7 -3.0
98 x 5 / 4 A 17.8 -0.3 0.441 -0.4 0.299 0.1 98 x 5 / 4 A 21.2 0.4 FN -2.7 -3.0
99 7 / 6 A 0.201 -1.0 16.8 -0.5 0.562 0.6 99 7 / 6 A 7.91 -2.4 0.084 -0.7 0.0019 -1.5 -2.1
100 0 / 0 B 100 0 / 0 B
101 0 / 0 B 101 0 / 0 B
102 7 / 6 A 0.230 -0.6 18.1 -0.2 0.730 2.0 0.250 -0.6 102 7 / 6 A 20.5 0.3 0.0017 -1.7 -2.3
* Category A/B classification (Cat A was assigned to laboratories that have correctly analysed at least 12 of 13 compulsory compounds on the Target Pesticides List, corretly detected 7 or more out of the 8 compulsory compounds and that have not reported any false positive result)
* Category A/B classification (Cat A was assigned to laboratories that have correctly analysed at least 12 of 13 compulsory compounds on the Target Pesticides List, corretly detected 7 or more out of the 8 compulsory compounds and that have not reported any false positive result)
Table 4-9 (cont.): Results reported and z-scores achieved by all participating laboratories for OPTIONAL compounds
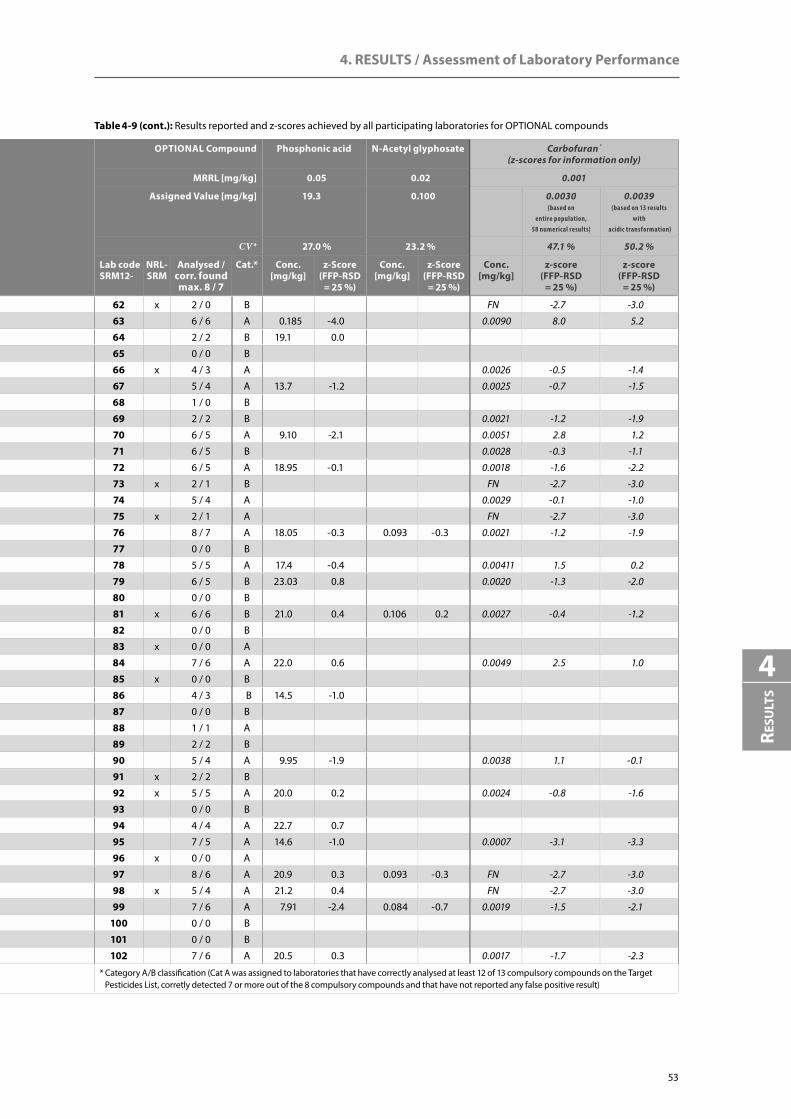
4. RESULTS / Assessment of Laboratory Performance
53
Resu
lts
4
Table 4-9 (cont.): Results reported and z-scores achieved by all participating laboratories for OPTIONAL compounds
OPTIONAL Compound Bifenazate Bromide ion Chlorate Dithianon OPTIONAL Compound Phosphonic acid N-Acetyl glyphosate Carbofuran ‘
(z-scores for information only)
MRRL [mg/kg] 0.02 3 0.02 0.02 MRRL [mg/kg] 0.05 0.02 0.001
Assigned Value [mg/kg] 0.270 19.1 0.490 0.294 Assigned Value [mg/kg] 19.3 0.100 0.0030(based on
entire population,58 numerical results)
0.0039(based on 13 results
with acidic transformation)
CV* 22.1 % 16.0 % 16.2 % 25.3 % CV* 27.0 % 23.2 % 47.1 % 50.2 %
Lab code SRM12-
NRL-SRM
Analysed / corr. found max. 8 / 7
Cat.* Conc. [mg/kg]
z-Score (FFP-RSD
= 25 %)
Conc. [mg/kg]
z-Score (FFP-RSD
= 25 %)
Conc. [mg/kg]
z-Score (FFP-RSD
= 25 %)
Conc. [mg/kg]
z-Score (FFP-RSD
= 25 %)
Lab code SRM12-
NRL-SRM
Analysed / corr. found max. 8 / 7
Cat.* Conc. [mg/kg]
z-Score (FFP-RSD
= 25 %)
Conc. [mg/kg]
z-Score (FFP-RSD
= 25 %)
Conc. [mg/kg]
z-score (FFP-RSD
= 25 %)
z-score (FFP-RSD
= 25 %)
62 x 2 / 0 B 62 x 2 / 0 B FN -2.7 -3.0
63 6 / 6 A 0.304 0.5 31.0 2.5 0.221 -2.2 0.252 -0.6 63 6 / 6 A 0.185 -4.0 0.0090 8.0 5.2
64 2 / 2 B 0.299 0.1 64 2 / 2 B 19.1 0.0
65 0 / 0 B 65 0 / 0 B
66 x 4 / 3 A 19.7 0.1 0.695 1.7 66 x 4 / 3 A 0.0026 -0.5 -1.4
67 5 / 4 A 0.402 -0.7 0.317 0.3 67 5 / 4 A 13.7 -1.2 0.0025 -0.7 -1.5
68 1 / 0 B 68 1 / 0 B
69 2 / 2 B 19.4 0.1 69 2 / 2 B 0.0021 -1.2 -1.9
70 6 / 5 A 0.630 5.3 0.128 -3.0 0.350 0.8 70 6 / 5 A 9.10 -2.1 0.0051 2.8 1.2
71 6 / 5 B 0.245 -0.4 29.3 2.1 0.411 -0.6 0.179 -1.6 71 6 / 5 B 0.0028 -0.3 -1.1
72 6 / 5 A 0.187 -1.2 0.554 0.5 0.384 1.2 72 6 / 5 A 18.95 -0.1 0.0018 -1.6 -2.2
73 x 2 / 1 B 0.391 -0.8 73 x 2 / 1 B FN -2.7 -3.0
74 5 / 4 A 0.340 1.0 19.9 0.2 0.277 -0.2 74 5 / 4 A 0.0029 -0.1 -1.0
75 x 2 / 1 A 0.019 -3.7 75 x 2 / 1 A FN -2.7 -3.0
76 8 / 7 A 0.227 -0.6 16.35 -0.6 0.480 -0.1 0.285 -0.1 76 8 / 7 A 18.05 -0.3 0.093 -0.3 0.0021 -1.2 -1.9
77 0 / 0 B 77 0 / 0 B
78 5 / 5 A 0.245 -0.4 18.1 -0.2 0.471 -0.2 78 5 / 5 A 17.4 -0.4 0.00411 1.5 0.2
79 6 / 5 B 10.6 -1.8 0.501 0.1 0.868 7.8 79 6 / 5 B 23.03 0.8 0.0020 -1.3 -2.0
80 0 / 0 B 80 0 / 0 B
81 x 6 / 6 B 19.7 0.1 0.400 -0.7 0.282 -0.2 81 x 6 / 6 B 21.0 0.4 0.106 0.2 0.0027 -0.4 -1.2
82 0 / 0 B 82 0 / 0 B
83 x 0 / 0 A 83 x 0 / 0 A
84 7 / 6 A 0.290 0.3 20.0 0.2 0.540 0.4 0.280 -0.2 84 7 / 6 A 22.0 0.6 0.0049 2.5 1.0
85 x 0 / 0 B 85 x 0 / 0 B
86 4 / 3 B 0.239 -0.5 0.468 -0.2 86 4 / 3 B 14.5 -1.0
87 0 / 0 B 87 0 / 0 B
88 1 / 1 A 0.485 0.0 88 1 / 1 A
89 2 / 2 B 0.397 1.9 0.238 -0.8 89 2 / 2 B
90 5 / 4 A 0.482 -0.1 2.57 31.0 90 5 / 4 A 9.95 -1.9 0.0038 1.1 -0.1
91 x 2 / 2 B 14.8 -0.9 0.260 -0.5 91 x 2 / 2 B
92 x 5 / 5 A 0.293 0.3 0.507 0.1 0.313 0.3 92 x 5 / 5 A 20.0 0.2 0.0024 -0.8 -1.6
93 0 / 0 B 93 0 / 0 B
94 4 / 4 A 11.9 -1.5 0.549 0.5 0.405 1.5 94 4 / 4 A 22.7 0.7
95 7 / 5 A 0.237 -0.5 21.2 0.4 0.433 -0.5 -3.9 95 7 / 5 A 14.6 -1.0 0.0007 -3.1 -3.3
96 x 0 / 0 A 96 x 0 / 0 A
97 8 / 6 A 0.350 1.2 24.4 1.1 0.502 0.1 0.300 0.1 97 8 / 6 A 20.9 0.3 0.093 -0.3 FN -2.7 -3.0
98 x 5 / 4 A 17.8 -0.3 0.441 -0.4 0.299 0.1 98 x 5 / 4 A 21.2 0.4 FN -2.7 -3.0
99 7 / 6 A 0.201 -1.0 16.8 -0.5 0.562 0.6 99 7 / 6 A 7.91 -2.4 0.084 -0.7 0.0019 -1.5 -2.1
100 0 / 0 B 100 0 / 0 B
101 0 / 0 B 101 0 / 0 B
102 7 / 6 A 0.230 -0.6 18.1 -0.2 0.730 2.0 0.250 -0.6 102 7 / 6 A 20.5 0.3 0.0017 -1.7 -2.3
* Category A/B classification (Cat A was assigned to laboratories that have correctly analysed at least 12 of 13 compulsory compounds on the Target Pesticides List, corretly detected 7 or more out of the 8 compulsory compounds and that have not reported any false positive result)
* Category A/B classification (Cat A was assigned to laboratories that have correctly analysed at least 12 of 13 compulsory compounds on the Target Pesticides List, corretly detected 7 or more out of the 8 compulsory compounds and that have not reported any false positive result)
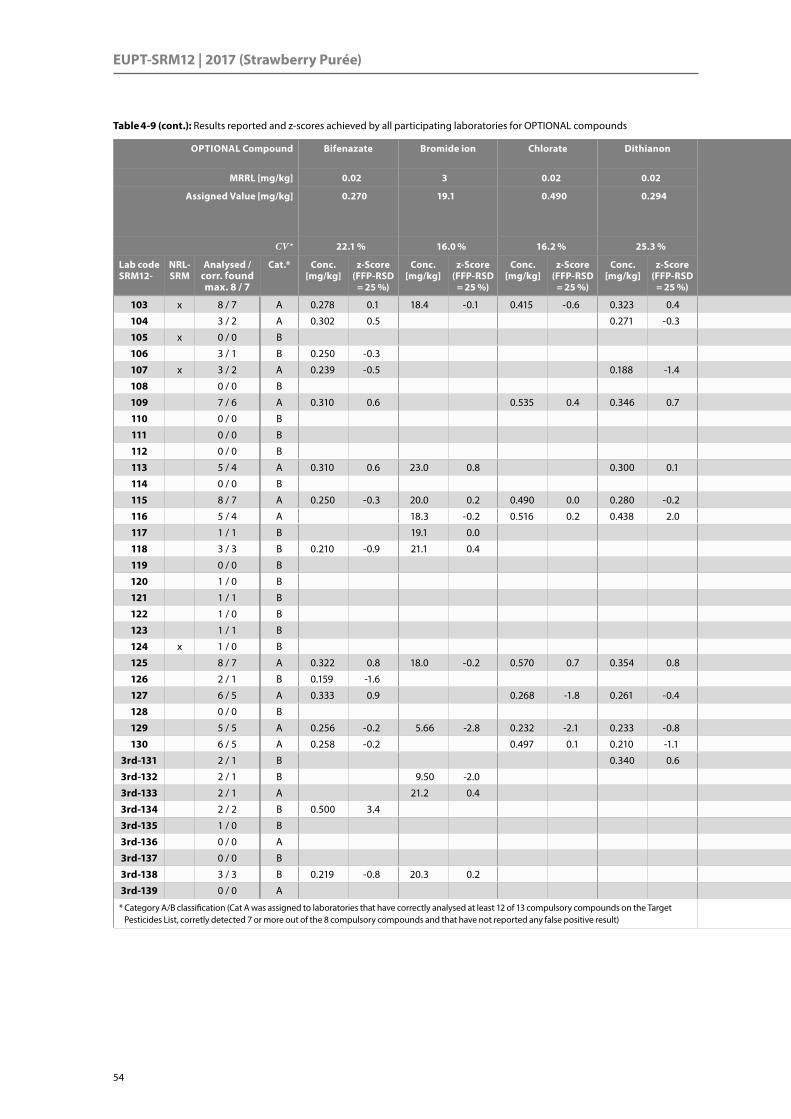
EUPT-SRM12 | 2017 (Strawberry Purée)
54
OPTIONAL Compound Bifenazate Bromide ion Chlorate Dithianon OPTIONAL Compound Phosphonic acid N-Acetyl glyphosate Carbofuran ‘
(z-scores for information only)
MRRL [mg/kg] 0.02 3 0.02 0.02 MRRL [mg/kg] 0.05 0.02 0.001
Assigned Value [mg/kg] 0.270 19.1 0.490 0.294 Assigned Value [mg/kg] 19.3 0.100 0.0030(based on
entire population,58 numerical results)
0.0039(based on 13 results
with acidic transformation)
CV* 22.1 % 16.0 % 16.2 % 25.3 % CV* 27.0 % 23.2 % 47.1 % 50.2 %
Lab code SRM12-
NRL-SRM
Analysed / corr. found max. 8 / 7
Cat.* Conc. [mg/kg]
z-Score (FFP-RSD
= 25 %)
Conc. [mg/kg]
z-Score (FFP-RSD
= 25 %)
Conc. [mg/kg]
z-Score (FFP-RSD
= 25 %)
Conc. [mg/kg]
z-Score (FFP-RSD
= 25 %)
Lab code SRM12-
NRL-SRM
Analysed / corr. found max. 8 / 7
Cat.* Conc. [mg/kg]
z-Score (FFP-RSD
= 25 %)
Conc. [mg/kg]
z-Score (FFP-RSD
= 25 %)
Conc. [mg/kg]
z-score (FFP-RSD
= 25 %)
z-score (FFP-RSD
= 25 %)
103 x 8 / 7 A 0.278 0.1 18.4 -0.1 0.415 -0.6 0.323 0.4 103 x 8 / 7 A 20.4 0.2 0.094 -0.3 0.0032 0.3 -0.7
104 3 / 2 A 0.302 0.5 0.271 -0.3 104 3 / 2 A
105 x 0 / 0 B 105 x 0 / 0 B
106 3 / 1 B 0.250 -0.3 106 3 / 1 B FN -2.7 -3.0
107 x 3 / 2 A 0.239 -0.5 0.188 -1.4 107 x 3 / 2 A FN -2.7 -3.0
108 0 / 0 B 108 0 / 0 B
109 7 / 6 A 0.310 0.6 0.535 0.4 0.346 0.7 109 7 / 6 A 22.5 0.7 0.09 -0.4 0.0031 0.1 -0.8
110 0 / 0 B 110 0 / 0 B
111 0 / 0 B 111 0 / 0 B
112 0 / 0 B 112 0 / 0 B
113 5 / 4 A 0.310 0.6 23.0 0.8 0.300 0.1 113 5 / 4 A 0.0032 0.3 -0.7
114 0 / 0 B 114 0 / 0 B
115 8 / 7 A 0.250 -0.3 20.0 0.2 0.490 0.0 0.280 -0.2 115 8 / 7 A 29.0 2.0 0.071 -1.2 0.0017 -1.7 -2.3
116 5 / 4 A 18.3 -0.2 0.516 0.2 0.438 2.0 116 5 / 4 A 17.4 -0.4
117 1 / 1 B 19.1 0.0 117 1 / 1 B
118 3 / 3 B 0.210 -0.9 21.1 0.4 118 3 / 3 B 0.033 40.0 29.6
119 0 / 0 B 119 0 / 0 B
120 1 / 0 B 120 1 / 0 B FN -2.7 -3.0
121 1 / 1 B 121 1 / 1 B 0.0023 -0.9 -1.7
122 1 / 0 B 122 1 / 0 B
123 1 / 1 B 123 1 / 1 B 0.0013 -2.3 -2.7
124 x 1 / 0 B 124 x 1 / 0 B FN -2.7 -3.0
125 8 / 7 A 0.322 0.8 18.0 -0.2 0.570 0.7 0.354 0.8 125 8 / 7 A 18.0 -0.3 0.104 0.1 0.0027 -0.4 -1.2
126 2 / 1 B 0.159 -1.6 126 2 / 1 B FN -2.7 -3.0
127 6 / 5 A 0.333 0.9 0.268 -1.8 0.261 -0.4 127 6 / 5 A 20.1 0.2 0.0027 -0.4 -1.2
128 0 / 0 B 128 0 / 0 B
129 5 / 5 A 0.256 -0.2 5.66 -2.8 0.232 -2.1 0.233 -0.8 129 5 / 5 A 8.41 -2.3
130 6 / 5 A 0.258 -0.2 0.497 0.1 0.210 -1.1 130 6 / 5 A 26.5 1.5 0.0022 -1.1 -1.8
3rd-131 2 / 1 B 0.340 0.6 3rd-131 2 / 1 B
3rd-132 2 / 1 B 9.50 -2.0 3rd-132 2 / 1 B FN -2.7 -3.0
3rd-133 2 / 1 A 21.2 0.4 3rd-133 2 / 1 A
3rd-134 2 / 2 B 0.500 3.4 3rd-134 2 / 2 B 0.0030 0.0 -0.9
3rd-135 1 / 0 B 3rd-135 1 / 0 B FN -2.7 -3.0
3rd-136 0 / 0 A 3rd-136 0 / 0 A
3rd-137 0 / 0 B 3rd-137 0 / 0 B
3rd-138 3 / 3 B 0.219 -0.8 20.3 0.2 3rd-138 3 / 3 B 17.4 -0.4
3rd-139 0 / 0 A 3rd-139 0 / 0 A
* Category A/B classification (Cat A was assigned to laboratories that have correctly analysed at least 12 of 13 compulsory compounds on the Target Pesticides List, corretly detected 7 or more out of the 8 compulsory compounds and that have not reported any false positive result)
* Category A/B classification (Cat A was assigned to laboratories that have correctly analysed at least 12 of 13 compulsory compounds on the Target Pesticides List, corretly detected 7 or more out of the 8 compulsory compounds and that have not reported any false positive result)
Table 4-9 (cont.): Results reported and z-scores achieved by all participating laboratories for OPTIONAL compounds

4. RESULTS / Assessment of Laboratory Performance
55
Resu
lts
4
Table 4-9 (cont.): Results reported and z-scores achieved by all participating laboratories for OPTIONAL compounds
OPTIONAL Compound Bifenazate Bromide ion Chlorate Dithianon OPTIONAL Compound Phosphonic acid N-Acetyl glyphosate Carbofuran ‘
(z-scores for information only)
MRRL [mg/kg] 0.02 3 0.02 0.02 MRRL [mg/kg] 0.05 0.02 0.001
Assigned Value [mg/kg] 0.270 19.1 0.490 0.294 Assigned Value [mg/kg] 19.3 0.100 0.0030(based on
entire population,58 numerical results)
0.0039(based on 13 results
with acidic transformation)
CV* 22.1 % 16.0 % 16.2 % 25.3 % CV* 27.0 % 23.2 % 47.1 % 50.2 %
Lab code SRM12-
NRL-SRM
Analysed / corr. found max. 8 / 7
Cat.* Conc. [mg/kg]
z-Score (FFP-RSD
= 25 %)
Conc. [mg/kg]
z-Score (FFP-RSD
= 25 %)
Conc. [mg/kg]
z-Score (FFP-RSD
= 25 %)
Conc. [mg/kg]
z-Score (FFP-RSD
= 25 %)
Lab code SRM12-
NRL-SRM
Analysed / corr. found max. 8 / 7
Cat.* Conc. [mg/kg]
z-Score (FFP-RSD
= 25 %)
Conc. [mg/kg]
z-Score (FFP-RSD
= 25 %)
Conc. [mg/kg]
z-score (FFP-RSD
= 25 %)
z-score (FFP-RSD
= 25 %)
103 x 8 / 7 A 0.278 0.1 18.4 -0.1 0.415 -0.6 0.323 0.4 103 x 8 / 7 A 20.4 0.2 0.094 -0.3 0.0032 0.3 -0.7
104 3 / 2 A 0.302 0.5 0.271 -0.3 104 3 / 2 A
105 x 0 / 0 B 105 x 0 / 0 B
106 3 / 1 B 0.250 -0.3 106 3 / 1 B FN -2.7 -3.0
107 x 3 / 2 A 0.239 -0.5 0.188 -1.4 107 x 3 / 2 A FN -2.7 -3.0
108 0 / 0 B 108 0 / 0 B
109 7 / 6 A 0.310 0.6 0.535 0.4 0.346 0.7 109 7 / 6 A 22.5 0.7 0.09 -0.4 0.0031 0.1 -0.8
110 0 / 0 B 110 0 / 0 B
111 0 / 0 B 111 0 / 0 B
112 0 / 0 B 112 0 / 0 B
113 5 / 4 A 0.310 0.6 23.0 0.8 0.300 0.1 113 5 / 4 A 0.0032 0.3 -0.7
114 0 / 0 B 114 0 / 0 B
115 8 / 7 A 0.250 -0.3 20.0 0.2 0.490 0.0 0.280 -0.2 115 8 / 7 A 29.0 2.0 0.071 -1.2 0.0017 -1.7 -2.3
116 5 / 4 A 18.3 -0.2 0.516 0.2 0.438 2.0 116 5 / 4 A 17.4 -0.4
117 1 / 1 B 19.1 0.0 117 1 / 1 B
118 3 / 3 B 0.210 -0.9 21.1 0.4 118 3 / 3 B 0.033 40.0 29.6
119 0 / 0 B 119 0 / 0 B
120 1 / 0 B 120 1 / 0 B FN -2.7 -3.0
121 1 / 1 B 121 1 / 1 B 0.0023 -0.9 -1.7
122 1 / 0 B 122 1 / 0 B
123 1 / 1 B 123 1 / 1 B 0.0013 -2.3 -2.7
124 x 1 / 0 B 124 x 1 / 0 B FN -2.7 -3.0
125 8 / 7 A 0.322 0.8 18.0 -0.2 0.570 0.7 0.354 0.8 125 8 / 7 A 18.0 -0.3 0.104 0.1 0.0027 -0.4 -1.2
126 2 / 1 B 0.159 -1.6 126 2 / 1 B FN -2.7 -3.0
127 6 / 5 A 0.333 0.9 0.268 -1.8 0.261 -0.4 127 6 / 5 A 20.1 0.2 0.0027 -0.4 -1.2
128 0 / 0 B 128 0 / 0 B
129 5 / 5 A 0.256 -0.2 5.66 -2.8 0.232 -2.1 0.233 -0.8 129 5 / 5 A 8.41 -2.3
130 6 / 5 A 0.258 -0.2 0.497 0.1 0.210 -1.1 130 6 / 5 A 26.5 1.5 0.0022 -1.1 -1.8
3rd-131 2 / 1 B 0.340 0.6 3rd-131 2 / 1 B
3rd-132 2 / 1 B 9.50 -2.0 3rd-132 2 / 1 B FN -2.7 -3.0
3rd-133 2 / 1 A 21.2 0.4 3rd-133 2 / 1 A
3rd-134 2 / 2 B 0.500 3.4 3rd-134 2 / 2 B 0.0030 0.0 -0.9
3rd-135 1 / 0 B 3rd-135 1 / 0 B FN -2.7 -3.0
3rd-136 0 / 0 A 3rd-136 0 / 0 A
3rd-137 0 / 0 B 3rd-137 0 / 0 B
3rd-138 3 / 3 B 0.219 -0.8 20.3 0.2 3rd-138 3 / 3 B 17.4 -0.4
3rd-139 0 / 0 A 3rd-139 0 / 0 A
* Category A/B classification (Cat A was assigned to laboratories that have correctly analysed at least 12 of 13 compulsory compounds on the Target Pesticides List, corretly detected 7 or more out of the 8 compulsory compounds and that have not reported any false positive result)
* Category A/B classification (Cat A was assigned to laboratories that have correctly analysed at least 12 of 13 compulsory compounds on the Target Pesticides List, corretly detected 7 or more out of the 8 compulsory compounds and that have not reported any false positive result)

EUPT-SRM12 | 2017 (Strawberry Purée)
56
ADDITIONAL Compound Captan (sum) Folpet (sum) THPI Phthalimide
MRRL [mg/kg] – – – –
Assigned Value [mg/kg] 0.302 1.195 0.110 0.446
CV* 25.2 % 21.1 % 30.5 % 21.6 %
Lab code SRM12-
NRL-SRM
Analysed / corr. found max. 8 / 7
Cat.* Conc. [mg/kg]
z-Score (FFP-RSD
= 25 %)
Conc. [mg/kg]
z-Score (FFP-RSD
= 25 %)
Conc. [mg/kg]
z-Score (FFP-RSD
= 25 %)
Conc. [mg/kg]
z-Score (FFP-RSD
= 25 %)
1 4 / 4 A 0.252 -0.7 0.961 -0.8 0.099 -0.4 0.382 -0.6
2 4 / 4 A 0.277 -0.3 1.12 -0.3 0.0946 -0.6 0.382 -0.6
3 x 0 / 0 A
4 4 / 4 B 0.246 -0.7 1.21 0.1 0.0874 -0.8 0.454 0.1
5 0 / 0 B
6 x 0 / 0 A
7 4 / 4 A 0.243 -0.8 0.973 -0.7 0.083 -1.0 0.341 -0.9
8 0 / 0 B
9 2 / 2 A 0.137 -2.2 0.0636 -1.7
10 0 / 0 B
11 0 / 0 B
12 0 / 0 A
13 x 2 / 2 A 1.93 2.5 0.813 3.3
14 4 / 4 A 0.328 0.3 1.24 0.2 0.125 0.5 0.441 0.0
15 0 / 0 B
16 x 0 / 0 B
17 x 4 / 4 A 0.251 -0.7 1.19 0.0 0.0823 -1.0 0.441 0.0
18 4 / 4 A 0.313 0.2 1.255 0.2 0.108 -0.1 0.433 -0.1
19 x 4 / 4 A 0.351 0.7 1.54 1.2 0.131 0.7 0.558 1.0
20 4 / 4 A 0.324 0.3 1.196 0.0 0.119 0.3 0.397 -0.4
21 4 / 4 A 0.313 0.2 1.30 0.4 0.115 0.2 0.470 0.2
22 4 / 4 A 0.390 1.2 1.37 0.6 0.153 1.5 0.488 0.4
23 0 / 0 B
24 0 / 0 B
25 4 / 4 A 0.478 2.3 1.736 1.8 0.196 3.1 0.637 1.7
26 4 / 4 A 0.200 -1.3 2.00 2.7 0.062 -1.8 0.550 0.9
27 2 / 2 B 0.0759 -3.7 0.0738 -1.3
28 x 0 / 0 B
29 x 4 / 4 B 0.315 0.2 1.16 -0.1 0.127 0.6 0.497 0.5
30 x 0 / 0 A
31 1 / 1 B 0.516 0.6
32 0 / 0 B
33 x 4 / 4 A 0.267 -0.5 1.12 -0.3 0.093 -0.6 0.386 -0.5
34 2 / 2 B 0.283 6.3 0.602 1.4
35 x 4 / 4 A 0.341 0.5 1.44 0.8 0.119 0.3 0.437 -0.1
37 0 / 0 B
38 0 / 0 B
39 4 / 4 A 0.404 1.4 2.58 4.6 0.158 1.7 1.50 9.5
40 0 / 0 B
41 4 / 4 A 0.316 0.2 0.754 -1.5 0.134 0.9 0.260 -1.7
42 4 / 4 A 0.336 0.5 1.074 -0.4 0.129 0.7 0.403 -0.4
43 0 / 0 B
* Category A/B classification (Cat A was assigned to laboratories that have correctly analysed at least 12 of 13 compulsory compounds on the Target Pesticides List, corretly detected 7 or more out of the 8 compulsory compounds and that have not reported any false positive result)
Table 4-10: Results reported and z-scores achieved by all participating laboratories for ADDITIONAL compounds

4. RESULTS / Assessment of Laboratory Performance
57
Resu
lts
4
ADDITIONAL Compound Captan (sum) Folpet (sum) THPI Phthalimide
MRRL [mg/kg] – – – –
Assigned Value [mg/kg] 0.302 1.195 0.110 0.446
CV* 25.2 % 21.1 % 30.5 % 21.6 %
Lab code SRM12-
NRL-SRM
Analysed / corr. found max. 8 / 7
Cat.* Conc. [mg/kg]
z-Score (FFP-RSD
= 25 %)
Conc. [mg/kg]
z-Score (FFP-RSD
= 25 %)
Conc. [mg/kg]
z-Score (FFP-RSD
= 25 %)
Conc. [mg/kg]
z-Score (FFP-RSD
= 25 %)
44 x 0 / 0 B
45 0 / 0 A
46 4 / 4 A 0.282 -0.3 1.114 -0.3 0.104 -0.2 0.390 -0.5
47 4 / 3 A 0.405 1.4 0.260 -3.1 0.172 2.2 FN -3.9
48 4 / 4 A 0.254 -0.6 1.347 0.5 0.0901 -0.7 0.505 0.5
49 x 4 / 4 A 0.155 -1.9 0.805 -1.3 0.0561 -2.0 0.288 -1.4
50 4 / 4 B 0.263 -0.5 1.236 0.1 0.092 -0.7 0.425 -0.2
51 2 / 2 B 0.128 0.6 0.455 0.1
52 4 / 4 A 0.338 0.5 1.74 1.8 0.101 -0.3 0.436 -0.1
53 4 / 4 A 0.209 -1.2 1.131 -0.2 0.069 -1.5 0.399 -0.4
54 0 / 0 B
55 0 / 0 B
56 0 / 0 B
57 4 / 4 A 0.185 -1.5 1.10 -0.3 0.093 -0.6 0.414 -0.3
58 4 / 4 A 0.565 3.5 2.11 3.1 0.231 4.4 0.911 4.2
59 0 / 0 B
60 0 / 0 B
61 4 / 4 B 0.310 0.1 1.33 0.5 0.115 0.2 0.470 0.2
62 x 0 / 0 B
63 0 / 0 A
64 4 / 4 B 0.290 -0.2 1.181 0.0 0.113 0.1 0.416 -0.3
65 0 / 0 B
66 x 4 / 4 A 0.209 -1.2 0.579 -2.1 0.0628 -1.7 0.444 0.0
67 0 / 0 A
68 0 / 0 B
69 0 / 0 B
70 4 / 4 A 0.148 -2.0 0.96 -0.8 0.064 -1.7 0.310 -1.2
71 4 / 4 B 0.158 -1.9 0.828 -1.2 0.0794 -1.1 0.412 -0.3
72 4 / 4 A 0.294 -0.1 1.188 0.0 0.079 -1.1 0.374 -0.6
73 x 4 / 4 B 0.340 0.5 1.15 -0.2 0.105 -0.2 0.389 -0.5
74 4 / 4 A 0.284 -0.2 1.13 -0.2 0.143 1.2 0.561 1.0
75 x 0 / 0 A
76 4 / 4 A 0.299 0.0 1.247 0.2 0.100 -0.4 0.440 -0.1
77 0 / 0 B
78 4 / 4 A 0.289 -0.2 1.208 0.0 0.099 -0.4 0.412 -0.3
79 2 / 2 B 0.273 -0.4 1.19 0.0
80 0 / 0 B
81 x 4 / 4 B 0.306 0.1 1.09 -0.4 0.107 -0.1 0.518 0.6
82 0 / 0 B
83 x 0 / 0 A
84 4 / 4 A 0.289 -0.2 1.146 -0.2 0.105 -0.2 0.410 -0.3
85 x 0 / 0 B
* Category A/B classification (Cat A was assigned to laboratories that have correctly analysed at least 12 of 13 compulsory compounds on the Target Pesticides List, corretly detected 7 or more out of the 8 compulsory compounds and that have not reported any false positive result)
Table 4-10 (cont.): Results reported and z-scores achieved by all participating laboratories for ADDITIONAL compounds

EUPT-SRM12 | 2017 (Strawberry Purée)
58
ADDITIONAL Compound Captan (sum) Folpet (sum) THPI Phthalimide
MRRL [mg/kg] – – – –
Assigned Value [mg/kg] 0.302 1.195 0.110 0.446
CV* 25.2 % 21.1 % 30.5 % 21.6 %
Lab code SRM12-
NRL-SRM
Analysed / corr. found max. 8 / 7
Cat.* Conc. [mg/kg]
z-Score (FFP-RSD
= 25 %)
Conc. [mg/kg]
z-Score (FFP-RSD
= 25 %)
Conc. [mg/kg]
z-Score (FFP-RSD
= 25 %)
Conc. [mg/kg]
z-Score (FFP-RSD
= 25 %)
86 4 / 4 B 0.426 1.6 0.697 -1.7 0.117 0.2 0.231 -1.9
87 0 / 0 B
88 4 / 4 A 0.279 -0.3 1.27 0.3 0.096 -0.5 0.482 0.3
89 0 / 0 B
90 4 / 4 A 0.283 -0.2 0.963 -0.8 0.097 -0.5 0.352 -0.8
91 x 0 / 0 B
92 x 4 / 4 A 0.383 1.1 1.07 -0.4 0.150 1.4 0.349 -0.9
93 0 / 0 B
94 4 / 4 A 0.291 -0.1 1.27 0.3 0.107 -0.1 0.457 0.1
95 4 / 4 A 0.421 1.6 1.61 1.4 0.137 1.0 0.425 -0.2
96 x 0 / 0 A
97 4 / 4 A 0.287 -0.2 1.242 0.2 0.101 -0.3 0.406 -0.4
98 x 4 / 4 A 0.256 -0.6 1.44 0.8 0.117 0.2 0.645 1.8
99 4 / 4 A 0.411 1.4 1.31 0.4 0.112 0.1 0.465 0.2
100 0 / 0 B
101 0 / 0 B
102 4 / 4 A 0.420 1.6 1.07 -0.4 0.170 2.2 0.440 -0.1
103 x 4 / 4 A 0.331 0.4 1.11 -0.3 0.123 0.5 0.506 0.5
104 4 / 4 A 0.342 0.5 1.26 0.2 0.131 0.7 0.468 0.2
105 x 4 / 4 B 0.330 0.4 1.11 -0.3 0.110 0.0 0.330 -1.0
106 4 / 4 B 0.300 0.0 1.00 -0.7 0.300 6.9 1.00 5.0
107 x 0 / 0 A
108 0 / 0 B
109 4 / 4 A 0.301 0.0 1.26 0.2 0.113 0.1 0.451 0.0
110 0 / 0 B
111 0 / 0 B
112 0 / 0 B
113 4 / 4 A 0.288 -0.2 1.21 0.1 0.110 0.0 0.460 0.1
114 0 / 0 B
115 4 / 4 A 0.183 -1.6 1.43 0.8 0.047 -2.3 0.500 0.5
116 4 / 4 A 0.322 0.3 1.12 -0.3 0.122 0.4 0.431 -0.1
117 0 / 0 B
118 0 / 0 B
119 0 / 0 B
120 0 / 0 B
121 0 / 0 B
122 0 / 0 B
123 0 / 0 B
124 x 0 / 0 B
125 4 / 4 A 0.248 -0.7 1.023 -0.6 0.056 -2.0 0.248 -1.8
126 4 / 4 B 0.231 -0.9 0.960 -0.8 0.08 -1.1 0.33 -1.0
127 4 / 4 A 0.446 1.9 1.62 1.4 0.171 2.2 0.612 1.5
* Category A/B classification (Cat A was assigned to laboratories that have correctly analysed at least 12 of 13 compulsory compounds on the Target Pesticides List, corretly detected 7 or more out of the 8 compulsory compounds and that have not reported any false positive result)
Table 4-10 (cont.): Results reported and z-scores achieved by all participating laboratories for ADDITIONAL compounds

4. RESULTS / Assessment of Laboratory Performance
59
Resu
lts
4
ADDITIONAL Compound Captan (sum) Folpet (sum) THPI Phthalimide
MRRL [mg/kg] – – – –
Assigned Value [mg/kg] 0.302 1.195 0.110 0.446
CV* 25.2 % 21.1 % 30.5 % 21.6 %
Lab code SRM12-
NRL-SRM
Analysed / corr. found max. 8 / 7
Cat.* Conc. [mg/kg]
z-Score (FFP-RSD
= 25 %)
Conc. [mg/kg]
z-Score (FFP-RSD
= 25 %)
Conc. [mg/kg]
z-Score (FFP-RSD
= 25 %)
Conc. [mg/kg]
z-Score (FFP-RSD
= 25 %)
128 0 / 0 B
129 4 / 4 A 0.506 2.7 1.97 2.6 0.22 4.0 0.851 3.6
130 4 / 4 A 0.288 -0.2 0.960 -0.8 0.101 -0.3 0.285 -1.4
3rd-131 0 / 0 B
3rd-132 2 / 2 B 0.71 21.7 1.56 10.0
3rd-133 0 / 0 A
3rd-134 0 / 0 B
3rd-135 0 / 0 B
3rd-136 0 / 0 A
3rd-137 0 / 0 B
3rd-138 0 / 0 B
3rd-139 0 / 0 A
* Category A/B classification (Cat A was assigned to laboratories that have correctly analysed at least 12 of 13 compulsory compounds on the Target Pesticides List, corretly detected 7 or more out of the 8 compulsory compounds and that have not reported any false positive result)
4.4.4 Laboratory Classification Based on Scope
All participating laboratories having reported at least one result were classified into categories A or B ac-cording to the rules stated in Section 2.5 (p. 16). Following the rules defined in the General Protocol (7th Edition, see Appendix 8), a laboratory had to fulfill the following conditions in order to be classified into Category A in the present PT: a) analysis of at least twelve out of the thirteen compulsory pesticides on the Target Pesticides List; b) correct detection of at least seven out of the eight compulsory pesticides present in the test item, and c) no false positive results.
A total of 64 EU and EFTA laboratories (50 %) were classified into Category A and 65 (50 %) into Category B. Three out of the 9 EU candidate and third-country laboratories were classified into Category A. Considering only the compulsory compounds the laboratories from EU and EFTA countries classified into Category A achieved an overall AAZ of 0.8 (n = 507), whereas those classified into Category B achieved an overall AAZ of 1.0 (n = 256). The AAZ values remain the same, when including laboratories from EU candidate and third countries (at n = 530 for the compulsory compounds and n = 289 for the optional compounds).
Table 4-11 and Table 4-12 (p. 62) show the details of laboratories classified into Category A and B, respec-tively. For informative purposes, the overall AAZ was calculated for laboratories with 5 or more individual z-scores among the compulsory compounds. For the AAZ calculation any z-scores > 5 were set at 5.
Table 4-10 (cont.): Results reported and z-scores achieved by all participating laboratories for ADDITIONAL compounds
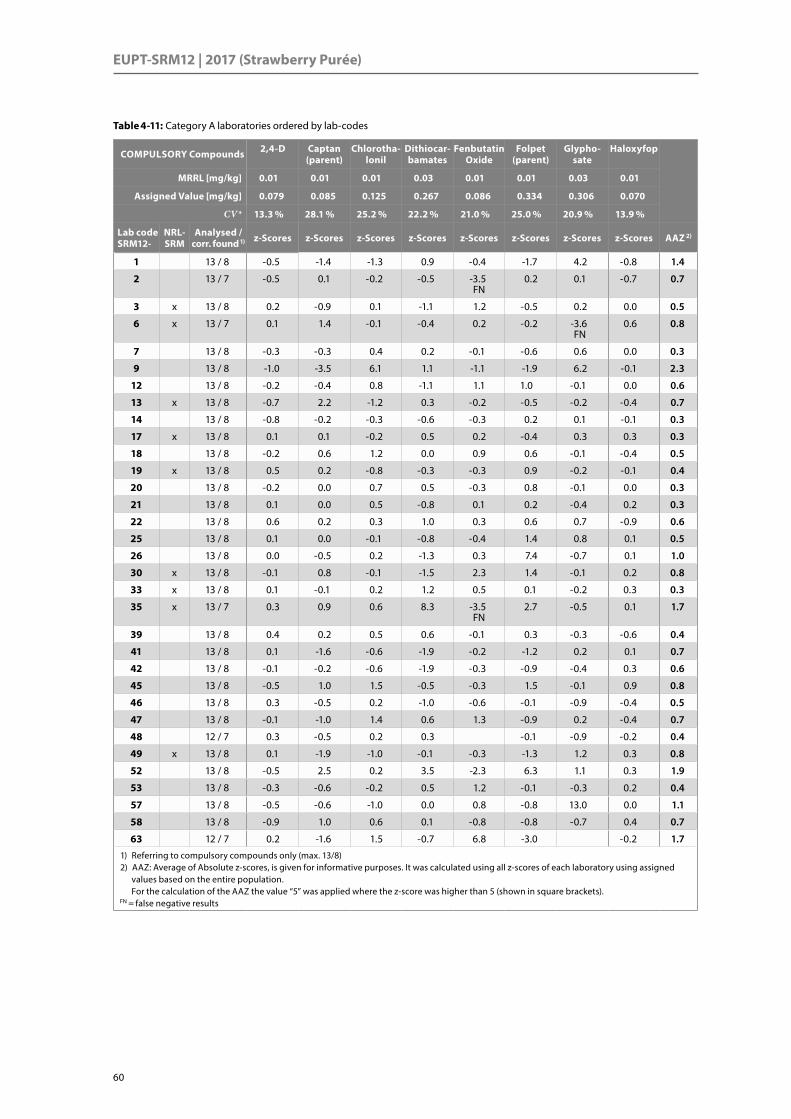
EUPT-SRM12 | 2017 (Strawberry Purée)
60
COMPULSORY Compounds 2,4-D Captan (parent)
Chlorotha-lonil
Dithiocar-bamates
Fenbutatin Oxide
Folpet (parent)
Glypho-sate
Haloxyfop
MRRL [mg/kg] 0.01 0.01 0.01 0.03 0.01 0.01 0.03 0.01
Assigned Value [mg/kg] 0.079 0.085 0.125 0.267 0.086 0.334 0.306 0.070
CV* 13.3 % 28.1 % 25.2 % 22.2 % 21.0 % 25.0 % 20.9 % 13.9 %
Lab code SRM12-
NRL-SRM
Analysed / corr. found 1) z-Scores z-Scores z-Scores z-Scores z-Scores z-Scores z-Scores z-Scores AAZ 2)
1 13 / 8 -0.5 -1.4 -1.3 0.9 -0.4 -1.7 4.2 -0.8 1.4
2 13 / 7 -0.5 0.1 -0.2 -0.5 -3.5 FN
0.2 0.1 -0.7 0.7
3 x 13 / 8 0.2 -0.9 0.1 -1.1 1.2 -0.5 0.2 0.0 0.5
6 x 13 / 7 0.1 1.4 -0.1 -0.4 0.2 -0.2 -3.6FN
0.6 0.8
7 13 / 8 -0.3 -0.3 0.4 0.2 -0.1 -0.6 0.6 0.0 0.3
9 13 / 8 -1.0 -3.5 6.1 1.1 -1.1 -1.9 6.2 -0.1 2.3
12 13 / 8 -0.2 -0.4 0.8 -1.1 1.1 1.0 -0.1 0.0 0.6
13 x 13 / 8 -0.7 2.2 -1.2 0.3 -0.2 -0.5 -0.2 -0.4 0.7
14 13 / 8 -0.8 -0.2 -0.3 -0.6 -0.3 0.2 0.1 -0.1 0.3
17 x 13 / 8 0.1 0.1 -0.2 0.5 0.2 -0.4 0.3 0.3 0.3
18 13 / 8 -0.2 0.6 1.2 0.0 0.9 0.6 -0.1 -0.4 0.5
19 x 13 / 8 0.5 0.2 -0.8 -0.3 -0.3 0.9 -0.2 -0.1 0.4
20 13 / 8 -0.2 0.0 0.7 0.5 -0.3 0.8 -0.1 0.0 0.3
21 13 / 8 0.1 0.0 0.5 -0.8 0.1 0.2 -0.4 0.2 0.3
22 13 / 8 0.6 0.2 0.3 1.0 0.3 0.6 0.7 -0.9 0.6
25 13 / 8 0.1 0.0 -0.1 -0.8 -0.4 1.4 0.8 0.1 0.5
26 13 / 8 0.0 -0.5 0.2 -1.3 0.3 7.4 -0.7 0.1 1.0
30 x 13 / 8 -0.1 0.8 -0.1 -1.5 2.3 1.4 -0.1 0.2 0.8
33 x 13 / 8 0.1 -0.1 0.2 1.2 0.5 0.1 -0.2 0.3 0.3
35 x 13 / 7 0.3 0.9 0.6 8.3 -3.5FN
2.7 -0.5 0.1 1.7
39 13 / 8 0.4 0.2 0.5 0.6 -0.1 0.3 -0.3 -0.6 0.4
41 13 / 8 0.1 -1.6 -0.6 -1.9 -0.2 -1.2 0.2 0.1 0.7
42 13 / 8 -0.1 -0.2 -0.6 -1.9 -0.3 -0.9 -0.4 0.3 0.6
45 13 / 8 -0.5 1.0 1.5 -0.5 -0.3 1.5 -0.1 0.9 0.8
46 13 / 8 0.3 -0.5 0.2 -1.0 -0.6 -0.1 -0.9 -0.4 0.5
47 13 / 8 -0.1 -1.0 1.4 0.6 1.3 -0.9 0.2 -0.4 0.7
48 12 / 7 0.3 -0.5 0.2 0.3 -0.1 -0.9 -0.2 0.4
49 x 13 / 8 0.1 -1.9 -1.0 -0.1 -0.3 -1.3 1.2 0.3 0.8
52 13 / 8 -0.5 2.5 0.2 3.5 -2.3 6.3 1.1 0.3 1.9
53 13 / 8 -0.3 -0.6 -0.2 0.5 1.2 -0.1 -0.3 0.2 0.4
57 13 / 8 -0.5 -0.6 -1.0 0.0 0.8 -0.8 13.0 0.0 1.1
58 13 / 8 -0.9 1.0 0.6 0.1 -0.8 -0.8 -0.7 0.4 0.7
63 12 / 7 0.2 -1.6 1.5 -0.7 6.8 -3.0 -0.2 1.71) Referring to compulsory compounds only (max. 13/8)2) AAZ: Average of Absolute z-scores, is given for informative purposes. It was calculated using all z-scores of each laboratory using assigned
values based on the entire population. For the calculation of the AAZ the value “5” was applied where the z-score was higher than 5 (shown in square brackets).
FN = false negative results
Table 4-11: Category A laboratories ordered by lab-codes
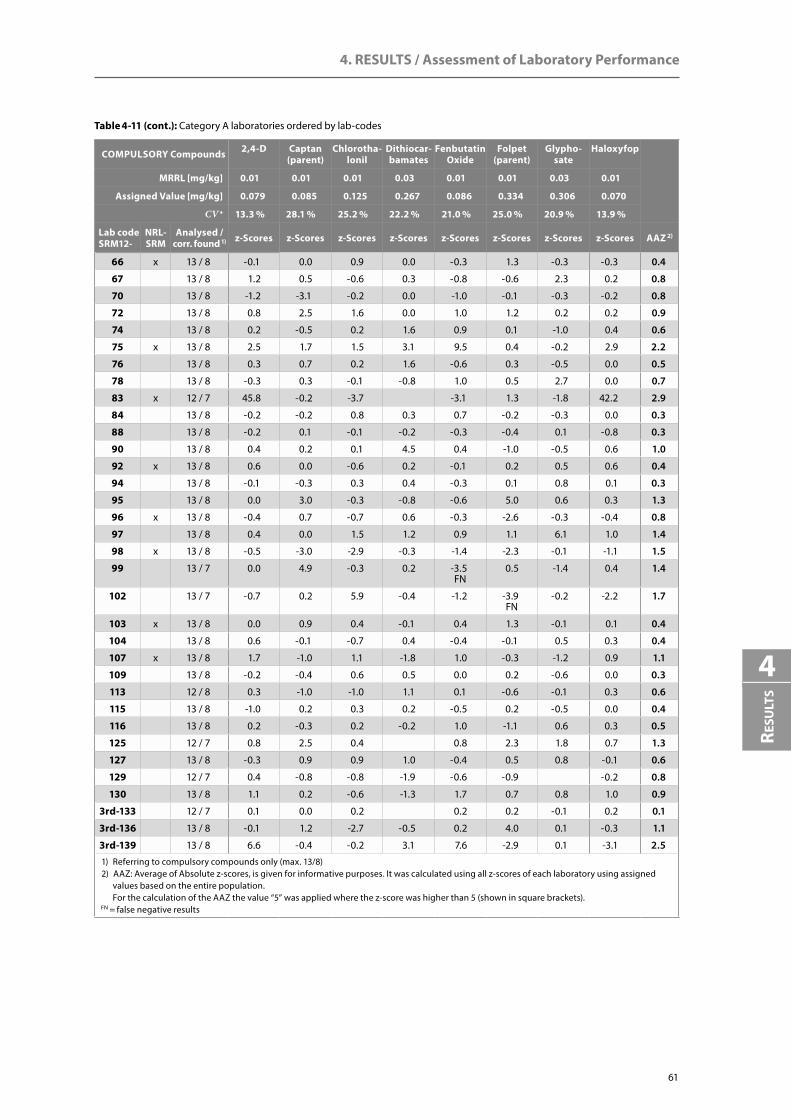
4. RESULTS / Assessment of Laboratory Performance
61
Resu
lts
4
COMPULSORY Compounds 2,4-D Captan (parent)
Chlorotha-lonil
Dithiocar-bamates
Fenbutatin Oxide
Folpet (parent)
Glypho-sate
Haloxyfop
MRRL [mg/kg] 0.01 0.01 0.01 0.03 0.01 0.01 0.03 0.01
Assigned Value [mg/kg] 0.079 0.085 0.125 0.267 0.086 0.334 0.306 0.070
CV* 13.3 % 28.1 % 25.2 % 22.2 % 21.0 % 25.0 % 20.9 % 13.9 %
Lab code SRM12-
NRL-SRM
Analysed / corr. found 1) z-Scores z-Scores z-Scores z-Scores z-Scores z-Scores z-Scores z-Scores AAZ 2)
66 x 13 / 8 -0.1 0.0 0.9 0.0 -0.3 1.3 -0.3 -0.3 0.4
67 13 / 8 1.2 0.5 -0.6 0.3 -0.8 -0.6 2.3 0.2 0.8
70 13 / 8 -1.2 -3.1 -0.2 0.0 -1.0 -0.1 -0.3 -0.2 0.8
72 13 / 8 0.8 2.5 1.6 0.0 1.0 1.2 0.2 0.2 0.9
74 13 / 8 0.2 -0.5 0.2 1.6 0.9 0.1 -1.0 0.4 0.6
75 x 13 / 8 2.5 1.7 1.5 3.1 9.5 0.4 -0.2 2.9 2.2
76 13 / 8 0.3 0.7 0.2 1.6 -0.6 0.3 -0.5 0.0 0.5
78 13 / 8 -0.3 0.3 -0.1 -0.8 1.0 0.5 2.7 0.0 0.7
83 x 12 / 7 45.8 -0.2 -3.7 -3.1 1.3 -1.8 42.2 2.9
84 13 / 8 -0.2 -0.2 0.8 0.3 0.7 -0.2 -0.3 0.0 0.3
88 13 / 8 -0.2 0.1 -0.1 -0.2 -0.3 -0.4 0.1 -0.8 0.3
90 13 / 8 0.4 0.2 0.1 4.5 0.4 -1.0 -0.5 0.6 1.0
92 x 13 / 8 0.6 0.0 -0.6 0.2 -0.1 0.2 0.5 0.6 0.4
94 13 / 8 -0.1 -0.3 0.3 0.4 -0.3 0.1 0.8 0.1 0.3
95 13 / 8 0.0 3.0 -0.3 -0.8 -0.6 5.0 0.6 0.3 1.3
96 x 13 / 8 -0.4 0.7 -0.7 0.6 -0.3 -2.6 -0.3 -0.4 0.8
97 13 / 8 0.4 0.0 1.5 1.2 0.9 1.1 6.1 1.0 1.4
98 x 13 / 8 -0.5 -3.0 -2.9 -0.3 -1.4 -2.3 -0.1 -1.1 1.5
99 13 / 7 0.0 4.9 -0.3 0.2 -3.5FN
0.5 -1.4 0.4 1.4
102 13 / 7 -0.7 0.2 5.9 -0.4 -1.2 -3.9FN
-0.2 -2.2 1.7
103 x 13 / 8 0.0 0.9 0.4 -0.1 0.4 1.3 -0.1 0.1 0.4
104 13 / 8 0.6 -0.1 -0.7 0.4 -0.4 -0.1 0.5 0.3 0.4
107 x 13 / 8 1.7 -1.0 1.1 -1.8 1.0 -0.3 -1.2 0.9 1.1
109 13 / 8 -0.2 -0.4 0.6 0.5 0.0 0.2 -0.6 0.0 0.3
113 12 / 8 0.3 -1.0 -1.0 1.1 0.1 -0.6 -0.1 0.3 0.6
115 13 / 8 -1.0 0.2 0.3 0.2 -0.5 0.2 -0.5 0.0 0.4
116 13 / 8 0.2 -0.3 0.2 -0.2 1.0 -1.1 0.6 0.3 0.5
125 12 / 7 0.8 2.5 0.4 0.8 2.3 1.8 0.7 1.3
127 13 / 8 -0.3 0.9 0.9 1.0 -0.4 0.5 0.8 -0.1 0.6
129 12 / 7 0.4 -0.8 -0.8 -1.9 -0.6 -0.9 -0.2 0.8
130 13 / 8 1.1 0.2 -0.6 -1.3 1.7 0.7 0.8 1.0 0.9
3rd-133 12 / 7 0.1 0.0 0.2 0.2 0.2 -0.1 0.2 0.1
3rd-136 13 / 8 -0.1 1.2 -2.7 -0.5 0.2 4.0 0.1 -0.3 1.1
3rd-139 13 / 8 6.6 -0.4 -0.2 3.1 7.6 -2.9 0.1 -3.1 2.51) Referring to compulsory compounds only (max. 13/8)2) AAZ: Average of Absolute z-scores, is given for informative purposes. It was calculated using all z-scores of each laboratory using assigned
values based on the entire population. For the calculation of the AAZ the value “5” was applied where the z-score was higher than 5 (shown in square brackets).
FN = false negative results
Table 4-11 (cont.): Category A laboratories ordered by lab-codes

EUPT-SRM12 | 2017 (Strawberry Purée)
62
Table 4-12: Category B laboratories ordered by lab-codes
COMPULSORY Compounds 2,4-D Captan (parent)
Chlorotha-lonil
Dithiocar-bamates
Fenbutatin Oxide
Folpet (parent)
Glypho-sate
Haloxyfop
Assigned Value [mg/kg] 0.01 0.01 0.01 0.03 0.01 0.01 0.03 0.01
MRRL [mg/kg] 0.079 0.085 0.125 0.267 0.086 0.334 0.306 0.070
CV* 13.3 % 28.1 % 25.2 % 22.2 % 21.0 % 25.0 % 20.9 % 13.9 %
Lab code SRM12-
NRL-SRM
Analysed / corr. found 1) z-Scores z-Scores z-Scores z-Scores z-Scores z-Scores z-Scores AAZ 2)
4 11 / 7 -0.2 -0.6 -0.9 0.9 -1.3 -0.5 -0.3 0.7
5 1 / 1 -0.3
8 9 / 4 0.5 -0.6 1.1 0.7
10 9 / 5 -0.6 5.3 1.7 0.1 -0.2 1.5
11 6 / 3 -1.8 11.8 -1.7
15 10 / 6 -0.2 -0.2 0.7 0.2 -0.5 -0.6 0.4
16 x 11 / 6 -1.2 0.7 -0.9 0.3 -0.9 -0.4 0.7
23 10 / 5 -2.8 -3.0 -3.5 -1.6 -1.7 2.5
24 11 / 7 0.2 -1.1 -0.2 0.7 -0.8 0.0 -0.3 0.5
27 6 / 2 -0.1 -3.7FN
-3.1
28 x 10 / 6 -0.4 -0.6 0.6 1.6 -0.6 -0.5 0.7
29 x 10 / 6 0.0 -1.1 -0.6 0.1 -2.1 -0.1 0.7
31 4 / 4 0.3 -0.8 0.3 -0.2
32 11 / 7 0.1 0.4 -0.8 0.4 0.5 -0.1 0.1 0.3
34 11 / 6 -0.1 0.0 0.8 0.0 0.1 -0.7 0.3
37 6 / 4 -0.1 -0.2 -0.1 -0.2
38 8 / 6 -0.3 -1.0 -0.5 -1.0 -0.2 -2.3 0.9
40 9 / 5 1.1 -0.3 -0.1 3.4 -1.4 1.3
43 2 / 2 -1.0 -0.8
44 x 8 / 4 -3.5FN
0.0 -1.9 0.8 -0.4 -3.4FN
1.7
50 11 / 7 0.3 -0.2 2.1 0.7 0.1 0.5 0.0 0.6
51 8 / 4 -0.3 3.3 0.9 -0.3
54 6 / 3 -1.8 -0.8 0.8
55 2 / 1 -0.6
56 7 / 4 -1.4 -0.6 -0.3 -0.4
59 1 / 1 -0.2
60 3 / 2 0.2 0.1
61 6 / 4 -0.2 -0.2 0.6 0.0
62 x 9 / 6 -0.4 -1.1 -1.2 -0.9 0.5 -0.7 -4.0FN
1.3
64 10 / 6 0.2 0.8 -0.2 0.2 1.5 -0.2 0.5
65 1 / 1 -0.1
68 8 / 4 0.1 0.2 -3.3 0.1
69 10 / 6 0.5 0.0 -0.8 0.6 0.3 0.2 0.4
71 11 / 6 36.2 -0.8 -0.3 -0.8 0.3 38.6 2.0
73 x 8 / 5 2.2 0.0 1.1 0.4 0.7 0.91) Referring to compulsory compounds only (max. 13/7)2) AAZ: Average of Absolute z-scores, is given for informative purposes for participants having reported at least 5 results for compulsory ana-
lytes. It was calculated using all z-scores of each lab using assigned values based on the entire population. For the calculation of the AAZ the value “5” was applied where the z-score was higher than 5 (shown in square brackets).
FN = false negative results
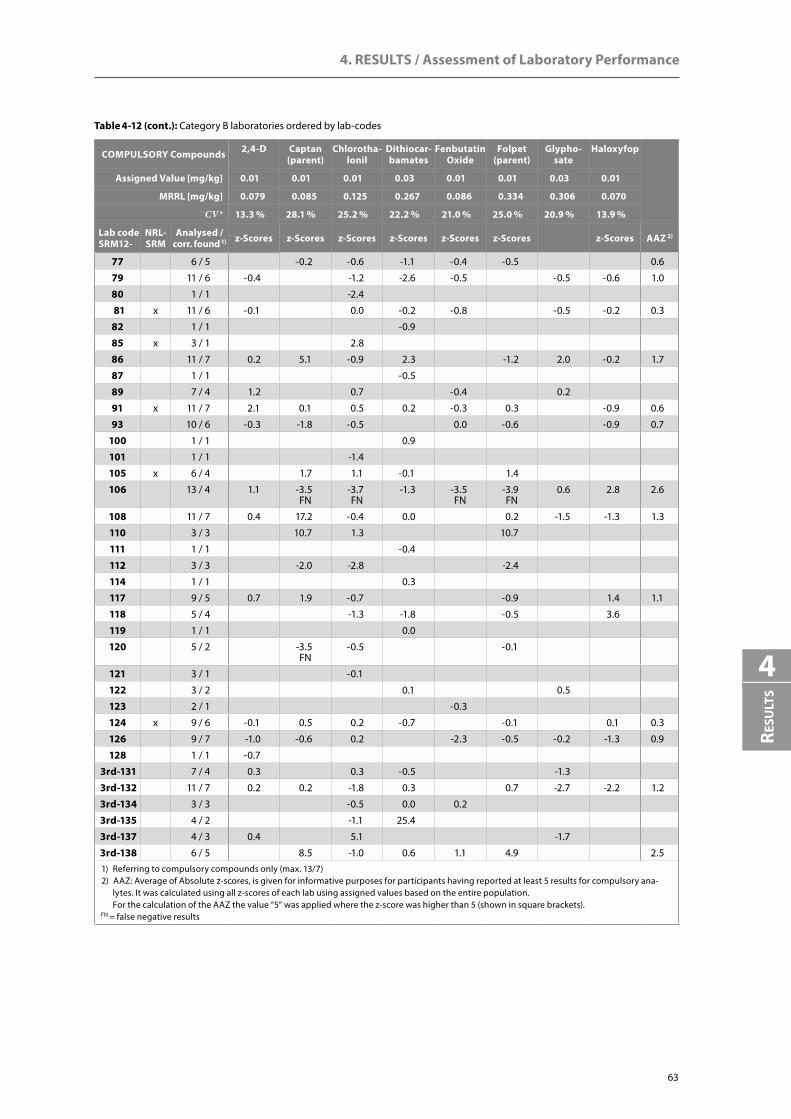
4. RESULTS / Assessment of Laboratory Performance
63
Resu
lts
4
COMPULSORY Compounds 2,4-D Captan (parent)
Chlorotha-lonil
Dithiocar-bamates
Fenbutatin Oxide
Folpet (parent)
Glypho-sate
Haloxyfop
Assigned Value [mg/kg] 0.01 0.01 0.01 0.03 0.01 0.01 0.03 0.01
MRRL [mg/kg] 0.079 0.085 0.125 0.267 0.086 0.334 0.306 0.070
CV* 13.3 % 28.1 % 25.2 % 22.2 % 21.0 % 25.0 % 20.9 % 13.9 %
Lab code SRM12-
NRL-SRM
Analysed / corr. found 1) z-Scores z-Scores z-Scores z-Scores z-Scores z-Scores z-Scores AAZ 2)
77 6 / 5 -0.2 -0.6 -1.1 -0.4 -0.5 0.6
79 11 / 6 -0.4 -1.2 -2.6 -0.5 -0.5 -0.6 1.0
80 1 / 1 -2.4
81 x 11 / 6 -0.1 0.0 -0.2 -0.8 -0.5 -0.2 0.3
82 1 / 1 -0.9
85 x 3 / 1 2.8
86 11 / 7 0.2 5.1 -0.9 2.3 -1.2 2.0 -0.2 1.7
87 1 / 1 -0.5
89 7 / 4 1.2 0.7 -0.4 0.2
91 x 11 / 7 2.1 0.1 0.5 0.2 -0.3 0.3 -0.9 0.6
93 10 / 6 -0.3 -1.8 -0.5 0.0 -0.6 -0.9 0.7
100 1 / 1 0.9
101 1 / 1 -1.4
105 x 6 / 4 1.7 1.1 -0.1 1.4
106 13 / 4 1.1 -3.5FN
-3.7FN
-1.3 -3.5FN
-3.9FN
0.6 2.8 2.6
108 11 / 7 0.4 17.2 -0.4 0.0 0.2 -1.5 -1.3 1.3
110 3 / 3 10.7 1.3 10.7
111 1 / 1 -0.4
112 3 / 3 -2.0 -2.8 -2.4
114 1 / 1 0.3
117 9 / 5 0.7 1.9 -0.7 -0.9 1.4 1.1
118 5 / 4 -1.3 -1.8 -0.5 3.6
119 1 / 1 0.0
120 5 / 2 -3.5FN
-0.5 -0.1
121 3 / 1 -0.1
122 3 / 2 0.1 0.5
123 2 / 1 -0.3
124 x 9 / 6 -0.1 0.5 0.2 -0.7 -0.1 0.1 0.3
126 9 / 7 -1.0 -0.6 0.2 -2.3 -0.5 -0.2 -1.3 0.9
128 1 / 1 -0.7
3rd-131 7 / 4 0.3 0.3 -0.5 -1.3
3rd-132 11 / 7 0.2 0.2 -1.8 0.3 0.7 -2.7 -2.2 1.2
3rd-134 3 / 3 -0.5 0.0 0.2
3rd-135 4 / 2 -1.1 25.4
3rd-137 4 / 3 0.4 5.1 -1.7
3rd-138 6 / 5 8.5 -1.0 0.6 1.1 4.9 2.51) Referring to compulsory compounds only (max. 13/7)2) AAZ: Average of Absolute z-scores, is given for informative purposes for participants having reported at least 5 results for compulsory ana-
lytes. It was calculated using all z-scores of each lab using assigned values based on the entire population. For the calculation of the AAZ the value “5” was applied where the z-score was higher than 5 (shown in square brackets).
FN = false negative results
Table 4-12 (cont.): Category B laboratories ordered by lab-codes

EUPT-SRM12 | 2017 (Strawberry Purée)
64
4.4.5 Laboratory Feedback in Case of Poor Results
As a follow-up measure to this EUPT, all participating laboratories having achieved questionable (2 < |z-score| < 3) or unacceptable (|z-score| ≥ 3) results were asked to investigate the reasons for their poor performance and to report them to the organisers. The aim of this measure is to sensibilize the laboratories to investigate the sources of errors. A compilation of the feedback received by the laboratories is given in Appendix 7. With this compilation it is intended to make all participanting labs aware of common and po-tential error sources so that they can be avoided or eliminated in the future. This information also provides input to NRLs on how to better assist OfLs within the network in improving their performance.
In the current PT, excluding carbofuran (part of sum) that showed an unacceptble uncertainty of the as-signed value, in total 744 results were reported by 147 participants. 161 results by 73 laboratories were allocated with |z| > 2, and thereof 102 results by 53 laboratories with |z| ≥ 3 (see Table 4-7, p. 40). Among EU and EFTA laboratories, |z| > 2 was assigned to 143 results by 66 laboratories, and |z| ≥ 3 to 88 results by 46 laboratories. All these laboratories were asked to provide a feedback. Overall, 57 laboratories responded to the organisers with (possible) reasons for their poor performance in 123 cases. In 20 of those cases the real reasons for generating biased results could not be clarified, inspite of intensive investigation. The most frequently reported error sources were “error in the concentration of analytical standards or calibration solutions” (24 cases), “lack of experience” (14 cases) and “transcription or administrative errors” (14 cases). Compared to the previous PTs the rate of “transcription or administrative errors” was high in the current PT (e.g., only 1 case in EUPT-SRM10 and EUPT-SRM11).
Other error sources commonly reported were: “Use of inappropriate procedure” (9 cases), “error in the evalu- ation or in the interpretation of measurement data” (9 cases), “application of inappropriate calibration” (9 cases), “technical problems with measurement instrumentation” like poor sensitivity (8 cases), “matrix ef-fect not properly compensated” (6 cases) and “result not corrected for low or high recovery” (5 cases). Con-cerning captan (parent) and THPI as well as folpet (parent) and phthalimide, in 4 cases the laboratories blamed the conversion the parent compounds into the metabolites as a source of bias for the individual compounds with the sum concentration being acceptable.
The other reasons for poor performace were: “procedure not properly conducted” (4 cases), “strong chro-matographic interferences” (3 cases), “detection signals strongly interferred by matrix components” and
“degradation during sample preparation or measurement“ (each 2 cases) as well as “misunderstanding of the definition of the analyte” (1 case). The responses from the other labratories are pending.
4.5 Methodological Information
4.5.1 Analytical methods used
An overview of the methods used by all participating laboratories for sample preparation and determina-tion for each analyte present in the test item can be seen in Figure 4-1. Detailed information about the analytical methods used by the laboratories for each of the analytes can be found online under “EUPT-SRM12 - Supplementary Information” accessible using the the link: http://www.eurl-pesticides.eu/library/docs/srm/EUPT-SRM12_Supplementary_Information.pdf.
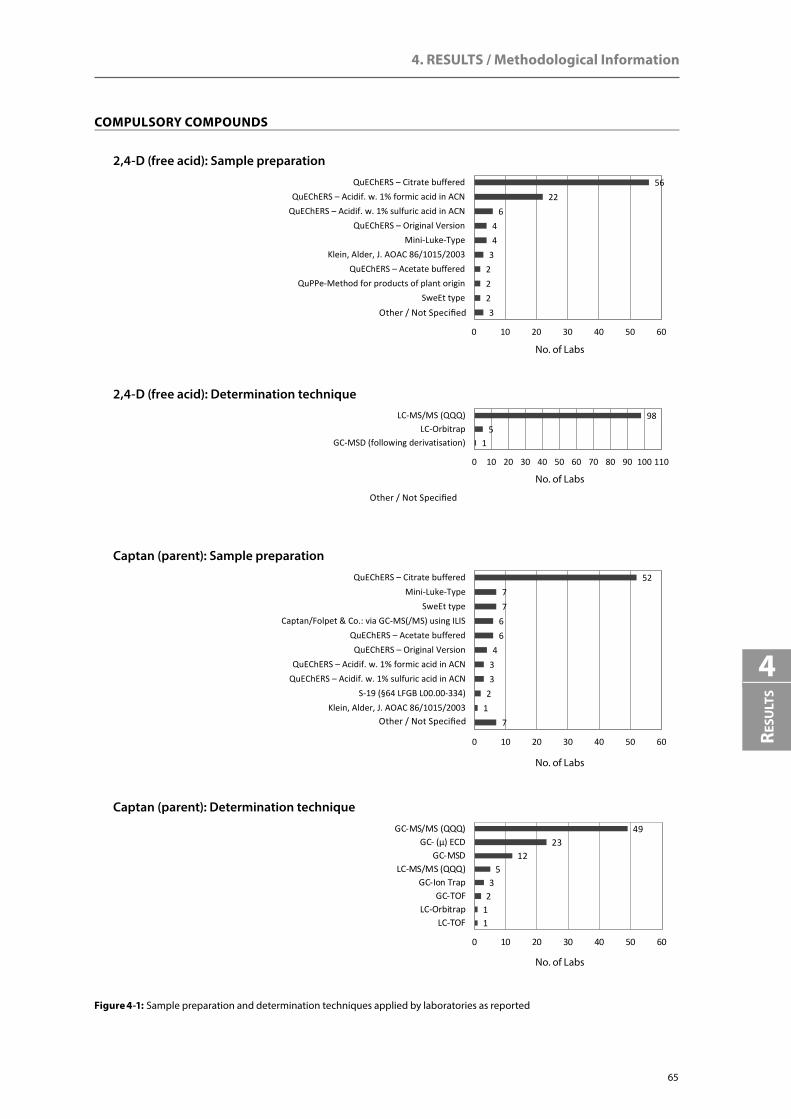
4. RESULTS / Methodological Information
65
Resu
lts
4
4923
125
32
11
0 10 20 30 40 50 60
GC-MS/MS (QQQ)GC- (µ) ECD
GC-MSDLC-MS/MS (QQQ)
GC-Ion TrapGC-TOF
LC-OrbitrapLC-TOF
5277
66
433
21
7
0 10 20 30 40 50 60
QuEChERS – Citrate bufferedMini-Luke-Type
SweEt typeCaptan/Folpet & Co.: via GC-MS(/MS) using ILIS
QuEChERS – Acetate bufferedQuEChERS – Original Version
QuEChERS – Acidif. w. 1% formic acid in ACNQuEChERS – Acidif. w. 1% sulfuric acid in ACN
S-19 (§64 LFGB L00.00-334)Klein, Alder, J. AOAC 86/1015/2003
Other
No. of Labs
Captan (parent): Sample preparation
Captan (parent): Determination technique
No. of Labs
2,4-D (free acid): Sample preparation
2,4-D (free acid): Determination technique
No. of Labs
No. of Labs
Figure 4-1: Sample preparation and determination techniques applied by laboratories as reported
5622
644
32223
0 10 20 30 40 50 60
QuEChERS – Citrate bufferedQuEChERS – Acidif. w. 1% formic acid in ACN
QuEChERS – Acidif. w. 1% sulfuric acid in ACNQuEChERS – Original Version
Mini-Luke-TypeKlein, Alder, J. AOAC 86/1015/2003
QuEChERS – Acetate bufferedQuPPe-Method for products of plant origin
SweEt typeOther
985
1
0 10 20 30 40 50 60 70 80 90 100 110
LC-MS/MS (QQQ)LC-Orbitrap
GC-MSD (following derivatisation)
COMPULSORY COMPOUNDS
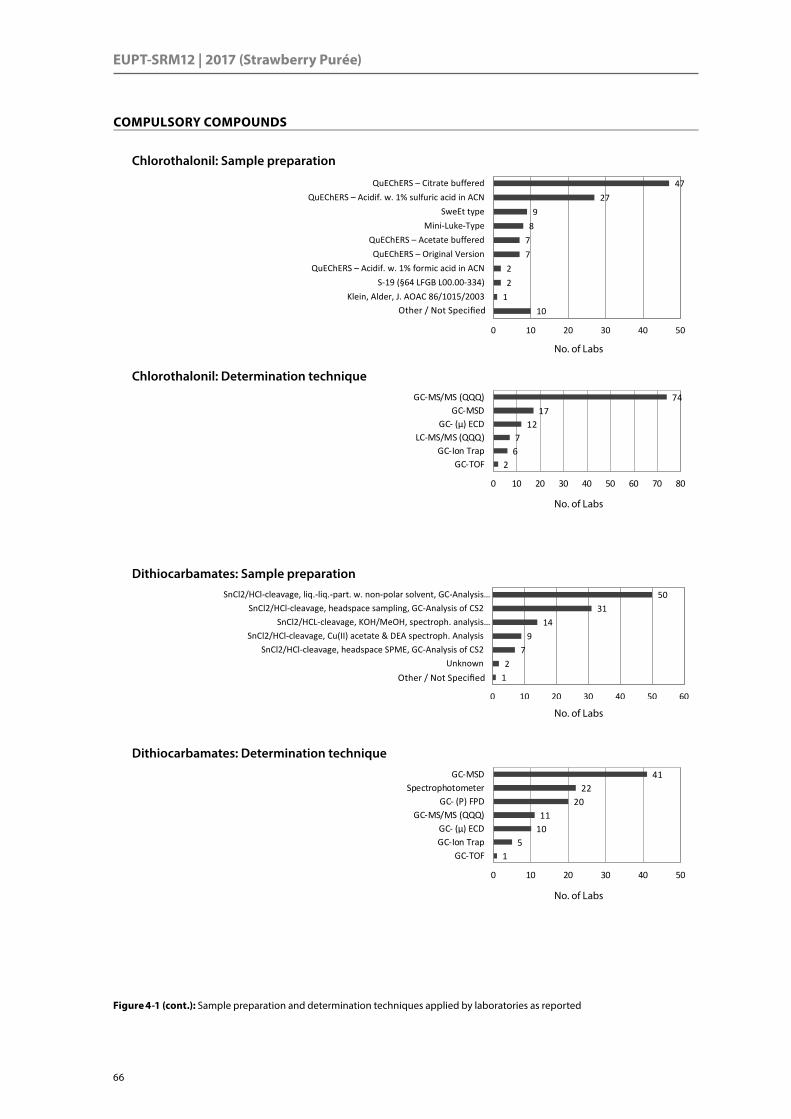
EUPT-SRM12 | 2017 (Strawberry Purée)
66
7417
127
62
0 10 20 30 40 50 60 70 80
GC-MS/MS (QQQ)GC-MSD
GC- (µ) ECDLC-MS/MS (QQQ)
GC-Ion TrapGC-TOF
4122
2011
105
1
0 10 20 30 40 50
GC-MSDSpectrophotometer
GC- (P) FPDGC-MS/MS (QQQ)
GC- (µ) ECDGC-Ion Trap
GC-TOF
Dithiocarbamates: Sample preparation
Dithiocarbamates: Determination technique
No. of Labs
No. of Labs
Figure 4-1 (cont.): Sample preparation and determination techniques applied by laboratories as reported
No. of Labs
Chlorothalonil: Sample preparation
Chlorothalonil: Determination technique
No. of Labs
4727
98
77
22
110
0 10 20 30 40 50
QuEChERS – Citrate bufferedQuEChERS – Acidif. w. 1% sulfuric acid in ACN
SweEt typeMini-Luke-Type
QuEChERS – Acetate bufferedQuEChERS – Original Version
QuEChERS – Acidif. w. 1% formic acid in ACNS-19 (§64 LFGB L00.00-334)
Klein, Alder, J. AOAC 86/1015/2003Other
5031
149
72
1
0 10 20 30 40 50 60
SnCl2/HCl-cleavage, liq.-liq.-part. w. non-polar solvent, GC-Analysis…SnCl2/HCl-cleavage, headspace sampling, GC-Analysis of CS2
SnCl2/HCL-cleavage, KOH/MeOH, spectroph. analysis…SnCl2/HCl-cleavage, Cu(II) acetate & DEA spectroph. Analysis
SnCl2/HCl-cleavage, headspace SPME, GC-Analysis of CS2Unknown
Other
COMPULSORY COMPOUNDS

4. RESULTS / Methodological Information
67
Resu
lts
4
5621
125
42
1
0 10 20 30 40 50 60
GC-MS/MS (QQQ)GC- (µ) ECD
GC-MSDLC-MS/MS (QQQ)
GC-Ion TrapGC-TOF
LC-Orbitrap
3724
65
43
111
5
0 10 20 30 40
QuEChERS – Citrate bufferedQuEChERS – Acidif. w. 1% formic acid in ACN
QuEChERS – Acidif. w. 1% sulfuric acid in ACNQuEChERS – Acetate bufferedQuEChERS – Original Version
SweEt typeS-19 (§64 LFGB L00.00-334)
Klein, Alder, J. AOAC 86/1015/2003QuPPe-Method for products of plant origin
Other / Not Specified
813
111
0 10 20 30 40 50 60 70 80 90
LC-MS/MS (QQQ)LC-Orbitrap
LC-MSLC-TOF
GC-MSD (with derivatization)
Folpet (parent): Sample preparation
Folpet (parent): Determination technique
No. of Labs
No. of Labs
Figure 4-1 (cont.): Sample preparation and determination techniques applied by laboratories as reported
Fenbutatin Oxide: Sample preparation
Fenbutatin Oxide: Determination technique
No. of Labs
No. of Labs
57777
64
322
17
0 10 20 30 40 50 60
QuEChERS – Citrate bufferedSweEt type
Mini-Luke-TypeCaptan/Folpet & Co.: via GC-MS(/MS) using ILIS
QuEChERS – Acetate bufferedQuEChERS – Original Version
QuEChERS – Acidif. w. 1% sulfuric acid in ACNQuEChERS – Acidif. w. 1% formic acid in ACN
S-19 (§64 LFGB L00.00-334)Klein, Alder, J. AOAC 86/1015/2003
Other
COMPULSORY COMPOUNDS

EUPT-SRM12 | 2017 (Strawberry Purée)
68
8621111
0 10 20 30 40 50 60 70 80 90 100
LC-MS/MS (QQQ)LC-FLD (Fluorescence)
GC-MS/MS (QQQ)ICP-MS
LC-OrbitrapIC-Orbitrap
6220
11
8
0 10 20 30 40 50 60 70
QuPPe-Method for products of plant originMtd involving deriv. w. FMOC
Mtd involving post-column deriv. w. OPAQuEChERS – Citrate buffered
Other
5818
444
333
13
0 10 20 30 40 50 60 70
QuEChERS – Citrate bufferedQuEChERS – Acidif. w. 1% formic acid in ACN
QuEChERS – Acetate bufferedQuEChERS – Original Version
QuEChERS – Acidif. w. 1% sulfuric acid in ACNSweEt type
Mini-Luke-TypeKlein, Alder, J. AOAC 86/1015/2003
QuPPe-Method for products of plant originOther
Haloxyfop: Sample preparation
Haloxyfop: Determination technique
No. of Labs
No. of Labs
Figure 4-1 (cont.): Sample preparation and determination techniques applied by laboratories as reported
No. of Labs
Glyphosate: Sample preparation
Glyphosate: Determination technique
No. of Labs
COMPULSORY COMPOUNDS
935
111
0 10 20 30 40 50 60 70 80 90 100
LC-MS/MS (QQQ)LC-Orbitrap
LC-Q-TOFLC-TOF
GC-MSD (following derivatisation)

4. RESULTS / Methodological Information
69
Resu
lts
4
2011
97
22
1111
0 10 20 30
GC- (µ) ECDLC-MS/MS (QQQ)
IC-ConductivityGC-MSD
ICP-MSLC-UV or DAD
GC-Ion TrapLC-OrbitrapIC-Orbitrap
XRF
2712
11
14
0 10 20 30
deriv. with propyleneoxideQuPPe-Method for products of plant origin
QuEChERS – Citrate bufferedderiv. with ethyleneoxide
Other
3112
4222
111
0 10 20 30 40
QuEChERS – Citrate bufferedQuEhERS-based, involv. Reduct. w. Ascorb. Acid
QuEChERS – Acetate bufferedSweEt type
Mini-Luke-TypeKlein, Alder, J. AOAC 86/1015/2003
QuEChERS – Original VersionQuEChERS – Acidif. w. 1% sulfuric acid in ACN
Other
4111
211
0 10 20 30 40 50
LC-MS/MS (QQQ)GC-MS/MS (QQQ)
LC-OrbitrapLC-TOF
GC-MSD
Bromide ion: Sample preparation
Bromide ion: Determination technique
No. of Labs
No. of Labs
Figure 4-1 (cont.): Sample preparation and determination techniques applied by laboratories as reported
Bifenazate (sum): Sample preparation
Bifenazate (sum): Determination technique
No. of Labs
No. of Labs
OPTIONAL COMPOUNDS
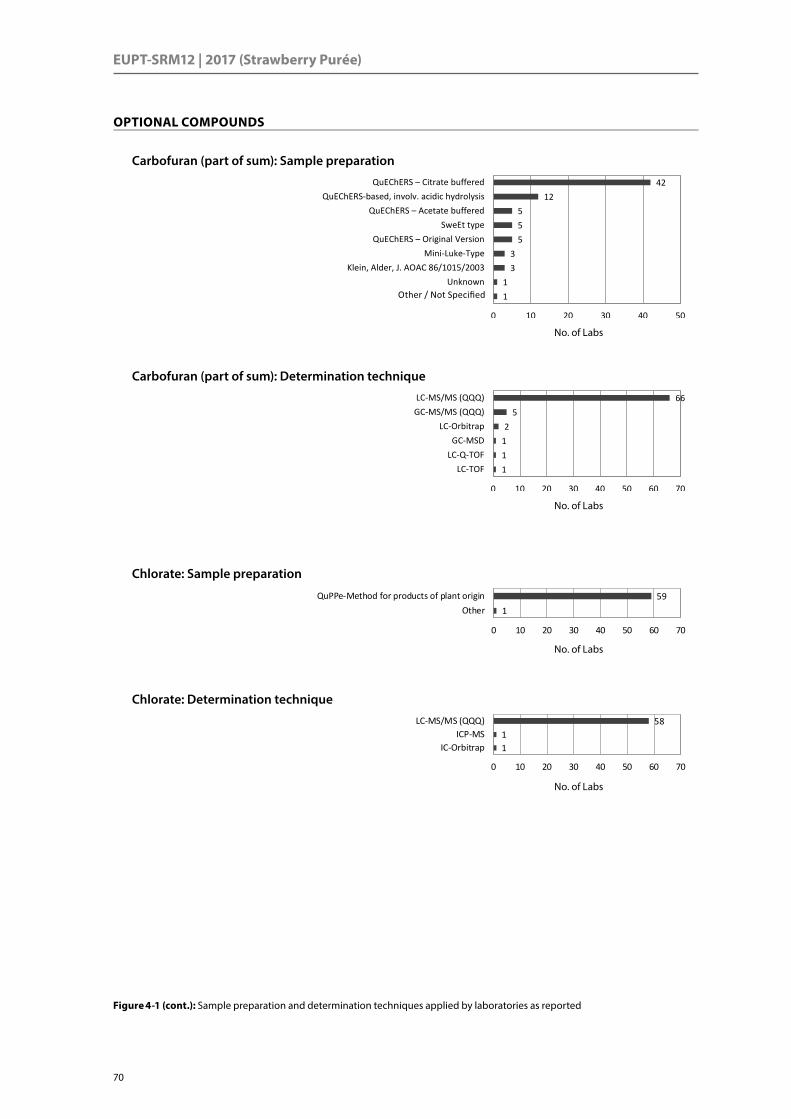
EUPT-SRM12 | 2017 (Strawberry Purée)
70
5811
0 10 20 30 40 50 60 70
LC-MS/MS (QQQ)ICP-MS
IC-Orbitrap
591
0 10 20 30 40 50 60 70
QuPPe-Method for products of plant originOther
4212
555
33
11
0 10 20 30 40 50
QuEChERS – Citrate bufferedQuEChERS-based, involv. acidic hydrolysis
QuEChERS – Acetate bufferedSweEt type
QuEChERS – Original VersionMini-Luke-Type
Klein, Alder, J. AOAC 86/1015/2003Unknown
Other
Chlorate: Sample preparation
Chlorate: Determination technique
No. of Labs
No. of Labs
Figure 4-1 (cont.): Sample preparation and determination techniques applied by laboratories as reported
No. of Labs
Carbofuran (part of sum): Sample preparation
Carbofuran (part of sum): Determination technique
No. of Labs
OPTIONAL COMPOUNDS
665
2111
0 10 20 30 40 50 60 70
LC-MS/MS (QQQ)GC-MS/MS (QQQ)
LC-OrbitrapGC-MSD
LC-Q-TOFLC-TOF

4. RESULTS / Methodological Information
71
Resu
lts
4
151
0 10 20
LC-MS/MS (QQQ)IC-Orbitrap
4911
0 10 20 30 40 50 60
LC-MS/MS (QQQ)ICP-MS
IC-Orbitrap
151
0 10 20
QuPPe-Method for products of plant originOther
4911
0 10 20 30 40 50 60
QuPPe-Method for products of plant originQuEChERS – Acidif. w. 1% formic acid in ACN
Other
641
0 10 20 30 40 50 60 70
LC-MS/MS (QQQ)LC-Orbitrap
211515
33
17
0 10 20 30
QuEChERS – Acidif. w. 1% sulfuric acid in ACNQuEChERS – Citrate buffered
QuEChERS – Acidif. w. 1% formic acid in ACNQuEChERS – Acetate bufferedQuEChERS – Original Version
Mini-Luke-TypeOther
Phosphonic acid: Sample preparation
N-Acetyl glyphosate: Sample preparation
Phosphonic acid: Determination technique
N-Acetyl glyphosate: Determination technique
No. of Labs
No. of Labs
No. of Labs
No. of Labs
Figure 4-1 (cont.): Sample preparation and determination techniques applied by laboratories as reported
Dithianon: Sample preparation
Dithianon: Determination technique
No. of Labs
No. of Labs
OPTIONAL COMPOUNDS

EUPT-SRM12 | 2017 (Strawberry Purée)
72
4044
32
1
0 10 20 30 40 50
GC-MS/MS (QQQ)GC- (µ) ECD
GC-MSDLC-MS/MS (QQQ)
GC-Ion TrapGC-TOF
316
444
32
111
6
0 10 20 30 40
QuEChERS – Citrate bufferedSweEt type
QuEChERS – Acetate bufferedMini-Luke-Type
Captan/Folpet & Co.: via GC-MS(/MS) using ILISQuEChERS – Original Version
QuEChERS – Acidif. w. 1% sulfuric acid in ACNS-19 (§64 LFGB L00.00-334)
Klein, Alder, J. AOAC 86/1015/2003QuEChERS – Acidif. w. 1% formic acid in ACN
Other / Not Specified
3944
3111
0 10 20 30 40 50
GC-MS/MS (QQQ)GC- (µ) ECD
GC-MSDLC-MS/MS (QQQ)
LC-TOFGC-Ion Trap
GC-TOF
325
44
33
2111
6
0 10 20 30 40
QuEChERS – Citrate bufferedSweEt type
QuEChERS – Acetate bufferedMini-Luke-Type
QuEChERS – Original VersionCaptan/Folpet & Co.: via GC-MS(/MS) using ILIS
QuEChERS – Acidif. w. 1% sulfuric acid in ACNS-19 (§64 LFGB L00.00-334)
Klein, Alder, J. AOAC 86/1015/2003QuEChERS – Acidif. w. 1% formic acid in ACN
Other
Folpet (sum): Sample preparation
Folpet (sum): Determination technique
No. of Labs
No. of Labs
Captan (sum): Sample preparation
Captan (sum): Determination technique
No. of Labs
No. of Labs
Figure 4-1 (cont.): Sample preparation and determination techniques applied by laboratories as reported
ADDITIONAL COMPOUNDS

4. RESULTS / Methodological Information
73
Resu
lts
4
537
42
11
0 10 20 30 40 50 60
GC-MS/MS (QQQ)GC- (µ) ECD
GC-MSDGC-TOF
GC-Ion TrapLC-MS/MS (QQQ)
3966
433
21112
0 10 20 30 40 50
QuEChERS – Citrate bufferedQuEChERS – Acetate buffered
SweEt typeMini-Luke-Type
QuEChERS – Original VersionCaptan/Folpet & Co.: via GC-MS(/MS) using ILIS
QuEChERS – Acidif. w. 1% sulfuric acid in ACNS-19 (§64 LFGB L00.00-334)
Klein, Alder, J. AOAC 86/1015/2003QuEChERS – Acidif. w. 1% formic acid in ACN
Other
564
32
111
0 10 20 30 40 50 60
GC-MS/MS (QQQ)GC-MSD
GC-Ion TrapGC-TOF
GC- (µ) ECDLC-MS/MS (QQQ)
GC-NPD
406
54
33
21112
0 10 20 30 40 50
QuEChERS – Citrate bufferedQuEChERS – Acetate buffered
SweEt typeMini-Luke-Type
QuEChERS – Original VersionCaptan/Folpet & Co.: via GC-MS(/MS) using ILIS
QuEChERS – Acidif. w. 1% sulfuric acid in ACNS-19 (§64 LFGB L00.00-334)
Klein, Alder, J. AOAC 86/1015/2003QuEChERS – Acidif. w. 1% formic acid in ACN
Other
Figure 4-1 (cont.): Sample preparation and determination techniques applied by laboratories as reported
ADDITIONAL COMPOUNDS
Phthalimide: Sample preparation
Phthalimide: Determination technique
No. of Labs
No. of Labs
No. of Labs
THPI: Sample preparation
THPI: Determination technique
No. of Labs

EUPT-SRM12 | 2017 (Strawberry Purée)
Table 4-13: Calibration approaches and internal standrads employed (aggregation by internal standards)
COMPULSORY COMPOUNDS OPTIONAL COMPOUNDS ADDITIONAL COMPOUNDS SUM
Internal Standards (IS) used 2,
4-D
Capt
an (p
aren
t)
Chlo
roth
alon
il
Dith
ioca
rbam
ates
Fenb
utat
in O
xide
Folp
et (p
aren
t)
Glyp
hosa
te
Halo
xyfo
p
Sum
of C
ompu
lsory
Com
poun
ds
Bife
naza
te
Brom
ide i
on
Carb
ofur
an
Chlo
rate
Dith
iano
n
Phos
phon
ic ac
id
N-Ac
etyl
gly
phos
ate
Sum
of O
ptio
nal C
ompo
unds
Internal Standards (IS) used Ca
ptan
(sum
)
Folp
et (s
um)
THPI
Phth
alim
ide
Sum
of A
dditi
onal
Com
poun
ds
Yes, ILISs Sum 3 (3 %)
20 (20 %)
– (0 %)
3 (3 %)
1 (1 %)
16 (16 %)
55 (60 %)
– (0 %)
98 (12 %)
– (0 %)
– (0 %)
2 (3 %)
38 (63 %)
12 (18 %)
31 (61 %)
2 (13 %)
85 (22 %)
Yes, ILISs Sum 9 (14 %)
8 (12 %)
5 (7 %)
3 (4 %)
25 (9 %)
208 (14 %)
Procedural calibr. 5 3 10 (11 %)
18 (2 %)
6 (10 %)
7 (14 %)
13 (3 %)
Procedural calibr. 1 1 (0.4 %)
32 (2 %)
Std add. to sample PORTIONS
1 1 1 1 4 (0.5 %)
1 2 2 3 1 9 (2 %)
Std add. to sample PORTIONS
1 1 2 (1 %)
15 (1 %)
Std add. to extract ALIQUOTS
1 5 5 4 15 (2 %)
1 2 1 4 (1 %)
Std add. to extract ALIQUOTS
2 2 3 2 9 (3 %)
28 (2 %)
MATRIX based: same matrix / other matrix [not specified]
5 / 0 [0]
5 / 0 [1]
19 / 1 [1]
(23 %)
32 (4 %)
14 / 0 [0]
(23 %)
3 / 1 [0]
9 / 0 [0]
(18 %)
27 (7 %)
MATRIX based: same matrix / other matrix [not specified]
4 / 0 [0]
3 / 0 [1]
2 / 0 [0]
0 / 0 [1]
11 (4 %)
70 (5 %)
Pure SOLVENT based
1 3 3 1 1 17 (18 %)
26 (3 %)
13 (22 %)
4 11 (22 %)
1 29 (8 %)
Pure SOLVENT based
1 1 2 (1 %)
57 (4 %)
No Data on calibration
1 2 3 (0.4 %)
1 1 1 3 (1 %)
No Data on calibration
6 (0 %)
Yes, other IS Sum 46 (44 %)
44 (45 %)
72 (60 %)
17 (15 %)
35 (40 %)
50 (49 %)
– (0 %)
48 (48 %)
312 (38 %)
30 (54 %)
14 (25 %)
34 (44 %)
7 (12 %)
21 (32 %)
4 (8 %)
3 (19 %)
113 (30 %)
Yes, other IS Sum 28 (43 %)
29 (44 %)
42 (62 %)
44 (65 %)
143 (54 %)
568 (39 %)
Procedural calibr. 4 2 8 2 4 4 4 28 (3 %)
4 5 (9 %)
4 4 17 (4 %)
Procedural calibr. 3 4 6 6 19 (7 %)
64 (4 %)
Std add. to sample PORTIONS
2 4 2 1 3 3 3 18 (2 %)
3 3 1 7 (2 %)
Std add. to sample PORTIONS
1 1 3 3 8 (3 %)
33 (2 %)
Std add. to extract ALIQUOTS
5 3 6 5 3 6 28 (3 %)
2 2 3 1 8 (2 %)
Std add. to extract ALIQUOTS
2 3 5 (2 %)
41 (3 %)
MATRIX based: same matrix / other matrix [not specified]
22 / 2 [2]
(25 %)
22 / 5 [2]
(30 %)
38 / 5 [5]
(40 %)
3 / 0 [2]
17 / 2 [1]
(23 %)
26 / 5 [1]
(31 %)
20 / 3 [2]
(25 %)
185 (23 %)
13 / 4 [1]
(32 %)
1 / 0 [0]
18 / 4 [1]
(30 %)
4 / 2 [0]
(10 %)
5 / 2 [2]
(14 %)
1 / 1 [0]
3 / 0 [0]
62 (16 %)
MATRIX based: same matrix / other matrix [not specified]
17 / 4 [2]
(35 %)
17 / 4 [1]
(33 %)
18 / 5 [2]
(37 %)
20 / 5 [1]
(38 %)
96 (36 %)
343 (23 %)
Pure SOLVENT based
9 6 7 8 3 6 9 48 (6 %)
3 7 (13 %)
2 1 4 1 18 (5 %)
Pure SOLVENT based
1 2 5 5 13 (5 %)
79 (5 %)
No Data 1 1 2 1 5 (1 %)
1 1 (0 %)
No Data 1 1 2 (1 %)
8 (1 %)
No Sum 49 (47 %)
27 (28 %)
39 (33 %)
80 (70 %)
43 (49 %)
30 (29 %)
33 (36 %)
47 (47 %)
348 (42 %)
21 (38 %)
35 (64 %)
32 (42 %)
12 (20 %)
25 (38 %)
13 (25 %)
10 (63 %)
148 (39 %)
No Sum 10 (15 %)
11 (17 %)
18 (26 %)
17 (25 %)
56 (21 %)
552 (38 %)
Procedural calibr. 2 1 6 4 6 2 21 (3 %)
2 3 2 2 3 1 4 17 (4 %)
Procedural calibr. 38 (3 %)
Std add. to sample PORTIONS
2 5 2 2 3 14 (2 %)
1 3 1 1 2 8 (2 %)
Std add. to sample PORTIONS
1 1 2 (1 %)
24 (2 %)
Std add. to extract ALIQUOTS
3 2 3 4 2 3 3 20 (2 %)
3 1 3 3 2 4 16 (4 %)
Std add. to extract ALIQUOTS
2 2 4 (1 %)
40 (3 %)
MATRIX based: same matrix / other matrix [not specified]
37 / 2 [2]
(39 %)
18 / 1 [4]
(23 %)
25 / 3 [3]
(26 %)
13 / 2 [0]
(13 %)
25 / 2 [1]
(32 %)
19 / 1 [3]
(22 %)
18 / 0 [1]
(21 %)
33 / 2 [1]
(36 %)
216 (26 %)
9 / 1 [2]
(21 %)
7 / 0 [1]
(15 %)
19 / 2 [2]
(30 %)
5 / 0 [1]
(10 %)
19 / 0 [0]
(29 %)
4 / 0 [1]
(10 %)
4 / 0 [1]
(31 %)
78 (21 %)
MATRIX based: same matrix / other matrix [not specified]
8 / 0 [1]
(14 %)
9 / 0 [1]
(15 %)
14 / 0 [1]
(22 %)
12 / 0 [1]
(19 %)
47 (18 %)
341 (23 %)
Pure SOLVENT based
2 2 1 51 (45 %)
7 3 1 2 69 (8 %)
3 18 (33 %)
4 1 1 27 (7 %)
Pure SOLVENT based
1 1 (0.4 %)
97 (7 %)
Other 1 1 1 1 4 (0.5 %)
1 1 (0.3 %)
Other 5 (0 %)
No Data 1 2 1 4 (0.5 %)
1 1 (0.3 %)
No Data 1 1 2 (1 %)
7 (0 %)
No data on IS Sum 6 (6 %)
7 (7 %)
9 (8 %)
14 (12 %)
8 (9 %)
7 (7 %)
4 (4 %)
6 (6 %)
61 (7 %)
5 (9 %)
6 (11 %)
9 (12 %)
3 (5 %)
7 (11 %)
3 (6 %)
1 (6 %)
34 (9 %)
No data on IS Sum 18 (28 %)
18 (27 %)
3 (4 %)
4 (6 %)
43 (16 %)
138 (9 %)
Procedural calibr. 2 1 1 1 1 1 2 9 (1 %)
1 1 2 2 6 (2 %)
Procedural calibr. 2 2 4 (1 %)
19 (1 %)
Std add. to sample PORTIONS
2 3 3 2 3 1 2 16 (2 %)
2 2 2 2 2 2 1 13 (3 %)
Std add. to sample PORTIONS
1 1 1 1 4 (1 %)
33 (2 %)
MATRIX based: same matrix / other matrix [not specified]
[1] [2] 3 / 0 [1]
1 / 0 [2]
2 / 0 [1]
2 / 0 [0]
1 / 0 [0]
1 / 0 [0]
17 (2 %)
1 / 0 [0]
0 / 0 [1]
2 / 0 [1]
1 / 0 [0]
2 / 0 [1]
1 / 0 [0]
10 (3 %)
MATRIX based: same matrix / other matrix [not specified]
3 / 0 [1]
3 / 0 [1]
1 / 0 [1]
1 / 0 [1]
12 (4 %)
39 (3 %)
Pure SOLVENT based
1 1 1 7 1 1 2 1 15 (2 %)
1 2 1 4 (1 %)
Pure SOLVENT based
1 1 (0.4 %)
20 (1 %)
Other Other 1 1 2 (1 %)
2 (0 %)
No Data 3 1 4 (0.5 %)
1 1 (0.3 %)
No Data 10 10 20 (7 %)
25 (2 %)
Overall 104 98 120 114 87 103 92 101 819 56 55 77 60 65 51 16 380 Overall 65 66 68 68 267 1466Corrected for matrix effects 83
(80 %)75
(77 %)92
(77 %)35
(31 %)68
(78 %)81
(79 %)86
(93 %)79
(78 %)599
(73 %)41
(73 %)23
(42 %)59
(77 %)56
(93 %)50
(77 %)47
(92 %)14
(88 %)290
(76 %)Corrected for matrix effects 44
(68 %)45
(68 %)53
(78 %)52
(76 %)194
(73 %)1083
(74 %)Percentages in parentheses for each of the compounds based on the number of laboratories analysed for these compounds; percentages in parentheses for each group of compounds based on the sum of total number of results in each group
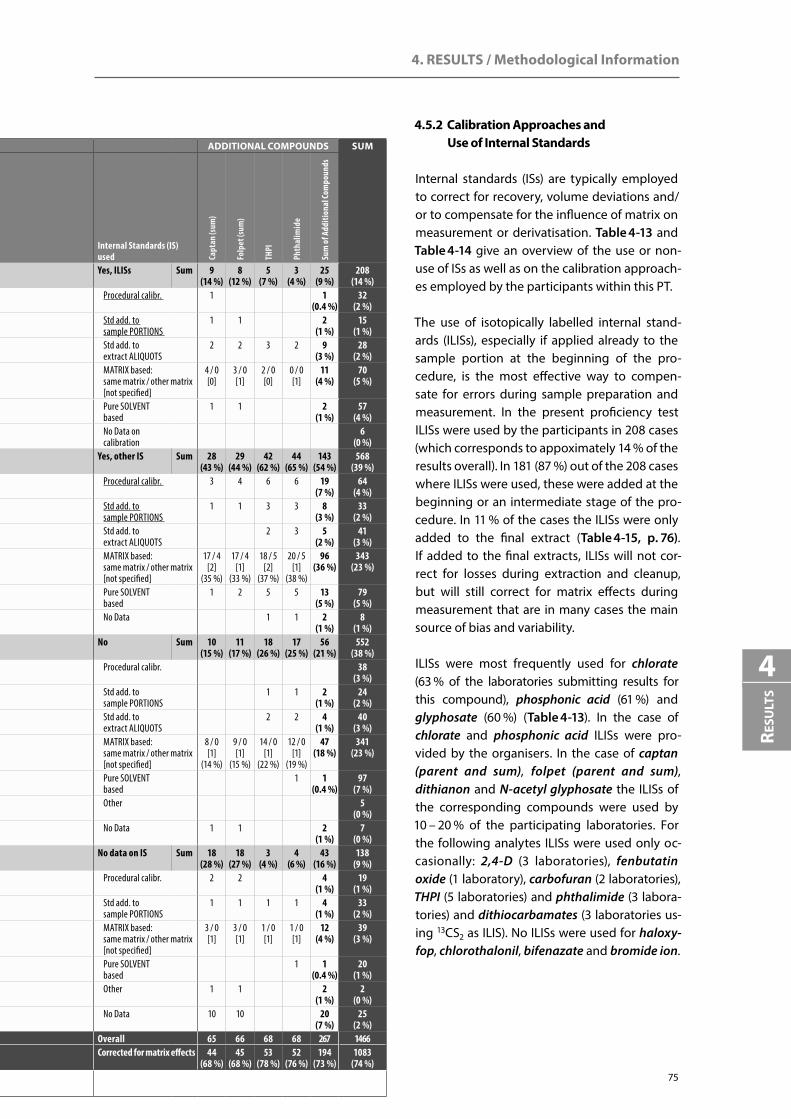
4. RESULTS / Methodological Information
75
Resu
lts
4
4.5.2 Calibration Approaches and Use of Internal Standards
Internal standards (ISs) are typically employed to correct for recovery, volume deviations and/or to compensate for the influence of matrix on measurement or derivatisation. Table 4-13 and Table 4-14 give an overview of the use or non-use of ISs as well as on the calibration approach-es employed by the participants within this PT.
The use of isotopically labelled internal stand-ards (ILISs), especially if applied already to the sample portion at the beginning of the pro-cedure, is the most effective way to compen-sate for errors during sample preparation and measurement. In the present proficiency test ILISs were used by the participants in 208 cases (which corresponds to appoximately 14 % of the results overall). In 181 (87 %) out of the 208 cases where ILISs were used, these were added at the beginning or an intermediate stage of the pro-cedure. In 11 % of the cases the ILISs were only added to the final extract (Table 4-15, p. 76). If added to the final extracts, ILISs will not cor-rect for losses during extraction and cleanup, but will still correct for matrix effects during measurement that are in many cases the main source of bias and variability.
ILISs were most frequently used for chlorate (63 % of the laboratories submitting results for this compound), phosphonic acid (61 %) and glyphosate (60 %) (Table 4-13). In the case of chlorate and phosphonic acid ILISs were pro-vided by the organisers. In the case of captan (parent and sum), folpet (parent and sum), dithianon and N-acetyl glyphosate the ILISs of the corresponding compounds were used by 10 – 20 % of the participating laboratories. For the following analytes ILISs were used only oc-casionally: 2,4-D (3 laboratories), fenbutatin oxide (1 laboratory), carbofuran (2 laboratories), THPI (5 laboratories) and phthalimide (3 labora-tories) and dithiocarbamates (3 laboratories us-ing 13CS2 as ILIS). No ILISs were used for haloxy-fop, chlorothalonil, bifenazate and bromide ion.
COMPULSORY COMPOUNDS OPTIONAL COMPOUNDS ADDITIONAL COMPOUNDS SUM
Internal Standards (IS) used 2,
4-D
Capt
an (p
aren
t)
Chlo
roth
alon
il
Dith
ioca
rbam
ates
Fenb
utat
in O
xide
Folp
et (p
aren
t)
Glyp
hosa
te
Halo
xyfo
p
Sum
of C
ompu
lsory
Com
poun
ds
Bife
naza
te
Brom
ide i
on
Carb
ofur
an
Chlo
rate
Dith
iano
n
Phos
phon
ic ac
id
N-Ac
etyl
gly
phos
ate
Sum
of O
ptio
nal C
ompo
unds
Internal Standards (IS) used Ca
ptan
(sum
)
Folp
et (s
um)
THPI
Phth
alim
ide
Sum
of A
dditi
onal
Com
poun
ds
Yes, ILISs Sum 3 (3 %)
20 (20 %)
– (0 %)
3 (3 %)
1 (1 %)
16 (16 %)
55 (60 %)
– (0 %)
98 (12 %)
– (0 %)
– (0 %)
2 (3 %)
38 (63 %)
12 (18 %)
31 (61 %)
2 (13 %)
85 (22 %)
Yes, ILISs Sum 9 (14 %)
8 (12 %)
5 (7 %)
3 (4 %)
25 (9 %)
208 (14 %)
Procedural calibr. 5 3 10 (11 %)
18 (2 %)
6 (10 %)
7 (14 %)
13 (3 %)
Procedural calibr. 1 1 (0.4 %)
32 (2 %)
Std add. to sample PORTIONS
1 1 1 1 4 (0.5 %)
1 2 2 3 1 9 (2 %)
Std add. to sample PORTIONS
1 1 2 (1 %)
15 (1 %)
Std add. to extract ALIQUOTS
1 5 5 4 15 (2 %)
1 2 1 4 (1 %)
Std add. to extract ALIQUOTS
2 2 3 2 9 (3 %)
28 (2 %)
MATRIX based: same matrix / other matrix [not specified]
5 / 0 [0]
5 / 0 [1]
19 / 1 [1]
(23 %)
32 (4 %)
14 / 0 [0]
(23 %)
3 / 1 [0]
9 / 0 [0]
(18 %)
27 (7 %)
MATRIX based: same matrix / other matrix [not specified]
4 / 0 [0]
3 / 0 [1]
2 / 0 [0]
0 / 0 [1]
11 (4 %)
70 (5 %)
Pure SOLVENT based
1 3 3 1 1 17 (18 %)
26 (3 %)
13 (22 %)
4 11 (22 %)
1 29 (8 %)
Pure SOLVENT based
1 1 2 (1 %)
57 (4 %)
No Data on calibration
1 2 3 (0.4 %)
1 1 1 3 (1 %)
No Data on calibration
6 (0 %)
Yes, other IS Sum 46 (44 %)
44 (45 %)
72 (60 %)
17 (15 %)
35 (40 %)
50 (49 %)
– (0 %)
48 (48 %)
312 (38 %)
30 (54 %)
14 (25 %)
34 (44 %)
7 (12 %)
21 (32 %)
4 (8 %)
3 (19 %)
113 (30 %)
Yes, other IS Sum 28 (43 %)
29 (44 %)
42 (62 %)
44 (65 %)
143 (54 %)
568 (39 %)
Procedural calibr. 4 2 8 2 4 4 4 28 (3 %)
4 5 (9 %)
4 4 17 (4 %)
Procedural calibr. 3 4 6 6 19 (7 %)
64 (4 %)
Std add. to sample PORTIONS
2 4 2 1 3 3 3 18 (2 %)
3 3 1 7 (2 %)
Std add. to sample PORTIONS
1 1 3 3 8 (3 %)
33 (2 %)
Std add. to extract ALIQUOTS
5 3 6 5 3 6 28 (3 %)
2 2 3 1 8 (2 %)
Std add. to extract ALIQUOTS
2 3 5 (2 %)
41 (3 %)
MATRIX based: same matrix / other matrix [not specified]
22 / 2 [2]
(25 %)
22 / 5 [2]
(30 %)
38 / 5 [5]
(40 %)
3 / 0 [2]
17 / 2 [1]
(23 %)
26 / 5 [1]
(31 %)
20 / 3 [2]
(25 %)
185 (23 %)
13 / 4 [1]
(32 %)
1 / 0 [0]
18 / 4 [1]
(30 %)
4 / 2 [0]
(10 %)
5 / 2 [2]
(14 %)
1 / 1 [0]
3 / 0 [0]
62 (16 %)
MATRIX based: same matrix / other matrix [not specified]
17 / 4 [2]
(35 %)
17 / 4 [1]
(33 %)
18 / 5 [2]
(37 %)
20 / 5 [1]
(38 %)
96 (36 %)
343 (23 %)
Pure SOLVENT based
9 6 7 8 3 6 9 48 (6 %)
3 7 (13 %)
2 1 4 1 18 (5 %)
Pure SOLVENT based
1 2 5 5 13 (5 %)
79 (5 %)
No Data 1 1 2 1 5 (1 %)
1 1 (0 %)
No Data 1 1 2 (1 %)
8 (1 %)
No Sum 49 (47 %)
27 (28 %)
39 (33 %)
80 (70 %)
43 (49 %)
30 (29 %)
33 (36 %)
47 (47 %)
348 (42 %)
21 (38 %)
35 (64 %)
32 (42 %)
12 (20 %)
25 (38 %)
13 (25 %)
10 (63 %)
148 (39 %)
No Sum 10 (15 %)
11 (17 %)
18 (26 %)
17 (25 %)
56 (21 %)
552 (38 %)
Procedural calibr. 2 1 6 4 6 2 21 (3 %)
2 3 2 2 3 1 4 17 (4 %)
Procedural calibr. 38 (3 %)
Std add. to sample PORTIONS
2 5 2 2 3 14 (2 %)
1 3 1 1 2 8 (2 %)
Std add. to sample PORTIONS
1 1 2 (1 %)
24 (2 %)
Std add. to extract ALIQUOTS
3 2 3 4 2 3 3 20 (2 %)
3 1 3 3 2 4 16 (4 %)
Std add. to extract ALIQUOTS
2 2 4 (1 %)
40 (3 %)
MATRIX based: same matrix / other matrix [not specified]
37 / 2 [2]
(39 %)
18 / 1 [4]
(23 %)
25 / 3 [3]
(26 %)
13 / 2 [0]
(13 %)
25 / 2 [1]
(32 %)
19 / 1 [3]
(22 %)
18 / 0 [1]
(21 %)
33 / 2 [1]
(36 %)
216 (26 %)
9 / 1 [2]
(21 %)
7 / 0 [1]
(15 %)
19 / 2 [2]
(30 %)
5 / 0 [1]
(10 %)
19 / 0 [0]
(29 %)
4 / 0 [1]
(10 %)
4 / 0 [1]
(31 %)
78 (21 %)
MATRIX based: same matrix / other matrix [not specified]
8 / 0 [1]
(14 %)
9 / 0 [1]
(15 %)
14 / 0 [1]
(22 %)
12 / 0 [1]
(19 %)
47 (18 %)
341 (23 %)
Pure SOLVENT based
2 2 1 51 (45 %)
7 3 1 2 69 (8 %)
3 18 (33 %)
4 1 1 27 (7 %)
Pure SOLVENT based
1 1 (0.4 %)
97 (7 %)
Other 1 1 1 1 4 (0.5 %)
1 1 (0.3 %)
Other 5 (0 %)
No Data 1 2 1 4 (0.5 %)
1 1 (0.3 %)
No Data 1 1 2 (1 %)
7 (0 %)
No data on IS Sum 6 (6 %)
7 (7 %)
9 (8 %)
14 (12 %)
8 (9 %)
7 (7 %)
4 (4 %)
6 (6 %)
61 (7 %)
5 (9 %)
6 (11 %)
9 (12 %)
3 (5 %)
7 (11 %)
3 (6 %)
1 (6 %)
34 (9 %)
No data on IS Sum 18 (28 %)
18 (27 %)
3 (4 %)
4 (6 %)
43 (16 %)
138 (9 %)
Procedural calibr. 2 1 1 1 1 1 2 9 (1 %)
1 1 2 2 6 (2 %)
Procedural calibr. 2 2 4 (1 %)
19 (1 %)
Std add. to sample PORTIONS
2 3 3 2 3 1 2 16 (2 %)
2 2 2 2 2 2 1 13 (3 %)
Std add. to sample PORTIONS
1 1 1 1 4 (1 %)
33 (2 %)
MATRIX based: same matrix / other matrix [not specified]
[1] [2] 3 / 0 [1]
1 / 0 [2]
2 / 0 [1]
2 / 0 [0]
1 / 0 [0]
1 / 0 [0]
17 (2 %)
1 / 0 [0]
0 / 0 [1]
2 / 0 [1]
1 / 0 [0]
2 / 0 [1]
1 / 0 [0]
10 (3 %)
MATRIX based: same matrix / other matrix [not specified]
3 / 0 [1]
3 / 0 [1]
1 / 0 [1]
1 / 0 [1]
12 (4 %)
39 (3 %)
Pure SOLVENT based
1 1 1 7 1 1 2 1 15 (2 %)
1 2 1 4 (1 %)
Pure SOLVENT based
1 1 (0.4 %)
20 (1 %)
Other Other 1 1 2 (1 %)
2 (0 %)
No Data 3 1 4 (0.5 %)
1 1 (0.3 %)
No Data 10 10 20 (7 %)
25 (2 %)
Overall 104 98 120 114 87 103 92 101 819 56 55 77 60 65 51 16 380 Overall 65 66 68 68 267 1466Corrected for matrix effects 83
(80 %)75
(77 %)92
(77 %)35
(31 %)68
(78 %)81
(79 %)86
(93 %)79
(78 %)599
(73 %)41
(73 %)23
(42 %)59
(77 %)56
(93 %)50
(77 %)47
(92 %)14
(88 %)290
(76 %)Corrected for matrix effects 44
(68 %)45
(68 %)53
(78 %)52
(76 %)194
(73 %)1083
(74 %)Percentages in parentheses for each of the compounds based on the number of laboratories analysed for these compounds; percentages in parentheses for each group of compounds based on the sum of total number of results in each group

EUPT-SRM12 | 2017 (Strawberry Purée)
76
Table 4-15: Stages of the procedure at which the internal standards were used in the EUPT-SRM12 for the analysis
COMPULSORY COMPOUNDS OPTIONAL COMPOUNDS ADDITIONAL COMPOUNDS SUM MAxIMUM OF EACH CALIBRATION TYPE
Calibration Type 2,4-
D
Capt
an (p
aren
t)
Chlo
roth
alon
il
Dith
ioca
rbam
ates
Fenb
utat
in O
xide
Folp
et (p
aren
t)
Glyp
hosa
te
Halo
xyfo
p
Sum
of C
ompu
lsory
Com
poun
ds
Bife
naza
te
Brom
ide i
on
Carb
ofur
an
Chlo
rate
Dith
iano
n
Phos
phon
ic ac
id
N-Ac
etyl
gly
phos
ate
Sum
of O
ptio
nal C
ompo
unds
Internal Standards (IS) used Ca
ptan
(sum
)
Folp
et (s
um)
THPI
Phth
alim
ide
Sum
of A
dditi
onal
Com
poun
ds
Procedural calibr. 8 8 10 9 9 8 16 (17 %)
8 76 (9 %)
7 9 (16 %)
8 8 9 8 (16 %)
4 (25 %)
53 (14 %)
Procedural calibr. 6 6 6 6 24 (9 %)
153 (10 %)
Procedural calibr. glyphosate (17 %), bromide (16 %), phosphonic acid (16 %)
Std add. to sample PORTIONS
5 8 7 6 5 9 4 8 52 (6 %)
6 5 6 5 6 7 (14 %)
2 37 (10 %)
Std add. to sample PORTIONS
3 3 5 5 16 (6 %)
105 (7 %)
Std add. to sample PORTIONS
phosphonic acid 14 %
Std add. to extract ALIQUOTS
9 10 (10 %)
9 9 (10 %)
10 (10 %)
7 9 63 (8 %)
5 1 6 5 6 5 28 (7 %)
Std add. to extract ALIQUOTS
2 2 7 (10 %)
7 (10 %)
18 (7 %)
109 (7 %)
Std add. to extract ALIQUOTS
captan, folpet, THPI, phthalimid, fenbutatin oxide (10 % each)
MATRIX based 68 (65 %)
59 (60 %)
83 (69 %)
23 (20 %)
51 (59 %)
63 (61 %)
41 (45 %)
62 (61 %)
450 (55 %)
31 (55 %)
10 49 (64 %)
27 (45 %)
35 (54 %)
17 (33 %)
8 (50 %)
177 (47 %)
MATRIX based 40 (62 %)
40 (61 %)
44 (65 %)
42 (62 %)
166 (62 %)
793 (54 %)
MATRIX-based chlorothalonil (69 %), 2,4-D (65 %)
Matrix-Matched (= Strawberry as Matrix)
60 (58 %)
47 (48 %)
66 (55 %)
17 (15 %)
44 (51 %)
52 (50 %)
38 (41 %)
54 (53 %)
378 (46 %)
23 (41 %)
8 (15 %)
39 (51 %)
24 (40 %)
29 (45 %)
15 (29 %)
7 (44 %)
145 (38 %)
Matrix-Matched (= Strawberry as Matrix)
32 (49 %)
32 (48 %)
35 (51 %)
33 (49 %)
132 (49 %)
655 (45 %)
MATRIX-Matched 2,4-D (58 %), chlorothalonil (55 %)
Other Matrix 8 (8 %)
12 (12 %)
17 (14 %)
6 (5 %)
7 (8 %)
11 (11 %)
3 (3 %)
8 (8 %)
72 (9 %)
8 (14 %)
2 (4 %)
10 (13 %)
3 (5 %)
6 (9 %)
2 (4 %)
1 (6 %)
32 (8 %)
Other Matrix 8 (12 %)
8 (12 %)
9 (13 %)
9 (13 %)
34 (13 %)
138 (9 %)
Pure SOLVENT based 13 12 9 69 (61 %)
12 11 20 (22 %)
12 158 (19 %)
7 27 (49 %)
7 14 8 13 2 78 (21 %)
Pure SOLVENT based 2 3 5 7 17 (6 %)
253 (17 %)
Pure SOLVENT based dithiocarbamates (61 %)
Other 1 1 1 1 4 (0 %)
1 1 (0 %)
Other 1 1 2 (1 %)
7 (0 %)
No Data on Calibration 1 2 6 1 2 3 1 16 (2 %)
2 1 1 1 1 6 (2 %)
No Data on Calibration 11 11 1 1 24 (9 %)
46 (3 %)
Overall 104 98 120 114 87 103 92 101 819 56 55 77 60 65 51 16 380 Overall 65 66 68 68 267 1466
The percentages in brackets refer to the overall population stated at the bottom of the table
Table 4-14: Calibration approaches employed for the analysis (aggregated by type of calibration)
COMPULSORY COMPOUNDS OPTIONAL COMPOUNDS OPTIONAL COMPOUNDS ADDITIONAL COMPOUNDS ALL COMPOUNDS
Q: was IS used? 2,4-
D
Capt
an
(par
ent)
Chlo
roth
alon
il
Dith
ioca
rbam
ates
Fenb
utat
in O
xide
Folp
et
(par
ent)
Glyp
hosa
te
Halo
xyfo
p
Over
all
(Com
pulso
ry Co
mpo
unds
)
Bife
naza
te
Brom
ide i
on
Carb
ofur
an
Chlo
rate
Q: was IS used? Dith
iano
n
Phos
phon
ic ac
id
N-Ac
etyl
gly
phos
ate
Over
all
(Opt
iona
l Com
poun
ds)
Capt
an
(sum
)
Folp
et
(sum
)
THPI
Phth
alim
ide
Over
all
(Add
ition
al Co
mpo
unds
)
Over
all
ISs were added to... ISs were added to...
Yes, ILISs Sum 3 20 – 3 1 16 55 – 98 – – 2 38 Yes, ILISs Sum 12 31 2 85 9 8 5 3 25 208
1) at the beginning of procedure 3 (100 %)
16 (80 %)
– 3 (100 %)
1 (100 %)
12 (75 %)
47 (85 %)
– 82 (84 %)
– – 2 (100 %)
34 (89 %) 1) at the beginning of procedure 11
(92 %)27
(87 %)2
(100 %)76
(89 %)8
(89 %)7
(88 %)3
(60 %)2
(67 %)20
(80 %)178
(86 %)
2) at an intermediate stage (between 1 and 3)
– – – – – – 2 (4 %)
– 2 (2 %)
– – – – 3) at an intermediate stage (between 1 and 2)
– 1 (3 %)
– 1 (1 %)
– – – – – 3 (1 %)
3) to an aliquot of the final extract
– 4 (20 %)
– – – 4 (25 %)
4 (7 %)
– 12 (12 %)
– – – 3 (8 %)
2) to an aliquot of the final extract
1 (8 %)
2 (6 %)
– 6 (7 %)
1 (11 %)
1 (13 %)
2 (40 %)
1 (33 %)
5 (20 %)
23 (11 %)
No Data – – – – – – 2 (4 %)
– 2 (2 %)
– – – 1 (3 %) No Data – 1
(3 %)– 2
(2 %)– – – – – 4
(2 %)
Yes, other ISs Sum 46 44 72 17 35 50 – (0 %) 48 312 30 14 34 7 Yes, other ISs Sum 21 4 3 113 29 30 42 44 145 570
1) at the beginning of procedure 37 (80 %)
29 (66 %)
55 (76 %)
13 (76 %)
28 (80 %)
35 (70 %) – 38
(79 %)235
(75 %)24
(80 %)7
(50 %)23
(68 %)6
(86 %) 1) at the beginning of procedure 17 (81 %)
3 (75 %)
3 (100 %)
83 (73 %)
19 (66 %)
21 (70 %)
30 (71 %)
31 (70 %)
101 (70 %)
419 (74 %)
2) at an intermediate stage (between 1 and 3) – 3
(7 %)3
(4 %)2
(12 %) – 3 (6 %) – – 11
(4 %) – 2 (14 %) – – 3) at an intermediate stage
(between 1 and 2) – 1 (25 %) – 3
(3 %)1
(3 %)1
(3 %)1
(2 %)1
(2 %)4
(3 %)18
(3 %)
3) to an aliquot of the final extract
9 (20 %)
12 (27 %)
14 (19 %)
2 (12 %)
7 (20 %)
12 (24 %) – 10
(21 %)66
(21 %)6
(20 %)5
(36 %)11
(32 %)1
(14 %)2) to an aliquot of the
final extract4
(19 %) – – 27 (24 %)
9 (31 %)
8 (27 %)
11 (26 %)
12 (27 %)
40 (28 %)
133 (23 %)
No Sum 48 + 1* 26 + 1* 39 79 + 1* 42 + 1* 30 33 46 + 1* 343 + 5* 21 35 32 12 No Sum 24 + 1* 13 10 147 + 1* 10 11 18 17 56 546 + 6*
No data Sum 6 7 9 14 8 7 4 6 61 5 6 9 3 No data Sum 7 3 1 34 17 17 3 4 41 136
Overall 104 98 120 114 87 103 92 101 819 56 55 77 60 Overall 65 51 16 380 65 66 68 68 267 1466Percentages in parentheses for each of the compounds refer to the respective subporpulation. * ISs or ILISs were used only for the purpose of quality control, not used for calculation of results.
Percentages in parentheses for each of the compounds refer to the respective subporpulation. * ISs or ILISs were used only for the purpose of quality control, not used for calculation of results.

4. RESULTS / Methodological Information
77
Resu
lts
4
COMPULSORY COMPOUNDS OPTIONAL COMPOUNDS ADDITIONAL COMPOUNDS SUM MAxIMUM OF EACH CALIBRATION TYPE
Calibration Type 2,4-
D
Capt
an (p
aren
t)
Chlo
roth
alon
il
Dith
ioca
rbam
ates
Fenb
utat
in O
xide
Folp
et (p
aren
t)
Glyp
hosa
te
Halo
xyfo
p
Sum
of C
ompu
lsory
Com
poun
ds
Bife
naza
te
Brom
ide i
on
Carb
ofur
an
Chlo
rate
Dith
iano
n
Phos
phon
ic ac
id
N-Ac
etyl
gly
phos
ate
Sum
of O
ptio
nal C
ompo
unds
Internal Standards (IS) used Ca
ptan
(sum
)
Folp
et (s
um)
THPI
Phth
alim
ide
Sum
of A
dditi
onal
Com
poun
ds
Procedural calibr. 8 8 10 9 9 8 16 (17 %)
8 76 (9 %)
7 9 (16 %)
8 8 9 8 (16 %)
4 (25 %)
53 (14 %)
Procedural calibr. 6 6 6 6 24 (9 %)
153 (10 %)
Procedural calibr. glyphosate (17 %), bromide (16 %), phosphonic acid (16 %)
Std add. to sample PORTIONS
5 8 7 6 5 9 4 8 52 (6 %)
6 5 6 5 6 7 (14 %)
2 37 (10 %)
Std add. to sample PORTIONS
3 3 5 5 16 (6 %)
105 (7 %)
Std add. to sample PORTIONS
phosphonic acid 14 %
Std add. to extract ALIQUOTS
9 10 (10 %)
9 9 (10 %)
10 (10 %)
7 9 63 (8 %)
5 1 6 5 6 5 28 (7 %)
Std add. to extract ALIQUOTS
2 2 7 (10 %)
7 (10 %)
18 (7 %)
109 (7 %)
Std add. to extract ALIQUOTS
captan, folpet, THPI, phthalimid, fenbutatin oxide (10 % each)
MATRIX based 68 (65 %)
59 (60 %)
83 (69 %)
23 (20 %)
51 (59 %)
63 (61 %)
41 (45 %)
62 (61 %)
450 (55 %)
31 (55 %)
10 49 (64 %)
27 (45 %)
35 (54 %)
17 (33 %)
8 (50 %)
177 (47 %)
MATRIX based 40 (62 %)
40 (61 %)
44 (65 %)
42 (62 %)
166 (62 %)
793 (54 %)
MATRIX-based chlorothalonil (69 %), 2,4-D (65 %)
Matrix-Matched (= Strawberry as Matrix)
60 (58 %)
47 (48 %)
66 (55 %)
17 (15 %)
44 (51 %)
52 (50 %)
38 (41 %)
54 (53 %)
378 (46 %)
23 (41 %)
8 (15 %)
39 (51 %)
24 (40 %)
29 (45 %)
15 (29 %)
7 (44 %)
145 (38 %)
Matrix-Matched (= Strawberry as Matrix)
32 (49 %)
32 (48 %)
35 (51 %)
33 (49 %)
132 (49 %)
655 (45 %)
MATRIX-Matched 2,4-D (58 %), chlorothalonil (55 %)
Other Matrix 8 (8 %)
12 (12 %)
17 (14 %)
6 (5 %)
7 (8 %)
11 (11 %)
3 (3 %)
8 (8 %)
72 (9 %)
8 (14 %)
2 (4 %)
10 (13 %)
3 (5 %)
6 (9 %)
2 (4 %)
1 (6 %)
32 (8 %)
Other Matrix 8 (12 %)
8 (12 %)
9 (13 %)
9 (13 %)
34 (13 %)
138 (9 %)
Pure SOLVENT based 13 12 9 69 (61 %)
12 11 20 (22 %)
12 158 (19 %)
7 27 (49 %)
7 14 8 13 2 78 (21 %)
Pure SOLVENT based 2 3 5 7 17 (6 %)
253 (17 %)
Pure SOLVENT based dithiocarbamates (61 %)
Other 1 1 1 1 4 (0 %)
1 1 (0 %)
Other 1 1 2 (1 %)
7 (0 %)
No Data on Calibration 1 2 6 1 2 3 1 16 (2 %)
2 1 1 1 1 6 (2 %)
No Data on Calibration 11 11 1 1 24 (9 %)
46 (3 %)
Overall 104 98 120 114 87 103 92 101 819 56 55 77 60 65 51 16 380 Overall 65 66 68 68 267 1466
The percentages in brackets refer to the overall population stated at the bottom of the table
Table 4-14: Calibration approaches employed for the analysis (aggregated by type of calibration)
COMPULSORY COMPOUNDS OPTIONAL COMPOUNDS OPTIONAL COMPOUNDS ADDITIONAL COMPOUNDS ALL COMPOUNDS
Q: was IS used? 2,4-
D
Capt
an
(par
ent)
Chlo
roth
alon
il
Dith
ioca
rbam
ates
Fenb
utat
in O
xide
Folp
et
(par
ent)
Glyp
hosa
te
Halo
xyfo
p
Over
all
(Com
pulso
ry Co
mpo
unds
)
Bife
naza
te
Brom
ide i
on
Carb
ofur
an
Chlo
rate
Q: was IS used? Dith
iano
n
Phos
phon
ic ac
id
N-Ac
etyl
gly
phos
ate
Over
all
(Opt
iona
l Com
poun
ds)
Capt
an
(sum
)
Folp
et
(sum
)
THPI
Phth
alim
ide
Over
all
(Add
ition
al Co
mpo
unds
)
Over
all
ISs were added to... ISs were added to...
Yes, ILISs Sum 3 20 – 3 1 16 55 – 98 – – 2 38 Yes, ILISs Sum 12 31 2 85 9 8 5 3 25 208
1) at the beginning of procedure 3 (100 %)
16 (80 %)
– 3 (100 %)
1 (100 %)
12 (75 %)
47 (85 %)
– 82 (84 %)
– – 2 (100 %)
34 (89 %) 1) at the beginning of procedure 11
(92 %)27
(87 %)2
(100 %)76
(89 %)8
(89 %)7
(88 %)3
(60 %)2
(67 %)20
(80 %)178
(86 %)
2) at an intermediate stage (between 1 and 3)
– – – – – – 2 (4 %)
– 2 (2 %)
– – – – 3) at an intermediate stage (between 1 and 2)
– 1 (3 %)
– 1 (1 %)
– – – – – 3 (1 %)
3) to an aliquot of the final extract
– 4 (20 %)
– – – 4 (25 %)
4 (7 %)
– 12 (12 %)
– – – 3 (8 %)
2) to an aliquot of the final extract
1 (8 %)
2 (6 %)
– 6 (7 %)
1 (11 %)
1 (13 %)
2 (40 %)
1 (33 %)
5 (20 %)
23 (11 %)
No Data – – – – – – 2 (4 %)
– 2 (2 %)
– – – 1 (3 %) No Data – 1
(3 %)– 2
(2 %)– – – – – 4
(2 %)
Yes, other ISs Sum 46 44 72 17 35 50 – (0 %) 48 312 30 14 34 7 Yes, other ISs Sum 21 4 3 113 29 30 42 44 145 570
1) at the beginning of procedure 37 (80 %)
29 (66 %)
55 (76 %)
13 (76 %)
28 (80 %)
35 (70 %) – 38
(79 %)235
(75 %)24
(80 %)7
(50 %)23
(68 %)6
(86 %) 1) at the beginning of procedure 17 (81 %)
3 (75 %)
3 (100 %)
83 (73 %)
19 (66 %)
21 (70 %)
30 (71 %)
31 (70 %)
101 (70 %)
419 (74 %)
2) at an intermediate stage (between 1 and 3) – 3
(7 %)3
(4 %)2
(12 %) – 3 (6 %) – – 11
(4 %) – 2 (14 %) – – 3) at an intermediate stage
(between 1 and 2) – 1 (25 %) – 3
(3 %)1
(3 %)1
(3 %)1
(2 %)1
(2 %)4
(3 %)18
(3 %)
3) to an aliquot of the final extract
9 (20 %)
12 (27 %)
14 (19 %)
2 (12 %)
7 (20 %)
12 (24 %) – 10
(21 %)66
(21 %)6
(20 %)5
(36 %)11
(32 %)1
(14 %)2) to an aliquot of the
final extract4
(19 %) – – 27 (24 %)
9 (31 %)
8 (27 %)
11 (26 %)
12 (27 %)
40 (28 %)
133 (23 %)
No Sum 48 + 1* 26 + 1* 39 79 + 1* 42 + 1* 30 33 46 + 1* 343 + 5* 21 35 32 12 No Sum 24 + 1* 13 10 147 + 1* 10 11 18 17 56 546 + 6*
No data Sum 6 7 9 14 8 7 4 6 61 5 6 9 3 No data Sum 7 3 1 34 17 17 3 4 41 136
Overall 104 98 120 114 87 103 92 101 819 56 55 77 60 Overall 65 51 16 380 65 66 68 68 267 1466Percentages in parentheses for each of the compounds refer to the respective subporpulation. * ISs or ILISs were used only for the purpose of quality control, not used for calculation of results.
Percentages in parentheses for each of the compounds refer to the respective subporpulation. * ISs or ILISs were used only for the purpose of quality control, not used for calculation of results.
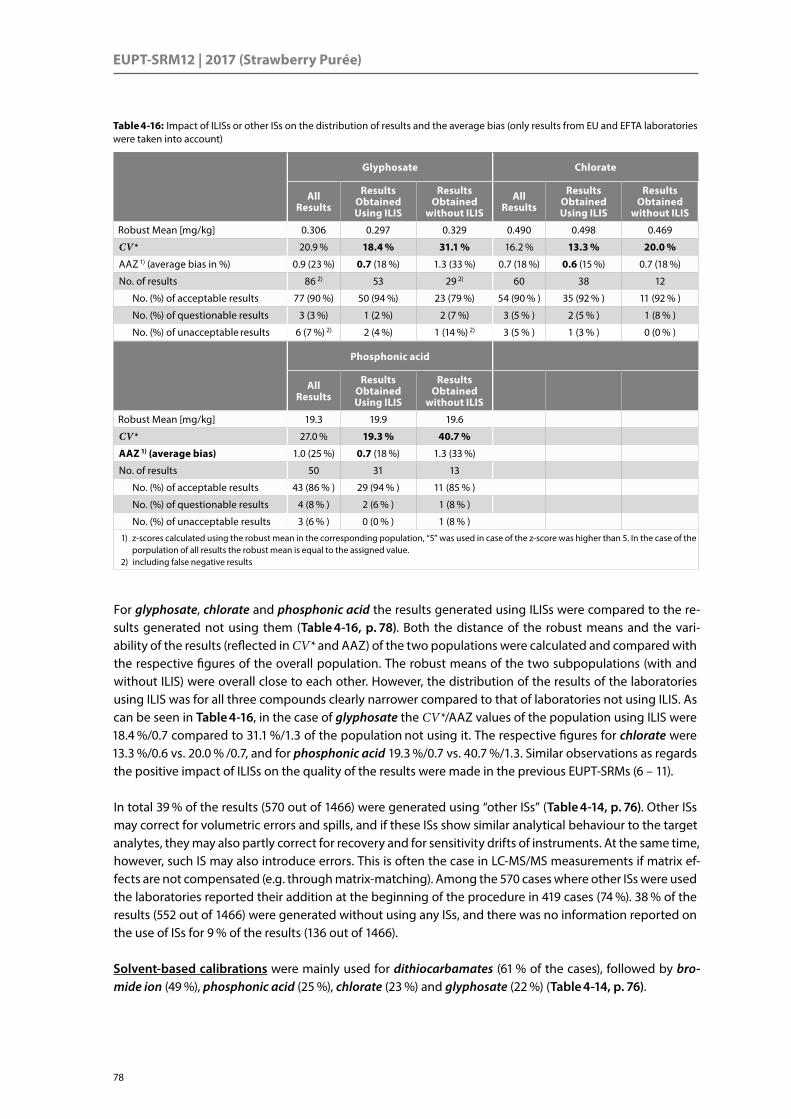
EUPT-SRM12 | 2017 (Strawberry Purée)
78
Table 4-16: Impact of ILISs or other ISs on the distribution of results and the average bias (only results from EU and EFTA laboratories were taken into account)
Glyphosate Chlorate
All Results
Results Obtained Using ILIS
Results Obtained
without ILIS
All Results
Results Obtained Using ILIS
Results Obtained
without ILIS
Robust Mean [mg/kg] 0.306 0.297 0.329 0.490 0.498 0.469
CV* 20.9 % 18.4 % 31.1 % 16.2 % 13.3 % 20.0 %
AAZ 1) (average bias in %) 0.9 (23 %) 0.7 (18 %) 1.3 (33 %) 0.7 (18 %) 0.6 (15 %) 0.7 (18 %)
No. of results 86 2) 53 29 2) 60 38 12
No. (%) of acceptable results 77 (90 %) 50 (94 %) 23 (79 %) 54 (90 % ) 35 (92 % ) 11 (92 % )
No. (%) of questionable results 3 (3 %) 1 (2 %) 2 (7 %) 3 (5 % ) 2 (5 % ) 1 (8 % )
No. (%) of unacceptable results 6 (7 %) 2) 2 (4 %) 1 (14 %) 2) 3 (5 % ) 1 (3 % ) 0 (0 % )
Phosphonic acid
All Results
Results Obtained Using ILIS
Results Obtained
without ILIS
Robust Mean [mg/kg] 19.3 19.9 19.6
CV* 27.0 % 19.3 % 40.7 %
AAZ 1) (average bias) 1.0 (25 %) 0.7 (18 %) 1.3 (33 %)
No. of results 50 31 13
No. (%) of acceptable results 43 (86 % ) 29 (94 % ) 11 (85 % )
No. (%) of questionable results 4 (8 % ) 2 (6 % ) 1 (8 % )
No. (%) of unacceptable results 3 (6 % ) 0 (0 % ) 1 (8 % )
1) z-scores calculated using the robust mean in the corresponding population, “5” was used in case of the z-score was higher than 5. In the case of the porpulation of all results the robust mean is equal to the assigned value.
2) including false negative results
For glyphosate, chlorate and phosphonic acid the results generated using ILISs were compared to the re-sults generated not using them (Table 4-16, p. 78). Both the distance of the robust means and the vari-ability of the results (reflected in CV* and AAZ) of the two populations were calculated and compared with the respective figures of the overall population. The robust means of the two subpopulations (with and without ILIS) were overall close to each other. However, the distribution of the results of the laboratories using ILIS was for all three compounds clearly narrower compared to that of laboratories not using ILIS. As can be seen in Table 4-16, in the case of glyphosate the CV*/AAZ values of the population using ILIS were 18.4 %/0.7 compared to 31.1 %/1.3 of the population not using it. The respective figures for chlorate were 13.3 %/0.6 vs. 20.0 % /0.7, and for phosphonic acid 19.3 %/0.7 vs. 40.7 %/1.3. Similar observations as regards the positive impact of ILISs on the quality of the results were made in the previous EUPT-SRMs (6 – 11).
In total 39 % of the results (570 out of 1466) were generated using “other ISs” (Table 4-14, p. 76). Other ISs may correct for volumetric errors and spills, and if these ISs show similar analytical behaviour to the target analytes, they may also partly correct for recovery and for sensitivity drifts of instruments. At the same time, however, such IS may also introduce errors. This is often the case in LC-MS/MS measurements if matrix ef-fects are not compensated (e.g. through matrix-matching). Among the 570 cases where other ISs were used the laboratories reported their addition at the beginning of the procedure in 419 cases (74 %). 38 % of the results (552 out of 1466) were generated without using any ISs, and there was no information reported on the use of ISs for 9 % of the results (136 out of 1466).
Solvent-based calibrations were mainly used for dithiocarbamates (61 % of the cases), followed by bro-mide ion (49 %), phosphonic acid (25 %), chlorate (23 %) and glyphosate (22 %) (Table 4-14, p. 76).

4. RESULTS / Methodological Information
79
Resu
lts
4
Matrix-Matched calibration was the most frequently used calibration approach with 655 (45 %) of all re-sults being generated in this way. This approach involved calibration based on blank extracts of the same matrix type, either by using the blank matrix that was provided or using an own blank strawberry. Matrix-matched calibration was used at frequencies ranging between 29 % for phosphonic acid to 58 % for 2,4-D. Among the 655 cases where matrix-matched calibrations were used the blank material provided by the organisers was used and in 621 cases (95 % thereof, 42 % overall) and an own blank strawberry was used in 34 cases (5 % thereof, 2 % overall). In 138 cases (9 % overall) other commodities were used for calibra-tion. In this case matrix effects during measurement are not correctly compensated unless ILIS is used. It is assumed that the laboratories employing other blank commodities for calibration have selected this ap-proach in order to ensure that the PT-results are generated in a way reflecting routine procedures.
Procedural calibration, another form of matrix matched calibration, in which results are automatically cor-rected for recovery, was used in 10 % of the cases overall. This approach was most frequently used in the case of N-acetyl glyphosate (25 % of the cases) followed by glyphosate (17 %), phosphonic acid (16 %), bro-mide ion (16 %), dithianon (14 %), chlorate (13 %) and bifenazate (sum) (13 %).
Standard addition to sample portions was used in 7 % of the cases overall and most frequently for phos-phonic acid (14 % of the cases), N-acetyl glyphosate (13 %) and bifenazate (sum) (11 %).
In a wider sense matrix matching is not only accomplished when the analysis involves matrix-matched cali-bration but also when procedural calibration and standard additions to sample portions or extract aliquots are used. Altogether matrix-matching was employed in 69 % of the cases. In all these cases matrix effects were properly compensated. Matrix effects were further compensated in all cases where ILISs were used by the laboratories. Altogether matrix effects were thus compensated in 74 % of the cases. The compounds, for which matrix effects were compensated the least, were bromide ion (only 42 % of the cases involving matrix-matching) and dithiocarbamates (only 31 % of the cases). For all other compounds altogether ma-trix effects were compensated in more than 79 % of the cases with the glyphosate (93%), chlorate (93%) and phosphonic acid (92%) showing the highest percentages, see also Table 4-13 (p. 74).
4.5.3 Correction for Recovery
Recovery corrections can be accomplished by using ILISs at the beginning or an intermediate stage of the procedure, or by other approaches. The two calibration types “procedural calibration” and “standard ad-dition to sample portions” entail an “automatic” correction for recovery, irrespective whether ILIS is used or not. Another way of correcting for recovery is the use of recovery factors derived from recovery experi-ments to correct the results. The various approaches employed by the laboratories for recovery correction are compiled in Table 4-17 (p. 80). In many cases different calibration types were combined with the use of ILISs for better accuracy. Overall, correction of results for recovery using various approaches was accom-plished in 506 cases corresponding to 34 % of all results (Table 4-17).
The compounds for which recovery-based correction was applied most frequently were phosphonic acid (73 % of the cases), chlorate (70 %), glyphosate (66 %), N-acetyl glyphosate (50 %), dithianon (42 %), bro-mide ion (31 %), captan (33 %), folpet (31 %), bifenazate (sum) (30 %) and carbofuran (part of sum) (29 %). THPI (26 %), phthalimide (25 %), fenbutatin oxide (22 %), haloxyfop (21 %), dithiocarbamates (21 %), chloro-thalonil (19 %) and 2,4-D (19 %) follow. There were also several cases where different approaches correcting for recovery were combined such as ILISs with procedural calibrations in 32 cases (2 %) and with standard additions to sample portions in 15 cases (1 %) (Table 4-13, p. 74). ILISs were furthermore combined with standard additions to extract aliquots in 28 cases (2 %) and with matrix-matched calibrations in 70 cases (5 %). The use of matrix-matched calibrations also helps to compensate for matrix effects, especially when the same matrix is used. The use of recovery factors was rather limited (5 % of the cases).
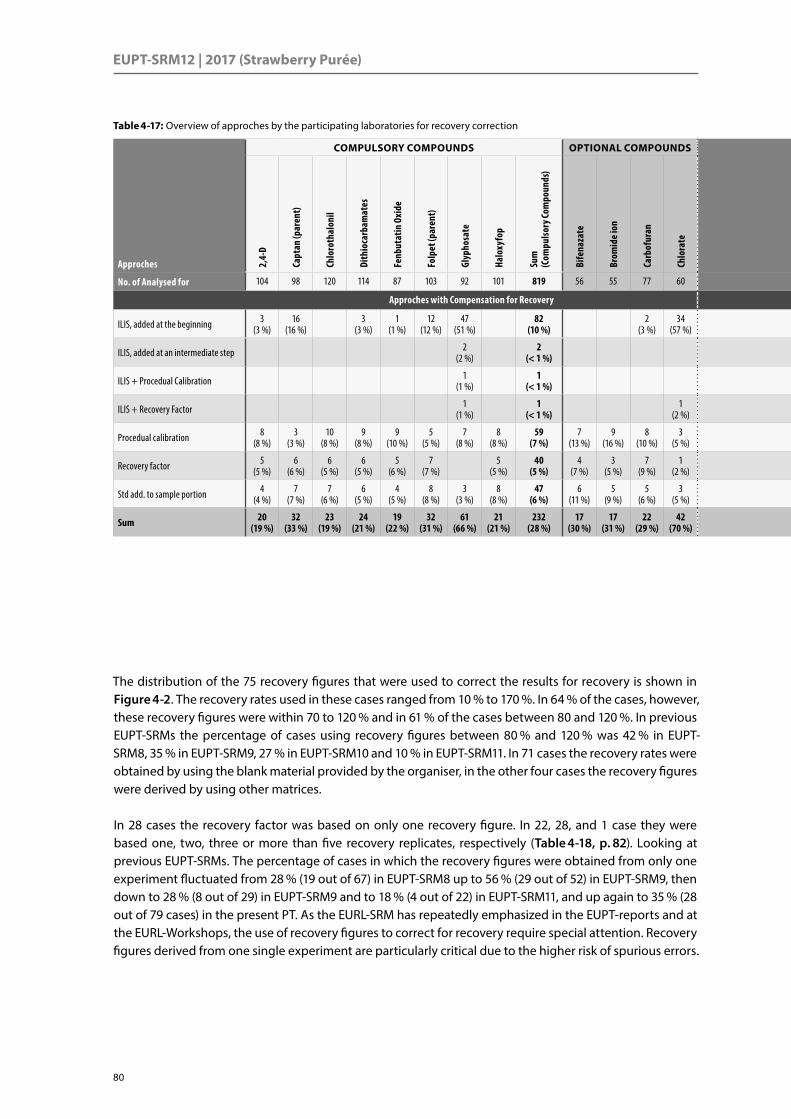
EUPT-SRM12 | 2017 (Strawberry Purée)
80
COMPULSORY COMPOUNDS OPTIONAL COMPOUNDS OPTIONAL COMPOUNDS ADDITIONAL COMPOUNDS ALL COMPOUNDS
Approches 2,4-
D
Capt
an (p
aren
t)
Chlo
roth
alon
il
Dith
ioca
rbam
ates
Fenb
utat
in O
xide
Folp
et (p
aren
t)
Glyp
hosa
te
Halo
xyfo
p
Sum
(C
ompu
lsory
Com
poun
ds)
Bife
naza
te
Brom
ide i
on
Carb
ofur
an
Chlo
rate
Approches Dith
iano
n
Phos
phon
ic ac
id
N-Ac
etyl
gly
phos
ate
Sum
(O
ptio
nal C
ompo
unds
)
Capt
an (s
um)
Folp
et (s
um)
THPI
Phth
alim
ide
Sum
(A
dditi
onal
Com
poun
ds)
Over
all
No. of Analysed for 104 98 120 114 87 103 92 101 819 56 55 77 60 No. of Analysed for 65 51 16 380 65 66 68 68 267 1466
Approches with Compensation for Recovery Approches with Compensation for Recovery
ILIS, added at the beginning 3 (3 %)
16 (16 %)
3 (3 %)
1 (1 %)
12 (12 %)
47 (51 %)
82 (10 %)
2 (3 %)
34 (57 %) ILIS, added at the beginning 11
(17 %)28
(55 %)2
(13 %)77
(20 %)8
(12 %)7
(11 %)3
(4 %)2
(3 %)20
(7 %)179
(12 %)
ILIS, added at an intermediate step 2 (2 %)
2 (< 1 %) ILIS, added at an intermediate step 1
(2 %)1
(< 1 %)3
(< 1 %)
ILIS + Procedual Calibration 1 (1 %)
1 (< 1 %) ILIS + Procedual Calibration 1
(< 1 %)
ILIS + Recovery Factor 1 (1 %)
1 (< 1 %)
1 (2 %) ILIS + Recovery Factor 1
(2 %)2
(1 %)3
(< 1 %)
Procedual calibration 8 (8 %)
3 (3 %)
10 (8 %)
9 (8 %)
9 (10 %)
5 (5 %)
7 (8 %)
8 (8 %)
59 (7 %)
7 (13 %)
9 (16 %)
8 (10 %)
3 (5 %) Procedual calibration 9
(14 %)2
(4 %)4
(25 %)42
(11 %)5
(8 %)6
(9 %)6
(9 %)6
(9 %)23
(9 %)124
(8 %)
Recovery factor 5 (5 %)
6 (6 %)
6 (5 %)
6 (5 %)
5 (6 %)
7 (7 %)
5 (5 %)
40 (5 %)
4 (7 %)
3 (5 %)
7 (9 %)
1 (2 %) Recovery factor 3
(5 %)1
(2 %)1
(6 %)20
(5 %)3
(5 %)3
(5 %)4
(6 %)4
(6 %)14
(5 %)74
(5 %)
Std add. to sample portion 4 (4 %)
7 (7 %)
7 (6 %)
6 (5 %)
4 (5 %)
8 (8 %)
3 (3 %)
8 (8 %)
47 (6 %)
6 (11 %)
5 (9 %)
5 (6 %)
3 (5 %) Std add. to sample portion 4
(6 %)4
(8 %)1
(6 %)28
(7 %)2
(3 %)2
(3 %)5
(7 %)5
(7 %)14
(5 %)89
(6 %)
Sum 20 (19 %)
32 (33 %)
23 (19 %)
24 (21 %)
19 (22 %)
32 (31 %)
61 (66 %)
21 (21 %)
232 (28 %)
17 (30 %)
17 (31 %)
22 (29 %)
42 (70 %) Sum 27
(42 %)37
(73 %)8
(50 %)170
(45 %)18
(28 %)18
(27 %)18
(26 %)17
(25 %)71
(27 %)473
(32 %)
Table 4-17: Overview of approches by the participating laboratories for recovery correction
The distribution of the 75 recovery figures that were used to correct the results for recovery is shown in Figure 4-2. The recovery rates used in these cases ranged from 10 % to 170 %. In 64 % of the cases, however, these recovery figures were within 70 to 120 % and in 61 % of the cases between 80 and 120 %. In previous EUPT-SRMs the percentage of cases using recovery figures between 80 % and 120 % was 42 % in EUPT-SRM8, 35 % in EUPT-SRM9, 27 % in EUPT-SRM10 and 10 % in EUPT-SRM11. In 71 cases the recovery rates were obtained by using the blank material provided by the organiser, in the other four cases the recovery figures were derived by using other matrices.
In 28 cases the recovery factor was based on only one recovery figure. In 22, 28, and 1 case they were based one, two, three or more than five recovery replicates, respectively (Table 4-18, p. 82). Looking at previous EUPT-SRMs. The percentage of cases in which the recovery figures were obtained from only one experiment fluctuated from 28 % (19 out of 67) in EUPT-SRM8 up to 56 % (29 out of 52) in EUPT-SRM9, then down to 28 % (8 out of 29) in EUPT-SRM9 and to 18 % (4 out of 22) in EUPT-SRM11, and up again to 35 % (28 out of 79 cases) in the present PT. As the EURL-SRM has repeatedly emphasized in the EUPT-reports and at the EURL-Workshops, the use of recovery figures to correct for recovery require special attention. Recovery figures derived from one single experiment are particularly critical due to the higher risk of spurious errors.

4. RESULTS / Methodological Information
81
Resu
lts
4
COMPULSORY COMPOUNDS OPTIONAL COMPOUNDS OPTIONAL COMPOUNDS ADDITIONAL COMPOUNDS ALL COMPOUNDS
Approches 2,4-
D
Capt
an (p
aren
t)
Chlo
roth
alon
il
Dith
ioca
rbam
ates
Fenb
utat
in O
xide
Folp
et (p
aren
t)
Glyp
hosa
te
Halo
xyfo
p
Sum
(C
ompu
lsory
Com
poun
ds)
Bife
naza
te
Brom
ide i
on
Carb
ofur
an
Chlo
rate
Approches Dith
iano
n
Phos
phon
ic ac
id
N-Ac
etyl
gly
phos
ate
Sum
(O
ptio
nal C
ompo
unds
)
Capt
an (s
um)
Folp
et (s
um)
THPI
Phth
alim
ide
Sum
(A
dditi
onal
Com
poun
ds)
Over
all
No. of Analysed for 104 98 120 114 87 103 92 101 819 56 55 77 60 No. of Analysed for 65 51 16 380 65 66 68 68 267 1466
Approches with Compensation for Recovery Approches with Compensation for Recovery
ILIS, added at the beginning 3 (3 %)
16 (16 %)
3 (3 %)
1 (1 %)
12 (12 %)
47 (51 %)
82 (10 %)
2 (3 %)
34 (57 %) ILIS, added at the beginning 11
(17 %)28
(55 %)2
(13 %)77
(20 %)8
(12 %)7
(11 %)3
(4 %)2
(3 %)20
(7 %)179
(12 %)
ILIS, added at an intermediate step 2 (2 %)
2 (< 1 %) ILIS, added at an intermediate step 1
(2 %)1
(< 1 %)3
(< 1 %)
ILIS + Procedual Calibration 1 (1 %)
1 (< 1 %) ILIS + Procedual Calibration 1
(< 1 %)
ILIS + Recovery Factor 1 (1 %)
1 (< 1 %)
1 (2 %) ILIS + Recovery Factor 1
(2 %)2
(1 %)3
(< 1 %)
Procedual calibration 8 (8 %)
3 (3 %)
10 (8 %)
9 (8 %)
9 (10 %)
5 (5 %)
7 (8 %)
8 (8 %)
59 (7 %)
7 (13 %)
9 (16 %)
8 (10 %)
3 (5 %) Procedual calibration 9
(14 %)2
(4 %)4
(25 %)42
(11 %)5
(8 %)6
(9 %)6
(9 %)6
(9 %)23
(9 %)124
(8 %)
Recovery factor 5 (5 %)
6 (6 %)
6 (5 %)
6 (5 %)
5 (6 %)
7 (7 %)
5 (5 %)
40 (5 %)
4 (7 %)
3 (5 %)
7 (9 %)
1 (2 %) Recovery factor 3
(5 %)1
(2 %)1
(6 %)20
(5 %)3
(5 %)3
(5 %)4
(6 %)4
(6 %)14
(5 %)74
(5 %)
Std add. to sample portion 4 (4 %)
7 (7 %)
7 (6 %)
6 (5 %)
4 (5 %)
8 (8 %)
3 (3 %)
8 (8 %)
47 (6 %)
6 (11 %)
5 (9 %)
5 (6 %)
3 (5 %) Std add. to sample portion 4
(6 %)4
(8 %)1
(6 %)28
(7 %)2
(3 %)2
(3 %)5
(7 %)5
(7 %)14
(5 %)89
(6 %)
Sum 20 (19 %)
32 (33 %)
23 (19 %)
24 (21 %)
19 (22 %)
32 (31 %)
61 (66 %)
21 (21 %)
232 (28 %)
17 (30 %)
17 (31 %)
22 (29 %)
42 (70 %) Sum 27
(42 %)37
(73 %)8
(50 %)170
(45 %)18
(28 %)18
(27 %)18
(26 %)17
(25 %)71
(27 %)473
(32 %)
1 0 0
9
4 5 2
12
19
7 8
2 2 21 1
0
5
10
15
20
25
10 – 20 % 20 – 30 % 30 – 40 % 40 – 50 % 50 – 60 % 60 – 70 % 70 – 80 % 80 – 90 % 90 – 100 % 100 – 110 %
110 – 120 %
120 – 130 %
130 – 140 %
140 – 150 %
150 – 160 %
160 – 170 %
(1 %)
(12 %)(16 %)
(25 %)
(9 %) (11 %)
(5 %) (7 %) (3 %) (3 %) (3 %) (3 %)
80 % – 120 % 40 (61 %)
70 % – 120 % 42 (64 %)
Figure 4-2: Distribution of recovery figures used for results correction for recovery. Four results using reported recovery rate of 100 % and one with reported recovery rate of 0 % were not taken into account.
(1 %) (1 %)
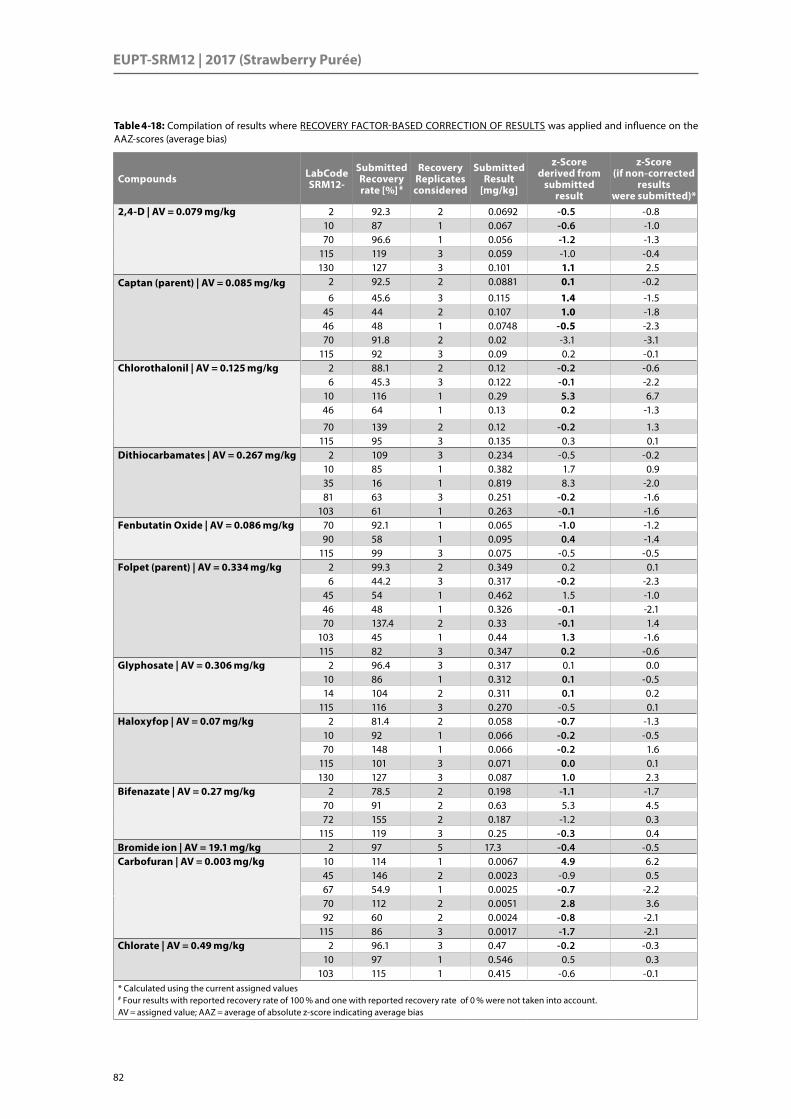
EUPT-SRM12 | 2017 (Strawberry Purée)
82
Table 4-18: Compilation of results where RECOVERY FACTOR-BASED CORRECTION OF RESULTS was applied and influence on the AAZ-scores (average bias)
Compounds LabCode SRM12-
Submitted Recovery rate [%] #
Recovery Replicates considered
Submitted Result
[mg/kg]
z-Score derived from
submitted result
z-Score (if non-corrected
results were submitted)*
2,4-D | AV = 0.079 mg/kg 2 92.3 2 0.0692 -0.5 -0.810 87 1 0.067 -0.6 -1.070 96.6 1 0.056 -1.2 -1.3
115 119 3 0.059 -1.0 -0.4130 127 3 0.101 1.1 2.5
Captan (parent) | AV = 0.085 mg/kg 2 92.5 2 0.0881 0.1 -0.2
6 45.6 3 0.115 1.4 -1.545 44 2 0.107 1.0 -1.846 48 1 0.0748 -0.5 -2.370 91.8 2 0.02 -3.1 -3.1
115 92 3 0.09 0.2 -0.1Chlorothalonil | AV = 0.125 mg/kg 2 88.1 2 0.12 -0.2 -0.6
6 45.3 3 0.122 -0.1 -2.210 116 1 0.29 5.3 6.746 64 1 0.13 0.2 -1.3
70 139 2 0.12 -0.2 1.3115 95 3 0.135 0.3 0.1
Dithiocarbamates | AV = 0.267 mg/kg 2 109 3 0.234 -0.5 -0.210 85 1 0.382 1.7 0.935 16 1 0.819 8.3 -2.081 63 3 0.251 -0.2 -1.6
103 61 1 0.263 -0.1 -1.6Fenbutatin Oxide | AV = 0.086 mg/kg 70 92.1 1 0.065 -1.0 -1.2
90 58 1 0.095 0.4 -1.4115 99 3 0.075 -0.5 -0.5
Folpet (parent) | AV = 0.334 mg/kg 2 99.3 2 0.349 0.2 0.16 44.2 3 0.317 -0.2 -2.3
45 54 1 0.462 1.5 -1.046 48 1 0.326 -0.1 -2.170 137.4 2 0.33 -0.1 1.4
103 45 1 0.44 1.3 -1.6115 82 3 0.347 0.2 -0.6
Glyphosate | AV = 0.306 mg/kg 2 96.4 3 0.317 0.1 0.010 86 1 0.312 0.1 -0.514 104 2 0.311 0.1 0.2
115 116 3 0.270 -0.5 0.1Haloxyfop | AV = 0.07 mg/kg 2 81.4 2 0.058 -0.7 -1.3
10 92 1 0.066 -0.2 -0.570 148 1 0.066 -0.2 1.6
115 101 3 0.071 0.0 0.1130 127 3 0.087 1.0 2.3
Bifenazate | AV = 0.27 mg/kg 2 78.5 2 0.198 -1.1 -1.770 91 2 0.63 5.3 4.572 155 2 0.187 -1.2 0.3
115 119 3 0.25 -0.3 0.4Bromide ion | AV = 19.1 mg/kg 2 97 5 17.3 -0.4 -0.5Carbofuran | AV = 0.003 mg/kg 10 114 1 0.0067 4.9 6.2
45 146 2 0.0023 -0.9 0.567 54.9 1 0.0025 -0.7 -2.270 112 2 0.0051 2.8 3.692 60 2 0.0024 -0.8 -2.1
115 86 3 0.0017 -1.7 -2.1Chlorate | AV = 0.49 mg/kg 2 96.1 3 0.47 -0.2 -0.3
10 97 1 0.546 0.5 0.3103 115 1 0.415 -0.6 -0.1
* Calculated using the current assigned values # Four results with reported recovery rate of 100 % and one with reported recovery rate of 0 % were not taken into account. AV = assigned value; AAZ = average of absolute z-score indicating average bias

4. RESULTS / Methodological Information
83
Resu
lts
4
Compounds LabCode SRM12-
Submitted Recovery rate [%] #
Recovery Replicates considered
Submitted Result
[mg/kg]
z-Score derived from
submitted result
z-Score (if non-corrected
results were submitted)*
115 71 3 0.49 0.0 -1.2Dithianon | AV = 0.294 mg/kg 2 87.9 2 0.268 -0.3 -0.8
70 89 1 0.35 0.8 0.2103 107 1 0.323 0.4 0.7115 70 3 0.28 -0.2 -1.3
Phosphonic acid | AV = 19.3 mg/kg 2 101 2 17.9 -0.3 -0.210 112 1 27.9 1.8 2.5
115 95 3 29.0 2.0 1.7N-Acetyl glyphosate | AV = 0.1 mg/kg 103 97 1 0.094 -0.3 -0.4
115 108 3 0.071 -1.2 -0.9Captan (sum) | AV = 0.302 mg/kg 115 106 3 0.183 -1.6 -1.4Folpet (sum) | AV = 1.195 mg/kg 115 92 3 1.43 0.8 0.4THPI | AV = 0.11 mg/kg 2 85.1 2 0.0946 -0.6 -1.1
46 48 1 0.104 -0.2 -2.270 62.4 2 0.064 -1.7 -2.6
115 84 3 0.047 -2.3 -2.6Phthalimide | AV = 0.446 mg/kg 2 95.1 2 0.382 -0.6 -0.7
46 48 1 0.39 -0.5 -2.370 161.5 2 0.31 -1.2 0.5
115 85 3 0.5 0.5 -0.2
Overall
16 Labs 75 Cases 1 Repl.(26x) 2 Repl.(22x) 3 Repl.(26x) 4 Repl.(0x) 5 Repl.(1x)
AAZ(all) = 0.9 AAZ(80–120%) = 1.0
Acceptable: 68 Questionable: 2 Unacceptable: 5
AAZ(all) = 1.3 AAZ(80–120%) = 1.1
Acceptabel: 55 Questionable: 15 Unacceptable: 5
* Calculated using the current assigned values # Four results with reported recovery rate of 100 % and one with reported recovery rate of 0 % were not taken into account. AV = assigned value; AAZ = average of absolute z-score indicating average bias
Table 4-18 (cont.): Compilation of results where RECOVERY FACTOR-BASED CORRECTION OF RESULTS was applied and influence on the AAZ-scores (average bias)
Correction using a recovery factor will typically lead to a result that is closer to the assigned value com-pared to the result that would have been reported if no recovery correction had been applied (provided that the assigned value is not strongly distant from the real value itself due to a large number of laborato-ries using biased methods). Using the recovery factor rates submitted by the laboratories it is possible to calculate the original results of the laboratories and the z-scores that would have been achieved if these results were submitted. By applying a recovery factor to correct for recovery, participants’ z-scores (in abso-lute terms) have improved in 47 cases and worsened in 23 cases. Excluding results associated with recovery rates between 80 – 120 %, the ratio of improved versus worsened z-scores shifts from approximately 2 (47 vs. 23) to 5 (25 vs. 5). This clarifies that recovery corrections based on recovery rates have little impact when recoveries are close to 100 %. In 12 cases the results moved from “questionable” to “acceptable” and in one case from “unacceptable” to “questionable”. In further 5 cases (all associated with recovery rates between 80 % and 120 % where recovery correction has typically little impact) there was no change in the catego-rization (Table 4-18). In one case the result moved from “acceptable” to “unacceptable” when the recovery factor of 16 % (at n = 1) was applied. Comparing the AAZ of the recovery-corrected results with that of the results that would have been submitted if no recovery-based correction had been applied, a significant decline from 1.3 to 0.9 is observed. In previous EUPT-SRMs similar trends were observed, although these trends were typically stronger (AAZ shift from 1.3 to 0.7 in EUPT-SRM10; from 1.9 to 1.1 in EUPT-SRM9; from 1.7 to 1.1 in EUPT-SRM8 and from 2.2 to 1.1 in EUPT-SRM7). This is surely related to the fact that EUPT-SRM12 entailed only few compounds where low recoveries are typically achieved. Looking at the cases where cor-rection was based on recoveries between 80 % and 120 % the AAZ improved from 1.1 to 1.0, whereas in all

EUPT-SRM12 | 2017 (Strawberry Purée)
84
other cases the improvement was from 1.3 to 0.9. Despite this positive effect, recovery correction based on recovery figures should be the last remedy as this approach is tricky and less accurate compared to other types of result correction such as the use of ILISs, procedural calibrations or standard addition to sample portions.
4.5.4 Comparison of Methods employed in the EUPT-SRM12
An overview of the methodological approaches mainly applied by the EU- and EFTA-Laboratories in the EUPT-SRM12 is shown in Table 4-19. Overall, QuEChERS (up to 92 % for dithianon) and in case of polar com-pounds QuPPe (up to 98 % for phosphonic acid) were the most frequently used methods.
Transformation to Carbofuran: As shown in Section 1.3 (p. 5), the concentration of carbofuran (part of sum) may be underestimated if no chemical transformation step to carbofuran is applied. Alternatively, carbofuran and carbosulfan may be determined separately and added up expressed as carbofuran, but this adds to the uncertainty of analysis and increases the risk of false negative results. The influence of acidic hydrolysis is also reflected in the participants results (Table 4-20) with the robust mean of the population applying chemical transformation (0.0039 mg/kg) being by 33 % higher than that of the entire popula-tion. This value was closer to the mean concentration detected by the organizers in the homogeneity test (0.0043 mg/kg). However, due to the very low concentration and smaller population, the CV* of this sub-population was also very high.
CompoundACN based
(various QuE-ChERS versions)
EtAc based (diff. SweEt
versions
Acetone based (e.g. Mini-Luke/
S19/Dutch) QuPPe
Involving Deriv./Transf.
Liq-Liq Part./ Spectroph./Head Space
Com
puls
ory
Com
poun
ds
2,4-D 87 % 2 % 4 % 3 % 1 %
Captan (parent) 76 % 11 % 12 %
Chlorothalonil 78 % 10 % 11 %
Dithiocarbamates 45 % / 21 % / 32 %
Fenbutatin oxide 90 % 4 % 1 % 2 % 1 %
Folpet (parent) 78 % 10 % 11 %
Glyphosate 1 % 70 % 26 %
Haloxyfop 88 % 3 % 3 % 2 % 1 %
Opt
iona
l Co
mpo
unds
Bifenazate 87 % 4 % 4 % 2 %
Bromide ion 2 % 21 % 52 %
Carbofuran (with chem. transformation)
82 % (20 %)
7 % 4 % 1 % 20 % (see QuEChERS)
Chlorate 100 %
Dithianon 92 % 2 % 2 %
Phosphonic acid 2 % 98 %
N-Acetyl glyphosate 94 %
Add
itio
nal
Com
poun
ds Captan (sum) 69 % 8 % 8 %
Folpet (sum) 68 % 9 % 8 %
THPI 82 % 9 % 7 %
Phthalimide 81 % 10 % 7 %
Table 4-19: Comparison of methods mainly employed by the EU- and EFTA-laboratories in the EUPT-SRM12

4. RESULTS / Methodological Information
85
Resu
lts
4
Entire Population
LC-MS/MS (QuPPe)
LC-MS/MS (QuPPe)
excl. 3 results *
Derivatisation-GC
IC- Conductivity Other #
No. of Results (total) 52 11 8 27 8 6 *
No. of Results (nummerical) 52 11 8 27 8 6
No. of FN 0 0 0 0 0 0
Robust Mean [mg/kg] 19.1 18.1 19.4 19.0 21.4 –
CV* 16.0 % 39.1 % 17.7 % 13.7 % 23.5 % –
* Three results were obtained without using high collision energy and therefore excluded.# Two results drived by extraction/UV-DAD, one by XRF, one by extraction/ICP-MS, one by ion-pair LC and one by QuEChERS/LC-Orbitrap
Table 4-21: Comparison of results of bromide ion obtained from different methods
Analysis of Bromide Ion: The QuPPe/LC-MS/MS method newly introduced by the EURL-SRM for the analy-sis of bromide ion was employed by 21 % of the participating laboratories. This method is much more simple compared to the traditional approach involving derivatisation. Compared with the other methods employed for the determination of bromide ion (Table 4-21), the robust mean of the LC-MS/MS method was overall comparable to that of the other methods but the distribution of the results overall broader. It should be noted, however, that several of the labs reporting biased results deviated from the procedure by not employing a large fragmentation energy to improve selectivity as indicated in the QuPPe protocol. Excluding these results, the CV* decreased from 39.1 % to 17.7 %.
Compounds Used for Calibration: Table 4-22 (p. 86) shows an overview of compounds used for calibra-tion for dithiocarbamates, bifenazate (sum), carbofuran (part of sum), captan (parent and sum) and THPI as well as for folpet (parent and sum) and phthalimide. Unfortunately, a substantial number of laboratories did not provide information this regarding. 69 out of total 82 (84 %) of the participants having submitted results for dithiocarbamates and giving an answer to this question, used CS2 for calibration. 13 participants used thiram as calibration standard. With CS2 being very volatile, its stock and working solutions are dif-ficult to handle and store. On the other hand, the use of thiram for calibration requires its spiking at the beginning of the procedure in a procedural calibration approach.
In the case of bifenazate (sum) most labs used bifenazate for calibration, but there were also cases where bifenazate and bifenazate diazene were calibrated separately as well as one case where bifenazate dia-zene was used for calibration. In the case of carbofuran (part of sum) 25 laboratories reported the use of carbofuran for calibration with 10 laboratories thereof (40 %) using a procedure entailing a hydrolysis step. 7 laboratories indicated the separate calibration of carbofuran and carbosulfan, two of them reported con-centrations at around the assigned value based on the entire population (0.0030 mg/kg), another two un-
Entire Population With Chem. Transformation
Without Chem. Transformation No Data
No. of Results (total) 74 14 38 22
No. of Results (nummerical) 58 13 31 14
No. of FN 3 + 13* 1* 5* + 2 1 + 7*
Robust Mean [mg/kg] 0.0030 0.0039 0.0028 0.0027
CV* 47.1 % 50.2 % 49.7 % 28.9 %
* FN due to lab’s RL higher than the assigned value
Table 4-20: Impact of acidic transformation on the results of carbofuran

EUPT-SRM12 | 2017 (Strawberry Purée)
86
derestimated (0.0018 and 0.0021 mg/kg), while the remaining three, all at or over 0.0046 mg/kg, were higher than the assigned value based on the popu-lation with chemical transformation (0.0039 mg/kg). As shown in Section 1.3 (p. 5), the non-conduc-tion of a hydrolysis step can lead to underestimated results.
Captan and Folpet: One of the biggest challenges in the present PT was surely the analysis of captan (parent) and folpet (parent) as well as their degrada-tion products THPI and phthalimide. Equally chal-lenging is the determination of captan (sum) and folpet (sum), since the degradation products (THPI and phthalimide) may not only be present in the test material, but can be also generated from the respective parents during hot injection in the GC. Similar problems are faced in routine work. When analysing these compounds, it should be kept in mind that 1) the concentration of THPI or phthal-imide detected by GC does not directly reflect the concentration of these compounds in the sample, as it includes those parts generated during injec-tion; 2) when employing GC, the use of captan-ILIS and folpet-ILIS at the same time as the respective ILISs of the decomposition products can be critical as the latter is formed from the decomposition of the respective parents during injection and there-fore introducing errors. At this point it should be noted that as strawberry is a strongly acidic com-modity, the decomposition of these compounds (at any stage of analysis) was less pronounced com-pared to a basic commodity.
There are different approaches to determine cap-tan (sum) and folpet (sum). A few days prior to sub-mission deadline of the exercise the EURL-SRM has distributed two methods for the analysis of captan, folpet and their degradation products (THPI and phthalimide) as well as the respective summed residues. The methods were accompanied by Excel-sheets to assist calculation. The distributed method makes the assumption that phthalimide and THPI are generated from their respective parents in the hot GC injection in a linear relationship and that these fractions can be calculated from the original levels of captan and folpet which can be deter-mined using ILIS. The original levels of THPI and phthalimide are calculated by deducting the levels
AnalyteCompounds used for calibration
No. (% *) AAZ
DithiocarbamatesCS2 69 (61 %) 0.9
Thiram 13 (11 %) 0.8
No Data / None of those listed 32 (28 %) 0.8
Bifenazate (sum)Bifenazate 27 (48 %) 1.0
Bifenazate and Bifenazate diazene (separately) 6 (11 %) 0.7
Bifenazate diazene 1 (2 %) 1.6
No Data / None of those listed 22 (39 %) 0.6
Carbofuran (part of sum)Carbofuran 25 –
Carbofuran and Benfuracarb (separately) 1 –
Carbofuran and Carbosulfan (separately) 7 –
Carbofuran and Furathiocarb (separately) 1 –
No Data / None of those listed 43 –
Captan (parent)Captan 47 (48 %) 1.1
Captan and THPI (separately) 8 (8 %) 0.8
THPI – –
No Data / None of those listed 43 (44 %) 1.2
Captan (sum)Captan 8 (12 %) 1.4
Captan and THPI (separately) 30 (46 %) 0.8
THPI 3 (5 %) 0.7
No Data / None of those listed 24 (37 %) 0.6
THPICaptan 6 (9 %) 1.6
Captan and THPI (separately) 7 (10 %) 1.0
THPI 31 (46 %) 1.1
Phthalimide 1 (1 %) 1.5
No Data / None of those listed 23 (34 %) 1.0
Folpet (parent)Captan / Folpet 50 (49 %) 1.1
Folpet and Phthalimide (separately) 7 (7 %) 0.8
Phthalimide – –
No Data / None of those listed 46 (45 %) 1.2
Folpet (sum)Captan / Folpet 8 (12 %) 1.4
Folpet and Phthalimide (separately) 30 (45 %) 0.9
Phthalimide 3 (5 %) 0.5
No Data / None of those listed 25 (38 %) 0.6
PhthalimideCaptan / Folpet 5 (7 %) 1.5
Folpet and Phthalimide (separately) 8 (12 %) 1.6
Phthalimide 32 (47 %) 0.9
No Data / None of those listed 23 (34 %) 0.7
* Percentages are based on the total number of laboratories submit-ting data as regards the compound(s) used for calibration.
Table 4-22: Compounds used for calibration in the EUPT-SRM12
4. RESULTS / Methodological Information
87
Resu
lts
4
of these degradation products generated during injection from the total levels determined via external calibration. Captan (sum) and folpet (sum) are finally calculated through addition, considering that the residue should be expressed as parent.
Hydrolysis of Acidic Pesticides: For some acidic pesticides in the Target Pesticides List the legal residue definition includes esters and conjugates. The organiser still decided to only ask for the analysis of the free acids to keep the PT more simple and avoid mixed populations of results. The impact of alkaline or acidic hydrolysis on the release of conjugated residues of acidic pesticides will be studied in future EUPTs and collaborative method validation tests. Although it was clearly defined in the target pesticides list that no hydrolysis step was to be applied, still, 3 laboratories have conducted a hydrolysis step for 2,4-D, haloxyfop, and fluazifop. For 2,4-D and haloxyfop, which were spiked to the material in form of free acid, no significant influence of hydrolysis on the results could be observed by the organizers (as expected). However, the par-ticipants are urged to keep an eye on the residue definitions in the target pesticides list.
4.5.5 Coverage of Compounds in Routine Scope and Analytical Experience of Laboratories
As can be seen in Figure 4-3 (p. 88) the percentage of all participating laboratories (n = 138) that covered the various compounds in the EUPT-SRM12 Target Pesticides List varied greatly ranging from 59 % (ethe-phon) to 87 % (chlorothalonil) among the compulsory compounds and between 12 % (N-acetyl glyphosate) and 56 % (carbofuran (part of sum)) among the optional compounds. For the four additional compounds the analysis rate was around 50 % in all cases. For the four additional compounds the analysis rate was around 50 %. Although introduced several years ago in EUPT-schemes, and although included in the EU-co-ordinated monitoring, fenbutatin oxide, ethephon and glyphosate are still analysed by the fewest laborato-ries on a routine basis, but a positive trend can be observed: The participants analysing for fenbutatin oxide, ethephon and glyphosate rose from 59, 51, 49, respectively in 2013 (SRM8) to 60, 66 and 69, respectively in 2015 (SRM10) and further to 87, 81 and 92, respectively in the present PT.
In 40 cases the compounds within the labs’ routine scope were not analysed for in this PT (Table 4-23, p. 89). Among them the participants reported in 15 cases that the analytes were accredited in their labo-ratories either via flexible scope or specifically for this commodity type and within routine scope. Except one case, participants reported the following reasons for not analysing those compounds: lack of person-nel (19×), technical problem with instruments (12×), lab’s reporting limit (RL) higher than the MRRL in the PT (5×) and lack of necessary analytical standards (3×).
In 458 cases the participating laboratories even analysed compounds not yet included in their routine scope, among them 256 cases concerning compulsory compounds, 115 cases concerning optional com-pounds and 87 cases concerning additional compounds. This indicates that many laboratories are in the position or in the process of expanding their scope with additional SRM-compounds. The compound most frequently analysed by laboratories but not yet included in their routine scope was glyphosate (28 labora-tories).
Figure 4-4 (p. 89) gives an overview of the overall analytical experience of the participating laboratories for compulsory, optional and additional compounds separately. Overall the experience of the laboratories with compulsory compounds was clearly higher than that with optional and additional compounds, with the labs reporting > 2 years of experience with the analysis of the respective compounds in 80 %, 61 % and 51 % of the cases, respectively. Table 4-24 (p. 90) shows the experience reported for each single com-pound present in the test item as well as the average performance of the labs as reflected by the AAZ (aver-age absolute bias). In general, laboratories with > 2 years of experience achieved on average better z-scores

EUPT-SRM12 | 2017 (Strawberry Purée)
88
65 66 68 68
43 45 46 4632 31 30 30
0
20
40
60
80
100
120
140
Capt
an (s
um)
Folp
et (s
um)
THPI
Phta
limid
e
60 56 55
77
6065
51
16
39 4146
61
45 49
38
6
2733
40
52
36 3629
30
20
40
60
80
100
120
140
AMPA
Bife
naza
te
Brom
ide
ion
Carb
ofur
an
Chlo
rate
Dith
iano
n
Phos
phon
ic a
cid
N-A
cety
lgl
ypho
sate
104 102 98
120
103
114
8187
102 103
92101
116
8188
80
100
77
99
6368
79 83
64
85
100
68 7058
71
56
91
5449
64 62
46
70
86
0
20
40
60
80
100
120
140
2,4-
D
Abam
ectin
Capt
an (p
aren
t)
Chlo
roth
alon
il
Cyro
maz
ine
Dith
ioca
rbam
ates
Ethe
phon
Fenb
utat
in O
xide
Flua
zifo
p
Folp
et (p
aren
t)
Gly
phos
ate
Hal
oxyf
op
Prop
amoc
arb
Figure 4-3: Number of laboratories targeting compounds within the framework of the EUPT-SRM12, within their routine scope and within the accredited scopes. Percentages are based on the total number of participating laboratories having submitted at least one result (n = 138).
Analysed for in EUPT-SRM12
Within routine scope of laboratories
Accredited (for this commodity or via flexible scope)
43 %
28 % 20 %
39 %26 %
21 %26 %
2 %
24 %
41 %
30 %33 %
38 %40 %
43 %
56 %
44 % 47 %
36 %33 %28 %
4 %
37 %
12 %
Coun
t of L
abs
75 %
59 %
42 % 41 % 39%
66 %
36 %
51 %49 %
74 %
64 %58 % 51 %
71 % 75 %
87 %
72 %
83 %
72 %
56 %
46 %46 % 45 %
33 %49 %
57 % 60 % 51 %
46 %
62 %59 %63 %
74 % 75 %67 %
73 % 72 % 62 %
84 %
Coun
t of L
abs
COMPULSORY COMPOUNDS
OPTIONAL COMPOUNDS
23 % 22 %31 % 22 %33 % 33 %
47 % 48 % 49 %
33 %22 %
49 %
ADDITIONAL COMPOUNDS
Folp
et
(par
ent)
Folp
et
(sum
)
Capt
an
(par
ent)
Capt
an
(sum
)
Bife
naza
te
(sum
)
Carb
ofur
an
(par
t of s
um)
N-A
cety
l- gl
ypho
sate
Dit
hioc
arba
mat
es
than those having less experience. (Figure 4-5, p. 91) gives an overview of this correlation. Among the compulsory compounds present in the test item laboratories had the most experience with the analysis of dithiocarbamates. 80 laboratories (90 %) indicated more than two years of experience with the analysis of dithiocarbamates. The compulsory compound with which the laboratories had the least experience was glyphosate with 22 % of the laboratories reporting less than one year.
Bromide ion, chlorate and bifenazate (sum) were the optional analytes which the laboratories had the most experience with. 84 %, 67 % and 66 % of the laboratories indicated an experience of > 2 years with bromide ion, chlorate and bifenazate (sum), respectively. N-Acetyl glyphosate was the compound which the partici-pating laboratories had the least experience with: None of the participants had experience of more than two years and 88 % of the laboratories having submitted results reported experience of less than one year with the analysis of this compound.
Among laboratories having analysed for the additional compounds roughly every second laboratory had long experience (> 2 years ), and roughly 40 % of the labs had experience of less than one year.

4. RESULTS / Methodological Information
89
Resu
lts
4
within routine scope of lab
NOT within routine scope of lab
analysed for in this EUPT
not analysed for
analysed for in this EUPT
not analysed for
COM
PULS
ORY
CO
MPO
UN
DS
2,4-D 81 (98 %) 2 23 (42 %) 32
Abamectin 88 (99 %) 1 14 (29 %) 35
Captan (parent) 80 (99 %) 1 18 (32 %) 39
Chlorothalonil 100 (98 %) 2 20 (56 %) 16
Cyromazine 77 (99 %) 1 26 (43 %) 34
Dithiocarbamates 99 (100 %) 0 15 (38 %) 24
Ethephon 63 (97 %) 2 18 (25 %) 55
Fenbutatin oxide 68 (99 %) 1 19 (28 %) 50
Fluazifop 79 (98 %) 2 23 (40 %) 34
Folpet (parent) 83 (99 %) 1 20 (37 %) 34
Glyphosate 64 (97 %) 2 28 (39 %) 44
Haloxyfop 85 (99 %) 1 16 (31 %) 36
Propamocarb 100 (98 %) 2 16 (44 %) 20
SUM 1067 (98 %) 18 (1.7 %) 256 (36 %) 453 (64 %)
OP
TIO
NA
L CO
MPO
UN
DS
AMPA 39 (100 %) 0 21 (21 %) 78
Bifenazate (sum) 41 (98 %) 1 15 (16 %) 81
Bromide ion 46 (98 %) 1 9 (10 %) 82
Carbofuran 61 (94 %) 4 16 (22 %) 57
Chlorate 45 (94 %) 3 15 (17 %) 75
Dithianon 49 (96 %) 2 16 (18 %) 71
Phosphonic acid 38 (100 %) 0 13 (13 %) 87
N-Acetyl glyphosate 6 (86 %) 1 10 (8 %) 121
SUM 325 (96 %) 12 (3.6 %) 115 (15 %) 275 (76 %)
AD
DIT
ION
AL
COM
POU
ND
S Captan (sum) 43 (96 %) 2 22 (24 %) 71
Folpet (sum) 45 (96 %) 2 21 (23 %) 70
THPI 46 (94 %) 3 22 (25 %) 67
Phthalimide 46 (94 %) 3 22 (25 %) 67
SUM 180 (95 %) 10 (5.3 %) 87 (24 %) 652 (85 %)
Overall Sum 1572 (98 %) 40 (2.5 %) 458 (25 %) 1380 (75 %)
Table 4-23: Inclusion of EUPT-SRM12 compounds in the laboratories’ routine scope (including data of laboratories from EU-candidate and third countries)
COMPULSORy COMPOUNDS OPTIONAL COMPOUNDS ADDITIONAL COMPOUNDS
80%
6%
12%
2%
61%13%
20%
6%
51%
6%
42%
1%
: Long (>2 years); : Short (1-2 years); : Very short (<1 year); : No Data
Figure 4-4: Overall experience of laboratories with the analysis of pesticides present in the test item (the shown figures refer to com-pounds present in the test item and analysed by the laboratories.)

EUPT-SRM12 | 2017 (Strawberry Purée)
90
Table 4-24: Laboratories’ experience with the analysis of individual compounds present in the test item and correlation with AAZ reflecting the average deviation from the assigned value. AAZs and CV* were calculated for populations with at least 5 laboratories.
COMPULSORY COMPOUNDS OPTIONAL COMPOUNDS
Pesticides Experience No. of Labs 2) (%) AAZ/CV* 2) Pesticides Experience No. of Labs 2) (%) AAZ/CV* 2)
2,4-D (free acid)
AAZ 1): 0.6 CV* 1): 13.3 %
> 2 years 88 (85 %) 0.5/13.1 %Bifenazate
AAZ 1): 0.8 CV* 1): 22.1 %
> 2 years 37 (66 %) 0.7/20.1 %1 – 2 years 7 (7 %) 1.1/22.7 % 1 – 2 years 5 (9 %) 0.9/36.8 %< 1 year 8 (8 %) 0.8/8.6 % < 1 year 13 (23 %) 1.1/33.1 %no data 1 (1 %) no data 1 (2 %)
Captan (par-ent)
AAZ 1): 1.1 CV* 1): 28.1 %
> 2 years 80 (82 %) 1.0/25.7 %Bromide ion
AAZ 1): 0.7 CV* 1): 16.0 %
> 2 years 46 (84 %) 0.7/14.4 %1 – 2 years 3 (3 %) 1 – 2 years 3 (5 %)< 1 year 13 (13 %) 1.6/41.8 % < 1 year 6 (11 %) 1.1/46.4 %no data 2 (2 %) no data 0 (0 %)
Chlorothalonil
AAZ 1): 1.0 CV* 1): 25.2 %
> 2 years 100 (83 %) 0.9/23.9 %Carbofuran 3)
AAZ 1): 1.8 CV* 1): 47.1 %
> 2 years 42 (55 %) 1.5/43.4 %1 – 2 years 4 (3 %) 1 – 2 years 2 (3 %)< 1 year 14 (12 %) 1.8/54.8 % < 1 year 15 (19 %) 2/55.7 %no data 2 (2 %) no data 18 (23 %) 2.7/ -
Dithio- carbamates
AAZ 1): 0.8 CV* 1): 22.2 %
> 2 years 103 (90 %) 0.8/22.4 %Chlorate
AAZ 1): 0.7 CV* 1): 16.2 %
> 2 years 40 (67 %) 0.7/11.5 %1 – 2 years 5 (4 %) 1.9/63.5 % 1 – 2 years 11 (18 %) 1/38.5 %< 1 year 6 (5 %) 0.4/12.3 % < 1 year 9 (15 %) 0.8/20.5 %no data 0 (0 %) no data 0 (0 %)
Fenbutatin Oxide
AAZ 1): 0.9 CV* 1): 21.0 %
> 2 years 60 (69 %) 0.8/20.7 %Dithianon
AAZ 1): 1.1 CV* 1): 25.3 %
> 2 years 40 (62 %) 1/19.8 %1 – 2 years 7 (8 %) 1.6/49.4 % 1 – 2 years 14 (22 %) 1/35.6 %< 1 year 16 (18 %) 0.6/17.5 % < 1 year 10 (15 %) 1.4/36.8 %no data 4 (5 %) no data 1 (2 %)
Folpet (parent)
AAZ 1): 1.1 CV* 1): 25.0 %
> 2 years 84 (82 %) 0.9/22.1 % Phosphonic acid
AAZ 1): 1.0 CV* 1): 27.0 %
> 2 years 28 (55 %) 1/26.9 %1 – 2 years 2 (2 %) 1 – 2 years 13 (25 %) 1/28.8 %< 1 year 15 (15 %) 2.2/69.4 % < 1 year 10 (20 %) 1.2/28.4 %no data 2 (2 %) no data 0 (0 %)
Glyphosate
AAZ 1): 0.9 CV* 1): 20.9 %
> 2 years 57 (62 %) 0.6/15.7 % N-Acetyl glyphosate
AAZ 1): 0.8 CV* 1): 23.2 %
> 2 years 0 (0 %)1 – 2 years 12 (13 %) 1.7/53.4 % 1 – 2 years 1 (6 %)< 1 year 22 (24 %) 1.0/33 % < 1 year 14 (88 %) 0.7/24.2 %no data 1 (1 %) no data 1 (6 %)
Haloxyfop
AAZ 1): 0.7 CV* 1): 13.9 %
> 2 years 87 (86 %) 0.6/13.8 %1 – 2 years 5 (5 %) 0.5/19.1 %
< 1 year 7 (7 %) 1.4/30.2 %
no data 2 (2 %)
ADDITIONAL COMPOUNDS
Pesticides Experience No. of Labs 2) (%) AAZ/CV* 2)
Captan (sum)
AAZ 1): 0.8 CV* 1): 25.2 %
> 2 years 35 (54 %) 0.9/27.5 %
1 – 2 years 2 (3 %)
< 1 year 28 (43 %) 0.7/19.5 %
no data 0 (0 %)
Folpet (sum)
AAZ 1): 0.8 CV* 1): 21.1 %
> 2 years 33 (50 %) 0.8/17.2 %
1 – 2 years 3 (5 %)
< 1 year 30 (45 %) 0.9/22.8 %
no data 0 (0 %)
THPI
AAZ 1): 1.1 CV* 1): 30.5 %
> 2 years 36 (53 %) 1.2/34 %
1 – 2 years 5 (7 %) 0.6/21.7 %
< 1 year 27 (40 %) 1.1/33.5 %
no data 0 (0 %)
Phthalimide
AAZ 1): 0.9 CV* 1): 21.6 %
> 2 years 33 (49 %) 0.9/19.6 %
1 – 2 years 7 (10 %) 1.4/39 %
< 1 year 27 (40 %) 0.9/25.6 %
no data 1 (1 %)
1) based on participants from EU and EFTA countries2) based on all participants3) Assigned value uncertain, AAZ for informative purpose only

4. RESULTS / Methodological Information
91
Resu
lts
4
4.5.6 Size of Analytical Portions
Figure 4-6 (p. 92) gives an overview of the analytical sample sizes employed by the participants in this exercise. The majority of the laboratories (82 %) employed analytical portions equal or larger than 10 g, the size of the analytical portion used by the organisers in the homogeneity test for all compounds except dithiocarbamates where 20 g were used. In the case of dithiocarbamates 41 % laboratories used analyti-cal portions smaller than 20 g (the sample weight used in the homogeneity test). In the case of bromide ion the share of the laboratories employing analytical portions < 10 g (the amount used in the homogene-ity test) was even 47 %. The participating laboratories were informed in advance via the Specific Protocol about the sample sizes used in the homogeneity tests and that sufficient homogeneity cannot be always guaranteed where the analytical portions employed are significantly smaller than those used in the ho-mogeneity test. To get an additional impression of the sub-sample variability of the test item when small analytical portions are used, an additional homogeneity test was conducted for some of the analytes contained in the test item (2,4-D, dithianon, haloxyfop, bifenazate). For this analytical portions of 1 g and 10 g (10 each) were taken from one Test Item bottle. The relative standard deviation of results at 1 g were in general higher than those at 10 g sample size, but they did not exceed 10 %. This indicates sufficient homogeneity even in case of sample sizes of only 1 g.
4.5.7 Comparison of Reporting Limits, Assigned Values and MRRLs
Figure 4-7 (p. 93) shows the distribution of the reporting limits (RLs) reported by the participating laborato-ries for each of the compounds present in the test item.
Among the compulsory compounds present in the test item, the respective MRRLs were not met by the partici-pating laboratories in 147 out of 819 cases (18 %). In one case of captan (parent), one case of fenbutatin oxide and two cases of dithiocarbamates, the laboratories’ RLs were even higher than the assigned values of the corresponding analytes. In two cases the participants were not able to analyse abamectin and ethephon due to RLs exceeding the MRRLs. Among the optional compounds the MRRLs were not met in 79 out of 380 cases (21 %). Due to RLs being higher than the MRRLs, 5 laboratories were not able to analyse for carbofuran (part of sum) (3×), N-acetyl glyphosate (1×), and AMPA (1×). Notably, 32 out of the 77 laboratories (42 %) having ana-
0.8 0.80.9
1.3
1.01.1
1.3
1.00.9
0.0
0.2
0.4
0.6
0.8
1.0
1.2
1.4
Optional Compounds
Additional Compounds
(191) (137)
(47) (17)
(233)(137) (112)
(62)
: Long (>2 years); : Short (1-2 years); : Very short (<1 year)
Compulsory Compounds
Figure 4-5: Correlation between the labs’ experience with the analytes and the AAZ. (No. of data in each case in parentheses, exclud-ing carbofuran and laboratories without data on experience with the analysis)
(659)AA
Z

EUPT-SRM12 | 2017 (Strawberry Purée)
92
Bifenazate (sum)
7 % < 10 g
Bromide ion
47 % < 10 g
Carbofuran
4 % < 10 g
Chlorate 15 % < 10 g
Dithianon
9 % < 10 g
Captan (sum)
7 % < 10 g
Folpet (sum)
7 % < 10 g
THPI
6 % < 10 g
Phthalimide
6 % < 10 g
Phosphonic acid 22 % < 10 g
N-Acetyl glyphosate 19 % < 10 g
0 20 40 60 80 100
15
10
5
50
18
15
10
5
50
18
15
10
5
200
100
75
50
30
25
20
15
10
5
4
3
2
1
25
15
10
5
50
18
15
10
5
2
20
10
5
3
2
1
15
10
5
0 20 40 60 80 100
15
10
5
18
15
10
5
15
10
5
18
15
10
5
0 20 40 60 80 100
15
10
5
15
10
6
5
4
3
2
1
15
12
10
5
10
5
2
1
20
15
10
5
10
5
2
1
10
5
2
COMPULSORY COMPOUNDS OPTIONAL COMPOUNDS
ADDITIONAL COMPOUNDS
2,4-D
6 % < 10 g
Number of Laboratories
Number of Laboratories
Captan (parent)
5 % < 10 g
Chlorothalonil
5 % < 10 g
Dithiocarbamates
41 % < 20 g
Folpet (parent)
6 % < 10 g
Glyphosate
30 % < 10 g
Haloxyfop
8 % < 10 g
[g]
[g]
Fenbutatin oxide
7 % < 10 g
Figure 4-6: Size of analytical portions [g] employed by labs and percentage of cases where the analytical portions were smaller than those used to test homogeneity by the organiser
[g]
Bifenazate
7 % < 10 g
Bromide ion
47 % < 10 g
Carbofuran
4 % < 10 g
Chlorate
15 % < 10 g
Dithianon
9 % < 10 g
Phosphonic acid
22 % < 10 g
N-Acetyl glyphosate
22 % < 10 g
Captan (sum)
7 % < 10 g
Folpet (sum)
7 % < 10 g
THPI
6 % < 10 g
Phthalimid
6 % < 10 g

4. RESULTS / Methodological Information
93
Resu
lts
4
0 20 40 60 80 100 120
0.080.050.030.02
0.0150.01
0.0070.005
No Data
0.080.050.030.02
0.0150.01
0.005No Data
0.050.020.01
0.0050.001
0.050.020.01
0.0050.003
0 20 40 60 80 100 120
0.50.050.020.01
0.005No Data
106543
2.521
0.50.20.1
0.050.01
0.050.01
0.0050.0030.0020.001
0.20.1
0.050.020.01
0.0050.002
0.050.020.01
0.005
0.560.30.20.1
0.050.035
0.030.020.01
0.10.050.020.01
0 20 40 60 80 100 120
0.050.020.01
0.0050.002
No Data
0.20.050.04
0.0220.02
0.0150.01
0.005
0.050.030.020.01
0.0050.110.16
0.001
0.30.270.25
0.20.1
0.050.040.03
0.0250.020.01
0.0050.001
0.090.050.020.01
0.0050.002
0.20.050.04
0.0250.020.01
0.005
0.30.18
0.10.050.040.030.020.01
0.002
0.050.022
0.020.01
0.0050.0030.002
Figure 4-7: Distribution of laboratories’ Reporting Limits (RLs) and comparison with the MRRLs and the assigned values (AV). For the four additional compounds there was no MRRL defined.
COMPULSORY COMPOUNDS OPTIONAL COMPOUNDS
Number of Laboratories
[mg/kg]
[mg/kg]
Haloxyfop AV = 0.070 mg/kg
MRRL = 0.01 mg/kg, (8 % of RLs > MRRL)
Glyphosate AV = 0.306 mg/kg
MRRL = 0.03 mg/kg, (32 % of RLs > MRRL)
Folpet (parent) AV = 0.334 mg/kg
MRRL = 0.01 mg/kg, (22 % of RLs > MRRL)
Fenbutatin oxide AV = 0.086 mg/kg
MRRL = 0.01 mg/kg, (9 % of RLs > MRRL)
Dithiocarbamates AV = 0.267 mg/kg
MRRL = 0.03 mg/kg, (37 % of RLs > MRRL)
Chlorothalonil AV = 0.125 mg/kg
MRRL = 0.01 mg/kg, (6 % of RLs > MRRL)
Captan (parent) AV = 0.085 mg/kg
MRRL = 0.01 mg/kg, (24 % of RLs > MRRL)
2,4-D AV = 0.079 mg/kg
MRRL = 0.01 mg/kg, (6 % of RLs > MRRL)
Bifenazate (sum) AV = 0.270 mg/kg
MRRL = 0.02 mg/kg, (4 % of RLs > MRRL)
Bromide ion AV = 19.1 mg/kg
MRRL = 3 mg/kg, (22 % of RLs > MRRL)
Dithianon AV = 0.294 mg/kg
MRRL = 0.02 mg/kg, (5 % of RLs > MRRL)
Chlorate AV = 0.490 mg/kg
MRRL = 0.02 mg/kg, (12 % of RLs > MRRL)
Phosphonic acid AV = 19.3 mg/kg
MRRL = 0.05 mg/kg, (31 % of RLs > MRRL)
N-Acetyl glyphosate AV = 0.100 mg/kg
MRRL = 0.02 mg/kg, (44 % of RLs > MRRL)
Captan (sum) AV = 0.302 mg/kg
Folpet (sum) AV = 1.195 mg/kg
THPI AV = 0.110 mg/kg
Phthalimide AV = 0.446 mg/kg
Carbofuran AV = 0.0030 mg/kg
MRRL = 0.0010 mg/kg, (42 % of RLs > MRRL)
Number of Laboratories[mg/kg]
ADDITIONAL COMPOUNDS

EUPT-SRM12 | 2017 (Strawberry Purée)
94
lysed for carbofuran (part of sum) were not able to meet the MRRL at 0.001 mg/kg, the RLs of 26 laboratories were even higher than the robust mean of the total population (0.0030 mg/kg) with 18 of them reporting not detected and receiving a “false negative” judgement. The organisers encourage the laboratories to improve their methods and are willing to assist them in this process.
4.6 Critical Points in this PT and Post-PT Advices to Participants
• To avoid bias it is important to compensate for strongly deviating recovery rates and matrix effects: Strongly deviating recovery rates: Employ procedures that adjust results for recovery (e.g. ILIS
added at the beginning of the procedure, standard addition to sample portions, procedural calibration); these approaches also correct for matrix effects.
Significant matrix effects: Use either the above mentioned procedures that also correct for re-covery or procedures that compensate for matrix effects only (e.g. matrix-matched calibrations, ILISs added to the sample extract, standard addition to extract aliquots, analyte protectants in GC)
• When carbofuran (part of sum) is to be analysed, it is advised to perform the transformation of carbosulfan, benfuracarb and furanthiocarb into carbofuran. This reduces the number of different compounds to be analysed and also the possibility of false negatives. A simple method entailing an acidic hydrolysis with sulfuric acid directly in the final QuEChERS extract has been published in the EURL-SRM website (Method SRM-33),
• When bifenazate (sum) is to be analysed, it is advised to perform a transformation of bifenazate diazene into bifenazate. A method involving a reductive transformation with ascorbic acid directly in the QuEChERS final extract can be found in the EURL-SRM website (Method SRM-34)
• When analysing for captan (sum) and folpet (sum) or for THPI and phthalimide be aware of the decomposition of captan and folpet in the hot GC-injector and the formation of THPI and phthal-imide. Be careful with the calculations to avoid that the concentration of the degradation is overes-timated. A possible procedure for the quantification of captan (sum) and folpet (sum) can be found in the EURL-SRM website (Method SRM-07).
• Make sure that the analytical portion is not too small as this increases portion-to-portion varia-bility. If the methodology used requires the use of small analytical portions, repetitive analysis and averaging can reduce the influence of subsampling variability.
• Where possible, consider reducing the portion size of homogenized samples for dithiocarba-mates analysis as the amount of Test Material that can be provided to the participants is limited.
• Consider improving the sensitivity and reducing the reporting limit of carbofuran.• Always refer to the analyte definition stated on the Target Pesticides List. For example, if the “free
acid” without hydrolysis is asked, no hydrolysis step should be performed• Always submit all methodological data requested and check their correctness and plausibility.
Posterior corrections of missing or contradictory input is time consuming and delays the publica-tion of the final report.
• Follow the instruction and details in the invoice for payment and indicate the complete invoice number as payee identification text. Otherwise it is not possible to identify the payer and the pay-ment cannot be allocated.
• When analysing bromide by LC-MS/MS keep in mind to employ a very large fragmentation energy to reduce mass spectrometric interferences by other compounds. Detailed instructions in this re-gard can be found in the QuPPe procedure.
• The organisers would like to appeal to all laboratories to gradually expand their scope so that more SRM compounds are covered. Where possible and reasonable, specialized laboratories may be established to cover SRM compounds on a subcontract basis, both in commodities of animal and plant origin.

4. RESULTS / Survey to Collect the Participant’s Feedback on EUPT-SRM12
95
Resu
lts
4
4.7 Survey to Collect the Participant’s Feedback on EUPT-SRM12
In order to continuously improve the quality of the PTs and to better satisfy the participants’ requirements, a survey on the EUPT-SRM12 was launched together with the release of the preliminary report on 11 May, 2017. The survey was conducted with the help of the “EU-Survey” platform with 127 of the 139 invited participants (91 %) taking part. Besides some critical points and some valuable suggestions that have to be considered in future EUPTs, lots of positive comments were received. A compilation of the results and the organiser’s reactions were published on 27 July, 2017 and can be downloaded via the link: http://www.eurl-pesticides.eu/library/docs/srm/SRM12_Survey_Statistics_Evaluation.pdf
4.8 Summary, Conclusions, Retrospect and Prospect
The EUPT-SRM12 was the 12th scheduled EUPT focusing on pesticides requiring the use of “single” residue methods.
A total of 129 laboratories representing 28 EU and 3 EFTA countries registered for the EUPT-SRM12. In ad-dition, two laboratories from one EU-candidate country and seven from third countries registered for par-ticipation. All of them submitted results. Croatia was the only EU-country not represented by an NRL-SRM. Malta was represented by its proxy-NRL-SRM based in the United Kingdom. For the first time one OfL from Iceland has participated in an EUPT-SRM.
Compared to the previous EUPT-SRMs using fruit and vegetables as commodity the number of laborato-ries that participated in this EUPT has increased significantly (Table 4-25, p. 96). It should be noted that participation in EUPTs mainly depends on the compounds included in the Target Pesticides List as well as the matrices concerned. The number of participants in EUPT-SRMs based on fruit or vegetables is generally higher compared to PTs using cereals or feeding stuff as matrix. EUPTs entailing target compounds which are included in the scope of many laboratories, such as dithiocarbamates, also tend to show a higher num-ber of participants (Table 4-26, p. 98).
The EUPT-SRM12 was the most successful one as regards the number of participants and the average num-ber of compounds analysed per participant (Table 4-25). Also in terms of performance the EUPT-SRM12 was the most successful among the EUPT-SRMs so far, with the result distribution being in most cases quite narrow (average CV* excluding carbofuran 21 %). The percentage of laboratories classified into Category A was also relatively high.
The Target Pesticides List of EUPT-SRM12 (Appendix 10) contained in total 25 SRM-compounds. 13 of them were compulsory, and 12 were optional for the laboratories in terms of scope, four of them were only for the purpose of data collection and were assigned as “additional compounds”. All of the compulsory and additional compounds were relevant to the EU multiannual coordinated control program (MACP) for straw-berry and listed in the MACP regulation. Four of the eight optional compounds were included in the MACP regulation and the other four were included in the MACP working document giving guidance to the EU Member States for designing the national monitoring programs.
8 of total 25 analytes in the Target Pesticides List were included for the first time in the EUPT-SRM with 7 of them being present in the test item: bifenazate (sum), carbofuran (part of sum), folpet (parent), N-acetyl glyphosate, captan (sum), THPI, folpet (sum) and phthalimide. All these new compounds were analysed by a sufficient number of laboratories to allow proper statistical evaluation. Although only 15 laboratories reported a numerical result for N-acetyl glyphosate, the CV* of 23.2 % indicates the high analytical qual-ity of these laboratories. Similar observations with compounds analysed by only a few, but obviously well performing, laboratories were also made in several past PTs.
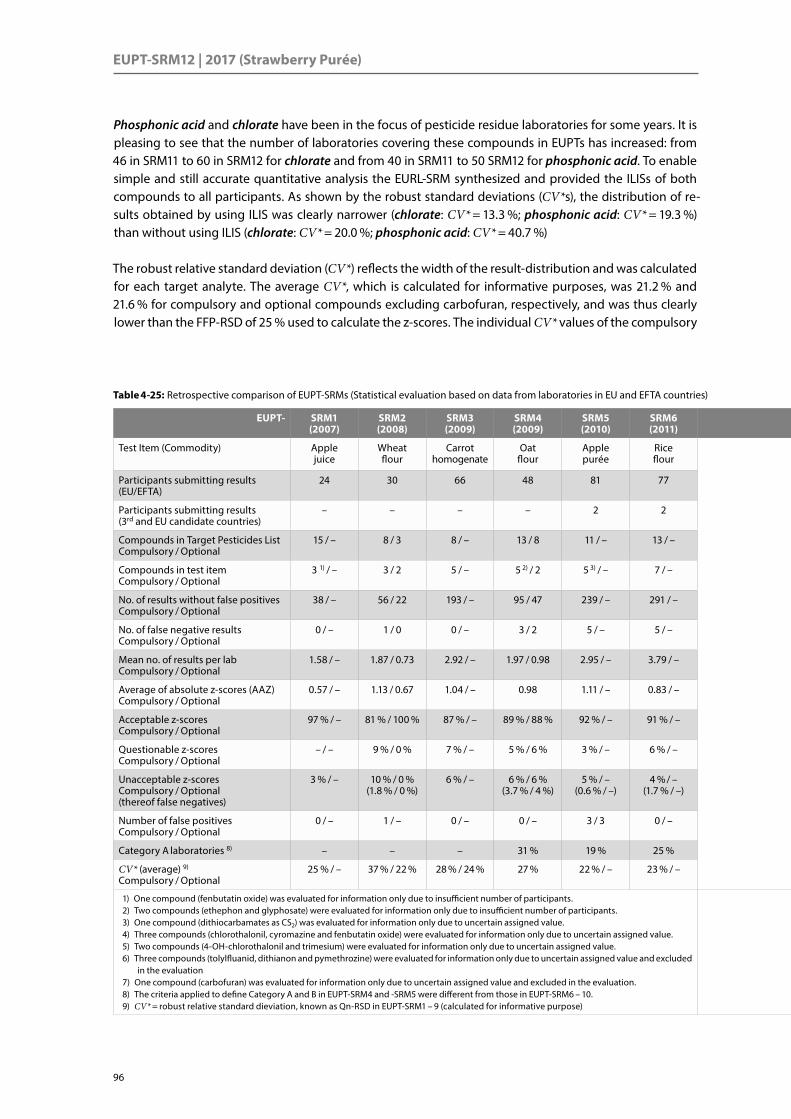
EUPT-SRM12 | 2017 (Strawberry Purée)
96
Phosphonic acid and chlorate have been in the focus of pesticide residue laboratories for some years. It is pleasing to see that the number of laboratories covering these compounds in EUPTs has increased: from 46 in SRM11 to 60 in SRM12 for chlorate and from 40 in SRM11 to 50 SRM12 for phosphonic acid. To enable simple and still accurate quantitative analysis the EURL-SRM synthesized and provided the ILISs of both compounds to all participants. As shown by the robust standard deviations (CV*s), the distribution of re-sults obtained by using ILIS was clearly narrower (chlorate: CV* = 13.3 %; phosphonic acid: CV* = 19.3 %) than without using ILIS (chlorate: CV* = 20.0 %; phosphonic acid: CV* = 40.7 %)
The robust relative standard deviation (CV*) reflects the width of the result-distribution and was calculated for each target analyte. The average CV*, which is calculated for informative purposes, was 21.2 % and 21.6 % for compulsory and optional compounds excluding carbofuran, respectively, and was thus clearly lower than the FFP-RSD of 25 % used to calculate the z-scores. The individual CV* values of the compulsory
Table 4-25: Retrospective comparison of EUPT-SRMs (Statistical evaluation based on data from laboratories in EU and EFTA countries)
EUPT- SRM1 (2007)
SRM2 (2008)
SRM3 (2009)
SRM4 (2009)
SRM5 (2010)
SRM6 (2011)
EUPT- SRM7 (2012)
SRM8 (2013)
SRM9 (2014)
SRM10 (2015)
SRM11 (2016)
SRM12 (2017)
Test Item (Commodity) Apple juice
Wheat flour
Carrot homogenate
Oat flour
Apple purée
Rice flour
Matrix of test item Lentil flour
Potato homogenate
Cow’s whole milk
Maize flour
Spinach homogenate
Strawberry purée
Participants submitting results (EU/EFTA)
24 30 66 48 81 77 Participants submitting results (EU/EFTA)
110 110 62 104 120 129
Participants submitting results (3rd and EU candidate countries)
– – – – 2 2 Participants submitting results (3rd and EU candidate countries)
4 6 5 6 2 9
Compounds in Target Pesticides List Compulsory / Optional
15 / – 8 / 3 8 / – 13 / 8 11 / – 13 / – Compounds in Target Pesticide List Compulsory / Optional
16 / – 13 / 10 12 / 7 9 / 14 11 / 16 13 / 8
Compounds in test item Compulsory / Optional
3 1) / – 3 / 2 5 / – 5 2) / 2 5 3) / – 7 / – Compounds in test item Compulsory / Optional
8 4) / – 8 5) / 7 8 5) / 6 8 / 5 6 6) / 8 6) 8 / 7 7)
No. of results without false positives Compulsory / Optional
38 / – 56 / 22 193 / – 95 / 47 239 / – 291 / – No. of results without false positives Compulsory / Optional
439 / – 604 / 212 361 / 132 461 / 135 479 / 411 772 / 370
No. of false negative results Compulsory / Optional
0 / – 1 / 0 0 / – 3 / 2 5 / – 5 / – No. of false negative results Compulsory / Optional
11 / – 14 / 8 3 / 4 4 / 2 8 / 20 14 / 18
Mean no. of results per lab Compulsory / Optional
1.58 / – 1.87 / 0.73 2.92 / – 1.97 / 0.98 2.95 / – 3.79 / – Mean no. of results per lab Compulsory / Optional
4.12 / – 5.49 / 1.93 5.87 / 2.19 4.43 / 1.29 4.03 / 3.71 5.98 / 2.87
Average of absolute z-scores (AAZ) Compulsory / Optional
0.57 / – 1.13 / 0.67 1.04 / – 0.98 1.11 / – 0.83 / – Average of absolute z-scores (AAZ) Compulsory / Optional
0.97 / – 0.98 / 1.06 0.75 / 0.80 0.9 / 0.7 1.0 6) / 1.1 6) 0.9 / 0.9 7)
Acceptable z-scores Compulsory / Optional
97 % / – 81 % / 100 % 87 % / – 89 % / 88 % 92 % / – 91 % / – Acceptable z-scores Compulsory / Optional
90 % / – 88 % / 85 % 92 % / 71 % 87 % / 89 % 87 % 6) / 85 % 6) 89 % / 90 % 7)
Questionable z-scores Compulsory / Optional
– / – 9 % / 0 % 7 % / – 5 % / 6 % 3 % / – 6 % / – Questionable z-scores Compulsory / Optional
3 % / – 6 % / 5 % 4 % / 5 % 8 % / 6 % 5 % 6) / 4 % 6) 4 % / 5 % 7)
Unacceptable z-scores Compulsory / Optional (thereof false negatives)
3 % / – 10 % / 0 % (1.8 % / 0 %)
6 % / – 6 % / 6 % (3.7 % / 4 %)
5 % / – (0.6 % / –)
4 % / – (1.7 % / –)
Unacceptable z-scores Compulsory / Optional (thereof false negatives)
7 % / –
(2.1 % / –)6 % / 10 %
(2.2 % / 3.6 % )4 % / 3.5 %
(0.8 % / 2.7 %)5 % / 4 %
(0.8 % / 2.9 %)7 % 6) / 10 % 6)
(1.0 % 6) / 4.8 % 6))7 % / 6 % 7)
(1.8 % / 0.7 % 7))
Number of false positives Compulsory / Optional
0 / – 1 / – 0 / – 0 / – 3 / 3 0 / – Number of false positives Compulsory / Optional
0 / – 2 / 0 6 / 0 0 / 4 4 / 4 1 / 0
Category A laboratories 8) – – – 31 % 19 % 25 % Category A laboratories 8) 28 % 47 % 52 % 53 % 47 % 50 %
CV* (average) 9) Compulsory / Optional
25 % / – 37 % / 22 % 28 % / 24 % 27 % 22 % / – 23 % / – CV* (average) 9) Compulsory / Optional
27 % / – 26 % / 26 % 20 % / 19 % 24 % / 19 % 28 % 6) / 30 % 6) 21 % / 22 % 7)
1) One compound (fenbutatin oxide) was evaluated for information only due to insufficient number of participants.2) Two compounds (ethephon and glyphosate) were evaluated for information only due to insufficient number of participants.3) One compound (dithiocarbamates as CS2) was evaluated for information only due to uncertain assigned value.4) Three compounds (chlorothalonil, cyromazine and fenbutatin oxide) were evaluated for information only due to uncertain assigned value.5) Two compounds (4-OH-chlorothalonil and trimesium) were evaluated for information only due to uncertain assigned value.6) Three compounds (tolylfluanid, dithianon and pymethrozine) were evaluated for information only due to uncertain assigned value and excluded
in the evaluation7) One compound (carbofuran) was evaluated for information only due to uncertain assigned value and excluded in the evaluation.8) The criteria applied to define Category A and B in EUPT-SRM4 and -SRM5 were different from those in EUPT-SRM6 – 10.9) CV* = robust relative standard dieviation, known as Qn-RSD in EUPT-SRM1 – 9 (calculated for informative purpose)
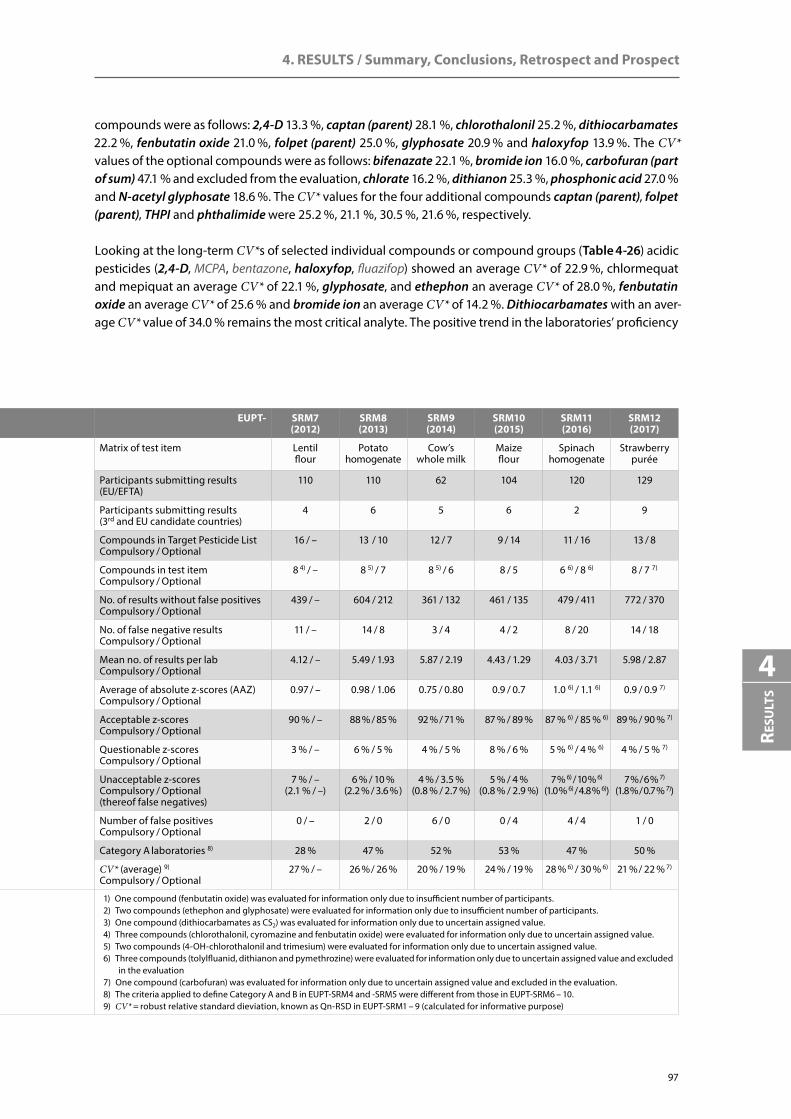
4. RESULTS / Summary, Conclusions, Retrospect and Prospect
97
Resu
lts
4
compounds were as follows: 2,4-D 13.3 %, captan (parent) 28.1 %, chlorothalonil 25.2 %, dithiocarbamates 22.2 %, fenbutatin oxide 21.0 %, folpet (parent) 25.0 %, glyphosate 20.9 % and haloxyfop 13.9 %. The CV* values of the optional compounds were as follows: bifenazate 22.1 %, bromide ion 16.0 %, carbofuran (part of sum) 47.1 % and excluded from the evaluation, chlorate 16.2 %, dithianon 25.3 %, phosphonic acid 27.0 % and N-acetyl glyphosate 18.6 %. The CV* values for the four additional compounds captan (parent), folpet (parent), THPI and phthalimide were 25.2 %, 21.1 %, 30.5 %, 21.6 %, respectively.
Looking at the long-term CV*s of selected individual compounds or compound groups (Table 4-26) acidic pesticides (2,4-D, MCPA, bentazone, haloxyfop, fluazifop) showed an average CV* of 22.9 %, chlormequat and mepiquat an average CV* of 22.1 %, glyphosate, and ethephon an average CV* of 28.0 %, fenbutatin oxide an average CV* of 25.6 % and bromide ion an average CV* of 14.2 %. Dithiocarbamates with an aver-age CV* value of 34.0 % remains the most critical analyte. The positive trend in the laboratories’ proficiency
Table 4-25: Retrospective comparison of EUPT-SRMs (Statistical evaluation based on data from laboratories in EU and EFTA countries)
EUPT- SRM1 (2007)
SRM2 (2008)
SRM3 (2009)
SRM4 (2009)
SRM5 (2010)
SRM6 (2011)
EUPT- SRM7 (2012)
SRM8 (2013)
SRM9 (2014)
SRM10 (2015)
SRM11 (2016)
SRM12 (2017)
Test Item (Commodity) Apple juice
Wheat flour
Carrot homogenate
Oat flour
Apple purée
Rice flour
Matrix of test item Lentil flour
Potato homogenate
Cow’s whole milk
Maize flour
Spinach homogenate
Strawberry purée
Participants submitting results (EU/EFTA)
24 30 66 48 81 77 Participants submitting results (EU/EFTA)
110 110 62 104 120 129
Participants submitting results (3rd and EU candidate countries)
– – – – 2 2 Participants submitting results (3rd and EU candidate countries)
4 6 5 6 2 9
Compounds in Target Pesticides List Compulsory / Optional
15 / – 8 / 3 8 / – 13 / 8 11 / – 13 / – Compounds in Target Pesticide List Compulsory / Optional
16 / – 13 / 10 12 / 7 9 / 14 11 / 16 13 / 8
Compounds in test item Compulsory / Optional
3 1) / – 3 / 2 5 / – 5 2) / 2 5 3) / – 7 / – Compounds in test item Compulsory / Optional
8 4) / – 8 5) / 7 8 5) / 6 8 / 5 6 6) / 8 6) 8 / 7 7)
No. of results without false positives Compulsory / Optional
38 / – 56 / 22 193 / – 95 / 47 239 / – 291 / – No. of results without false positives Compulsory / Optional
439 / – 604 / 212 361 / 132 461 / 135 479 / 411 772 / 370
No. of false negative results Compulsory / Optional
0 / – 1 / 0 0 / – 3 / 2 5 / – 5 / – No. of false negative results Compulsory / Optional
11 / – 14 / 8 3 / 4 4 / 2 8 / 20 14 / 18
Mean no. of results per lab Compulsory / Optional
1.58 / – 1.87 / 0.73 2.92 / – 1.97 / 0.98 2.95 / – 3.79 / – Mean no. of results per lab Compulsory / Optional
4.12 / – 5.49 / 1.93 5.87 / 2.19 4.43 / 1.29 4.03 / 3.71 5.98 / 2.87
Average of absolute z-scores (AAZ) Compulsory / Optional
0.57 / – 1.13 / 0.67 1.04 / – 0.98 1.11 / – 0.83 / – Average of absolute z-scores (AAZ) Compulsory / Optional
0.97 / – 0.98 / 1.06 0.75 / 0.80 0.9 / 0.7 1.0 6) / 1.1 6) 0.9 / 0.9 7)
Acceptable z-scores Compulsory / Optional
97 % / – 81 % / 100 % 87 % / – 89 % / 88 % 92 % / – 91 % / – Acceptable z-scores Compulsory / Optional
90 % / – 88 % / 85 % 92 % / 71 % 87 % / 89 % 87 % 6) / 85 % 6) 89 % / 90 % 7)
Questionable z-scores Compulsory / Optional
– / – 9 % / 0 % 7 % / – 5 % / 6 % 3 % / – 6 % / – Questionable z-scores Compulsory / Optional
3 % / – 6 % / 5 % 4 % / 5 % 8 % / 6 % 5 % 6) / 4 % 6) 4 % / 5 % 7)
Unacceptable z-scores Compulsory / Optional (thereof false negatives)
3 % / – 10 % / 0 % (1.8 % / 0 %)
6 % / – 6 % / 6 % (3.7 % / 4 %)
5 % / – (0.6 % / –)
4 % / – (1.7 % / –)
Unacceptable z-scores Compulsory / Optional (thereof false negatives)
7 % / –
(2.1 % / –)6 % / 10 %
(2.2 % / 3.6 % )4 % / 3.5 %
(0.8 % / 2.7 %)5 % / 4 %
(0.8 % / 2.9 %)7 % 6) / 10 % 6)
(1.0 % 6) / 4.8 % 6))7 % / 6 % 7)
(1.8 % / 0.7 % 7))
Number of false positives Compulsory / Optional
0 / – 1 / – 0 / – 0 / – 3 / 3 0 / – Number of false positives Compulsory / Optional
0 / – 2 / 0 6 / 0 0 / 4 4 / 4 1 / 0
Category A laboratories 8) – – – 31 % 19 % 25 % Category A laboratories 8) 28 % 47 % 52 % 53 % 47 % 50 %
CV* (average) 9) Compulsory / Optional
25 % / – 37 % / 22 % 28 % / 24 % 27 % 22 % / – 23 % / – CV* (average) 9) Compulsory / Optional
27 % / – 26 % / 26 % 20 % / 19 % 24 % / 19 % 28 % 6) / 30 % 6) 21 % / 22 % 7)
1) One compound (fenbutatin oxide) was evaluated for information only due to insufficient number of participants.2) Two compounds (ethephon and glyphosate) were evaluated for information only due to insufficient number of participants.3) One compound (dithiocarbamates as CS2) was evaluated for information only due to uncertain assigned value.4) Three compounds (chlorothalonil, cyromazine and fenbutatin oxide) were evaluated for information only due to uncertain assigned value.5) Two compounds (4-OH-chlorothalonil and trimesium) were evaluated for information only due to uncertain assigned value.6) Three compounds (tolylfluanid, dithianon and pymethrozine) were evaluated for information only due to uncertain assigned value and excluded
in the evaluation7) One compound (carbofuran) was evaluated for information only due to uncertain assigned value and excluded in the evaluation.8) The criteria applied to define Category A and B in EUPT-SRM4 and -SRM5 were different from those in EUPT-SRM6 – 10.9) CV* = robust relative standard dieviation, known as Qn-RSD in EUPT-SRM1 – 9 (calculated for informative purpose)
1) One compound (fenbutatin oxide) was evaluated for information only due to insufficient number of participants.2) Two compounds (ethephon and glyphosate) were evaluated for information only due to insufficient number of participants.3) One compound (dithiocarbamates as CS2) was evaluated for information only due to uncertain assigned value.4) Three compounds (chlorothalonil, cyromazine and fenbutatin oxide) were evaluated for information only due to uncertain assigned value.5) Two compounds (4-OH-chlorothalonil and trimesium) were evaluated for information only due to uncertain assigned value.6) Three compounds (tolylfluanid, dithianon and pymethrozine) were evaluated for information only due to uncertain assigned value and excluded
in the evaluation7) One compound (carbofuran) was evaluated for information only due to uncertain assigned value and excluded in the evaluation.8) The criteria applied to define Category A and B in EUPT-SRM4 and -SRM5 were different from those in EUPT-SRM6 – 10.9) CV* = robust relative standard dieviation, known as Qn-RSD in EUPT-SRM1 – 9 (calculated for informative purpose)

EUPT-SRM12 | 2017 (Strawberry Purée)
98
can be seen clearly in the analysis of glyphosate: the number laboratories having analysed for glyphosate increased from 6 in EUPT-SRM4 to 34 in EUPT-SRM6 to 39 in EUPT-SRM7 to 45 in EUPT-SRM8 to 62 in EUPT-SRM10 and finally to 86 in the current PT with the CV* decreasing from 40.6 % (EUPT-SRM6), 34.5 % (EUPT-SRM7), 24.5 % (EUPT-SRM8), 22.8 % (EUPT-SRM10) to 20.9 % (SRM12).
In accordance with the definition in the General EUPT Protocol, z-scores based on the FFP-RSD of 25 % were calculated and classified into “acceptable“, “questionable“, and “unacceptable” for each laboratory/target-
Table 4-26: Overview of selected pesticides tested in the EUPT-SRMs 1 – 12 and analysed by the participating laboratories. n: Number of laboratories having analysed selected pesticides present in the test items. The figures in brackets show the percentage of labora-tories submitting numerical results for a compound out of the total number of laboratories submitting results (only EU and EFTA labs considered; CV*, formerly known as Qn, was calculated for populations with at least 10 laboratories). Only CV*s based on 15 or more labs were used to calculated the average CV*s at the bottom.
EUPT
No.
of l
abor
ator
ies
Com
mod
ity
type
1
Acidic pesticidesRequiring individual methods
Polar pesticides Other
2,4-
D
MCP
A
Bent
azon
e
Hal
oxyf
op
Flua
zifo
p
Brom
ide
Dit
hio-
ca
rbam
ates
Chlo
rmeq
uat
Mep
iqua
t
Ethe
phon
Gly
phos
ate
Fenb
utat
in o
xide
SRM1 24 FV n 10 (42 %) 23 (96 %) 5 (21 %)HW CV* 27.1 % 13.8 % –
SRM2 30 CF n 13 (43 %) 25 (83 %) D CV* 45.8 % 29.1 %
SRM3 66 FV n 38 (58 %) 35 (55 %) 59 (89 %) HW CV* 27.0 % 26.6 % 38.4 %
SRM4 48 CF n 32 (66 %) 38 (83 %) 4 (8.3 %) 6 (13 %) D CV* 27.5 % 25.8 % – –
SRM5 81 FV n 51 (64 %) 70 (86 %) 28 (35 %) 35 (43 %)HW CV* 19.8 % 58.9 % 23.0 % 24.3 %
SRM6 77 CF n 57 (74 %) 49 (64 %) 34 (44 %) 64 (83 %) 28 (36 %) 34 (44 %) D CV* 22.1 % 17.7 % 8.6 % 24.2 % 29.7 % 40.6 %
SRM7 110 CF n 70 (64 %) 44 (40 %) 83 (75 %) 32 (29 %) 39 (35 %)D CV* 27.9 % 18.0 % 23.1 % 25.2 % 34.5 %
SRM8 110 FV n 81 (74 %) 71 (65 %) 45 (41 %) 59 (54 %)HW CV* 20.2 % 22.2 % 24.5 % 31.4 %
SRM9 62 AO n 50 (81 %) 50 (81 %) 50 (81 %) 49 (79 %)HW CV* 18.7 % 26.0 % 29.8 % 19.6 %
SRM10 104 CF n 82 (79 %) 79 (76 %) 69 (66 %) 85 (82 %) 75 (72 %) 76 (67 %) 61 (59 %) 62 (60 %) D CV* 18.2 % 18.9 % 18.5 % 36.9 % 18.2 % 18.5 % 30.8 % 22.8 %
SRM11 119 FV n 95 (80 %)HW CV* 34.6 %
SRM12 129 FV n 98 (76 %) 97 (65 %) 52 (50 %) 107 (83 %) 86 (67 %) 82 (64 %)HW CV* 13.3 % 13.9 % 16.0 % 22.2 % 20.9 % 21.0 %
Average CV* EUPT-SRMs 1 – 12 21.3 % 23.0 % 18.5 % 17.3 % 24.1 % 14.2 % 34.0 % 23.3 % 20.1 % 27.2 % 28.7 % 25.6 %
Average CV* of Group
EUPT-SRMs 1 – 12
Acidic pesticides Br- Dithi-ocarba-mates
Chlormequat + Mepiquat
Ethephon + Glyphosate
FBO
21.1% 14.2 % 34.0 % 22.1 % 28.0 % 25.6 %
1) Commodity type:HW: High water content; D: dry = high strach or high protein content and low water content
4. RESULTS / Summary, Conclusions, Retrospect and Prospect
99
Resu
lts
4
analyte combination. Overall, the performance of the laboratories was very high. In the case of compulsory compounds 93 out of 98 laboratories (95 %) reported results within the acceptable z-score-range for 2,4-D, 77 out of 93 (83 %) for captan (parent), 97 out of 111 (87 %) for chlorothalonil, 101 out of 107 (94 %) for dithi-ocarbamates, 72 out of 87 (88 %) for fenbutatin oxide, 82 out of 98 (84 %) for folpet (parent), 77 out of 86 (90 %) for glyphosate and 89 out of 97 (92 %) for haloxyfop. In the case of optional compounds 52 out of 54 laboratories (96 %) submitted results within the acceptable z-score-range for bifenazate (sum), 47 out of 52 (90 %) for bromide ion, 44 out of 74 (59 %) for carbofuran, 54 out of 60 (90 %) for chlorate, 54 out of 64 (84 %) for dithianon, 43 out of 50 (86 %) for phosphonic acid and 15 out of 16 (94 %) for N-acetyl glyphosate. In the case of additional compounds, where evaluation was only done for informative purposes, 61 out of 65 laboratories (94 %) submitted results within the acceptable z-score-range for captan (sum), 58 out of 66 (88 %) for folpet (sum), 58 out of 67 (87 %) for THPI and 61 out of 67 (97 %) for phthalimide.
Considering results reported by all participating laboratories, false negative results were reported by EU/EFTA-laboratories in 14 cases among the compulsory compounds (4× fenbutatin oxide, 2× captan (par-ent), 2× folpet (parent), 2× chlorothalonil, 2× haloxyfop, 1× glyphosate and 1× 2,4-D). Among the optional compounds false negative results were reported in 20 cases (18× carbofuran, 1× dithianon, 1× N-acetyl glyphosate). Among the additional compounds there was one result for phthalimide judged as false nega-tive. One numerical result for propamocarb was reported by an EU/EFTA-laboratory and judged as false positive. Two other false positive results (abamectin and cyromazine) were reported by the participants from third countries.
All participating laboratories were classified into category A and B following the rules in the General EUPT Protocol. Laboratories analysing at least 12 of the 13 the compulsory compounds and correctly detecting at least seven of the eight compulsory pesticides present in the test item without reporting any false positive result were classified into Category A. A total of 64 EU/EFTA-laboratories (50 %) were classified into Cat-egory A and the remaining 65 (50 %) laboratories into Category B. Among the 9 participating laboratories from third countries, three were classified into Category A and the other 6 into Category B.
16 of the 125 EU laboratories that registered for participation in this EUPT participated on a voluntary basis. The other 109 participating laboratories represent 74 % of the 147 laboratories that were finally considered as being obliged to participate in this exercise based on their function (NRL-SRM) or scope (routinely ana-lysing official samples for pesticide residues in fruit and vegetable). 38 laboratories (26 %) that were con-sidered as obliged to participate in the current PT had neither registered for non-participation nor stated any reason.
Post-PT measures and assistance to the laboratories: Following the distribution of the preliminary results all laboratories achieving questionable or unacceptable z-scores as well as false positive results were asked to investigate the reasons and report them to the organisers, as far as possible. 57 laboratories responded to the organisers with (possible) reasons for their poor performance in 123 cases. In 20 of those case the real reasons could not be clarified, in spite of intensive investigation. The most frequently reported error sources were “error in the concentration of analytical standards or calibration solutions” (24 cases), “lack of experience” (14 cases) and “transcription or administrative errors” (14 cases). “Use of inappropriate proce-dure”, “error in the evaluation or in the interpretation of measurement data” and “application of inappropri-ate calibration” were reported as reasons for the poor performance by in 9 cases each. “Technical problems with measurement instrumentation” like poor sensitivity (8 cases), “matrix effect was not properly com-pensated” (6 cases) and “result not corrected for low or high recovery” (5 cases) were other frequent error sources. The other reported reasons for the poor performance were: “procedure not properly conducted” (4 cases), “Strong chromatographic interferences” (3 cases), “detection signals strongly interfered by matrix components” and “degradation during sample preparation or measurement“ (2 cases each) as well as “mis-understanding of the residue definition of the analyte” (1 case). In 4 cases concerning captan (parent) and

EUPT-SRM12 | 2017 (Strawberry Purée)
100
THPI as well as folpet (parent) and phthalimide the laboratories reported problems with the conversion of the parent compounds into the metabolites which introduced an error in the final quantification. Even if in many cases the laboratories did not give any feedback to the organiser for their poor performance, the organisers hope that every participating laboratory has tried to find out the reason, as this will reduce er-rors in the future and improve analytical quality.
Expanding the scope and improving the overall performance of NRLs and OfLs in the area of pesticides and metabolites not amenable to multiresidue methods is one of the main aims of the EURL-SRM. The EURL-SRM is thus pleased to assist the laboratories via bilateral discussions, workshops and trainings and will continue developing, validating and distributing easy-to-use, fast and cost-efficient methodologies for such compounds. In future PTs, the selection of target analytes will continue to focus on those included in the scope of the EU coordinated control programs as well as on additional pesticides and metabolites of high relevance. Specific requests by NRLs and OfLs stated in the survey on the EUPT-SRM12 will be also taken into account.

5. Acknowledgements / 6. References
101
Ack
no
wle
dg
emen
ts
R efe
Ren
ces
5/6
5. ACkNOWLEDGEMENTS
The organisers wish to thank the members of the EUPT Scientific Committee (Quality Control Group and Advisory Group) for their valuable advice. Special thanks also go to Jens-Ole Frimann for his support in establishing the online result submission tool.
6. REFERENCES
[1] Regulation (EC) N° 882/2004 of the European Parliament and of the Council on official controls per-formed to ensure the verification of compliance with feed and food law, animal health and animal welfare rules. Published at OJ of the EU L191 of 28.05.2004
[2] Regulation (EC) N° 396/2005, published at OJ of the EU L70 of 16.03.2005, as last amended by Regula-tion 839/2008 published at OJ of the EU L234 of 30.08.2008.
[3] http://www.crl-pesticides.eu/userfiles/file/EurlSRM/EurlSrm_Observations_AcidicPesticides.pdf
[4] Thompson M., Ellison S.L.R. and Wood R., The International Harmonized Protocol for the Proficiency Testing of Analytical Chemistry Laboratories (IUPAC Technical Report). Pure Appl. Chem., Vol. 78, No. 1, pp. 145 – 196, 2006
[5] http://quppe.eu/
[6] ISO 13528:2015: Statistical methods for use in proficiency testing by interlaboratory comparisons.


Appendix 1. List of Laboratories Registered to Participate in the EUPT-SRM12
Part
iciP
atio
n
a1
A-1
7. APPENDICES
Country (Location)
Analysed on behalf of Institution City NRL*-
SRMReported
results
Austria AT AGES Innsbruck - Food Safety Institute Innsbruck x Yes
Austria AT Lebensmitteluntersuchung Wien Vienna Yes
Austria AT LVA GmbH Klosterneuburg Yes
Belgium BE LOVAP NV Geel Yes
Belgium BE WIV-ISP (Scientific Institute of Public Health) Brussels x Yes
Belgium BE/BG/FR/LU
Primoris Belgium Gent - Zwijnaarde Yes
Bulgaria BG CLCTC Sofia x Yes
Croatia HR Bioinstitute Ltd. Cakovec Yes
Croatia HR CNIPH Zagreb Yes
Croatia HR Euroinspekt-Croatiakjontrola Laboratory Zagreb Yes
Croatia HR Inspecto d.o.o. Laboratorij Osijek Yes
Croatia HR Teaching Institute of Public Health, Dr. Andrija Štampar Zagreb Yes
Cyprus CY Laboratory of Pesticide Residues Analysis, State General Laboratory, Cyprus
Nicosia x Yes
Czech Re-public
CZ Central Institute for Supervising and Testing in Agriculture Brno Yes
Czech Re-public
CZ Czech Agriculture and Food Inspection Authority Prague x Yes
Czech Re-public
CZ UCT Prague, Metrological and Testing laboratory Praha 6 Yes
Denmark DK Danish Veterinary and Food Administration Ringsted x Yes
Estonia EE Agricultural Research Centre, Laboratory for Residues and Contaminants
Saku Yes
Estonia EE Tartu Laboratory of Health Board Tartu x Yes
Finland FI Finnish Customs Laboratory Espoo x Yes
Finland FI MetropoliLab Ltd Helsinki Yes
France FR Analysis Center Mediterranean Pyrenees (Perpignan) Perpignan Yes
France FR ANSES-PBM Maisons-Alfort Cedex x Yes
France FR CAPINOV Landerneau Yes
France FR CERECO SUD GARONS Yes
France FR FREDON Pays de la Loire / GIRPA BEAUCOUZE Yes
France FR INOVALYS - Le MANS Le Mans Yes
France FR Laboratoire du SCL de Montpellier Montpellier Yes
France FR SCL Ile de France - Massy Massy Cedex Yes
France BE PHYTOCONTROL NIMES Yes
Germany FR Intertek Food Services GmbH Bremen Bremen Yes
Germany BE LUFA-ITL GmbH, Kiel Kiel Yes
Germany DE Amt für Verbraucherschutz Düsseldorf - Chemische and Lebensmitteluntersuchung
Duesseldorf Yes
Germany DE Chemical and Veterinary Analytical Institute Rhine-Ruhr-Wupper
Krefeld Yes
Germany DE Chemisches Labor Dr. Mang Frankfurt am Main Yes
Germany DE Chemisches and Veterinäruntersuchungsamt Münsterland Emscher-Lippe
Münster Yes
Germany DE Federal Office of Consumer Protection and Food Safety, NRL for Pesticide Residues
Berlin-Marienfelde x Yes
* only for EU-Member States
Appendix 1 List of Laboratories Registered to Participate in the EUPT-SRM12
(a): participating labs of EU and EFTA Member States
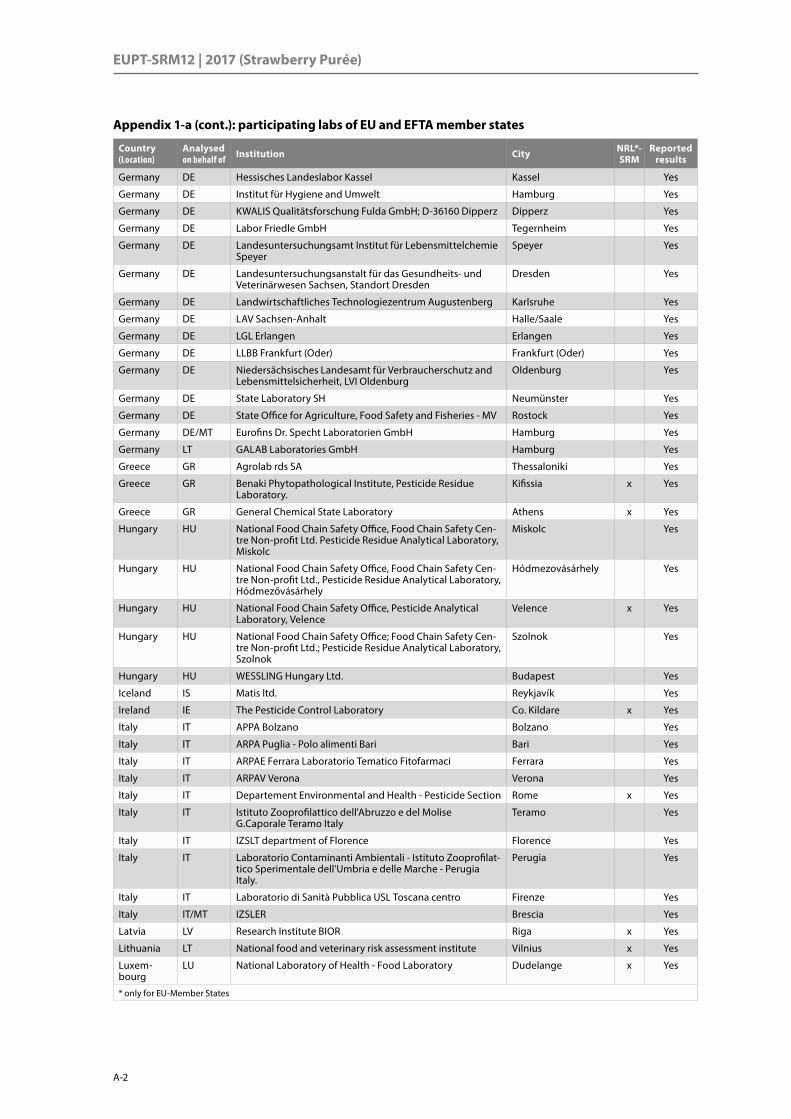
EUPT-SRM12 | 2017 (Strawberry Purée)
A-2
Country (Location)
Analysed on behalf of Institution City NRL*-
SRMReported
results
Germany DE Hessisches Landeslabor Kassel Kassel Yes
Germany DE Institut für Hygiene and Umwelt Hamburg Yes
Germany DE KWALIS Qualitätsforschung Fulda GmbH; D-36160 Dipperz Dipperz Yes
Germany DE Labor Friedle GmbH Tegernheim Yes
Germany DE Landesuntersuchungsamt Institut für Lebensmittelchemie Speyer
Speyer Yes
Germany DE Landesuntersuchungsanstalt für das Gesundheits- und Veterinärwesen Sachsen, Standort Dresden
Dresden Yes
Germany DE Landwirtschaftliches Technologiezentrum Augustenberg Karlsruhe Yes
Germany DE LAV Sachsen-Anhalt Halle/Saale Yes
Germany DE LGL Erlangen Erlangen Yes
Germany DE LLBB Frankfurt (Oder) Frankfurt (Oder) Yes
Germany DE Niedersächsisches Landesamt für Verbraucherschutz and Lebensmittelsicherheit, LVI Oldenburg
Oldenburg Yes
Germany DE State Laboratory SH Neumünster Yes
Germany DE State Office for Agriculture, Food Safety and Fisheries - MV Rostock Yes
Germany DE/MT Eurofins Dr. Specht Laboratorien GmbH Hamburg Yes
Germany LT GALAB Laboratories GmbH Hamburg Yes
Greece GR Agrolab rds SA Thessaloniki Yes
Greece GR Benaki Phytopathological Institute, Pesticide Residue Laboratory.
Kifissia x Yes
Greece GR General Chemical State Laboratory Athens x Yes
Hungary HU National Food Chain Safety Office, Food Chain Safety Cen-tre Non-profit Ltd. Pesticide Residue Analytical Laboratory, Miskolc
Miskolc Yes
Hungary HU National Food Chain Safety Office, Food Chain Safety Cen-tre Non-profit Ltd., Pesticide Residue Analytical Laboratory, Hódmezővásárhely
Hódmezovásárhely Yes
Hungary HU National Food Chain Safety Office, Pesticide Analytical Laboratory, Velence
Velence x Yes
Hungary HU National Food Chain Safety Office; Food Chain Safety Cen-tre Non-profit Ltd.; Pesticide Residue Analytical Laboratory, Szolnok
Szolnok Yes
Hungary HU WESSLING Hungary Ltd. Budapest Yes
Iceland IS Matis ltd. Reykjavík Yes
Ireland IE The Pesticide Control Laboratory Co. Kildare x Yes
Italy IT APPA Bolzano Bolzano Yes
Italy IT ARPA Puglia - Polo alimenti Bari Bari Yes
Italy IT ARPAE Ferrara Laboratorio Tematico Fitofarmaci Ferrara Yes
Italy IT ARPAV Verona Verona Yes
Italy IT Departement Environmental and Health - Pesticide Section Rome x Yes
Italy IT Istituto Zooprofilattico dell'Abruzzo e del Molise G.Caporale Teramo Italy
Teramo Yes
Italy IT IZSLT department of Florence Florence Yes
Italy IT Laboratorio Contaminanti Ambientali - Istituto Zooprofilat-tico Sperimentale dell'Umbria e delle Marche - Perugia Italy.
Perugia Yes
Italy IT Laboratorio di Sanità Pubblica USL Toscana centro Firenze Yes
Italy IT/MT IZSLER Brescia Yes
Latvia LV Research Institute BIOR Riga x Yes
Lithuania LT National food and veterinary risk assessment institute Vilnius x Yes
Luxem-bourg
LU National Laboratory of Health - Food Laboratory Dudelange x Yes
* only for EU-Member States
Appendix 1-a (cont.): participating labs of EU and EFTA member states
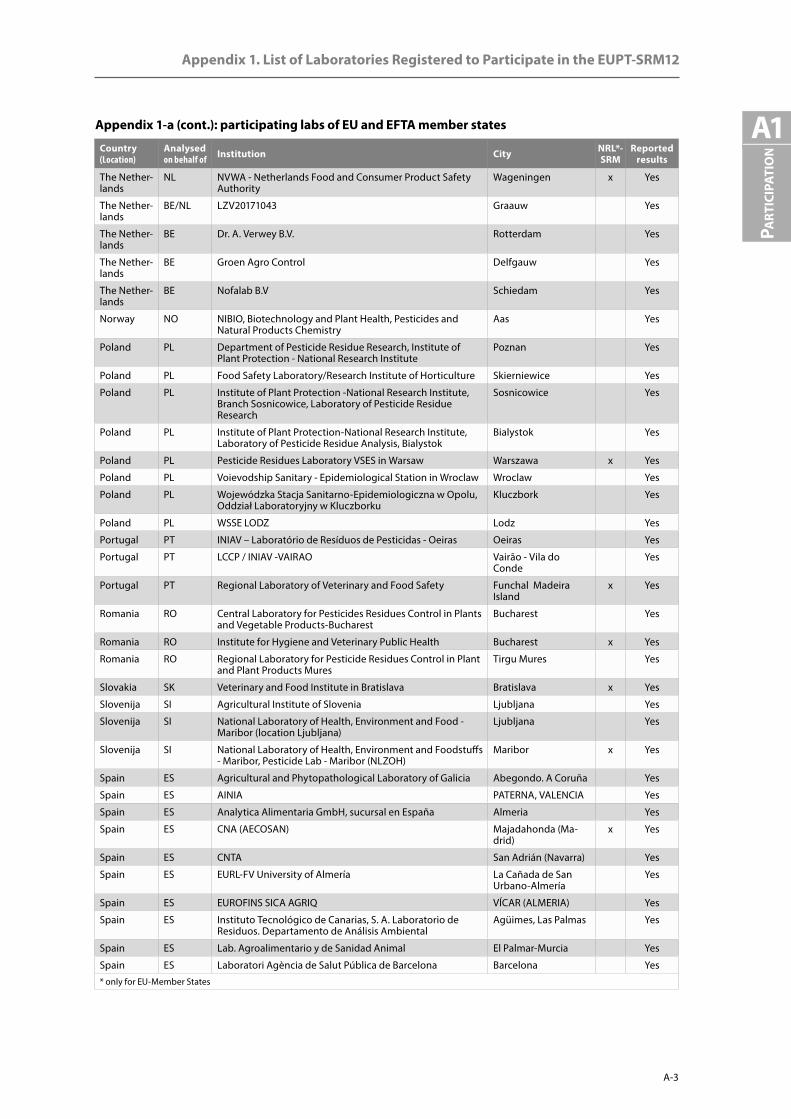
Appendix 1. List of Laboratories Registered to Participate in the EUPT-SRM12
A-3
Part
iciP
atio
n
a1Country (Location)
Analysed on behalf of Institution City NRL*-
SRMReported
results
The Nether-lands
NL NVWA - Netherlands Food and Consumer Product Safety Authority
Wageningen x Yes
The Nether-lands
BE/NL LZV20171043 Graauw Yes
The Nether-lands
BE Dr. A. Verwey B.V. Rotterdam Yes
The Nether-lands
BE Groen Agro Control Delfgauw Yes
The Nether-lands
BE Nofalab B.V Schiedam Yes
Norway NO NIBIO, Biotechnology and Plant Health, Pesticides and Natural Products Chemistry
Aas Yes
Poland PL Department of Pesticide Residue Research, Institute of Plant Protection - National Research Institute
Poznan Yes
Poland PL Food Safety Laboratory/Research Institute of Horticulture Skierniewice Yes
Poland PL Institute of Plant Protection -National Research Institute, Branch Sosnicowice, Laboratory of Pesticide Residue Research
Sosnicowice Yes
Poland PL Institute of Plant Protection-National Research Institute, Laboratory of Pesticide Residue Analysis, Bialystok
Bialystok Yes
Poland PL Pesticide Residues Laboratory VSES in Warsaw Warszawa x Yes
Poland PL Voievodship Sanitary - Epidemiological Station in Wroclaw Wroclaw Yes
Poland PL Wojewódzka Stacja Sanitarno-Epidemiologiczna w Opolu, Oddział Laboratoryjny w Kluczborku
Kluczbork Yes
Poland PL WSSE LODZ Lodz Yes
Portugal PT INIAV – Laboratório de Resíduos de Pesticidas - Oeiras Oeiras Yes
Portugal PT LCCP / INIAV -VAIRAO Vairão - Vila do Conde
Yes
Portugal PT Regional Laboratory of Veterinary and Food Safety Funchal Madeira Island
x Yes
Romania RO Central Laboratory for Pesticides Residues Control in Plants and Vegetable Products-Bucharest
Bucharest Yes
Romania RO Institute for Hygiene and Veterinary Public Health Bucharest x Yes
Romania RO Regional Laboratory for Pesticide Residues Control in Plant and Plant Products Mures
Tirgu Mures Yes
Slovakia SK Veterinary and Food Institute in Bratislava Bratislava x Yes
Slovenija SI Agricultural Institute of Slovenia Ljubljana Yes
Slovenija SI National Laboratory of Health, Environment and Food - Maribor (location Ljubljana)
Ljubljana Yes
Slovenija SI National Laboratory of Health, Environment and Foodstuffs - Maribor, Pesticide Lab - Maribor (NLZOH)
Maribor x Yes
Spain ES Agricultural and Phytopathological Laboratory of Galicia Abegondo. A Coruña Yes
Spain ES AINIA PATERNA, VALENCIA Yes
Spain ES Analytica Alimentaria GmbH, sucursal en España Almeria Yes
Spain ES CNA (AECOSAN) Majadahonda (Ma-drid)
x Yes
Spain ES CNTA San Adrián (Navarra) Yes
Spain ES EURL-FV University of Almería La Cañada de San Urbano-Almería
Yes
Spain ES EUROFINS SICA AGRIQ VÍCAR (ALMERIA) Yes
Spain ES Instituto Tecnológico de Canarias, S. A. Laboratorio de Residuos. Departamento de Análisis Ambiental
Agüimes, Las Palmas Yes
Spain ES Lab. Agroalimentario y de Sanidad Animal El Palmar-Murcia Yes
Spain ES Laboratori Agència de Salut Pública de Barcelona Barcelona Yes
* only for EU-Member States
Appendix 1-a (cont.): participating labs of EU and EFTA member states

EUPT-SRM12 | 2017 (Strawberry Purée)
A-4
Appendix 1-b: Participating labs from EU candidate countries and third countries
Country Institution City Reported results
Canada ISURA Burnaby, BC Yes
Costa Rica Laboratorio de Análisis de Residuos de Agroquímicos San José Yes
Egypt Central Lab of Residue Analysis of Pesticides and Heavy Metals in Foods
Giza Yes
Hong Kong, People’s Republic of China
Government Laboratory Pok Fu Lam Yes
Malaysia Environmental Toxicology Research Center/Korea Institute of Toxicology
Petaling Jaya, Selangor
Yes
South Korea, Republic of Korea
Department of Chemistry Malaysia JINJU-SI, GYEONG-SANGNAM-DO
Yes
Serbia Institute of Public Health of Belgrade Belgrade Yes
Serbia SP LABORATORIJA A.D. BECEJ Yes
Taiwan, Republic of China
ChiMei Inspection Technology Co., Ltd. Taichung City Yes
Country (Location)
Analysed on behalf of Institution City NRL*-
SRMReported
results
Spain ES LABORATORIO AGRARIO REGIONAL. JUNTA DE CASTILLA Y LEON
Burgos Yes
Spain ES Laboratorio Agroalimentario de Extremadura. Cáceres Yes
Spain ES Laboratorio Agroalimentario de Zaragoza Zaragoza Yes
Spain ES Laboratorio Agroalimentario Valencia Burjassot-Valencia Yes
Spain ES LABORATORIO ANALÍTICO BIOCLÍNICO SLU ALMERÍA Yes
Spain ES Laboratorio Arbitral Agroalimentario Madrid Madrid x Yes
Spain ES Laboratorio de Producción y Sanidad Vegetal de Almería La Mojonera (Almería)
Yes
Spain ES LABORATORIO DEL SERVICIO DE INSPECCION SOIVRE Valencia Yes
Spain ES LABORATORIO KUDAM Pilar de la Horadada Yes
Spain ES Laboratorio Salud Pública Ayuntamiento de Madrid. Madrid Salud
Madrid Yes
Spain ES LABORATORIOS ECOSUR, S.A. Lorquí (Murcia) Yes
Spain ES Labs & Technological Services AGQ, S.L. Burguillos (Sevilla) Yes
Spain ES LPSV JAEN Mengibar (Jaén) Yes
Sweden SE Eurofins Food&Feed Testing Sweden AB Lidkoping Yes
Sweden SE National Food Agency Uppsala x Yes
Switzerland CH Cantonal Office of Consumer Protection Aargau Aarau Yes
Switzerland CH Kantonales Labor Zürich Zurich Yes
Unied Kingdom
UK/MT Fera Science Ltd York x Yes
Unied Kingdom
UK SASA Edinburgh Yes
Unied Kingdom
UK Scientific Analysis Laboratories Ltd Bar Hill Yes
* only for EU-Member States
Appendix 1-a (cont.): participating labs of EU and EFTA member states
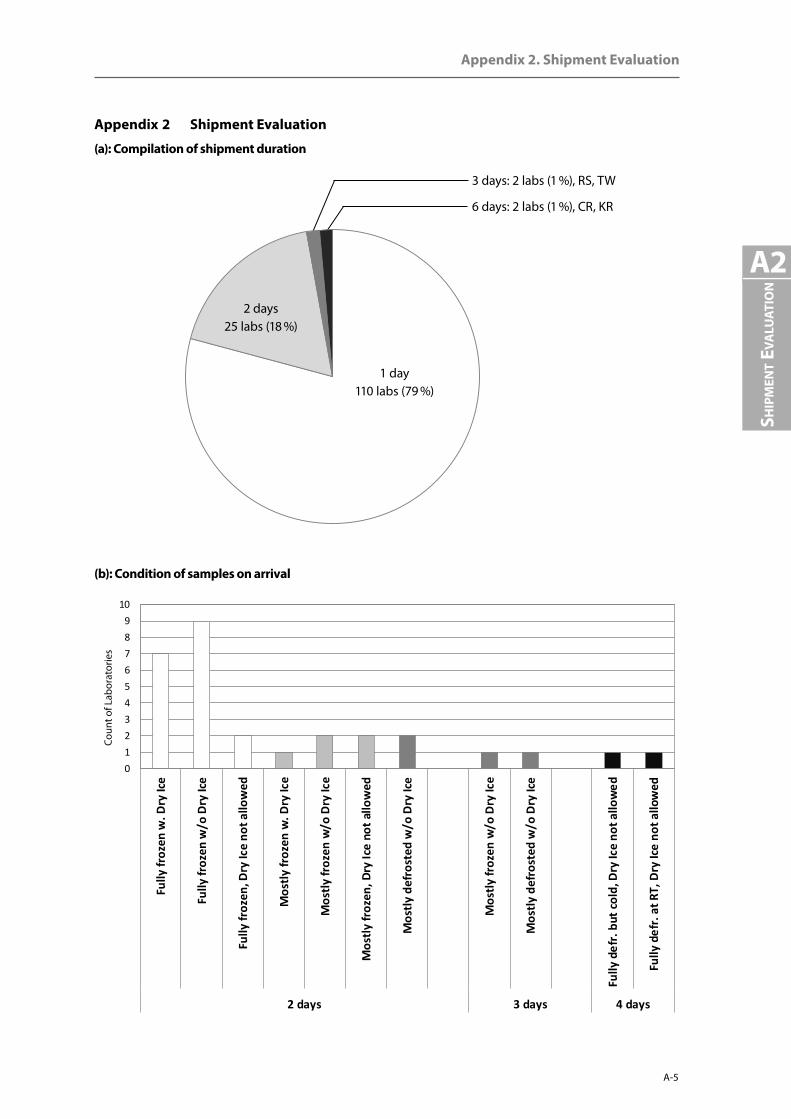
Appendix 2. Shipment Evaluation
A-5
A2
Ship
men
t evA
luAt
ion
Appendix 2 Shipment Evaluation
(a): Compilation of shipment duration
1 day 110 labs (79 %)
2 days 25 labs (18 %)
3 days: 2 labs (1 %), RS, TW
6 days: 2 labs (1 %), CR, KR
0123456789
10
Fully
froz
en w
. Dry
Ice
Fully
froz
en w
/o D
ry Ic
e
Fully
froz
en, D
ry Ic
e no
t allo
wed
Mos
tly fr
ozen
w. D
ry Ic
e
Mos
tly fr
ozen
w/o
Dry
Ice
Mos
tly fr
ozen
, Dry
Ice
not a
llow
ed
Mos
tly d
efro
sted
w/o
Dry
Ice
Mos
tly fr
ozen
w/o
Dry
Ice
Mos
tly d
efro
sted
w/o
Dry
Ice
Fully
def
r. bu
t col
d, D
ry Ic
e no
t allo
wed
Fully
def
r. at
RT,
Dry
Ice
not a
llow
ed
2 days 3 days 4 days
Coun
t of L
abor
ator
ies
(b): Condition of samples on arrival
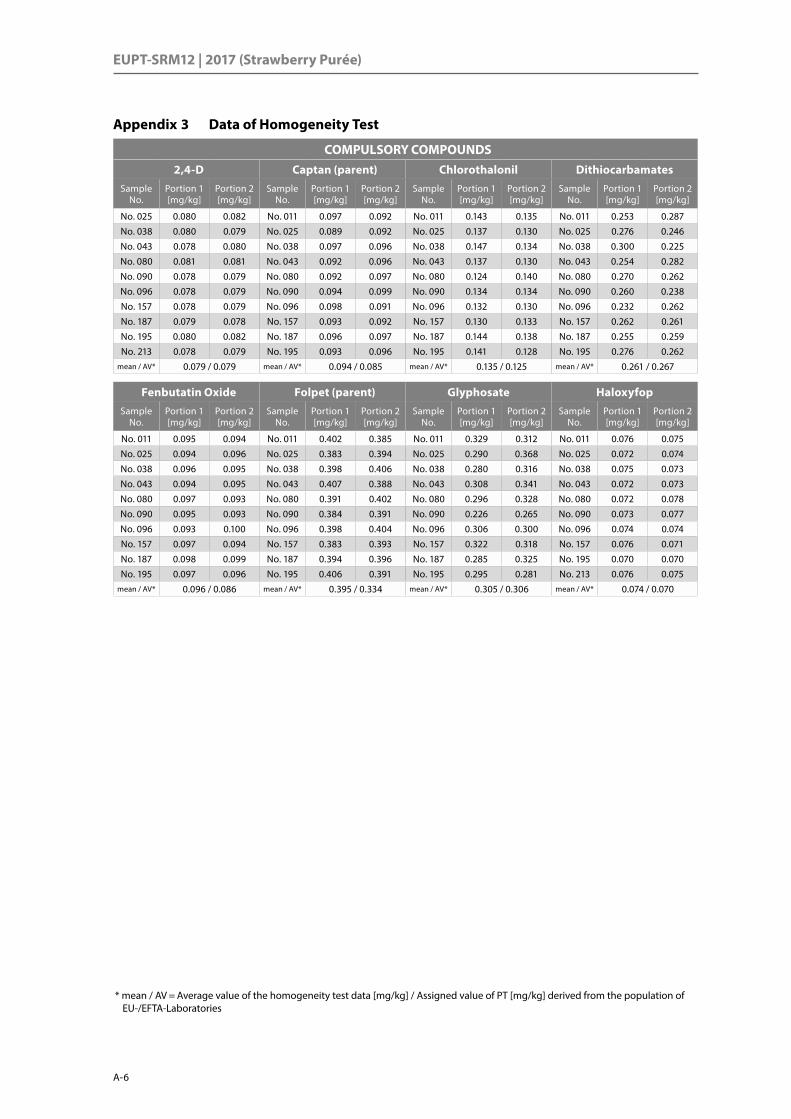
A-6
EUPT-SRM12 | 2017 (Strawberry Purée)
Appendix 3 Data of Homogeneity Test
Fenbutatin Oxide Folpet (parent) Glyphosate HaloxyfopSample
No.Portion 1 [mg/kg]
Portion 2 [mg/kg]
Sample No.
Portion 1 [mg/kg]
Portion 2 [mg/kg]
Sample No.
Portion 1 [mg/kg]
Portion 2 [mg/kg]
Sample No.
Portion 1 [mg/kg]
Portion 2 [mg/kg]
No. 011 0.095 0.094 No. 011 0.402 0.385 No. 011 0.329 0.312 No. 011 0.076 0.075
No. 025 0.094 0.096 No. 025 0.383 0.394 No. 025 0.290 0.368 No. 025 0.072 0.074
No. 038 0.096 0.095 No. 038 0.398 0.406 No. 038 0.280 0.316 No. 038 0.075 0.073
No. 043 0.094 0.095 No. 043 0.407 0.388 No. 043 0.308 0.341 No. 043 0.072 0.073
No. 080 0.097 0.093 No. 080 0.391 0.402 No. 080 0.296 0.328 No. 080 0.072 0.078
No. 090 0.095 0.093 No. 090 0.384 0.391 No. 090 0.226 0.265 No. 090 0.073 0.077
No. 096 0.093 0.100 No. 096 0.398 0.404 No. 096 0.306 0.300 No. 096 0.074 0.074
No. 157 0.097 0.094 No. 157 0.383 0.393 No. 157 0.322 0.318 No. 157 0.076 0.071
No. 187 0.098 0.099 No. 187 0.394 0.396 No. 187 0.285 0.325 No. 195 0.070 0.070
No. 195 0.097 0.096 No. 195 0.406 0.391 No. 195 0.295 0.281 No. 213 0.076 0.075mean / AV* 0.096 / 0.086 mean / AV* 0.395 / 0.334 mean / AV* 0.305 / 0.306 mean / AV* 0.074 / 0.070
COMPULSORY COMPOUNDS2,4-D Captan (parent) Chlorothalonil Dithiocarbamates
Sample No.
Portion 1 [mg/kg]
Portion 2 [mg/kg]
Sample No.
Portion 1 [mg/kg]
Portion 2 [mg/kg]
Sample No.
Portion 1 [mg/kg]
Portion 2 [mg/kg]
Sample No.
Portion 1 [mg/kg]
Portion 2 [mg/kg]
No. 025 0.080 0.082 No. 011 0.097 0.092 No. 011 0.143 0.135 No. 011 0.253 0.287
No. 038 0.080 0.079 No. 025 0.089 0.092 No. 025 0.137 0.130 No. 025 0.276 0.246
No. 043 0.078 0.080 No. 038 0.097 0.096 No. 038 0.147 0.134 No. 038 0.300 0.225
No. 080 0.081 0.081 No. 043 0.092 0.096 No. 043 0.137 0.130 No. 043 0.254 0.282
No. 090 0.078 0.079 No. 080 0.092 0.097 No. 080 0.124 0.140 No. 080 0.270 0.262
No. 096 0.078 0.079 No. 090 0.094 0.099 No. 090 0.134 0.134 No. 090 0.260 0.238
No. 157 0.078 0.079 No. 096 0.098 0.091 No. 096 0.132 0.130 No. 096 0.232 0.262
No. 187 0.079 0.078 No. 157 0.093 0.092 No. 157 0.130 0.133 No. 157 0.262 0.261
No. 195 0.080 0.082 No. 187 0.096 0.097 No. 187 0.144 0.138 No. 187 0.255 0.259
No. 213 0.078 0.079 No. 195 0.093 0.096 No. 195 0.141 0.128 No. 195 0.276 0.262mean / AV* 0.079 / 0.079 mean / AV* 0.094 / 0.085 mean / AV* 0.135 / 0.125 mean / AV* 0.261 / 0.267
* mean / AV = Average value of the homogeneity test data [mg/kg] / Assigned value of PT [mg/kg] derived from the population of EU-/EFTA-Laboratories

Appendix 3. Data of Homogeneity Test
A-7
Ho
mo
gen
eity
A3
Dithianon Phosphonic acid N-Acetyl glyphosateSample
No.Portion 1 [mg/kg]
Portion 2 [mg/kg]
Sample No.
Portion 1 [mg/kg]
Portion 2 [mg/kg]
Sample No.
Portion 1 [mg/kg]
Portion 2 [mg/kg]
No. 011 0.317 0.337 No. 011 19.7 18.9 No. 011 0.088 0.082
No. 025 0.317 0.298 No. 025 18.1 19.0 No. 025 0.094 0.087
No. 038 0.311 0.293 No. 038 18.0 17.8 No. 038 0.095 0.084
No. 043 0.321 0.317 No. 043 17.8 19.5 No. 043 0.091 0.085
No. 080 0.312 0.298 No. 080 19.0 17.7 No. 080 0.080 0.082
No. 090 0.316 0.323 No. 090 17.8 18.6 No. 090 0.081 0.084
No. 096 0.312 0.329 No. 096 18.7 17.9 No. 096 0.090 0.088
No. 157 0.295 0.308 No. 157 18.2 18.4 No. 157 0.087 0.085
No. 187 0.321 0.324 No. 187 18.3 17.9 No. 187 0.089 0.090
No. 195 0.315 0.308 No. 195 18.6 19.3 No. 195 0.083 0.092mean / AV* 0.314 / 0.294 mean / AV* 18.5 / 19.3 mean / AV* 0.087 / 0.100
OPTIONAL COMPOUNDSBifenazate (sum) Bromide ion Carbofuran (part of sum) Chlorate
Sample No.
Portion 1 [mg/kg]
Portion 2 [mg/kg]
Sample No.
Portion 1 [mg/kg]
Portion 2 [mg/kg]
Sample No.
Portion 1 [mg/kg]
Portion 2 [mg/kg]
Sample No.
Portion 1 [mg/kg]
Portion 2 [mg/kg]
No. 011 0.282 0.274 No. 011 21.2 20.2 No. 011 0.0045 0.0044 No. 011 0.488 0.473
No. 025 0.282 0.282 No. 025 23.0 21.3 No. 025 0.0044 0.0043 No. 025 0.476 0.473
No. 038 0.277 0.279 No. 038 20.1 21.9 No. 038 0.0042 0.0044 No. 038 0.483 0.486
No. 043 0.270 0.276 No. 043 19.2 20.4 No. 043 0.0040 0.0044 No. 043 0.465 0.474
No. 080 0.278 0.277 No. 080 20.5 21.7 No. 080 0.0044 0.0043 No. 080 0.522 0.499
No. 090 0.282 0.255 No. 090 20.5 19.7 No. 090 0.0041 0.0042 No. 090 0.489 0.461
No. 096 0.248 0.270 No. 096 22.4 19.1 No. 096 0.0042 0.0043 No. 096 0.497 0.482
No. 157 0.277 0.280 No. 157 21.2 20.9 No. 157 0.0042 0.0042 No. 157 0.495 0.487
No. 187 0.268 0.288 No. 187 21.6 21.0 No. 187 0.0045 0.0042 No. 187 0.514 0.510
No. 195 0.281 0.274 No. 195 22.6 20.6 No. 195 0.0044 0.0044 No. 195 0.525 0.477mean / AV* 0.275 / 0.270 mean / AV* 21.0 / 19.1 mean / AV* 0.0043 / 0.0030 mean / AV* 0.489 / 0.490
* mean / AV = Average value of the homogeneity test data [mg/kg] / Assigned value of PT [mg/kg] derived from the population of EU-/EFTA-Laboratories
ADDITIONAL COMPOUNDSCaptan (sum) Folpet (sum) Phtalimid THPI
Sample No.
Portion 1 [mg/kg]
Portion 2 [mg/kg]
Sample No.
Portion 1 [mg/kg]
Portion 2 [mg/kg]
Sample No.
Portion 1 [mg/kg]
Portion 2 [mg/kg]
Sample No.
Portion 1 [mg/kg]
Portion 2 [mg/kg]
No. 011 0.300 0.280 No. 011 1.242 1.147 No. 011 0.416 0.377 No. 011 0.104 0.095
No. 025 0.285 0.281 No. 025 1.215 1.165 No. 025 0.412 0.382 No. 025 0.100 0.096
No. 038 0.291 0.275 No. 038 1.179 1.137 No. 038 0.386 0.361 No. 038 0.099 0.091
No. 043 0.296 0.306 No. 043 1.192 1.275 No. 043 0.388 0.439 No. 043 0.103 0.107
No. 080 0.300 0.282 No. 080 1.250 1.192 No. 080 0.425 0.391 No. 080 0.105 0.094
No. 090 0.278 0.286 No. 090 1.123 1.160 No. 090 0.366 0.380 No. 090 0.093 0.096
No. 096 0.279 0.290 No. 096 1.132 1.219 No. 096 0.363 0.402 No. 096 0.092 0.101
No. 157 0.293 0.275 No. 157 1.220 1.177 No. 157 0.414 0.388 No. 157 0.102 0.093
No. 187 0.288 0.295 No. 187 1.216 1.233 No. 187 0.407 0.414 No. 187 0.098 0.101
No. 195 0.287 0.294 No. 195 1.202 1.243 No. 195 0.393 0.422 No. 195 0.099 0.101mean / AV* 0.288 / 0.302 mean / AV* 1.196 / 1.195 mean / AV* 0.396 / 0.446 mean / AV* 0.099 / 0.110

EUPT-SRM12 | 2017 (Strawberry Purée)
A-8
* RSD = relative standard diviation
Appendix 4 Data of Stability Test
COMPULSORY COMPOUNDS2,4-D Captan (parent)
AV [mg/kg] 0.079 AV [mg/kg] 0.085
Date 29.03.2017 19.04.2017 11.05.2017 Date 29.03.2017 19.04.2017 11.05.2017
Sample [mg/kg] [mg/kg] [mg/kg] Sample [mg/kg] [mg/kg] [mg/kg]
Nr. 025 0.079 0.077 0.081 0.077 0.078 0.080 Nr. 025 0.094 0.087 0.097 0.095 0.087 0.089
Nr. 080 0.081 0.080 0.078 0.082 0.079 0.078 Nr. 080 0.085 0.094 0.092 0.089 0.091 0.093
Nr. 096 0.076 0.078 0.077 0.079 0.077 0.075 Nr. 187 0.074 0.090 0.091 0.093 0.086 0.085
Mean [mg/kg] 0.079 0.079 0.078 Mean [mg/kg] 0.087 0.093 0.088
RSD* [%] 2.30 % 1.27 % 2.07 % RSD* [%] 5.41 % 2.79 % 3.55 %
Diviation [%] (ref. 1st Anaylsis) — 0.64 % -0.85 % Diviation [%]
(ref. 1st Anaylsis) — 6.29 % 1.32 %
Chlorothalonil Dithiocarbamates
AV [mg/kg] 0.125 AV [mg/kg] 0.267
Date 29.03.2017 19.04.2017 11.05.2017 Date 06.04.2017 27.04.2017 18.05.2017
Sample [mg/kg] [mg/kg] [mg/kg] Sample [mg/kg] [mg/kg] [mg/kg]
Nr. 025 0.146 0.145 0.137 0.135 0.143 0.142 Nr. 025 0.146 0.145 0.137 0.135 0.143 0.142
Nr. 080 0.141 0.138 0.139 0.139 0.131 0.136 Nr. 080 0.141 0.138 0.139 0.139 0.131 0.136
Nr. 096 0.138 0.140 0.125 0.129 0.132 0.135 Nr. 096 0.138 0.140 0.125 0.129 0.132 0.135
Mean [mg/kg] 0.141 0.134 0.137 Mean [mg/kg] 0.141 0.134 0.137
RSD* [%] 2.55 % 4.55 % 3.49 % RSD* [%] 2.55 % 4.55 % 3.49 %
Diviation [%] (ref. 1st Anaylsis) — -5.13 % -3.43 % Diviation [%]
(ref. 1st Anaylsis) — -5.13 % -3.43 %
Fenbutatin Oxide Folpet (parent)
AV [mg/kg] 0.086 AV [mg/kg] 0.334
Date 29.03.2017 19.04.2017 11.05.2017 Date 29.03.2017 19.04.2017 11.05.2017
Sample [mg/kg] [mg/kg] [mg/kg] Sample [mg/kg] [mg/kg] [mg/kg]
Nr. 025 0.095 0.093 0.100 0.100 0.102 0.104 Nr. 025 0.403 0.390 0.391 0.387 0.391 0.386
Nr. 080 0.096 0.100 0.098 0.099 0.099 0.092 Nr. 080 0.394 0.401 0.398 0.393 0.380 0.393
Nr. 096 0.097 0.101 0.094 0.098 0.099 0.099 Nr. 187 0.401 0.400 0.389 0.400 0.404 0.376
Mean [mg/kg] 0.097 0.098 0.099 Mean [mg/kg] 0.398 0.393 0.388
RSD* [%] 2.82 % 1.98 % 3.80 % RSD* [%] 0.53 % 0.87 % 0.48 %
Diviation [%] (ref. 1st Anaylsis) — 1.28 % 1.96 % Diviation [%]
(ref. 1st Anaylsis) — -1.35 % -2.53 %
Glyphosate Haloxyfop
AV [mg/kg] 0.306 AV [mg/kg] 0.070
Date 24.03.2017 13.04.2017 12.05.2017 Date 29.03.2017 19.04.2017 11.05.2017
Sample [mg/kg] [mg/kg] [mg/kg] Sample [mg/kg] [mg/kg] [mg/kg]
Nr. 025 0.302 0.279 0.300 0.259 0.233 0.325 Nr. 025 0.071 0.074 0.076 0.074 0.077 0.073
Nr. 080 0.318 0.336 0.311 0.288 0.248 0.288 Nr. 080 0.074 0.074 0.076 0.076 0.073 0.073
Nr. 096 0.293 0.309 0.290 0.301 0.341 0.287 Nr. 096 0.078 0.076 0.070 0.073 0.071 0.072
Mean [mg/kg] 0.306 0.292 0.287 Mean [mg/kg] 0.075 0.074 0.073
RSD* [%] 6.14 % 3.63 % 8.37 % RSD* [%] 3.08 % 3.19 % 2.40 %
Diviation [%] (ref. 1st Anaylsis) — -4.79 % -6.26 % Diviation [%]
(ref. 1st Anaylsis) — -0.45 % -1.79 %
/ Compulsory Compounds

Appendix 4. Data of Stability Test
A-9
Sta
bili
ty
a4
OPTIONAL COMPOUNDSBifenazate (sum) Bromide Ion
AV [mg/kg] 0.270 AV [mg/kg] 19.1
Date 29.03.2017 19.04.2017 11.05.2017 Date 24.03.2017 13.04.2017 12.05.2017
Sample [mg/kg] [mg/kg] [mg/kg] Sample [mg/kg] [mg/kg] [mg/kg]
Nr. 025 0.291 0.294 0.283 0.287 0.288 0.283 Nr. 025 19.0 21.4 20.4 24.1 20.8 19.9
Nr. 080 0.285 0.289 0.285 0.283 0.282 0.290 Nr. 080 21.3 19.5 19.6 19.9 19.0 19.7
Nr. 096 0.295 0.287 0.278 0.286 0.276 0.281 Nr. 187 18.9 20.7 17.7 18.5 19.9 19.2
Mean [mg/kg] 0.290 0.284 0.283 Mean [mg/kg] 20.1 20.0 19.8
RSD* [%] 0.91 % 0.45 % 1.48 % RSD* [%] 1.52 % 10.43 % 2.68 %
Diviation [%] (ref. 1st Anaylsis) — -2.23 % -2.39 % Diviation [%]
(ref. 1st Anaylsis) — -0.50 % -1.90 %
Carbofuran (part of sum) Chlorate
AV [mg/kg] 0.0030 AV [mg/kg] 0.490
Date 29.03.2017 19.04.2017 11.05.2017 Date 24.03.2017 13.04.2017 12.05.2017
Sample [mg/kg] [mg/kg] [mg/kg] Sample [mg/kg] [mg/kg] [mg/kg]
Nr. 025 0.0046 0.0047 0.0041 0.0041 0.0044 0.0044 Nr. 025 0.432 0.457 0.455 0.453 0.441 0.449
Nr. 080 0.0047 0.0045 0.0043 0.0044 0.0045 0.0045 Nr. 080 0.445 0.425 0.443 0.473 0.442 0.437
Nr. 096 0.0045 0.0046 0.0043 0.0041 0.0045 0.0046 Nr. 096 0.412 0.416 0.439 0.443 0.401 0.431
Mean [mg/kg] 0.0043 0.0042 0.0045 Mean [mg/kg] 0.431 0.451 0.434
RSD* [%] 1.34 % 2.99 % 2.25 % RSD* [%] 3.62 % 1.97 % 3.55 %
Diviation [%] (ref. 1st Anaylsis) — -2.15 % 4.01 % Diviation [%]
(ref. 1st Anaylsis) — 4.60 % 0.54 %
Dithianon Phosphonic acid
AV [mg/kg] 0.294 AV [mg/kg] 19.3
Date 29.03.2017 19.04.2017 11.05.2017 Date 24.03.2017 13.04.2017 12.05.2017
Sample [mg/kg] [mg/kg] [mg/kg] Sample [mg/kg] [mg/kg] [mg/kg]
Nr. 025 0.331 0.320 0.324 0.302 0.318 0.304 Nr. 025 17.5 21.0 19.1 22.6 19.4 17.9
Nr. 080 0.300 0.330 0.301 0.337 0.302 0.339 Nr. 080 18.4 16.2 18.5 18.8 18.7 17.4
Nr. 096 0.345 0.306 0.315 0.331 0.344 0.343 Nr. 096 17.5 18.8 17.1 18.0 18.0 18.8
Mean [mg/kg] 0.322 0.318 0.325 Mean [mg/kg] 18.4 19.0 18.4
RSD* [%] 1.88 % 1.58 % 5.14 % RSD* [%] 0.77 % 8.84 % 1.64 %
Diviation [%] (ref. 1st Anaylsis) — -1.14 % 0.93 % Diviation [%]
(ref. 1st Anaylsis) — 3.22 % -0.31 %
N-Acetyl glyphosate
AV [mg/kg] 0.100
Date 24.03.2017 13.04.2017 12.05.2017
Sample [mg/kg] [mg/kg] [mg/kg]
Nr. 025 0.087 0.083 0.094 0.085 0.088 0.079
Nr. 080 0.087 0.089 0.088 0.088 0.084 0.089
Nr. 096 0.087 0.088 0.086 0.080 0.082 0.090
Mean [mg/kg] 0.087 0.087 0.085
RSD* [%] 1.85 % 3.92 % 1.88 %
Diviation [%] (ref. 1st Anaylsis) — 0.00 % -1.73 %
Appendix 4 (cont.): Data of Stability Test / Optional Compounds

EUPT-SRM12 | 2017 (Strawberry Purée)
A-10
ADDITIONAL COMPOUNDSCaptan (sum) Folpet (sum)
AV [mg/kg] 0.302 AV [mg/kg] 1.195
Date 29.03.2017 19.04.2017 11.05.2017 Date 29.03.2017 19.04.2017 11.05.2017
Sample [mg/kg] [mg/kg] [mg/kg] Sample [mg/kg] [mg/kg] [mg/kg]
Nr. 025 0.282 0.273 0.298 0.292 0.250 0.274 Nr. 025 1.148 1.118 1.217 1.180 1.007 1.106
Nr. 080 0.277 0.308 0.288 0.304 0.279 0.273 Nr. 080 1.140 1.264 1.186 1.259 1.137 1.112
Nr. 187 0.291 0.286 0.288 0.288 0.261 0.271 Nr. 187 1.217 1.203 1.195 1.158 1.057 1.068
Mean [mg/kg] 0.286 0.293 0.268 Mean [mg/kg] 1.182 1.199 1.081
RSD* [%] 2.70 % 1.44 % 2.72 % RSD* [%] 3.59 % 1.91 % 3.50 %
Diviation [%] (ref. 1st Anaylsis) — 2.34 % -6.33 % Diviation [%]
(ref. 1st Anaylsis) — 1.47 % -8.53 %
Phthalimide THPI
AV [mg/kg] 0.446 AV [mg/kg] 0.110
Date 29.03.2017 19.04.2017 11.05.2017 Date 29.03.2017 19.04.2017 11.05.2017
Sample [mg/kg] [mg/kg] [mg/kg] Sample [mg/kg] [mg/kg] [mg/kg]
Nr. 025 0.370 0.361 0.410 0.393 0.306 0.357 Nr. 025 0.094 0.094 0.101 0.099 0.082 0.093
Nr. 080 0.370 0.429 0.391 0.430 0.376 0.357 Nr. 080 0.096 0.108 0.098 0.108 0.095 0.091
Nr. 187 0.405 0.399 0.400 0.376 0.324 0.343 Nr. 187 0.109 0.099 0.099 0.098 0.088 0.094
Mean [mg/kg] 0.389 0.400 0.344 Mean [mg/kg] 0.100 0.101 0.090
RSD* [%] 5.23 % 2.78 % 5.69 % RSD* [%] 5.30 % 2.32 % 2.91 %
Diviation [%] (ref. 1st Anaylsis) — 2.90 % -11.58 % Diviation [%]
(ref. 1st Anaylsis) — 0.61 % -9.69 %
Appendix 4 (cont.): Data of Stability Test / Additional Compounds

Appendix 5. Histograms and kernel Density Estimates of z-score Distributions
A-11
A5
His
tog
rAm
m
-4 -3.5 -3 -2.5 -2 -1.5 -1 -0.5 0 0.5 1 1.5 2 2.5 3 3.5 4 4.5 502468
101214161820222426283032343638
-4 -3.5 -3 -2.5 -2 -1.5 -1 -0.5 0 0.5 1 1.5 2 2.5 3 3.5 4 4.5 502468
101214161820222426
-4 -3.5 -3 -2.5 -2 -1.5 -1 -0.5 0 0.5 1 1.5 2 2.5 3 3.5 4 4.5 502468
101214161820222426
-4 -3.5 -3 -2.5 -2 -1.5 -1 -0.5 0 0.5 1 1.5 2 2.5 3 3.5 4 4.5 502468
1012141618202224262830
-4 -3.5 -3 -2.5 -2 -1.5 -1 -0.5 0 0.5 1 1.5 2 2.5 3 3.5 4 4.5 502468
10121416182022242628
-4 -3.5 -3 -2.5 -2 -1.5 -1 -0.5 0 0.5 1 1.5 2 2.5 3 3.5 4 4.5 502468
101214161820222426
-4 -3.5 -3 -2.5 -2 -1.5 -1 -0.5 0 0.5 1 1.5 2 2.5 3 3.5 4 4.5 502468
101214161820222426
-4 -3.5 -3 -2.5 -2 -1.5 -1 -0.5 0 0.5 1 1.5 2 2.5 3 3.5 4 4.5 502468
1012141618202224262830323436
Appendix 5 Histograms and kernel Density Estimates of z-score DistributionsHistograms and kernel Density Estimates of z-score* Distributions(Results from EU and EFTA Laboratories only)
Coun
t of z
-sco
res
Haloxyfop (AV derived from entire population)
Folpet (parent) (AV derived from entire population)
* Cut-off at z-score = 5;
Fenbutatin oxide (AV derived from entire population)
Range of z-scores
Chlorothalonil (AV derived from entire population)
Dithiocarbamates (AV derived from entire population)
Captan (parent) (AV derived from entire population)
Compulsory Compounds
2,4-D (AV derived from entire population)
Glyphosate (AV derived from entire population)
|z-score| ≤ 2 acceptable2 < |z-score| < 3 questionable
|z-score| ≥ 3 unacceptable
|z-score| ≤ 2 acceptable2 < |z-score| < 3 questionable
|z-score| ≥ 3 unacceptable
|z-score| ≤ 2 acceptable2 < |z-score| < 3 questionable
|z-score| ≥ 3 unacceptable
|z-score| ≤ 2 acceptable2 < |z-score| < 3 questionable
|z-score| ≥ 3 unacceptable
Coun
t of z
-sco
res
Coun
t of z
-sco
res
Range of z-scores Range of z-scores
Coun
t of z
-sco
res
Coun
t of z
-sco
res
Range of z-scores Range of z-scores
|z-score| ≤ 2 acceptable2 < |z-score| < 3 questionable
|z-score| ≥ 3 unacceptable
|z-score| ≤ 2 acceptable2 < |z-score| < 3 questionable
|z-score| ≥ 3 unacceptable
|z-score| ≤ 2 acceptable2 < |z-score| < 3 questionable
|z-score| ≥ 3 unacceptable
|z-score| ≤ 2 acceptable2 < |z-score| < 3 questionable
|z-score| ≥ 3 unacceptable
Coun
t of z
-sco
res
Coun
t of z
-sco
res
Coun
t of z
-sco
res
Coun
t of z
-sco
res
Range of z-scores Range of z-scores
Range of z-scores Range of z-scores

EUPT-SRM11 | 2016 (Spinach Homogenate)
A-12
-4 -3.5 -3 -2.5 -2 -1.5 -1 -0.5 0 0.5 1 1.5 2 2.5 3 3.5 4 4.5 50
2
4
6
8
-4 -3.5 -3 -2.5 -2 -1.5 -1 -0.5 0 0.5 1 1.5 2 2.5 3 3.5 4 4.5 50
2
4
6
8
10
12
14
-4 -3.5 -3 -2.5 -2 -1.5 -1 -0.5 0 0.5 1 1.5 2 2.5 3 3.5 4 4.5 50
2
4
6
8
10
12
14
16
18
-4 -3.5 -3 -2.5 -2 -1.5 -1 -0.5 0 0.5 1 1.5 2 2.5 3 3.5 4 4.5 502468
1012141618202224
-4 -3.5 -3 -2.5 -2 -1.5 -1 -0.5 0 0.5 1 1.5 2 2.5 3 3.5 4 4.5 50
2
4
6
8
10
12
14
16
18
-4 -3.5 -3 -2.5 -2 -1.5 -1 -0.5 0 0.5 1 1.5 2 2.5 3 3.5 4 4.5 50
2
4
6
8
10
12
14
N-Acetyl glyphosate (AV derived from entire population)
Phosphonic acid (AV # derived from entire population)
Range of z-scores
Chlorate (AV derived from entire population)
Dithianon (AV derived from entire population)
Bromide ion (AV derived from entire population)
Appendix 5 (cont.) Histograms and kernel Density Estimates of z-score* Distributions(Results from EU and EFTA Laboratories only)
* Cut-off at z-score = 5# excluding carbofuran due to high uncertainty of its assigned value
Optional Compounds #
Bifenazate (P) (AV derived from entire population)
|z-score| ≤ 2 acceptable2 < |z-score| < 3 questionable
|z-score| ≥ 3 unacceptable
|z-score| ≤ 2 acceptable2 < |z-score| < 3 questionable
|z-score| ≥ 3 unacceptable
Coun
t of z
-sco
res
Coun
t of z
-sco
res
Range of z-scores Range of z-scores
|z-score| ≤ 2 acceptable2 < |z-score| < 3 questionable
|z-score| ≥ 3 unacceptable
|z-score| ≤ 2 acceptable2 < |z-score| < 3 questionable
|z-score| ≥ 3 unacceptable
|z-score| ≤ 2 acceptable2 < |z-score| < 3 questionable
|z-score| ≥ 3 unacceptable
|z-score| ≤ 2 acceptable2 < |z-score| < 3 questionable
|z-score| ≥ 3 unacceptable
Coun
t of z
-sco
res
Coun
t of z
-sco
res
Coun
t of z
-sco
res
Coun
t of z
-sco
res
Range of z-scores Range of z-scores
Range of z-scores Range of z-scores
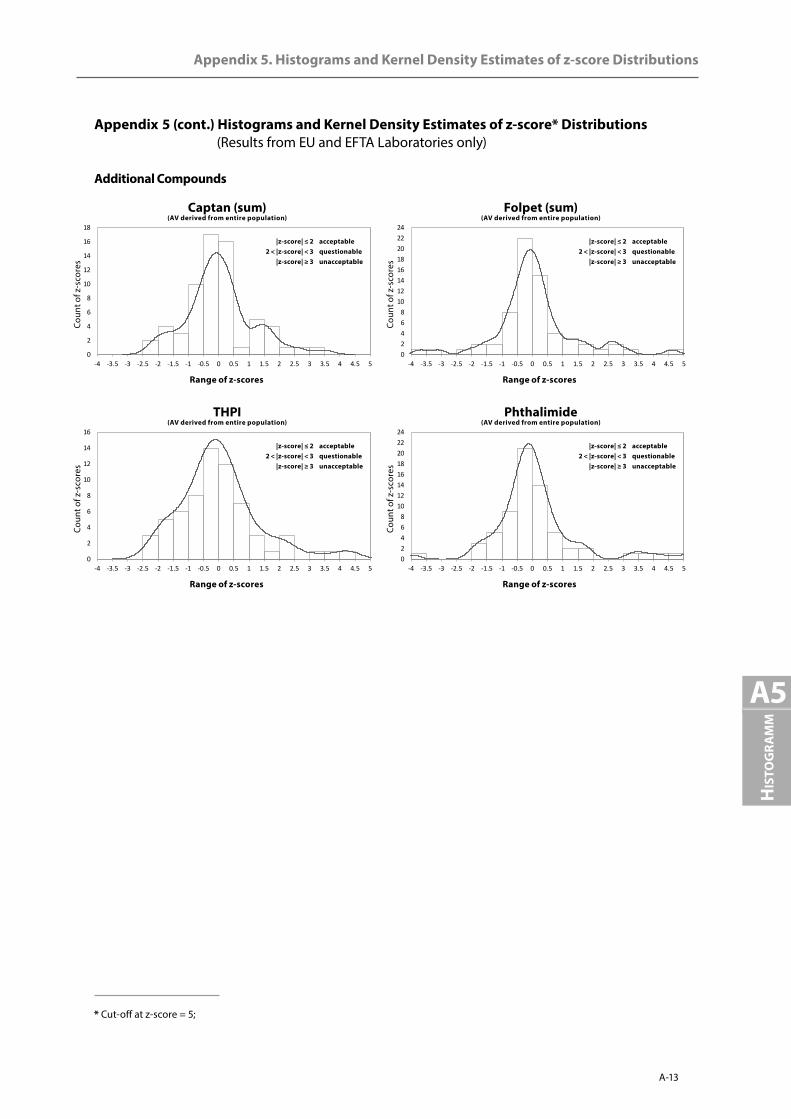
Appendix 5. Histograms and kernel Density Estimates of z-score Distributions
A-13
A5
His
tog
rAm
m
-4 -3.5 -3 -2.5 -2 -1.5 -1 -0.5 0 0.5 1 1.5 2 2.5 3 3.5 4 4.5 502468
1012141618202224
-4 -3.5 -3 -2.5 -2 -1.5 -1 -0.5 0 0.5 1 1.5 2 2.5 3 3.5 4 4.5 50
2
4
6
8
10
12
14
16
-4 -3.5 -3 -2.5 -2 -1.5 -1 -0.5 0 0.5 1 1.5 2 2.5 3 3.5 4 4.5 502468
1012141618202224
-4 -3.5 -3 -2.5 -2 -1.5 -1 -0.5 0 0.5 1 1.5 2 2.5 3 3.5 4 4.5 50
2
4
6
8
10
12
14
16
18
Appendix 5 (cont.) Histograms and kernel Density Estimates of z-score* Distributions(Results from EU and EFTA Laboratories only)
Additional Compounds
* Cut-off at z-score = 5;
THPI (AV derived from entire population)
Phthalimide (AV derived from entire population)
Folpet (sum) (AV derived from entire population)
Captan (sum) (AV derived from entire population)
|z-score| ≤ 2 acceptable2 < |z-score| < 3 questionable
|z-score| ≥ 3 unacceptable
|z-score| ≤ 2 acceptable2 < |z-score| < 3 questionable
|z-score| ≥ 3 unacceptable
Coun
t of z
-sco
res
Coun
t of z
-sco
res
Range of z-scores Range of z-scores
|z-score| ≤ 2 acceptable2 < |z-score| < 3 questionable
|z-score| ≥ 3 unacceptable
|z-score| ≤ 2 acceptable2 < |z-score| < 3 questionable
|z-score| ≥ 3 unacceptable
Coun
t of z
-sco
res
Coun
t of z
-sco
res
Range of z-scores Range of z-scores

EUPT-SRM12 | 2017 (Strawberry Purée)
A-14
-5-4-3-2-1012345
*4411
*1670
9115126
5814
*13102128
101
5257
*9845
279
*28*62*96
389351
75378
12718
4201215618488
109*30
4794
*66*124
*8134422795
*103*29
2699*62125
*3368
*173241
*49*363642486
116744876
*354650
1133990
12997
108*19
8692292
104117
72125106130*67
89*107
*91*75
71*83
App
endi
x 6
Gra
phic
Pre
sent
atio
n of
z-S
core
s: C
ompu
lsor
y Co
mpo
unds
2,4-
D(A
ssig
ned
val
ue
and
CV
* d
eriv
ed fr
om e
nti
re p
opu
lati
on)
acce
ptab
le93
labs
95 %
ques
tiona
ble
2 la
bs2
%un
acce
ptab
le3
labs
3 %
fals
e ne
gativ
e1
lab
Ass
igne
d va
lue
=0.
079
mg/
kgC
V*
=13
.3 %
MRR
L =
0.01
mg/
kg
36.245.8
(Res
ults
from
EU
and
EFT
A L
abor
ator
ies
only
, * =
NRL
)

Appendix 6. Graphic Presentation of z-Scores
A-15
A6
z-sc
ore
dis
trib
uti
on
-5-4-3-2-1012345
106120
970
*9823
112*49
934163
15624
*29*62
3847
*107113
*3129
53126
45774484626
1091294
7116
14425077
*83841561
104*33
3721
*6669
*4492202597
*1788
*912
102130*19
223990
115317832
*124*67
18*96
76*30*35127
*1035845*6
*105*75117*13*73
5272
125959986
110108
App
endi
x 6
(con
t.)
Gra
phic
Pre
sent
atio
n of
z-Sc
ores
: Com
puls
ory
Com
poun
ds
Capt
an (P
aren
t)(A
ssig
ned
val
ue
and
CV
* d
eriv
ed fr
om e
nti
re p
opu
lati
on)
acce
ptab
le77
labs
83 %
ques
tiona
ble
6 la
bs6
%un
acce
ptab
le10
labs
11 %
fals
e ne
gativ
e2
labs
Ass
igne
d va
lue
=0.
085
mg/
kgC
V*
=28
.1 %
MRR
L =
0.01
mg/
kg5.110.717.2
(Res
ults
from
EU
and
EFT
A L
abor
ator
ies
only
, * =
NRL
)
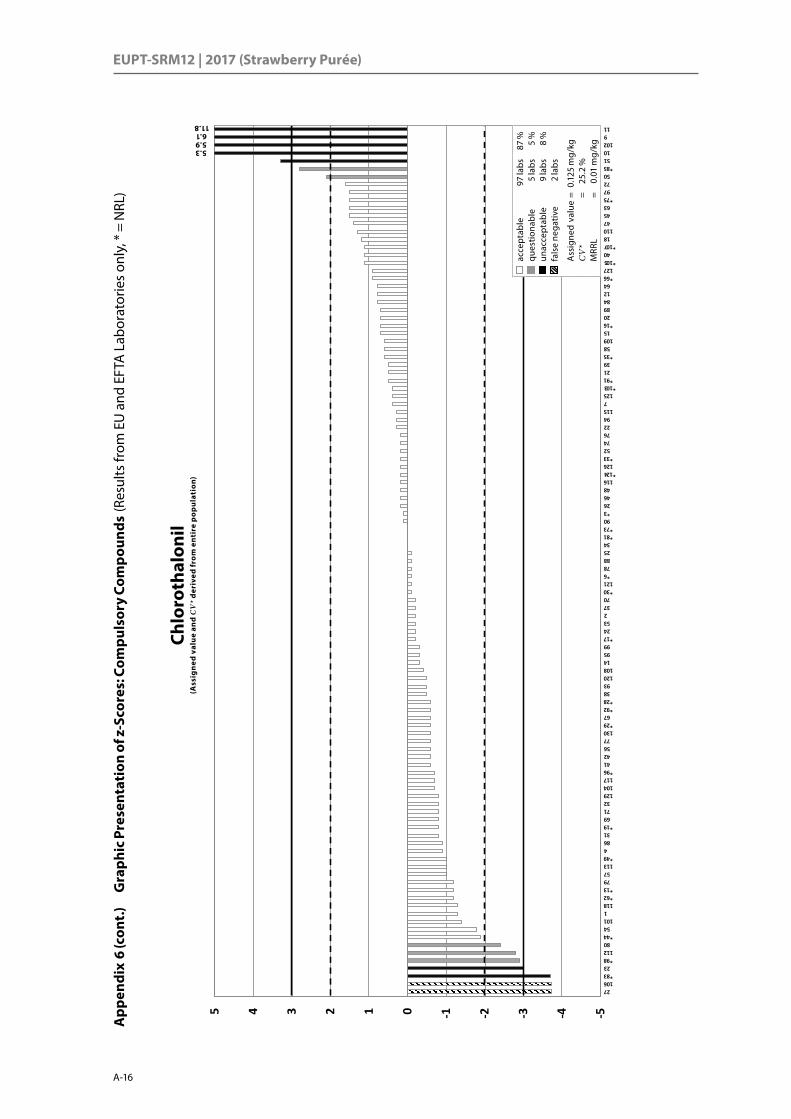
EUPT-SRM12 | 2017 (Strawberry Purée)
A-16
-5-4-3-2-1012345
27106*83
23*98112
80*44
54101
1118*62*13
7957
113*49
48631
*19697132
129104117*96
41425677
130*29
67*92*28
3893
120108
149599
*172453
23770
*30121
*678882534
*81*73
90*3264648
116*124
126*33
5274762294
1157
125*103
*912139
*3558
10915
*162089841264
*66127
*10540
*10718
110474563
*75977250
*855110
1029
11
App
endi
x 6
(con
t.)
Gra
phic
Pre
sent
atio
n of
z-Sc
ores
: Com
puls
ory
Com
poun
ds
Chlo
roth
alon
il(A
ssig
ned
val
ue
and
CV
* d
eriv
ed fr
om e
nti
re p
opu
lati
on)
acce
ptab
le97
labs
87 %
ques
tiona
ble
5 la
bs5
%un
acce
ptab
le9
labs
8 %
fals
e ne
gativ
e2
labs
Ass
igne
d va
lue
=0.
125
mg/
kgC
V*
=25
.2 %
MRR
L =
0.01
mg/
kg5.35.96.1
11.8
(Res
ults
from
EU
and
EFT
A L
abor
ator
ies
only
, * =
NRL
)
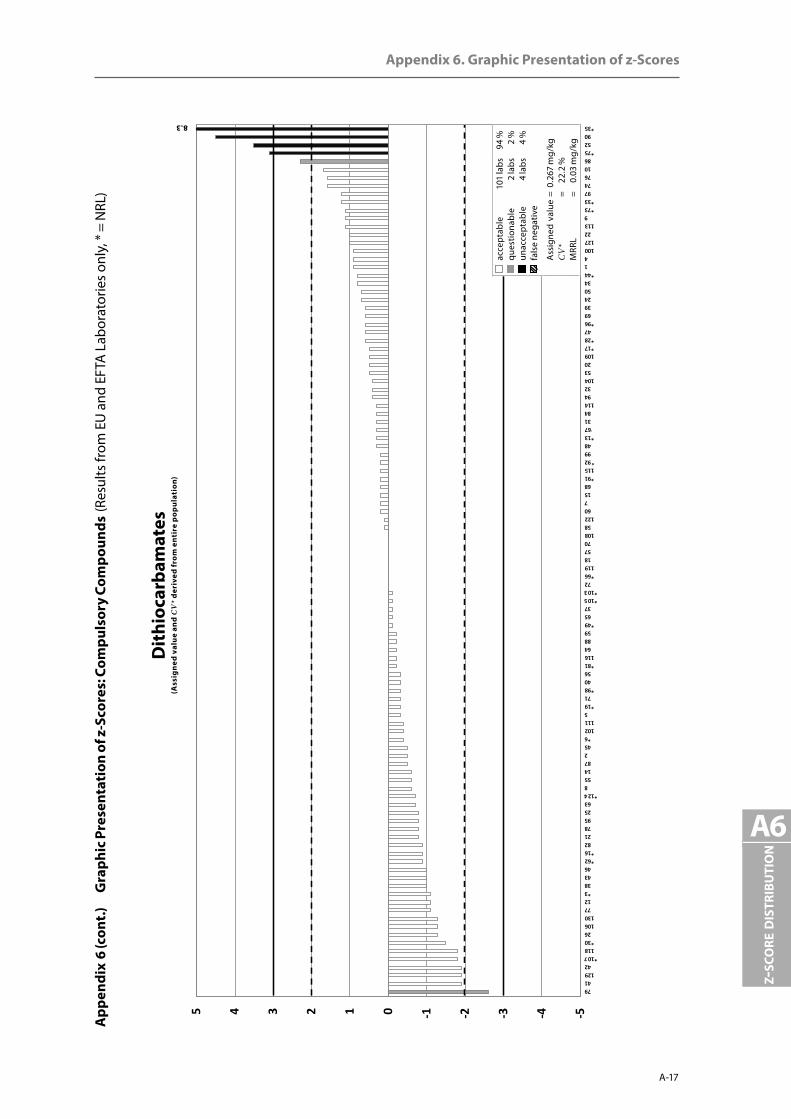
Appendix 6. Graphic Presentation of z-Scores
A-17
A6
z-sc
ore
dis
trib
uti
on
-5-4-3-2-1012345
7941
12942
*107118*30
26106130
7712*3384346
*62*16
822178952563
*1248
551487
245*6
102111
5*19
71*98
4056
*81116
648859
*496537
*105*103
72*66119
185770
10858
12260
71568
*91115
929948
*13*67
3184
1149432
1045320
109*17*28
47*96
6939245034
*4414
100127
22113
9*73*33
9774761086
*755290
*35
App
endi
x 6
(con
t.)
Gra
phic
Pre
sent
atio
n of
z-Sc
ores
: Com
puls
ory
Com
poun
ds
Dit
hioc
arba
mat
es(A
ssig
ned
val
ue
and
CV
* d
eriv
ed fr
om e
nti
re p
opu
lati
on)
acce
ptab
le10
1 la
bs94
%qu
estio
nabl
e2
labs
2 %
unac
cept
able
4 la
bs4
%fa
lse
nega
tive
Ass
igne
d va
lue
=0.
267
mg/
kgC
V*
=22
.2 %
MRR
L =
0.03
mg/
kg
8.3
(Res
ults
from
EU
and
EFT
A L
abor
ator
ies
only
, * =
NRL
)

EUPT-SRM12 | 2017 (Strawberry Purée)
A-18
-5-4-3-2-1012345
2
*35
99
106
*83
52
126
*98
4
102
9
70
71
24
*67
58
*81
76
129
95
46
79
115
1
77
89
104
25
127
*66
45
*91
94
20
*49
14
*19
42
88
*96
123
*13
41
7
39
92
40
34
93
109
21
50
113
*29
*6
*17
*16
22
26
90
*103
*33
84
125
57
18
51
97
74
78
*107
116
72
12
*3
53
47
*28
130
*30
63
*75
App
endi
x 6
(con
t.)
Gra
phic
Pre
sent
atio
n of
z-Sc
ores
: Com
puls
ory
Com
poun
ds
Fenb
utat
in O
xide
(Ass
ign
ed v
alu
e an
d C
V*
der
ived
from
en
tire
pop
ula
tion
)
acce
ptab
le72
labs
88 %
ques
tiona
ble
3 la
bs4
%un
acce
ptab
le7
labs
9 %
fals
e ne
gativ
e4
labs
Ass
igne
d va
lue
=0.
086
mg/
kgC
V*
=21
.0 %
MRR
L =
0.01
mg/
kg
6.89.5
(Res
ults
from
EU
and
EFT
A L
abor
ator
ies
only
, * =
NRL
)
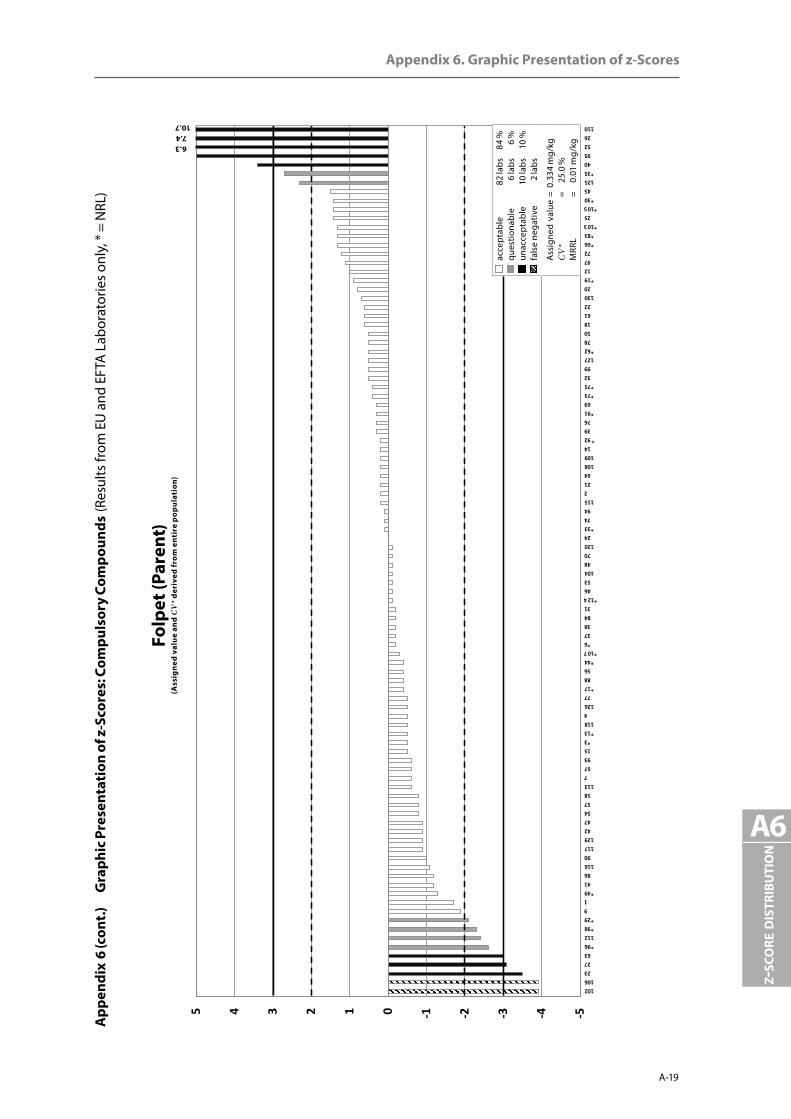
Appendix 6. Graphic Presentation of z-Scores
A-19
A6
z-sc
ore
dis
trib
uti
on
-5-4-3-2-1012345
102106
232763
*96112*98*29
91
*494186
11690
117129
4247545758
1137
*679315*3
*13118
4126
77*17
8856
*44*107
*637388431
*1244653
1044870
12024
*337494
1152
2164
108109
14923976
*9169
*73*75
3299
127*62
7850186122
13020
*19129772
*66*83
*10325
*105*30
45125*35
40955226
110
App
endi
x 6
(con
t.)
Gra
phic
Pre
sent
atio
n of
z-Sc
ores
: Com
puls
ory
Com
poun
ds
Folp
et (P
aren
t)(A
ssig
ned
val
ue
and
CV
* d
eriv
ed fr
om e
nti
re p
opu
lati
on)
acce
ptab
le82
labs
84 %
ques
tiona
ble
6 la
bs6
%un
acce
ptab
le10
labs
10 %
fals
e ne
gativ
e2
labs
Ass
igne
d va
lue
=0.
334
mg/
kgC
V*
=25
.0 %
MRR
L =
0.01
mg/
kg 6.3 7.4 10.7
(Res
ults
from
EU
and
EFT
A L
abor
ator
ies
only
, * =
NRL
)
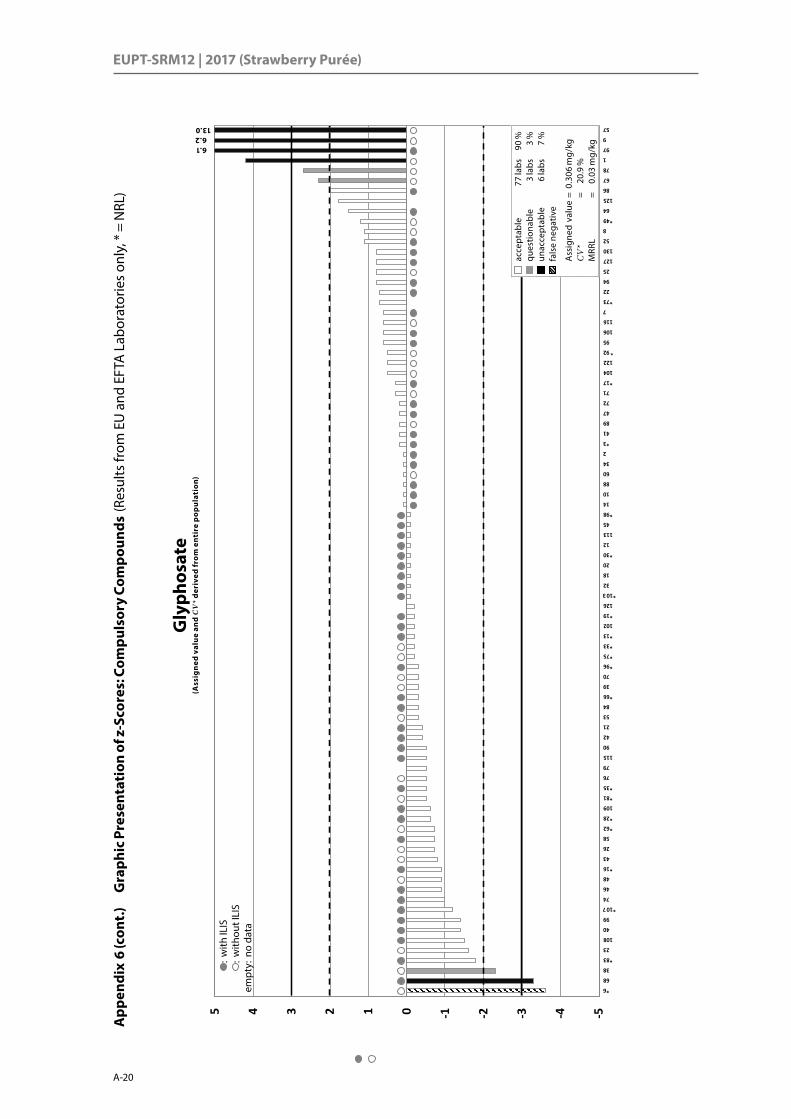
EUPT-SRM12 | 2017 (Strawberry Purée)
A-20
-5-4-3-2-1012345
*6
68
38
*83
23
108
40
99
*107
74
46
48
*16
43
26
58
*62
*28
109
*81
*35
76
79
115
90
42
21
53
84
*66
39
70
*96
*75
*33
*13
102
*19
126
*103
32
18
20
*30
12
113
45
*98
14
10
88
60
34
2
*3
41
89
47
72
71
*17
104
122
92
95
106
116
7
*73
22
94
25
127
130
52
8
*49
64
125
86
*67
78
1
97
9
57
App
endi
x 6
(con
t.)
Gra
phic
Pre
sent
atio
n of
z-Sc
ores
: Com
puls
ory
Com
poun
ds
Gly
phos
ate
(Ass
ign
ed v
alu
e an
d C
V*
der
ived
from
en
tire
pop
ula
tion
)
acce
ptab
le77
labs
90 %
ques
tiona
ble
3 la
bs3
%un
acce
ptab
le6
labs
7 %
fals
e ne
gativ
e
Ass
igne
d va
lue
=0.
306
mg/
kgC
V*
=20
.9 %
MRR
L =
0.03
mg/
kg6.16.2
13.0
:w
ith IL
IS:w
ithou
t ILI
Sem
pty:
no d
ata
(Res
ults
from
EU
and
EFT
A L
abor
ator
ies
only
, * =
NRL
)
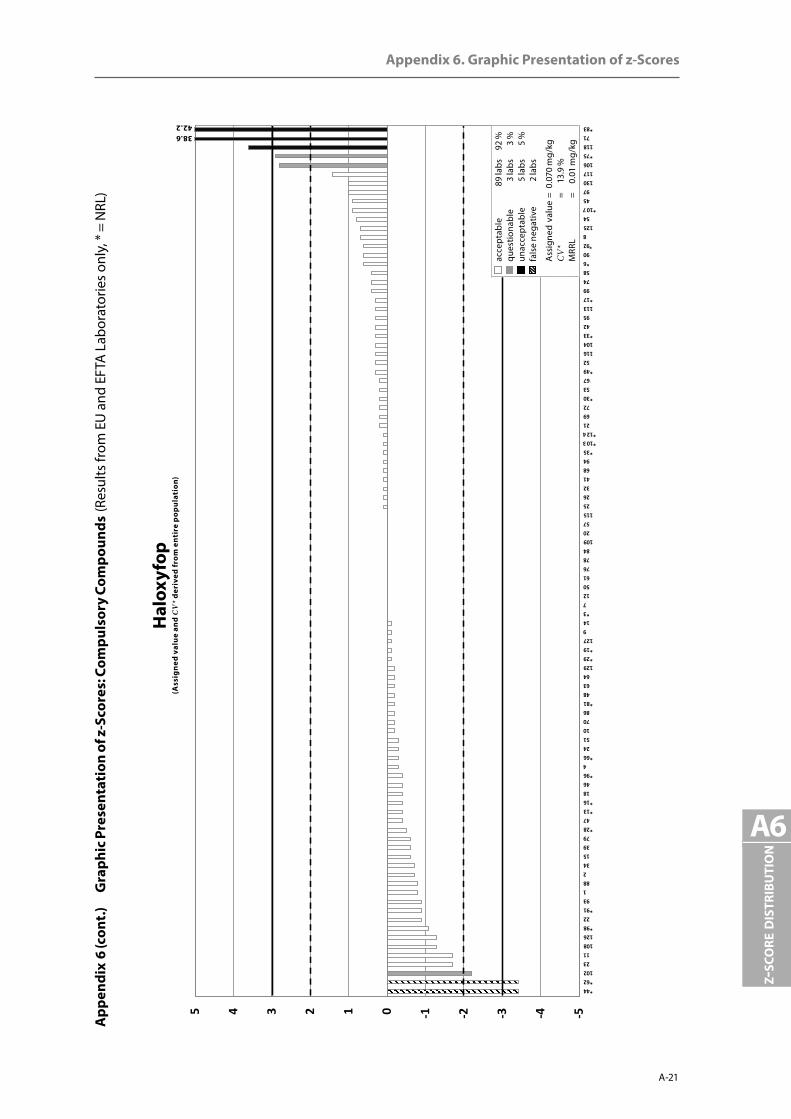
Appendix 6. Graphic Presentation of z-Scores
A-21
A6
z-sc
ore
dis
trib
uti
on
-5-4-3-2-1012345
*44*62102
2311
108126*98
22*91
931
882
34153979
*2847
*13*16
1846
*964
*662451107086
*81486364
129*29*19127
914*3
7125061767884
1092057
115252632416894
*35*103*124
216972
*3053
*67*49
52116104*33
4295
113*17
997458*69092
8125
54*107
4597
130117106*75118
71*83
App
endi
x 6
(con
t.)
Gra
phic
Pre
sent
atio
n of
z-Sc
ores
: Com
puls
ory
Com
poun
ds
Hal
oxyf
op(A
ssig
ned
val
ue
and
CV
* d
eriv
ed fr
om e
nti
re p
opu
lati
on)
acce
ptab
le89
labs
92 %
ques
tiona
ble
3 la
bs3
%un
acce
ptab
le5
labs
5 %
fals
e ne
gativ
e2
labs
Ass
igne
d va
lue
=0.
070
mg/
kgC
V*
=13
.9 %
MRR
L =
0.01
mg/
kg
38.642.2
(Res
ults
from
EU
and
EFT
A L
abor
ator
ies
only
, * =
NRL
)

EUPT-SRM12 | 2017 (Strawberry Purée)
A-22
-5-4-3-2-1012345
126
1
*6
72
2
*3
99
*33
118
*29
12
76
102
53
95
27
86
*107
21
71
78
18
106
115
129
52
130
42
*103
39
41
47
50
84
92
48
26
104
63
*17
109
113
*35
25
125
34
127
74
97
45
7
89
58
70
App
endi
x 6
(con
t.)
Gra
phic
Pre
sent
atio
n of
z-S
core
s: O
ptio
nal C
ompo
unds
Bife
naza
te (s
um)
(Ass
ign
ed v
alu
e an
d C
V*
der
ived
from
en
tire
pop
ula
tion
)
acce
ptab
le55
labs
95 %
ques
tiona
ble
0 la
bs0
%un
acce
ptab
le3
labs
5 %
fals
e ne
gativ
e
Ass
igne
d va
lue
=0.
285
mg/
kgC
V*
=25
.8 %
MRR
L =
0.02
mg/
kg
5.3
(Res
ults
from
EU
and
EFT
A L
abor
ator
ies
only
, * =
NRL
)
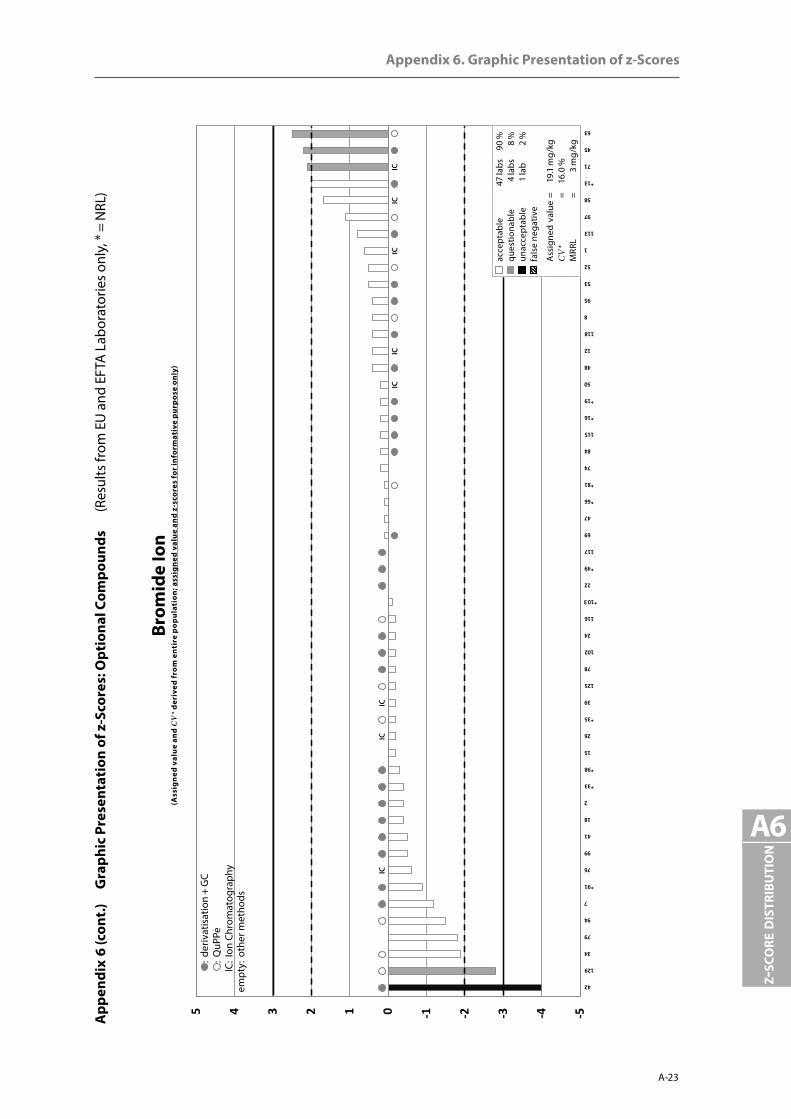
Appendix 6. Graphic Presentation of z-Scores
A-23
A6
z-sc
ore
dis
trib
uti
on
-5-4-3-2-1012345
42
129
34
79
94
7
*91
76
99
41
18
2
*33
*98
15
26
*35
39
125
78
102
24
116
*103
22
*49
117
69
47
*66
*81
74
84
115
*16
*19
50
48
12
118
8
95
53
52
1
113
97
58
*13
71
45
63
App
endi
x 6
(con
t.)
Gra
phic
Pre
sent
atio
n of
z-S
core
s: O
ptio
nal C
ompo
unds
Brom
ide
Ion
(Ass
ign
ed v
alu
e an
d C
V*
der
ived
from
en
tire
pop
ula
tion
; ass
ign
ed v
alu
e an
d z-
scor
es fo
r in
form
ativ
e p
urp
ose
only
)
acce
ptab
le47
labs
90 %
ques
tiona
ble
4 la
bs8
%un
acce
ptab
le1
lab
2 %
fals
e ne
gativ
e
Ass
igne
d va
lue
=19
.1 m
g/kg
CV
* =
16.0
%M
RRL
=3
mg/
kg
ICIC
IC
ICIC
ICIC
IC
:d
eriv
atis
atio
n +
GC
:QuP
PeIC
: Ion
Chr
omat
ogra
phy
empt
y:ot
her m
etho
ds
(Res
ults
from
EU
and
EFT
A L
abor
ator
ies
only
, * =
NRL
)
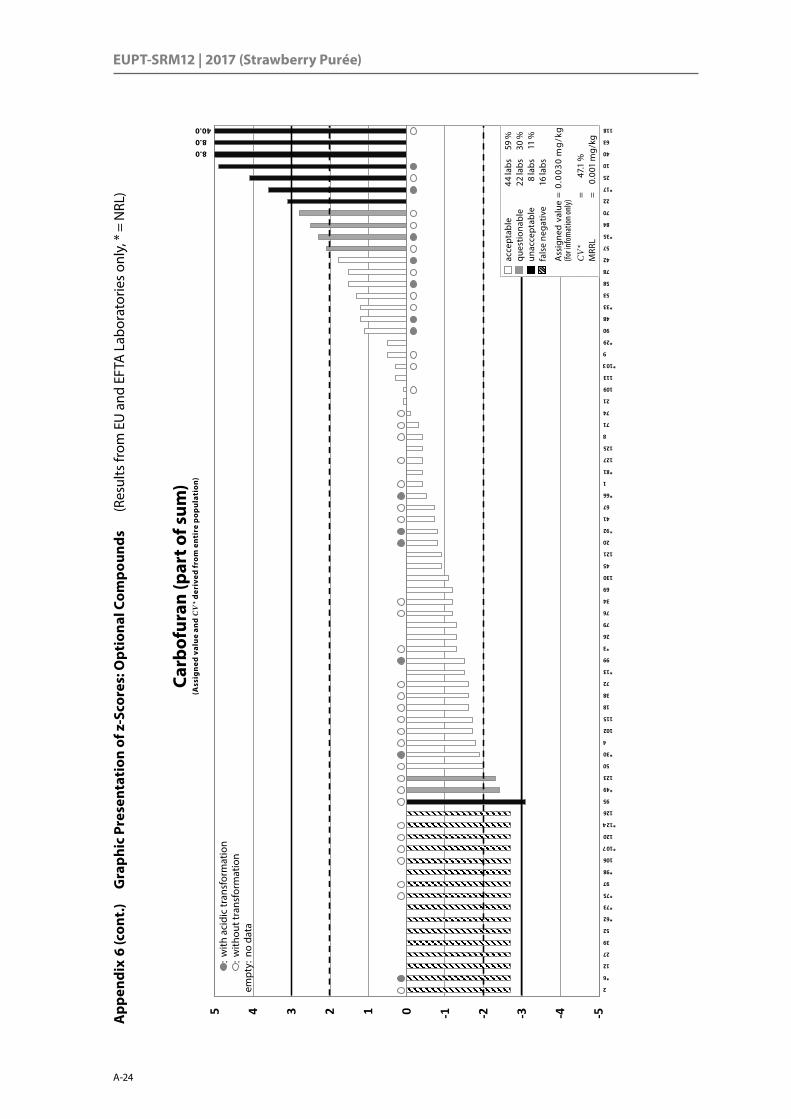
EUPT-SRM12 | 2017 (Strawberry Purée)
A-24
-5-4-3-2-1012345
2
*6
12
27
39
52
*62
*73
*75
97
*98
106
*107
120
*124
126
95
*49
123
50
*30
4
102
115
18
38
72
*13
99
*3
26
79
76
34
69
130
45
121
20
92
41
*67
*66
1
*81
127
125
8
71
74
21
109
113
*103
9
*29
90
48
*33
53
58
78
42
57
*35
84
70
22
*17
25
10
40
63
118
App
endi
x 6
(con
t.)
Gra
phic
Pre
sent
atio
n of
z-S
core
s: O
ptio
nal C
ompo
unds
Carb
ofur
an (p
art o
f sum
)(A
ssig
ned
val
ue
and
CV
* d
eriv
ed fr
om e
nti
re p
opu
lati
on)
acce
ptab
le44
labs
59 %
ques
tiona
ble
22 la
bs30
%un
acce
ptab
le8
labs
11 %
fals
e ne
gativ
e16
labs
Ass
igne
d va
lue
=(fo
r inf
omat
ion o
nly)
0.0
030
mg
/kg
CV
* =
47.1
%M
RRL
=0.
001
mg/
kg
8.08.0
40.0
:w
ith a
cidi
c tr
ansf
orm
atio
n:w
ithou
t tra
nsfo
rmat
ion
empt
y:no
dat
a
(Res
ults
from
EU
and
EFT
A L
abor
ator
ies
only
, * =
NRL
)

Appendix 6. Graphic Presentation of z-Scores
A-25
A6
z-sc
ore
dis
trib
uti
on
-5-4-3-2-1012345
2
*6
12
27
39
52
*62
*73
*75
97
*98
106
*107
120
*124
126
95
*49
123
50
*30
4
102
115
18
38
72
*13
99
*3
26
79
76
34
69
130
45
121
20
92
41
*67
*66
1
*81
127
125
8
71
74
21
109
113
*103
9
*29
90
48
*33
53
58
78
42
57
*35
84
70
22
*17
25
10
40
63
118
App
endi
x 6
(con
t.)
Gra
phic
Pre
sent
atio
n of
z-S
core
s: O
ptio
nal C
ompo
unds
Carb
ofur
an (p
art o
f sum
)(A
ssig
ned
val
ue
and
CV
* d
eriv
ed fr
om r
esu
lts
wit
h ac
idic
tra
nsf
orm
atio
n)
acce
ptab
le40
labs
54 %
ques
tiona
ble
14 la
bs19
%un
acce
ptab
le20
labs
27 %
fals
e ne
gativ
e16
labs
Ass
igne
d va
lue
=(fo
r inf
omat
ion o
nly)
0.0
039
mg
/kg
CV
* =
50.2
%M
RRL
=0.
001
mg/
kg
5.25.2
29.8
:w
ith a
cidi
c tr
ansf
orm
atio
n:w
ithou
t tra
nsfo
rmat
ion
empt
y:no
dat
a
(Res
ults
from
EU
and
EFT
A L
abor
ator
ies
only
, * =
NRL
)
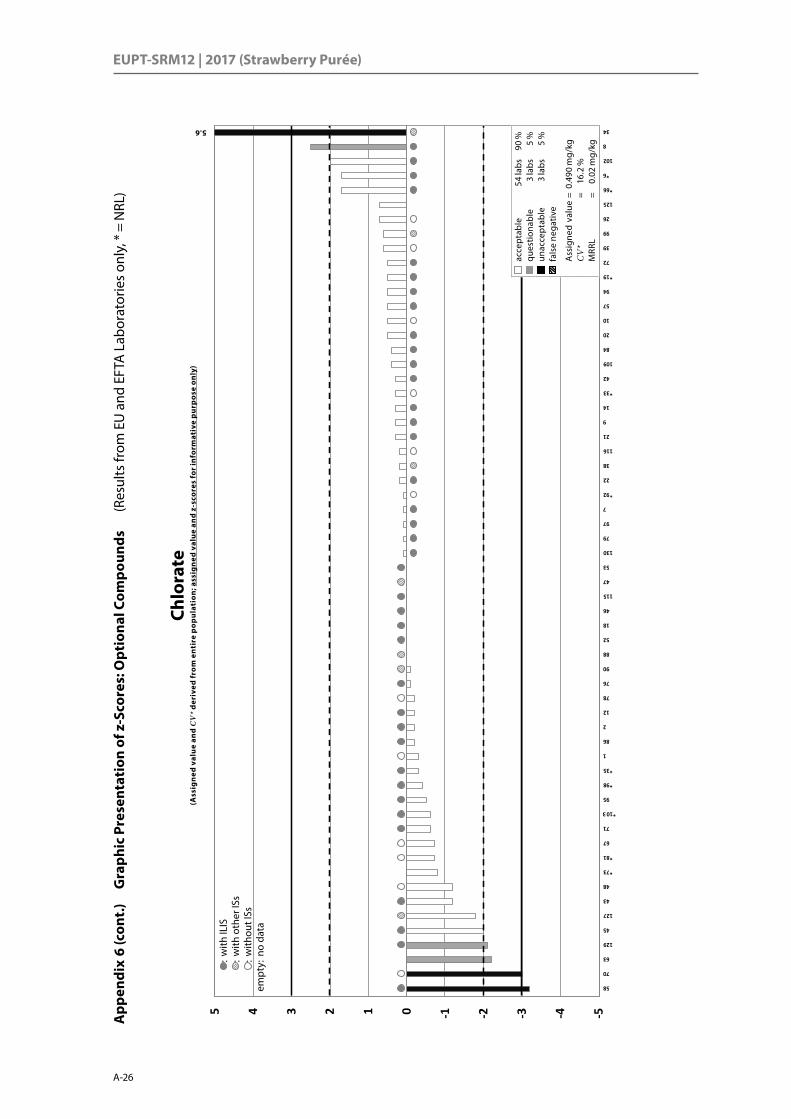
EUPT-SRM12 | 2017 (Strawberry Purée)
A-26
-5-4-3-2-1012345
58
70
63
129
45
127
43
48
*73
*81
*67
71
*103
95
*98
*35
1
86
2
12
78
76
90
88
52
18
46
115
47
53
130
79
97
7
92
22
38
116
21
9
14
*33
42
109
84
20
10
57
94
*19
72
39
99
26
125
*66
*6
102
8
34
App
endi
x 6
(con
t.)
Gra
phic
Pre
sent
atio
n of
z-S
core
s: O
ptio
nal C
ompo
unds
Chlo
rate
(Ass
ign
ed v
alu
e an
d C
V*
der
ived
from
en
tire
pop
ula
tion
; ass
ign
ed v
alu
e an
d z-
scor
es fo
r in
form
ativ
e p
urp
ose
only
)
acce
ptab
le54
labs
90 %
ques
tiona
ble
3 la
bs5
%un
acce
ptab
le3
labs
5 %
fals
e ne
gativ
e
Ass
igne
d va
lue
=0.
490
mg/
kgC
V*
=16
.2 %
MRR
L =
0.02
mg/
kg
5.6
:w
ith IL
IS:w
ith o
ther
ISs
:with
out I
Ssem
pty:
no d
ata
(Res
ults
from
EU
and
EFT
A L
abor
ator
ies
only
, * =
NRL
)

Appendix 6. Graphic Presentation of z-Scores
A-27
A6
z-sc
ore
dis
trib
uti
on
-5-4-3-2-1012345
95
*75
52
46
*3
57
1
71
*107
58
130
129
89
34
102
63
*91
127
*28
2
104
*6
*19
74
*13
84
115
*81
4
76
18
12
47
64
*98
97
113
20
14
*35
*33
92
53
*67
25
50
*103
40
24
26
22
109
70
125
51
72
21
94
39
116
*30
79
41
90
App
endi
x 6
(con
t.)
Gra
phic
Pre
sent
atio
n of
z-S
core
s: O
ptio
nal C
ompo
unds
Dit
hian
on(A
ssig
ned
val
ue
and
CV
* d
eriv
ed fr
om e
nti
re p
opu
lati
on)
acce
ptab
le54
labs
84 %
ques
tiona
ble
2 la
bs3
%un
acce
ptab
le8
labs
13 %
fals
e ne
gativ
e1
lab
Ass
igne
d va
lue
=0.
294
mg/
kgC
V*
=25
.3 %
MRR
L =
0.02
mg/
kg
6.2
7.3
15.1
31.0
(Res
ults
from
EU
and
EFT
A L
abor
ator
ies
only
, * =
NRL
)

EUPT-SRM12 | 2017 (Strawberry Purée)
A-28
-5-4-3-2-1012345
63
57
99
129
70
90
*67
47
86
95
52
1
21
8
*33
78
116
14
2
125
76
42
72
64
*35
92
18
127
7
*103
102
*6
97
12
*81
53
*98
84
22
109
94
79
41
26
130
10
58
115
9
34
App
endi
x 6
(con
t.)
Gra
phic
Pre
sent
atio
n of
z-S
core
s: O
ptio
nal C
ompo
unds
Phos
phon
ic a
cid
(Ass
ign
ed v
alu
e an
d C
V*
der
ived
from
en
tire
pop
ula
tion
)
acce
ptab
le43
labs
86 %
ques
tiona
ble
4 la
bs8
%un
acce
ptab
le3
labs
16 %
fals
e ne
gativ
e
Ass
igne
d va
lue
=19
.3 m
g/kg
CV
* =
27.0
%M
RRL
=0.
05 m
g/kg 6.7
10.0
:w
ith IL
IS:w
ith o
ther
ISs
:with
out I
Ssem
pty:
no d
ata
(Res
ults
from
EU
and
EFT
A L
abor
ator
ies
only
, * =
NRL
)

Appendix 6. Graphic Presentation of z-Scores
A-29
A6
z-sc
ore
dis
trib
uti
on
-5-4-3-2-1012345
*6
20
115
99
109
8
25
76
97
*103
125
*81
39
*35
*33
52
App
endi
x 6
(con
t.)
Gra
phic
Pre
sent
atio
n of
z-S
core
s: O
ptio
nal c
ompo
unds
N-A
cety
l gly
phos
ate
(Ass
ign
ed v
alu
e an
d C
V*
der
ived
from
en
tire
pop
ula
tion
)
acce
ptab
le15
labs
94 %
ques
tiona
ble
0 la
bs0
%un
acce
ptab
le1
lab
6 %
fals
e ne
gativ
e1
lab
Ass
igne
d va
lue
=0.
100
mg/
kgC
V*
=23
.2 %
MRR
L =
0.02
mg/
kg
:w
ith IL
IS:w
ith o
ther
ISs
:with
out I
Ssem
pty:
no d
ata
(Res
ults
from
EU
and
EFT
A L
abor
ator
ies
only
, * =
NRL
)

EUPT-SRM12 | 2017 (Strawberry Purée)
A-30
-5-4-3-2-1012345
9
70
*49
71
115
57
26
53
*66
126
7
4
125
*17
1
48
*98
50
*33
79
2
88
46
90
74
97
113
130
78
84
64
94
72
76
106
109
*81
61
18
21
*29
41
116
20
14
*105
*103
42
52
*73
*35
104
*19
92
22
39
47
99
102
95
86
127
25
129
58
Capt
an (s
um)
(Ass
ign
ed v
alu
e an
d C
V*
der
ived
from
en
tire
pop
ula
tion
)
acce
ptab
le61
labs
94 %
ques
tiona
ble
3 la
bs5
%un
acce
ptab
le1
lab
2 %
fals
e ne
gativ
e
Ass
igne
d va
lue
=0.
302
mg/
kgC
V*
=25
.2 %
MRR
L =
– m
g/kg
App
endi
x 6
(con
t.)
Gra
phic
Pre
sent
atio
n of
z-S
core
s: A
ddit
iona
l com
poun
ds (A
ssig
ned
Valu
e an
d z-
scor
e fo
r inf
orm
ativ
pur
pose
onl
y)(R
esul
ts fr
om E
U a
nd E
FTA
Lab
orat
orie
s on
ly, *
= N
RL))
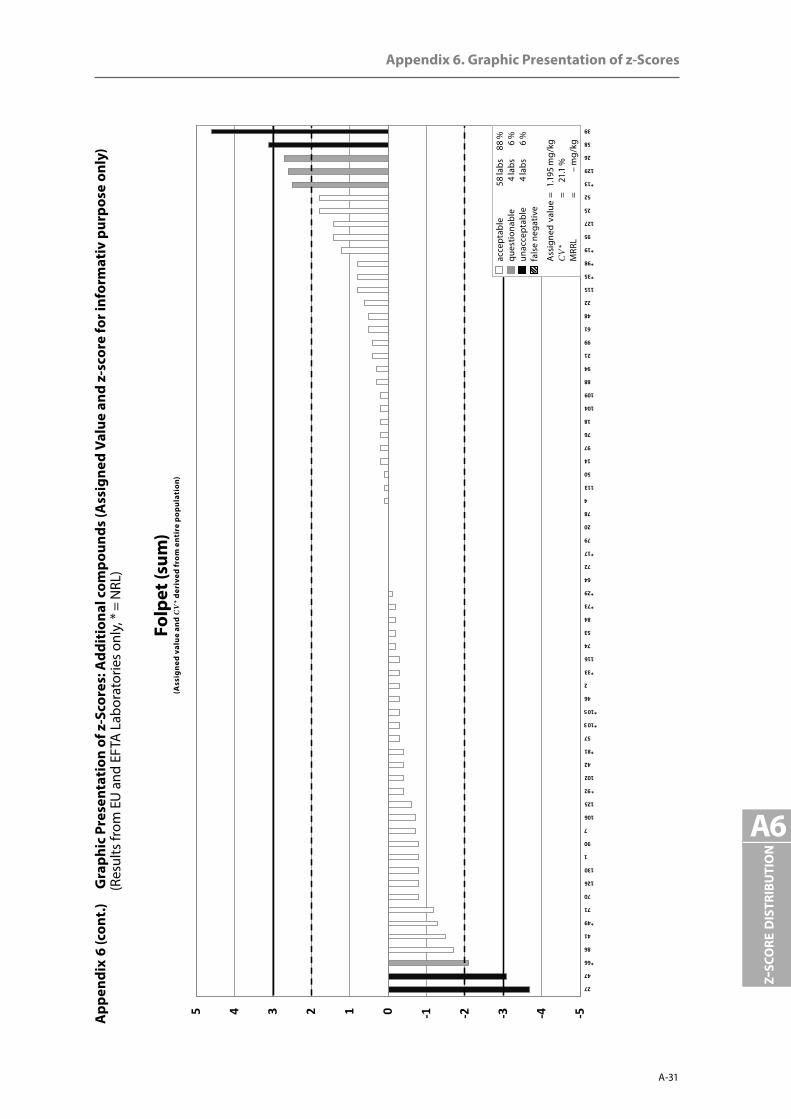
Appendix 6. Graphic Presentation of z-Scores
A-31
A6
z-sc
ore
dis
trib
uti
on
-5-4-3-2-1012345
27
47
*66
86
41
*49
71
70
126
130
1
90
7
106
125
92
102
42
*81
57
*103
*105
46
2
*33
116
74
53
84
*73
*29
64
72
*17
79
20
78
4
113
50
14
97
76
18
104
109
88
94
21
99
61
48
22
115
*35
*98
*19
95
127
25
52
*13
129
26
58
39
Folp
et (s
um)
(Ass
ign
ed v
alu
e an
d C
V*
der
ived
from
en
tire
pop
ula
tion
)
acce
ptab
le58
labs
88 %
ques
tiona
ble
4 la
bs6
%un
acce
ptab
le4
labs
6 %
fals
e ne
gativ
e
Ass
igne
d va
lue
=1.
195
mg/
kgC
V*
=21
.1 %
MRR
L =
– m
g/kg
App
endi
x 6
(con
t.)
Gra
phic
Pre
sent
atio
n of
z-S
core
s: A
ddit
iona
l com
poun
ds (A
ssig
ned
Valu
e an
d z-
scor
e fo
r inf
orm
ativ
pur
pose
onl
y)(R
esul
ts fr
om E
U a
nd E
FTA
Lab
orat
orie
s on
ly, *
= N
RL)
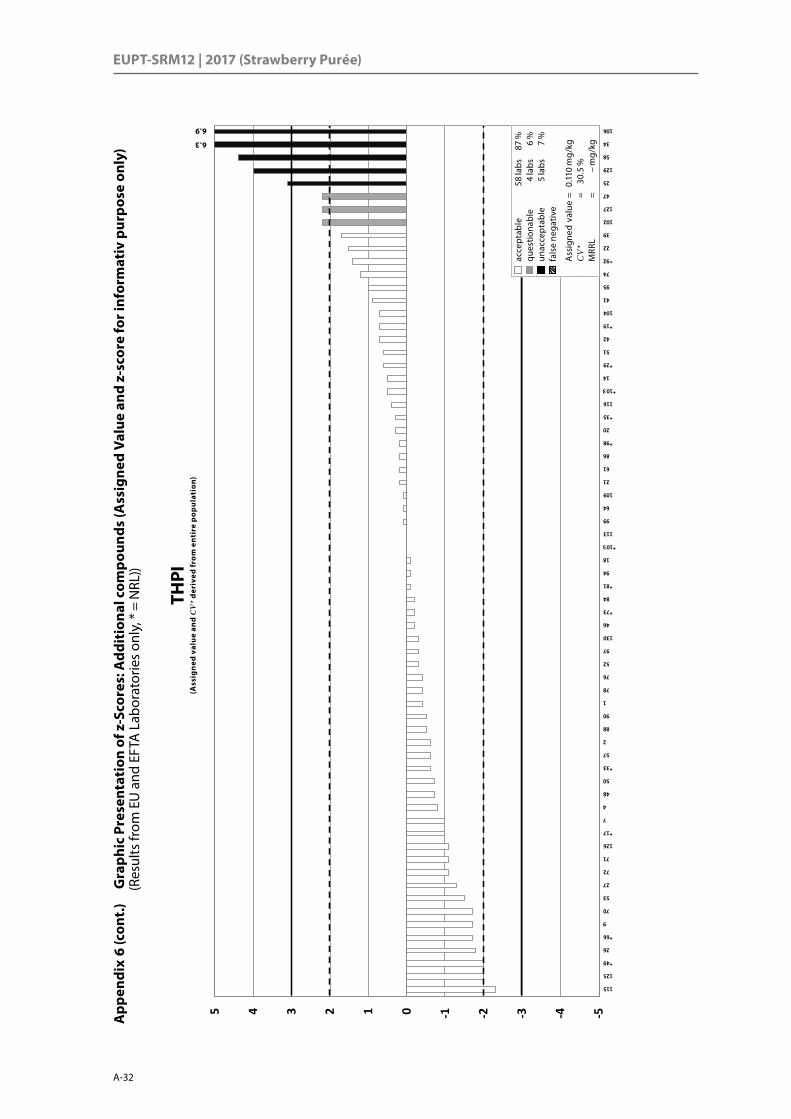
EUPT-SRM12 | 2017 (Strawberry Purée)
A-32
-5-4-3-2-1012345
115
125
*49
26
*66
9
70
53
27
72
71
126
*17
7
4
48
50
*33
57
2
88
90
1
78
76
52
97
130
46
*73
84
*81
94
18
*105
113
99
64
109
21
61
86
*98
20
*35
116
*103
14
*29
51
42
*19
104
41
95
74
92
22
39
102
127
47
25
129
58
34
106
THPI
(Ass
ign
ed v
alu
e an
d C
V*
der
ived
from
en
tire
pop
ula
tion
)
acce
ptab
le58
labs
87 %
ques
tiona
ble
4 la
bs6
%un
acce
ptab
le5
labs
7 %
fals
e ne
gativ
e
Ass
igne
d va
lue
=0.
110
mg/
kgC
V*
=30
.5 %
MRR
L =
– m
g/kg
6.3
6.9
App
endi
x 6
(con
t.)
Gra
phic
Pre
sent
atio
n of
z-S
core
s: A
ddit
iona
l com
poun
ds (A
ssig
ned
Valu
e an
d z-
scor
e fo
r inf
orm
ativ
pur
pose
onl
y)(R
esul
ts fr
om E
U a
nd E
FTA
Lab
orat
orie
s on
ly, *
= N
RL))

Appendix 6. Graphic Presentation of z-Scores
A-33
A6
z-sc
ore
dis
trib
uti
on
-5-4-3-2-1012345
47
86
125
41
130
*49
70
*105
126
7
92
90
72
1
2
*33
*73
46
20
53
42
97
84
71
78
57
64
50
95
116
18
52
*35
76
102
14
*17
*66
109
4
51
94
113
99
104
21
61
88
22
*29
115
48
*103
31
*81
26
*19
74
34
127
25
*98
*13
129
58
106
39
Phth
alim
ide
(Ass
ign
ed v
alu
e an
d C
V*
der
ived
from
en
tire
pop
ula
tion
)
acce
ptab
le61
labs
91 %
ques
tiona
ble
0 la
bs0
%un
acce
ptab
le6
labs
9 %
fals
e ne
gativ
e1
lab
Ass
igne
d va
lue
=0.
446
mg/
kgC
V*
=21
.6 %
MRR
L =
– m
g/kg
5.0
9.5
App
endi
x 6
(con
t.)
Gra
phic
Pre
sent
atio
n of
z-S
core
s: A
ddit
iona
l com
poun
ds (A
ssig
ned
Valu
e an
d z-
scor
e fo
r inf
orm
ativ
pur
pose
onl
y)(R
esul
ts fr
om E
U a
nd E
FTA
Lab
orat
orie
s on
ly, *
= N
RL)

EUPT-SRM12 | 2017 (Strawberry Purée)
A-34
Appendix 7 (cont.) Possible Reasons for Poor Performance (ordered by z-scores)
A: Technical problems with measurement instrumentation
B: Procedure not properly conductedC: Matrix effect not properly compensatedD: Lack of experienceE: Error in concentration of analytical standardF: Error in the evaluation/interpretation of measurement dataG: Use of inappropriate procedureH: Reporting limit higher than the assigned value
I: Sample weight too small, homogeneity insufficientJ: Transcription error
K: Result not corrected for low recoveryL: Inappropriate calibration
M: Detection signals strongly interfered by matrix components/Strong chromatographicinterferences
N: Misunderstanding of the definition of the analyteO: Degradation during sample preparation or measurementP: Sample amount not sufficient for quantitative analysisQ: Consecutive error (e.g. parent too low, degraded product too high, but sum o.k.)U: Undefined
2,4-D (free acid) Assigned value: 0.079 mg/kg
LabCode z-Score Source of error localized? Reason / Remarks
44 -3.5 (FN)
(Yes) We have checked our method (calibration curve, recovery and SRM), we think that the most likely cause of the poor results is the used derivatisation reagent (trimethyl-sulfonium hydroxide (0.2 mol/L in MeOH). Unfortunately, there is not an expiry date in the certificate we have. To avoid getting bad results in the future, we ordered a new production reagent and will review our results.
B
75 2.5 Yes The Concentration was determined directly without dilution. The determined con-centration was not far from the highest calibration points. The repeat analysis was performed and the sample was diluted to the concentration at almost the same level as the average calibration points. It has been shown that the measured concentration for 2,4-D was then 0,094 mg/kg with an acceptable z-score.
C, L
3rd-139 6.6 (Yes) 2,4-D, fenbutatin oxide, fluazifop, haloxyfop standard are mixed together, standard may have degraded when we mixed together.
C
71 36.2 Yes Transcription error. It should be 0.0791 mg/kg J
Captan (parent) Assigned value: 0.085 mg/kg
LabCode z-Score Source of error localized? Reason / Remarks
70 -3.1 Yes Captan is degraded in metabolite tetrahydrophthalimide (THPI) and Captan is under-estimated.
O
98 -3.0 Yes We used QuEChERS method (EN) without acidification for routine analysis and was used for this work. This method converts more of the parent into tetrahydrophtha-mide (THPI) and therefore the value for captan is underestimated and value for THPI is overestimated. However these effects cancel each other out for sum of two com-ponents, as required for MRL residue definition. Our result for full residue definition (sum) was within the acceptable range. We have re-analysed the PT sample using acidic extraction and our results are 0.079 mg/kg for captan and 0.141 mg/kg for THPI. These results would have achieved acceptable z-scores. I have introduced a corrective action to use acidic extraction method for positive samples.
G, Q
Appendix 7 Possible Reasons Reported for Poor Performance (ordered by z-scores)
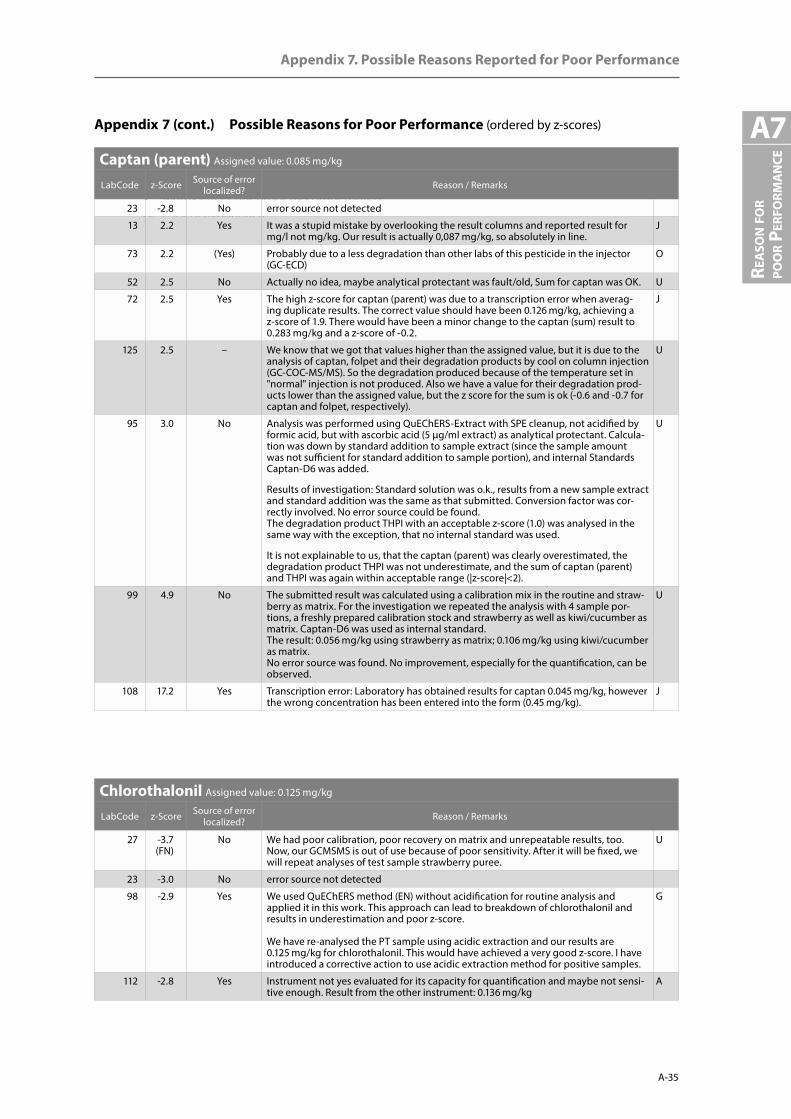
A: Technical problems with measurement instrumentation
B: Procedure not properly conductedC: Matrix effect not properly compensatedD: Lack of experienceE: Error in concentration of analytical standardF: Error in the evaluation/interpretation of measurement dataG: Use of inappropriate procedureH: Reporting limit higher than the assigned value
I: Sample weight too small, homogeneity not warrantedJ: Transcription error
K: Result not corrected for low recoveryL: Inappropriate calibration
M: Detection signals strongly interfered by matrix components/Strong chromatografic interference
N: misunderstanding of the definition of the analyteO: Degradation during sample preparation or measurementP: sample amount not sufficient for quantitative investigationQ: Consequent error (e.g. parent too low, degraded product too high, but sum o.k.)U: Undefined
Appendix 7. Possible Reasons Reported for Poor Performance
A-35
Appendix 7 (cont.) Possible Reasons for Poor Performance (ordered by z-scores)
Rea
son
foR
poo
R peR
foRm
an
ce
a7Captan (parent) Assigned value: 0.085 mg/kg
LabCode z-Score Source of error localized? Reason / Remarks
23 -2.8 No error source not detected
13 2.2 Yes It was a stupid mistake by overlooking the result columns and reported result for mg/l not mg/kg. Our result is actually 0,087 mg/kg, so absolutely in line.
J
73 2.2 (Yes) Probably due to a less degradation than other labs of this pesticide in the injector (GC-ECD)
O
52 2.5 No Actually no idea, maybe analytical protectant was fault/old, Sum for captan was OK. U
72 2.5 Yes The high z-score for captan (parent) was due to a transcription error when averag-ing duplicate results. The correct value should have been 0.126 mg/kg, achieving a z-score of 1.9. There would have been a minor change to the captan (sum) result to 0.283 mg/kg and a z-score of -0.2.
J
125 2.5 – We know that we got that values higher than the assigned value, but it is due to the analysis of captan, folpet and their degradation products by cool on column injection (GC-COC-MS/MS). So the degradation produced because of the temperature set in "normal" injection is not produced. Also we have a value for their degradation prod-ucts lower than the assigned value, but the z score for the sum is ok (-0.6 and -0.7 for captan and folpet, respectively).
U
95 3.0 No Analysis was performed using QuEChERS-Extract with SPE cleanup, not acidified by formic acid, but with ascorbic acid (5 µg/ml extract) as analytical protectant. Calcula-tion was down by standard addition to sample extract (since the sample amount was not sufficient for standard addition to sample portion), and internal Standards Captan-D6 was added.
Results of investigation: Standard solution was o.k., results from a new sample extract and standard addition was the same as that submitted. Conversion factor was cor-rectly involved. No error source could be found. The degradation product THPI with an acceptable z-score (1.0) was analysed in the same way with the exception, that no internal standard was used.
It is not explainable to us, that the captan (parent) was clearly overestimated, the degradation product THPI was not underestimate, and the sum of captan (parent)and THPI was again within acceptable range (|z-score|<2).
U
99 4.9 No The submitted result was calculated using a calibration mix in the routine and straw-berry as matrix. For the investigation we repeated the analysis with 4 sample por-tions, a freshly prepared calibration stock and strawberry as well as kiwi/cucumber as matrix. Captan-D6 was used as internal standard. The result: 0.056 mg/kg using strawberry as matrix; 0.106 mg/kg using kiwi/cucumber as matrix. No error source was found. No improvement, especially for the quantification, can be observed.
U
108 17.2 Yes Transcription error: Laboratory has obtained results for captan 0.045 mg/kg, however the wrong concentration has been entered into the form (0.45 mg/kg).
J
Chlorothalonil Assigned value: 0.125 mg/kg
LabCode z-Score Source of error localized? Reason / Remarks
27 -3.7 (FN)
No We had poor calibration, poor recovery on matrix and unrepeatable results, too. Now, our GCMSMS is out of use because of poor sensitivity. After it will be fixed, we will repeat analyses of test sample strawberry puree.
U
23 -3.0 No error source not detected
98 -2.9 Yes We used QuEChERS method (EN) without acidification for routine analysis and applied it in this work. This approach can lead to breakdown of chlorothalonil and results in underestimation and poor z-score. We have re-analysed the PT sample using acidic extraction and our results are 0.125 mg/kg for chlorothalonil. This would have achieved a very good z-score. I have introduced a corrective action to use acidic extraction method for positive samples.
G
112 -2.8 Yes Instrument not yes evaluated for its capacity for quantification and maybe not sensi-tive enough. Result from the other instrument: 0.136 mg/kg
A
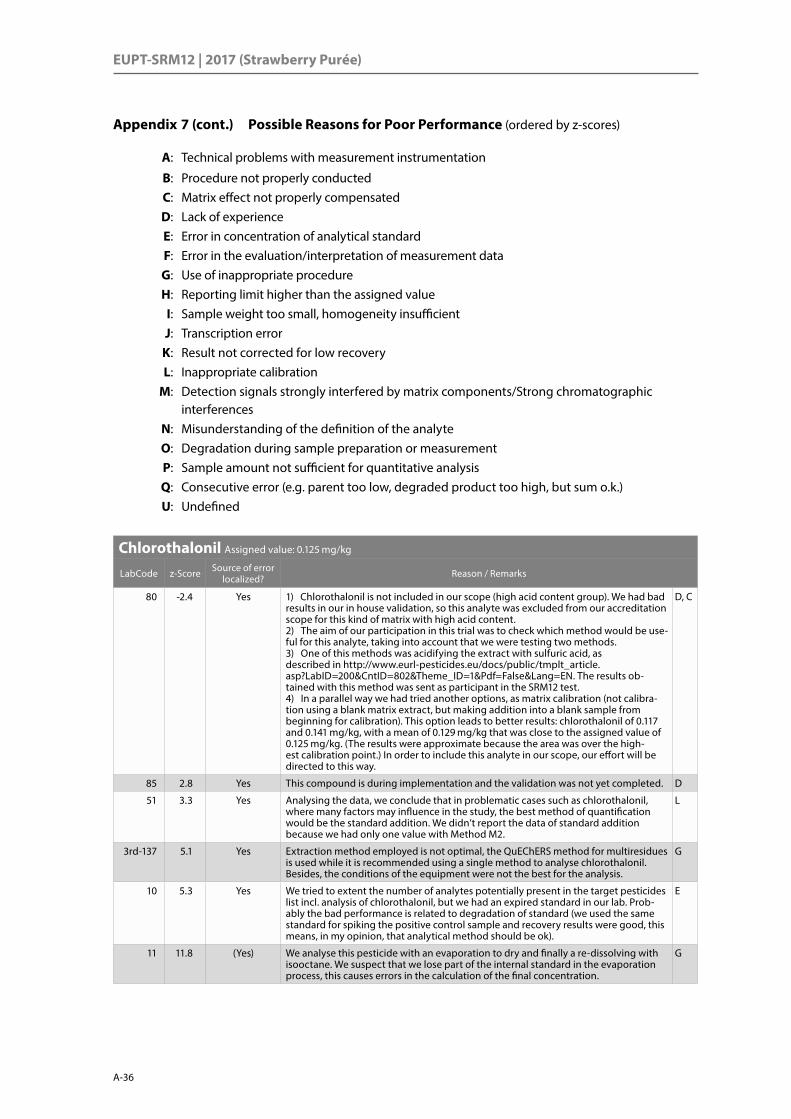
EUPT-SRM12 | 2017 (Strawberry Purée)
A-36
Appendix 7 (cont.) Possible Reasons for Poor Performance (ordered by z-scores)
A: Technical problems with measurement instrumentation
B: Procedure not properly conductedC: Matrix effect not properly compensatedD: Lack of experienceE: Error in concentration of analytical standardF: Error in the evaluation/interpretation of measurement dataG: Use of inappropriate procedureH: Reporting limit higher than the assigned value
I: Sample weight too small, homogeneity insufficientJ: Transcription error
K: Result not corrected for low recoveryL: Inappropriate calibration
M: Detection signals strongly interfered by matrix components/Strong chromatographicinterferences
N: Misunderstanding of the definition of the analyteO: Degradation during sample preparation or measurementP: Sample amount not sufficient for quantitative analysisQ: Consecutive error (e.g. parent too low, degraded product too high, but sum o.k.)U: Undefined
Chlorothalonil Assigned value: 0.125 mg/kg
LabCode z-Score Source of error localized? Reason / Remarks
80 -2.4 Yes 1) Chlorothalonil is not included in our scope (high acid content group). We had bad results in our in house validation, so this analyte was excluded from our accreditation scope for this kind of matrix with high acid content. 2) The aim of our participation in this trial was to check which method would be use-ful for this analyte, taking into account that we were testing two methods. 3) One of this methods was acidifying the extract with sulfuric acid, as described in http://www.eurl-pesticides.eu/docs/public/tmplt_article.asp?LabID=200&CntID=802&Theme_ID=1&Pdf=False&Lang=EN. The results ob-tained with this method was sent as participant in the SRM12 test. 4) In a parallel way we had tried another options, as matrix calibration (not calibra-tion using a blank matrix extract, but making addition into a blank sample from beginning for calibration). This option leads to better results: chlorothalonil of 0.117 and 0.141 mg/kg, with a mean of 0.129 mg/kg that was close to the assigned value of 0.125 mg/kg. (The results were approximate because the area was over the high-est calibration point.) In order to include this analyte in our scope, our effort will be directed to this way.
D, C
85 2.8 Yes This compound is during implementation and the validation was not yet completed. D
51 3.3 Yes Analysing the data, we conclude that in problematic cases such as chlorothalonil, where many factors may influence in the study, the best method of quantification would be the standard addition. We didn’t report the data of standard addition because we had only one value with Method M2.
L
3rd-137 5.1 Yes Extraction method employed is not optimal, the QuEChERS method for multiresidues is used while it is recommended using a single method to analyse chlorothalonil. Besides, the conditions of the equipment were not the best for the analysis.
G
10 5.3 Yes We tried to extent the number of analytes potentially present in the target pesticides list incl. analysis of chlorothalonil, but we had an expired standard in our lab. Prob-ably the bad performance is related to degradation of standard (we used the same standard for spiking the positive control sample and recovery results were good, this means, in my opinion, that analytical method should be ok).
E
11 11.8 (Yes) We analyse this pesticide with an evaporation to dry and finally a re-dissolving with isooctane. We suspect that we lose part of the internal standard in the evaporation process, this causes errors in the calculation of the final concentration.
G

A: Technical problems with measurement instrumentation
B: Procedure not properly conductedC: Matrix effect not properly compensatedD: Lack of experienceE: Error in concentration of analytical standardF: Error in the evaluation/interpretation of measurement dataG: Use of inappropriate procedureH: Reporting limit higher than the assigned value
I: Sample weight too small, homogeneity not warrantedJ: Transcription error
K: Result not corrected for low recoveryL: Inappropriate calibration
M: Detection signals strongly interfered by matrix components/Strong chromatografic interference
N: misunderstanding of the definition of the analyteO: Degradation during sample preparation or measurementP: sample amount not sufficient for quantitative investigationQ: Consequent error (e.g. parent too low, degraded product too high, but sum o.k.)U: Undefined
Appendix 7. Possible Reasons Reported for Poor Performance
A-37
Appendix 7 (cont.) Possible Reasons for Poor Performance (ordered by z-scores)
Rea
son
foR
poo
R peR
foRm
an
ce
a7Dithiocarbamates Assigned value: 0.267 mg/kg
LabCode z-Score Source of error localized? Reason / Remarks
86 2.3 Yes The calibration standards used during the first analysis were not properly prepared for the compound CS2. We’ve re-analysed the sample using newly prepared calibration standards and found the concentration of the CS2 was 0.339 mg/kg. This is equal to a z-score of 1.08"
E
75 3.1 Yes This almost double-overestimation was caused by mistake in making calibration solutions and building calibration curve from them.
E
3rd-139 3.1 Yes CS2 standard was degraded on the date we preformed the test; we have recalculated result using standard ran 2 weeks before: new result is 0.290 ppm.
E
52 3.5 No No idea, strong matrix interference M
90 4.5 (Yes) We usually quantify residue level with a matrix-matched standard solution instead of standard solutions in solvent as soon as a matrix affect is shown. For this analysis (assigned value at 0.267 mg/kg), residue levels were different according to the quanti-fication and the matrix-matched quantification seemed to be the most accurate: - with standard solutions in solvent :0.157 mg/kg (closer to the assigned value) - with a matrix-matched standard solution : 0.566 mg/kg (z-score 4.5). If the spiking level is close to the assigned value, it doesn’t seem to be relevant to quantify with a matrix-matched standard solution: the quantification has to be performed in solvent.
35 8.3 Yes This compound is not in our scope. The method used is the EURL method (Analysis of Dithiocarbamate Residues in Foods of Plant Origin involving Cleavage into Carbon Disulfide, Partitioning into Isooctane and Determinative Analysis by GC-ECD, 2nd Ver-sion) which is not optimised in our lab.
D
3rd-135 25.4 Yes Root Cause : Methods that has not been properly documented has been used. Ana-lyst has made an error in the preparation of standards. Corrective action : Test method for the above analysis has been documented.
E
Fenbutatin oxide Assigned value: 0.086 mg/kg
LabCode z-Score Source of error localized? Reason / Remarks
2 -3.5 (FN)
Yes Correctly found and quantified (0.087 mg/kg), but the system setting for specific parameters was not correct, so that the result was not highlighted and not reported. This problem was already solved by the participant.
J
35 -3.5 (FN)
Yes This compound is not in our scope. The extraction method used is the EURL method (QuEChERS with sulfuric acid, without dSPE) which is not optimised in our lab. We observed a very poor sensitivity for the detection of this compound, which comes from our chromatographic conditions that need to be optimised. We had a look at the chromatogram and there was no presence of fenbutatin oxide compared to the standard and to the recovery test, that is the reason why we reported as not detected.
D, A
99 -3.5 (FN)
Yes For the PT a special measurement program containing only the SRM12 analytes was developed for analysis via LC-MS/MS. Unfortunately, the transition of fenbutatin oxide was by mistake not included.
J
52 -2.3 Yes Recovery of only 60 %. If we had stated the for recovery corrected result, we would have achieved a z-score about 0.8.
K
30 2.3 (Yes) The reason for higher concentration compared to the AV could be due to the matrix effect. The matrix calibration (procedural) were prepared on the other matrix (pears) than strawberry because high signal at the retention time of fenbutatin oxide in strawberry blank matrix was observed.
C
63 6.8 Yes For this PT our lab staff prepared a fresh stock solution. The stock solution was pre-pared with acetonitrile. Unfortunately, fenbutatin oxide wasn't completely dissolved, however, the lab staff didn't notice that during the tests. To secure best possible performance for the future we decided to always buy fenbutatin oxide as a liquid 100ng/µL.
E
3rd-139 7.6 (Yes) 2,4-D, fenbutatin oxide, fluazifop, haloxyfop standard are mixed together, standard may have degraded when we mixed together.
E
75 9.5 Yes In case of fenbutatin oxide we used several dilutions for the determination of the concentration, but the compound was overlapping. For fenbutatin oxide analysis we also used different analytical columns: sun fire col-umns and kinetex biphenyl column, but the overlapping persisted. In repeat analysis we used direct determination concentration without dilution the concentration was 0.118 mg/kg.
M

EUPT-SRM12 | 2017 (Strawberry Purée)
A-38
Appendix 7 (cont.) Possible Reasons for Poor Performance (ordered by z-scores)
A: Technical problems with measurement instrumentation
B: Procedure not properly conductedC: Matrix effect not properly compensatedD: Lack of experienceE: Error in concentration of analytical standardF: Error in the evaluation/interpretation of measurement dataG: Use of inappropriate procedureH: Reporting limit higher than the assigned value
I: Sample weight too small, homogeneity insufficientJ: Transcription error
K: Result not corrected for low recoveryL: Inappropriate calibration
M: Detection signals strongly interfered by matrix components/Strong chromatographicinterferences
N: Misunderstanding of the definition of the analyteO: Degradation during sample preparation or measurementP: Sample amount not sufficient for quantitative analysisQ: Consecutive error (e.g. parent too low, degraded product too high, but sum o.k.)U: Undefined
Glyphosate Assigned value: 0.306 mg/kg
LabCode z-Score Source of error localized? Reason / Remarks
6 -3.6 (FN)
(Yes) Reason not yet found, probably human error on extraction step, investigation in progress
B
3rd-132 -2.7 No We couldn’t find the problem. Standards and LC conditions were ok, recovery (87 %) was ok and we didn’t make any calculation error. During the analysis, we couldn’t repeat analysis a few times more because all the sample was used for GC determina-tion. Plastic bottles were used for the sample preparation, sample extract was filled in the glass vials.
Note of organiser: Plastic vials should be used for the analysis of glyphosate.
U
38 -2.3 (Yes) We have less experience with this compound. We have analysed this compound only since this year using Quick Polar Pesticides Method and Obelisc N column. Due to this questionable result and the instability and poor reproducibility of this column, we will test a new analytical method (first step, extraction using the QuPPE method and the second step, derivatization using FMOC).
D
67 2.3 (Yes) The situation was the following: The average of first 3 parallel samples was about 0.354 mg/kg but due to the high RSD% (= 30 %) and poor recovery (55.1 %) the proce-dure was repeated with second 3 parallel samples. Although the average result was similar to the previous one (0.339 mg/kg) and the recovery (76 %) and RSD% (24.5 %) better due to the result of phosphonic acid analysed from same sample the injection/analyses was repeated on next day. The 3rd compound analysed in this sample was the chlorate. During the repeating, all parameters remained the same: st. dilutions, sample extracts, spiked sample. But the result was quite convincing: RSD% = 1.6 %, recovery 101.4 %, however the average 0.485 mg/kg for glyphosate. We suspected, the sample was concentrated (all the time was on the autosampler) but due to lower average result of phosphonic acid with better recovery (104 %) and lower average result of chlorate with same recovery (87 %) we rejected this suspect. There was no any possibility to repeat the process because the test sample was run out.
F
78 2.7 Yes Probably due to degradation of glyphosate stock solution in glass bottles. We have changed it and use now only plastic bottles for glyphosate stock solution.
E

A: Technical problems with measurement instrumentation
B: Procedure not properly conductedC: Matrix effect not properly compensatedD: Lack of experienceE: Error in concentration of analytical standardF: Error in the evaluation/interpretation of measurement dataG: Use of inappropriate procedureH: Reporting limit higher than the assigned value
I: Sample weight too small, homogeneity not warrantedJ: Transcription error
K: Result not corrected for low recoveryL: Inappropriate calibration
M: Detection signals strongly interfered by matrix components/Strong chromatografic interference
N: misunderstanding of the definition of the analyteO: Degradation during sample preparation or measurementP: sample amount not sufficient for quantitative investigationQ: Consequent error (e.g. parent too low, degraded product too high, but sum o.k.)U: Undefined
Appendix 7. Possible Reasons Reported for Poor Performance
A-39
Appendix 7 (cont.) Possible Reasons for Poor Performance (ordered by z-scores)
Rea
son
foR
poo
R peR
foRm
an
ce
a7
Folpet (parent) Assigned value: 0.334 mg/kg
LabCode z-Score Source of error localized? Reason / Remarks
23 -3.5 Yes Transcription error (it was 0.400 mg/kg) J
27 -3.1 No We had poor calibration, poor recovery on matrix and unrepeatable results, too. Now, our GC-MS/MS is out of use because of poor sensitivity. After it will be fixed, we will repeat analyses of test sample strawberry puree.
U
63 -3.0 Yes Phthalimide was not included in the result. F
3rd-139 -2.9 No Folpet was tested before last update of method: We didn't skip the dSPE step, and we didn't account for degradation product Phthalimide.
U
96 -2.6 Yes Due to technical problems we were under enormous time pressure. At the beginning we integrated the interfering peak instead of folpet, but we had the time to correct this fault. Unfortunately, we also integrated an interfering peak instead of the ILIS for folpet and didn't correct this fault. After correcting this mistake we determine 0.251 mg/kg by standard addition which leads to a z-score of ~ -1.0.
F, M
112 -2.4 Yes Lacking of reference material not yet checked if it is due to insufficient sensitivity of the instrument (s. also chlorothalonil)
A
98 -2.3 Yes We used QuEChERS method (EN) without acidification for routine analysis and was used for this work. This method converts more of the parent to phthalimide and therefore the value for folpet is underestimated and value for phthalimide is overes-timated. However these effects cancel each other out for sum of two components, as required for MRL residue definition. Our result for full residue definition (sum) was within the acceptable range. We have re-analysed the PT sample using acidic extraction and our results are 0.346 mg/kg for folpet and 0.57 mg/kg for phthalimide. These results would have achieved acceptable z-scores. I have introduced a corrective action to use acidic extraction method for positive samples.
G, Q
29 -2.1 Yes The reason for the poor performance is the unsatisfactory method used for the quantification of folpet in our lab, which does not take the inter-injection variable breakdown of folpet to phthalimide into account. Analysis on GC-ECD yielded a result of about 0.25 mg/kg (low but not questionable/unacceptable). We've looked on the results of folpet over the last 3 years (in total approx. 350 sam-ples of fruits and vegetables) using GC-MS/MS and found one finding (SANTE MS/MS identification criteria fulfilled) of phthalimide at a conc. above 0.01 mg/kg (folpet <0.01). The false negative rate to date has thus not been alarmingly high and the sum folpet calculated from this single actual finding (of PI) is below 0.03 mg/kg (current default MRL in apples). The method for folpet will be revised this autumn to cover the full residue defini-tion. The method for captan will be revised as well. We will use the methodology presented on the EURL-SRM webpage as a starting point for the re-validation of these two active substances.
F
Glyphosate Assigned value: 0.306 mg/kg
LabCode z-Score Source of error localized? Reason / Remarks
1 4.2 Yes Degradation of the stock solution (Factor: 1.715. Applying this factor, it would be 0.367 mg/kg, corresponding to a z-score of 0.8)
E
97 6.1 Yes Freshly prepared calibration and fortification solutions contained only half the con-centration. Short of time to verify in another assay.
E
57 13.0 Yes Inappropriate calibration. The 1: 4 dilution factor was not applied during the quantification of the result obtained. After its correct application a concentration of 0.343 mg/kg
F

EUPT-SRM12 | 2017 (Strawberry Purée)
A-40
Appendix 7 (cont.) Possible Reasons for Poor Performance (ordered by z-scores)
A: Technical problems with measurement instrumentation
B: Procedure not properly conductedC: Matrix effect not properly compensatedD: Lack of experienceE: Error in concentration of analytical standardF: Error in the evaluation/interpretation of measurement dataG: Use of inappropriate procedureH: Reporting limit higher than the assigned value
I: Sample weight too small, homogeneity insufficientJ: Transcription error
K: Result not corrected for low recoveryL: Inappropriate calibration
M: Detection signals strongly interfered by matrix components/Strong chromatographicinterferences
N: Misunderstanding of the definition of the analyteO: Degradation during sample preparation or measurementP: Sample amount not sufficient for quantitative analysisQ: Consecutive error (e.g. parent too low, degraded product too high, but sum o.k.)U: Undefined
Folpet (parent) Assigned value: 0.334 mg/kg
LabCode z-Score Source of error localized? Reason / Remarks
125 2.3 – We know that we got that values higher than the assigned value, but it is due to the analysis of captan, folpet and their degradation products by cool on column injection (GC-COC-MS/MS). So the degradation produced because of the temperature set in "normal" injection is not produced. Also we have a value for their degradation prod-ucts lower than the assigned value, but the z score for the sum is ok (-0.6 and -0.7 for captan and folpet, respectively).
U
35 2.7 No This compound is not in our scope . The method (QuEChERS citrate buffered, without dSPE) is not optimised in our lab. We haven’t managed yet to identify the error source, as we used folpet D4 combined with standard addition for quantifying this compound. We obtained the same amount without correcting the result by standard addition. We obtained a concentration of 0.375 mg/kg with a recovery of only 64 % using the calculation sheet published lately by the EURL, that’s why we preferred to provide the result obtained by standard additions with folpet D4.
A
40 3.4 (Yes) We assume that the problem is in the stability of our standard and we expect a new standard to determine the problem
G
95 5.0 No Analysis was performed using QuEChERS-Extract with SPE cleanup, not acidified by formic acid, but with ascorbic acid (5 µg/ml extract) as analytical protectant. Calcula-tion was down by one standard addition to sample extract (since the sample amount was not sufficient for standard addition to sample portion), and internal standards Folpet-D4 was added.
Results of investigation: Standard solution was o.k., results from a new sample prepa-ration and standard addition was the same as that submitted. Conversion factor was correctly involved. No error source could be found. The degradation product PI with an acceptable z-score (-0.2) was analysed in the same way with the exception, that no internal standard was used.
It is not explainable to us, that the folpet (parent) was clearly overestimated, the degradation product PI was not underestimate, and the sum of folpet (parent) and PI was again within acceptable range (|z-score|<2).
U
52 6.3 No Actually no idea, maybe analytical protectant was fault/old, Sum for Folpet was OK U

A: Technical problems with measurement instrumentation
B: Procedure not properly conductedC: Matrix effect not properly compensatedD: Lack of experienceE: Error in concentration of analytical standardF: Error in the evaluation/interpretation of measurement dataG: Use of inappropriate procedureH: Reporting limit higher than the assigned value
I: Sample weight too small, homogeneity not warrantedJ: Transcription error
K: Result not corrected for low recoveryL: Inappropriate calibration
M: Detection signals strongly interfered by matrix components/Strong chromatografic interference
N: misunderstanding of the definition of the analyteO: Degradation during sample preparation or measurementP: sample amount not sufficient for quantitative investigationQ: Consequent error (e.g. parent too low, degraded product too high, but sum o.k.)U: Undefined
Appendix 7. Possible Reasons Reported for Poor Performance
A-41
Appendix 7 (cont.) Possible Reasons for Poor Performance (ordered by z-scores)
Rea
son
foR
poo
R peR
foRm
an
ce
a7Haloxyfop Assigned value: 0.070 mg/kg
LabCode z-Score Source of error localized? Reason / Remarks
62 -4.0 (FN)
Yes It was my fault, that we missed haloxyfop. I put it to the GC pesticides but we screen it with LC! We found it in the LC screens and we quantified it: 0.054 mg/kg.
J
44 -3.4 (FN)
(Yes) We have checked our method (calibration curve, recovery and SRM), we think that the most likely cause of the poor results is the used derivatization reagent (trimethyl-sulfonium hydroxide (0.2 mol/L in methanol). Unfortunately, there is not an expiry date in the certificate we have. To avoid getting bad results in the future, we ordered a new reagent and will review our results.
B
3rd-139 -3.1 (Yes) 2,4-D, fenbutatin oxide, fluazifop, haloxyfop standard are mixed together, standard may have degraded when we mixed together.
E
3rd-132 -2.2 No We couldn’t find the problem. Standards and LC conditions were ok, recovery (85 %)was ok and we didn’t make any calculation error. During the analysis, we couldn’t repeat analysis a few more times because all material was used for GC determination.
75 2.9 Yes The concentrations were determined directly without dilution. The determined con-centration was not far from the highest calibration points. The repeat analysis was performed and the sample was diluted to the concentration at almost the same level as the average calibration points. It has been shown that the measured concentration for haloxyfop was then 0.084 mg/kg with an acceptable z-score.
C, L
71 38.6 Yes Transcription error. It should be 0.0748 mg/kg J
Bifenazate (sum) Assigned value: 0.267 mg/kg
LabCode z-Score Source of error localized? Reason / Remarks
58 2.3 Yes a standard with an incorrect concentration was used (factor 1.81, applying the factor: concentration=0.234 mg/kg, new z-score:-0.53)
E
70 5.3 Yes Bifenazate is degraded in standard solution. In the calibration, the peak correspond-ing to bifenazate was smaller than normal. So bifenazate concentration in the straw-berry sample was overestimated.
E
3rd-134 3.4 (Yes) We are focusing on the dithiocarbamate this time. After numerous of testing, we are pretty sure the result for dithiocarbamate is correct. Unfortunately, the remain-ing sample in good condition is not enough for regular pesticides analysis. We can only do a rough trial once and submit our data. The pesticide data is apparently not reliable. Many points, like sample condition and quality of pesticide standard, can be wrong in this rough trial.
P
Bromide ion Assigned value: 19.1 mg/kg
LabCode z-Score Source of error localized? Reason / Remarks
42 -4.0 Yes It was a calculation error. Recalculation give an amount of 16.0 mg/kg. F
129 -2.8 Yes The instrument we used is 11 years old and in case of some compounds we have some problems with quantification. In May we bought a new one LC-MS/MS (Ther-mo-Quantiva), I run the PT again with this instrument and the results was perfect.
A
71 2.1 Yes Sample weight 1 mg too small, resulting in loss of homogeneity. We repeated the analysis by weighting 5 grams of sample and we obtained a concentration of 23.8 mg/kg (Z-score of around 1). The original method was initially performed for aromatic herbs, so by weighting 1 gram we avoid some interferences in the ionic chromatograph. As a corrective measure, we are going to amend this procedure and we will establish a weight of 5 grams for high water content commodities such as fruits and vegetables, in which less interferences are expected.
I
45 2.2 Yes The result was not corrected for the high recovery of 130 %. If we would have cor-rected it for recovery, the z-score would have been fine.
K
63 2.5 Yes In this PT we used the QuPPe method that we want to use in the near future. Our ac-credited method uses GC after derivatisation.
D
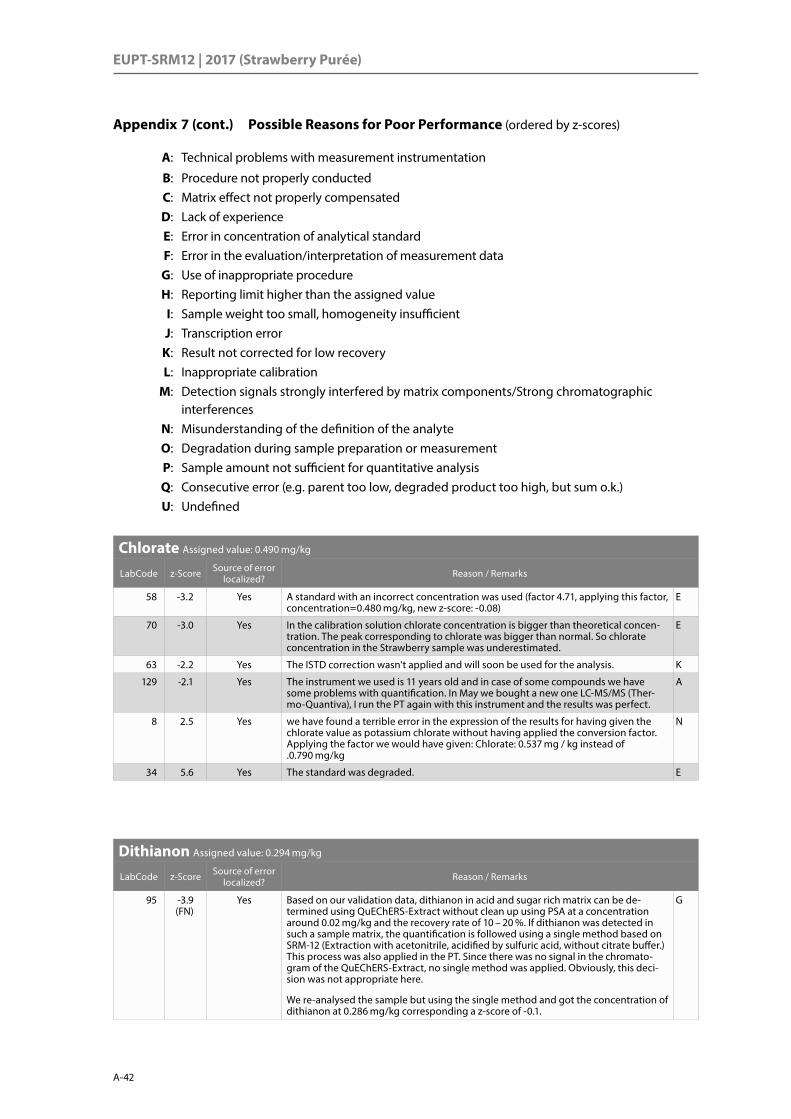
EUPT-SRM12 | 2017 (Strawberry Purée)
A-42
Appendix 7 (cont.) Possible Reasons for Poor Performance (ordered by z-scores)
A: Technical problems with measurement instrumentation
B: Procedure not properly conductedC: Matrix effect not properly compensatedD: Lack of experienceE: Error in concentration of analytical standardF: Error in the evaluation/interpretation of measurement dataG: Use of inappropriate procedureH: Reporting limit higher than the assigned value
I: Sample weight too small, homogeneity insufficientJ: Transcription error
K: Result not corrected for low recoveryL: Inappropriate calibration
M: Detection signals strongly interfered by matrix components/Strong chromatographicinterferences
N: Misunderstanding of the definition of the analyteO: Degradation during sample preparation or measurementP: Sample amount not sufficient for quantitative analysisQ: Consecutive error (e.g. parent too low, degraded product too high, but sum o.k.)U: Undefined
Chlorate Assigned value: 0.490 mg/kg
LabCode z-Score Source of error localized? Reason / Remarks
58 -3.2 Yes A standard with an incorrect concentration was used (factor 4.71, applying this factor, concentration=0.480 mg/kg, new z-score: -0.08)
E
70 -3.0 Yes In the calibration solution chlorate concentration is bigger than theoretical concen-tration. The peak corresponding to chlorate was bigger than normal. So chlorate concentration in the Strawberry sample was underestimated.
E
63 -2.2 Yes The ISTD correction wasn't applied and will soon be used for the analysis. K
129 -2.1 Yes The instrument we used is 11 years old and in case of some compounds we have some problems with quantification. In May we bought a new one LC-MS/MS (Ther-mo-Quantiva), I run the PT again with this instrument and the results was perfect.
A
8 2.5 Yes we have found a terrible error in the expression of the results for having given the chlorate value as potassium chlorate without having applied the conversion factor. Applying the factor we would have given: Chlorate: 0.537 mg / kg instead of .0.790 mg/kg
N
34 5.6 Yes The standard was degraded. E
Dithianon Assigned value: 0.294 mg/kg
LabCode z-Score Source of error localized? Reason / Remarks
95 -3.9 (FN)
Yes Based on our validation data, dithianon in acid and sugar rich matrix can be de-termined using QuEChERS-Extract without clean up using PSA at a concentration around 0.02 mg/kg and the recovery rate of 10 – 20 %. If dithianon was detected in such a sample matrix, the quantification is followed using a single method based on SRM-12 (Extraction with acetonitrile, acidified by sulfuric acid, without citrate buffer.) This process was also applied in the PT. Since there was no signal in the chromato-gram of the QuEChERS-Extract, no single method was applied. Obviously, this deci-sion was not appropriate here.
We re-analysed the sample but using the single method and got the concentration of dithianon at 0.286 mg/kg corresponding a z-score of -0.1.
G

A: Technical problems with measurement instrumentation
B: Procedure not properly conductedC: Matrix effect not properly compensatedD: Lack of experienceE: Error in concentration of analytical standardF: Error in the evaluation/interpretation of measurement dataG: Use of inappropriate procedureH: Reporting limit higher than the assigned value
I: Sample weight too small, homogeneity not warrantedJ: Transcription error
K: Result not corrected for low recoveryL: Inappropriate calibration
M: Detection signals strongly interfered by matrix components/Strong chromatografic interference
N: misunderstanding of the definition of the analyteO: Degradation during sample preparation or measurementP: sample amount not sufficient for quantitative investigationQ: Consequent error (e.g. parent too low, degraded product too high, but sum o.k.)U: Undefined
Appendix 7. Possible Reasons Reported for Poor Performance
A-43
Appendix 7 (cont.) Possible Reasons for Poor Performance (ordered by z-scores)
Rea
son
foR
poo
R peR
foRm
an
ce
a7Dithianon Assigned value: 0.294 mg/kg
LabCode z-Score Source of error localized? Reason / Remarks
52 -3.7 Yes Transcription error (I put in the wrong number, measurement values: 0.219; 0.243; 0.235 )
J
75 -3.7 Yes Dithianon is not within laboratory’s routine scope. The analysis were performed with-out acidifying the sample with 1 % HCOOH or H2SO4. The standard solution wasn’t acidified, too. These factors affect the recovery crucially.
D
46 -3.4 (Yes) Three possible explanations for the nonconforming dithianon results, namely: 1: We corrected the result by the doping efficiency: gross result = 0.122 mg/kg (300 % doping yield), 2: We introduced dithianon D4 before injection and not before extraction (to save the amount of solution used) 3: The calibration is done in the solvent and not in presence of matrix, there is perhaps a matrix effect: "red fruit" not yet checked. We regularly perform doping on peaches and apricots (dithianon regularly requested on this type of matrix) and our yields are in conformity. This is an analysis that is never asked for red fruits.
C
3 -2.6 (Yes) We don’t use dithianon D4 and we don’t use procedural calibration in our routine procedure, it could be an explanation for the difference with labs who use one of this 2 kind of recovery corrections (our recovery is 71 %). As our method is not accredited for this analyt, we didn’t do further investigation.
L
57 -2.5 Yes The recovery obtained was only 51 %. K
30 6.2 No Unfortunately, I couldn’t find any reasons associated with analytical detection.
90 31.0 Yes The technician made mistake in the preparation of the standard solution (factor 10). The result is indeed 0.257 mg/kg instead of 2.57 mg/kg and good (assigned value at 0.294 mg/kg).
E
Phosphonic acid Assigned value: 19.3 mg/kg
LabCode z-Score Source of error localized? Reason / Remarks
63 -4 Yes A dilution factor of 10 wasn't applied, therefore, the result was wrong of this factor. F
57 -2.9 Yes Procedure not properly conducted. Error in the preparation of the working solution of ILIS-P (WS1), water was used instead of acetonitrile. Analysis using our standard gave an average concentration of 5382.45 mg/kg.
E, B
99 -2.4 – In the last two PTs, our lab also has submitted results for phosphonic acid lower than the assigned values. Usually, we analysed phosphonic acid together with glyphosate with a hypercarb column. So far we have not adapted the special chromatographic condition given in Method 1.4, since we modified the chromatographic condition us-ing QuPPe M1.3 and the recovery rate was usually within 70 % and 120 %. Therefore, we have not ruled out a significant discrimination between phosphonic acid and phosphoric acid. For matrix with a lot of interference, e.g. Tea, the extract was diluted before measurement to reduce the interference.
U
129 -2.3 Yes The instrument we used is 11 years old and in some compounds we have some prob-lems with quantification. In May we buy a new one LC-MSMS (Thermo-Quantiva) and I run the PT’s again in this instrument and the results was perfect
A
70 -2.1 Yes Integration error. With the new integration, the result is 13,2 mg/kg (Z-score =-1,26) which is a correct result.
F
34 10.0 Yes The standard was degraded. E
N-Acetyl glyphosate Assigned value: 0.100 mg/kg
LabCode z-Score Source of error localized? Reason / Remarks
6 -3.2 (FN)
(Yes) Reason not yet found, probably low sensitivity of the equipment on ESI neg. mode. LOD for NAG too high on ESI neg. mode, investigation in progress
A

EUPT-SRM12 | 2017 (Strawberry Purée)
A-44
Appendix 7 (cont.) Possible Reasons for Poor Performance (ordered by z-scores)
A: Technical problems with measurement instrumentation
B: Procedure not properly conductedC: Matrix effect not properly compensatedD: Lack of experienceE: Error in concentration of analytical standardF: Error in the evaluation/interpretation of measurement dataG: Use of inappropriate procedureH: Reporting limit higher than the assigned value
I: Sample weight too small, homogeneity insufficientJ: Transcription error
K: Result not corrected for low recoveryL: Inappropriate calibration
M: Detection signals strongly interfered by matrix components/Strong chromatographicinterferences
N: Misunderstanding of the definition of the analyteO: Degradation during sample preparation or measurementP: Sample amount not sufficient for quantitative analysisQ: Consecutive error (e.g. parent too low, degraded product too high, but sum o.k.)U: Undefined
Captan (sum) Assigned value: 0.302 mg/kg
LabCode z-Score Source of error localized? Reason / Remarks
25 2.3 Yes New result calculated with the new THPI result: 0.265 mg/kg, estimated z-score: -0.5)
129 2.7 Yes We don’t have internal standard for this compounds. We order this. We used a chemi-cal ionization, but it is something new for us and because of this we didn’t had good quantification for this compounds
D
58 3.5 Yes We did not use and follow the SRM method “Quantification of Residues of Folpet and Captan in QuEChERS Extracts” Version 3.1 (update 6/4/17).
L
Folpet (sum) Assigned value: 1.195 mg/kg
LabCode z-Score Source of error localized? Reason / Remarks
47 -3.1 Yes Transcription error (please see phthalimide) J
66 -2.1 Yes Transcription error (Our folpet (parent) result was 0.440 mg/kg (z-score = 1.3) and phthalimide result was 0.444 mg/kg (z-score = 0.0). So our folpet sum (sum of folpet and phthalimide expressed as folpet) should be 1,337 mg/kg. But we had reported by mistake 0.579 mg/kg.
J
13 2.5 No We used 1) ECD for detection, correction using ILIS was not possible; 2) just the folpet for calibration and quantified both compounds phthalimide and folpet as a sum; 3) calculation Excel-sheet provided by the organisers
U
129 2.6 Yes We don’t have internal standard for this compounds. We order this. We used a chemi-cal ionization, but it is something new for us and because of this we didn’t had good quantification for this compounds
D
58 3.1 Yes We did not use and follow the SRM method “Quantification of Residues of Folpet and Captan in QuEChERS Extracts” Version 3.1 (update 6/4/17).
L
39 4.6 Yes Phthalimide too high, consequently folpet too high Q

A: Technical problems with measurement instrumentation
B: Procedure not properly conductedC: Matrix effect not properly compensatedD: Lack of experienceE: Error in concentration of analytical standardF: Error in the evaluation/interpretation of measurement dataG: Use of inappropriate procedureH: Reporting limit higher than the assigned value
I: Sample weight too small, homogeneity not warrantedJ: Transcription error
K: Result not corrected for low recoveryL: Inappropriate calibration
M: Detection signals strongly interfered by matrix components/Strong chromatografic interference
N: misunderstanding of the definition of the analyteO: Degradation during sample preparation or measurementP: sample amount not sufficient for quantitative investigationQ: Consequent error (e.g. parent too low, degraded product too high, but sum o.k.)U: Undefined
Appendix 7. Possible Reasons Reported for Poor Performance
A-45
Appendix 7 (cont.) Possible Reasons for Poor Performance (ordered by z-scores)
Rea
son
foR
poo
R peR
foRm
an
ce
a7THPI Assigned value: 0.110 mg/kg
LabCode z-Score Source of error localized? Reason / Remarks
47 2.2 Yes We have reported an elevated z-score for THPI (z-score = 2.2) but the result of captan is slightly lowered (z-score = -1.1). Since THPI is a degradation compound of captan, and the result of captan is lowered, it is logic to find an elevated result for THPI. When assessing the sum of both compounds (in accordance with the residue definition), the z-score is 1.4, which is a good result. It is clear that there is no structural method problem.
Q
127 2.2 (Yes) We have investigated the causes of the result of THPI, and the explication is we used isotopically labelled standards (ILIS) of the parent (captan D6) instead of other inter-nal standard like chlorpyrifos D10. Captan D6 presented low sensibility and resolu-tion. We think that was the reason we obtained a slightly higher result.
Note of organiser: Captan D6 will be degraded during hot injection into GC, its amount varies from vial to vial and, therefore, not suitable as internal standards.
G
25 3.1 Yes New calibration standard solution realized with another batch of reference standard (new result: 0.0907 mg/kg, estimated z-score: -0.7)
E
129 4.0 Yes We used a chemical ionization, but it is something new for us and because of this we didn’t had good quantification for this compounds.
D
58 4.4 Yes We did not use and follow the SRM method “Quantification of Residues of Folpet and Captan in QuEChERS Extracts” Version 3.1 (update 6/4/17). For phthalimide and THPI, however, we did not calculate the concentration against the standards phthalimide and THPI (non degraded) but against phthalimide and THPI coming from degradation of standards folpet and captan. This causes a overestimation of the concentration leading to the high, positive z-scores. Conclusion: For a correct quantification the SRM method should be followed using also the ILIS.
L
34 6.3 Yes The standard was degraded. E
3rd-132 21.7 Yes THPI and phthalimide are in implementation process and we hadn’t experience with that analysis. We couldn’t get a good results by GC-MS/MS and used GC-MS without confirmation. We submitted by mistake this result.
D
Phthalimide Assigned value: 0.446 mg/kg
LabCode z-Score Source of error localized? Reason / Remarks
47 -4.0 Yes Transcription error (The result of phthalimide was 0.518 mg/kg, but not reported due to an administrative fault. This result would have given a good z-score for phthalim-ide and folpet (sum).
J
13 3.3 No unclear, no calculation error
129 3.6 Yes We used a chemical ionization, but it is something new for us and because of this we didn’t had good quantification for this compounds.
D
58 4.2 Yes We did not use and follow the SRM method “Quantification of Residues of Folpet and Captan in QuEChERS Extracts” Version 3.1 (update 6/4/17). For phthalimide and THPI, however, we did not calculate the concentration against the standards phthalimide and THPI (non degraded) but against phthalimide and THPI coming from degradation of standards folpet and captan. This causes a overestimation of the concentration leading to the high, positive z-scores. Conclusion: For a correct quantification the SRM method should be followed using also the ILIS.
L
39 9.5 Yes Bad concentration standard of phthalimide which was degraded and increased the result of the sum.
E
3rd-132 10.0 Yes THPI and phthalimide are in implementation process and we hadn’t experience with that analysis. We couldn’t get a good results by GC-MS/MS and used GC-MS without confirmation. We submitted by mistake this result.
D

EUPT-SRM12 | 2017 (Strawberry Purée)
A-46
Appendix 7 (cont.) Possible Reasons for Poor Performance (ordered by z-scores)
A: Technical problems with measurement instrumentation
B: Procedure not properly conductedC: Matrix effect not properly compensatedD: Lack of experienceE: Error in concentration of analytical standardF: Error in the evaluation/interpretation of measurement dataG: Use of inappropriate procedureH: Reporting limit higher than the assigned value
I: Sample weight too small, homogeneity insufficientJ: Transcription error
K: Result not corrected for low recoveryL: Inappropriate calibration
M: Detection signals strongly interfered by matrix components/Strong chromatographicinterferences
N: Misunderstanding of the definition of the analyteO: Degradation during sample preparation or measurementP: Sample amount not sufficient for quantitative analysisQ: Consecutive error (e.g. parent too low, degraded product too high, but sum o.k.)U: Undefined
False Positive ResultsAnalyte LabCode Reason / Remarks
Abamectin 3rd-132 We made a transcription error, because the result for Abamectin was 0,0023 mg/kg. J
Cyromazine 3rd-135 Misinterpretation of GC-MS/MS data by the analyst. Corrective action : Retraining on the interpretation of GC-MS/MS data to the analyst and all officers in Pesticide Laboratory."
F

A-47
Appendix 8 (cont.) General EUPT Protocol (7th Ed.)
A8
Gen
erA
l Pro
toco
(7th
ed
.)
Appendix 8. General EUPT Protocol (7th Ed.)
7th E
ditio
n: R
evis
ed 2
7th J
anua
ry, 2
017
Pag
e 1
of 1
7
GEN
ERA
L PR
OTO
CO
L fo
r EU
Pro
ficie
ncy
Test
s on
Pes
ticid
e R
esid
ues
in
Foo
d an
d Fe
ed
Intr
oduc
tion
This
pro
toco
l con
tain
s ge
nera
l pro
cedu
res
valid
for a
ll Eu
rope
an U
nion
Pro
ficie
ncy
Test
s (E
UPT
s)
orga
nise
d on
beh
alf
of t
he E
urop
ean
Com
mis
sion
, D
G-S
ANTE
1 by
the
four
Eur
opea
n U
nion
R
efer
ence
Lab
orat
orie
s (E
UR
Ls)
resp
onsi
ble
for
pest
icid
e re
sidu
es i
n fo
od a
nd f
eed.
The
se
EUPT
s ar
e di
rect
ed a
t lab
orat
orie
s be
long
ing
to th
e N
etw
ork2 o
f Nat
iona
l Ref
eren
ce L
abor
ator
ies
(NR
Ls)
and
Offi
cial
Lab
orat
orie
s (O
fLs)
of t
he E
U M
embe
r St
ates
. OfL
s fro
m E
FTA
coun
tries
and
EU
-Can
dida
te c
ount
ries
are
also
wel
com
e to
par
ticip
ate
in th
e EU
PTs.
OfL
s fro
m T
hird
cou
ntrie
s m
ay b
e pe
rmitt
ed to
par
ticip
ate
on a
cas
e-by
-cas
e ba
sis.
The
follo
win
g fo
ur E
UR
Ls f
or p
estic
ide
resi
dues
wer
e ap
poin
ted
by D
G-S
ANTE
bas
ed o
n re
gula
tion
882/
2004
/EC
3 :
• EU
RL
for F
ruits
and
Veg
etab
les
(EU
RL-
FV),
• EU
RL
for C
erea
ls a
nd F
eedi
ngst
uffs
(EU
RL-
CF)
,
• EU
RL
for F
ood
of A
nim
al O
rigin
and
Com
mod
ities
with
Hig
h Fa
t Con
tent
(EU
RL-
AO) a
nd
• EU
RL
for p
estic
ides
requ
iring
Sin
gle
Res
idue
Met
hods
(EU
RL-
SRM
).
The
aim
of t
hese
EU
PTs
is to
obt
ain
info
rmat
ion
rega
rdin
g th
e qu
ality
, acc
urac
y an
d co
mpa
rabi
lity
of p
estic
ide
resi
due
data
in fo
od a
nd fe
ed re
porte
d to
the
Euro
pean
Uni
on w
ithin
the
fram
ewor
k of
th
e na
tiona
l co
ntro
l pr
ogra
mm
es a
nd t
he E
U m
ultia
nnua
l co
-ord
inat
ed c
ontro
l pr
ogra
mm
e4 . Pa
rtici
patin
g la
bora
torie
s w
ill be
pro
vide
d w
ith a
n as
sess
men
t of t
heir
anal
ytic
al p
erfo
rman
ce th
at
1 DG
-SA
NTÉ
= E
urop
ean
Com
mis
sion
, Hea
lth a
nd F
ood
Saf
ety
Dire
ctor
ate-
Gen
eral
2 F
or m
ore
info
rmat
ion
abou
t the
EU
RL/
NR
L/O
fL-N
etw
ork
plea
se re
fer t
o th
e E
UR
L-W
eb-p
orta
l und
er:
ht
tp://
ww
w.e
url-p
estic
ides
.eu
3 Reg
ulat
ion
(EC
) No
882/
2004
of t
he E
urop
ean
Par
liam
ent a
nd o
f the
Cou
ncil
on o
ffici
al c
ontro
ls p
erfo
rmed
to e
nsur
e th
e ve
rific
atio
n of
com
plia
nce
with
feed
and
food
law
, ani
mal
hea
lth a
nd a
nim
al w
elfa
re ru
les.
Pub
lishe
d at
OJ
of th
e E
U L
191
of 2
8.05
.200
4 4 E
urop
ean
Com
mis
sion
Pro
ficie
ncy
Test
s fo
r Pes
ticid
e R
esid
ues
in F
ruits
and
Veg
etab
les,
Tre
nds
in A
naly
tical
C
hem
istry
, 201
0, 2
9 (1
), 70
– 8
3.
7th E
ditio
n: R
evis
ed 2
7th J
anua
ry, 2
017
Pag
e 2
of 1
7
they
can
use
to
dem
onst
rate
the
ir an
alyt
ical
per
form
ance
and
com
pare
the
mse
lves
with
oth
er
parti
cipa
ting
labo
rato
ries.
EUPT
-Org
anis
ers
and
Scie
ntifi
c C
omm
ittee
EUPT
s ar
e or
gani
sed
by in
divi
dual
EU
RLs
, or b
y m
ore
than
one
EU
RL,
in jo
int c
olla
bora
tion.
An O
rgan
isin
g Te
am i
s ap
poin
ted
by t
he E
UR
L(s)
in
char
ge.
This
tea
m i
s re
spon
sibl
e fo
r al
l ad
min
istra
tive
and
tech
nica
l m
atte
rs
conc
erni
ng
the
orga
nisa
tion
of
the
PT,
e.g.
th
e PT
-an
noun
cem
ent,
prod
uctio
n of
Tes
t Ite
m a
nd B
lank
Mat
eria
l, th
e un
derta
king
of
hom
ogen
eity
and
st
abilit
y te
sts,
pac
king
and
shi
pmen
t of t
he T
est I
tem
and
Bla
nk M
ater
ial,
hand
ling
and
eval
uatio
n of
the
res
ults
and
met
hod
info
rmat
ion
subm
itted
by
the
parti
cipa
nts
and
the
draf
ting
of t
he
prel
imin
ary
and
final
repo
rts.
To c
ompl
emen
t the
inte
rnal
exp
ertis
e of
the
EUR
Ls, a
gro
up o
f ext
erna
l con
sulta
nts
that
form
the
EUPT
-Sci
entif
ic C
omm
ittee
(EU
PT-S
C)5 h
as b
een
esta
blis
hed
and
appr
oved
by
DG
-SAN
TE. T
he
EUPT
-SC
con
sist
s of
exp
ert
scie
ntis
ts w
ith m
any
year
s of
exp
erie
nce
in P
Ts a
nd/o
r pe
stic
ide
resi
due
anal
ysis
. The
act
ual c
ompo
sitio
n of
the
EUPT
-SC
, the
affi
liatio
n of
eac
h m
embe
r is
show
n on
the
EU
RL-
Web
site
. The
mem
bers
of
the
EUPT
-SC
will
also
be
liste
d in
the
Spe
cific
Pro
toco
l an
d th
e Fi
nal R
epor
t of e
ach
EUPT
.
The
EUPT
-SC
is m
ade
up o
f the
follo
win
g tw
o su
bgro
ups:
a)
An in
depe
nden
t Qua
lity
Con
trol
Gro
up (E
UPT
-QC
G) a
nd
b)
An A
dvis
ory
Gro
up (E
UPT
-AG
).
The
EUPT
-SC
’s r
ole
is t
o he
lp t
he O
rgan
iser
s m
ake
deci
sion
s re
gard
ing
the
EUPT
des
ign:
the
se
lect
ion
of th
e co
mm
odity
, the
sel
ectio
n of
pes
ticid
es to
be
incl
uded
in th
e Ta
rget
Pes
ticid
e Li
st
(see
bel
ow),
the
esta
blis
hmen
t of t
he M
inim
um R
equi
red
Rep
ortin
g Le
vels
(MR
RLs
), th
e st
atis
tical
tre
atm
ent a
nd e
valu
atio
n of
par
ticip
ants
resu
lts (i
n an
onym
ous
form
), an
d th
e dr
aftin
g an
d up
datin
g of
doc
umen
ts s
uch
as th
e G
ener
al a
nd S
peci
fic P
T Pr
otoc
ols
and
the
Fina
l EU
PT-R
epor
ts.
The
EUPT
-QC
G h
as th
e ad
ditio
nal f
unct
ion
of s
uper
visi
ng t
he q
ualit
y of
EU
PTs
and
of a
ssis
ting
the
EUR
Ls in
con
fiden
tial a
spec
ts s
uch
as th
e ch
oice
of
the
pest
icid
es to
be
pres
ent i
n th
e Te
st
Item
and
the
conc
entra
tions
at w
hich
they
sho
uld
be p
rese
nt.
5 Lin
k to
the
List
of c
urre
nt m
embe
rs o
f the
EU
PT
Sci
entif
ic C
omm
ittee
: ht
tp://
ww
w.e
url-p
estic
ides
.eu/
libra
ry/d
ocs/
allc
rl/E
UP
T-S
C.p
df
Appendix 8 General EUPT Protocol (7th Ed.)

EUPT-SRM12 | 2017 (Strawberry Purée)
A-48
Appendix 8 (cont.) General EUPT Protocol (7th Ed.)
7th E
ditio
n: R
evis
ed 2
7th J
anua
ry, 2
017
Pag
e 4
of 1
7
NR
Ls a
re r
espo
nsib
le f
or c
heck
ing
whe
ther
all
rele
vant
OfL
s w
ithin
the
ir ne
twor
k ar
e in
clud
ed in
th
e lis
t of
obl
igat
ed la
bora
torie
s an
d w
heth
er t
he c
onta
ct in
form
atio
n an
d co
mm
odity
-sco
pes
are
corr
ect.
OfL
s ar
e fu
rther
mor
e ur
ged
to k
eep
thei
r ow
n pr
ofile
s w
ithin
the
EU
RL-
Dat
aPoo
l up
-to-d
ate,
es
peci
ally
thei
r com
mod
ity a
nd p
estic
ide
scop
es a
nd th
eir c
onta
ct in
form
atio
n.
Labs
tha
t ar
e ob
liged
to
parti
cipa
te in
a g
iven
EU
PT,
and
that
are
not
abl
e to
par
ticip
ate,
mus
t pr
ovid
e th
e re
ason
s fo
r th
eir
non-
parti
cipa
tion
with
out p
reju
dice
of a
ny le
gal a
ctio
n ta
ken
agai
nst
them
for
not p
artic
ipat
ing.
Thi
s al
so a
pplie
s to
any
par
ticip
atin
g la
bora
torie
s th
at th
en fa
il to
rep
ort
resu
lts.
Con
fiden
tialit
y an
d C
omm
unic
atio
n
The
prop
rieto
r of a
ll EU
PT d
ata
is D
G-S
ANTE
and
as
such
has
acc
ess
to a
ll in
form
atio
n.
For
each
EU
PT,
the
labo
rato
ries
are
give
n a
uniq
ue c
ode
(lab
code
), in
itial
ly o
nly
know
n to
th
emse
lves
and
the
Org
anis
ers.
In th
e fin
al E
UPT
-Rep
ort,
the
nam
es o
f par
ticip
atin
g la
bora
torie
s w
ill no
t be
linke
d to
thei
r lab
orat
ory
code
s. It
sho
uld
be n
oted
, how
ever
, tha
t the
Org
anis
ers,
at t
he
requ
est
by D
G-S
ANTE
, m
ay p
rese
nt t
he E
UPT
-resu
lts o
n a
coun
try-b
y-co
untry
bas
is.
It m
ay
ther
efor
e be
pos
sibl
e th
at a
link
bet
wee
n co
des
and
labo
rato
ries
coul
d be
mad
e, e
spec
ially
for
th
ose
coun
tries
whe
re o
nly
one
labo
rato
ry h
as p
artic
ipat
ed. F
urth
erm
ore,
the
EUR
Ls r
eser
ve th
e rig
ht t
o sh
are
EUPT
res
ults
and
cod
es a
mon
gst
them
selv
es:
for
exam
ple,
for
the
pur
pose
of
eval
uatin
g ov
eral
l lab
or c
ount
ry p
erfo
rman
ce a
s re
ques
ted
by D
G-S
ANTE
.
As la
id d
own
in R
egul
atio
n 88
2/20
04, N
RLs
are
resp
onsi
ble
for e
valu
atin
g an
d im
prov
ing
thei
r ow
n O
fL-N
etw
ork.
On
requ
est f
rom
the
NR
Ls,
the
EUR
Ls w
ill pr
ovid
e th
em w
ith t
he P
T-co
des
of th
e pa
rtici
patin
g O
fLs
belo
ngin
g to
the
ir O
fL-N
etw
ork.
Thi
s w
ill al
low
NR
Ls t
o fo
llow
the
par
ticip
atio
n an
d pe
rform
ance
of t
he la
bora
torie
s w
ithin
thei
r net
wor
k.
Com
mun
icat
ion
betw
een
parti
cipa
ting
labo
rato
ries
durin
g th
e te
st o
n m
atte
rs c
once
rnin
g a
PT
exer
cise
is n
ot p
erm
itted
from
the
star
t of t
he P
T ex
erci
se u
ntil
the
dist
ribut
ion
of th
e pr
elim
inar
y re
port.
For
each
EU
PT t
he o
rgan
isin
g EU
RL
prep
ares
a s
peci
fic E
UPT
-Web
site
whe
re a
ll re
leva
nt
docu
men
ts in
thei
r lat
est v
ersi
on a
re li
nked
.
The
offic
ial l
angu
age
used
in a
ll EU
PTs
is E
nglis
h.
7th E
ditio
n: R
evis
ed 2
7th J
anua
ry, 2
017
Pag
e 3
of 1
7
The
EUPT
-SC
typi
cally
mee
ts o
nce
a ye
ar, a
fter t
he E
UPT
s of
all
four
pes
ticid
e EU
RLs
hav
e be
en
cond
ucte
d, to
dis
cuss
the
eval
uatio
n of
the
EU
PT-re
sults
and
to c
onsu
lt w
ith t
he E
UR
Ls in
the
ir de
cisi
on m
akin
g. U
pcom
ing
EUPT
s ar
e al
so p
lann
ed d
urin
g th
ese
mee
tings
.
The
EUPT
-Org
anis
ing
Team
and
the
EUPT
-SC
toge
ther
form
the
EUPT
-Pan
el.
The
deci
sion
s of
the
EUPT
-Pan
el w
ill be
doc
umen
ted.
This
pre
sent
EU
PT G
ener
al P
roto
col w
as jo
intly
dra
fted
by th
e EU
PT-S
C a
nd th
e EU
RLs
and
was
ap
prov
ed b
y D
G-S
ANTE
.
EUPT
Par
ticip
ants
With
in th
e Eu
rope
an U
nion
all
NR
Ls o
pera
ting
in th
e sa
me
area
as
the
orga
nisi
ng E
UR
L, a
s w
ell
as a
ll O
fLs
who
se s
cope
ove
rlaps
with
tha
t of
the
EU
PT,
are
lega
lly o
blig
ed t
o pa
rtici
pate
in
EUPT
s. T
he le
gal o
blig
atio
n of
NR
Ls a
nd O
fLs
to p
artic
ipat
e in
EU
PTs
aris
es fr
om:
- Ar
t. 28
of
Reg
. 39
6/20
05/E
C6 (
for
all
OfL
s an
alys
ing
for
pest
icid
e re
sidu
es w
ithin
the
fra
mew
ork
of o
ffici
al c
ontro
ls7 o
f foo
d or
feed
)
- Ar
t. 33
of R
eg. 8
82/2
004/
EC (f
or a
ll N
RLs
)
The
four
EU
RLs
will
annu
ally
issu
e an
d di
strib
ute,
via
the
EUR
L-w
ebsi
te, a
join
t lis
t of a
ll O
fLs
that
m
ust p
artic
ipat
e in
eac
h of
the
EUPT
s to
be
cond
ucte
d w
ithin
a g
iven
yea
r. Th
e lis
t of o
blig
ed la
bs
will
be u
pdat
ed e
very
yea
r to
take
acc
ount
of a
ny c
hang
es in
the
lab
prof
iles.
Inte
rim u
pdat
es w
ill be
issu
ed to
elim
inat
e an
y po
ssib
le e
rror
s.
6 R
egul
atio
n (E
C) N
o 39
6/20
05, p
ublis
hed
at O
J of
the
EU
L70
of 1
6.03
.200
5, a
s la
st a
men
ded
by R
egul
atio
n 83
9/20
08
publ
ishe
d at
OJ
of th
e E
U L
234
of 3
0.08
.200
8.
7 Offi
cial
con
trols
in th
e se
nse
of R
eg. 8
82/2
004/
EC
, Thi
s in
clud
es la
bs in
volv
ed in
con
trols
with
in th
e fra
mew
ork
of
natio
nal a
nd/o
r EU
-con
trolle
d pr
ogra
mm
es a
s w
ell a
s la
bs in
volv
ed in
impo
rt co
ntro
ls a
ccor
ding
to R
egul
atio
n 66
9/20
09/E
C.
OR
GAN
ISER
S EU
PT-A
G
EUPT
-QC
G
EUPT
-Pan
el
EUPT
-SC

Appendix 8. General EUPT Protocol (7th Ed.)
A-49
Appendix 8 (cont.) General EUPT Protocol (7th Ed.)
A8
Gen
erA
l Pro
toco
(7th
ed
.)
7th E
ditio
n: R
evis
ed 2
7th J
anua
ry, 2
017
Pag
e 5
of 1
7
Anno
unce
men
t / In
vita
tion
Lette
r
At
leas
t 3
mon
ths
befo
re
the
dist
ribut
ion
of
the
Test
Ite
m
the
EUR
Ls
will
publ
ish
an
Anno
unce
men
t/Inv
itatio
n le
tter
on th
e EU
RL-
web
-por
tal a
nd d
istri
bute
it v
ia e
-mai
l to
the
NR
L/O
fL
mai
ling
list a
vaila
ble
to th
e EU
RLs
. Thi
s le
tter w
ill in
form
abo
ut th
e co
mm
odity
to b
e us
ed a
s Te
st
Item
, as
wel
l as
links
to th
e te
ntat
ive
EUPT
-Tar
get P
estic
ide
List
and
the
tent
ativ
e EU
PT-C
alen
dar.
Targ
et P
estic
ide
List
This
list
con
tain
s al
l ana
lyte
s (p
estic
ides
and
met
abol
ites)
to b
e so
ught
, alo
ng w
ith t
he M
inim
um
Req
uire
d R
epor
ting
Leve
ls (
MR
RLs
) va
lid fo
r th
e sp
ecifi
c EU
PT. T
he M
RR
Ls a
re ty
pica
lly b
ased
up
on
the
low
est
MR
Ls
foun
d ei
ther
in
R
egul
atio
n 39
6/20
05/E
C
or
Com
mis
sion
D
irect
ive
2006
/125
/EC
(Bab
y Fo
od D
irect
ive)
.
Labs
mus
t exp
ress
thei
r res
ults
as
stat
ed in
the
Targ
et P
estic
ides
Lis
t.
Spec
ific
Prot
ocol
For
each
EU
PT th
e or
gani
zing
EU
RL
will
publ
ish
a Sp
ecifi
c Pr
otoc
ol a
t lea
st 2
wee
ks b
efor
e th
e Te
st I
tem
is d
istri
bute
d to
the
par
ticip
atin
g la
bora
torie
s. T
he S
peci
fic P
roto
col w
ill co
ntai
n al
l the
in
form
atio
n pr
evio
usly
inc
lude
d in
the
Inv
itatio
n Le
tter
but
in i
ts f
inal
ver
sion
, in
form
atio
n on
pa
ymen
t an
d de
liver
y, in
stru
ctio
ns o
n ho
w t
o ha
ndle
the
Tes
t Ite
m u
pon
rece
ipt
and
on h
ow t
o su
bmit
resu
lts, a
s w
ell a
s an
y ot
her r
elev
ant i
nfor
mat
ion.
Hom
ogen
eity
of t
he T
est I
tem
The
Test
Ite
m w
ill be
tes
ted
for
hom
ogen
eity
typ
ical
ly b
efor
e di
strib
utio
n to
par
ticip
ants
. Th
e ho
mog
enei
ty t
ests
usu
ally
invo
lve
the
anal
ysis
of
two
repl
icat
e an
alyt
ical
por
tions
, ta
ken
from
at
leas
t ten
rand
omly
cho
sen
units
of t
reat
ed T
est I
tem
. Bot
h, s
ampl
e pr
epar
atio
n an
d m
easu
rem
ents
sh
ould
be
cond
ucte
d in
rand
om o
rder
.
The
hom
ogen
eity
test
dat
a ar
e st
atis
tical
ly e
valu
ated
acc
ordi
ng to
ISO
135
28, A
nnex
B o
r to
the
Inte
rnat
iona
l Har
mon
ized
Pro
toco
ls jo
intly
pub
lishe
d by
ISO
, AO
AC a
nd IU
PAC
. The
res
ults
of a
ll ho
mog
enei
ty te
sts
are
pres
ente
d to
the
EUPT
-SC
. In
spec
ial c
ases
, whe
re th
e ab
ove
hom
ogen
eity
te
st c
riter
ia a
re n
ot m
et,
the
EUPT
-SC
con
side
ring
all
rele
vant
asp
ects
(e.
g. t
he h
omog
enei
ty
resu
lts o
f ot
her
pest
icid
es s
pike
d at
the
sam
e tim
e, t
he o
vera
ll di
strib
utio
n of
the
par
ticip
ants
’ re
sults
, the
ana
lytic
al d
iffic
ultie
s fa
ced
durin
g th
e te
st, k
now
ledg
e of
the
anal
ytic
al b
ehav
iour
of t
he
7th E
ditio
n: R
evis
ed 2
7th J
anua
ry, 2
017
Pag
e 6
of 1
7
pest
icid
e qu
estio
n) m
ay d
ecid
e to
ove
rrul
e th
e te
st.
The
reas
ons
of t
his
over
rulin
g ha
ve t
o be
tra
nspa
rent
ly e
xpla
ined
in th
e Fi
nal E
UPT
-Rep
ort.
Stab
ility
of t
he a
naly
tes
cont
aine
d in
the
Test
Item
The
Test
Item
s w
ill al
so b
e te
sted
for s
tabi
lity
- ac
cord
ing
to IS
O 1
3528
, Ann
ex B
. The
tim
e de
lay
betw
een
the
first
and
the
last
sta
bilit
y te
st m
ust e
xcee
d th
e pe
riod
of th
e EU
PT-e
xerc
ise.
Typ
ical
ly
the
first
ana
lysi
s is
car
ried
out
shor
tly b
efor
e th
e sh
ipm
ent
of t
he T
est
Item
s an
d th
e la
st o
ne
shor
tly a
fter
the
dead
line
for
subm
issi
on o
f res
ults
. To
bette
r re
cogn
ise
trend
s an
d ga
in a
dditi
onal
ce
rtain
ty o
ne o
r mor
e ad
ditio
nal t
ests
may
be
cond
ucte
d by
the
Org
anis
ers.
At l
east
6 s
ub-s
ampl
es
(ana
lytic
al p
ortio
ns) s
houl
d be
ana
lyse
d on
eac
h te
st d
ay (e
.g. 2
ana
lytic
al p
ortio
ns w
ithdr
awn
from
th
ree
rand
omly
cho
sen
cont
aine
rs O
R 6
por
tions
with
draw
n fro
m a
sin
gle
cont
aine
r). In
prin
cipl
e al
l pe
stic
ides
con
tain
ed in
the
Test
Item
sho
uld
be c
heck
ed fo
r sta
bilit
y. H
owev
er, i
n in
divi
dual
cas
es,
whe
re s
uffic
ient
kno
wle
dge
exis
ts t
hat
the
stab
ility
of a
cer
tain
ana
lyte
is
very
unl
ikel
y to
be
sign
ifica
ntly
affe
cted
dur
ing
stor
age
(e.g
. ba
sed
on e
xper
ienc
e fro
m p
ast
stab
ility
test
s or
kn
owle
dge
of it
s ph
ysic
oche
mic
al p
rope
rties
), th
e O
rgan
iser
s, a
fter
cons
ulta
tion
with
the
EU
PT-
QC
G, m
ay d
ecid
e to
om
it a
spec
ific
stab
ility
test
. The
EU
PT-S
C w
ill fin
ally
dec
ide
whe
ther
ana
lyte
s fo
r w
hich
the
sta
bilit
y te
st w
as n
ot u
nder
take
n w
ill be
incl
uded
in t
he f
inal
rep
ort,
cons
ider
ing
all
rele
vant
asp
ects
suc
h as
the
dist
ribut
ion
of th
e pa
rtici
pant
’s re
sults
(CV*
).
A pe
stic
ide
is c
onsi
dere
d to
be
adeq
uate
ly s
tabl
e if
| yi -y
| ≤ 0.
3×σ pt
, whe
re y i
the
mea
n va
lue
of th
e la
st p
erio
d of
the
stab
ility
test
, y is
the
mea
n va
lue
of th
e fir
st p
erio
d of
the
stab
ility
test
and
σ pt t
he
stan
dard
dev
iatio
n us
ed fo
r pro
ficie
ncy
asse
ssm
ent (
typi
cally
25%
of t
he a
ssig
ned
valu
e).
The
resu
lts o
f all
stab
ility
test
s ar
e pr
esen
ted
to th
e EU
PT-S
C. I
n sp
ecia
l cas
es w
here
the
abov
e st
abilit
y te
st c
riter
ia a
re n
ot m
et,
the
EUPT
-SC
con
side
ring
all
rele
vant
asp
ects
(e.
g. t
he p
ast
expe
rienc
e w
ith th
e st
abilit
y of
the
com
poun
d, th
e ov
eral
l dis
tribu
tion
the
parti
cipa
nts’
res
ults
, the
m
easu
rem
ent
varia
bilit
y, a
naly
tical
diff
icul
ties
face
d du
ring
the
test
and
kno
wle
dge
abou
t th
e an
alyt
ical
beh
avio
ur o
f the
pes
ticid
e qu
estio
n) m
ay d
ecid
e to
ove
rrul
e th
e te
st. T
he re
ason
s of
this
ov
erru
ling
will
be tr
ansp
aren
tly e
xpla
ined
in th
e Fi
nal E
UPT
-Rep
ort.
The
Org
anis
ers
may
als
o de
cide
to c
ondu
ct a
dditi
onal
sta
bilit
y te
sts
at d
iffer
ent s
tora
ge c
ondi
tions
th
an th
ose
reco
mm
ende
d to
the
parti
cipa
nts
e.g.
at a
mbi
ent t
empe
ratu
re.
Con
side
ring
know
ledg
e ab
out t
he e
xpec
ted
susc
eptib
ility
of p
estic
ides
in th
e Te
st It
em to
pos
sibl
e lo
sses
, th
e O
rgan
iser
s w
ill ch
ose
the
ship
men
t co
nditi
ons
to b
e su
ch t
hat
pest
icid
e lo
sses
are
m
inim
ised
(e.
g. s
hipm
ent
of f
roze
n sa
mpl
es,
addi
tion
of d
ry i
ce).
As s
hipm
ent
time
can
diffe
r be
twee
n la
bs/c
ount
ries
it is
rec
omm
ende
d th
at th
e O
rgan
iser
s co
nduc
t add
ition
al s
tabi
lity
test
s at
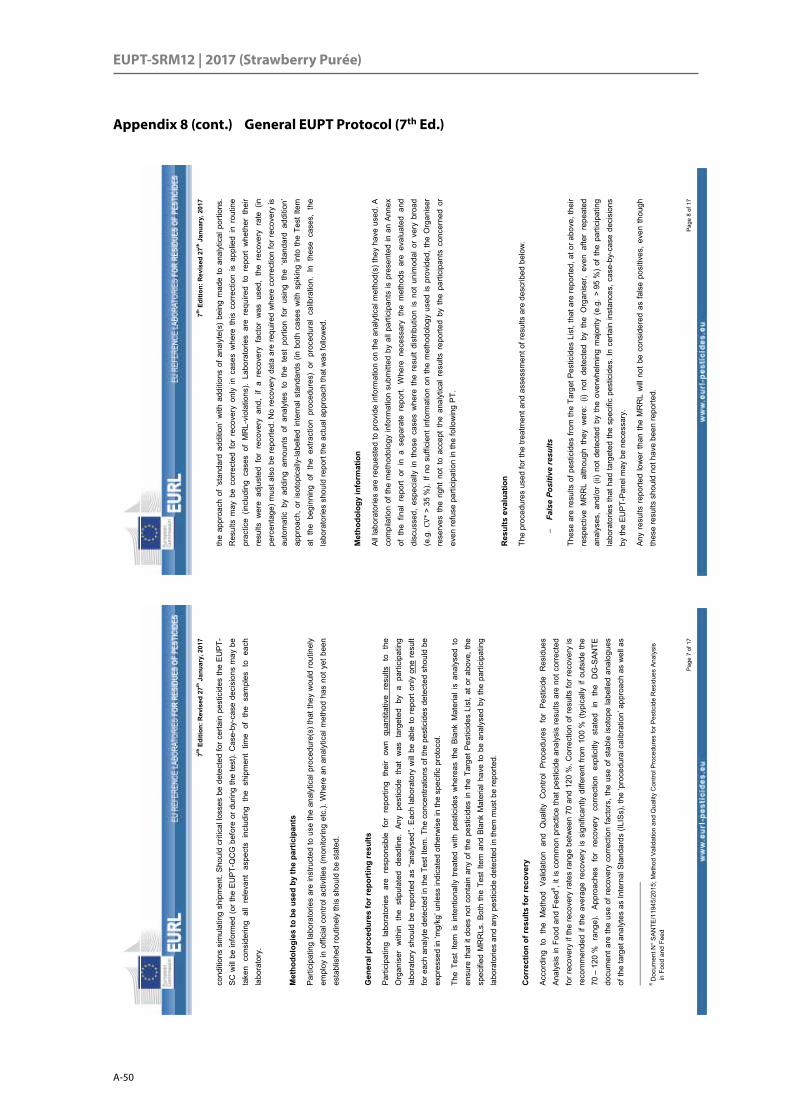
EUPT-SRM12 | 2017 (Strawberry Purée)
A-50
Appendix 8 (cont.) General EUPT Protocol (7th Ed.)
7th E
ditio
n: R
evis
ed 2
7th J
anua
ry, 2
017
Pag
e 7
of 1
7
cond
ition
s si
mul
atin
g sh
ipm
ent.
Shou
ld c
ritic
al lo
sses
be
dete
cted
for c
erta
in p
estic
ides
the
EUPT
-SC
will
be in
form
ed (o
r the
EU
PT-Q
CG
bef
ore
or d
urin
g th
e te
st).
Cas
e-by
-cas
e de
cisi
ons
may
be
take
n co
nsid
erin
g al
l re
leva
nt a
spec
ts i
nclu
ding
the
shi
pmen
t tim
e of
the
sam
ples
to
each
la
bora
tory
.
Met
hodo
logi
es to
be
used
by
the
part
icip
ants
Parti
cipa
ting
labo
rato
ries
are
inst
ruct
ed to
use
the
anal
ytic
al p
roce
dure
(s) t
hat t
hey
wou
ld ro
utin
ely
empl
oy in
offi
cial
con
trol a
ctiv
ities
(m
onito
ring
etc.
). W
here
an
anal
ytic
al m
etho
d ha
s no
t yet
bee
n es
tabl
ishe
d ro
utin
ely
this
sho
uld
be s
tate
d.
Gen
eral
pro
cedu
res
for r
epor
ting
resu
lts
Parti
cipa
ting
labo
rato
ries
are
resp
onsi
ble
for
repo
rting
the
ir ow
n qu
antit
ativ
e re
sults
to
the
Org
anis
er w
ithin
the
stip
ulat
ed d
eadl
ine.
Any
pes
ticid
e th
at w
as t
arge
ted
by a
par
ticip
atin
g la
bora
tory
sho
uld
be r
epor
ted
as “a
naly
sed”
. Eac
h la
bora
tory
will
be a
ble
to r
epor
t onl
y on
e re
sult
for e
ach
anal
yte
dete
cted
in th
e Te
st It
em. T
he c
once
ntra
tions
of t
he p
estic
ides
det
ecte
d sh
ould
be
expr
esse
d in
‘mg/
kg’ u
nles
s in
dica
ted
othe
rwis
e in
the
spec
ific
prot
ocol
.
The
Test
Ite
m is
inte
ntio
nally
tre
ated
with
pes
ticid
es w
here
as t
he B
lank
Mat
eria
l is
anal
ysed
to
ensu
re th
at it
doe
s no
t con
tain
any
of t
he p
estic
ides
in th
e Ta
rget
Pes
ticid
es L
ist,
at o
r abo
ve, t
he
spec
ified
MR
RLs
. Bot
h th
e Te
st It
em a
nd B
lank
Mat
eria
l hav
e to
be
anal
ysed
by
the
parti
cipa
ting
labo
rato
ries
and
any
pest
icid
e de
tect
ed in
them
mus
t be
repo
rted.
Cor
rect
ion
of re
sults
for r
ecov
ery
Acco
rdin
g to
the
Met
hod
Valid
atio
n an
d Q
ualit
y C
ontro
l Pr
oced
ures
for
Pes
ticid
e R
esid
ues
Anal
ysis
in F
ood
and
Feed
8 , it i
s co
mm
on p
ract
ice
that
pes
ticid
e an
alys
is re
sults
are
not
cor
rect
ed
for r
ecov
ery
if th
e re
cove
ry ra
tes
rang
e be
twee
n 70
and
120
%. C
orre
ctio
n of
resu
lts fo
r rec
over
y is
re
com
men
ded
if th
e av
erag
e re
cove
ry is
sig
nific
antly
diff
eren
t fro
m 1
00 %
(ty
pica
lly if
out
side
the
70 –
120
%
rang
e).
Appr
oach
es
for
reco
very
co
rrec
tion
expl
icitl
y st
ated
in
th
e D
G-S
ANTE
do
cum
ent a
re th
e us
e of
rec
over
y co
rrec
tion
fact
ors,
the
use
of s
tabl
e is
otop
e la
belle
d an
alog
ues
of th
e ta
rget
ana
lyte
s as
Inte
rnal
Sta
ndar
ds (I
LISs
), th
e ‘p
roce
dura
l cal
ibra
tion’
app
roac
h as
wel
l as
8 Doc
umen
t N°
SA
NTE
/119
45/2
015;
Met
hod
Valid
atio
n an
d Q
ualit
y C
ontro
l Pro
cedu
res
for P
estic
ide
Res
idue
s An
alys
is
in F
ood
and
Feed
7th E
ditio
n: R
evis
ed 2
7th J
anua
ry, 2
017
Pag
e 8
of 1
7
the
appr
oach
of ‘
stan
dard
add
ition
’ with
add
ition
s of
ana
lyte
(s)
bein
g m
ade
to a
naly
tical
por
tions
. R
esul
ts m
ay b
e co
rrect
ed f
or r
ecov
ery
only
in c
ases
whe
re t
his
corre
ctio
n is
app
lied
in r
outin
e pr
actic
e (in
clud
ing
case
s of
MR
L-vi
olat
ions
). La
bora
torie
s ar
e re
quire
d to
rep
ort
whe
ther
the
ir re
sults
wer
e ad
just
ed f
or r
ecov
ery
and,
if
a re
cove
ry f
acto
r w
as u
sed,
the
rec
over
y ra
te (
in
perc
enta
ge) m
ust a
lso
be re
porte
d. N
o re
cove
ry d
ata
are
requ
ired
whe
re c
orre
ctio
n fo
r rec
over
y is
au
tom
atic
by
addi
ng a
mou
nts
of a
naly
tes
to t
he t
est
porti
on f
or u
sing
the
‘st
anda
rd a
dditi
on’
appr
oach
, or
isot
opic
ally
-labe
lled
inte
rnal
sta
ndar
ds (
in b
oth
case
s w
ith s
piki
ng in
to th
e Te
st It
em
at t
he b
egin
ning
of
the
extra
ctio
n pr
oced
ures
) or
pro
cedu
ral
calib
ratio
n. I
n th
ese
case
s, t
he
labo
rato
ries
shou
ld re
port
the
actu
al a
ppro
ach
that
was
follo
wed
.
Met
hodo
logy
info
rmat
ion
All l
abor
ator
ies
are
requ
este
d to
pro
vide
info
rmat
ion
on th
e an
alyt
ical
met
hod(
s) th
ey h
ave
used
. A
com
pila
tion
of th
e m
etho
dolo
gy in
form
atio
n su
bmitt
ed b
y al
l par
ticip
ants
is p
rese
nted
in a
n An
nex
of t
he f
inal
rep
ort
or i
n a
sepa
rate
rep
ort.
Whe
re n
eces
sary
the
met
hods
are
eva
luat
ed a
nd
disc
usse
d, e
spec
ially
in t
hose
cas
es w
here
the
res
ult
dist
ribut
ion
is n
ot u
nim
odal
or
very
bro
ad
(e.g
. CV*
> 3
5 %
). If
no s
uffic
ient
info
rmat
ion
on th
e m
etho
dolo
gy u
sed
is p
rovi
ded,
the
Org
anis
er
rese
rves
the
rig
ht n
ot t
o ac
cept
the
ana
lytic
al r
esul
ts r
epor
ted
by t
he p
artic
ipan
ts c
once
rned
or
even
refu
se p
artic
ipat
ion
in th
e fo
llow
ing
PT.
Res
ults
eva
luat
ion
The
proc
edur
es u
sed
for t
he tr
eatm
ent a
nd a
sses
smen
t of r
esul
ts a
re d
escr
ibed
bel
ow.
−Fa
lse
Posi
tive
resu
lts
Thes
e ar
e re
sults
of p
estic
ides
from
the
Targ
et P
estic
ides
Lis
t, th
at a
re re
porte
d, a
t or a
bove
, the
ir re
spec
tive
MR
RL
alth
ough
the
y w
ere:
(i)
not
dete
cted
by
the
Org
anis
er,
even
afte
r re
peat
ed
anal
yses
, an
d/or
(ii)
not
det
ecte
d by
the
ove
rwhe
lmin
g m
ajor
ity (
e.g.
> 9
5 %
) of
the
par
ticip
atin
g la
bora
torie
s th
at h
ad ta
rget
ed th
e sp
ecifi
c pe
stic
ides
. In
certa
in in
stan
ces,
cas
e-by
-cas
e de
cisi
ons
by th
e EU
PT-P
anel
may
be
nece
ssar
y.
Any
resu
lts r
epor
ted
low
er th
an th
e M
RR
L w
ill no
t be
cons
ider
ed a
s fa
lse
posi
tives
, eve
n th
ough
th
ese
resu
lts s
houl
d no
t hav
e be
en re
porte
d.

Appendix 8. General EUPT Protocol (7th Ed.)
A-51
Appendix 8 (cont.) General EUPT Protocol (7th Ed.)
A8
Gen
erA
l Pro
toco
(7th
ed
.)
7th E
ditio
n: R
evis
ed 2
7th J
anua
ry, 2
017
Pag
e 9
of 1
7
−Fa
lse
Neg
ativ
e re
sults
Thes
e ar
e re
sults
for
pes
ticid
es r
epor
ted
by t
he la
bora
torie
s as
’ana
lyse
d’ b
ut w
ithou
t re
porti
ng
num
eric
al v
alue
s al
thou
gh t
hey
wer
e: a
) us
ed b
y th
e O
rgan
iser
to
treat
the
Tes
t Ite
m a
nd b
) de
tect
ed b
y th
e O
rgan
iser
as
wel
l as
the
maj
ority
of
the
parti
cipa
nts
that
had
tar
gete
d th
ese
spec
ific
pest
icid
es a
t or
abov
e th
e re
spec
tive
MR
RLs
. Res
ults
rep
orte
d as
’< R
L’ (
RL=
Rep
ortin
g Li
mit
of th
e la
bora
tory
) will
be c
onsi
dere
d as
not
det
ecte
d an
d w
ill be
judg
ed a
s fa
lse
nega
tives
. In
certa
in in
stan
ces,
cas
e-by
-cas
e de
cisi
ons
by th
e EU
PT-P
anel
may
be
nece
ssar
y.
In c
ases
of t
he a
ssig
ned
valu
e be
ing
less
than
a fa
ctor
of 3
tim
es th
e M
RR
L, fa
lse
nega
tives
will
ty
pica
lly n
ot b
e as
sign
ed.
The
EUPT
-Pan
el m
ay d
ecid
e to
tak
e ca
se-b
y-ca
se d
ecis
ions
in
this
re
spec
t afte
r co
nsid
erin
g al
l rel
evan
t fac
tors
suc
h as
the
resu
lt di
strib
utio
n an
d th
e re
porti
ng li
mits
of
the
affe
cted
labs
.
−Es
timat
ion
of th
e as
sign
ed v
alue
(xpt)
In o
rder
to
min
imis
e th
e in
fluen
ce o
f ou
t-lyi
ng r
esul
ts o
n th
e st
atis
tical
eva
luat
ion,
the
ass
igne
d va
lue x pt
(=
cons
ensu
s co
ncen
tratio
n) w
ill ty
pica
lly b
e es
timat
ed u
sing
rob
ust
estim
ate
of t
he
parti
cipa
nt’s
mea
n (x
*) a
s de
scrib
ed in
ISO
135
28:2
0159 , t
akin
g in
to a
ccou
nt th
e re
sults
rep
orte
d by
EU
and
EFT
A co
untri
es l
abor
ator
ies
only
. In
spe
cial
jus
tifia
ble
case
s, t
he E
UPT
-Pan
el m
ay
deci
de t
o el
imin
ate
certa
in r
esul
ts t
race
ably
ass
ocia
ted
with
gro
ss e
rrors
(se
e “O
mis
sion
or
Excl
usio
n of
resu
lts” b
elow
) or t
o us
e on
ly th
e re
sults
of a
sub
grou
p co
nsis
ting
of la
bora
torie
s th
at
have
repe
ated
ly d
emon
stra
ted
good
per
form
ance
for t
he s
peci
fic c
ompo
und
in th
e pa
st.
−O
mis
sion
or E
xclu
sion
of r
esul
ts
Befo
re e
stim
atin
g th
e as
sign
ed v
alue
res
ults
ass
ocia
ted
with
obv
ious
mis
take
s ha
ve t
o be
ex
amin
ed to
dec
ide
whe
ther
they
sho
uld
be r
emov
ed fr
om th
e po
pula
tion.
Suc
h gr
oss
erro
rs m
ay
incl
ude
inco
rrec
t rec
ordi
ng (
e.g.
due
to tr
ansc
riptio
n er
rors
by
the
parti
cipa
nt, d
ecim
al p
oint
faul
ts
or t
rans
pose
d di
gits
, in
corr
ect
unit)
, ca
lcul
atio
n er
rors
(e.
g. m
issi
ng f
acto
rs),
anal
ysis
of
a w
rong
sa
mpl
e/ex
tract
(e.
g. a
spi
ked
blan
k), u
se o
f wro
ng c
once
ntra
tions
of s
tand
ard
solu
tions
, inc
orre
ct
data
pro
cess
ing
(e.g
. int
egra
tion
of w
rong
pea
k), m
ajor
dev
iatio
ns fr
om th
e an
alyt
ical
pro
cedu
re,
9 DIN
IS
O 1
3528
:201
5, S
tatis
tical
met
hods
for
use
in p
rofic
ienc
y te
stin
g by
inte
rlabo
rato
ry c
ompa
rison
s, I
nter
natio
nal
Org
aniz
atio
n fo
r S
tand
ardi
zatio
n. T
here
in a
spe
cific
rob
ust
met
hod
for
dete
rmin
atio
n of
the
con
sens
us m
ean
and
stan
dard
dev
iatio
n w
ithou
t the
nee
d fo
r rem
oval
of d
evia
ting
resu
lts is
des
crib
ed (A
lgor
ithm
A in
Ann
ex C
).
7th E
ditio
n: R
evis
ed 2
7th J
anua
ry, 2
017
Pag
e 10
of 1
7
inap
prop
riate
sto
rage
or
trans
port
cond
ition
s (in
cas
e of
sus
cept
ible
com
poun
ds),
and
the
use
of
inap
prop
riate
pro
cedu
res
that
dem
onst
rabl
y le
ad t
o si
gnifi
cant
ly b
iase
d re
sults
(e.
g. d
ue t
o de
grad
atio
n or
inc
ompl
ete
extra
ctio
n).
Whe
re t
he O
rgan
iser
s (e
.g.
afte
r th
e pu
blic
atio
n of
the
pr
elim
inar
y re
port)
rec
eive
inf
orm
atio
n of
suc
h gr
oss
erro
rs,
havi
ng a
sig
nific
ant
impa
ct o
n a
gene
rate
d re
sult,
the
affe
cted
resu
lts w
ill be
exa
min
ed o
n a
case
-by-
case
bas
is to
dec
ide
whe
ther
, or
not
, the
y sh
ould
be
excl
uded
from
the
popu
latio
n us
ed fo
r rob
ust s
tatis
tics.
Res
ults
may
als
o be
om
itted
e.g
. if a
n in
appr
opria
te m
etho
d ha
s be
en u
sed
even
if th
ey a
re n
ot o
utlie
rs.
All d
ecis
ions
to
omit/
excl
ude
resu
lts w
ill be
dis
cuss
ed w
ith t
he E
UPT
-SC
and
the
rea
soni
ng f
or t
he o
mis
sion
of
each
res
ult
clea
rly s
tate
d in
the
fin
al E
UPT
-Rep
ort.
How
ever
, z
scor
es w
ill be
cal
cula
ted
for
all
resu
lts ir
resp
ectiv
e of
the
fact
that
they
wer
e om
itted
from
the
calc
ulat
ion
of th
e as
sign
ed v
alue
.
Om
itted
res
ults
mig
ht b
e in
tere
stin
g as
the
y m
ight
giv
e in
dica
tions
abo
ut p
ossi
ble
sour
ce(s
) of
er
rors
. The
Org
anis
ers
will
thus
ask
the
rele
vant
lab(
s) to
pro
vide
feed
back
on
poss
ible
sou
rces
of
erro
rs (s
ee a
lso
“follo
w-u
p ac
tiviti
es”)
.
Unc
erta
inty
of t
he a
ssig
ned
valu
e
The
unce
rtain
ty o
f the
ass
igne
d va
lues
u(x pt
) is c
alcu
late
d ac
cord
ing
to IS
O 1
3528
:201
5 as
:
1,25×
∗
whe
re s*
is th
e ro
bust
sta
ndar
d de
viat
ion
and
is th
e nu
mbe
r of r
esul
ts.
In c
erta
in c
ases
and
con
side
ring
all r
elev
ant f
acto
rs (e
.g. t
he re
sult
dist
ribut
ion,
mul
timod
ality
), th
e nu
mbe
r of
sub
mitt
ed r
esul
ts,
info
rmat
ion
rega
rdin
g an
alyt
e ho
mog
enei
ty/s
tabi
lity,
inf
orm
atio
n re
gard
ing
the
use
of m
etho
dolo
gies
that
mig
ht p
rodu
ce a
bia
s th
at w
ere
used
by
the
parti
cipa
nts)
, th
e EU
PT-P
anel
may
con
side
r th
e as
sign
ed v
alue
of
a sp
ecifi
c an
alyt
e to
be
too
unce
rtain
and
de
cide
tha
t th
e re
sults
sho
uld
not
be e
valu
ated
, or
onl
y ev
alua
ted
for
info
rmat
ive
purp
oses
. Th
e pr
ovis
ions
of I
SO 1
3528
:201
5 co
ncer
ning
the
unce
rtain
ty o
f the
ass
igne
d va
lue
will
be ta
ken
into
ac
coun
t.
−St
anda
rd d
evia
tion
of th
e as
sign
ed v
alue
(tar
get s
tand
ard
devi
atio
n)
The
targ
et s
tand
ard
devi
atio
n of
the
ass
igne
d va
lue
(FFP- σ
pt) w
ill be
cal
cula
ted
usin
g a
Fit-F
or-
Purp
ose
appr
oach
with
a fi
xed
Rel
ativ
e St
anda
rd D
evia
tion
(FFP
-RSD
) of 2
5% a
s fo
llow
s:
FFP- σ
pt 0.
25 ×
x pt
EUPT-SRM12 | 2017 (Strawberry Purée)
A-52
Appendix 8 (cont.) General EUPT Protocol (7th Ed.)
7th E
ditio
n: R
evis
ed 2
7th J
anua
ry, 2
017
Pag
e 11
of 1
7
The
perc
enta
ge F
FP-R
SD is
set
at 2
5% b
ased
on
expe
rienc
e fro
m r
esul
ts o
f pr
evio
us E
UPT
s10.
The
EUPT
-Pan
el r
eser
ves
the
right
to
also
em
ploy
oth
er a
ppro
ache
s on
a c
ase-
by-c
ase
basi
s co
nsid
erin
g an
alyt
ical
diff
icul
ties
and
expe
rienc
e ga
ined
from
pre
viou
s pr
ofic
ienc
y te
sts.
For i
nfor
mat
ive
purp
oses
the
robu
st re
lativ
e st
anda
rd d
evia
tion
(CV*)
is c
alcu
late
d ac
cord
ing
to IS
O
1352
8:20
15;
Cha
pter
7.7
(C
onse
nsus
val
ue f
rom
par
ticip
ant
resu
lts)
follo
win
g Al
gorit
hm A
in
Anne
x C
.
−z
scor
es
This
par
amet
er is
cal
cula
ted
usin
g th
e fo
llow
ing
form
ula:
-
whe
re x i
is t
he v
alue
rep
orte
d by
the
lab
orat
ory,
x pt
is t
he a
ssig
ned
valu
e, a
nd F
FP-σ p
tis
the
st
anda
rd d
evia
tion
usin
g FF
P ap
proa
ch.
Z sc
ores
will
be r
ound
ed t
o on
e de
cim
al p
lace
. Fo
r th
e ca
lcul
atio
n of
com
bine
d z
scor
es (s
ee b
elow
) the
orig
inal
z s
core
s w
ill be
use
d an
d ro
unde
d to
one
de
cim
al p
lace
afte
r cal
cula
tion.
Any
z sc
ores
> 5
will
be t
ypic
ally
rep
orte
d as
‘> 5
’ and
a v
alue
of
‘5’ w
ill be
use
d to
cal
cula
te
com
bine
d z
scor
es (s
ee b
elow
).
Z sc
ores
will
be in
terp
rete
d in
the
follo
win
g w
ay, a
s is
set
in th
e IS
O 1
7043
:201
011:
|z
| ≤ 2
.0
Ac
cept
able
2.
0 <
|z| <
3.0
Que
stio
nabl
e
|z
| ≥ 3
.0
U
nacc
epta
ble
For r
esul
ts c
onsi
dere
d as
fals
e ne
gativ
es, z
sco
res
will
be c
alcu
late
d us
ing
the
MR
RL
or R
L (th
e la
bora
tory
’s R
epor
ting
Lim
it) if
the
RL
< M
RR
L. T
he E
UPT
-Pan
el w
ill de
cide
whe
ther
, or n
ot, t
hese
va
lues
sho
uld
appe
ar in
the
z sc
ore
hist
ogra
ms.
−C
ateg
ory
A a
nd B
cla
ssifi
catio
n
10 C
ompa
rativ
e S
tudy
of t
he M
ain
Top-
dow
n A
ppro
ache
s fo
r th
e E
stim
atio
n of
Mea
sure
men
t Unc
erta
inty
in M
ultir
esid
ue
Ana
lysi
s of
Pes
ticid
es in
Fru
its a
nd V
eget
able
s. J
. Agr
ic. F
ood
Che
m.,
2011
, 59(
14),
7609
-761
9.
11 IS
O/IE
C 1
7043
:201
0. C
onfo
rmity
ass
essm
ent –
Gen
eral
requ
irem
ents
for p
rofic
ienc
y te
stin
g
7th E
ditio
n: R
evis
ed 2
7th J
anua
ry, 2
017
Pag
e 12
of 1
7
The
EUPT
-Pan
el w
ill de
cide
if a
nd h
ow t
o cl
assi
fy t
he la
bora
torie
s in
to tw
o ca
tego
ries
- A
or B
. C
urre
ntly
, la
bora
torie
s th
at a
re a
ble
to a
naly
se a
t le
ast
90%
of
the
com
puls
ory
pest
icid
es in
the
ta
rget
pes
ticid
es li
st,
have
cor
rect
ly d
etec
ted
and
quan
tifie
d a
suffi
cien
tly h
igh
perc
enta
ge o
f th
e pe
stic
ides
pre
sent
in
the
Test
Ite
m (
at l
east
90
%)
and
repo
rted
no f
alse
pos
itive
s w
ill ha
ve
dem
onst
rate
d ‘s
uffic
ient
sco
pe’
and
can
ther
efor
e be
cla
ssifi
ed i
nto
Cat
egor
y A.
For
the
90%
cr
iterio
n th
e nu
mbe
r of p
estic
ides
nee
ded
to b
e co
rrec
tly a
naly
sed
to h
ave
suffi
cien
t sco
pe w
ill be
ca
lcul
ated
by
mul
tiply
ing
the
num
ber
of c
ompu
lsor
y pe
stic
ides
from
the
Targ
et P
estic
ides
Lis
t by
0.9
and
roun
ding
to
the
near
est
full
num
ber
with
0.5
dec
imal
s be
ing
roun
ded
dow
nwar
ds (
see
som
e ex
ampl
es in
Tab
le 1
).
Appendix 8. General EUPT Protocol (7th Ed.)
A-53
Appendix 8 (cont.) General EUPT Protocol (7th Ed.)
A8
Gen
erA
l Pro
toco
(7th
ed
.)
7th E
ditio
n: R
evis
ed 2
7th J
anua
ry, 2
017
Pag
e 13
of 1
7
Tabl
e 1.
No.
of p
estic
ides
from
the
Targ
et P
estic
ides
Lis
t nee
ded
to b
e ta
rget
ed o
r pes
ticid
es p
rese
nt
in th
e Te
st It
em th
at n
eed
to b
e co
rrec
tly d
etec
ted
and
quan
tifie
d to
hav
e su
ffici
ent s
cope
.
No.
of c
ompu
lsor
y pe
stic
ides
pre
sent
in th
e Te
st It
em /
Targ
et
Pest
icid
es L
ist (
N)
90 %
N
o. o
f pes
ticid
es n
eede
d to
be
corr
ectly
det
ecte
d an
d qu
antif
ied
/ tar
gete
d to
hav
e su
ffici
ent
scop
e (n
) n
3 2.
7 3
N
4 3.
6 4
5 4.
5 4
N -
1
6 5.
4 5
7 6.
3 6
8 7.
2 7
9 8.
1 8
10
9.0
9 11
9.
9 10
12
10
.8
11
13
11.7
12
14
12
.6
13
15
13.5
13
N -
2
16
14.4
14
17
15
.3
15
18
16.2
16
19
17
.1
17
20
18
18
21
18.9
19
22
19
.8
20
23
20.7
21
24
21
.6
22
25
22.5
22
N
- 3
26
23.4
23
−O
vera
ll pe
rfor
man
ce o
f lab
orat
orie
s - c
ombi
ned
z sc
ores
For
eval
uatio
n of
the
ove
rall
perfo
rman
ce o
f la
bora
torie
s w
ithin
Cat
egor
y A,
the
Ave
rage
of
the
Squa
red
z sc
ore
(AZ2 )12
,13 (s
ee b
elow
) will
be u
sed.
The
AZ2 is
cal
cula
ted
as fo
llow
s:
nzAZ
n ii
∑ ==
1
2
2
12 F
orm
erly
nam
ed “S
um o
f squ
ared
z s
core
s (S
Z2 )” 13
Labo
rato
ry a
sses
smen
t by
com
bine
d z
scor
e va
lues
in p
rofic
ienc
y te
sts:
exp
erie
nce
gain
ed t
hrou
gh t
he E
UP
T fo
r pe
stic
ide
resi
dues
in fr
uits
and
veg
etab
les.
Ana
l. B
ioan
al. C
hem
., 20
10, 3
97, 3
061–
3070
.
7th E
ditio
n: R
evis
ed 2
7th J
anua
ry, 2
017
Pag
e 14
of 1
7
Whe
re n
is th
e nu
mbe
r of z
sco
res
to b
e co
nsid
ered
in th
e ca
lcul
atio
n. In
the
calc
ulat
ion
of th
e AZ
2 , z
scor
es h
ighe
r th
an 5
will
be s
et a
s 5.
Bas
ed o
n th
e AZ
2 ac
hiev
ed, t
he la
bora
torie
sar
e cl
assi
fied
as fo
llow
s:
AZ2
≤ 2.
0
G
ood
2.
0 <
AZ2 <
3.0
Satis
fact
ory
AZ2≥
3.0
Uns
atis
fact
ory
Com
bine
d z
scor
es a
re c
onsi
dere
d to
be
of le
sser
impo
rtanc
e th
an t
he in
divi
dual
z s
core
s. T
he
EUPT
-Pan
el r
etai
ns t
he r
ight
not
to
calc
ulat
e AZ
2 if it
is c
onsi
dere
d as
not
bei
ng u
sefu
l or
if th
e nu
mbe
r of r
esul
ts re
porte
d by
any
par
ticip
ant i
s co
nsid
ered
to b
e to
o lo
w.
In th
e ca
se o
f EU
PT-S
RM
s, w
here
onl
y a
few
resu
lts p
er la
b m
ay b
e av
aila
ble,
the
Aver
age
of th
e Ab
solu
te z
sco
res
(AAZ
) m
ay b
e ca
lcul
ated
for
info
rmat
ive
purp
oses
, bu
t on
ly f
or la
bs th
at h
ave
repo
rted
enou
gh r
esul
ts t
o ob
tain
5 o
r m
ore
z sc
ores
. Fo
r th
e ca
lcul
atio
n of
the
AAZ
, z
scor
es
high
er th
an 5
will
also
be
set a
s 5.
Labo
rato
ries
with
in C
ateg
ory
B w
ill be
rank
ed a
ccor
ding
to th
e to
tal n
umbe
r of p
estic
ides
that
they
co
rrec
tly re
porte
d to
be
pres
ent i
n th
e Te
st It
em. T
he n
umbe
r of a
ccep
tabl
e z
scor
es a
chie
ved
will
be p
rese
nted
, too
. The
EU
RL-
Pane
l ret
ains
the
right
to c
alcu
late
com
bine
d z
scor
es (
see
abov
e)
also
for l
abs
with
in C
ateg
ory
B, e
.g. f
or in
form
ativ
e pu
rpos
es, p
rovi
ded
that
a m
inim
um n
umbe
r of
resu
lts (z
sco
res)
hav
e be
en re
porte
d.
Publ
icat
ion
of re
sults
The
EUR
Ls w
ill pu
blis
h a
prel
imin
ary
repo
rt, c
onta
inin
g te
ntat
ive
assi
gned
val
ues
and
z sc
ore
valu
es f
or a
ll pe
stic
ides
pre
sent
in
the
Test
Ite
m,
with
in 2
mon
ths
of t
he d
eadl
ine
for
resu
lt su
bmis
sion
.
The
Fina
l EU
PT R
epor
t will
be p
ublis
hed
afte
r th
e EU
PT-P
anel
has
dis
cuss
ed th
e re
sults
. Tak
ing
into
acc
ount
tha
t th
e EU
PT-P
anel
mee
ts n
orm
ally
onl
y on
ce a
yea
r (ty
pica
lly in
late
sum
mer
or
autu
mn)
to d
iscu
ss th
e re
sults
of a
ll EU
PTs
orga
nise
d by
the
EUR
Ls e
arlie
r in
the
year
, the
fina
l re
port
may
be
publ
ishe
d up
to
10 m
onth
s af
ter
the
dead
line
for
resu
lts s
ubm
issi
on.
Res
ults
su
bmitt
ed b
y no
n-EU
/EFT
A la
bora
torie
s m
ight
not
alw
ays
be u
sed
in t
he t
able
s or
fig
ures
in th
e fin
al re
port.

EUPT-SRM12 | 2017 (Strawberry Purée)
A-54
Appendix 8 (cont.) General EUPT Protocol (7th Ed.)
7th E
ditio
n: R
evis
ed 2
7th J
anua
ry, 2
017
Pag
e 15
of 1
7
Cer
tific
ates
of p
artic
ipat
ion
Toge
ther
with
the
Fina
l EU
PT-R
epor
t, th
e EU
RL
Org
anis
er w
ill de
liver
a C
ertif
icat
e of
Par
ticip
atio
n to
eac
h pa
rtici
patin
g la
bora
tory
sho
win
g th
e z
scor
es a
chie
ved
for
each
indi
vidu
al p
estic
ide,
the
co
mbi
ned
z sc
ores
cal
cula
ted
(if a
ny),
and
the
clas
sific
atio
n in
to C
ateg
ory
A or
B.
Feed
back
At a
ny ti
me
befo
re, d
urin
g or
afte
r the
PT
parti
cipa
nts
have
the
poss
ibilit
y to
con
tact
the
Org
anis
ers
and
mak
e su
gges
tions
or
in
dica
te
erro
rs.
Afte
r th
e di
strib
utio
n of
th
e Fi
nal
EUPT
-Rep
ort,
parti
cipa
ting
labo
rato
ries
will
be g
iven
the
oppo
rtuni
ty to
giv
e th
eir f
eedb
ack
to th
e O
rgan
iser
s an
d m
ake
sugg
estio
ns fo
r fut
ure
impr
ovem
ents
.
Cor
rect
ion
of e
rror
s
Shou
ld e
rror
s be
dis
cove
red
in a
ny o
f the
doc
umen
ts is
sued
prio
r to
the
EUPT
(C
alen
dar,
Targ
et
Pest
icid
es L
ist,
Spec
ific
Prot
ocol
, Gen
eral
Pro
toco
l) th
e co
rrect
ed d
ocum
ents
will
be u
ploa
ded
onto
th
e w
ebsi
te a
nd in
the
case
of s
ubst
antia
l erro
rs th
e pa
rtici
pant
s w
ill be
info
rmed
. Bef
ore
star
ting
the
exer
cise
par
ticip
ants
sho
uld
mak
e su
re t
o do
wnl
oad
the
late
st v
ersi
on o
f th
ese
docu
men
ts.
If su
bsta
ntia
l erro
rs a
re d
isco
vere
d in
the
Prel
imin
ary
EUPT
-Rep
ort t
he O
rgan
iser
s w
ill di
strib
ute
a ne
w c
orre
cted
ver
sion
, whe
re it
will
be s
tate
d th
at th
e pr
evio
us v
ersi
on is
no
long
er v
alid
.
Whe
re s
ubst
antia
l er
rors
are
dis
cove
red
in t
he F
inal
EU
PT-R
epor
t th
e EU
PT-P
anel
will
deci
de
whe
ther
a c
orrig
endu
m w
ill be
issu
ed a
nd h
ow t
his
shou
ld lo
ok.
The
onlin
e ve
rsio
n of
the
fin
al
repo
rt w
ill be
repl
aced
by
the
new
one
and
all
affe
cted
labs
will
be c
onta
cted
.
Whe
re e
rror
s ar
e di
scov
ered
in
EUPT
-Cer
tific
ates
the
rel
evan
t la
bora
torie
s w
ill be
sen
t ne
w
corr
ecte
d on
es. W
here
nec
essa
ry th
e la
bora
torie
s w
ill be
ask
ed to
retu
rn th
e ol
d on
es.
Follo
w-u
p ac
tiviti
es
Labo
rato
ries
are
expe
cted
to u
nder
take
follo
w-u
p ac
tiviti
es to
trac
e ba
ck th
e so
urce
s of
erro
neou
s or
stro
ngly
dev
iatin
g re
sults
(ty
pica
lly t
hose
with
|z|
> 2
.0)
- in
clud
ing
all
fals
e po
sitiv
es.
Even
re
sults
with
in |z
| ≤ 2
.0 m
ay h
ave
to b
e ch
ecke
d if
ther
e is
indi
catio
ns o
f a
sign
ifica
nt p
ositi
ve o
r ne
gativ
e bi
as.
7th E
ditio
n: R
evis
ed 2
7th J
anua
ry, 2
017
Pag
e 16
of 1
7
Upo
n re
ques
t, th
e la
bora
tory
’s c
orre
spon
ding
NR
L an
d EU
RL
are
to b
e in
form
ed o
f the
out
com
e of
an
y in
vest
igat
ive
activ
ities
for
fal
se p
ositi
ves,
fal
se n
egat
ives
and
for
res
ults
with
|z|
≥ 3
.0.
Con
cern
ing
z sc
ores
bet
wee
n 2.
0 an
d 3.
0 th
e co
mm
unic
atio
n of
the
outc
ome
of fo
llow
-up
activ
ities
is
opt
iona
l but
hig
hly
enco
urag
ed w
here
the
sour
ce o
f dev
iatio
n co
uld
be id
entif
ied
and
coul
d be
of
inte
rest
to o
ther
labs
.
Acco
rdin
g to
inst
ruct
ions
from
DG
-SAN
TE, t
he “P
roto
col f
or m
anag
emen
t of u
nder
perfo
rman
ce in
com
para
tive
test
ing
and/
or la
ck o
f col
labo
ratio
n of
Nat
iona
l Ref
eren
ce L
abor
ator
ies
(NR
Ls) w
ith
EU R
efer
ence
Lab
orat
orie
s (E
UR
Ls) a
ctiv
ities
” is
to b
e fo
llow
ed.
NR
Ls w
ill be
con
side
red
as u
nder
perf
orm
ing
in re
latio
n to
sco
pe if
in a
t lea
st tw
o of
the
last
four
EUPT
s fa
lling
with
in th
eir r
espo
nsib
ility
area
if th
ey: a
) hav
en’t
parti
cipa
ted,
or b
) tar
gete
d le
ss th
an
90%
of t
he c
ompu
lsor
y pe
stic
ides
in th
e ta
rget
list
s (8
0% fo
r SR
M-c
ompo
unds
), or
c) d
etec
ted
less
than
90%
of
the
com
puls
ory
com
poun
ds p
rese
nt i
n th
e te
st i
tem
s (8
0% f
or S
RM
-com
poun
ds).
Addi
tiona
lly,
NR
Ls t
hat
obta
ined
AZ2 h
ighe
r th
an 3
in
two
cons
ecut
ive
EUPT
s of
the
las
t fo
ur
EUPT
s, w
ill be
con
side
red
as u
nder
perf
orm
ing
in a
ccur
acy.
A tw
o-st
ep p
roto
col e
stab
lishe
d by
DG
-SAN
TE w
ill be
app
lied
as s
oon
as u
nder
perfo
rman
ce o
f an
NR
L is
det
ecte
d14:
Phas
e 1:
• Id
entif
ying
the
orig
in o
f the
bad
resu
lts (f
ailu
re in
EU
PTs)
.
• Ac
tions
: On
the
spot
vis
its a
nd tr
aini
ng if
nec
essa
ry a
nd re
petit
ion
of th
e co
mpa
rativ
e te
st if
feas
ible
and
clo
se th
e as
sess
men
t of r
esul
ts b
y th
e EU
RL.
Phas
e 2:
• If
the
resu
lts s
till r
evea
l und
erpe
rform
ance
the
Com
mis
sion
sha
ll be
info
rmed
offi
cial
ly b
y
the
EUR
L in
clud
ing
a re
port
of th
e m
ain
findi
ngs
and
corre
ctiv
e ac
tions
.
• Th
e C
omm
issi
on s
hall
info
rm th
e C
ompe
tent
Aut
horit
y an
d re
quire
that
app
ropr
iate
act
ions
are
take
n.
Und
erpe
rform
ance
rule
s fo
r the
OfL
s w
ill be
est
ablis
hed
at a
late
r sta
ge.
14 A
rticl
e 32
of t
he R
egul
atio
n 88
2/20
04

Appendix 8. General EUPT Protocol (7th Ed.)
A-55
Appendix 8 (cont.) General EUPT Protocol (7th Ed.)
A8
Gen
erA
l Pro
toco
(7th
ed
.)
7th E
ditio
n: R
evis
ed 2
7th J
anua
ry, 2
017
Pag
e 17
of 1
7
Dis
clai
mer
The
EUPT
-Pan
el r
etai
ns th
e rig
ht to
cha
nge
any
parts
of t
his
EUPT
– G
ener
al P
roto
col b
ased
on
new
sci
entif
ic o
r tec
hnic
al in
form
atio
n. A
ny c
hang
es w
ill be
com
mun
icat
ed in
due
cou
rse.
EUPT-SRM12 | 2017 (Strawberry Purée)
A-56
Appendix 9 (cont.) Specific Protocol of EUPT-SRM12Appendix 9 Specific Protocol of EUPT-SRM12
EU R
efer
ence
Lab
orat
ory
for S
ingl
e Re
sidu
e M
etho
ds (E
URL
-SRM
) CV
UA
Stut
tgar
t, Sc
hafla
ndst
r. 3/
2, D
E-70
736
Fellb
ach
Web
site:
ww
w.e
url-p
estic
ides
.eu,
E-M
ail:
EURL
-SRM
@cv
uas.
bwl.d
e Pa
ge 1
of 6
SP
ECIF
IC P
ROTO
COL
for t
he 1
2th E
U P
rofic
ienc
y Te
st
on P
estic
ides
requ
iring
Sin
gle
Resi
due
Met
hods
EU
PT –
SRM
12 (2
017)
(u
pdat
e on
27
Febr
uary
, 201
7)
Intr
oduc
tion
This
prot
ocol
is c
ompl
emen
tary
to th
e va
lid v
ersio
n of
the
"Gen
eral
Pro
toco
l for
EU
Pro
ficie
ncy
Test
s fo
r Pe
stic
ide
Resi
-du
es in
Foo
d an
d Fe
ed"
cove
ring
all E
UPT
s.
The
EUPT
-SRM
12 is
org
anise
d by
the
EU
Ref
eren
ce L
abor
ator
y fo
r pe
stic
ides
req
uirin
g Si
ngle
Res
idue
Met
hods
(EU
RL–
SRM
) whi
ch is
acc
redi
ted
acco
rdin
g to
ISO
170
43 a
s pro
vide
rs o
f pro
ficie
ncy
test
s.
The
EUPT
-SRM
12 d
eals
with
the
ana
lysis
of
SRM
-pes
ticid
es in
str
awbe
rry
puré
e an
d is
to b
e pe
rfor
med
by
all N
atio
nal
Refe
renc
e La
bora
torie
s fo
r Sin
gle
Resid
ue M
etho
ds (N
RL-S
RMs)
as
wel
l as
by a
ll of
ficia
l EU
labo
rato
ries
(OfL
s) in
volv
ed in
of
ficia
l pes
ticid
e re
sidue
con
trol
s as
far
as th
eir
scop
e ov
erla
ps w
ith th
at o
f the
EU
PT-S
RM12
. Thi
s in
clud
es la
bora
torie
s in
volv
ed in
impo
rt c
ontr
ol w
ithin
the
fram
e of
Reg
. 669
/200
9/EC
. A s
peci
al E
UPT
-SRM
12-W
ebsi
te c
onta
inin
g lin
ks to
the
mos
t im
port
ant d
ocum
ents
of r
elev
ance
was
con
stru
cted
. Ba
sed
on th
e in
form
atio
n in
the
offic
ial L
ab-N
etw
ork-
data
base
hos
ted
in th
e EU
RL D
ataP
ool a
nd c
onsid
erin
g th
e co
mm
od-
ity sc
ope
only
(not
the
pest
icid
e sc
ope)
, the
sta
tus o
f the
OfL
s con
cern
ing
thei
r par
ticip
atio
n in
the
curr
ent P
T is
show
n on
th
e re
gist
ratio
n pa
ge. A
s fa
r as
the
EUPT
-SRM
12 is
con
cern
ed, a
ll O
fLs
anal
ysin
g pe
stic
ides
in fr
uits
and
veg
etab
les
wer
e co
nsid
ered
as
oblig
ed. O
fLs
liste
d as
“ob
liged
to
part
icip
ate
in th
e EU
PT-S
RM12
” bu
t no
t in
tend
ing
to p
artic
ipat
e ha
d to
st
ate
thei
r rea
sons
for n
on-p
artic
ipat
ion
durin
g th
e on
line
regi
stra
tion
of th
e EU
PT-S
RM12
, whi
ch la
sted
from
17
Janu
ary
till 2
0 Fe
brua
ry, 2
017.
Te
st It
em a
nd B
lank
Mat
eria
l
This
EUPT
dea
ls w
ith th
e an
alys
is of
pes
ticid
e re
sidue
s in
Stra
wbe
rry
Puré
e.
Part
icip
ants
will
rece
ive
two
bott
les c
onta
inin
g:
1) c
a. 4
00 g
Tes
t Ite
m (w
ith in
curr
ed o
r spi
ked
anal
ytes
), co
ntai
ning
pes
ticid
es fr
om th
e Ta
rget
Pes
ticid
es L
ist.
2)
ca.
400
g B
lank
Mat
eria
l, th
at c
an b
e us
ed fo
r rec
over
y ex
perim
ents
as
wel
l as
for
the
prep
arat
ion
of m
atrix
-m
atch
ed c
alib
ratio
n st
anda
rds
Usin
g ra
ndom
ly c
hose
n bo
ttle
s, th
e O
rgan
izers
will
che
ck th
e Te
st It
em fo
r suf
ficie
nt h
omog
enei
ty a
nd fo
r the
sta
bilit
y of
th
e pe
stic
ides
con
tain
ed o
ver t
he p
erio
d of
the
exer
cise
. The
Bla
nk M
ater
ial w
ill b
e al
so c
heck
ed to
pro
ve th
at n
one
of th
e pe
stic
ides
on
the
Targ
et p
estic
ides
List
is c
onta
ined
at r
elev
ant l
evel
s.
Sp
ecifi
c Pr
otoc
ol |
EU
PT –
SRM
12 (2
017)
EU R
efer
ence
Lab
orat
ory
for S
ingl
e Re
sidu
e M
etho
ds (E
URL
-SRM
) CV
UA
Stut
tgar
t, Sc
hafla
ndst
r. 3/
2, D
E-70
736
Fellb
ach
Web
site:
ww
w.e
url-p
estic
ides
.eu,
E-M
ail:
EURL
-SRM
@cv
uas.
bwl.d
e Pa
ge 2
of 6
Ta
rget
Ana
lyte
s and
MRR
Ls
The
Test
Item
will
con
tain
sev
eral
pes
ticid
es fr
om th
e EU
PT-S
RM12
Tar
get
Pest
icid
es L
ist.
Labo
rato
ries
shou
ld r
ead
this
list c
aref
ully
, as
it sh
ows
how
the
resid
ues
are
expe
cted
to b
e re
port
ed a
s w
ell a
s th
e M
inim
um R
equi
red
Repo
rtin
g Le
v-el
s (M
RRLs
). Th
e M
RRL
valu
es w
ill b
e us
ed to
hel
p id
entif
y fa
lse p
ositi
ve a
nd fa
lse n
egat
ive
resu
lts a
nd fo
r the
cal
cula
tion
of z
-sco
res
for
false
neg
ativ
es. M
ake
sure
to d
ownl
oad
the
late
st v
ersi
on o
f the
EU
PT-S
RM12
Tar
get P
estic
ides
Lis
t be
-fo
re st
artin
g w
ith a
naly
sis a
nd re
sult
repo
rtin
g.
It sh
ould
not
be
assu
med
that
onl
y pe
stic
ides
regi
ster
ed fo
r use
in st
raw
berr
y ar
e pr
esen
t in
the
Test
Item
. Sh
ipm
ent o
f Tes
t Ite
m
Test
item
and
Bla
nk M
ater
ial a
re p
lann
ed to
be
ship
ped
on 1
3 M
arch
, 201
7.
Froz
en T
est I
tem
and
Bla
nk M
ater
ial w
ill b
e pa
cked
in th
erm
o-bo
xes t
oget
her w
ith d
ry ic
e an
d sh
ippe
d to
the
part
icip
ants
. Pr
ior t
o sh
ipm
ent a
rem
inde
r will
be
sent
to th
e pa
rtic
ipat
ing
labo
rato
ries b
y e-
mai
l.
Labo
rato
ries
mus
t m
ake
thei
r ow
n ar
rang
emen
ts fo
r th
e re
ceip
t of
the
pac
kage
. The
y sh
ould
info
rm t
he O
rgan
iser
s of
an
y pu
blic
hol
iday
s in
thei
r cou
ntry
/city
dur
ing
the
wee
k of
the
ship
men
t, an
d m
ust m
ake
the
nece
ssar
y ar
rang
emen
ts
to re
ceiv
e th
e sh
ipm
ent,
even
if th
e la
bora
tory
is c
lose
d.
Shou
ld a
ny c
ompl
icat
ions
dur
ing
ship
men
t, de
liver
y or
the
cust
oms
be e
xpec
ted,
the
part
icip
atin
g la
bora
torie
s sh
ould
pr
ovid
e th
e O
rgan
izers
with
con
tact
info
rmat
ion
of p
ossib
le c
onta
ct p
erso
ns o
f the
lab
(e.g
. mob
ile p
hone
num
bers
) as
wel
l as
inst
ruct
ions
in lo
cal l
angu
age
expl
aini
ng t
he n
eed
to k
eep
the
pack
age
in f
reez
er d
urin
g de
lay
in t
rans
it an
d de
liver
y. T
his i
nfor
mat
ion
will
be
atta
ched
to th
e pa
ckag
e.
Inst
ruct
ions
on
hand
ling
the
Test
Item
Onc
e re
ceiv
ed, t
he T
est I
tem
sho
uld
be st
ored
dee
p fr
ozen
(at -
18°C
or l
ower
) unt
il an
alys
is in
ord
er to
min
imiz
e pe
stic
ide
degr
adat
ion
and
avoi
d an
y po
ssib
le d
eter
iora
tion/
spoi
lage
. Be
fore
ana
lytic
al p
ortio
ns a
re t
aken
for
ana
lysi
s, it
is r
ecom
men
ded
to m
ix t
he m
ater
ial t
horo
ughl
y in
its
entir
ety.
W
hile
mix
ing,
try
to k
eep
tem
pera
ture
s as
low
as p
ossib
le to
avo
id th
e lo
ss o
f uns
tabl
e pe
stic
ides
. Pa
rtic
ipat
ing
labo
rato
ries
shou
ld u
se th
eir r
outin
e st
anda
rd o
pera
ting
proc
edur
es fo
r ext
ract
ion,
cle
an-u
p an
d an
alyt
i-ca
l mea
sure
men
t as
wel
l as
thei
r ow
n re
fere
nce
stan
dard
s fo
r ide
ntifi
catio
n an
d qu
antif
icat
ion
purp
oses
. Lab
orat
orie
s m
ay a
lso e
mpl
oy m
etho
ds n
ot y
et im
plem
ente
d ro
utin
ely,
for
exa
mpl
e if
they
are
in t
he t
est-
phas
e of
impl
emen
ting
them
. In
this
case
the
limite
d ex
perie
nce
and
the
non-
incl
usio
n of
the
anal
yte
in th
e ro
utin
e sc
ope
shou
ld b
e in
dica
ted
in
the
. re
sult
subm
issio
n w
ebsi
te Th
e ho
mog
enei
ty te
sts
will
be
cond
ucte
d us
ing
10 g
ana
lytic
al p
ortio
ns o
f Tes
t Ite
m fo
r al
l ana
lyte
s ex
cept
for
dith
ioca
r-ba
mat
es w
here
exp
ecte
dly
20 g
will
be
used
. Ple
ase
note
: Sub
-sam
plin
g va
riabi
lity
incr
ease
s w
ith d
ecre
asin
g an
alyt
ical
po
rtio
n siz
e, a
nd su
ffici
ent h
omog
enei
ty c
an o
nly
be g
uara
ntee
d fo
r sam
ple
port
ions
≥ 1
0 g.
Appendix 9. Specific Protocol of EUPT-SRM12
A-57
Appendix 9 (cont.) Specific Protocol of EUPT-SRM12
A9
Spec
ific
pro
toco
l
Sp
ecifi
c Pr
otoc
ol |
EU
PT –
SRM
12 (2
017)
EU R
efer
ence
Lab
orat
ory
for S
ingl
e Re
sidu
e M
etho
ds (E
URL
-SRM
) CV
UA
Stut
tgar
t, Sc
hafla
ndst
r. 3/
2, D
E-70
736
Fellb
ach
Web
site:
ww
w.e
url-p
estic
ides
.eu,
E-M
ail:
EURL
-SRM
@cv
uas.
bwl.d
e Pa
ge 3
of 6
Re
sults
subm
issi
on w
ebsi
te
Sam
ple
rece
ipt a
ckno
wle
dgem
ent,
anal
ytic
al re
sults
and
met
hod
info
rmat
ion
are
to b
e su
bmitt
ed v
ia th
e fo
llow
ing
web
-sit
e:
. EU
PT-S
RM12
resu
lt su
bmis
sion
web
site
Su
b-Pa
ge 0
(Sam
ple
rece
ipt a
ckno
wle
dgem
ent)
, acc
essib
le fr
om 1
4 M
arch
, 201
7.
Su
b-Pa
ges 1
-3 (a
naly
tical
resu
lts a
nd m
etho
d in
form
atio
n) a
cces
sible
from
20
Mar
ch, t
ill 1
0 Ap
ril, 2
017.
The
dead
line
for r
esul
t sub
miss
ion
is 1
0 Ap
ril, 2
017
at 1
6 h
(CES
T).
- Log
in C
rede
ntia
l and
Lab
-Cod
e
To a
cces
s th
e da
ta-s
ubm
issi
on f
orm
s pa
rtic
ipan
ts m
ust
use
thei
r un
ique
logi
n cr
eden
tials
(use
rnam
e an
d pa
ssw
ord)
. Th
e lo
gin
cred
entia
l tog
ethe
r with
the
EUPT
-SRM
12 la
b-co
des
the
will
be
prov
ided
to e
ach
of th
e pa
rtic
ipat
ing
labo
ra-
torie
s on
the
ship
men
t day
. - S
ampl
e Re
ceip
t and
Acc
epta
nce
(Sub
-Pag
e 0)
Onc
e th
e la
bora
tory
has
rece
ived
the
Test
Item
s it
mus
t rep
ort t
o th
e or
gani
ser
via
the
EUPT
-SRM
12 R
esul
t Su
bmis
sion
(s
ub-p
age
0) th
e da
te o
f rec
eipt
, the
con
ditio
n of
the
Test
Item
, and
its
acce
ptan
ce. F
or la
bora
torie
s in
the
EU-
Web
site
and
EFTA
cou
ntrie
s an
d EU
can
dida
te c
ount
ries,
the
dead
line
for
acce
ptan
ce is
17
Mar
ch, 2
017.
If a
labo
rato
ry d
oes
not
resp
ond
by th
is de
adlin
e, th
e O
rgan
isers
will
ass
ume
that
Tes
t Ite
m a
nd B
lank
Mat
eria
l hav
e be
en re
ceiv
ed a
nd a
ccep
ted.
An
y pa
rtici
pant
s tha
t hav
e no
t rec
eive
d th
e Te
st It
ems b
y th
e 17
Mar
ch in
the
afte
rnoo
n, th
ey m
ust i
nfor
m th
e O
rgan
iser v
ia
e-m
ail (
EURL
-SRM
@cv
uas.b
wl.d
e). T
he O
rgan
iser
will
con
sult
the
ship
ping
com
pany
to
loca
lize
the
pack
age
and
decid
e on
fu
rthe
r act
ions
inclu
ding
new
ship
men
t, if
nece
ssar
y.
Sele
cted
par
ticip
ants
mig
ht b
e as
ked
to p
rovi
de in
form
atio
n on
the
con
ditio
n of
the
Tes
t Ite
m u
pon
rece
ipt
(e.g
. cor
e te
mpe
ratu
re o
f Tes
t Ite
m e
tc.).
- R
epor
ting
qual
itativ
e an
d qu
antit
ativ
e Re
sults
(Sub
-Pag
e 1
and
2)
To re
port
thei
r res
ults
, lab
orat
orie
s mus
t acc
ess t
he E
UPT
-SRM
12 R
esul
t Sub
mis
sion
Web
site
. Al
l res
ults
mus
t be
repo
rted
on
this
web
site
by 1
0 Ap
ril, 2
017
at 1
6 h
(CES
T). T
he w
ebsit
e w
ill n
ot b
e ac
cess
ible
afte
r thi
s de
adlin
e, a
nd a
ll re
sults
subm
itted
afte
rwar
ds w
ill n
ot b
e ac
cept
ed.
Befo
re e
nter
ing
the
resu
lts, p
leas
e st
udy
the
Targ
et P
estic
ide
List
car
eful
ly, i
n pa
rtic
ular
the
res
idue
def
initi
ons
that
ap
ply
to th
e EU
PT, w
hich
are
not
nec
essa
rily
give
n in
full
on th
e .
Resu
lt Su
bmis
sion
Web
site
The
follo
win
g fie
lds w
ill b
e av
aila
ble
for r
epor
ting
the
quan
titat
ive
resu
lts:
-
“Con
cent
ratio
n in
mg/
kg”:
the
pest
icid
e co
ncen
trat
ions
that
wou
ld b
e re
port
ed in
rout
ine
wor
k. R
esul
ts s
houl
d no
t be
rep
orte
d w
here
a p
estic
ide
was
not
det
ecte
d, o
r w
as d
etec
ted
belo
w th
e RL
(Rep
ortin
g Li
mit)
of t
he la
-bo
rato
ry o
r the
MRR
L. R
esul
ts re
port
ed a
s “<
RL”
or “
< #,
# m
g/kg
” w
ill b
e co
nsid
ered
as „
Not
Det
ecte
d”.
The
resid
ue le
vels
of th
e pe
stic
ides
mus
t be
repo
rted
in m
g/kg
usin
g th
e fo
llow
ing
sign
ifica
nt fi
gure
s:
Le
vels
<0.0
10 m
g/kg
to b
e ex
pres
sed
to 2
sign
ifica
nt fi
gure
s, e
.g. 0
.005
8 m
g/kg
;
Leve
ls ≥
0.01
0 m
g/kg
to b
e ex
pres
sed
to 3
sign
ifica
nt fi
gure
s, e
.g. 0
.156
, 1.6
4, 1
0.3
mg/
kg
Reco
very
-cor
rect
ed r
esul
ts s
houl
d be
rep
orte
d on
ly w
here
thi
s re
flect
s th
e ro
utin
e la
b’s
proc
edur
e; o
ther
wis
e th
e no
n-re
cove
ry-c
orre
cted
res
ult
shou
ld b
e re
port
ed.
Whe
re a
res
ult
was
cor
rect
ed f
or r
ecov
ery
the
ap-
Sp
ecifi
c Pr
otoc
ol |
EU
PT –
SRM
12 (2
017)
EU R
efer
ence
Lab
orat
ory
for S
ingl
e Re
sidu
e M
etho
ds (E
URL
-SRM
) CV
UA
Stut
tgar
t, Sc
hafla
ndst
r. 3/
2, D
E-70
736
Fellb
ach
Web
site:
ww
w.e
url-p
estic
ides
.eu,
E-M
ail:
EURL
-SRM
@cv
uas.
bwl.d
e Pa
ge 4
of 6
proa
ch(e
s) fo
llow
ed to
ach
ieve
this
corr
ectio
n (e
.g. s
tand
ard
addi
tions
to sa
mpl
e po
rtio
ns, p
roce
dura
l cal
ibra
tion,
re
cove
ry m
ust b
e re
port
ed in
the
resp
ectiv
e fie
lds
in S
ubpa
ge 3
fact
or, u
se o
f ILI
S).
-
“Con
c. in
bla
nk in
mg/
kg”:
con
cent
ratio
n va
lues
of a
ny p
estic
ides
from
the
Targ
et P
estic
ide
List
det
erm
ined
in
the
Blan
k M
ater
ial (
even
at l
evel
s bel
ow th
e M
RRL)
. -
“Exp
erie
nce
with
this
com
poun
d”: U
se th
e dr
opdo
wn-
men
u to
indi
cate
for h
ow m
any
year
s you
hav
e be
en a
na-
lysin
g fo
r eac
h co
mpo
und
usin
g th
e m
etho
d ap
plie
d in
this
EUPT
.
- Rep
ortin
g In
form
atio
n on
Ana
lytic
al M
etho
dolo
gy (S
ub-P
age
3)
On
sub-
page
3 o
f the
“EU
PT-S
RM12
Res
ult S
ubm
issi
on W
ebsi
te”
the
part
icip
atin
g la
bora
torie
s m
ust p
rovi
de C
OM
PLET
E in
form
atio
n on
the
ana
lytic
al m
etho
d(s)
app
lied
to a
ll pe
stic
ides
whi
ch w
ere
anal
ysed
, irr
espe
ctiv
e of
whe
ther
the
y w
ere
dete
cted
or n
ot.
The
part
icip
atin
g la
bora
torie
s ar
e ur
ged
to th
orou
ghly
fill-
in a
ll re
ques
ted
info
rmat
ion
and
cont
rol i
t car
eful
ly in
ord
er to
m
inim
ize
the
adm
inist
rativ
e bu
rden
of c
olle
ctin
g an
d co
rrec
ting
it a
post
erio
ri.
If no
suf
ficie
nt in
form
atio
n on
the
met
hodo
logy
use
d is
pro
vide
d, t
he O
rgan
iser
s re
serv
e th
e rig
ht n
ot t
o ac
cept
the
an
alyt
ical
resu
lts re
port
ed b
y th
e pa
rtic
ipan
t or t
o re
fuse
par
ticip
atio
n is
futu
re E
UPT
-SRM
s.
For
deta
iled
info
rmat
ion
on t
he c
olum
ns o
n su
b-pa
ge 3
ple
ase
refe
r to
the
det
aile
d Gu
ide
on R
esul
t Su
bmiss
ion
(htt
p://
ww
w.e
url-p
estic
ides
.eu/
libra
ry/d
ocs/
srm
/EU
PT-S
RM12
_Sho
rt_G
uide
_Sub
Page
s.pd
f).
Onc
e yo
ur re
sults
are
com
plet
ely
subm
itted
, ple
ase
expo
rt th
em v
ia th
e fu
nctio
n on
the
subm
issio
n M
ain
Page
as
a cs
v-fo
rmat
. Thi
s file
can
be
view
ed v
ia E
xcel
, and
you
can
eas
ily c
heck
you
r ent
ries s
tore
d in
the
data
base
. Su
bcon
trac
ting
The
follo
win
g ta
sk w
as su
bcon
trac
ted
to th
e EU
RL-C
F, S
øbor
g, D
enm
ark:
a)
Gene
ratio
n of
the
logi
n cr
eden
tials
b)
Adm
inist
ratio
n of
EU
PT-S
RM12
resu
lt su
bmiss
ion
web
site
Follo
w-u
p ac
tions
Afte
r the
dist
ribut
ion
of th
e EU
PT-S
RM12
Pre
limin
ary
Repo
rt ,
labo
rato
ries
with
poo
r res
ults
(hig
h ab
solu
te z
-sco
res,
false
ne
gativ
es o
r fa
lse p
ositi
ves)
will
be
aske
d to
pro
vide
info
rmat
ion
conc
erni
ng th
e re
ason
s fo
r th
is an
d po
ssib
le c
orre
ctiv
e ac
tions
. Thi
s in
form
atio
n w
ill b
e fo
rwar
ded
to t
he c
orre
spon
ding
NRL
-SRM
s up
on r
eque
st. A
ll EU
PT-S
RM12
-par
ticip
ants
ar
e w
elco
me
to a
sk th
e EU
RL-S
RM fo
r tec
hnic
al a
ssist
ance
. Th
e O
rgan
iser
mig
ht a
sk la
bora
torie
s to
pro
vide
miss
ing
met
hodo
logy
info
rmat
ion
that
is im
port
ant
for
the
eval
uatio
n an
d in
terp
reta
tion
of th
e PT
. Ac
cord
ing
to in
stru
ctio
ns b
y DG
-SAN
TE,
the
“Pro
toco
l for
man
agem
ent
of u
nder
perf
orm
ance
in c
ompa
rativ
e te
stin
g an
d/or
lack
of c
olla
bora
tion
of N
atio
nal R
efer
ence
Lab
orat
orie
s (N
RLs)
with
Com
mun
ity r
efer
ence
labo
rato
ries
(CRL
s)
activ
ities
” w
ill b
e fo
llow
ed b
y N
RLs.

EUPT-SRM12 | 2017 (Strawberry Purée)
A-58
Appendix 9 (cont.) Specific Protocol of EUPT-SRM12
Spec
ific
Prot
ocol
| E
UPT
– S
RM12
(201
7)
EU R
efer
ence
Lab
orat
ory
for S
ingl
e Re
sidu
e M
etho
ds (E
URL
-SRM
) CV
UA
Stut
tgar
t, Sc
hafla
ndst
r. 3/
2, D
E-70
736
Fellb
ach
Web
site:
ww
w.e
url-p
estic
ides
.eu,
E-M
ail:
EURL
-SRM
@cv
uas.
bwl.d
e Pa
ge 5
of 6
Do
cum
ents
All d
ocum
ents
rela
ted
to th
e EU
PT–S
RM12
can
be
foun
d in
the
EURL
-Doc
umen
t Rep
osito
ry (C
IRCA
-BC)
. Lin
ks to
the
doc-
umen
ts c
an a
lso b
e fo
und
in th
e EU
PT-S
RM12
Web
site
. Fo
r fur
ther
info
rmat
ion
plea
se c
onta
ct th
e or
gani
zers
EU
RL-S
RM@
cvua
s.bw
l.de
Plea
se c
heck
the
EUPT
-SRM
12 W
ebsi
te b
efor
e st
artin
g w
ith th
e an
alys
is to
mak
e su
re th
at y
ou h
ave
the
late
st v
ersi
on o
f al
l doc
umen
ts a
vaila
ble.
In c
ase
of m
ajor
cha
nges
the
part
icip
ants
will
be
info
rmed
via
e-m
ail.
Part
icip
atio
n fe
es a
nd p
aym
ent d
etai
ls
To c
over
the
cos
ts o
f pro
duct
ion,
han
dlin
g an
d sh
ipm
ent
of t
he P
T-M
ater
ials
the
follo
win
g fe
es w
ill b
e ch
arge
d fo
r on
e un
it of
the
PT-M
ater
ial t
o th
e pa
rtic
ipat
ing
labo
rato
ries:
- OfL
s (in
clud
ing
NRL
s) fr
om E
U c
ount
ries,
EU-c
andi
date
cou
ntrie
s and
EFT
A co
untr
ies:
250
€
- Lab
s bas
ed in
third
cou
ntrie
s: 3
50 €
An
invo
ice
issu
ed t
o th
e "i
nvoi
ce a
ddre
ss"
stat
ed in
the
regi
stra
tion
form
will
be
sent
to th
e e-
mai
l add
ress
of t
he in
-vo
ice
reci
pien
t sta
ted
durin
g re
gist
ratio
n. S
houl
d th
e pa
ymen
t bei
ng ta
ken
care
of b
y an
othe
r dep
artm
ent/
inst
itutio
n,
the
reci
pien
t of
the
invo
ice
is r
eque
sted
to
forw
ard
the
invo
ice
acco
rdin
gly.
Det
ails
of
paym
ent
will
be
give
n in
the
in
voic
es.
Paym
ent i
s exp
ecte
d to
be
mad
e w
ithin
30
days
upo
n th
e da
te o
f shi
pmen
t.
If fo
r any
reas
on p
aym
ent c
anno
t be
carr
ied
out b
efor
e th
is d
ate,
ple
ase
cont
act t
he O
rgan
izer t
o gi
ve e
xpla
natio
ns.
If no
pay
men
t or n
o pr
oof o
f pay
men
t is
rece
ived
and
no
expl
anat
ion
is g
iven
to th
e O
rgan
izers
, the
Org
anize
rs re
serv
e th
e rig
ht to
exc
lude
the
resu
lts o
f the
con
cern
ed la
bora
torie
s fr
om th
e Fi
nal E
UPT
-Rep
ort
or to
ref
use
part
icip
atio
n in
fu
ture
EU
PT-S
RMs.
Ba
nk D
etai
ls:
Bank
acc
ount
hol
der:
La
ndes
ober
kass
e Ba
den
Wue
rtte
mbe
rg
Bank
Nam
e :
Bade
n W
uert
tem
berg
isch
e Ba
nk
IBAN
: DE
02
6005
010
1 74
95 5
301
02
BIC/
SWIF
T:
SOLA
DEST
XXX
Paye
e id
entif
icat
ion
text
:
VAT
of C
VUA
Stut
tgar
t
See
invo
ice
(impo
rtan
t and
MU
ST b
e in
dica
ted!
)
DE 8
11 6
00 5
10
To fa
cilit
ate
trac
king
of m
oney
tran
sfer
the
spec
ial p
ayee
iden
tific
atio
n te
xt (=
invo
ice
num
ber)
as
show
n in
th
e in
voic
e M
UST
be
indi
cate
d in
the
rem
ittan
ce.
Mor
e de
tails
for b
ank-
rem
ittan
ce w
ill b
e gi
ven
in th
e in
voic
es.
Cale
ndar
of E
UPT
-SRM
12
(ple
ase
see:
htt
p://
ww
w.e
url-p
estic
ides
.eu/
user
files
/file
//EU
PT-S
RM12
_Cal
enda
r.pdf
)
Targ
et P
estic
ides
List
of E
UPT
-SRM
12
(ple
ase
see:
htt
p://
ww
w.e
url-p
estic
ides
.eu/
user
files
/file
//EU
PT-S
RM12
_Tar
getP
estic
ideL
ist.p
df)
Sp
ecifi
c Pr
otoc
ol |
EU
PT –
SRM
12 (2
017)
EU R
efer
ence
Lab
orat
ory
for S
ingl
e Re
sidu
e M
etho
ds (E
URL
-SRM
) CV
UA
Stut
tgar
t, Sc
hafla
ndst
r. 3/
2, D
E-70
736
Fellb
ach
Web
site:
ww
w.e
url-p
estic
ides
.eu,
E-M
ail:
EURL
-SRM
@cv
uas.
bwl.d
e Pa
ge 6
of 6
Co
ntac
t inf
orm
atio
n
EU R
efer
ence
Lab
orat
ory
for S
ingl
e Re
sidu
e M
etho
ds (E
URL
-SRM
) Ch
emisc
hes u
nd V
eter
inär
unte
rsuc
huns
amt S
tutt
gart
Sc
hafla
ndst
r. 3/
2,
D-
7073
6 Fe
llbac
h
Germ
any
e-m
ail:
EURL
-SRM
@cv
uas.
bwl.d
e
Fax:
+49
342
6 11
24
Org
anis
ing
Gro
up a
t the
EU
RL-S
RM (S
tutt
gart
)
Mic
hela
ngel
o An
asta
ssia
des
phon
e: +
49 3
426
1124
Pa
t Sch
reite
r ph
one:
+49
342
6 10
29
Anne
Ben
kens
tein
ph
one:
+49
342
6 11
51
Hube
rt Z
ippe
r ph
one:
+49
342
6 11
41
Anja
Bar
th
phon
e: +
49 3
426
1935
Gi
ovan
na C
erch
ia
phon
e: +
49 3
426
1114
Ad
viso
ry G
roup
Amad
eo F
erná
ndez
-Alb
a EU
RL-F
V, U
nive
rsity
of A
lmer
ía, E
S M
igue
l Gam
ón
EURL
-FV,
Lab
orat
orio
Agr
oalim
enta
rio G
ener
alita
t Val
enci
ana,
ES
Met
te E
reci
us P
oulse
n EU
RL-C
F, N
atio
nal F
ood
Inst
itute
, DTU
, Søb
org,
DK
Ralf
Lipp
old
EURL
-AO
, CVU
A Fr
eibu
rg, D
E Ph
ilipp
e Gr
os
Serv
ice
Com
mun
des
Lab
orat
oire
s (SC
L) /
Labo
rato
ire d
e M
ontp
ellie
r, FR
M
agnu
s Jez
usse
k Ba
varia
n He
alth
and
Foo
d Sa
fety
Aut
horit
y (L
GL),
Erla
ngen
, DE
Andr
é de
Kok
N
ethe
rland
s Foo
d an
d Co
nsum
er P
rodu
ct S
afet
y Au
thor
ity (N
VWA)
, Am
ster
dam
, NL
Sonj
a M
asse
lter
Aust
rian
Agen
cy fo
r Hea
lth a
nd F
ood
Safe
ty, I
nnsb
ruck
, AT
Fi
nbar
r O’R
egan
Pe
stici
de C
ontr
ol La
bora
tory
(PCL
), De
pt. o
f Agr
icultu
re, F
ood
and
the
Mar
ine
(DAF
M) I
R Tu
ija P
ihlst
röm
Sw
edish
Nat
iona
l Foo
d Ag
ency
(Liv
smed
elsv
erke
t), U
ppsa
la, S
E Ca
rmel
o Ro
dríg
uez
Uni
vers
ity o
f Alm
ería
, Spa
in
Qua
lity
Cont
rol G
roup
Anto
nio
Valv
erde
Uni
vers
ity o
f Alm
ería
, ES
Paul
a M
edin
a
EF
SA, P
arm
a, E
U

Appendix 10. Calendar and Target Pesticides List of EUPT-SRM12
A-59
Cale
nd
ar a
nd
T a
rgeT
Pes
TiCi
de l
isT
a10
EU R
efer
ence
Lab
orat
ory
Requ
iring
Sin
gle
Resi
due
Met
hods
(EU
RL-S
RM)
CVU
A St
uttg
art,
Scha
fland
str.
3/2,
DE-
7073
6 Fe
llbac
h, G
erm
any
Web
site:
ww
w.e
url-p
estic
ides
.eu,
E-M
ail:
eurl-
srm
@cv
uas.
bwl.d
e Pa
ge 1
of 1
TARG
ET P
ESTI
CIDE
LIST
fo
r the
EU
PT –
SRM
12 2
017,
Str
awbe
rry
Puré
e re
leas
ed o
n 16
.12.
2016
Com
poun
ds P
oten
tially
Pre
sent
in T
est I
tem
In
MAC
P M
RRL
(mg/
kg)
Com
puls
ory
Com
poun
ds (w
ill b
e co
nsid
ered
in C
ateg
ory
A/B
clas
sific
atio
n)
2,4-
D (fr
ee a
cid,
no
hydr
olys
is st
ep to
be
appl
ied)
M
ACP-
Reg.
0.
01
Abam
ectin
(ave
rmec
tin B
1a)
MAC
P-Re
g.
0.01
Capt
an (p
aren
t onl
y)
MAC
P-Re
g.
0.01
Chlo
roth
alon
il M
ACP-
Reg.
0.
01
Cyro
maz
ine
MAC
P-Re
g.
0.01
Dith
ioca
rbam
ates
(exp
ress
ed a
s CS2
) M
ACP-
Reg.
0.
03
Ethe
phon
M
ACP-
Reg.
0.
02
Fenb
utat
in O
xide
M
ACP-
Reg.
0.
01
Flua
zifo
p (fr
ee a
cid,
no
hydr
olys
is st
ep to
be
appl
ied)
M
ACP-
Reg.
0.
01
Folp
et (p
aren
t onl
y)
MAC
P-Re
g.
0.01
Gly
phos
ate
(par
ent o
nly)
M
ACP-
Reg.
0.
03
Halo
xyfo
p (fr
ee a
cid,
no
hydr
olys
is st
ep to
be
appl
ied)
M
ACP-
Reg.
0.
01
Prop
amoc
arb
MAC
P-Re
g.
0.01
Addi
tiona
l Dat
a Co
llect
ion
for i
nfor
mat
ive
purp
oses
(not
for s
corin
g)
Capt
an (s
um) (
sum
of c
apta
n an
d TH
PI, e
xpre
ssed
as c
apta
n)
MAC
P-Re
g.
Folp
et (s
um) (
sum
of f
olpe
t and
pht
alim
ide,
exp
ress
ed a
s fol
pet)
M
ACP-
Reg.
THPI
M
ACP-
Reg.
Phta
limid
e M
ACP-
Reg.
Opt
iona
l Com
poun
ds (w
ill N
OT
be c
onsi
dere
d in
Cat
egor
y A/
B cl
assi
ficat
ion)
AMPA
M
ACP-
WD
0.03
Bife
naza
te (s
um) (
sum
of b
ifena
zate
plu
s bife
naza
te-d
iaze
ne e
xpre
ssed
as b
ifena
zate
) M
ACP-
WD
0.02
Brom
ide
ion
MAC
P-Re
g.
3.0
Carb
ofur
an (p
art o
f sum
) (su
m o
f car
bofu
ran,
car
bosu
lfan,
ben
fura
carb
or f
urat
hioc
arb
expr
esse
d as
car
bofu
ran)
; 3-
OH-
carb
ofur
an is
not
to b
e co
nsid
ered
with
in th
is e
xerc
ize!
MAC
P-Re
g.
0.00
1
Chlo
rate
M
ACP-
WD
0.02
Dith
iano
n M
ACP-
Reg.
0.
02
Phos
phon
ic a
cid
M
ACP-
Reg.
0.
05
N-A
cety
l-Gly
phos
ate
MAC
P-W
D 0.
02
MAC
P =
EU M
ulti-
Annu
al C
oord
inat
ed C
ontr
ol P
rogr
am;
MAC
P-Re
g.: M
ACP
Regu
latio
n; M
ACP-
WD:
MAC
P W
orki
ng D
ocum
ent
Not
e: T
his
docu
men
t may
be
subj
ect t
o m
inor
cha
nges
. In
case
of s
igni
fican
t cha
nges
the
orga
nize
rs w
ill s
end
e-m
ails
. In
any
case
ple
ase
chec
k ou
r web
site
perio
dica
lly to
mak
e su
re y
ou a
re u
sing
the
late
st a
vaila
ble
vers
ion.
For a
ny fu
rthe
r cla
rific
atio
n do
n’t h
esita
te to
con
tact
us u
nder
eur
l-srm
@cv
uas.
bwl.d
e
The
EUPT
-SRM
12 O
rgan
isin
g Te
am
Appendix 10 Calendar and Target Pesticides List of EUPT-SRM12
EU R
efer
ence
Lab
orat
ory
Requ
iring
Sin
gle
Resi
due
Met
hods
(EU
RL-S
RM)
CVU
A St
uttg
art,
Scha
fland
str.
3/2,
DE-
7073
6 Fe
llbac
h, G
erm
any
Web
site:
ww
w.e
url-p
estic
ides
.eu,
E-M
ail:
EURL
-SRM
@cv
uas.
bwl.d
e Pa
ge 1
of 1
CC AALL EE
NNDD
AARR
ff oorr tt
hh ee EE
UUPP TT
–– SS
RR MM11 22
St
raw
berr
y Pu
rée
(upd
ate
on 1
7 Ja
nuar
y, 2
017)
Activ
ity
Who
? Da
tes
Ope
ning
of t
he E
UPT
-SRM
12 W
ebsi
te
with
link
s to
all r
elev
ant d
ocum
ents
(L
ist o
f obl
iged
labs
, Cal
enda
r, Ta
rget
Pes
ticid
es L
ist,
Gen
eral
Pro
toco
l) EU
RL-S
RM
16 D
ec.,
2016
Regi
stra
tion
via
“EU
PT-R
egis
trat
ion
Web
site
”
(Not
e: o
blig
ed O
fLs M
UST
ent
er th
is W
ebsit
e an
d ei
ther
regi
ster
or g
ive
expl
anat
ions
for n
on-p
artic
ipat
ion)
All L
abor
ator
ies i
nter
este
d to
par
ticip
ate
and
all o
blig
ed
labs
1 eve
n if
not i
nter
este
d 17
Jan.
– 1
0 Fe
b. 2
017
Disp
atch
of E
UPT
-SRM
12-S
peci
fic P
roto
col
EURL
-SRM
Fe
b. 2
017
Prep
arat
ion
of E
UPT
-SRM
12-T
est I
tem
(p
relim
inar
y te
sts S
piki
ng /
Hom
ogen
izatio
n)
EURL
-SRM
N
ov. 2
016
– Fe
b. 2
017
Hom
ogen
eity
Tes
ts
EURL
-SRM
Ja
n. –
Feb
. 201
7
Stab
ility
Tes
ts
EURL
-SRM
M
arch
– M
ay 2
017
Ship
men
t of E
UPT
-SRM
12 T
est I
tem
(+
rem
inde
r of u
pcom
ing
parc
el a
rriv
al)
EURL
-SRM
13
Mar
ch, 2
017
Conf
irmat
ion
of S
ampl
e Re
ceip
t and
Acc
epta
nce
via
“EU
PT-S
RM12
Res
ult S
ubm
issi
on W
ebsi
te",
(S
ub-P
age
0)
Part
icip
atin
g La
bs
with
in 4
8 h
of re
ceip
t
Resu
lt Su
bmis
sion
(P
estic
ide
scop
e, R
esul
ts, M
etho
d In
fo) i
n
“EU
PT-S
RM12
Res
ult S
ubm
issi
on W
ebsi
te",
(S
ub-P
ages
1 –
3)
Part
icip
atin
g La
bs
20 M
arch
– 1
0 Ap
r. 2
017
Prel
imin
ary
Repo
rt
(onl
y co
mpi
latio
n of
resu
lts)
EURL
-SRM
M
ay 2
017
EUPT
Eva
luat
ion
Mee
ting
EUPT
-SC,
DG-
SAN
TE
–
Surv
ey to
col
lect
reas
ons f
or u
nder
perf
orm
ance
an
d m
issin
g in
form
atio
n on
met
hods
EU
RL-S
RM /
Pa
rtic
ipat
ing
Labs
M
ay/J
une
2017
Fina
l Rep
ort
EURL
-SRM
De
c. 2
017
REM
ARK:
Ple
ase
note
that
the
date
s men
tione
d ab
ove
may
be
subj
ect t
o m
inor
cha
nges
. In
the
case
of c
hang
es th
e pa
r-tic
ipan
ts w
ill b
e in
form
ed v
ia e
-mai
l. Bu
t ple
ase,
still
che
ck p
erio
dica
lly o
ur w
ebsi
te fo
r pos
sible
upd
ates
in c
ase
the
emai
l doe
s not
get
thro
ugh
to y
ou.
Cont
act:
eurl-
srm
@cv
uas.
bwl.d
e
The
EUPT
-SRM
Tea
m
1 T
hese
are
OfL
s of E
U M
S th
at a
re c
onsid
ered
obl
iged
to p
artic
ipat
e (p
leas
e re
fer t
o th
e in
vita
tion
lett
er fo
r mor
e de
tails
)


European Union Reference Laboratoryfor pesticides requiring Single Residue Methods (EURL – SRM)hosted at Chemisches Veterinäruntersuchungsamt Stuttgart (CVUA Stuttgart)
Schafl andstr. 3/270736 FellbachGermany
Tel: + 49 711 3426 1124Fax: + 49 711 58 81 76
http://www.srm.eurl-pesticides.eue-mail: [email protected]