Embed Size (px)
Citation preview

Assessing the Short-term Forecasting Power of Confidence Indices
Euler Pereira G. de Mello and Francisco Marcos R. Figueiredo
December, 2014
371

ISSN 1518-3548 CGC 00.038.166/0001-05
Working Paper Series Brasília n. 371 December 2014 p. 1-17

Working Paper Series
Edited by Research Department (Depep) – E-mail: [email protected]
Editor: Francisco Marcos Rodrigues Figueiredo – E-mail: [email protected]
Editorial Assistant: Jane Sofia Moita – E-mail: [email protected]
Head of Research Department: Eduardo José Araújo Lima – E-mail: [email protected]
The Banco Central do Brasil Working Papers are all evaluated in double blind referee process.
Reproduction is permitted only if source is stated as follows: Working Paper n. 371.
Authorized by Carlos Hamilton Vasconcelos Araújo, Deputy Governor for Economic Policy.
General Control of Publications
Banco Central do Brasil
Comun/Dipiv/Coivi
SBS – Quadra 3 – Bloco B – Edifício-Sede – 14º andar
Caixa Postal 8.670
70074-900 Brasília – DF – Brazil
Phones: +55 (61) 3414-3710 and 3414-3565
Fax: +55 (61) 3414-1898
E-mail: [email protected]
The views expressed in this work are those of the authors and do not necessarily reflect those of the Banco Central or
its members.
Although these Working Papers often represent preliminary work, citation of source is required when used or reproduced.
As opiniões expressas neste trabalho são exclusivamente do(s) autor(es) e não refletem, necessariamente, a visão do Banco
Central do Brasil.
Ainda que este artigo represente trabalho preliminar, é requerida a citação da fonte, mesmo quando reproduzido parcialmente.
Citizen Service Division
Banco Central do Brasil
Deati/Diate
SBS – Quadra 3 – Bloco B – Edifício-Sede – 2º subsolo
70074-900 Brasília – DF – Brazil
Toll Free: 0800 9792345
Fax: +55 (61) 3414-2553
Internet: <http//www.bcb.gov.br/?CONTACTUS>

Assessing the Short-term Forecasting Power of Confidence
Indices*
Euler Pereira G. de Mello**
Francisco Marcos R. Figueiredo**
Abstract
This Working Paper should not be reported as representing the views of the Banco
Central do Brasil. The views expressed are those of the authors and
do not necessarily reflect those of the Banco Central do Brasil.
This paper assesses the predictive power of the main confidence indices
available in Brazil to forecast economic activity. More specifically, we
consider a set of economic activity variables and, for each of those, compare
the predictive power of a univariate autoregressive model to that of a similar
model that includes confidence index. Preliminary results using the Diebold
Mariano test suggest that the Industry Confidence Index (ICI) provides
relevant information, for both present and the near future, on some economic
activity variables of interest to the economic agents.
Keywords: confidence indices, economic activity, forecasting.
JEL Classification: C32, E17, E27
* The authors would like thank the Depec/Coace staff for their suggestions, comments, and help in
constructing the data set. ** Research Department (Depep), Banco Central do Brasil.
3

1. Introduction
A proper assessment of the current level of economic activity is of utmost
importance to the decisions of the economic agents. Nonetheless, measures of economic
activity are released with some time lag, leading agents to search for leading/coincident
indicators to help their decision-making process. An important class of such measures is
composed of confidence indices, measures that aim at capturing the perception of
determined groups of economic agents about the current and future development of some
key variables.
A relevant empirical question is, thus, whether confidence indices contain any
piece of relevant information about the current/future behavior of the level / rate of growth
of economic activity. As shown in Curtin (2000), this issue has been under debate since
the release of the first confidence surveys1. There is still no consensus in the literature,
but, according to Dées and Brinca (2013), most authors find a statistically significant
relationship between measures of confidence and the current and future behavior of
economic variables. Mourogane and Roma (2003), Ludvigson (2004) and Wilcox (2007)
for the US, Kwan and Cotsomitis (2006) for Canada and Easaw and Heravi (2004) for the
UK find that consumers confidence tends to reduce forecasting errors of models that
include traditional macroeconomic variables. On the other hand, Smith (2009) for the
UK, Al-Eyd et al. (2009) for OECD countries and Claveria et al. (2007) for Euro area
members show that the predictive power of those indices is weak and limited to a few
cases, or even inexistent.
In Brazil, the increasing importance given to confidence indices is reflected in
both the increase in the number of confidence indices and in the amount of media
coverage dedicated to their release. Nonetheless, there is a lack of research on assessing
the relevance of those indicators to help predicting current/future economic variables.
Such an assessment is relevant for the design and implementation of monetary policy,
since it tries to indentify the potential of those indices to provide additional pieces of
information about the current state of the economy and signals about its future path.
1 George Katona at the University of Michigan’s Survey Research Center constructed the first consumer
survey in 1946. This was the precursor to the University of Michigan’s Index of Consumer Sentiment.
Using the 1953 sample of this survey, Klein and Lansing (1955) found that surveys questions on buying
intentions, feeling of financial well-being and price expectations predict consumer expenditures on durable
goods.
4

For the Brazilian case, one of the few papers is that of Bentes (2006), which aims
at identifying the predictive power of the Consumer Confidence Index (ICC), computed
by the Federação de Bens, Serviços e Turismo (Fecomercio) do Estado de São Paulo,
with respect to different consumption categories, after controlling for some
macroeconomic variables, such as unemployment, industrial production and inflation.
The results obtained by that author are highly heterogeneous, with emphasis on the
positive effect for automobiles.
This paper aims at taking a step towards assessing the predictive power of the
main confidence indices available for the Brazilian economy as a whole. More
specifically, the proposed exercise is to consider a set of economic activity variables and,
for each of those, compare the predictive power of a univariate autoregressive model
against a similar model that on top of the autoregressive part includes an appropriate
confidence index. Our preliminary results point out that the Industry Confidence Index
(ICI) provides relevant information, for both present and the near future, on some
economic activity variables of interest to the economic agents.
An important limitation of confidence measures is that those are subjective
assessments, which might stem from a mix statistical modeling and judgment, of the
current and future environment where economic agents make their decisions.
Furthermore, as shown by Dominitz and Manski (2004), such indices might be
contaminated by measurement errors since their survey questions might be ambiguous
and their qualitative aspect might hinder quantitative assessments. Anyhow, we follow
the literature and assume that the indices used in this paper are good approximations for
the agents’ perceptions about the economic environment and, hence, would be good
candidates for improving the prediction of economic activity variables.
The sections of this paper are organized as following. In the next section, we
describe both the confidence indices and the variables used by this work to measure the
Brazilian economic activity. Section 3 describes the methodology and our estimation
strategy. We present our results in section 4, while we conclude and discuss further
extensions in section 5.
5

2. Data
Currently, there are several confidence indices available for the Brazilian
economy. In the top half of Table 1, we present the confidence indices considered in this
paper. From Fundação Getulio Vargas (FGV), we included the confidence indices based
on the Consumer Survey (the Consumer Confidence Index – ICC and the Coincident
Indicator of Unemployment - ICD) and the Manufacturing Industry Survery (Industry
Confidence Index – ICI and the confidence indices for the capital goods and for the
construction material sectors). We also consider two other consumer confidence indices
for our analysis: the National Confidence Index (INC), from the Associação de Comércio
de São Paulo (ACSP); National Consumer Confidence Index (INEC), from the
Confederação Nacional da Indústria (CNI). Finally, we include the Business Confidence
Index (ICEI) from CNI and the Markit’s Purchasing Manager’s Index (PMI).
There are other confidence indices for the Brazilian that were not included in our
analyzes, either because they do not cover the country as a whole (e.g., the Consumer
Confidence Index of Rio Grande do Sul, from the Centro de Estudos e Pesquisas em
Administração da Universidade Federal do Rio Grande do Sul) or, because their time span
is too short (e.g., Services Sector Survey and the Construction Survey, from FGV).
Table 1: Confidence indices and measures of activity level used in the analysis
Variable a) Acronym Source Frequency
Releasing date*
for period t
Confidence indices
Industry Confidence Index ICI FGV Monthly 25th of month t
Industry Confidence Index - Capital Goods BK.ICI FGV Monthly 25th of month t
Industry Confidence Index - Construction Material MC.ICI FGV Monthly 25th of month t
Consumer Confidence Index ICC FGV Monthly 25th of month t
Coincident Indicator of Unemployment ICD FGV Monthly 10th of month t+1
Purchasing Manager's Index PMI Markit Monthly 1st of month t+1
National Confidence Index INC ACSP Monthly 10th of month t+1
National Consumer Confidence Index b)
INEC CNI Quarterly b)
30th of month t
Business Confidence Index b)
ICEI CNI Quarterly b)
15th of month t
Activity Level Variables
Physical Production Index for Manufacturing Industry PIM - Manufacturing PIM/IBGE Monthly 1st of month t+2
Physical Production Index for Civil for Construction Materials PIM - Construction PIM/IBGE Monthly 1st of month t+2
Physical Production Index for Capital Goods PIM - Capital Goods PIM/IBGE Monthly 1st of month t+2
Unemployment Rate Unemployment PME/IBGE Monthly 10th of month t+2
Retail Sales Volume Index PMC - Restrict PMC/IBGE Monthly 15th of month t+2
Extended Retail Sales Volume Index PMC - Extended PMC/IBGE Monthly 15th of month t+2
Househol Consumption Expenditures in GDP GDP - Consumption SCN/IBGE Quarterly At the end of the second month of t+1
Manufacturing Industry in GDP GDP - Manufacturing SCN/IBGE Quarterly At the end of the second month of t+1
Civil Construction in GDP GDP - Constuction SCN/IBGE Quarterly At the end of the second month of t+1
Gross Fixed Capital formation in GDP GDP - FBCF SCN/IBGE Quarterly At the end of the second month of t+1
a) Seasol adjusted data. INC, INEC and ICEI were seasonal adjutes by the authors using X12-ARIMA.
b) Data was transformed into quarterly series since 2010 using quarterly averages.
* Approximation based on the latest releases.
Sources: Fundação Getúlio Vargas (FGV), Markit, Associação Comercial de São Paulo (ACSP) and survey from Instituto Brasileiro de Geografia e Estatística (IBGE): Monthly Survey of Industry -
Physical Production (PIM), Monthly Employment Survey (PME), Monthly Survey of Trade (PMC) and National Accounts System (SCN).
6

Table 1 also shows the variables used to capture the level of economic activity,
computed by the Instituto Brasileiro de Geografia e Estatística (IBGE). From the Monthly
Survey of Industry (PIM), the Physical Production Indices for Manufacturing, Capital
Goods and Construction Materials were used2. From the Monthly Survey of Trade
(PMC), we considered the Extended Retail Sales Volume Index (PMC – Extended),
which includes vehicles and construction inputs, and the (restrict) Retail Sales Volume
Index (PMC– Restrict). Regarding the Quarterly National Accounts, the GDP
components for household consumption expenditures, manufacturing industry, civil
construction industry and gross fixed capital formation were used.
2 The data from PIM have suffered a change in the methodology, to incorporate the classification CNAE
2.0, from IBGE. The original series were discontinued Feb 2014. Using the new classification, the starting
date would be 2002, thus, in order to have more data, for those series from PIM, we chose to keep using
the original series and stop our analyses at February 2014.
Table 2: Descriptive Statistics of confidence indices and activity level measures
ICI Apr/1995 233 98,8 10,4 69,5 117,5
ICI - Current Situation (ICI - ISA) Apr/1995 233 99,1 11,8 67,3 121,3
ICI - Expectations (ICI - IE) Apr/1995 233 98,5 9,5 71,7 116,6
BK.ICI Apr/1995 233 95,9 18,7 51,1 128,2
BK.ICI - Current Situation (BK.ICI - ISA) Apr/1995 233 96,7 21,4 45,6 139,4
BK.ICI - Expectations (BK.ICI - IE) Apr/1995 233 95,0 17,4 47,2 124,8
MC.ICI Apr/1995 233 102,3 13,9 55,8 136,7
MC.ICI - Current Situation (MC.ICI - ISA) Apr/1995 233 102,5 14,9 42,8 143,6
MC.ICI - Expectations (MC.ICI - IE) Apr/1995 233 102,1 14,4 68,3 129,7
ICC Sep/2005 108 112,0 7,5 94,7 127,8
ICC - Current Situation (ICC - ISA) Sep/2005 108 119,5 15,1 96,8 147,8
ICC - Expectations (ICC - IE) Sep/2005 108 108,0 5,2 93,1 119,4
ICD Sep/2008 106 78,4 14,4 60,4 101,9
PMI Nov/2005 103 51,0 3,6 38,1 57,8
INC Apr/2005 113 141,1 13,8 113,9 170,7
INEC 1st
Q/2001 54 109,8 4,9 97,1 117,8
ICEI 2nd
Q/1999 61 58,0 4,9 46,9 69,7
PIM - Manufacturing Jan/1995 230 109,0 13,4 87,3 130,8
PIM - Construction Material Jan/1995 230 109,8 13,1 87,0 137,1
PIM - Capital Goods Jan/1995 230 129,9 38,3 76,0 198,8
Unemployment Mar/2002 146 8,5 2,4 4,6 13,2
PMC - Restrict Jan/2000 175 77,9 20,8 53,5 116,2
PMC - Extended Jan/2003 139 81,2 21,2 49,6 114,8
GDP 1st
Q/1996 69 128,2 21,1 100,1 165,3
GDP - Household Consumption 1st
Q/1996 74 131,3 25,8 98,5 178,7
GDP - Manufacturing 1st
Q/1996 74 113,8 12,3 94,0 132,9
GDP - Construction 1st
Q/1996 74 123,9 18,8 101,3 160,4
GDP - GFCF 1st
Q/1996 74 130,0 32,1 93,5 189,4
Maximum
Sources: Fundação Getúlio Vargas (FGV), Markit, Associação Comercial de São Paulo (ACSP) e Instituto Brasileiro de Geografia e
Estatística (IBGE). For ICI, current situation and expectations have weight 50%, for the ICC current situation and expectation have weight 2/5
and 3/5, respectively. Further information can be obtained from the methodological notes available at FGV's site.
MinimumVariableBeginning of
the sampleObs. Mean
Standard
deviation
Confidence Indices
Monthly
Quarterly
Activity Level Variables
Monthly
Quarterly
7

The sample considered in this paper was determined by the availability of the
confidence indices, and thus, varies depending on the particular index at study. Table 2
shows the starting point of the sample for each index, the total number of observations
and some descriptive statistics. In some sense, this table also helps emphasizing three
limitations of this paper. First, the available time series have a relative short time span
(ranging from 50 to 222 observations), which might hinder the power of our tests. Second,
confidence indices are qualitative, usually summarized in a scale from 0 to 200, values
higher than 100 indicating optimism3. Therefore, the relationship between the confidence
index and the predicted variable could depend on the level of the confidence index (with
different patterns depending whether the actual level is lower or higher than 100),
something that is not explored in this paper. Finally, this paper only considers some of
the several possible relationships that could be tested, though it focus on the simplest and
less subjective type of forecasting models.
In the next section, we will describe our strategy to test the predictive power of
the aforementioned confidence indices.
3. Methodology and estimation strategy
As mentioned before, this paper considers a set of variables concerning the growth
rate of economic activity and for each of them, compares the predictive power of a
univariate autoregressive model (equation 1) against the predictive power of a similar
model that includes a confidence index (equation 2):
Univariate: 𝑦𝑡+ℎ = 𝛼 + 𝛽𝑖 ∑ 𝑦𝑡−𝑖 +𝑃𝑖=1 𝜀𝑡+ℎ (1)
Extendend model: 𝑦𝑡+ℎ = 𝛼 + 𝛽𝑖 ∑ 𝑦𝑡−𝑖 + 𝛾𝑗 ∑ 𝑖𝑐𝑡−𝑗 +𝐾𝑗=0
𝑃𝑖=1 𝜀𝑡+ℎ (2)
where 𝑦𝑡 = ∆ln Yt, 𝑖𝑐𝑡 = ∆ln 𝐼𝐶𝑡. Yt is period’s t value of the variable capturing
the level of economic activity and 𝐼𝐶𝑡 is period’s t value of the confidence index.
The forecasting horizon for the above equations is h.
3 Nonetheless, there are exceptions, e.g., the Purchasing Managers’ Index (PMI) and the Business
Confidence Index (ICEI), which range from 0 to 100, values of 50 or higher would be considered optimism.
8
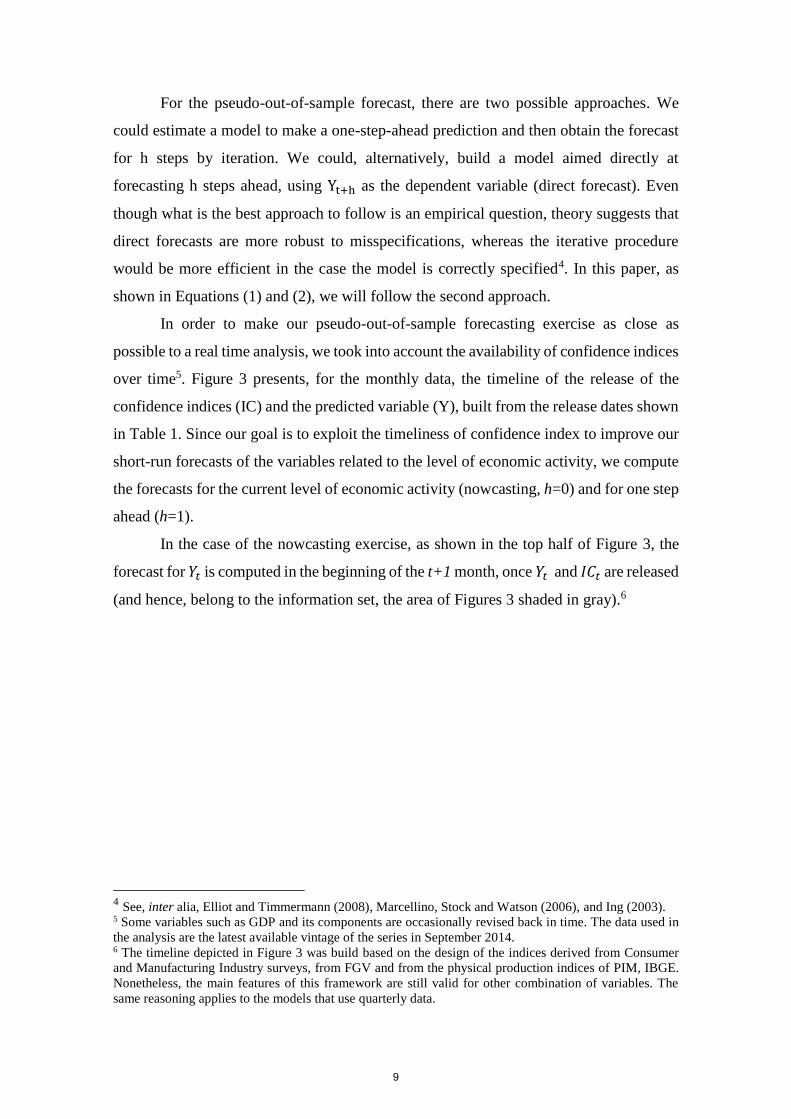
For the pseudo-out-of-sample forecast, there are two possible approaches. We
could estimate a model to make a one-step-ahead prediction and then obtain the forecast
for h steps by iteration. We could, alternatively, build a model aimed directly at
forecasting h steps ahead, using Yt+h as the dependent variable (direct forecast). Even
though what is the best approach to follow is an empirical question, theory suggests that
direct forecasts are more robust to misspecifications, whereas the iterative procedure
would be more efficient in the case the model is correctly specified4. In this paper, as
shown in Equations (1) and (2), we will follow the second approach.
In order to make our pseudo-out-of-sample forecasting exercise as close as
possible to a real time analysis, we took into account the availability of confidence indices
over time5. Figure 3 presents, for the monthly data, the timeline of the release of the
confidence indices (IC) and the predicted variable (Y), built from the release dates shown
in Table 1. Since our goal is to exploit the timeliness of confidence index to improve our
short-run forecasts of the variables related to the level of economic activity, we compute
the forecasts for the current level of economic activity (nowcasting, h=0) and for one step
ahead (h=1).
In the case of the nowcasting exercise, as shown in the top half of Figure 3, the
forecast for 𝑌𝑡 is computed in the beginning of the t+1 month, once 𝑌𝑡 and 𝐼𝐶𝑡 are released
(and hence, belong to the information set, the area of Figures 3 shaded in gray).6
4 See, inter alia, Elliot and Timmermann (2008), Marcellino, Stock and Watson (2006), and Ing (2003). 5 Some variables such as GDP and its components are occasionally revised back in time. The data used in
the analysis are the latest available vintage of the series in September 2014. 6 The timeline depicted in Figure 3 was build based on the design of the indices derived from Consumer
and Manufacturing Industry surveys, from FGV and from the physical production indices of PIM, IBGE.
Nonetheless, the main features of this framework are still valid for other combination of variables. The
same reasoning applies to the models that use quarterly data.
9

For the one-step-ahead forecasting, since it is computed at the same point in time
as the nowcasting, the information set is the same as before, the only change is that the
predicted variable is 𝑌𝑡+1 instead of 𝑌𝑡.
In the bottom half of Figure 3, we show the estimation strategy for the models that
use quarterly data. The main differences are that the confidence indices used (ICI, INEC
and ICEI) had to be converted to a quarterly frequency7. Similarly to the monthly data
models, the forecast is done in period t+1, but with the difference that the last piece of
information embodied in the information set is 𝐼𝐶𝑡.
7 The INEC and ICEI started to be released on a monthly basis in 2010, before that they were released every
quarter.
Included in the information set
To be forecasted
Projected*
Not used
Legend
* Variables to be projected if using the iterative approach. They are not used in the direct forecast approach.
ICt - Confidence index at time t
Yt - Measure of the activity level at time t
Forecasting
1 2
Nowcasting
(t)
t t+2
1 2 1 2
t+3
One-step ahead
forecasting
(t+1)
t t+2 t+3
ICt Yt Yt+1ICt-1
Information set
10 20 10 20 10 20
ICt-1
Nowcasting
(t)
t t+2 t+3
ICt Yt Yt+1
Information set
Figure 3 - Framework for nowcasting and one-step-ahead forecasting - monthly and quarterly data
10 20 10 20 10 20
Information set
ICt-1 ICt Yt Yt+1
1 2 1 2
Mo
nth
lyQ
uar
terl
y
Forecasting
t+3
Information set
ICt-1 ICt Yt+1
1 2
One-step ahead
forecasting
(t+1)
t t+2
Yt-1
Yt-1
t+1
ICt+1 ICt+2
ICt+2ICt+1
t+1
Yt-2
Yt-2
t+1
ICt+1
t+1
Yt-1
Yt-1 Yt ICt+1 ICt+2
ICt+2
10

The choice of the optimal number of lags for the models in this paper is based on
the Bayesian Information Criterion (BIC). More specifically, among the AR models of
order less than or equal to P given by equation (1), we choose the model with the lowest
BIC value. The same criterion is used to select among the models with up to K lags of the
confidence index and autoregressive terms of lower order or equal to P given by equation
(2). In this paper, the maximum value for K and P is 6 and 4, respectively, for monthly
data and quarterly data, so as to prevent losing too much information in our estimates.
After the choices of lags, we obtain the nowcasting and the one-step-ahead
forecasts. Then, we move the window forward by one period (rolling-window) and
compute the new predicted values based on the re-estimated models. We continue with
this procedure until we reach the end of the sample. After collecting all the forecasts, we
compute their root mean-squared forecasting errors.
We estimated our models using a moving window of fixed size, containing 60%
of the available data, since for some series with smaller samples, smaller rolling windows
would make estimation infeasible. Nonetheless it is important to highlight that the same
exercise was performed using windows size of 55% and 65%, with no qualitative
difference in the results.
Since the choices of lags for the autoregressive part of the equation (2) are
independent of the choices for the models given in (1), the models chosen for a specific
relationship between Y and IC are not necessarily nested. Thus, we decided to follow
Giacomini and White (2006) and test their predictive power using a rolling window
scheme. The predictive ability of the models is evaluated based on the statistics of Diebold
and Mariano (1995) applied to the difference of the mean squared errors obtained when
comparing the model without the confidence index and the model where the confidence
index is included. We interpret the occurrence of a significant value for this statistic as an
indication of predictive power gain from using a confidence index. While acknowledging
the existence of a range of possibilities to be tested, in this paper we focused only on a
few of the possible relationships involving the variables described in Table 1.
4. Results
Table 3 summarizes the results obtained from the nowcasting and from the one-
step-ahead forecasting exercises, by presenting for each model its root mean square error
11

and its Diebold Mariano statistic against the best univariate model for the models’
dependent variable8. According to the table, the Industry Confidence Index (ICI) provides
relevant information, for both present and the near future of the growth of economic
activity. In the case of the other indices, there was not sufficient evidence of a forecasting
improvement, nonetheless, this could be a consequence of a lower test power due to the
smaller number of observations.
Table 3 - Results for the test of predictive power
Index Aggregate* ISA IE Aggregate* ISA IE
Monthly
PIM - Manufacturing Industry ICI XX XXX XX X - -
PIM - Capital Goods BK.ICI - - X X X -
PIM - Construction Material MC.ICI XX XX XX XX X XX
PMI Markit - -
Unemployment Rate ICD - -
PMC - Extended ICC - - - - - -
PMC - Extended INC - -
PMC - Restrict ICC - - - - - -
PMC - Restrict INC - -
Quarterly
Household Consumption INEC - -
PMC - Restrict INEC - -
PMC - Extended INEC - -
GDP - Manufacturing Industry ICEI - -
GDP - Manufacturing Industry ICI - - - - - X
GDP - Construction Industry MC.ICI XX XX XX - - -
GDP - GFCF ICI XX XX XX X X -
GDP INEC - -
GDP ICI XX XX X XX XX X
GDP BK.ICI X XX X - - -
GDP MC.ICI - X - - - -
GDP ICEI - -
Nowcasting One step ahead
"XXX", "XX" e "X" represent significant results at 1, 5 e 10% levels, respectively, and "-" indicates absence of
significance at 10% level. The occurrence of a significant value for this statistic is interpreted as indicating the
existence of predictive gain of including the confidence index in the model.
* Either ICI and sectors indices are comprised by the Current Situation (ISA) and Expectation (IE) indices, which are
individually used in the regressions. For monthly data, ICI and its components are found to have a greater predictive
power against the best univariate model not only for the PIM –Manufacturing but also for
the PIM – Construction Goods both for the present (T) and the near future (T+1).
For quarterly data, it is worth emphasizing that for the case of the growth of
Construction industry and the Gross Fixed Capital formation as a percentage of the Gross
Domestic Product (GDP) there is enough statistical evidence to claim (at a 5%
significance level) that the Industry Confidence Index and its components improve upon
the forecasts of the univariate model, two months before the release of the GDP data. For
growth of GDP itself, there is also enough evidence to reject the null of the Industry
Confidence Index does not help predicting GDP’s growth.
8 See Tables A.1 - A.4 in the Appendix for a greater detail of the results. The best univariate model is
considered here to be the one that minimizes BIC.
12

5. Conclusion
In summary, the results presented in this paper suggest that among the confidence
indices under analysis, the ICI and its components stand out in helping to improve
univariate forecasts of variables capturing the level of economic activity, for both present
(nowcasting) and the near future (one-step-ahead prediction).
It is important, however to highlight the main limitations of our results. First, the
list of relationships used in this paper is quite limited, it is important to analyze the
contribution of confidence indices for other variables of interest to economic agents.
Second, the time series are short, which may compromise the power of the tests. Third,
the results point towards predictive ability, which does not necessarily imply causality.
Fourth, the models used in this paper do not take into account possible feedback effects
or nonlinearities. Fifth, there is nothing that guarantees that the gain in predictive terms
is still valid for other models with other exogenous variables of top of the indices of
confidence. Finally, the sample includes periods of crisis, which may have led to
important changes in the economic fundamentals.
References
Al-Eyd, A., Barrell, R., and Davis, E. (2009). “Consumer Confidence Indices and Short-
Term Forecasting of Consumption”. Manchester School, 77(1), 96-111.
Bentes, Fabio G. M. (2006). “O Poder Preditivo do Índice de Confiança do Consumidor
no Brasil: Uma Análise através de Vetores Autorregressivos.” Rio de Janeiro, março de
2006.
Claveria, O., Pons, E., and Ramos, R. (2007). “Business and Consumer Expectations and
Macroeconomic Forecasts”. International Journal of Forecasting, 23(1), 47-69.
Curtin R.T. (2000), “Psychology and Macroeconomics: Fifty Years of the Surveys of
Consumers”, Special Report, Surveys of Consumers, University of Michigan.
Dées, S. and Brinca, P. S. (2013). “Consumer confidence as a predictor of consumption
spending: Evidence for the United States and the Euro area”. International Economics,
Volume 134, 1-14.
13

Diebold, F.X. and Mariano, R.S. (1995). “Comparing Predictive Accuracy”, Journal of
Business e Economic Statistics, 13, 253-263.
Dominitz, J., and Manski, C. F. (2004). “How Should We Measure Consumer
Confidence?”. Journal of Economic Perspectives, 18(2), 51-66.
Easaw, J. Z., and Heravi, S. M. (2004). “Evaluating Consumer Sentiments as Predictors
of UK Household Consumption Behavior Are They Accurate and Useful?”. International
Journal Of Forecasting, 20(4), 671-681.
Elliott, G., and Timmermann, A. (2008). “Economic forecasting”. Journal of Economic
Literature, 3-56.
Giacomini, Raffaella, and Halbert White (2006). “Tests of conditional predictive ability”.
Econometrica, 74(6), 1545-1578.
Ing, C.K. (2003). “Multistep prediction in autoregressive processes." Econometric
Theory
19 (2), 254-279.
Klein, L.R. and Lansing, J.B. (1955). “Decisions to Purchase Consumer Durable Goods.”
Journal of Marketing, Vol. XX, pp. 109-132.
Kwan, A. C., and Cotsomitis, J. A. (2006). “The Usefulness of Consumer Confidence in
Forecasting Household Spending in Canada: A National and Regional Analysis”.
Economic Inquiry, 44(1), 185-197.
Ludvigson, S. C. (2004). “Consumer Confidence and Consumer Spending”. Journal of
Economic Perspectives, 18(2), 29-50.
Marcellino, M., Stock, and J., Watson, M., (2006). “A comparison of direct and iterated
multistep AR methods for forecasting macroeconomic time series”. Journal of
Econometrics, 135, 499-526.
Mourougane, A., and Roma, M. (2003). “Can Confidence Indicators Be Useful to Predict
Short Term Real GDP Growth?”. Applied Economics Letters, 10(8), 519-522.
Smith, B. M. (2009). “Forecasting utility of UK consumer sentiment indexes in real time:
do consumer sentiment surveys improve consumption forecasts in real time?” (Doctoral
dissertation, University of Richmond).
Wilcox, J. A. (2007). ”Forecasting Components of Consumption with Components of
Consumer Sentiment”. Business Economics, 42(4), 22-32.
14

Appendix
Table A1: Descriptive Statistics of confidence indices and activity (dlog)
ICI May/1995 232 -0,001 0,036 -0,199 0,171
ICI - Current Situation (ICI - ISA) May/1995 232 -0,002 0,043 -0,230 0,241
ICI - Expectations (ICI - IE) May/1995 232 -0,001 0,033 -0,165 0,109
BK.ICI May/1995 232 -0,002 0,075 -0,379 0,271
BK.ICI - Current Situation (BK.ICI - ISA) May/1995 232 -0,003 0,096 -0,533 0,417
BK.ICI - Expectations (BK.ICI - IE) May/1995 232 -0,001 0,075 -0,370 0,245
MC.ICI May/1995 232 -0,001 0,057 -0,310 0,309
MC.ICI - Current Situation (MC.ICI - ISA) May/1995 232 -0,001 0,071 -0,448 0,422
MC.ICI - Expectations (MC.ICI - IE) May/1995 232 0,000 0,061 -0,262 0,232
ICC Oct/2005 107 0,000 0,027 -0,134 0,058
ICC - Current Situation (ICC - ISA) Oct/2005 107 0,001 0,037 -0,152 0,094
ICC - Expectations (ICC - IE) Oct/2005 107 0,000 0,026 -0,124 0,065
ICD Oct/2008 105 -0,003 0,023 -0,079 0,069
PMI Nov/2005 102 -0,001 0,030 -0,098 0,088
INC May/2005 112 0,002 0,028 -0,070 0,070
INEC 2st
Q/2001 53 0,001 0,028 -0,063 0,099
ICEI 3nd
Q/1999 60 -0,001 0,062 -0,117 0,185
PIM - Manufacturing Feb/1995 229 0,001 0,020 -0,125 0,062
PIM - Construction Material Feb/1995 229 0,001 0,017 -0,062 0,039
PIM - Capital Goods Feb/1995 229 0,002 0,045 -0,268 0,136
Unemployment Apr/2002 145 -0,007 0,028 -0,078 0,073
PMC - Restrict Feb/2000 174 0,004 0,009 -0,023 0,026
PMC - Extended Feb/2003 138 0,005 0,025 -0,102 0,082
GDP 2nd
Q/1996 68 0,007 0,013 -0,042 0,044
GDP - Household Consumption 2nd
Q/1996 73 0,008 0,013 -0,030 0,046
GDP - Manufacturing 2nd
Q/1996 73 0,003 0,036 -0,110 0,142
GDP - Construction 2nd
Q/1996 73 0,005 0,025 -0,055 0,051
GDP - GFCF 2nd
Q/1996 73 0,008 0,037 -0,125 0,088
Activity Level Variables
Monthly
Minimum Maximum
Confidence Indices
Monthly
Quarterly
VariableBeginning of
the sampleObs. Mean
Quarterly
Sources: Fundação Getúlio Vargas (FGV), Markit, Associação Comercial de São Paulo (ACSP) e Instituto Brasileiro de Geografia e Estatística (IBGE).
Standard
deviation
15

Table A.2 - Root Mean Square Error for Nowcasting - Monthly Data
Endogenous Index Agg. ISA IE Begin End
PIM - Manufacturing ICI 0,77 0,81 0,78 Apr-1995 Aug-2006
(0,01) (0,01) (0,03)
PIM - Capital Goods BK.ICI 0,95 1,01 0,89 Apr-1995 Aug-2006
(0,23) (0,57) (0,08)
PIM - Construction Goods MC.ICI 0,72 0,91 0,79 Apr-1995 Aug-2006
(0,01) (0,02) (0,02)
PMI Markit 0,96 Feb-2006 Dec-2010
(0,40)
Unemployment Rate ICD 1,02 Dec-2005 Dec-2010
(0,70)
PMC - Extended ICC 1,06 1,09 1,04 Sep-2005 Jan-2011
(0,92) (0,85) (0,92)
PMC - Extended INC 1,02 Sep-2005 Jan-2011
0,82
PMC - Restrict ICC 1,13 1,25 1,10 Sep-2005 Jan-2011
(0,96) (0,91) (0,90)
PMC - Restrict INC 1,04 Sep-2005 Jan-2011
(0,71)
p-values from Diebold-Mariano statistics in parentheses. Alternative hypothesis: model with confidence
index has greater predictive power than the univariate model. In all models, the variables used were the first
difference of the logarithm of the original variables. Values in bold indicate significance at 10% level.
Table A.3 - Root Mean Square Error for Nowcasting - Quarterly Data
Endogenous Índice Agg. ISA IE Begin End
Consumption expenditures INEC 0,93 2001Q1 2009Q1
(0,27)
PMC - Restrict INEC 1,11 2001Q1 2009Q1
(0,90)
PMC - Extended INEC 1,06 2003Q2 2009Q4
(0,63)
GDP - Manufacturing ICEI 0,93 1999Q2 2008Q2
(0,35)
GDP - Manufacturing ICI 1,02 0,96 1,17 1996Q2 2007Q1
(0,52) (0,44) (0,70)
GDP - Construction MC.ICI 0,49 0,56 0,44 1996Q2 2007Q1
(0,02) (0,04) (0,02)
GDP - GFCF ICI 0,38 0,45 0,39 1996Q2 2007Q1
(0,02) (0,02) (0,01)
GDP INEC 0,86 1999Q2 2008Q2
(0,16)
GDP ICI 0,43 0,48 0,46 1996Q2 2007Q1
(0,05) (0,04) (0,06)
GDP BK.ICI 0,56 0,49 0,67 1996Q2 2007Q1
(0,06) (0,05) (0,05)
GDP MC.ICI 0,55 0,59 0,59 1996Q2 2007Q1
(0,14) (0,09) (0,13)
GDP ICEI 0,81 2001Q1 2009Q1
(0,23)
p-values from Diebold-Mariano statistics in parentheses. Alternative hypothesis: model with confidence index
has greater predictive power than the univariate model. In all models, the variables used were the first
difference of the logarithm of the original variables. Values in bold indicate significance at 10% level.
16

Table A.4 - Root Mean Square Error for One-step Ahead Forecasting- Monthly Data
Endogenous Index Agg. ISA IE Begin End
PIM - Manufacturing ICI 0,88 0,90 0,94 Apr-1995 Aug-2006
(0,09) (0,12) (0,36)
PIM - Capital Goods BK.ICI 0,87 0,90 0,93 Apr-1995 Aug-2006
(0,07) (0,05) (0,19)
PIM - Construction Goods MC.ICI 0,86 0,91 0,88 Apr-1995 Aug-2006
(0,03) (0,06) (0,02)
PMI Markit 1,09 Feb-2006 Dec-2010
(0,73)
Unemployment Rate ICD 1,00 Dec-2005 Dec-2010
(0,53)
PMC - Extended ICC 1,01 1,00 1,04 Sep-2005 Jan-2011
(0,71) (0,48) (0,96)
PMC - Extended INC 1,03 Sep-2005 Jan-2011
(0,90)
PMC - Restrict ICC 1,06 1,04 1,04 Sep-2005 Jan-2011
(0,82) (0,84) (0,72)
PMC - Restrict INC 1,07 Sep-2005 Jan-2011
(0,84)
p-values from Diebold-Mariano statistics in parentheses. Alternative hypothesis: model with confidence
index has greater predictive power than the univariate model. In all models, the variables used were the first
difference of the logarithm of the original variables. Values in bold indicate significance at 10% level.
Table A.5 - Root Mean Square Error for One-step Ahead Forecasting- Quarterly Data
Endogenous Index Agg. ISA IE Begin End
Consumption expenditures INEC 1,04 2001Q1 2009Q1
(0,84)
PMC - Restrict INEC 1,00 2001Q1 2009Q1
(0,51)
PMC - Extended INEC 1,14 2003Q2 2009Q4
(0,85)
GDP - Manufacturing ICEI 0,83 1999Q2 2008Q2
(0,11)
GDP - Manufacturing ICI 1,01 0,98 0,76 1996Q2 2007Q1
(0,52) (0,46) (0,06)
GDP - Construction MC.ICI 0,94 1,01 0,88 1996Q2 2007Q1
(0,28) (0,55) (0,17)
GDP - GFCF ICI 0,69 0,72 0,86 1996Q2 2007Q1
(0,10) (0,08) (0,34)
GDP INEC 0,89 1999Q2 2008Q2
(0,21)
GDP ICI 0,78 0,79 0,80 1996Q2 2007Q1
(0,04) (0,04) (0,06)
GDP BK.ICI 0,85 0,86 0,88 1996Q2 2007Q1
(0,16) (0,16) (0,16)
GDP MC.ICI 0,93 1,00 0,88 1996Q2 2007Q1
(0,15) (0,47) (0,11)
GDP ICEI 1,01 2001Q1 2009Q1
(0,59)
p-values from Diebold-Mariano statistics in parentheses. Alternative hypothesis: model with confidence index has
greater predictive power than the univariate model. In all models, the variables used were the first difference of the
logarithm of the original variables. Values in bold indicate significance at 10% level.
17