Embed Size (px)
Citation preview

Euro crisis, banks’ liquidity needs and the liquidity policy of the ECB
Pierluigi Morelli, Giovanni B. Pittaluga and Elena Seghezza
Abstract
Although there is by now extensive literature that sees the core function of banks in terms of
liquidity creation, very few contributions propose measures of it. This paper aims to construct an
indicator of liquidity creation that takes into account the maturity of the individual assets and
liabilities and the stability of their detention by various economic sectors. The use of such an
indicator for the banks of the eurozone makes it possible, in relation to the period between 2003 and
2013, to clarify the difference in behaviour regarding liquidity creation by the banks of southern
and northern Europe, and the changes in the liquidity policy of the ECB over time.

1. Introduction
The main function of banks is maturity transformation. By performing this function banks create
liquidity. They lend illiquid loans to borrowers of funds, and in the face of these emit liabilities
which may be withdrawn at any time at par value (Bryant, 1980; Diamond and Dybvig, 1983;
Holmstrom and Tirole, 1998).
However, the creation of liquidity is a major source of the banks’ vulnerability. This
vulnerability is represented by liquidity risk, since banks face the risk of requests for certain
liabilities invested in illiquid assets to be returned immediately.
In the past, the risk of illiquidity presented itself mainly in the form of a run on deposits. The
spread of public insurances on deposits proved to be an effective tool in averting bank runs.
With the financial crisis of 2008-2009, the liquidity risk of banks took on new forms. The
increasing integration of financial markets and non-specialized financial intermediaries rendered the
structure of banks' liabilities more complex. In particular, their dependence on funding in wholesale
markets increased.
The collapse of Lehman Brothers undermined confidence in the solvency of banks, leading
many banks to hoard liquidity. The result was a malfunction of the interbank markets and a
widespread lack of liquidity.
This gave rise to an ever-increasing focus on the question of bank liquidity at both the
academic and the regulatory level. Starting from the distinction between market liquidity (the ease
and cost with which assets can be sold) and funding liquidity (the ability of financial intermediaries
to fund their positions), several scholars demonstrated interconnections between liquidity risk and
credit risk. In particular, Brunnermeier and Pedersen (2009) showed that it is difficult for market
makers to finance their positions when their credit quality is low. 1On the other hand, they are
reluctant to take positions when funding is tighter. Accordingly, the deterioration of market
1 See also Acharya and Pederson (2005).

liquidity and funding liquidity are mutually reinforcing. This means that there is a link between
credit risk and liquidity risk.
At the regulatory level, what happened during the 2008-2009 crisis led the Basel Committee
with Basel III, to require banks to comply with both capital requirements and liquidity
requirements.
At the same time there was growing literature on how to measure liquidity creation, or,
conversely, banks’ liquidity needs.
In this paper, we seek to make a calculation of the trend of liquidity needs in the eurozone
and in its main components. To this end, instead of resorting to a ratio such as those proposed in
Basel III, we have calculated liquidity needs as an absolute value, in accordance with the
contributions of Berger and Bouwman (2009) and Bai et al. (2013).
An estimate of the liquidity needs of the eurozone, ot its core countries and of the GIPSI
countries enables us to better understand, on the one hand, the origins of the euro crisis and, on the
other, the behaviour of the ECB, in particular the extent to which it met liquidity needs and where it
channelled resources.
The paper is divided into three sections. The first section gives an account of the current
literature on measuring liquidity risk. The second section proposes an index of liquidity risk, which
unlike similar available contributions takes into account both the maturity of individual assets and
liabilities and the stability of relations between banks and the different economic sectors.
After laying down the criteria for constructing the index of liquidity risk, we calculate the
evolution of the liquidity needs of eurozone banks from 2003 until today.
Section 3 breaks down the liquidity needs between GIPSI countries and core eurozone
countries, showing how it was especially the first that increased cash flow requirements
significantly between 2003 and 2008. Initially, under the chairmanship of Trichet, this abnormal
need was not met by the ECB, which in the first phase of the euro crisis (from June 2010 to October
2011) absorbed liquidity from the system, rather than emitting it.

The behaviour of the ECB changed completely with the advent of Draghi as president. With
the intensification of the euro crisis, in late 2011 and early 2012, the ECB met the liquidity needs of
the GIPSI countries almost in their entirety, thereby compensating for the liquidity hoarding of the
core countries banks.
The Conclusions give a summary of the arguments put forward in the paper and also make
some policy proposals.
2. The practice and literature on banks’ liquidity measures
Before the financial crisis of 2007-2009, the main concern of the Basel Committee was to adjust the
degree of capitalization of banks. The recent financial crisis has shown how a widespread liquidity
crisis can escalate into a systemic crisis. Hence the decision of the Basel Committee to lay down in
Basil III two minimum liquidity requirements. The first is the Liquidity Coverage Ratio (LCR),
which promotes short-term liquidity resilience, and the Net Stable Funding Ratio (NSFR), which
promotes long-run liquidity resilience.
The LCR requires that a bank should hold a stock of unencumbered high quality assets
(HQLa)2 equal to or in excess of its projected net cash outflows (NCOF) in a 30 calendar day
liquidity stress scenario.
The NSFR is defined as the amount of available stable funding3 relative to the amount of
required stable funding.4
These liquidity requirements are useful in assessing the liquidity of individual banks. They are
not, however, to be used to measure the liquidity of the banking system at the aggregate level. For
this purpose, the liquidity indicators proposed by the academic literature can be used.
2 The HQLA consists of “cash or assets that can be converted into cash at little or no loss of value in private markets”. Basel Committee on Banking Supervision (2013; p. 4). 3 “Available stable funding” is defined as the portion of capital and liabilities expected to be reliable over one year. Basel Committee on Banking Supervision (2014; p. 2). 4 “The amount of such stable funding required of a specific institution is a function of the liquidity characteristics and residual maturities of the various assets held by that institution as well as those of its off-balance sheets (OBS) exposures”. Basel Committee on Banking Supervision (2014; p. 2).

In the contributions that have tried to explain the reasons for liquidity holding by banks,5 the
liquidity of a bank is identified with the cash and liquid assets it holds. The shortcoming of this
approach is that it considers only the assets of the banks and, therefore, is not suitable as a measure
of the liquidity needs of these institutions. This requirement, in fact, follows from both the market
liquidity of the assets and the funding liquidity, i.e. the degree of stability of funding sources.
Therefore, each asset and each liability contribute to a bank’s liquidity position.
The first contribution to take account of this is by Berger and Bowman (2009). In their paper
they calculate a liquidity indicator starting from the classification of assets and liabilities into liquid,
semi-liquid and illiquid.
This classification is based on the assumption that some assets may be sold more readily than
others and that some funding instruments are more volatile than others.
To each asset and liability is assigned a weight based on the classification criteria just
mentioned. The weighted sum of assets and liabilities makes it possible to calculate the creation of
the bank's liquidity.
The calculation method proposed by Berger and Bowman was taken as a reference by
Brunnermeier et al. (2012), who formulated a liquidity indicator, the Liquidity Mismatch Index
(LMI), which takes into account not only the characteristics of assets and liabilities but also market
conditions. Accordingly, in this context, the liquidity weights assigned to the individual assets and
liabilities, are time-varying. The variations of weights allows us to pinpoint the moments at which
manifest liquidity crises occur in the system.
However, the use of variable weights has its drawbacks. First, it should be noted that market
conditions are affected by both the demand and the supply of liquidity. Varying the weights of the
individual assets and liabilities in relation to market conditions does not allow us to isolate the
liquidity needs of the banks from the central bank's liquidity policy. Secondly, liquidity is more
5 See, among others, Heider et al. (2009), Acharya and Merrouche (2013) and Acharya and Rose (2013).
important in times of crisis, when information asymmetries are greater.6 The weights assigned to
the individual assets and liabilities should, therefore, be discrete, if not binary, rather than
continuous. In times of crisis, on the one hand, institutional investors tend to have a shorter time
frame and, therefore, to hold more liquidity.7 At the same time, on the other hand, individual
investors tend to shift the structure of their portfolios from illiquid to liquid assets.
In this paper, given the twofold objective of measuring the liquidity needs of banks and
evaluating the behaviour of the ECB in the euro crisis, we have adopted a measure of liquidity
based on fixed weights of assets and liabilities.
3. The trend of the liquidity needs of the eurozone banking system
An assessment of the ECB's liquidity policies must start from an estimate of liquidity creation by
banks in the eurozone. The creation of liquidity, if considered conversely, is a measure of the
liquidity needs of banks. A measure of this kind should make it possible to:
1. give a quantitative description of the liquidity of the financial system;
2. measure the imbalances liquidity of a financial system and of its parts.
In order to define a measure of the liquidity of the eurozone, in this section we first lay down
the criteria for a measure of liquidity and, subsequently, using these criteria, we go on to measure
the liquidity creation (and, conversely, the liquidity needs) of euro area banks and subsets of these
banks in the last decade.
3.1 The construction of a measure of liquidity creation in the euro area Taking into account the points made in the previous section, in order to determine the need for
liquidity in the euro area and its individual member countries, we proceeded, as in Berger and
Bouwman (2009), in three steps.
6 See among others Duffie et al. (2007). 7 See Sadka (2010).
In the first step we classified assets and liabilities. The second step involved determining the
weights of the assets and liabilities previously classified. In the third step we show how the liquidity
needs of the banking system can be established.
3.1.1. Step 1 -‐ Classifying assets and liabilities
Assets are classified, in order of liquidity, in relation to the ease, cost and time required to obtain
liquid funds from their sale. Similarly, liabilities are ordered by degree of liquidity in inverse
relation to the ease, cost and time their holders expend to obtain liquid funds from banks. Whether
for assets or liabilities, reference was made to two criteria:
1. Maturity:
a. a shorter maturity implies a higher degree of liquidity of an asset and, vice versa, a
longer maturity indicates a lower degree of liquidity of an asset;
b. a shorter maturity indicates a lower degree of liquidity of a liability and, vice versa, a
longer period indicates a higher degree of liquidity of a liability;
2. Economic sector:
a. The assets and liabilities were divided according to the type of customer,
distinguishing between banks, households, government and non-residents.
b. It is assumed that the credit and debt relations are more stable with households and
resident businesses, while relations with banks and non-residents are assumed to be
less stable. It is assumed that the degree of stability of a bank’s relations with the
government has an intermediate value between these two extremes.
c. Thus, for example, on the asset side a bank loan to other resident banks has a higher
degree of liquidity than government bonds, even higher than short-term loans to
businesses, and significantly higher than mortgage loans to households. By contrast,
for example, on the liability side, the degree of liquidity of the long-term deposits of
households is higher than that of companies and much higher than that of banks.

3.1.2 Assigning weights to assets and liabilities In this step we have assigned the weights to the individual assets and liabilities classified according
to the criteria laid down in step 1. The sign of the weights is positive in the case of assets and
negative in the case of liabilities: the bank, in fact, creates liquidity when it transforms illiquid
assets into liquid liabilities.
The weight given to the individual balance sheet items is based on the hierarchy of liquidity
set out in step 1. The sign and magnitude of the weight of each individual asset and liability are
given in Table 1.
Table 1 – Assets and liabilities weights
Loans Weight weight
- domestic banks 1,00 Deposits
- households mortgages 0,25 - Banks, domestic -1,00
- households, other loans 0,50 - Households, short-term -0,50
- businesses, short-term 0,50 - Households, long-term -0,25
- businesses, long-term 0,25 - Business, short-term -0,75
- government 0,50 - Business, long-term -0,50
- other residents 0,50 - Other residents -0,75
- Banks Eurozone 0,75 - Banks, Eurozone -1,00
- Banks, Extraeuro 0,75 - Banks, no Eurozone -1,00
- Non banks, Eurozone 0,60 - Non banks, Eurozone -1,00
- Non banks, Extraeuro 0,60 - Non banks, Extraeuro -1,00
Securities
- domestic banks, short-term 0,75 Securities
- domestic banks, long-term 0,50 - Banks, domestic, short-term -0,75
- government 0,75 - Banks, domestic, long-term -0,50
- other residents 0,60 - Other residents, short-term -0,75
- Eurozone banks 0,60 - Other residents, long-term -0,50
- Other banks 0,60 - Foreign -1,00
- Non banks, Eurozone 0,60
- Non banks, Extraeuro 0,60 Equity 0,00
Shares Other liabilities, foreign -1,00
- banks, domestic 0,75 Other liabilities -0,50
- other residents 0,75
- Euro Area 0,75

- Extra Euro 0,75
Other foreign assets 0,75
Fixed assets 0,00
Other assets 0,50
3.1.3 Step 3 – Calculating the liquidity needs of the banking system
On the basis of what has been defined in steps 1 and 2 we go on to calculate an index of the creation
of liquidity on the part of the banking system (LC). This calculation is based on an equation
analogous to that used by Berger and Bouman (2009), but in which the weights take into account
both the maturity of the individual assets and of the economic sector holding them:
𝐿𝐶!! = 𝜆!,!,!𝑥!,!,!!
!
+!
𝜆!,!!,!𝑥!,!!,!!
!!!
where i stands for the banking system, t the time period, j the economic sectors (households,
enterprises, government, banks and non-residents), K and K’ the various categories of assets (xt,K,J)
and liabilities (xt, K’, J), respectively, and lt,K,J and lt, K’, J the weights attributed to the various
categories of assets and liabilities.
3.2 An estimate of the liquidity needs of the eurozone countries
Using data for the 11 leading countries of the eurozone,8 we calculated the liquidity needs of each
national banking system and a proxy for the liquidity needs of the euro area banking system
(obtained by aggregating the national banking systems under consideration).9
The trend of the liquidity needs of the euro area banking system is shown in Figure 1.
[insert Figure 1 - Liquidity needs of the eurozone banking system]
8 Namely, Austria, Belgium, Finland, France, Germany, Greece, Ireland, Italy, the Netherlands, Portugal and Spain. 9 In 2003 this proxy represented a quota of … per cent of the eurozone banking system.
An examination of the figure above shows that liquidity creation in the eurozone banking
system increased significantly between early 2003 and mid-2008. During this period the liquidity
requirement as a percentage of assets went up from ... to .... percent, an increase of ... percentage
points.
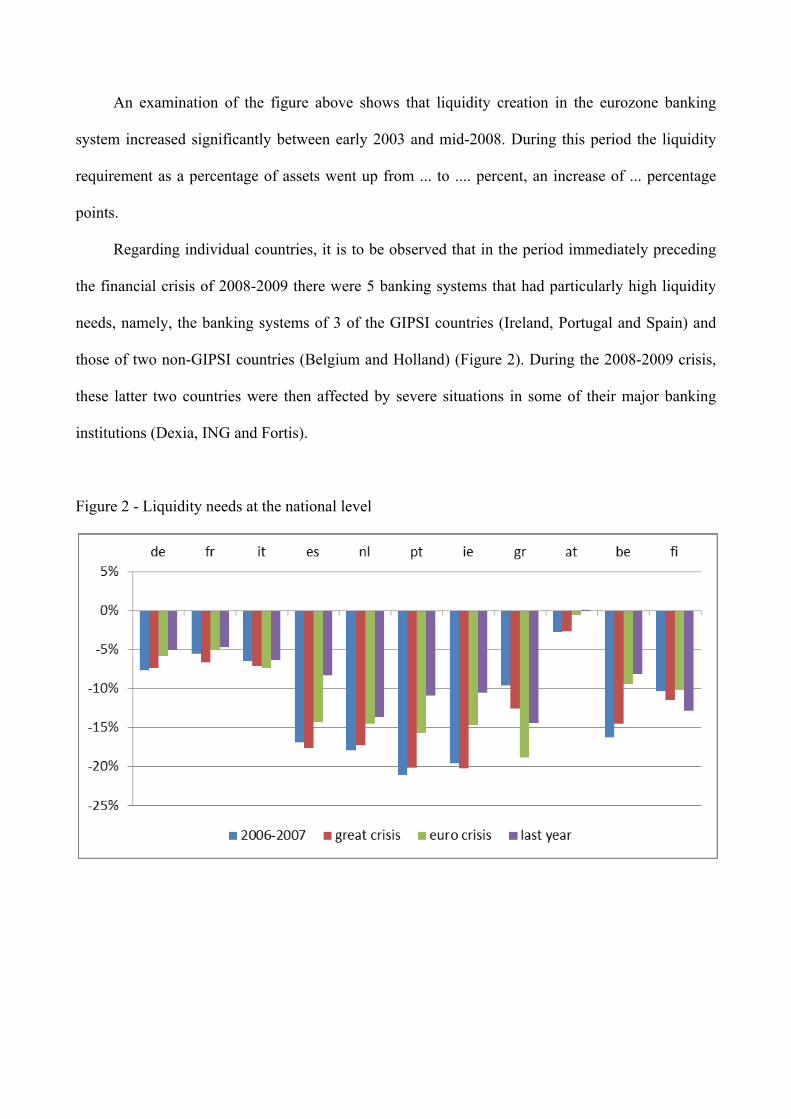
Regarding individual countries, it is to be observed that in the period immediately preceding
the financial crisis of 2008-2009 there were 5 banking systems that had particularly high liquidity
needs, namely, the banking systems of 3 of the GIPSI countries (Ireland, Portugal and Spain) and
those of two non-GIPSI countries (Belgium and Holland) (Figure 2). During the 2008-2009 crisis,
these latter two countries were then affected by severe situations in some of their major banking
institutions (Dexia, ING and Fortis).
Figure 2 - Liquidity needs at the national level
In 2006-2007, however, the banking systems of the largest eurozone countries, that is,
Germany, France and Italy, were characterized by relatively low liquidity needs.
Figure 2 also shows that, after reaching a peak in the 2008-2009 financial crisis, the liquidity
needs of the majority of national banking systems fell. This reduction was particularly marked in
the aftermath of the acute euro crisis between June 2010 and August 2012, particularly in the
countries most affected by this crisis, that is, the GIPSI countries.
4. Liquidity needs of the banking systems and liquidity policies of the ECB
The liquidity policy of a central bank is expressed by its net position vis-à-vis the banking system in
its country. When one considers the net position of the ECB with regard to the eurozone banks,
several turning points emerge (Figure 3).
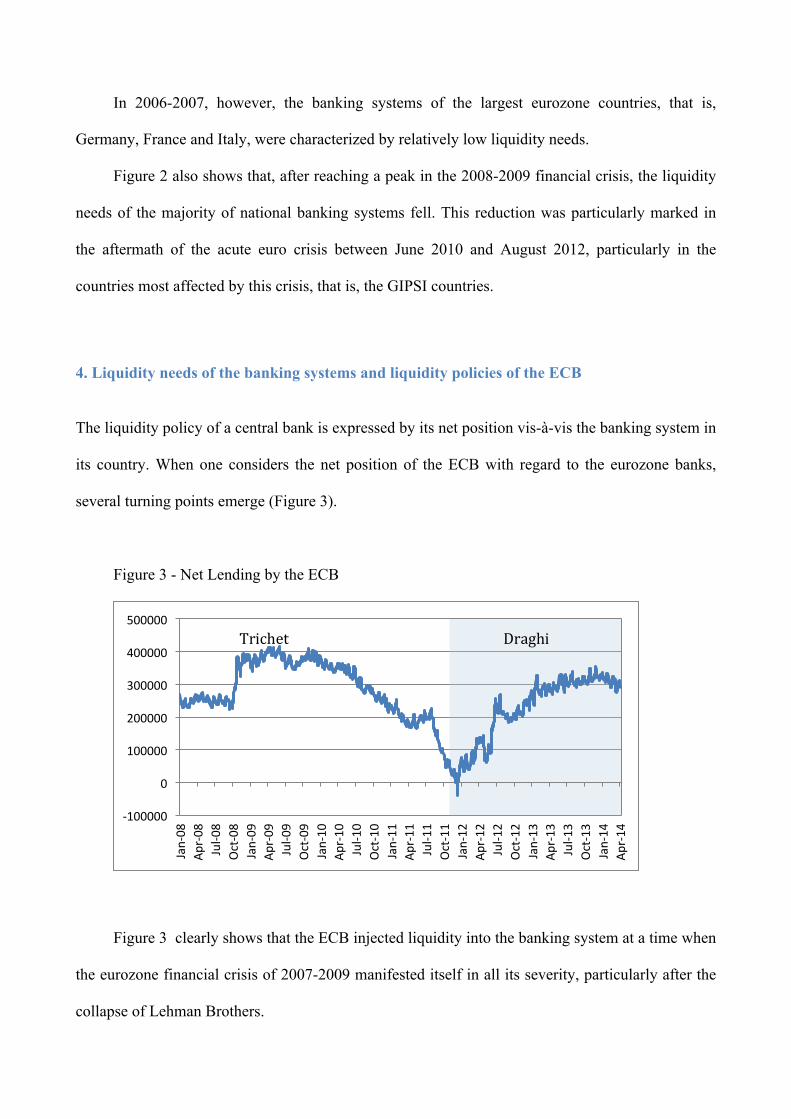
Figure 3 - Net Lending by the ECB
Figure 3 clearly shows that the ECB injected liquidity into the banking system at a time when
the eurozone financial crisis of 2007-2009 manifested itself in all its severity, particularly after the
collapse of Lehman Brothers.
-‐100000
0
100000
200000
300000
400000
500000
Jan-‐08
Apr-‐08
Jul-‐0
8 Oct-‐08
Jan-‐09
Apr-‐09
Jul-‐0
9 Oct-‐09
Jan-‐10
Apr-‐10
Jul-‐1
0 Oct-‐10
Jan-‐11
Apr-‐11
Jul-‐1
1 Oct-‐11
Jan-‐12
Apr-‐12
Jul-‐1
2 Oct-‐12
Jan-‐13
Apr-‐13
Jul-‐1
3 Oct-‐13
Jan-‐14
Apr-‐14
Trichet Draghi

The ECB itself began to re-absorb the liquidity created since the end of 2009. The re-
absorption process continued with undiminished intensity even after the outbreak of the euro crisis.
In July 2011, when the crisis began to involve Italy and Spain, the level of liquidity injected into the
system by the ECB returned to the values of the beginning of 2008. When the euro crisis reached its
peak, namely between October and December 2011, the ECB even became a net debtor to the banks
of the eurozone.
At the end of 2011, when Draghi replaced Trichet as President of the ECB, the bank’s
approach to liquidity policy changed completely. This is even more evident when the net
refinancing of the ECB is broken down into assets and liabilities (Figure 4).
Figure 4 – Assets and liabilities of the ECB to the banks of the eurozone
This breakdown shows how the ECB absorbed liquidity from the system until July 2011:
while its liability position remained stable, the asset position was drastically reduced.
At the end of 2011, as the euro crisis worsened we had a marked liquidity hoarding in banks
in the eurozone. Indeed, at a time of crisis of confidence in the solvency of the GIPSI10 banks the
core11 countries' banks were less willing to extend credit to them on the interbank market.
10 Greece, Italy, Portugal, Spain and Irland.
0
200000
400000
600000
800000
1000000
1200000
Jan-‐08
Apr-‐08
Jul-‐0
8 Oct-‐08
Jan-‐09
Apr-‐09
Jul-‐0
9 Oct-‐09
Jan-‐10
Apr-‐10
Jul-‐1
0 Oct-‐10
Jan-‐11
Apr-‐11
Jul-‐1
1 Oct-‐11
Jan-‐12
Apr-‐12
Jul-‐1
2 Oct-‐12
Jan-‐13
Apr-‐13
Jul-‐1
3 Oct-‐13
Jan-‐14
Apr-‐14
assets liabili;es
With the advent of Mario Draghi as president, the ECB countered liquidity hoarding through
a massive injection of liquidity into the eurozone banking system (Figure 4).
The question then arises as to who benefited most from the different behaviours shown by
Trichet and Draghi and as to the consequences of these different behaviours.
To clarify this point one can first break down the dynamics of the liquidity needs of the GIPSI
countries and the core countries of the eurozone.
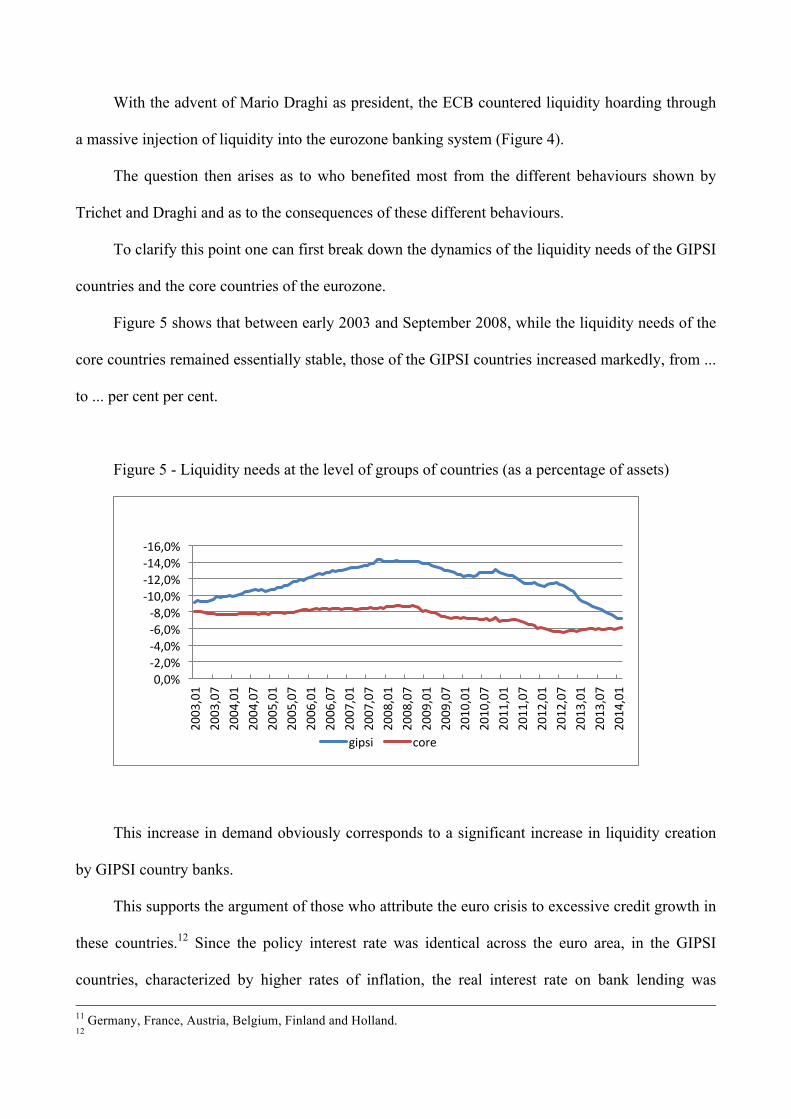
Figure 5 shows that between early 2003 and September 2008, while the liquidity needs of the
core countries remained essentially stable, those of the GIPSI countries increased markedly, from ...
to ... per cent per cent.
Figure 5 - Liquidity needs at the level of groups of countries (as a percentage of assets)
This increase in demand obviously corresponds to a significant increase in liquidity creation
by GIPSI country banks.
This supports the argument of those who attribute the euro crisis to excessive credit growth in
these countries.12 Since the policy interest rate was identical across the euro area, in the GIPSI
countries, characterized by higher rates of inflation, the real interest rate on bank lending was 11 Germany, France, Austria, Belgium, Finland and Holland. 12
-‐16,0% -‐14,0% -‐12,0% -‐10,0% -‐8,0% -‐6,0% -‐4,0% -‐2,0% 0,0%
2003,01
2003,07
2004,01
2004,07
2005,01
2005,07
2006,01
2006,07
2007,01
2007,07
2008,01
2008,07
2009,01
2009,07
2010,01
2010,07
2011,01
2011,07
2012,01
2012,07
2013,01
2013,07
2014,01
gipsi core

significantly lower than in the core countries. This resulted in a particularly high demand for bank
credit satisfied by the accommodating behaviour of the banking systems of the GIPSI countries.
Excessive absorption brought about the onset of severe current account deficits in these countries.
These deficits are, in the view of many economists, at the origin of the euro crisis that erupted
in mid-2010. Even after the outbreak of this crisis, the supply of liquidity from the ECB remained
rigid. Only after July 2011, when the euro crisis started to spread by contagion to Italy and Spain,
did the ECB begin a more active policy of liquidity. However, this policy remained very prudent: in
late October 2011, when Trichet left office, net lending to the banks of the GIPSI countries was
only 1.7 percentage points higher than in May 2010.
Given a very large gap between the ECB's net lending and the liquidity needs of the banks of
the GIPSI countries, the euro crisis tended to deepen. Towards the end of 2011, substantial distrust
in the GIPSI countries’ ability to pay off their debts with non-residents to cover current account
deficits began to spread.
Figure 5 also shows that mid-2012 saw the beginning of a process of convergence between
the liquidity needs of the GIPSI countries and those of the core countries. At the start of 2014, for
both of these groups, the need was close to 6.5 percent of total assets. Compared with the peak in
mid-2008, this amounted to a reduction of... percentage points for the GIPSI countries and ....
percentage points for the core countries, respectively.
With the intensification of the crisis, between the end of 2011 and mid-2012, the ECB
significantly expanded the provision of liquidity in the banking systems of the GIPSI countries.
During this same period the quantity of liquidity introduced in the core countries diminished
(Figure 6).
In this way, in the period between 2012 and 2013, as Figure 7 shows, the gap between the
actual supply of liquidity by the ECB and the liquidity needs of the GIPSI countries, estimated
according to the method described in Section 3, fell significantly. In the acute phase of the euro
crisis the ECB sought to satisfy the demand of countries with foreign account imbalances.

Figure 6 – Net financing from the ECB
Figure 7 – ECB supply of liquidity and liquidity needs of GISPI countries
The massive injection of liquidity in the banking systems of the GIPSI countries did not mean
a passive accommodation of the excessive creation of liquidity by the banks of these countries. As
Figure 5 shows, it was, in fact, accompanied by a gradual slowdown in liquidity creation by these
systems.
-‐4,0%
-‐2,0%
0,0%
2,0%
4,0%
6,0%
8,0%
2010,06 2010,12 2011,06 2011,12 2012,06 2012,12 2013,06 2013,12
gipsi core
-‐16,0% -‐14,0% -‐12,0% -‐10,0% -‐8,0% -‐6,0% -‐4,0% -‐2,0% 0,0% 2,0%
2003,01
2003,07
2004,01
2004,07
2005,01
2005,07
2006,01
2006,07
2007,01
2007,07
2008,01
2008,07
2009,01
2009,07
2010,01
2010,07
2011,01
2011,07
2012,01
2012,07
2013,01
2013,07
2014,01
Liquidity ECB

The lower liquidity creation of the banking systems of the GIPSI countries can be attributed
to both demand factors and supply factors. On the demand side, restrictive measures, especially of a
fiscal nature, led to a decline in domestic demand and GDP. On the supply side, what played a role
was the more prudent behaviour of banks in credit provision, made advisable by the increased
riskiness of customers, by the reduced value of collateral, the growth in non-performing loans and
the increasing cyclic stringency of the constraints imposed by Basel II.
The findings of this section suggest that:
a. The imbalances in the euro area seem largely attributable to excessive liquidity creation by
the banking systems of the GIPSI countries.
b. For a long period of time, until the end of 2011, there was a wide gap between the liquidity
needs of the banking systems of the GIPSI countries and liquidity supply to these systems
by the ECB.
c. Between the end of 2011 and beginning of 2012, the ECB changed its liquidity policy,
injecting large amounts of resources in the banking systems of the GIPSI countries.
d. At the same time the propensity of banks in these countries to create liquidity diminished. A
process of convergence between the liquidity needs of the banking systems of the GIPSI
countries and the banking systems of the core countries began. At the present moment, at the
beginning of 2014, this process appears to be almost completed.
Conclusions
The financial crisis of 2008-2009 drew the attention of academics and practitioners to the liquidity
risk of banks. In this context, the Basel Committee considered it appropriate that, with Basel III,
banks should be required to comply not only with capital requirements but also with two liquidity
ratios, the LCR and the NSFR.
At the same time there have been developments in literature, albeit on a small scale for the
time being, on the question of how to measure liquidity risk. The main contributions to this

literature have sought to define indicators that express the liquidity mismatch not so much in the
form of a ratio as in absolute terms.
The advantage of these indicators compared to the Basel III ratios is that they allow
aggregation and thus make it possible to assess the liquidity risk not only of individual institutions
but also of groups of banks and banking systems.
Working in accordance with this literature, in this paper we have formulated a new measure
of liquidity risk, expressed in absolute terms. By defining the weights to be assigned to the
individual assets and liabilities, as opposed to measures of a similar kind, this takes into account the
maturity of the individual instruments and the different economic sectors that hold the different
tools. On this last point, in particular, it is assumed that credit and debt relations with households
and resident businesses are more stable than those with other sectors.
Starting from these assumptions, we estimated an index of liquidity mismatch for banks in the
euro area. This index shows that in the period 2003-2008, the creation of liquidity by these banks
increased significantly. In particular, growth of liquidity creation was concentrated mainly in the
GIPSI countries. Conversely, in the core countries of the eurozone liquidity creation in the period
considered remained broadly stable.
The trend described above seems to confirm the hypothesis of those who believe that the euro
crisis resulted from the heavy current account imbalances accumulated by the GIPSI countries.
These imbalances, in turn, are attributable to a significant increase in domestic absorption and,
ultimately, to the considerable growth of bank credit that made it possible.
At some point the persistence of high current account deficits in the GIPSI countries and their
high exposure to liquidity risk undermined confidence in their solvency. This loss of confidence
swept through Greece in the spring of 2010 and then from July 2011 onwards also spread to Italy
and Spain.
Even after the crisis had reached all the GIPSI countries the ECB continued to reduce
liquidity; in December 2011 it was even in debt vis-à-vis the eurozone banking system.
With the arrival of Draghi as president, the ECB’s liquidity policy changed dramatically,
becoming accommodating to the GIPSI countries. From the beginning of 2012, after the euro crisis
had become particularly acute, the amount of liquidity injected into these countries by the ECB was
essentially equal to their liquidity needs. In the course of 2012 and 2013, however, these had been
declining, reflecting a reduction in liquidity creation by the GIPSI countries. This reduction reflects
the slowdown in credit growth recorded for the period in these countries. The reduced credit
dynamics of the GIPSI countries reflects a reduction in domestic demand and domestic absorption,
corresponding to a re-balancing of foreign accounts.
References
Acharya V. and Merrouche O. (2013), Precautionary hoarding of liquidity and inter-bank
markets: evidence from the sub-prime crisis, in “Review of Finance”, 17, pp. 107-160.
Acharya V. and Rosa N. (2013), A crisis of banks as liquidity providers, in “Journal of
Finance”, ??
Bai J., Krishnamurthy A. and Weymuller C.H. (2013), Measuring liquidity mismatch in the
banking sector, ??.
Basel Committee on Banking Supervision (2013), Basel III: the liquidity coverage ratio and
liquidity risk monitoring tools, Basel, BIS.
Basel Committee on Banking Supervision (2014), Basel III: the net stable funding ratio,
Basel, BIS.
Berger A. and Bouwman C. (2009), Bank liquidity creation, in “Review of Financial
Studies”, 22, p. 3779-3837.
Bouwman C.H. (2013), Liquidity: how banks create it and how it should be regulated, ??
Brunnermeier M. and Pedersen ? (2009), Market liquidity and funding liquidity, in “Review
of Financial Studies”, 22, p. 2201-2238.
Brunnermeier M., Gorton G. and Krishnamurthy A. (2011), Risk topography, NBER
Macroeconomic Annual.
Brunnermeier M., Gorton G. and Krishnamurthy A. (2012), Liquidity mismatch measurement,
NBER Systemic Risk and Macro Modelling.
Bryant J. (1980), A model of reserves, bank runs, and deposit insurance, in “Journal of
Banking and Finance”, 4, p. 335-344.
Calomiris C.W. and Gorton G.B. (1991), The origins of banking panics: models, facts, and
bank regulation, in Hubbard R.G. (ed.), “Financial markets and financial crises”, University of
Chicago Press, NBER.
Diamond D. and Dybvig P.H. (1983), Bank runs, deposit insurance, and liquidity, in “Journal
of Political Economy”, 91, p. 401-419.
Holmstrom B. and Tirole J. (1998), Private and public supply of liquidity, in “Journal of
Political Economy”, 106, p. 1-40.