Embed Size (px)
Citation preview

Euro Exit Risk
Stefan Eichler1 and Ingmar Rövekamp2
April 2017
Abstract: We introduce a novel approach to identify the risk of a single country leaving the
eurozone as assessed by investors of American Depositary Receipts (ADRs). As a proxy for
investors’ mistrust in eurozone membership, we look at the fraction of ADR returns that is
explained by a country-specific eurozone exit incentive indicator. For a sample of 143 ADRs
from eight eurozone countries from January 2008 to June 2015 we find that our exit risk
measure is significantly higher for the GIIPS countries than for Germany, France and the
Netherlands which we include as a placebo test. Next, we look at exit risk exposure in the
European banking system. We find that banks with higher credit risk exposure to the respective
country are more adversely affected by its exit risk. Third, we analyze the impact of eurozone
exit risk on the real sector in the GIIPS countries. We find that companies from the Health Care
and Telecommunications industries respond significantly negatively to increases in exit risk,
while companies from the Oil and Gas industry respond significantly positively. Also, more
highly indebted companies tend to respond more positively.
Keywords: European Debt Crisis; Eurozone Exit Risk; American Depositary Receipts
JEL-Classification: F31, G12, G1
1 TU Dresden, Department of Business and Economics, Chair of International Monetary Economics and Halle
Institute for Economic Research, Halle, Germany, E-Mail: [email protected]
2 TU Dresden, Department of Business and Economics, Chair of International Monetary Economics, E-Mail:

1
1. Introduction
Eurozone exit risk is one of the most important and interesting features of the financial
crisis in the eurozone. Leaving the eurozone would enable countries to implement national
monetary policies that may be better suited to reduce the real burden of public debt and to
restore competitiveness of the economy at least in the medium term. Eurozone exit would of
course come at significant (short term) costs which perhaps best explains why we have not seen
these exits in the past. Yet, the risk of eurozone exit is highly relevant for several actors in the
political arena and may explain the introduction of the ECB’s unconventional measures. Given
its relevance, eurozone exit risk is relatively unexplored so far.
We use American Depositary Receipts (ADRs) to derive a daily indicator of eurozone
exit risk. American Depositary Receipts represent ownership of a specific number of underlying
shares in the home market (in our case, the GIIPS countries) on which the ADR is written. The
ADR and the underlying stocks represent the same ownership rights. The only difference is the
currency denomination: ADRs trade in the United States and are denominated in US dollars,
the underlying share trades in the European market and is denominated in the domestic currency
– the euro. In the case of eurozone exit, domestic shares would be redenominated into the new
domestic currency, which would most probably be associated with a large devaluation against
the US dollar. As investors anticipate this currency risk in the case of eurozone exit, euro exit
risk will be priced in ADR returns. ADRs appear to be an ideal laboratory to derive eurozone
exit risk since the currency redenomination and potential price loss of the underlying stock in
US dollar terms associated with eurozone exit is the only systematic risk factor that affects
ADR returns (apart from company specific and exchange rate specific shocks that we control
for).
Using 143 ADRs from eight eurozone countries for the period 2008-2015 we find
significantly higher eurozone exit risk for the five crisis countries (Greece, Ireland, Italy,
Portugal and Spain) as compared to the relatively stable countries France, Germany and the

2
Netherlands. Moreover, exit risk of GIIPS countries shows remarkable time series variation,
while exit risk in stable countries fluctuates much less. We investigate the exposure of the
banking and the real sector to eurozone exit risk. We find that eurozone exit risk does not
significantly affect the stock returns of domestic banks. This result suggests that ADR investors
expect that the (short run) costs of eurozone exit (such as balance sheet losses, cut off from
ECB refinancing) may be outweighed by the present value of the long run benefits
(restructuring and recapitalization of the domestic banking sector, higher credit demand after
zombie bank problem (Acharya et al. (2016)) is resolved). Analyzing cross-border spillovers of
eurozone exit risk to other banking sectors we document that Portuguese bank stock returns are
adversely affected by Greek exit risk and that the Spanish banking sector is affected by
Portuguese exit risk. Investigating the channels of these cross country spillovers of exit risk, we
find that higher credit risk exposure (taken from the 2011 EBA stress test) are associated with
a larger cross country exposure to eurozone exit risk.
Moreover, we analyze the exposure of 333 stocks from different industries to domestic
eurozone exit risk. We find that Health Care and Telecommunications stocks are significantly
negatively affected by eurozone exit risk, while Oil and Gas stocks respond positively to
eurozone exit risk. Looking at the cross section of euro exit risk exposures between individual
companies, we conclude that companies with higher debt to assets ratios are less negatively
exposed to eurozone exit suggesting that ADR investors expect that eurozone exit would be
associated with an inflationary monetary policy that would effectively reduce the real debt
burden of companies.
Several interesting papers have investigated redenomination risk/exit risk in the
eurozone. Some studies attribute mispricing of sovereign bonds to eurozone exit risk arguing
that sovereign bond spreads above fundamentally justified values signal exit risk (e.g. Di Cesare
et al. (2012); Aizenman et al. (2013);Favero & Missale (2012); Dewachter et al. (2015)). Other
contributions use survey data on eurozone exit risk taken from the electronic trading platform

3
INTRADE and find that exit risk is priced in sovereign bond prices ( Klose & Weigert (2014),
Shambaugh (2012)). Kriwoluzky et al. (2015) calibrate a structural small open economy model
to construct counterfactuals without exit risk expectations for Greece. They find that sovereign
and corporate bond spreads would be significantly lower in a state without exit risk
expectations. While these approaches reveal interesting findings, they also bear several
limitations to study eurozone exit risk. Survey data on exit risk INTRADE was only available
for a short period of time and may not be representative. Mispricing of sovereign bonds may
occur for several reasons other than eurozone exit risk and may therefore not be an unbiased
measure for our purposes. Calibrated models enable a low frequency analysis of economic
implications, but do not allow for a marked based high frequency derivation of a eurozone exit
risk measure.
The closest approach to ours is Krishnamurthy et al. (2014) who use the CDS bond basis
to derive an indicator of redenomination risk. They build on contractual differences between
credit default swaps (CDS) and bonds. For Italy, for example, CDS do not cover losses from
redenomination from euros into a new national currency and thus purely reflect default risk of
the underlying bond. Yields of euro denominated bonds, on the contrary, reflect default risk
and redenomination risk. Sovereign bond yields above the CDS premium would thus indicate
redenomination risk. For Portugal and Spain, CDS cover both losses from default and
redenomination. Consequently, the authors use the difference between CDS premiums and the
yields from U.S. dollar denominated bonds (which are purely driven by default risk). Similarly,
De Santis (2015) uses the differences in the premiums on euro denominated and US dollar
denominated sovereign CDS and interprets widening spreads as evidence for larger
redenomination risk.
We argue that this CDS based approach also has some limitations. First, it relies on
contractual details of CDS, which differ, for example, between Italy on the one hand and Spain
and Portugal on the other. If investors are not aware of these contractual differences, the pricing

4
of CDS may not result in an unbiased measure of eurozone exit risk. Second, during the
eurozone crisis, CDS became increasingly illiquid for many countries such as Greece and
Portugal, and therefore may not be used to study exit risk in these periods. Moreover, it is not
entirely clear if claims from bonds or CDS would be redenominated into a new national
currency after eurozone exit.
Our approach is based on ADRs, which are available for all GIIPS countries in the
eurozone. The same pricing assumptions hold for all ADRs alike and ADRs are sufficiently
liquid. Moreover, contrary to claims from bonds or CDS, where it is not clear (and may depend
on contractual details) if currency redenomination occurs after eurozone exit, it is certain that
domestic stocks would be traded in the new domestic currency and that ADRs would still trade
in US dollars after eurozone exit. Since investors are most likely aware of currency
redenomination of the ADRs’ underlying stocks, the pricing of ADRs offers a unique laboratory
to derive a high frequency indicator of eurozone exit risk.
Various aspects of the European debt crisis have been discussed by the literature. One
strand looks at systemic sovereign risk in the eurozone, determinants of sovereign bond yield
spreads or CDS returns as well as contagion between EMU member states (e.g. Ang and
Longstaff (2013), Benzoni et al. (2015), Corsetti et al. (2014), Costantini et al. (2014)). Other
papers focus on the bank-sovereign nexus (e.g. Acharya et al. (2014), Acharya and Steffen
(2015), Engler and Große Steffen (2016), Gaballo and Zetlin-Jones (2016), Popov and van
Horen (2015)). A third strand of literature relates to the effects of the measures taken in order
to tackle the Euro crisis, especially the (unconventional) monetary policy conducted by the ECB
(e.g. Drechsler et al. (2016), Eser and Schwaab (2016), Krishnamurthy et al. (2015)). Others
focus on the real effects of the Euro crisis. For example, Meinen and Roehe (2017) document
how investment in the eurozone is adversely affected by uncertainty shocks.
Our paper is also related to studies investigating the impact of financial crises on the
pricing of ADRs. Several interesting studies conclude that the returns on U.S. dollar-

5
denominated ADRs are negatively affected by currency crises as the devaluation of the local
currency depresses the dollar value of the underlying stock ( (Bailey et al. 2000); Kim et al.
(2000); (Bin et al. 2004)). (Pasquariello 2008) reveals that the outbreak of financial crisis is
associated with a disintegration of the local capital market as the pricing dynamics of ADRs
and their underlying stocks change. Another interesting strand of the literature shows how
capital controls can lead to price wedges between ADRs and their underlyings with underlying
studies being typically overpriced ( Melvin (2003); (Levy Yeyati et al., 2004); (Auguste et al.
2006); Arquette et al. (2008); Levy Yeyati et al. (2009). Several papers use ADRs to derive
exchange rate forecasts (Eichler et al. 2009) and to show that financial fragility measures
affected the relative pricing of ADRs and their underlyings Eichler (2011).
We borrow from these contributions to derive a novel eurozone exit risk indicator based
on the pricing of ADRs that is available in high frequency and sufficiently liquid.
The paper is organized as follows: Section 2 introduces the methodology and data and
provides some descriptive evidence. Section 3 analyzes the exposure of the banking sector to
eurozone exit risk. Section 4 looks at the exit risk exposure of stocks in different industries and
investigates the channels establishing this risk exposure. Section 5 concludes.
2. Methodology and Data
2.1 ADR pricing and eurozone exit risk
An American Depositary Receipt (ADR) represents ownership of a specific number of
underlying shares in the home market on which the ADR is written. While the underlying stock
is traded on the stock exchange of the respective eurozone country and is denominated in Euro,
the ADR trades in the United States and is denominated in U.S. dollars.
Since the ADR provides the same rights to the owner such as dividend claims and voting
rights like the underlying stock and ADR and underlying stock can be converted into each other
at a fixed conversion ratio, the exchange rate adjusted prices of both stocks should be equal:

6
𝑃𝐴𝐷𝑅𝑖,𝑡 =
𝑃𝑈𝑁𝐷𝑖,𝑡∗𝛾𝑖
𝑆𝑡 , (1)
with 𝑃𝐴𝐷𝑅𝑖,𝑡 𝑎𝑛𝑑 𝑃𝑈𝑁𝐷𝑖,𝑡
being the prices of the ADR and its corresponding underlying
stock, respectively, 𝛾𝑖 a fixed conversion parameter and 𝑆𝑡 the EUR/USD exchange rate.
For a fully credible eurozone membership of the country from where the underlying
originates, ADR returns are thus governed by the returns of the underlying stock and the
exchange rate:
𝑟𝑒𝑡𝑖,𝑡𝐴𝐷𝑅 = 𝛼𝑖 + 𝛽1𝑟𝑒𝑡𝑖,𝑡
𝑈𝑁𝐷 + 𝛽2𝑟𝑒𝑡𝑗,𝑡𝑆 + 𝜀𝑖,𝑡. (3)
If ADR investors do anticipate some risk that a country may leave the eurozone, ADR
returns should reflect such risk. The ADR market is an ideal laboratory for testing eurozone
exit risk. By controlling for the underlying stock and EUR/USD exchange rate returns, we
capture any unobserved company or macro risk factors that could affect ADR investors (by
influencing the value of the underlying stock or the euro) – except for country-specific
eurozone exit risk. Each type of unobserved omitted variables that could influence the value of
the underlying stock (such as, news on financial stability, the health of the firm, or the real
economy) and that would potentially bias the estimations, are absorbed by the underlying stock
returns that are control variables in the regression equation. Any omitted variables that should
influence the external value of the euro (such as systemic risk in the eurozone, the ECB’s or
Fed’s monetary policies, capital flight, macroeconomic imbalances), are absorbed in the
EUR/USD returns also controlled for in the regressions.
The currency redenomination and potential price loss of the underlying stock in dollar
terms associated with eurozone exit is the only systematic risk factor that affects ADR returns
(after controlling for underlying stock and EUR/USD exchange rate returns). This is because
any other company specific or macroeconomic shock affects the ADR and underlying stock in

7
the same way. Currency risk associated with eurozone exit is the only shock that can lead to a
one-time price drop of the ADR stock (relative to the redenominated underlying stock price) of
the same company and is thus the only systematic risk factor that may influence ADR returns
after controlling for underlying stock returns.
Since eurozone exit risk is unobservable, we introduce a country-specific instability
indicator in the regression, in order to test if ADR investors price eurozone exit risk in ADR
stocks. This financial stability indicator aims to capture fundamental vulnerabilities that may
explain why a country may leave the eurozone (such as sovereign default risk as well as fragility
in the banking sector and in the real economy in the considered country). We argue that if ADR
returns respond to such an indicator, eurozone exit risk is priced in ADR returns and thus ADR
investors perceive such risk. On the contrary, if no eurozone exit risk is perceived, such a
vulnerability indicator would not be priced in ADR returns.
In order to obtain a single variable that comprises different incentives to leave the
eurozone, we calculate the first principal component out of three market based factors: the 10
years sovereign bond yield spread (relative to Germany)3, the returns of the country’s bank
stock index, and the intraday volatility of the local stock index. Intraday stock market volatility
is calculated using five minute ticks from Thomson Reuters Tick History. Data on bank indices
are taken from Thomson Reuters Tick History. Sovereign yield spreads are taken from
Thomson Reuters Eikon.
We select these three market based measures for two reasons. First, these measures are
available at daily frequency and thus can be used in an asset pricing framework of ADRs.
Second, each of these three indicators captures an economic vulnerability that represents an
incentive to leave the eurozone. Higher sovereign default risk (as indicated by higher sovereign
bond spreads) indicates that the domestic government is less able to avert sovereign default
3 For Germany, we use CDS with maturity of ten years instead.

8
within the eurozone but would rather opt to exit the eurozone in order to minimize the real value
of its public debt. A more fragile banking sector (measured by lower bank stock returns) may
also be recapitalized and restructured more effectively outside the Eurozone. Larger economic
fragility (as indicated by higher intraday stock return volatility) increases the incentive to leave
the Eurozone and to restore the competitiveness of the domestic economy by external
devaluation (rather than the long lasting process of internal devaluation). The relationship
between stock market volatility and real economic activity has been well documented by the
literature (e.g. Engle et al. (2013), Errunza & Hogan (1998)).
Since we expect each of those three factors to have a distinct influence for each of the
countries in our sample, we conduct the PCA for each country separately so that the
eigenvectors are allowed to vary between countries. We obtain the variable 𝐸𝐸𝑅 𝑑𝑟𝑖𝑣𝑒𝑟 by
multiplying the respective values of each of the three variables considered with the
corresponding eigenvector derived from the PCA:
𝐸𝐸𝑅 𝑑𝑟𝑖𝑣𝑒𝑟𝑗,𝑡 = 𝜆𝑆𝑀𝑉 ∗ 𝑆𝑀𝑉𝑗,𝑡 + 𝜆Δ𝐵𝑎𝑛𝑘𝑗∗ ∆𝐵𝑎𝑛𝑘𝑗,𝑡 + 𝜆∆𝑆𝑌𝑆𝑗
∗ ∆𝑆𝑜𝑣𝑗,𝑡 (4)
𝑆𝑀𝑉 … 𝑖𝑛𝑡𝑟𝑎𝑑𝑎𝑦 𝑠𝑡𝑜𝑐𝑘 𝑚𝑎𝑟𝑘𝑒𝑡 𝑣𝑜𝑙𝑎𝑡𝑖𝑙𝑖𝑡𝑦
∆ 𝐵𝑎𝑛𝑘 … 𝑏𝑎𝑛𝑘 𝑖𝑛𝑑𝑒𝑥 𝑟𝑒𝑡𝑢𝑟𝑛
∆ 𝑆𝑜𝑣 … 𝑑𝑎𝑖𝑙𝑦 𝑐ℎ𝑎𝑛𝑔𝑒 𝑖𝑛 𝑡ℎ𝑒 𝑠𝑜𝑣𝑒𝑟𝑒𝑖𝑔𝑛 𝑦𝑖𝑒𝑙𝑑 𝑠𝑝𝑟𝑒𝑎𝑑 𝑜𝑓 10𝑦 𝑠𝑜𝑣𝑒𝑟𝑒𝑖𝑔𝑛 𝑏𝑜𝑛𝑑𝑠 𝑣𝑠. 𝐺𝑒𝑟𝑚𝑎𝑛𝑦
Table 1 in the appendix shows the resulting eigenvectors as well as KMO measures and
the number of observations by country. As a robustness check, we conduct the principal
component analysis using a rolling window of 500 trading days. We find that the resulting
principal components are almost perfectly correlated with those resulting from the time-
invariant approach suggesting that the relation between returns of the bank index, stock market
volatility and changes in the sovereign yield spread are fairly stable over time, at least for our
sample period from 2008 to 2015. Table 2 in the appendix shows averages of the time-varying

9
eigenvectors and KMO measures as well as correlations with the principal components obtained
by the time-invariant approach by country.4
2.2 First-stage regression approach
In order to derive an indicator of eurozone exit risk based on ADR data, we estimate the
following equation in a rolling-regressions framework with an estimation window of 60 trading
days using OLS with Huber-White-standard errors:
𝑟𝑒𝑡𝑖,𝑗,𝑡𝐴𝐷𝑅 = 𝛼𝑖,𝑇 + 𝛽1,𝑖,𝑗,𝑇 𝑟𝑒𝑡𝑖,𝑗,𝑡
𝑈𝑁𝐷 + 𝛽2,𝑖,𝑗,𝑇 𝑟𝑒𝑡𝑡𝑆 + 𝛽𝑖,𝑗,𝑇
𝑒𝑥𝑖𝑡 𝑟𝑖𝑠𝑘𝑒𝑥𝑖𝑡 𝑟𝑖𝑠𝑘 𝑑𝑟𝑖𝑣𝑒𝑟𝑗,𝑡 + ∑ 𝛽𝑙,𝑖,𝑗,𝑇 ∗𝐿𝑙=1
𝑋𝑙,𝑡 +𝜀𝑖,𝑗,𝑡 (5)
where i is an index for the pair of a specific ADR and its corresponding underlying stock, j
represents the country in which the underlying stock is traded, and T denotes the day for which
the respective rolling regressions window is estimated. ∑ 𝑋𝑙,𝑡𝐿𝑙=1 captures the returns of the S&P
500 and weekday dummies as control variables, 𝛼𝑖,𝑇 is the intercept, and 𝜀𝑖,𝑗,𝑡the error term.
Table 3 in the appendix reports the variables and their sources used in the first-stage regression.
In order to derive an indicator of eurozone exit risk, we compute the semi-partial R² of
the exit risk driver drawn from the time series regressions in equation 5. The semi-partial R² is
defined as the share of the total variation of the dependent variable that is explained by the
variation of the respective explanatory variable that contains additional information i.e. that is
orthogonal to the other explanatory variables5. The semi-partial R² indicates how much of the
variation of the returns of ADR from countries that might potentially leave the eurozone can be
explained by the information contained in the eurozone exit risk driver – additional to that
4 However, there might be certain subperiods for single countries where the eigenvectors derived from the rolling
window approach might not have the signs consistent with our interpretation of the eurozone exit risk driver, i.e.
𝜆𝑆𝑀𝑉 and 𝜆∆𝑆𝑌𝑆𝑗 are not positive, respectively 𝜆Δ𝐵𝐼𝑗
is not negative. Therefore, we opt against this more flexible
approach, having shown though that the following results would not alter too much using this alternative
specification.
5 For discussions of the concept of semi-partial correlations see e.g. Fisher (1924) and Baba et al. (2004)

10
already contained in the return of the EUR/USD exchange rate and the return of the respective
underlying of the ADR. We hypothesize that the more probable the eurozone exit of a specific
country, the more important the eurozone exit risk driver will be as a pricing factor in ADR
returns as identified by the semi-partial R².
Our panel consists of 143 ADRs from eight eurozone member countries: France,
Germany, Greece, Ireland, Italy, Netherlands, Portugal and Spain over the period January 1st
2008 to June 30th 20156. Table 4 in the Appendix lists the ADRs used in the analysis. In order
to analyse eurozone exit risk we focus the GIIPS countries (Greece, Ireland, Italy, Portugal,
Spain). As a placebo test, we also apply our approach the remaining stable countries (France,
Germany and Netherlands) in order to check whether the patterns we observe for the crisis
countries do not hold for these countries as well. We do not include ADRs from Austria,
Belgium and Finland due to a limited number of ADRs and insufficient trading activity.
We identify potential pairs of ADRs and underlying stocks using information from the
ADR databases of JP Morgan, the Bank of New York Mellon as well as from Thomson Reuters
DATASTREAM. We consider Level I, II and Level III ADRs. We make sure that only ADRs
that are being traded with satisfactory liquidity are considered. We keep all ADRs that have at
least twenty observations by quarter for at least four consecutive quarters and whose mean daily
trading volume exceeds 1,000 ADRs traded. We check for correct matches of ADRs with their
respective underlying stock by regressing ADR returns on the return of their underlying and the
USD/EUR exchange rate and making sure that the estimated coefficients are significant. We
exclude extreme outliers which we define as observations with an abnormal return of more than
20 % or less than – 20 %. That yields a sample with a total of 148,844 observations. Prices of
ADRs and their respective underlyings as well as the EUR/USD exchange rate and the values
of the S&P 500 are taken from Thomson Reuters Tick History. In order to guarantee the most
6 This ending of our sample period is determined by the closing of the Greek stock market closed on June 27 th
2015.

11
synchronous match possible between prices, we consider the last value available prior to 3:00
pm UTC for each day because at that time all eurozone as well as the US stock market operate
in regular mode. Only for Greece, during DST we use last prices prior to 2:00 pm UTC since
otherwise an overlap of trading hours with the US stock markets would not be guaranteed.
2.3 Descriptive Evidence and Results
Figure 1 – 8 in the appendix illustrate the evolution of our eurozone exit risk measure, i.e.
the semi-partial R² of the exit risk driver estimated within the rolling regressions framework as
described in section 2.2, over the sample period from January 1st to June 30th 2015 by country7.
The eurozone exit risk indicator shows remarkable time series variation for the crisis
countries. Our indicator for the whole sample reaches its maximum for Greece in September
2012 when about 11 % of the total variation of ADR returns was explained by the Greek exit
risk driver.8 On the contrary, the eurozone exit risk indicator for Germany is only 0.2 % on
average. Also for France and the Netherlands, the absolute size of the indicator is negligible
and the time series variation also appears to be random. A simple pooled OLS regression
approach with country dummies reveals that eurozone exit risk is significantly higher values
for the GIIPS countries than for France, Germany and Netherlands (see Table 5 in the
appendix). Thus, we find evidence for a systematic difference in the pricing of ADRs between
crisis and non-crisis countries and attribute this to the presence of significant eurozone exit risk
assessed by investors for the GIIPS-countries.
In the next section, we analyse the exposure to eurozone exit risk in the banking sector.
7 For this analysis here and all future calculations, we calculate country-specific eurozone exit risk as the average
of the measure obtained by ADR as described in 2.2 over all ADRs from the specific country.
8 Please note that this percentage cannot be directly transformed into the probability that Greece would leave the
eurozone.

12
3. Exposure to Eurozone Exit Risk in the banking sector
3.1 Evidence from aggregate country bank indices
In this section, we test whether eurozone exit risk, as identified by our measure extracted
from the ADR market, is priced in European banks stocks. In Section 3.1 we focus on aggregate
bank indices by country to study the exposure of domestic banks to domestic eurozone exit risk
and to the exit risk of other countries. In Section 3.2 we analyse the determinants of the exposure
to exit risk at the individual bank level.
A most reasonable expectation would be that eurozone exit will negatively affect banks.
However, effects might differ between domestic banks affected by the exit risk of their home
country and banks in a third country affected by the exit risk of one of the crisis countries. For
the effect of exit risk on domestic banks, multiple channels are theoretically possible that might
work against each other. On the one hand, credit and asset losses due to economic disruptions
may occur. A sovereign default simultaneous with eurozone exit would depress the value of
sovereign bond holdings. Cheap funding from the ECB would no longer be available. On the
other hand, eurozone exit may also have positive implications for domestic banks, at least in
the medium and long term. External devaluation may restore the competitiveness of the
domestic economy, thereby improving the economic outlook and credit demand. Also, a
restructuring and recapitalization of weak domestic banks may resolve structural problems in
the banking sector, thereby restoring trust and the functioning of the interbank market. Since
the overall effect is not clear, it remains an empirical question to test how financial markets
judge the exposure of domestic banks to eurozone exit risk. Regarding the spillover effects of
eurozone exit risk on banks in a third country, we argue that the balance sheet channel can be
expected to be dominant over the other effects and thus expect banks from third countries to be
negatively affected by eurozone exit risk of the crisis countries.
In order to evaluate the exposure of domestic banks to eurozone exit risk, we regress the
domestic EUROSTOXX bank stock index returns on the ADR based eurozone exit risk

13
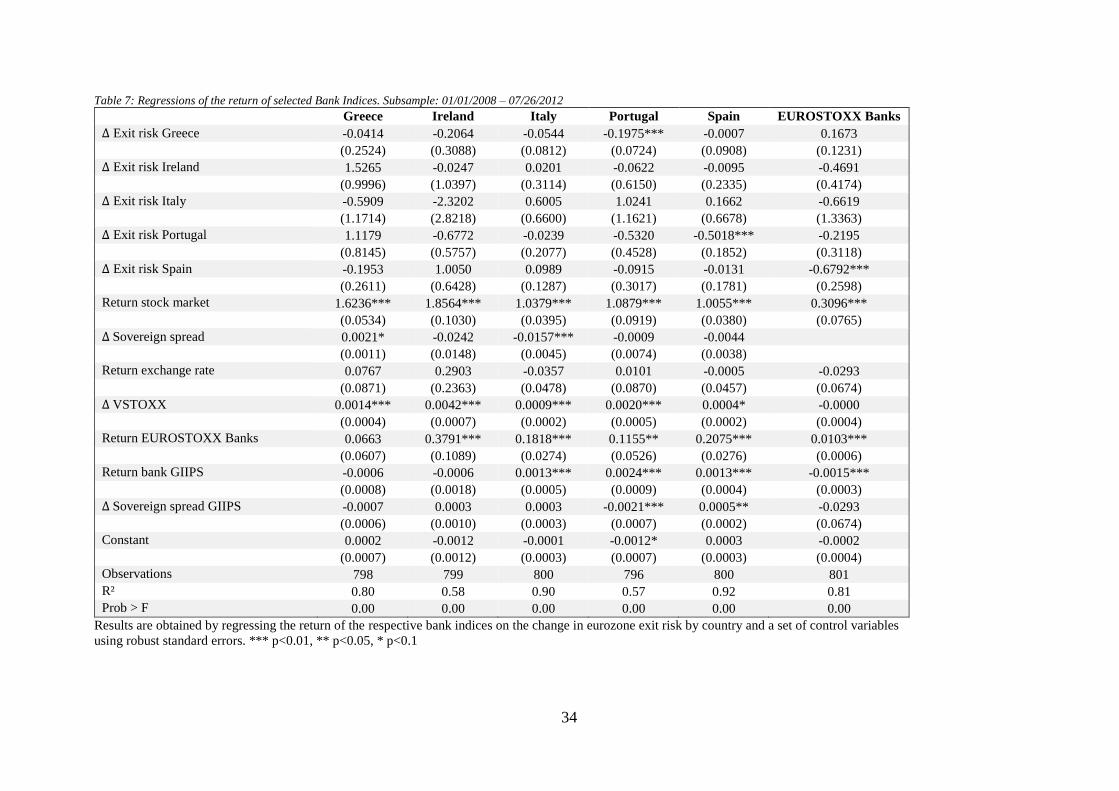
indicators derived in Section 2. Results are displayed in Table 6 and Table 7. For each of the
GIIPS countries, we estimate a model including domestic eurozone exit risk as well as the exit
risk indices of the other four countries. A battery of control variables accounts for banking
sector, sovereign, and economic risks in the considered country, the GIIPS aggregate, and the
eurozone. Control variables include the return of the stock market and the change in the
sovereign yield spread of the respective country, the return of the EUR/USD exchange rate and
the change in VSTOXX as proxies for systemic risk of the whole eurozone as well as the return
of EUROSTOXX Bank Index and first principal components of the GIIPS countries’ bank
indices (return bank GIIPS) and sovereign yield spreads (∆ sovereign spread GIIPS).
We argue that if we find some evidence for the impact of one country’s exit risk on the
banking sector of another country, this effect might be truly attributed to exit risk of this country
after having controlled for potential correlations of markets and spillover effects. For each
country, we run regressions for two samples: the whole sample from January 1st to June 30th
2015 and a subsample from January 1st to the famous “whatever it takes”-speech by Mario
Draghi on July 26th 2012.
We do not find evidence that eurozone exit risk has a significant positive or negative effect
on bank stock returns in the considered GIIPS countries. A possible explanation for this result
may be that – according to ADR investors’ assessment – the costs and benefits of eurozone exit
may balance each other out in the GIIPS countries considered. While current discussions
typically stress the negative effects of eurozone exit (short term asset losses, disruptions in
financing), investors may also see long term benefits of leaving the eurozone such as a
restructured domestic banking system and a restored competitiveness of the domestic economy,
which may spur credit demand and interest rate mark ups. Overall, financial markets appear to
believe that the discounted value of net long term benefits of leaving the eurozone may be as
large as the short term costs of euro exit.

14
Considering the cross country spillover effects, we find robust evidence that the Portuguese
bank stock returns are adversely affected by Greek exit risk, especially during the subsample
period January 2008 to July 2012. The same applies to the Spanish bank stock returns which
load negatively on Portuguese exit risk. Looking at the aggregate EUROSTOXX Bank Index
(which is mostly dominated by banks from Spain and Italy), we find that Spanish eurozone exit
risk significantly affected returns.
These cross-country spillover effects may be explained by an indirect and a direct channel.
There might be an indirect channel through financial stability. If a country leaves the eurozone,
one would expect significant short term turmoil on financial markets with negative impacts on
the banking system in the whole eurozone, e.g. due to asset losses or worsening of refinancing
conditions. We argue that we account for such effects by including control variables that proxy
for pan-eurozone systemic risk such as the EUR/USD-exchange rate, ∆VSTOXX, the return of
the EUROSTOXX Banks index as well as the first principal component of returns of GIIPS
countries’ individual banking indices and sovereign yield spreads. Therefore, we argue that the
effects we detect here should be rather attributed to a direct channel. Exit risk of one country
will have an effect on the performance of a bank in another country if this bank has direct
exposure to this country, either in the form of sovereign exposure or private credit exposure. In
either way, the exit of the respective country would cause balance sheet losses to the bank if
the exiting country introduced a new currency which then devalued sharply against the EUR.
The evidence provided in this section indicate a direct channel of eurozone exit risk of one
country on stock performance of a bank in another country. Banks in Portugal might be affected
by Greek exit risk and Banks in Spain by Portuguese exit risk because they have a high exposure
to those countries. In order to test this hypothesis, we look at the performance of individual
banks dependent on their exposure to the GIIPS countries in the next section.

15
3.2 Evidence from individual bank level data
In this section we investigate why banks are exposed differently to eurozone exit risk. A
key finding of the previous section was that – while euro exit risk of the domestic country are
not priced in domestic bank stocks – euro exit risk of other countries are significant
determinants of bank stock performance. A sensible explanation for these cross-country
spillovers of eurozone exit risk are bilateral asset holdings of banks. We would expect that
banks with higher credit exposure to the crisis countries should be affected more severely than
banks with no or low credit exposure. In order to test this empirically, we consider all banks
that were subject of the 2011 EU-wide stress test that was conducted by the European Banking
Authority (EBA) and that are listed on the stock market. Our sample includes 53 banks from
19 countries in the EU including non-Eurozone banks. Table 8 in the appendix provides on
overview together with some balance sheet information of those banks.
The variable describing exposure we use is “Total Exposure at Default” (EAD) as provided
by the EBA Stress Test Results 2011 with the information code “33021". Those include
exposure “for securitisation transactions, counterparty credit risk, sovereigns, guaranteed by
sovereigns, public sector entities, central banks, equities, etc.” (EBA 2011). We scale this
exposure variable by dividing it by “Total Assets” (information code “30029”).9
In a different specification that we do not report here due to limitations with regard to space,
we also use Sovereign Exposure (Gross Direct Long Positions, information code “34010”), but
did not find any significant and robust results.
At a first glance, descriptive evidence in Table 25 seems to support our hypothesis from
before that exit risk affects those banks that have the highest credit exposure most. Credit risk
9 “Total assets after the effects of mandatory restructuring plans publicly announced and fully committed and equity raised and fully committed by 30 April 2011” (EBA 2011). Because the credit risk exposure data we use relates to December 31st 2010, we obtain a ratio EAD/Total Assets of greater than 100% as it is the case for Italian credit risk exposure of Unione de Banche Italiane SpA,

16
exposure to Greece relative to total assets for the three Portuguese banks in our sample is about
2.57% on average, whereas it is only about 0.17% for all other banks that are neither from
Greece, Cyprus or Portugal. Spanish banks also have a significantly higher credit risk exposure
to Portugal than all other (excluding Portuguese) banks in our sample: 1.45% vs. 0.14% on
average. Next, we want to test our hypothesis more analytically.
In order to investigate the relevance of bilateral asset claims (as measured using holdings
of sovereign bonds and credit claims) for the exposure to Eurozone exit risk of the GIIPS
countries, we conduct a two-step regressions approach. In the first step, we run time-series
regressions for each of the 53 banks in our sample and each of the five GIIPS countries, where
individual bank stock returns of all banks (excluding country j) are regressed on exit risk of
country j:
𝑟𝑒𝑡𝑖,𝑡𝑏𝑎𝑛𝑘 = 𝛼𝑖,𝑡 + 𝛽𝑒𝑥𝑖𝑡 𝑟𝑖𝑠𝑘,𝑖,𝑗 ∆𝑒𝑥𝑖𝑡 𝑟𝑖𝑠𝑘𝑗,𝑡 + ∑ 𝛽𝑙,𝑖,𝑡 𝑋𝑙,𝑡
𝑘
𝑙=1
+ 𝜀𝑖,𝑡
where ∑ 𝑋𝑙,𝑡 𝑘𝑙=1 represents a set of control variables (∆VSTOXX, return of the respective
home country stock index, ∆ sovereign yield spread of the respective country, first principal
component of the returns of GIIPS countries’ bank indices and ∆ of sovereign yield spreads).
For the second-stage regression approach, we use the resulting exposures to eurozone exit
risk, 𝛽𝑒𝑥𝑖𝑡 𝑟𝑖𝑠𝑘,𝑖,𝑗 as the dependent variable in a cross section framework. As potential
determinants of bilateral eurozone exit risk exposures we consider bank-specific variables such
as the credit risk exposure to the GIIPS countries and other controls such as proxies for size
(log assets), risk structure (risk-weighted assets to total assets) and capital-adequacy (Tier 1
capital to risk-weighted assets):
𝛽𝑒𝑥𝑖𝑡 𝑟𝑖𝑠𝑘,𝑖,𝑗 = 𝛼 + 𝛽𝐸𝐴𝐷,𝑗 𝐸𝐴𝐷𝑖𝑗 + ∑ 𝛽𝑙 𝑋𝑙
𝑘
𝑙=1
+ 𝜀𝑖,𝑗

17
For each of those cross sectional regressions, we exclude the banks residing in the
country j whose exit risk we use as dependent variable to avoid possible problems of
endogeneity due to the link of banking sector stability and exit risk and to ensure that our results
are not driven by extreme outliers. For Greece, we also exclude banks from Cyprus due to the
close financial link between those two countries. Since the cross-sectional dimension is rather
limited, results from those regressions have to be seen with caution, but can still provide some
worthy insights.
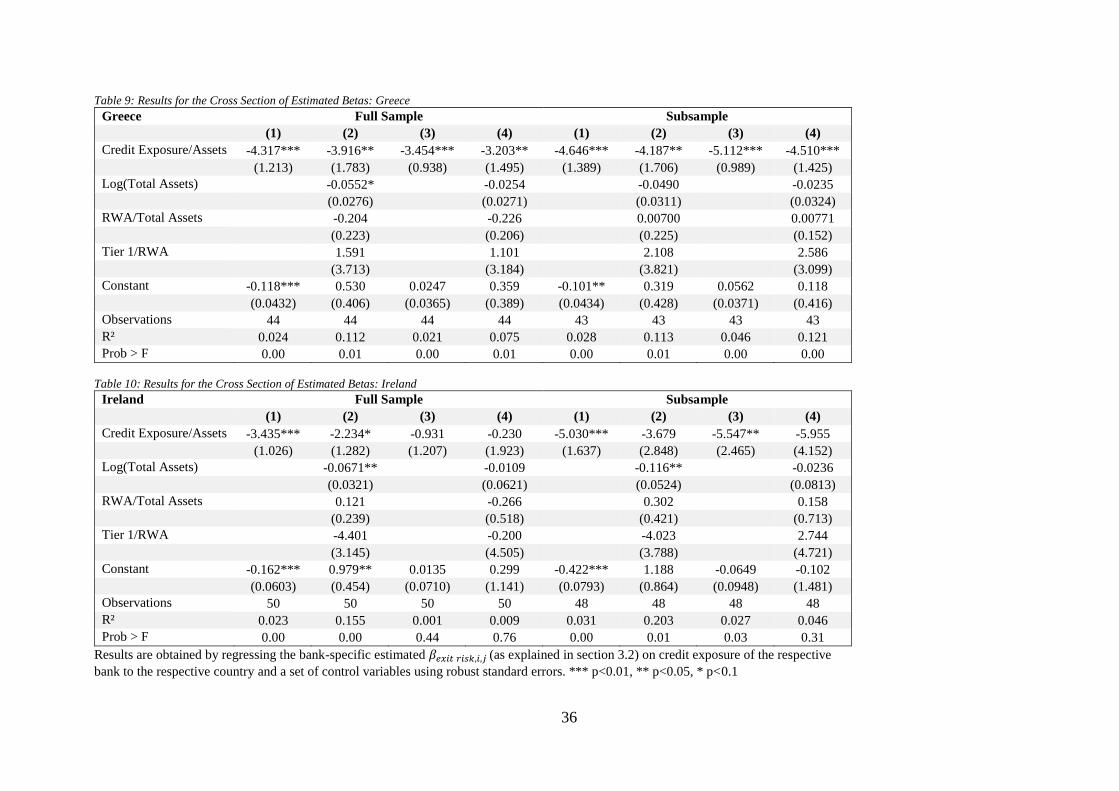
The results from the regressions are shown in Table 9 - Table 13.We estimated a variety
of different specifications, including various control variables in both, the first and the second
stage. Due to limitations with respect to space, we only report results from selected
specifications. Specifications (1) – (2) relate to regressions where we did not include any control
variables at all in the first stage, Specifications (3) – (4) to those regressions where we included
all control variables10.
For all GIIPS countries except for Italy, we find evidence for a significant relation
between the credit risk exposure as measured by EAD/Total Assets and the 𝛽𝑒𝑥𝑖𝑡 𝑟𝑖𝑠𝑘,𝑗 we
estimated in the first stage. Stock returns of banks that have higher credit risk exposure react
more sensitively to exit risk of the respective country, i.e. they are more negatively affected if
exit risk rises. Effects are particularly strong for the subsample from January 2008 to July 2012.
Regarding the other bank-specific balance sheet characteristics we include in the second stage
of those regressions, we can conclude that larger banks, i.e. banks with higher (log) total assets
are affected more by eurozone exit risk. For Portuguese exit risk, bank returns respond more
sensitively for less capitalized banks, i.e. banks with a lower ratio of Tier 1 Capital/Risk
Weighted Assets.
10 ∆VSTOXX, return of the respective home country stock index, ∆ sovereign yield spread of the respective
country, first principal component of the returns of GIIPS countries’ bank indices and ∆ of sovereign yield spreads

18
In the next step, we test whether we can attribute risk premia in bank stocks to eurozone
exit risk of GIIPS countries. Therefore, we test whether the cross section of average returns of
individual bank stocks can be explained by individual banks’ exposure to exit risk:
𝑟𝑒𝑡𝑖𝑏𝑎𝑛𝑘 = 𝛼 + 𝛽1,𝑗 𝛽𝑒𝑥𝑖𝑡 𝑟𝑖𝑠𝑘,𝑖,𝑗 + ∑ 𝛽𝑙 𝑋𝑙,𝑖
𝑘
𝑙=1
+ 𝜀𝑖
The results are reported in Table 14 and Table 15 For the full sample period, we find that
bank stocks with greater exposure to Irish exit risk, i.e. stocks for which we estimated a more
negative 𝛽𝑒𝑥𝑖𝑡 𝑟𝑖𝑠𝑘,𝑖,𝑗 in the first stage, performed significantly better. The same is true for bank
stocks with exposure to Italian exit risk, but this time only for the subsample period from 2008
to July 2012Investors who consider investing in European bank stocks demand risk premia
when buying these stocks in order to be compensated for the risk of eurozone exit. Those results
also reveal that exit risk premia of Greece, Portugal and Spain were not priced in bank stock
returns.
4. Exposure to Eurozone Exit Risk in the Real Sector
4.1 Hypothesized company specific determinants of the exposure to Eurozone Exit Risk
Eurozone exit would be associated with a number of macroeconomic shocks including
devaluation of the new domestic currency, disintegration of domestic capital markets, and
changes in expected inflation and economic growth. Since these changes in the macroeconomic
environment will affect the cash flows of companies, companies’ stocks returns may be affected
by exit risk. In the following, we investigate the exposure to eurozone exit risk at the individual
company level and study company specific and sectoral characteristics that may determine this
exposure.
Since we are not aware of existing studies investigating the impact of eurozone exit risk
on the performance of single companies, we cannot lean on existing hypotheses how different
companies react to exit risk. Given that the domestic currency would depreciate sharply after
19
exiting the eurozone, we lean on the literature investigating the impact of currency depreciations
on stock performance of individual companies (e.g. Choi and Jay (1995); Forbes (2002a); Glen
(2002)11.
For our hypothesis formation with regard to the determinants of the impact of eurozone
exit risk on individual company’s stock performance, we follow Forbes (2002a) who lists six
dimensions of company-specific variables that determine the impact of a (large) devaluation of
the domestic currency on company-specific stock performance: output characteristics, foreign
exposure, production structure, debt ratios, size and profitability. Depreciations of the local
currency will give companies producing traded goods a relative cost advantage while this is not
the case for companies producing nontraded goods. Thus the performance of companies
producing traded goods should improve relative to that of companies producing nontraded
goods. Second, companies with significant foreign sales would be expected to perform better
following depreciations. Also, companies with a low intensity of capital relative to labor are
expected to have better performance after a depreciation of the local currency. Forbes (2002a)
further argues that devaluation particularly hurts companies with higher outstanding debt ratios
since foreign debt would be appreciated. While Forbes (2002a) focuses on emerging market
companies with high foreign debt ratios, our eurozone sample is largely populated by
companies where funds are typically financed domestically. The redenomination of debt after
euro exit would thus lead to a devaluation of outstanding debt. With regard to company size,
Forbes (2002a) argues it is not a priori clear if larger companies are expected to be more or less
affected by depreciations of the local currencies since multiple effects might counteract each
other. For example, while larger companies are more likely to have access to better financing
conditions, also during lending contractions and are more likely to hedge against currency risk,
11 However, it must be kept in mind that this literature focuses mostly on emerging market economies where the
drivers of a company’s response to a devaluation of the local currency might be significantly different from those
in eurozone membership countries.

20
they are also more likely to borrow heavily in foreign currencies and are therefore more exposed
to negative balance sheet effects following depreciations. Also for company profitability,
Forbes (2002a) does not state a clear hypothesis regarding the sign of the impact of a local
currency devaluation since various effects might against each other.
4.2 Results
Our sample consists of 333 stocks from Greece, Ireland, Italy, Portugal and Spain. We
include all stocks included in the DATASTREAM sector indices.12 We begin our analysis by
looking at the whole sample of stocks from the five GIIPS countries by estimating the following
panel regressions with company fixed effects and robust standard errors:
𝑟𝑒𝑡𝑖,𝑗,𝑠,𝑡 = 𝛼𝑖 + 𝛽𝑒𝑥𝑖𝑡 𝑟𝑖𝑠𝑘 ∆ 𝑒𝑥𝑖𝑡 𝑟𝑖𝑠𝑘𝑗,𝑡 + ∑ 𝛽𝑙 𝑋𝑙,𝑗,𝑡
𝑘
𝑙=1
+ ∑ 𝛽𝑛 𝑍𝑛,𝑡
𝑚
𝑛=1
+ 𝜀𝑖,𝑗,𝑠,𝑡
We regress the stock return of company i from country j and industry s on the change in
eurozone exit risk of the respective country as well as on a set of country-specific control
variables (return of the home stock market and the change in the sovereign yield spread) and a
set of control variables for the whole eurozone (return of the DATASTREAM EMU sector
index of the respective industry, the change in VSTOXX and the return of the EUR/USD-
exchange rate).
As can be seen inTable 16, we do not find a significant impact of eurozone exit risk on
individual company’s stock performance if we look at the whole sample of companies. This
supports our notion stated above that it is not a priori clear whether companies will be positively
or negatively affected by eurozone exit risk. While the effect might be significantly positive for
12 For the analysis in this section, we exclude Financials for several reasons. First, we already studied them in
chapter 3. Second, the theoretical channels how exit risk affects companies from the real sector might be quite
different from those from the financial sector as we explained in the previous section. Third, financials might act
as outliers with regard to certain company-specific factors such as the ratio of total debt to total asset and therefore
might have a substantial impact on the results of this analysis.

21
some companies, it might be significantly negative for others, so that the aggregate effect
becomes insignificant.
Exposure to eurozone exit risk may be heterogeneous across different industries.
Therefore, we deepen our analysis in the next step by estimating the same equation as above
for each panel of stocks within the same industry. We use the FTSE/DJ Industry Classification
Benchmark (ICB) in order to assign each stock to one of the nine following industries: Basic
Materials, Consumer Goods, Consumer Services, Health Care, Industrials, Oil and Gas,
Technology, Telecommunications and Utilities.
The results are displayed in Table 17 to Tabel 25. While for six out of the nine industries,
no exposure to eurozone exit risk is detected, we find that Health Care and Telecommunications
stocks are significantly negatively affected by eurozone exit risk, while Oil and Gas stocks are
significantly positively affected by increases in eurozone exit risk. Companies from the Oil and
Gas industry in our sample are quite different from those from the Telecommunications industry
with regards to the amount of foreign sales: On average, for Oil and Gas companies the Foreign
Sales to Total Sales ratio equals 55.1% (the highest value across all industries), while this ratio
is only 26.93% for companies from the Telecommunications industry. Also, 75% of all Oil and
Gas companies are classified as primarily producing tradable goods following the Forbes
(2002b) classification (compared to 47.95% for all companies across industries) while this is
not the case for a single company from the Telecommunications industry. This evidence seems
to support our hypotheses stated above. In general, one might expect the Oil and Gas industry
to be one of the major winner industries in the case of a eurozone exit since it exports mostly
commodities denominated in U.S. dollars which would result in increased local currency
revenues after the deprecation of the newly introduced currency following eurozone exit. On
the other hand, the Telecommunications industry is a key example of an industry with low
foreign exposure and thus limited potential for economic gains following eurozone exit. Given
the only limited upside of the domestic currency value of cash flows in the Telecommunication

22
industry, devaluation of the new domestic currency would lead to a depression of the euro/dollar
value of the cash flows, which would explain why rising exit risk significantly lowers returns
of those stocks. With regards to the Health Care industry, the fact that stocks respond
significantly negatively to increases in exit risk cannot be explained by its foreign exposure
which is about the same magnitude than for all other companies This industry, however is
special with regards to two other measures: it is (after Technology) the most labour-intense
industry with a ratio of Total Assets/Total Employees of 299.15 U.S. dollars compared to
916.21 U.S. dollars on average over all other industries and it has a lower ratio of total debt to
total assets (27.34% compared to 31.36% over all other industries). A potential explanation for
the negative exposure to euro exit risk may be a disproportionately high reliance on public
funding in the Health industry. As disruptions in sovereign solvency are likely after eurozone
exit, companies in the Heath Care industry may be also be hit by disruptions in revenues. Of
course, it might be industry-specific factors other than those we can measure directly by the
data we have that explain while companies from the Health Care industry respond negatively
to increases in eurozone exit risk.
In the next step, we aim to explain the company specific exposure to eurozone exit risk
by company-specific factors, even after controlling for industry membership. Therefore, we
follow a two-stage estimation strategy similar to that we used for the stocks of European banks
in Section 3.2. In the first step, we regress the return of stock i from country j and sector s on
the change in the home country’s exit risk together with the same set of control variables as
stated above (return of the home stock market, change in the sovereign yield spread, return of
the DATASTREAM EMU sector index of the respective industry, change in VSTOXX and the
return of the EUR/USD-exchange rate).
𝑟𝑒𝑡𝑖,𝑗,𝑠,𝑡 = 𝛼𝑖,𝑗,𝑠 + 𝛽𝑒𝑥𝑖𝑡 𝑟𝑖𝑠𝑘,𝑖,𝑗,𝑠 ∆𝑒𝑥𝑖𝑡 𝑟𝑖𝑠𝑘𝑗,𝑡 + ∑ 𝛽𝑙,𝑖,𝑗,𝑠 𝑋𝑙,𝑗,𝑡
𝑘
𝑙=1
+ ∑ 𝛽𝑛,𝑖,𝑗,𝑠 𝑍𝑛,𝑡
𝑚
𝑛=1
+ 𝜀𝑖,𝑗,𝑠,𝑡
23
By running these time-series regressions for each of the 415 stocks in our sample, we
obtain one estimate of 𝛽𝑒𝑥𝑖𝑡 𝑟𝑖𝑠𝑘,𝑖,𝑗,𝑠 for each stock. In the next step, we explain the cross-section
of estimated 𝛽𝑒𝑥𝑖𝑡 𝑟𝑖𝑠𝑘,𝑖,𝑗,𝑠 by a set of company-specific variables using country and industry
fixed effects:
𝛽𝑒𝑥𝑖𝑡 𝑟𝑖𝑠𝑘,𝑖,𝑗,𝑠 = 𝜇𝑗 + 𝛾𝑠 + ∑ 𝛽𝑙 𝑋𝑙,𝑖 𝑘𝑙=1 + 𝜀𝑖,𝑗,𝑠
We check whether the six variables suggested by Forbes (2002a) have explanatory
power for the impact of eurozone exit risk on individual company’s stock performance even
with respect to within-industry and within-country heterogeneity. The results are summarized
in Table 26. Descriptive evidence and sources of the company-specific variables used are
displayed in Table 27.
After controlling for country and industry fixed effects, we find that the ratio of total
debt to total assets is the only variable that can explain why companies respond differently to
eurozone exit risk. Companies which are more heavily indebted respond less negatively,
respectively more positively, to increased eurozone exit risk of their home country. As the
majority of debt in eurozone countries is originated in euros, redenomination of the company
debt into the new national currency after eurozone exit and the subsequent inflationary
environment would effectively reduce the debt burden of companies. Highly indebted
companies may therefore benefit most from eurozone exit.
5. Conclusion
We introduce a novel approach to identify the risk of a single country leaving the eurozone
as assessed by investors of American Depositary Receipts (ADRs). As a proxy for investors’
mistrust in eurozone membership, we look at the fraction of ADR returns that is explained by
the first principal component of the underlying country’s sovereign yield spread, returns of its
bank index and volatility of its stock indices. We believe that our approach to identify eurozone

24
exit risk is superior to yet existing approaches because it is less restricted with respect to its
applicability and because doubts with regard to liquidity should be of minor concern.
Our dataset consists of 143 ADRs from eight eurozone countries: France, Germany, Greece,
Ireland, Italy, Netherlands, Portugal and Spain over the time period from January 2008 to June
2015. We find that our exit risk measure is significantly higher over the whole sample period
for the GIIPS countries than for the non-GIIPS countries which we include as a placebo test.
Next, we study how stocks of European banks were affected by eurozone exit risk. We find
that banks with higher credit risk exposure to the respective country are more adversely affected
by its exit risk. We also find evidence for significant risk premia in returns of European bank
stocks with respect to the exit risk of Greece, Ireland and Italy.
Third, we look at the impact of eurozone exit risk on the real sector in the GIIPS
countries. We find that companies from the Health Care and Telecommunications industries
respond significantly negatively to increases in exit risk, while companies from the Oil and Gas
industry respond significantly positively. Also, more highly indebted companies tend to
respond more positively.

25
Appendix:
Table 1: Resulting eigenvectors from the principal component analysis
Country 𝝀𝑺𝑴𝑽𝒋 𝝀𝚫𝑩𝒂𝒏𝒌𝒋
𝝀∆𝑺𝒐𝒗 KMO Observations
France 0.43 -0.68 0.59 0.52 2,034
Germany13 0.38 -0.68 0.63 0.52 1,927
Greece 0.54 -0.67 0.52 0.52 1,945
Ireland 0.29 -0.69 0.67 0.51 1,942
Italy 0.31 -0.68 0.66 0.52 1,981
Netherlands 0.54 -0.68 0.50 0.52 2,023
Portugal 0.39 -0.69 0.61 0.51 2,032
Spain 0.31 -0.69 0.65 0.51 1,994
Table 2: Averages of resulting eigenvectors from the principal component analysis using a rolling window of 500 trading days
Country ∅ 𝝀𝑺𝑴𝑽𝒋,𝒕 ∅ 𝝀𝚫𝑩𝒂𝒏𝒌𝒋,𝒕
∅ 𝝀∆𝑺𝒐𝒗 ∅ 𝑲𝑴𝑶𝒕 𝝆14
France 0.40 -0.68 0.59 0.52 0.94
Germany11 0.42 -0.68 0.56 0.51 0.82
Greece 0.40 -0.49 0.59 0.51 0.71
Ireland 0.21 -0.67 0.65 0.51 0.95
Italy 0.33 -0.67 0.65 0.54 0.93
Netherlands 0.44 -0.68 0.55 0.51 0.92
Portugal 0.41 -0.67 0.61 0.52 0.83
Spain 0.30 -0.68 0.64 0.52 0.92
Table 3: Variables used in the first-stage regressions and their sources
Variable Description Source
𝒓𝒆𝒕𝒊,𝒋,𝒕𝑨𝑫𝑹
Daily log return of American
Depositary Receipt. Thomson Reuters Tick History
𝒓𝒆𝒕𝒊,𝒋,𝒕𝑼𝑵𝑫
Daily log return of the underlying
stock. Thomson Reuters Tick History
𝒓𝒆𝒕𝒕𝑺
Daily log return of the EUR/USD
exchange rate. Thomson Reuters Tick History
𝒆𝒙𝒊𝒕 𝒓𝒊𝒔𝒌 𝒅𝒓𝒊𝒗𝒆𝒓𝒋,𝒕
Country specific market-based
measure of eurozone exit risk.
Calculated using PCA as described
in 2.1..
Own calculation.
𝒓𝒆𝒕𝒕𝑺&𝑷 𝟓𝟎𝟎 Daily log return of the S&P 500. Thomson Reuters Tick History
13 Since the sovereign yield spread is zero by definition for Germany, for use data from CDS with ten years maturity
instead.
14 Correlation between the principal components resulting from the time-invariant approach used for further
analysis in the paper and the principal components resulting from a rolling window of 500 trading days.

26
Table 4: ADRs in our sample by country
Name_ADR First day Last day
France
Air France-KLM SA 1:1 02/11/2008 06/30/2015
Air Liquide SA 5:1 10/28/2008 06/30/2015
Airbus Group SAS 4:1 01/03/2014 06/30/2015
Alcatel-Lucent SA 1:1 01/03/2009 06/30/2015
Alstom SA 10:1 01/06/2011 06/30/2015
Arkema SA 1:1 07/07/2010 06/30/2015
AXA SA 1:1 01/03/2008 06/30/2015
BNP Paribas SA 2:1 10/28/2008 06/30/2015
CAP Gemini SA 2:1 10/28/2008 06/30/2015
Carrefour SA 5:1 01/14/2009 27/05/2011
CGG SA 1:1 02/06/2013 06/30/2015
Compagnie de St. Gobain SA 5:1 10/03/2014 06/30/2015
Crédit Agricole SA 2:1 01/09/2009 06/30/2015
Danone SA 5:1 05/06/2009 06/30/2015
Dassault Systèmes SA 1:1 10/28/2008 06/30/2015
DBV Technologies SA 1:1 10/23/2014 06/30/2015
Électricité de France SA 5:1 07/01/2009 06/30/2015
Essilor International SA 2:1 10/28/2008 06/30/2015
Hermes International 10:1 01/04/2011 06/30/2015
Ingenico Group 5:1 04/04/2014 06/30/2015
Ipsen Group 4:1 04/24/2012 06/30/2015
Kering SA 10:1 04/23/2013 06/30/2015
L'Oreal SA 5:1 10/28/2008 06/30/2015
Lafarge SA 4:1 10/28/2008 06/30/2015
LVMH SE 5:1 10/28/2008 06/30/2015
Michelin SCA 5:1 01/08/2009 06/30/2015
Orange SA 1:1 07/02/2013 06/30/2015
Pernod-Ricard SA 5:1 04/11/2012 06/30/2015
Publicis Groupe SA 4:1 10/28/2008 06/30/2015
Renault SA 1:1 01/05/2015 06/30/2015
Safran SA 1:1 07/01/2011 06/30/2015
Sanofi SA 2:1 01/03/2008 06/30/2015
Schneider Electric SA 5:1 01/07/2009 06/30/2015
SCOR SE 10:1 01/05/2009 06/30/2015
Société Générale SA 5:1 10/28/2008 06/30/2015
Sodexo SA 5:1 01/07/2009 06/30/2015
STMicroelectronics N.V. 1:1 01/03/2008 06/30/2015
Suez Environnement SA 2:1 01/06/2009 06/30/2015
Technip SA 4:1 10/28/2008 06/30/2015
Total SA 1:1 01/03/2008 06/30/2015
Ubisoft Entertainment SA 5:1 10/01/2013 06/30/2015
Valeo SA 2:1 10/28/2008 06/30/2015
Vallourec SA 5:1 10/12/2011 06/30/2015
Veolia Environnement SA 1:1 01/03/2008 06/30/2015
Vinci SA 4:1 10/28/2008 06/30/2015
Vivendi SA 1:1 01/05/2009 06/30/2015
Germany
Adidas AG 2:1 10/28/2008 06/30/2015
AIXTRON SE 1:1 01/03/2008 06/30/2015
Allianz SE 10:1 10/27/2009 06/30/2015
BASF SE 1:1 10/28/2008 06/30/2015
Bayer AG 1:1 10/28/2008 06/30/2015
BMW AG 3:1 01/05/2009 06/30/2015
Celesio AG 5:1 01/05/2009 06/26/2013
Commerzbank AG 1:1 10/28/2008 06/30/2015
Continental AG 5:1 01/07/2014 06/30/2015
Daimler AG 1:1 04/04/2011 06/30/2015
Deutsche Lufthansa AG 1:1 10/28/2008 06/30/2015

27
Table 4 (continued): ADRs in our sample by country
Deutsche Post AG 1:1 01/05/2010 06/30/2015
Deutsche Telekom AG 1:1 07/01/2010 06/30/2015
Deutsche Börse AG 10:1 01/07/2009 06/30/2015
E.ON SE 1:1 10/28/2008 06/30/2015
Fresenius Medical Care AG & Co. KGaA 2:1 01/03/2009 06/30/2015
Fuchs Petrolub SE 4:1 04/01/2014 06/30/2015
GEA Group AG 1:1 04/04/2012 06/30/2015
Hannover Rück SE 2:1 10/28/2008 06/30/2015
HeidelbergCement AG 5:1 01/10/2012 06/30/2015
Henkel AG & Co. KGaA 1:1 10/28/2008 06/30/2015
Infineon Technologies AG 1:1 04/27/2009 06/30/2015
K + S AG 2:1 10/01/2010 06/30/2015
Linde AG 10:1 04/01/2010 06/30/2015
MAN SE 10:1 10/08/2009 09/29/2011
Merck KGaA 3:1 10/29/2008 06/30/2015
Metro Group 5:1 10/01/2013 06/30/2015
Munich Re AG 10:1 10/29/2008 06/30/2015
Porsche AG 10:1 10/07/2009 06/30/2015
ProSiebenSat.1 Media SE 4:1 07/22/2014 06/30/2015
Rheinmetall AG 5:1 04/02/2014 06/26/2015
RWE AG 1:1 10/28/2008 06/30/2015
Salzgitter AG 10:1 04/07/2010 06/14/2013
SAP SE 1:1 01/03/2008 06/30/2015
Siemens AG 1:1 01/03/2008 06/30/2015
Symrise AG 4:1 01/16/2009 06/30/2015
Greece
Alpha Bank AE 4:1 10/30/2008 06/30/2015
Coca-Cola Hellenic 1:1 01/03/2008 03/28/2013
Eurobank Ergasias SA 2:1 04/14/2014 06/30/2015
Hellenic Telecommunications Organization SA 2:1 01/03/2008 06/30/2015
National Bank of Greece 1:1 01/03/2008 06/30/2015
Piraeus Bank SA 1:2 01/17/2014 06/30/2015
Ireland
Allied Irish Banks plc 1:10 08/29/2011 08/14/2014
Bank of Ireland plc 1:40 01/03/2008 02/13/2015
C&C Group plc 1:3 07/02/2012 06/30/2015
CRH plc 1:1 01/03/2008 06/30/2015
Ryanair plc 1:5 01/03/2008 06/30/2015
Smurfit Kappa Group plc 1:2 07/03/2014 06/30/2015
Italy
Atlantia S.p.A. 2:1 01/25/2011 06/30/2015
Danieli S.p.A. 1:1 04/08/2013 06/19/2015
Enel S.p.A. 1:1 10/28/2008 06/30/2015
Eni S.p.A. 1:2 01/03/2008 06/30/2015
Finmeccanica S.p.A. 2:1 04/16/2010 06/30/2015
GTECH S.p.A. 1:1 10/22/2013 09/18/2014
Intesa Sanpaola S.p.A. 1:6 10/28/2008 06/30/2015
Italcementi S.p.A. 1:1 10/28/2008 06/30/2015
Luxottica S.p.A. 1:1 01/03/2008 06/30/2015
Mediaset S.p.A. 1:3 10/28/2008 12/30/2010
Mediolanum S.p.A. 2:1 10/11/2013 06/30/2015
Saipem S.p.A. 2:1 04/01/2010 12/22/2014
Telecom Italia S.p.A. 1:10 01/03/2008 06/30/2015
Terna S.p.A. 1:3 04/08/2013 06/30/2015
Netherlands
AEGON NV 1:1 01/03/2008 06/30/2015
Koninklijke Ahold NV 1:1 10/28/2008 06/30/2015
Akzo Nobel NV 3:1 10/28/2008 06/30/2015
Aperam SA 1:1 01/31/2011 06/30/2015
ArcelorMittal SA 1:1 01/03/2008 06/30/2015

28
Table 4 (continued): ADRs in our sample by country
ASML Holding NV 1:1 01/03/2008 06/30/2015
Gemalto NV 2:1 05/06/2013 06/30/2015
Heineken NV 2:1 01/03/2013 06/30/2015
ING Groep NV 1:1 01/03/2008 06/30/2015
Koninklijke Philips NV 1:1 01/03/2008 06/30/2015
PostNL NV 1:1 01/04/2012 06/30/2015
Koninklijke DSM NV 4:1 10/28/2008 06/30/2015
Royal Dutch Shell plc 1:2 01/03/2008 06/30/2015
Royal KPN NV 1:1 10/28/2008 06/30/2015
TNT Express NV 1:1 07/07/2011 06/30/2015
Unilever NV 1:1 01/03/2008 06/30/2015
Wolters Kluwer NV 1:1 10/28/2008 06/30/2015
Portugal
Energias de Portugal SGPS SA 10:1 10/28/2008 06/30/2015
Galp Energie SGPS SA 2:1 01/05/2015 06/30/2015
Jerónimo Martins SGPS SA 1:2 07/03/2013 12/19/2014
Pharol SGPS SA 1:1 01/03/2008 06/30/2015
Spain
Abengoa SA 2:1 10/21/2013 06/30/2015
Amadeus IT Group SA 1:1 04/02/2012 06/30/2015
Banco Santander SA 1:1 01/03/2008 06/30/2015
BBVA SA 1:1 01/05/2010 06/30/2015
Enagás SA 2:1 04/02/2012 06/30/2015
Gas Natural SDG SA 5:1 01/05/2015 06/30/2015
Grifols SA 1:1 06/03/2011 06/30/2015
Iberdrola SA 1:4 10/28/2008 06/30/2015
Indra Sistemas SA 2:1 04/11/2011 06/30/2015
Inditex SA 2:1 07/01/2010 06/30/2015
PRISA SA 1:1 01/04/2011 09/22/2014
Red Eléctrica de España SA 5:1 10/01/2012 06/30/2015
Repsol SA 1:1 04/01/2011 06/30/2015
Telefónica SA 1:1 01/03/2008 06/30/2015

29
Figure 1 - 8: Eurozone Exit risk by country
0
0,02
0,04
0,06
0,08
0,1
0,12
France
0
0,02
0,04
0,06
0,08
0,1
0,12
Germany
0
0,02
0,04
0,06
0,08
0,1
0,12
Greece

30
0
0,02
0,04
0,06
0,08
0,1
0,12
Ireland
0
0,02
0,04
0,06
0,08
0,1
0,12
Italy
0
0,02
0,04
0,06
0,08
0,1
0,12
Netherlands

31
0
0,02
0,04
0,06
0,08
0,1
0,12
Portugal
0
0,02
0,04
0,06
0,08
0,1
0,12
Spain

32
Table 5: Results from pooled OLS with country dummies using robust standard errors
(1) (2) (3) (4) (5) (6) (7) (8) (9) (10)
Greece 0.00951***
0.01010***
(0.000452)
(0.000452)
Ireland
0.00270***
0.00357***
(0.000184)
(0.000183)
Italy
0.00078***
0.00168***
(0.000108)
(0.000105)
Portugal
0.00064***
0.00160***
(0.000154)
(0.000153)
Spain
0.00215*** 0.00295***
(8.66e-05) (8.37e-05)
GIIPS
0.00354***
(0.000117)
France
-0.00080***
(4.62e-05)
Germany
-0.00121***
(4.56e-05)
Netherlands
-0.00249***
(3.61e-05)
Constant 0.00267*** 0.00294*** 0.00298*** 0.00304*** 0.00288*** 0.00208*** 0.00237*** 0.00332*** 0.00336*** 0.00340*** (1.96e-05) (2.66e-05) (2.73e-05) (2.69e-05) (2.79e-05) (1.69e-05) (1.74e-05) (3.72e-05) (3.42e-05) (3.07e-05)
Observations 167,469 167,469 167,469 167,469 167,469 167,469 167,469 167,469 167,469 167,469
R² 0.030 0.002 0.000 0.000 0.003 0.040 0.016 0.001 0.002 0.006
Prob > F 0.00 0.00 0.00 0.00 0.00 0.00 0.00 0.00 0.00 0.00
Results are obtained by regressing the eurozone exit risk measures by ADR on country dummies using robust standard errors. *** p<0.01, ** p<0.05, * p<0.1

33
Table 6: Regressions of the return of selected Bank Indices. Full sample: 01/01/2008 – 06/30/2015
Greece Ireland Italy Portugal Spain EUROSTOXX Banks
∆ Exit risk Greece -0.1072 -0.1888 -0.0503 -0.1858* -0.0237 0.1162 (0.2333) (0.2265) (0.0646) (0.1030) (0.0703) (0.0926)
∆ Exit risk Ireland 0.6041 -0.1055 0.0255 0.0427 0.0333 -0.1771 (0.5629) (0.3413) (0.0950) (0.3218) (0.0797) (0.1221)
∆ Exit risk Italy 4.4455 0.0639 0.0503 -0.7358 0.2850 -0.0430
(5.3941) (0.5551) (0.1759) (0.5121) (0.1787) (0.3115)
∆ Exit risk Portugal 0.2672 -0.4120 -0.0594 -0.4177 -0.3724** -0.1022 (0.8875) (0.4450) (0.1533) (0.3450) (0.1759) (0.2371)
∆ Exit risk Spain -0.4990 0.8677 0.0408 -0.1270 0.0380 -0.5404** (0.4775) (0.5801) (0.1211) (0.3622) (0.1638) (0.2350)
Return stock market 1.7089*** 1.7702*** 1.0752*** 1.4313*** 1.0129*** 0.4284*** (0.0557) (0.0886) (0.0310) (0.0883) (0.0310) (0.0699)
∆ Sovereign spread 0.0014 -0.0195 -0.0161*** -0.0054 -0.0040 (0.0013) (0.0128) (0.0040) (0.0058) (0.0031)
Return exchange rate -0.0147 0.3269** -0.0008 -0.0295 0.0260 0.0144 (0.1098) (0.1645) (0.0354) (0.0799) (0.0331) (0.0491)
∆ VSTOXX 0.0025*** 0.0039*** 0.0010*** 0.0028*** 0.0004** 0.0001 (0.0007) (0.0006) (0.0002) (0.0004) (0.0002) (0.0003)
Return EUROSTOXX Banks 0.2473* 0.3679*** 0.1892*** 0.1515*** 0.2223*** (0.1497) (0.0829) (0.0230) (0.0487) (0.0224)
Return bank GIIPS -0.0022 -0.0000 0.0008** 0.0018** 0.0008*** 0.0087*** (0.0016) (0.0010) (0.0003) (0.0008) (0.0003) (0.0006)
∆ Sovereign spread GIIPS -0.0001 0.0003 0.0004* -0.0019*** 0.0006*** -0.0015*** (0.0007) (0.0007) (0.0002) (0.0006) (0.0002) 0.0087***
Constant 0.0012 -0.0007 0.0001 -0.0015*** 0.0001 -0.0004 (0.0018) (0.0008) (0.0002) (0.0005) (0.0002) (0.0003)
Observations 1,404 1,407 1,408 1,404 1,408 1,413
R² 0.25 0.56 0.90 0.57 0.92 0.80
Prob > F 0.00 0.00 0.00 0.00 0.00 0.00
Results are obtained by regressing the return of the respective bank indices on the change in eurozone exit risk by country and a set of control variables
using robust standard errors. *** p<0.01, ** p<0.05, * p<0.1
34
Table 7: Regressions of the return of selected Bank Indices. Subsample: 01/01/2008 – 07/26/2012
Greece Ireland Italy Portugal Spain EUROSTOXX Banks
∆ Exit risk Greece -0.0414 -0.2064 -0.0544 -0.1975*** -0.0007 0.1673 (0.2524) (0.3088) (0.0812) (0.0724) (0.0908) (0.1231)
∆ Exit risk Ireland 1.5265 -0.0247 0.0201 -0.0622 -0.0095 -0.4691 (0.9996) (1.0397) (0.3114) (0.6150) (0.2335) (0.4174)
∆ Exit risk Italy -0.5909 -2.3202 0.6005 1.0241 0.1662 -0.6619
(1.1714) (2.8218) (0.6600) (1.1621) (0.6678) (1.3363)
∆ Exit risk Portugal 1.1179 -0.6772 -0.0239 -0.5320 -0.5018*** -0.2195 (0.8145) (0.5757) (0.2077) (0.4528) (0.1852) (0.3118)
∆ Exit risk Spain -0.1953 1.0050 0.0989 -0.0915 -0.0131 -0.6792*** (0.2611) (0.6428) (0.1287) (0.3017) (0.1781) (0.2598)
Return stock market 1.6236*** 1.8564*** 1.0379*** 1.0879*** 1.0055*** 0.3096*** (0.0534) (0.1030) (0.0395) (0.0919) (0.0380) (0.0765)
∆ Sovereign spread 0.0021* -0.0242 -0.0157*** -0.0009 -0.0044 (0.0011) (0.0148) (0.0045) (0.0074) (0.0038)
Return exchange rate 0.0767 0.2903 -0.0357 0.0101 -0.0005 -0.0293 (0.0871) (0.2363) (0.0478) (0.0870) (0.0457) (0.0674)
∆ VSTOXX 0.0014*** 0.0042*** 0.0009*** 0.0020*** 0.0004* -0.0000 (0.0004) (0.0007) (0.0002) (0.0005) (0.0002) (0.0004)
Return EUROSTOXX Banks 0.0663 0.3791*** 0.1818*** 0.1155** 0.2075*** 0.0103*** (0.0607) (0.1089) (0.0274) (0.0526) (0.0276) (0.0006)
Return bank GIIPS -0.0006 -0.0006 0.0013*** 0.0024*** 0.0013*** -0.0015*** (0.0008) (0.0018) (0.0005) (0.0009) (0.0004) (0.0003)
∆ Sovereign spread GIIPS -0.0007 0.0003 0.0003 -0.0021*** 0.0005** -0.0293 (0.0006) (0.0010) (0.0003) (0.0007) (0.0002) (0.0674)
Constant 0.0002 -0.0012 -0.0001 -0.0012* 0.0003 -0.0002 (0.0007) (0.0012) (0.0003) (0.0007) (0.0003) (0.0004)
Observations 798 799 800 796 800 801
R² 0.80 0.58 0.90 0.57 0.92 0.81
Prob > F 0.00 0.00 0.00 0.00 0.00 0.00
Results are obtained by regressing the return of the respective bank indices on the change in eurozone exit risk by country and a set of control variables
using robust standard errors. *** p<0.01, ** p<0.05, * p<0.1

35
Table 8: List of Banks in our Sample
EBA Code
Total assets RWA (%)
Tier 1 (%)
EAD (%) Bank GR IE IT PT ES GIIPS Eurobank Ergasias SA gr030 85,885 55.85 8.96 61.72 0.14 0.30 0.08 0.22 National Bank of Greece SA gr031 118,832 57.48 11.94 58.05 0.03 0.04 0.02 0.00 Alpha Bank AE gr032 66,798 73.30 10.77 69.12 0.04 0.03 0.02 0.02 Piraeus Bank SA gr033 57,680 65.86 8.00 59.61 0.01 0.03 0.00 0.00 Agricultural Bank of Greece SA gr034 31,221 40.47 6.27 80.82 0.01 0.03 0.00 0.00 TT Hellenic Postbank SA gr035 16,783 39.40 18.50 86.42 0.00 0.00 0.00 0.00 Allied Irish Banks, plc ie037 131,311 75.22 3.71 0.04 65.43 1.14 0.42 2.31 Bank of Ireland Group ie038 156,712 53.52 8.39 0.12 43.96 0.57 0.24 1.25 Intesa Sanpaolo SpA it040 576,962 57.57 7.88 0.16 0.21 72.47 0.27 1.14 UniCredit SpA it041 929,488 48.94 7.85 0.00 0.00 41.12 0.00 0.00 Banca Monte dei Paschi de Siena SpA it042 244,279 44.72 5.77 0.00 0.00 84.06 0.00 0.00 Banco Popolare Sc it043 140,043 67.75 5.77 0.00 0.00 87.53 0.00 0.00 Unione de Banche Italiane SpA it044 130,559 72.27 6.95 0.00 0.00 102.08 0.00 0.00 Banco Comercial Portugues SA pt054 100,010 59.56 5.91 6.33 1.45 0.08 67.96 0.94 Banco Espirito Santo SA pt055 85,644 83.04 6.35 0.00 0.00 0.00 65.22 8.00 Banco BPI SA pt056 43,826 59.41 8.19 1.38 0.87 2.73 75.88 8.27 Banco Santander SA es059 1,223,267 48.58 7.07 0.00 0.00 0.00 3.66 29.06 Banco Bilbao Vizcaya Argentaria SA es060 540,936 57.92 7.96 0.00 0.32 0.11 1.69 70.01 Bankia SA es061 327,930 61.14 6.91 0.00 0.00 0.00 0.00 84.93 Banco Popular Español SA es064 129,183 73.17 7.09 0.00 0.00 0.00 6.29 93.65 Banco de Sabadell SA es065 96,703 58.41 6.21 0.00 0.00 0.00 0.00 90.84 Bankinter SA es069 53,476 57.90 6.20 0.00 0.00 0.00 0.00 93.95 Banca Civica SA es071 71,055 64.87 8.00 0.00 0.00 0.00 0.00 93.65 Caja de Ahorros de Mediterraneo es083 72,034 66.98 3.82 0.00 0.00 0.00 0.00 92.11 Averages GIIPS 226,276 60.14 7.69 17.66 4.69 16.35 9.24 27.93 Non GIIPS Eurozone Erste Group Bank AG at001 205,938 58.53 8.72 0.46 0.15 1.01 0.12 0.44 Dexia SA be004 548,135 25.69 12.07 0.91 0.00 9.11 1.03 6.07 KBC Groep NV be005 276,723 40.45 10.46 0.20 6.59 2.20 0.08 1.05 Cyprus Popular Bank Public Co. Ltd. cy006 42,580 64.88 7.29 43.88 0.23 1.12 0.51 0.64 Bank of Cyprus PCL cy007 41,996 62.57 8.12 26.77 0.12 0.64 0.00 0.21 BNP Paribas SA fr013 1,998,157 30.09 9.21 0.43 0.39 6.98 0.41 1.72 Crédit Agricole SA fr014 1,503,621 37.35 8.24 1.80 0.45 5.56 0.21 0.99 Société Générale SA fr016 1,051,323 32.71 8.09 0.63 0.44 1.99 0.12 1.29 Deutsche Bank AG de017 1,905,630 18.19 8.76 0.19 0.96 2.14 0.22 1.69 Commerzbank AG de018 771,201 34.69 9.99 0.59 0.01 2.49 0.56 2.52 Landesbank Berlin Holding AG de027 133,861 26.34 14.64 0.37 0.91 2.58 0.21 2.85 Bank of Valetta plc mt046 6,382 52.75 10.53 0.00 0.00 0.00 0.00 0.00 ING Groep NV nl047 933,073 34.41 9.62 0.00 0.00 0.00 0.00 0.00 SNS Reaal Groep NV nl050 78,918 26.99 8.36 0.00 0.00 0.19 0.00 0.67 Averages Non GIIPS Eurozone 730,089 37.92 9.51 5.86 0.79 2.77 0.27 1.55 Non Eurozone Danske Bank A/S dk008 402,555 36.25 9.99 0.00 3.31 0.00 0.00 0.00 Jyske Bank A/S dk009 32,752 43.02 12.06 0.19 0.00 0.00 0.00 0.00 Sydbank A/S dk010 20,238 48.87 12.45 0.00 0.00 0.00 0.00 0.00 OTP Bank Nyrt hu036 35,190 76.27 12.33 0.00 0.00 0.00 0.00 0.00 DNB ASA no051 209,954 56.10 8.27 0.00 0.00 0.00 0.00 0.00 PKO Bank Polski SA pl052 35,540 100.0 11.82 0.00 0.1 0.24 0.00 0.00 Nova Kreditna Banka Maribor dd si058 0 - 7.40 - - - - - Nordea Bank AB se084 542,853 39.56 8.90 0.04 0.17 0.05 0.01 0.09 Skandinaviska Enskilda Banken AB se085 212,240 40.82 11.09 0.03 0.20 0.08 0.03 0.38 Svenska Handelsbanken AB se086 240,202 44.28 7.72 0.00 0.00 0.00 0.00 0.00 Swedbank AB se087 191,365 44.08 8.72 0.00 0.01 0.00 0.00 0.00 Royal Bank of Scotland Group plc gb088 607,351 100.0 9.71 0.58 10.58 1.74 0.28 3.84 HSBC Holdings plc gb089 1,783,199 46.30 10.53 0.24 0.00 0.00 0.00 0.54 Barclays plc gb090 1,725,709 26.72 10.03 0.01 0.24 1.52 0.73 2.55 Lloyds Banking Group plc gb091 1,006,082 46.93 10.16 0.00 0.00 0.00 0.00 0.00 Averages Non Eurozone 432,793 53.55 10.13 0.07 0.94 0.33 0.07 0.52
36
Table 9: Results for the Cross Section of Estimated Betas: Greece
Greece Full Sample Subsample
(1) (2) (3) (4) (1) (2) (3) (4)
Credit Exposure/Assets -4.317*** -3.916** -3.454*** -3.203** -4.646*** -4.187** -5.112*** -4.510*** (1.213) (1.783) (0.938) (1.495) (1.389) (1.706) (0.989) (1.425)
Log(Total Assets) -0.0552* -0.0254 -0.0490 -0.0235 (0.0276) (0.0271) (0.0311) (0.0324)
RWA/Total Assets -0.204 -0.226 0.00700 0.00771
(0.223) (0.206) (0.225) (0.152)
Tier 1/RWA 1.591 1.101 2.108 2.586
(3.713) (3.184) (3.821) (3.099)
Constant -0.118*** 0.530 0.0247 0.359 -0.101** 0.319 0.0562 0.118 (0.0432) (0.406) (0.0365) (0.389) (0.0434) (0.428) (0.0371) (0.416)
Observations 44 44 44 44 43 43 43 43
R² 0.024 0.112 0.021 0.075 0.028 0.113 0.046 0.121
Prob > F 0.00 0.01 0.00 0.01 0.00 0.01 0.00 0.00
Table 10: Results for the Cross Section of Estimated Betas: Ireland
Ireland Full Sample Subsample (1) (2) (3) (4) (1) (2) (3) (4)
Credit Exposure/Assets -3.435*** -2.234* -0.931 -0.230 -5.030*** -3.679 -5.547** -5.955 (1.026) (1.282) (1.207) (1.923) (1.637) (2.848) (2.465) (4.152)
Log(Total Assets) -0.0671** -0.0109 -0.116** -0.0236 (0.0321) (0.0621) (0.0524) (0.0813)
RWA/Total Assets 0.121 -0.266 0.302 0.158
(0.239) (0.518) (0.421) (0.713)
Tier 1/RWA -4.401 -0.200 -4.023 2.744
(3.145) (4.505) (3.788) (4.721)
Constant -0.162*** 0.979** 0.0135 0.299 -0.422*** 1.188 -0.0649 -0.102 (0.0603) (0.454) (0.0710) (1.141) (0.0793) (0.864) (0.0948) (1.481)
Observations 50 50 50 50 48 48 48 48
R² 0.023 0.155 0.001 0.009 0.031 0.203 0.027 0.046
Prob > F 0.00 0.00 0.44 0.76 0.00 0.01 0.03 0.31
Results are obtained by regressing the bank-specific estimated 𝛽𝑒𝑥𝑖𝑡 𝑟𝑖𝑠𝑘,𝑖,𝑗 (as explained in section 3.2) on credit exposure of the respective
bank to the respective country and a set of control variables using robust standard errors. *** p<0.01, ** p<0.05, * p<0.1

37
Table 11: Results for the Cross Section of Estimated Betas: Italy
Italy Full Sample Subsample
(1) (2) (3) (4) (1) (2) (3) (4)
Credit Exposure/Assets 8.848 -3.746 9.176 -1.573 15.79 -3.980 18.03 1.675 (13.15) (10.96) (13.45) (10.75) (18.95) (17.99) (18.15) (16.01)
Log(Total Assets) 0.120 0.0878 0.313 0.428* (0.160) (0.160) (0.254) (0.242)
RWA/Total Assets -1.878 -1.318 -2.641 -0.240
(1.270) (1.151) (2.291) (2.036)
Tier 1/RWA 11.13 17.60* 6.368 12.88
(9.593) (9.329) (13.74) (12.72)
Constant -0.763* -2.124 -0.343 -2.216 -0.650 -3.476 0.323 -5.742* (0.393) (2.657) (0.451) (2.597) (0.558) (3.999) (0.626) (3.285)
Observations 47 47 47 47 45 45 45 45
R² 0.006 0.060 0.005 0.055 0.010 0.062 0.011 0.045
Prob > F 0.51 0.47 0.50 0.41 0.41 0.49 0.33 0.30
Table 12: Results for the Cross Section of Estimated Betas: Portugal
Portugal Full Sample Subsample
(1) (2) (3) (4) (1) (2) (3) (4)
Credit Exposure/Assets -7.347* -2.304 -3.637 0.206 -12.20*** -5.841 -9.900*** -4.405 (3.674) (3.469) (3.607) (3.842) (3.825) (4.212) (3.679) (4.258)
Log(Total Assets) -0.104** -0.0509 -0.128** -0.0789 (0.0485) (0.0616) (0.0597) (0.0689)
RWA/Total Assets -0.574 -0.325 -0.824 -0.828
(0.372) (0.504) (0.612) (0.665)
Tier 1/RWA 5.384** 6.282** 6.601** 6.841*
(2.309) (2.771) (3.155) (3.598)
Constant -0.369*** 0.693 0.0588 0.266 -0.337*** 1.027 0.101 0.852 (0.0841) (0.777) (0.0914) (1.053) (0.110) (1.001) (0.109) (1.176)
Observations 49 49 49 49 47 47 47 47
R² 0.020 0.190 0.004 0.118 0.035 0.208 0.024 0.176
Prob > F 0.05 0.00 0.32 0.01 0.00 0.00 0.01 0.00
Results are obtained by regressing the bank-specific estimated 𝛽𝑒𝑥𝑖𝑡 𝑟𝑖𝑠𝑘,𝑖,𝑗 (as explained in section 3.2) on credit exposure of the respective
bank to the respective country and a set of control variables using robust standard errors. *** p<0.01, ** p<0.05, * p<0.1

38
Table 13: Results for the Cross Section of Estimated Betas: Spain
Spain Full Sample Subsample
(1) (2) (3) (4) (1) (2) (3) (4)
Credit Exposure/Assets -7.347* -2.304 -3.637 0.206 -12.20*** -5.841 -9.900*** -4.405 (3.674) (3.469) (3.607) (3.842) (3.825) (4.212) (3.679) (4.258)
Log(Total Assets) -0.104** -0.0509 -0.128** -0.0789 (0.0485) (0.0616) (0.0597) (0.0689)
RWA/Total Assets -0.574 -0.325 -0.824 -0.828
(0.372) (0.504) (0.612) (0.665)
Tier 1/RWA 5.384** 6.282** 6.601** 6.841*
(2.309) (2.771) (3.155) (3.598)
Constant -0.369*** 0.693 0.0588 0.266 -0.337*** 1.027 0.101 0.852 (0.0841) (0.777) (0.0914) (1.053) (0.110) (1.001) (0.109) (1.176)
Observations 49 49 49 49 47 47 47 47
R² 0.020 0.190 0.004 0.118 0.035 0.208 0.024 0.176
Prob > F 0.05 0.00 0.32 0.01 0.00 0.00 0.01 0.00
Results are obtained by regressing the bank-specific estimated 𝛽𝑒𝑥𝑖𝑡 𝑟𝑖𝑠𝑘,𝑖,𝑗 (as explained in section 3.2) on credit exposure of the respective
bank to the respective country and a set of control variables using robust standard errors. *** p<0.01, ** p<0.05, * p<0.1

39
Table 14: Results for the Cross Section of Bank Stock Returns: Full sample
Full sample 𝐞𝐱𝐢𝐭 𝐫𝐢𝐬𝐤𝐆𝐫𝐞𝐞𝐜𝐞 𝐞𝐱𝐢𝐭 𝐫𝐢𝐬𝐤𝐈𝐫𝐞𝐥𝐚𝐧𝐝 𝐞𝐱𝐢𝐭 𝐫𝐢𝐬𝐤𝐈𝐭𝐚𝐥𝐲 𝐞𝐱𝐢𝐭 𝐫𝐢𝐬𝐤𝐏𝐨𝐫𝐭𝐮𝐠𝐚𝐥 𝐞𝐱𝐢𝐭 𝐫𝐢𝐬𝐤𝐒𝐩𝐚𝐢𝐧
(1) (2) (1) (2) (1) (2) (1) (2) (1) (2)
βexit risk -0.001 -0.001 -0.001** -0.000** -0.000 -0.000 -0.000 -0.000 0.001 0.000 (0.001) (0.001) (0.000) (0.000) (0.000) (0.000) (0.000) (0.000) (0.000) (0.001)
Return stock market 0.546 0.493 1.004*** 0.987*** 0.893*** 0.872*** 0.872*** 0.881*** 0.954*** 0.896***
(0.488) (0.520) (0.137) (0.125) (0.128) (0.131) (0.133) (0.122) (0.135) (0.153)
∆ Sovereign spread -0.010 -0.015 -0.031 -0.046*** -0.063*** -0.061*** -0.054*** -0.050*** -0.067*** -0.067***
(0.075) (0.076) (0.021) (0.017) (0.016) (0.014) (0.014) (0.015) (0.015) (0.021)
Log(Total Assets) 0.000 0.000 0.000 0.000 0.000 0.000 0.000 0.000 0.000 0.000 (0.000) (0.000) (0.000) (0.000) (0.000) (0.000) (0.000) (0.000) (0.000) (0.000)
RWA/Total Assets 0.001 0.001 0.001 0.001 0.000 0.000 0.001 0.001 0.001 0.001
(0.001) (0.001) (0.001) (0.001) (0.001) (0.001) (0.001) (0.001) (0.001) (0.001)
Tier 1/RWA 0.014 0.014 -0.003 0.001 0.006 0.006 0.006 0.007 0.006 0.006
(0.011) (0.011) (0.004) (0.004) (0.006) (0.006) (0.006) (0.006) (0.006) (0.006)
Constant -0.003 -0.003 -0.001 -0.002 -0.002 -0.002 -0.003 -0.003* -0.003* -0.003* (0.002) (0.002) (0.001) (0.001) (0.002) (0.002) (0.002) (0.002) (0.002) (0.002)
Observations 44 44 50 50 47 47 49 49 44 44
R² 0.267 0.272 0.660 0.612 0.522 0.526 0.514 0.518 0.587 0.571
Prob > F 0.01 0.01 0.00 0.00 0.00 0.00 0.00 0.00 0.00 0.00
Results are obtained by regressing bank stock returns on the bank-specific estimated 𝛽𝑒𝑥𝑖𝑡 𝑟𝑖𝑠𝑘,𝑖,𝑗 (as explained in section 3.2) and a set of control variables using robust
standard errors. *** p<0.01, ** p<0.05, * p<0.1

40
Table 15: Results for the Cross Section of Bank Stock Returns: Subsample
Subsample 𝐞𝐱𝐢𝐭 𝐫𝐢𝐬𝐤𝐆𝐫𝐞𝐞𝐜𝐞 𝐞𝐱𝐢𝐭 𝐫𝐢𝐬𝐤𝐈𝐫𝐞𝐥𝐚𝐧𝐝 𝐞𝐱𝐢𝐭 𝐫𝐢𝐬𝐤𝐈𝐭𝐚𝐥𝐲 𝐞𝐱𝐢𝐭 𝐫𝐢𝐬𝐤𝐏𝐨𝐫𝐭𝐮𝐠𝐚𝐥 𝐞𝐱𝐢𝐭 𝐫𝐢𝐬𝐤𝐒𝐩𝐚𝐢𝐧
(1) (2) (1) (2) (1) (2) (1) (2) (1) (2)
βexit risk -0.001 -0.001 0.000 0.000 -0.000* -0.000** 0.000 0.000 -0.000 0.000 (0.002) (0.002) (0.000) (0.000) (0.000) (0.000) (0.000) (0.000) (0.000) (0.000)
Return stock market 0.817 0.826 0.953*** 0.972*** 0.911*** 0.816*** 0.870*** 0.857*** 0.793*** 0.765***
(0.526) (0.544) (0.175) (0.178) (0.221) (0.227) (0.217) (0.222) (0.201) (0.221)
∆ Sovereign spread -0.178 -0.157 -0.043** -0.040** -0.053* -0.053** -0.053** -0.047* -0.053** -0.055**
(0.115) (0.101) (0.021) (0.020) (0.026) (0.026) (0.023) (0.027) (0.025) (0.027)
Log(Total Assets) -0.000 -0.000 -0.000 -0.000 -0.000 -0.000 -0.000 -0.000 -0.000 0.000 (0.000) (0.000) (0.000) (0.000) (0.000) (0.000) (0.000) (0.000) (0.000) (0.000)
RWA/Total Assets 0.001 0.001 0.001 0.001 0.000 0.001 0.001 0.001 0.001 0.001
(0.001) (0.001) (0.001) (0.001) (0.001) (0.001) (0.001) (0.001) (0.001) (0.001)
Tier 1/RWA 0.000 0.003 0.004 0.003 0.011 0.012 0.008 0.010 0.014 0.014
(0.016) (0.018) (0.004) (0.004) (0.008) (0.008) (0.009) (0.009) (0.010) (0.010)
Constant 0.000 -0.000 -0.001 -0.001 -0.002 -0.002 -0.002 -0.002 -0.003 -0.003 (0.003) (0.003) (0.002) (0.002) (0.002) (0.002) (0.002) (0.002) (0.002) (0.002)
Observations 43 43 48 48 45 45 47 47 42 42
R² 0.399 0.385 0.642 0.638 0.516 0.533 0.475 0.469 0.544 0.554
Prob > F 0.00 0.002 0.00 0.00 0.00 0.00 0.00 0.00 0.00 0
Results are obtained by regressing bank stock returns on the bank-specific estimated 𝛽𝑒𝑥𝑖𝑡 𝑟𝑖𝑠𝑘,𝑖,𝑗 (as explained in section 3.2) and a set of control variables using robust
standard errors. *** p<0.01, ** p<0.05, * p<0.1
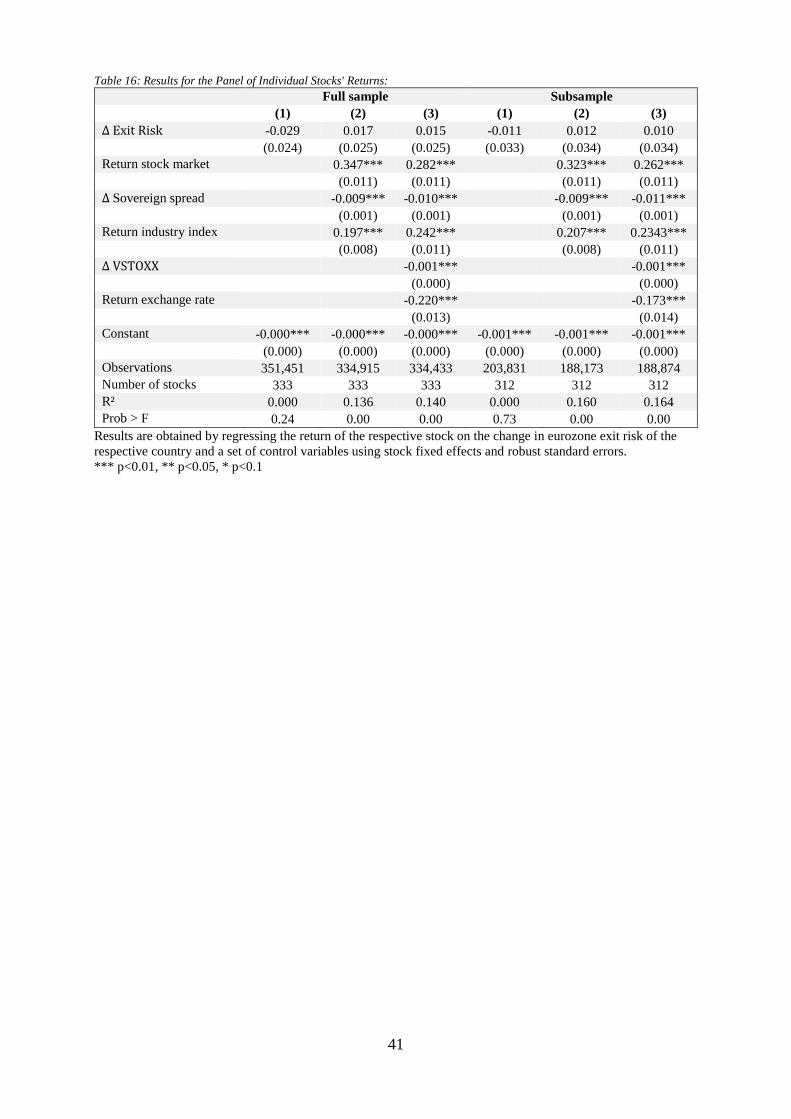
41
Table 16: Results for the Panel of Individual Stocks' Returns:
Full sample Subsample
(1) (2) (3) (1) (2) (3)
∆ Exit Risk -0.029 0.017 0.015 -0.011 0.012 0.010 (0.024) (0.025) (0.025) (0.033) (0.034) (0.034)
Return stock market 0.347*** 0.282*** 0.323*** 0.262***
(0.011) (0.011) (0.011) (0.011)
∆ Sovereign spread -0.009*** -0.010*** -0.009*** -0.011***
(0.001) (0.001) (0.001) (0.001)
Return industry index 0.197*** 0.242*** 0.207*** 0.2343*** (0.008) (0.011) (0.008) (0.011)
∆ VSTOXX -0.001*** -0.001***
(0.000) (0.000)
Return exchange rate -0.220*** -0.173***
(0.013) (0.014)
Constant -0.000*** -0.000*** -0.000*** -0.001*** -0.001*** -0.001*** (0.000) (0.000) (0.000) (0.000) (0.000) (0.000)
Observations 351,451 334,915 334,433 203,831 188,173 188,874
Number of stocks 333 333 333 312 312 312
R² 0.000 0.136 0.140 0.000 0.160 0.164
Prob > F 0.24 0.00 0.00 0.73 0.00 0.00
Results are obtained by regressing the return of the respective stock on the change in eurozone exit risk of the
respective country and a set of control variables using stock fixed effects and robust standard errors.
*** p<0.01, ** p<0.05, * p<0.1

42
Table 17: Results for the Panel of Individual Stocks' Returns: Basic Materials
Basic Materials Full sample Subsample
(1) (2) (3) (1) (2) (3)
∆ Exit Risk 0.011 0.026 0.031 0.054 0.053 0.047 (0.059) (0.059) (0.059) (0.076) (0.078) (0.077)
Return stock market 0.370*** 0.301*** 0.350*** 0.275***
(0.032) (0.032) (0.034) (0.035)
∆ Sovereign spread -0.009*** -0.011*** -0.010*** -0.012***
(0.002) (0.002) (0.002) (0.002)
Return industry index 0.137*** 0.158*** 0.147*** 0.158*** (0.020) (0.025) (0.021) (0.027)
∆ VSTOXX -0.001*** -0.001***
(0.000) (0.000)
Return exchange rate -0.166*** -0.127***
(0.036) (0.038)
Constant -0.001*** -0.000*** -0.001*** -0.001*** -0.001*** -0.001***
(0.000) (0.000) (0.000) (0.000) (0.000) (0.000)
Observations 27,754 26,373 26,338 16,882 15,562 15,562
Number of stocks 28 28 28 28 28 28
R² 0.000 0.113 0.117 0.000 0.137 0.141
Prob > F 0.85 0.00 0.00 0.48 0.00 0.00
Table 18: Results for the Panel of Individual Stocks' Returns: Consumer Goods
Consumer Goods Full sample Subsample
(1) (2) (3) (1) (2) (3)
∆ Exit Risk 0.012 0.066 0.063 0.065 0.111 0.105 (0.052) (0.055) (0.056) (0.075) (0.080) (0.081)
Return stock market 0.314*** 0.240*** 0.319*** 0.241***
(0.019) (0.019) (0.021) (0.021)
∆ Sovereign spread -0.006*** -0.007*** -0.006*** -0.007***
(0.001) (0.001) (0.002) (0.002)
Return industry index 0.153*** 0.160*** 0.150*** 0.146*** (0.014) (0.016) (0.015) (0.017)
∆ VSTOXX -0.001*** -0.001***
(0.000) (0.000)
Return exchange rate -0.127*** -0.067**
(0.025) (0.031)
Constant -0.000*** -0.000*** -0.000*** -0.001*** -0.001*** -0.001*** (0.000) (0.000) (0.000) (0.000) (0.000) (0.000)
Observations 57,453 54,809 54,731 32,513 30,035 30,035
Number of stocks 63 63 63 59 59 59
R² 0.000 0.087 0.091 0.000 0.104 0.107
Prob > F 0.82 0.00 0.00 0.39 0.00 0.00
Results are obtained by regressing the return of the respective stock on the change in eurozone exit risk of the
respective country and a set of control variables using stock fixed effects and robust standard errors.
*** p<0.01, ** p<0.05, * p<0.1

43
Table 19: Results for the Panel of Individual Stocks' Returns: Consumer Services
Consumer Services Full sample Subsample
(1) (2) (3) (1) (2) (3)
∆ Exit Risk 0.003 0.047 0.049 -0.002 0.021 0.027 (0.061) (0.062) (0.063) (0.103) (0.107) (0.108)
Return stock market 0.339*** 0.253*** 0.300*** 0.237***
(0.030) (0.030) (0.031) (0.031)
∆ Sovereign spread -0.007*** -0.008*** -0.006** -0.008***
(0.002) (0.002) (0.002) (0.002)
Return industry index 0.230*** 0.356*** 0.254*** 0.345*** (0.016) (0.026) (0.017) (0.029)
∆ VSTOXX -0.001*** -0.000***
(0.000) (0.000)
Return exchange rate -0.349*** -0.284***
(0.038) (0.043)
Constant -0.001*** -0.001*** -0.001*** -0.001*** -0.001*** -0.001*** (0.000) (0.000) (0.000) (0.000) (0.000) (0.000)
Observations 55,379 52,880 52,794 31,402 29,056 29,056
Number of stocks 57 57 57 51 51 51
R² 0.000 0.119 0.125 0.000 0.143 0.148
Prob > F 0.96 0.00 0.00 0.99 0.00 0.00
Table 20: Results for the Panel of Individual Stocks' Returns: Health Care
Health Care Full sample Subsample
(1) (2) (3) (1) (2) (3)
∆ Exit Risk -0.331** -0.353** -0.351*** -0.316** -0.381*** -0.388*** (0.118) (0.117) (0.114) (0.129) (0.125) (0.123)
Return stock market 0.343*** 0.285*** 0.330*** 0.261***
(0.029) (0.028) (0.033) (0.031)
∆ Sovereign spread -0.008** -0.009** -0.010** -0.011***
(0.004) (0.003) (0.004) (0.003)
Return industry index 0.147*** 0.172*** 0.158*** 0.157*** (0.018) (0.036) (0.019) (0.033)
∆ VSTOXX -0.001*** -0.001***
(0.000) (0.000)
Return exchange rate -0.164** -0.098
(0.062) (0.061)
Constant -0.000*** -0.000*** -0.000*** -0.001*** -0.001*** -0.001*** (0.000) (0.000) (0.000) (0.000) (0.000) (0.000)
Observations 18,175 17,307 17,281 10,654 9,827 9,827
Number of stocks 14 14 14 14 14 14
R² 0.001 0.114 0.118 0.001 0.134 0.138
Prob > F 0.01 0.00 0.00 0.03 0.00 0.00
Results are obtained by regressing the return of the respective stock on the change in eurozone exit risk of the
respective country and a set of control variables using stock fixed effects and robust standard errors.
*** p<0.01, ** p<0.05, * p<0.1

44
Table 21: Results for the Panel of Individual Stocks' Returns: Industrials
Industrials Full sample Subsample
(1) (2) (3) (1) (2) (3)
∆ Exit Risk -0.027 0.023 0.019 -0.011 0.015 0.017 (0.045) (0.044) (0.044) (0.055) (0.053) (0.053)
Return stock market 0.315*** 0.249*** 0.271*** 0.215***
(0.021) (0.022) (0.022) (0.022)
∆ Sovereign spread -0.012*** -0.013*** -0.012*** -0.015***
(0.001) (0.001) (0.002) (0.002)
Return industry index 0.234*** 0.317*** 0.258*** 0.325*** (0.014) (0.017) (0.014) (0.017)
∆ VSTOXX -0.000*** -0.000***
(0.000) (0.000)
Return exchange rate -0.297*** -0.276***
(0.021) (0.022)
Constant -0.000*** -0.000*** -0.000*** -0.001*** -0.001*** -0.001*** (0.000) (0.000) (0.000) (0.000) (0.000) (0.000)
Observations 105,369 100,326 100,182 61,441 56,644 56,644
Number of stocks 99 99 99 91 91 91
R² 0.000 0.152 0.157 0.000 0.181 0.186
Prob > F 0.55 0.00 0.00 0.84 0.00 0.00
Table 22: Results for the Panel of Individual Stocks' Returns: Oil and Gas
Oil and Gas Full sample Subsample
(1) (2) (3) (1) (2) (3)
∆ Exit Risk 0.117 0.200* 0.197* 0.215*** 0.276*** 0.271*** (0.103) (0.106) (0.109) (0.068) (0.081) (0.082)
Return stock market 0.461*** 0.361*** 0.403*** 0.305***
(0.068) (0.076) (0.062) (0.069)
∆ Sovereign spread -0.004 -0.006* -0.005 -0.007*
(0.003) (0.003) (0.004) (0.003)
Return industry index 0.249*** 0.284*** 0.284*** 0.297*** (0.047) (0.050) (0.045) (0.050)
∆ VSTOXX -0.001*** -0.001***
(0.000) (0.000)
Return exchange rate -0.223*** -0.156***
(0.035) (0.042)
Constant -0.000*** -0.000*** -0.000*** -0.001*** -0.001*** -0.001*** (0.000) (0.000) (0.000) (0.000) (0.000) (0.000)
Observations 21,395 20,382 20,355 12,547 11,586 11,586
Number of stocks 16 16 16 15 15 15
R² 0.000 0.238 0.245 0.000 0.288 0.295
Prob > F 0.24 0.00 0.00 0.01 0.00 0.00
Results are obtained by regressing the return of the respective stock on the change in eurozone exit risk of the
respective country and a set of control variables using stock fixed effects and robust standard errors.
*** p<0.01, ** p<0.05, * p<0.1
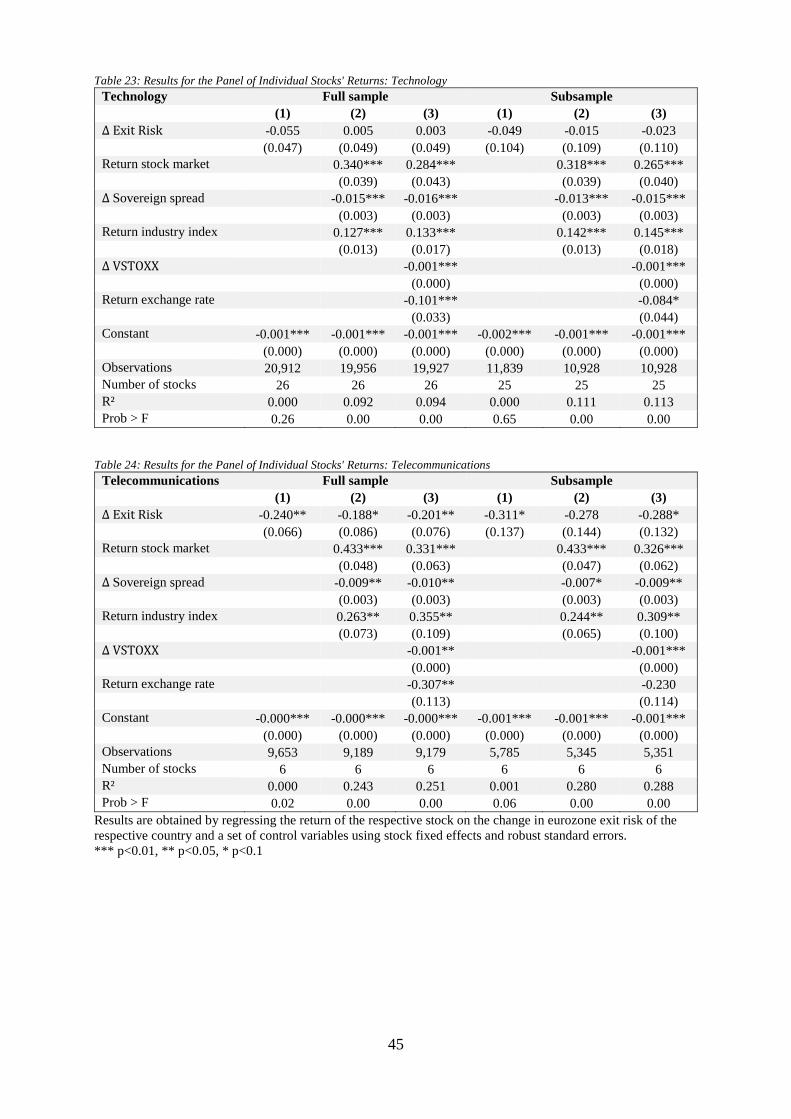
45
Table 23: Results for the Panel of Individual Stocks' Returns: Technology
Technology Full sample Subsample
(1) (2) (3) (1) (2) (3)
∆ Exit Risk -0.055 0.005 0.003 -0.049 -0.015 -0.023 (0.047) (0.049) (0.049) (0.104) (0.109) (0.110)
Return stock market 0.340*** 0.284*** 0.318*** 0.265***
(0.039) (0.043) (0.039) (0.040)
∆ Sovereign spread -0.015*** -0.016*** -0.013*** -0.015***
(0.003) (0.003) (0.003) (0.003)
Return industry index 0.127*** 0.133*** 0.142*** 0.145*** (0.013) (0.017) (0.013) (0.018)
∆ VSTOXX -0.001*** -0.001***
(0.000) (0.000)
Return exchange rate -0.101*** -0.084*
(0.033) (0.044)
Constant -0.001*** -0.001*** -0.001*** -0.002*** -0.001*** -0.001*** (0.000) (0.000) (0.000) (0.000) (0.000) (0.000)
Observations 20,912 19,956 19,927 11,839 10,928 10,928
Number of stocks 26 26 26 25 25 25
R² 0.000 0.092 0.094 0.000 0.111 0.113
Prob > F 0.26 0.00 0.00 0.65 0.00 0.00
Table 24: Results for the Panel of Individual Stocks' Returns: Telecommunications
Telecommunications Full sample Subsample
(1) (2) (3) (1) (2) (3)
∆ Exit Risk -0.240** -0.188* -0.201** -0.311* -0.278 -0.288* (0.066) (0.086) (0.076) (0.137) (0.144) (0.132)
Return stock market 0.433*** 0.331*** 0.433*** 0.326***
(0.048) (0.063) (0.047) (0.062)
∆ Sovereign spread -0.009** -0.010** -0.007* -0.009**
(0.003) (0.003) (0.003) (0.003)
Return industry index 0.263** 0.355** 0.244** 0.309** (0.073) (0.109) (0.065) (0.100)
∆ VSTOXX -0.001** -0.001***
(0.000) (0.000)
Return exchange rate -0.307** -0.230
(0.113) (0.114)
Constant -0.000*** -0.000*** -0.000*** -0.001*** -0.001*** -0.001*** (0.000) (0.000) (0.000) (0.000) (0.000) (0.000)
Observations 9,653 9,189 9,179 5,785 5,345 5,351
Number of stocks 6 6 6 6 6 6
R² 0.000 0.243 0.251 0.001 0.280 0.288
Prob > F 0.02 0.00 0.00 0.06 0.00 0.00
Results are obtained by regressing the return of the respective stock on the change in eurozone exit risk of the
respective country and a set of control variables using stock fixed effects and robust standard errors.
*** p<0.01, ** p<0.05, * p<0.1

46
Table 25: Results for the Panel of Individual Stocks' Returns: Utilities
Utilities Full sample Subsample
(1) (2) (3) (1) (2) (3)
∆ Exit Risk -0.043 -0.007 -0.013 -0.098 -0.085 -0.087 (0.075) (0.079) (0.080) (0.104) (0.108) (0.109)
Return stock market 0.382*** 0.305*** 0.352*** 0.271***
(0.036) (0.039) (0.040) (0.041)
∆ Sovereign spread -0.008*** -0.009*** -0.006*** -0.008***
(0.002) (0.002) (0.002) (0.002)
Return industry index 0.188*** 0.262*** 0.191*** 0.245*** (0.018) (0.028) (0.019) (0.029)
∆ VSTOXX -0.001*** -0.001***
(0.000) (0.000)
Return exchange rate -0.267*** -0.236***
(0.034) (0.038)
Constant -0.000*** 0.000*** 0.000*** -0.001*** -0.000*** -0.000*** (0.000) (0.000) (0.000) (0.000) (0.000) (0.000)
Observations 35,361 33,693 33,646 20,768 19,190 19,190
Number of stocks 24 24 24 23 23 23
R² 0.000 0.222 0.229 0.000 0.244 0.253
Prob > F 0.57 0.00 0.00 0.36 0.00 0.00
Results are obtained by regressing the return of the respective stock on the change in eurozone exit risk of the
respective country and a set of control variables using stock fixed effects and robust standard errors.
*** p<0.01, ** p<0.05, * p<0.1

47
Table 26: Results for the Cross Section of Estimated Betas of Individuals Stocks: Full Sample
Full sample
(1) (2) (3) (4) (5) (6) (7)
Tradables 0.081 0.076
(0.099) (0.109)
Foreign sales/Total sales 0.001 0.001
(0.001) (0.001)
Total assets/Employees 0.000 0.000
(0.000) (0.000)
Total debt/Total assets 0.006** 0.005*
(0.003) (0.003)
Log(total assets) 0.027 0.003
(0.021) (0.024)
Return on assets 0.002 0.002
(0.005) (0.005)
Constant 0.194 0.239 0.268* 0.056 -0.044 0.270* -0.050
(0.152) (0.154) (0.141) (0.143) (0.303) (0.142) (0.309)
Country FE YES YES YES YES YES YES YES
Industry FE YES YES YES YES YES YES YES
Observations 333 326 331 332 332 332 326
R² 0.046 0.059 0.044 0.066 0.047 0.044 0.077
Prob > F 0.06 0.01 0.07 0.03 0.05 0.05 0.05
Results are obtained by regressing the stock-specific estimated 𝛽𝑒𝑥𝑖𝑡 𝑟𝑖𝑠𝑘,𝑖,𝑗,𝑠 (as explained in section 4.2) on
company-specific variables using country and industry fixed effects and robust standard errors.
*** p<0.01, ** p<0.05, * p<0.1

48
Table 27: Sources and Descriptive Statistics of Company-Specific Variables
Variable Worldscope Code Mean Std. Dev. Min Max
Tradables (Dummy)15 WC07021 (SIC-code) 0.49 0.50 0 1
Foreign sales/Total sales (%) WC08731 38.63 32.30 0 105.56
Total assets/Employees WC08406 890.11 2,727.60 15.25 44,634.63
Total debt/Total assets (%) WC03255/ WC02999 31.19 16.85 0 76.14
Log(total assets) WC02999 13.41 2.00 9.28 18.86
Return on assets (%) WC08326 3.21 6.02 -44.15 33.49
15 Dummy variable classifying a company as producing either tradable goods (=1) or nontradable goods (=0).
Classified according to their two-digit SIC code following Forbes 2002b.

49
Literature
Acharya, Viral V.; Drechsler, Itamar; Schnabl, Philipp (2014): A Pyrrhic Victory? Bank
Bailouts and Sovereign Credit Risk. In: The Journal of Finance 69 (6), p. 2689–2739.
Acharya, Viral V.; Eisert, Tim; Eufinger, Christian; Hirsch, Christian W. (2016): Whatever It
Takes: The Real Effects of Unconventional Monetary Policy, 25.10.2016.
Acharya, Viral V.; Steffen, Sascha (2015): The “greatest” carry trade ever? Understanding
eurozone bank risks. In: Journal of Financial Economics 115 (2), p. 215–236.
Aizenman, Joshua; Hutchison, Michael; Jinjarak, Yothin (2013): What is the risk of European
sovereign debt defaults? Fiscal space, CDS spreads and market pricing of risk. In: Journal of
International Money and Finance 34 (C), p. 37–59.
Ang, Andrew; Longstaff, Francis A. (2013): Systemic sovereign credit risk: Lessons from the
U.S. and Europe. In: Aggregate Implications of Local Public Finance 60 (5), p. 493–510.
Arquette, Gregory C.; Brown Jr., William O.; Burdekin, Richard C.K. (2008): US ADR and
Hong Kong H-share discounts of Shanghai-listed firms. In: Journal of Banking & Finance 32
(9), p. 1916–1927.
Auguste, Sebastian; Dominguez, Kathryn M.E.; Kamil, Herman; Tesar, Linda L. (2006): Cross-
border trading as a mechanism for implicit capital flight: ADRs and the Argentine crisis. In:
Journal of Monetary Economics 53 (7), p. 1259–1295.
Baba, Kunihiro; Shibata, Ritei; Sibuya, Masaaki (2004): Partial correlation and conditional
correlation as measure of conditional independence 46 (4), p. 657–664.
Bailey, Warren; Chan, Kalok; Chung, Y. Peter (2000): Depositary Receipts, Country Funds,
and the Peso Crash: The Intraday Evidence. In: The Journal of Finance 55 (6), p. 2693–2717.
Benzoni, Luca; Collin-Dufresne, Pierre; Goldstein, Robert S.; Helwege, Jean (2015): Modeling
Credit Contagion via the Updating of Fragile Beliefs. In: Review of Financial Studies 28 (7), p.
1960–2008.
Bin, Feng-Shun; Blenman, Lloyd P.; Chen, Dar-Hsin (2004): Valuation impact of currency
crises: Evidence from the ADR market. In: International Financial Crisis: Contagion, Risk
Premia and Equity Market Impact 13 (4), p. 411–432.

50
Choi, Jongmoo Jay; Jay (1995): Exchange Risk Sensitivity and Its Determinants: A Firm and
Industry Analysis of U.S. Multinationals. In: Financial Management 24 (3).
Corsetti, Giancarlo; Kuester, Keith; Meier, André; Müller, Gernot J. (2014): Sovereign risk and
belief-driven fluctuations in the euro area. In: Carnegie-Rochester-NYU Conference Series on
“Fiscal Policy in the Presence of Debt Crises” held at the Stern School of Business, New York
University on April 19-20, 2013 61, p. 53–73.
Costantini, Mauro; Fragetta, Matteo; Melina, Giovanni (2014): Determinants of sovereign bond
yield spreads in the EMU: An optimal currency area perspective. In: European Economic
Review 70, p. 337–349.
De Santis, Roberto A. (2015): A Measure of Redenomination Risk, 20.06.2015.
Dewachter, Hans; Iania, Leonardo; Lyrio, Marco; Sola Perea, Maite de (2015): A macro-
financial analysis of the euro area sovereign bond market. In: Journal of Banking & Finance
50, p. 308–325.
Di Cesare, Antonio; Grande, Giuseppe; Manna, Michele; Taboga, Marco (2012): Recent
Estimates of Sovereign Risk Premia for Euro-Area Countries, 10.10.2012.
Drechsler, Itamar; Drechsel, Thomas; Marques-Ibanez, David; Schnabl, Philipp (2016): Who
Borrows from the Lender of Last Resort? In: The Journal of Finance 71 (5), p. 1933–1974.
Eichler, Stefan (2011): What Can Currency Crisis Models Tell Us about the Risk of Withdrawal
from the EMU? Evidence from ADR Data. In: JCMS: Journal of Common Market Studies 49
(4), p. 719–739.
Eichler, Stefan; Karmann, Alexander; Maltritz, Dominik (2009): The ADR shadow exchange
rate as an early warning indicator for currency crises. In: Financial Globalisation, Risk Analysis
and Risk Management 33 (11), p. 1983–1995.
Engle, Robert; Ghysels, Eric; Sohn, Bumjean (2013): Stock Market Volatility and
Macroeconomic Fundamentals. In: The Review of Economics and Statistics 95 (3), p. 776–797.
Engler, Philipp; Große Steffen, Christoph (2016): Sovereign risk, interbank freezes, and
aggregate fluctuations. In: European Economic Review 87, p. 34–61.

51
Errunza, Vihang; Hogan, Ked (1998): Macroeconomic Determinants of European Stock Market
Volatility. In: European Financial Management 4 (3), p. 361–377.
Eser, Fabian; Schwaab, Bernd (2016): Evaluating the impact of unconventional monetary
policy measures: Empirical evidence from the ECB׳s Securities Markets Programme. In:
Journal of Financial Economics 119 (1), p. 147–167.
Favero, Carlo; Missale, Alessandro (2012): Sovereign spreads in the eurozone: which prospects
for a Eurobond? In: Economic Policy 27 (70), p. 231–273.
Fisher, Ronald Aylmer, Sir, 1890-1962 (1924): 035: The Distribution of the Partial Correlation
Coefficient.
Forbes, Kristin J. (2002a): How Do Large Depreciations Affect Firm Performance? In: IMF
Econ Rev 49 (1), p. 214–238.
Forbes, Kristin J. (2002b): How Do Large Depreciations Affect Firm Performance? (National
Bureau of Economic Research, w9095).
Gaballo, Gaetano; Zetlin-Jones, Ariel (2016): Bailouts, moral hazard and banks׳ home bias for
Sovereign debt. In: Carnegie-Rochester-NYU Conference Series on Public Policy“Monetary
Policy: An Unprecedented Predicament” held at the Tepper School of Business, Carnegie
Mellon University, November, 2015 81, p. 70–85.
Glen, Jack (2002): Devaluations and emerging stock market returns. In: Emerging Markets
Review 3 (4), p. 409–428.
Kim, Minho; Szakmary, Andrew C.; Mathur, Ike (2000): Price transmission dynamics between
ADRs and their underlying foreign securities. In: Journal of Banking & Finance 24 (8), p.
1359–1382.
Klose, Jens; Weigert, Benjamin (2014): Sovereign Yield Spreads During the Euro Crisis:
Fundamental Factors Versus Redenomination Risk. In: International Finance 17 (1), p. 25–50.
Krishnamurthy, Arvind; Nagel, Stefan; Vissing-Jorgensen, Annette (2014): ECB Policies
involving Government Bond Purchases: Impact and Channels. In: Unpublished Working Paper
2014.

52
Kriwoluzky, Alexander; Müller, Gernot; Wolf, Martin (2015): Exit Expectations and Debt
Crises in Currency Unions, 16.09.2015.
Levy Yeyati, Eduardo; Schmukler, Sergio L.; van Horen, Neeltje (2004): The price of
inconvertible deposits: the stock market boom during the Argentine crisis. In: Economics
Letters 83 (1), p. 7–13.
Levy Yeyati, Eduardo; Schmukler, Sergio L.; van Horen, Neeltje (2009): International financial
integration through the law of one price: The role of liquidity and capital controls. In: Journal
of Financial Intermediation 18 (3), p. 432–463.
Meinen, Philipp; Roehe, Oke (2017): On measuring uncertainty and its impact on investment:
Cross-country evidence from the euro area. In: European Economic Review 92, S. 161–179.
Melvin, Michael (2003): A stock market boom during a financial crisis?: ADRs and capital
outflows in Argentina. In: Economics Letters 81 (1), p. 129–136.
Pasquariello, Paolo (2008): The anatomy of financial crises: Evidence from the emerging ADR
market. In: Journal of International Economics 76 (2), p. 193–207.
Popov, Alexander; van Horen, Neeltje (2015): Exporting Sovereign Stress: Evidence from
Syndicated Bank Lending during the Euro Area Sovereign Debt Crisis. In: Review of Finance
19 (5), p. 1825–1866.
Shambaugh, Jay C. (2012): The Euro’s Three Crises Brookings Papers on Economic Activity
Spring 2012.