Embed Size (px)
Citation preview
Final Report
EUROMET.M.FF-K4
Euromet Key Comparison for Volume Intercomparison of 100 ml Gay-Lussac Pycnometer
Based on the EUROMET Project no. 692 conducted September 2002/ March 2004
Elsa Batista
Portuguese Institute for Quality (IPQ)
Contents 1. Introduction ................................................................................................................................2 2. Participants and schedules.........................................................................................................2 3. The transfer package ..................................................................................................................3 4. Conditions selected .....................................................................................................................3 5. Experimental procedure .............................................................................................................4
5.1. Experimental conditions........................................................................................................... 4 5.2. Equipment .............................................................................................................................. 5 5.3. Type of water.......................................................................................................................... 5
6. Analysis of the results.................................................................................................................6 6.1. Volume measurements results .................................................................................................. 6 6.2. Determination of the reference value........................................................................................ 9 6.3. Determination of the reference value uncertainty ...................................................................... 9 6.4. Consistency statistical te st - Chi-square test ............................................................................10 6.5. Degrees of equivalence...........................................................................................................12
7. Uncertainty presentation..........................................................................................................13 7.1. Type A and type B uncertainty ................................................................................................13 7.2. Uncertainty components .........................................................................................................14 7.3. Major source of uncertainty .....................................................................................................19
8. Conclusions................................................................................................................................20 9. References .................................................................................................................................21 Annex 1 – Spreadsheet .................................................................................................................22 Annex 2 – Equipment ....................................................................................................................24 Annex 3 – Degrees of equivalence between laboratories of the EUROMET comparison in nl (ml ×10-6) ......................................................................................................................................29 Annex 4 – Degrees of equivalence between each laboratory participating in EUROMET comparison and each laboratory participating in CCM.FF-K4, in nl...........................................30 Annex 5 – Degrees of equivalence of each laboratory of EUROMET comparison with respect to the reference value determined in CCM.FF-K4 for the Pycnometer nº TS 03.04.03 ............31 Annex 6 – Uncertainty components for each laboratory ............................................................32
Portuguese Institute for Quality
EUROMET Key Comparison 100 ml pycnometer - Final Report – August 2006 2
1. Introduction
The project for the comparison of the volume of 100 ml Gay -Lussac pycnometer was proposed initially in the Euromet TC Flow meeting 2002 in Prague. The protocol was based on BIPM Guidelines and sent to all the interested countries, 14 NMIs agreed to participate. The Euromet 692 project officially started in September 2002 and was concluded in March 2004.
The main purpose of the project was to compare the experimental method and the uncertainty calculation in the pycnometer volume determination and it was expected to be representative for all types of laboratory glassware.
In the Euromet TC Flow 2006 in Lisbon it was decide to propose this project as a Euromet Key Comparison due to the good overall agreement found.
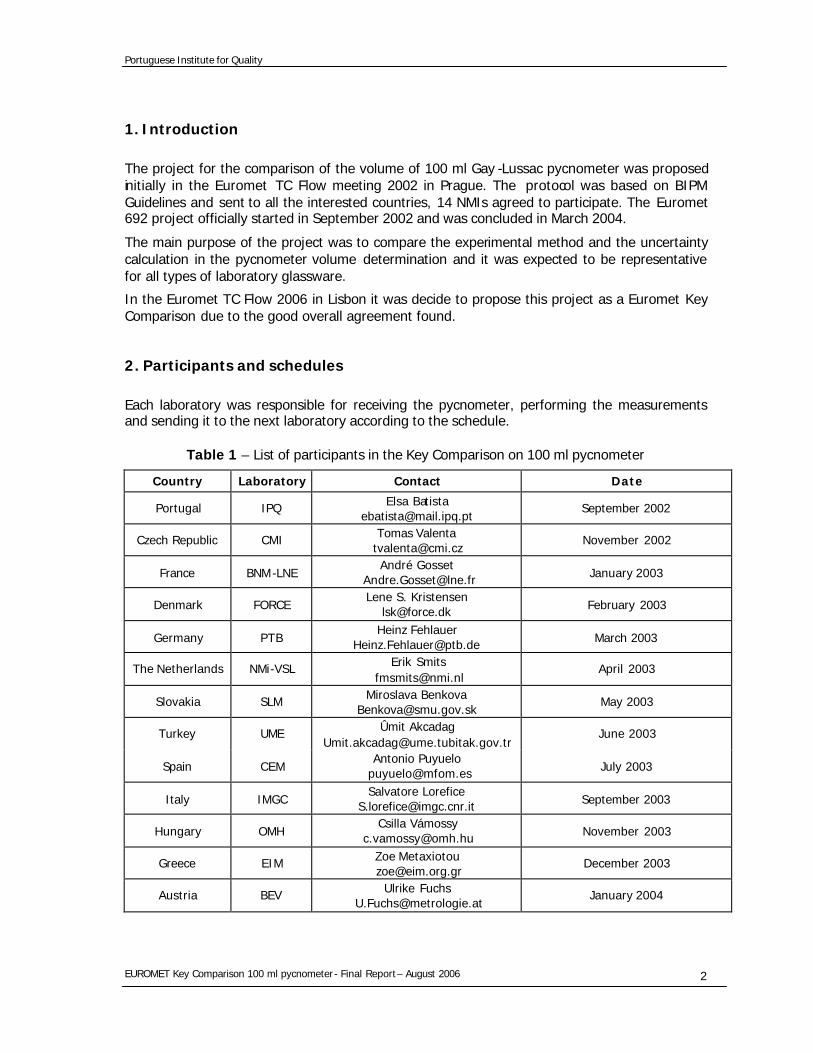
2. Participants and schedules Each laboratory was responsible for receiving the pycnometer, performing the measurements and sending it to the next laboratory according to the schedule.
Table 1 – List of participants in the Key Comparison on 100 ml pycnometer
Country Laboratory Contact Date
Portugal IPQ Elsa Batista [email protected]
September 2002
Czech Republic CMI Tomas Valenta [email protected]
November 2002
France BNM-LNE André Gosset
[email protected] January 2003
Denmark FORCE Lene S. Kristensen
[email protected] February 2003
Germany PTB Heinz Fehlauer
[email protected] March 2003
The Netherlands NMi-VSL Erik Smits [email protected]
April 2003
Slovakia SLM Miroslava Benkova [email protected]
May 2003
Turkey UME Ûmit Akcadag [email protected]
June 2003
Spain CEM Antonio Puyuelo
[email protected] July 2003
Italy IMGC Salvatore Lorefice
[email protected] September 2003
Hungary OMH Csilla Vámossy
[email protected] November 2003
Greece EIM Zoe Metaxiotou [email protected]
December 2003
Austria BEV Ulrike Fuchs [email protected]
January 2004
Portuguese Institute for Quality
EUROMET Key Comparison 100 ml pycnometer - Final Report – August 2006 3
Sweden SP Peter Lau [email protected]
March 2004
3. The transfer package
The transfer standard consists on a pycnometer currently used for the measurement of the density of different liquids (from water to high viscosity paints). In order to have a correct density measurement the volume of the pycnometer must be obtained by calibration. Usually the calibration method is a gravimetric method.
There are several types of pycnometers. The one suggested for this comparison is a Gay -Lussac borosilicate glass pycnometer of 100 ml (with a coefficient of thermal expansion of 10×10-6 C -1). The main reasons for choosing this type of pycnometer were:
Ø easy handling;
Ø the volume cannot be changed unless breaking the instrument;
Ø easy cleaning;
Ø possibility to observe air bubbles is evident.
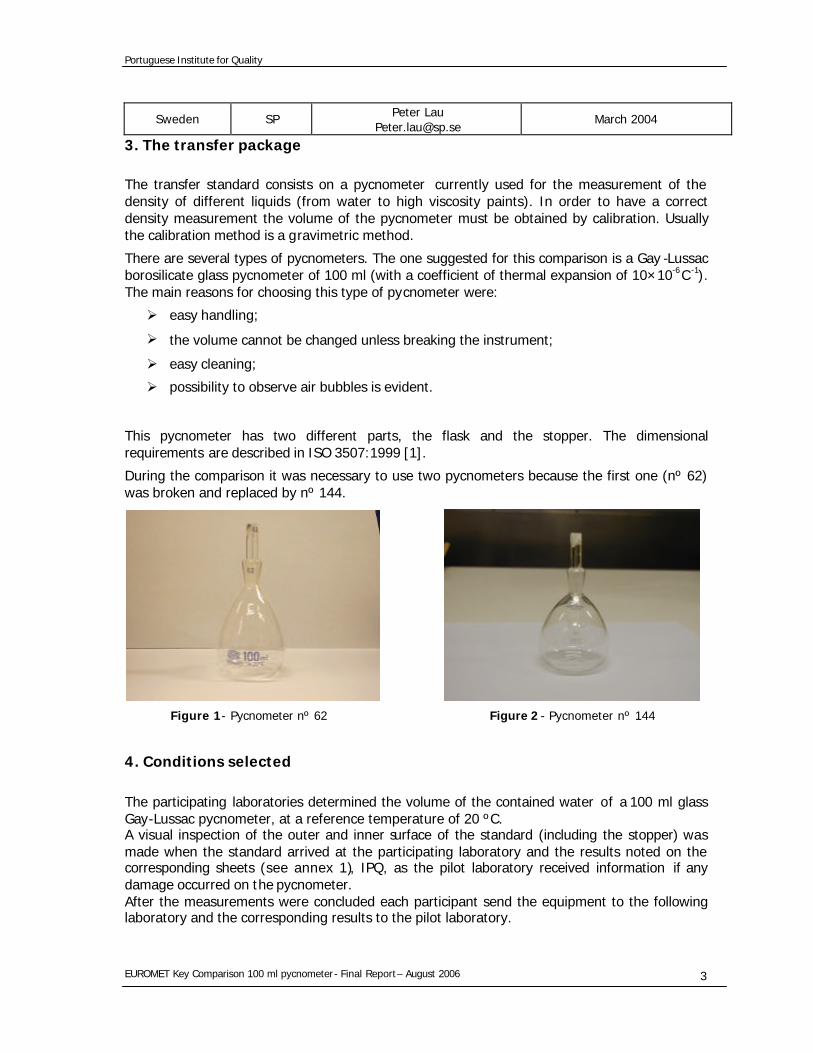
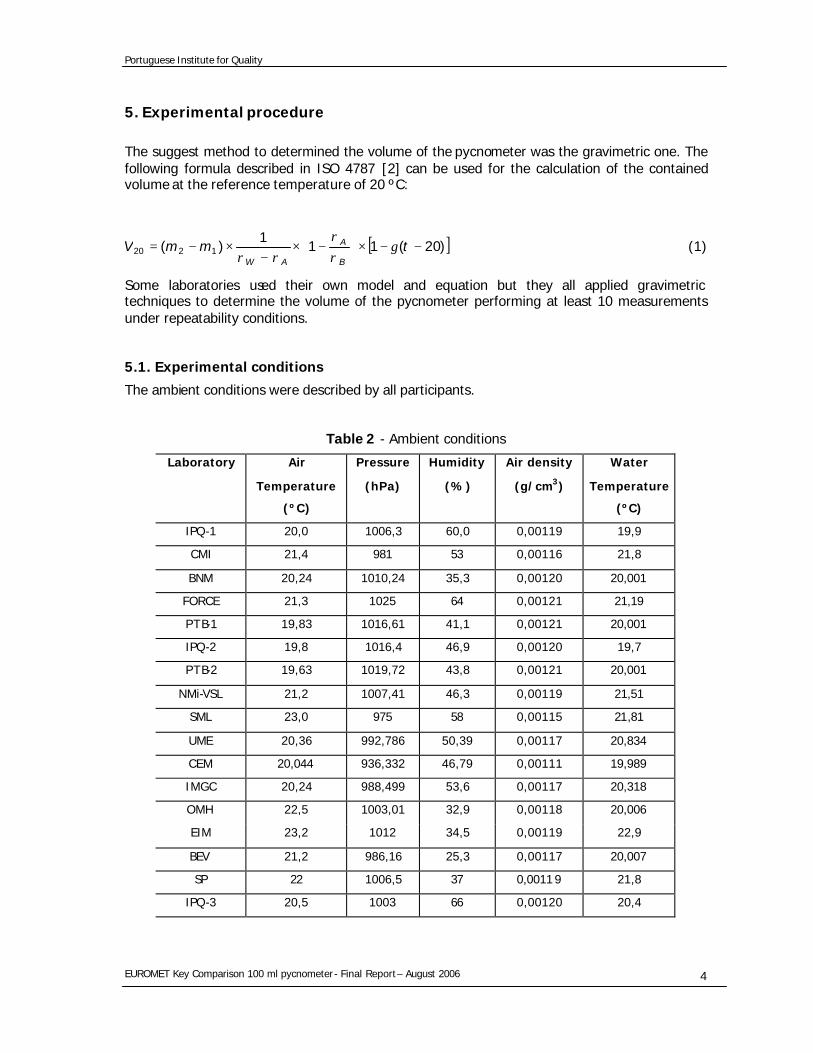
This pycnometer has two different parts, the flask and the stopper. The dimensional requirements are described in ISO 3507:1999 [1].
During the comparison it was necessary to use two pycnometers because the first one (nº 62) was broken and replaced by nº 144.
Figure 1- Pycnometer nº 62 Figure 2 - Pycnometer nº 144
4. Conditions selected
The participating laboratories determined the volume of the contained water of a 100 ml glass Gay-Lussac pycnometer, at a reference temperature of 20 ºC. A visual inspection of the outer and inner surface of the standard (including the stopper) was made when the standard arrived at the participating laboratory and the results noted on the corresponding sheets (see annex 1), IPQ, as the pilot laboratory received information if any damage occurred on the pycnometer. After the measurements were concluded each participant send the equipment to the following laboratory and the corresponding results to the pilot laboratory.
Portuguese Institute for Quality
EUROMET Key Comparison 100 ml pycnometer - Final Report – August 2006 4
5. Experimental procedure The suggest method to determined the volume of the pycnometer was the gravimetric one. The following formula described in ISO 4787 [2] can be used for the calculation of the contained volume at the reference temperature of 20 ºC:
[ ])20(111
)( 1220 −−×
−×
−×−= tmmV
B
A
AW
γρρ
ρρ (1)
Some laboratories used their own model and equation but they all applied gravimetric techniques to determine the volume of the pycnometer performing at least 10 measurements under repeatability conditions.
5.1. Experimental conditions
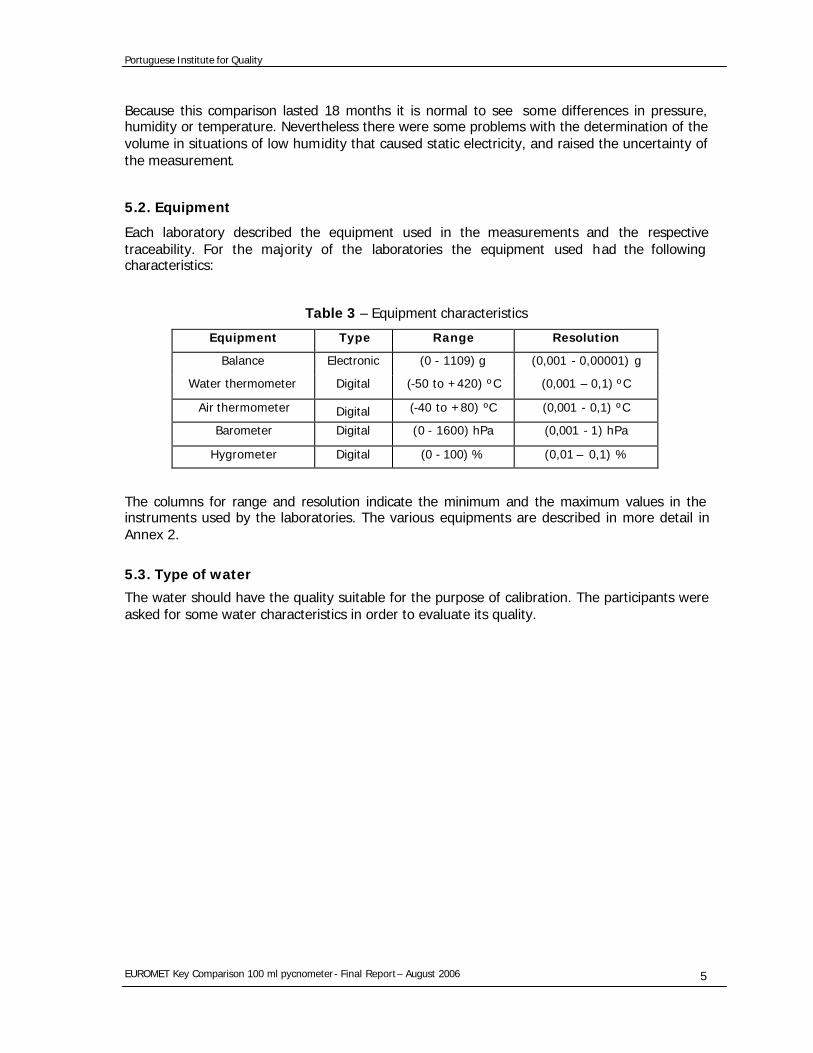
The ambient conditions were described by all participants.
Table 2 - Ambient conditions
Laboratory Air
Temperature
(ºC)
Pressure
(hPa)
Humidity
(%)
Air density
(g/cm3)
Water
Temperature
(ºC)
IPQ-1 20,0 1006,3 60,0 0,00119 19,9
CMI 21,4 981 53 0,00116 21,8
BNM 20,24 1010,24 35,3 0,00120 20,001
FORCE 21,3 1025 64 0,00121 21,19
PTB-1 19,83 1016,61 41,1 0,00121 20,001
IPQ-2 19,8 1016,4 46,9 0,00120 19,7
PTB-2 19,63 1019,72 43,8 0,00121 20,001
NMi-VSL 21,2 1007,41 46,3 0,00119 21,51
SML 23,0 975 58 0,00115 21,81
UME 20,36 992,786 50,39 0,00117 20,834
CEM 20,044 936,332 46,79 0,00111 19,989
IMGC 20,24 988,499 53,6 0,00117 20,318
OMH 22,5 1003,01 32,9 0,00118 20,006
EIM 23,2 1012 34,5 0,00119 22,9
BEV 21,2 986,16 25,3 0,00117 20,007
SP 22 1006,5 37 0,00119 21,8
IPQ-3 20,5 1003 66 0,00120 20,4
Portuguese Institute for Quality
EUROMET Key Comparison 100 ml pycnometer - Final Report – August 2006 5
Because this comparison lasted 18 months it is normal to see some differences in pressure, humidity or temperature. Nevertheless there were some problems with the determination of the volume in situations of low humidity that caused static electricity, and raised the uncertainty of the measurement.
5.2. Equipment
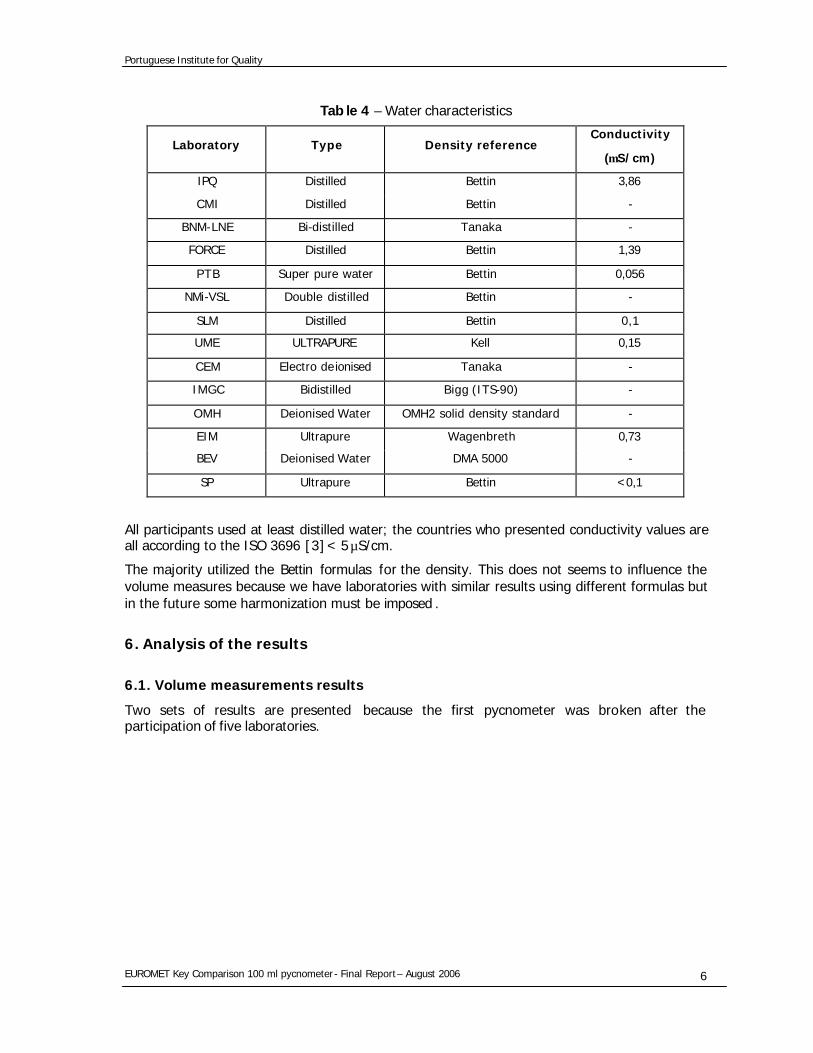
Each laboratory described the equipment used in the measurements and the respective traceability. For the majority of the laboratories the equipment used had the following characteristics:
Table 3 – Equipment characteristics
Equipment Type Range Resolution
Balance Electronic (0 - 1109) g (0,001 - 0,00001) g
Water thermometer Digital (-50 to +420) ºC (0,001 – 0,1) ºC
Air thermometer Digital (-40 to +80) ºC (0,001 - 0,1) ºC
Barometer Digital (0 - 1600) hPa (0,001 - 1) hPa
Hygrometer Digital (0 - 100) % (0,01 – 0,1) %
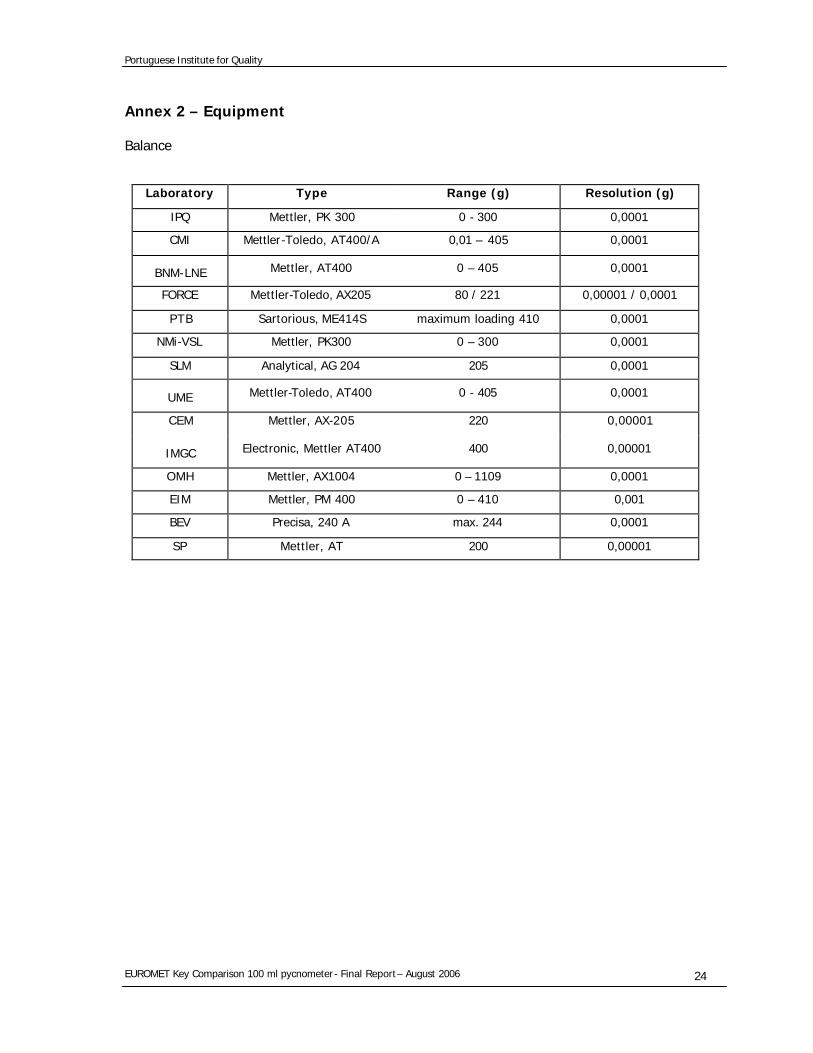
The columns for range and resolution indicate the minimum and the maximum values in the instruments used by the laboratories. The various equipments are described in more detail in Annex 2.
5.3. Type of water
The water should have the quality suitable for the purpose of calibration. The participants were asked for some water characteristics in order to evaluate its quality.
Portuguese Institute for Quality
EUROMET Key Comparison 100 ml pycnometer - Final Report – August 2006 6
Tab le 4 – Water characteristics
Laboratory Type Density reference Conductivity
(µ S/cm)
IPQ Distilled Bettin 3,86
CMI Distilled Bettin -
BNM-LNE Bi-distilled Tanaka -
FORCE Distilled Bettin 1,39
PTB Super pure water Bettin 0,056
NMi-VSL Double distilled Bettin -
SLM Distilled Bettin 0,1
UME ULTRAPURE Kell 0,15
CEM Electro deionised Tanaka -
IMGC Bidistilled Bigg (ITS-90) -
OMH Deionised Water OMH2 solid density standard -
EIM Ultrapure Wagenbreth 0,73
BEV Deionised Water DMA 5000 -
SP Ultrapure Bettin <0,1
All participants used at least distilled water; the countries who presented conductivity values are all according to the ISO 3696 [3] < 5µS/cm.
The majority utilized the Bettin formulas for the density. This does not seems to influence the volume measures because we have laboratories with similar results using different formulas but in the future some harmonization must be imposed .
6. Analysis of the results
6.1. Volume measurements results
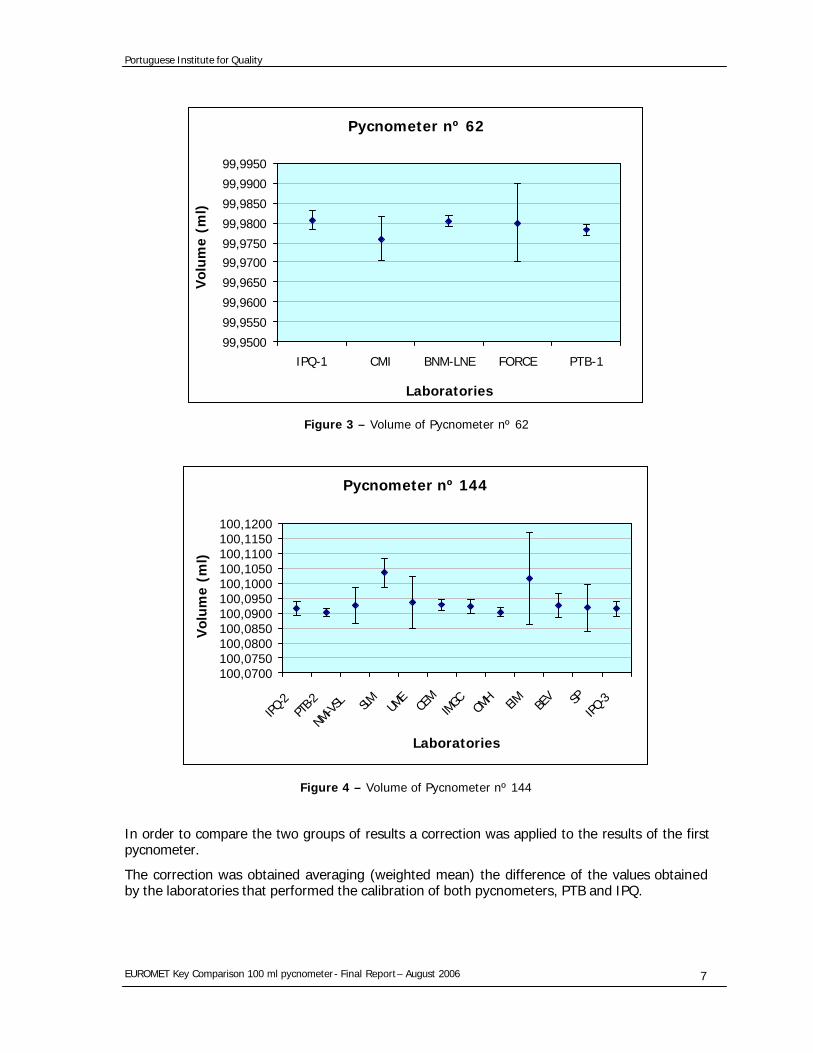
Two sets of results are presented because the first pycnometer was broken after the participation of five laboratories.
Portuguese Institute for Quality
EUROMET Key Comparison 100 ml pycnometer - Final Report – August 2006 7
Pycnometer nº 62
99,9500
99,9550
99,9600
99,9650
99,9700
99,9750
99,9800
99,9850
99,9900
99,9950
IPQ-1 CMI BNM-LNE FORCE PTB-1
Laboratories
Vo
lum
e (m
l)
Figure 3 – Volume of Pycnometer nº 62
Pycnometer nº 144
100,0700100,0750100,0800100,0850100,0900100,0950100,1000100,1050100,1100100,1150100,1200
IPQ-2
PTB-2
NMi-VSL SLM UM
ECE
MIM
GC OMH EIM BE
V SPIPQ
-3
Laboratories
Vol
um
e (m
l)
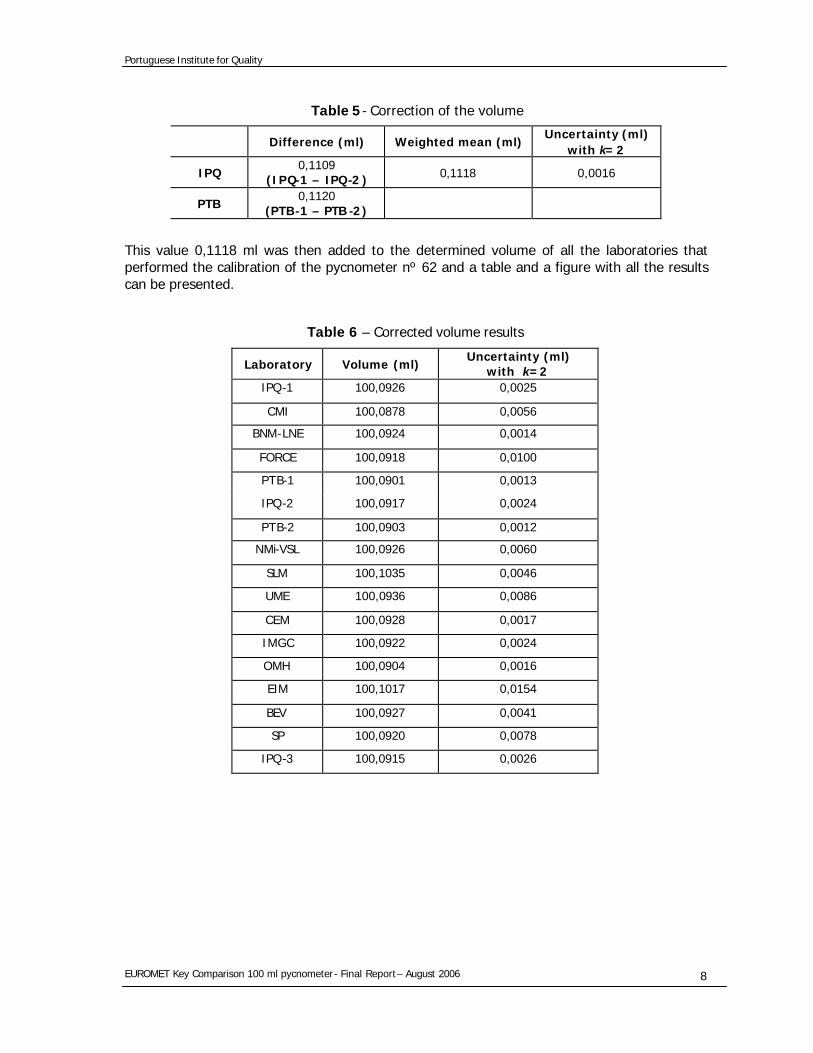
Figure 4 – Volume of Pycnometer nº 144
In order to compare the two groups of results a correction was applied to the results of the first pycnometer.
The correction was obtained averaging (weighted mean) the difference of the values obtained by the laboratories that performed the calibration of both pycnometers, PTB and IPQ.
Portuguese Institute for Quality
EUROMET Key Comparison 100 ml pycnometer - Final Report – August 2006 8
Table 5- Correction of the volume
Difference (ml) Weighted mean (ml) Uncertainty (ml)
with k=2
IPQ 0,1109
(IPQ-1 – IPQ-2 ) 0,1118 0,0016
PTB 0,1120
(PTB-1 – PTB -2)
This value 0,1118 ml was then added to the determined volume of all the laboratories that performed the calibration of the pycnometer nº 62 and a table and a figure with all the results can be presented.
Table 6 – Corrected volume results
Laboratory Volume (ml) Uncertainty (ml)
with k=2 IPQ-1 100,0926 0,0025
CMI 100,0878 0,0056
BNM-LNE 100,0924 0,0014
FORCE 100,0918 0,0100
PTB-1 100,0901 0,0013
IPQ-2 100,0917 0,0024
PTB-2 100,0903 0,0012
NMi-VSL 100,0926 0,0060
SLM 100,1035 0,0046
UME 100,0936 0,0086
CEM 100,0928 0,0017
IMGC 100,0922 0,0024
OMH 100,0904 0,0016
EIM 100,1017 0,0154
BEV 100,0927 0,0041
SP 100,0920 0,0078
IPQ-3 100,0915 0,0026
Portuguese Institute for Quality
EUROMET Key Comparison 100 ml pycnometer - Final Report – August 2006 9
Corrected volume results
100,0700
100,0750
100,0800
100,0850
100,0900
100,0950
100,1000
100,1050
100,1100
100,1150
100,1200
IPQ-1 CM
I
BNM-LN
EFO
RCE
PTB-1
IPQ-2
PTB-2
NMi-V
SL
SLM UME
CEM
IMGC OM
H EIM BEV SP
IPQ-3
Laboratories
Vo
lum
e (m
l)
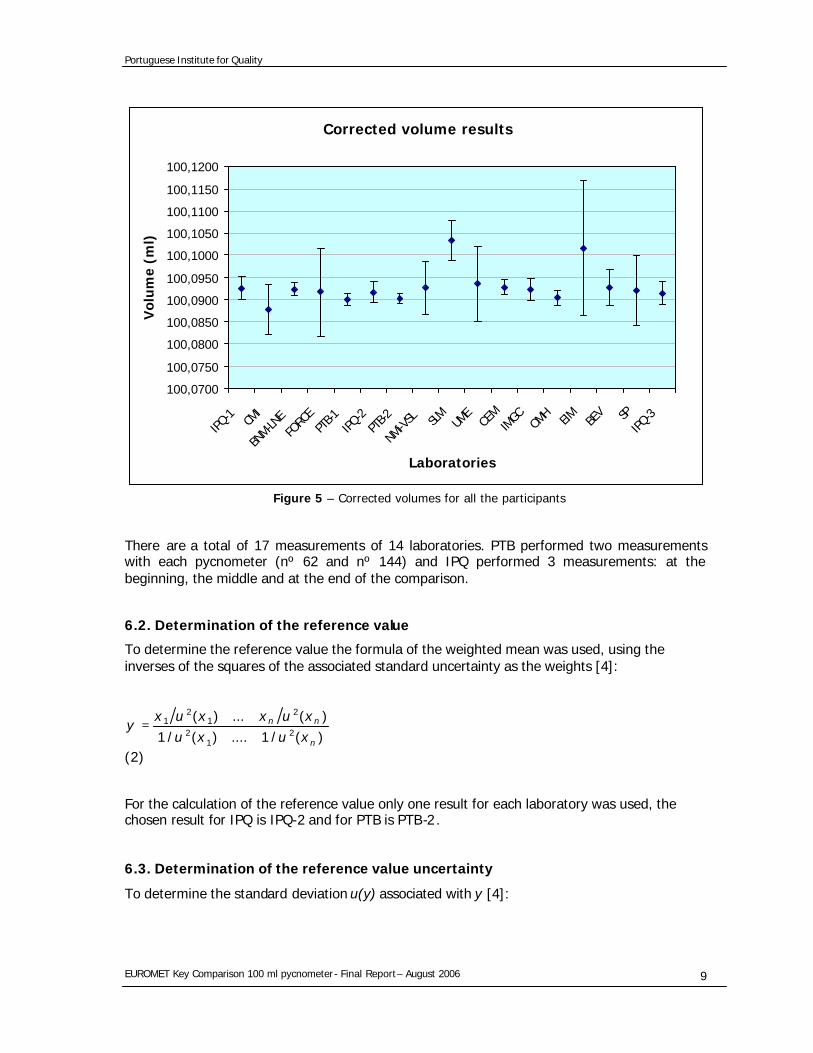
Figure 5 – Corrected volumes for all the participants
There are a total of 17 measurements of 14 laboratories. PTB performed two measurements with each pycnometer (nº 62 and nº 144) and IPQ performed 3 measurements: at the beginning, the middle and at the end of the comparison.
6.2. Determination of the reference value
To determine the reference value the formula of the weighted mean was used, using the inverses of the squares of the associated standard uncertainty as the weights [4]:
)(/1....)(/1
)(...)(2
12
21
21
n
nn
xuxu
xuxxuxy
++++
=
(2)
For the calculation of the reference value only one result for each laboratory was used, the chosen result for IPQ is IPQ-2 and for PTB is PTB-2.
6.3. Determination of the reference value uncertainty
To determine the standard deviation u(y) associated with y [4]:
Portuguese Institute for Quality
EUROMET Key Comparison 100 ml pycnometer - Final Report – August 2006 10
)(/1...)(/11)(
21
2nxuxu
yu++
=
(3)
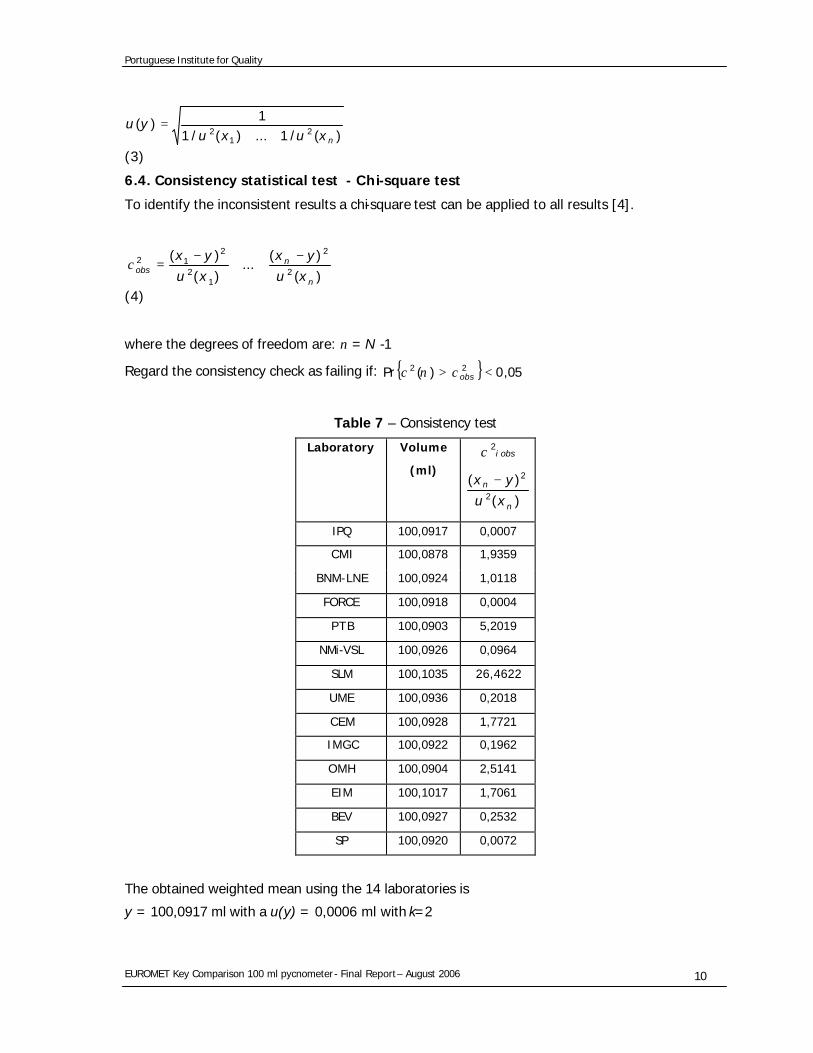
6.4. Consistency statistical test - Chi-square test
To identify the inconsistent results a chi-square test can be applied to all results [4].
)(
)(...
)(
)(2
2
12
212
n
nobs xu
yx
xu
yx −++
−=χ
(4)
where the degrees of freedom are: ν = N -1
Regard the consistency check as failing if: 05,0)(Pr 22 <> obsχνχ
Table 7 – Consistency test
Laboratory Volume
(ml) obsi
2χ
)(
)(2
2
n
n
xu
yx −
IPQ 100,0917 0,0007
CMI 100,0878 1,9359
BNM-LNE 100,0924 1,0118
FORCE 100,0918 0,0004
PTB 100,0903 5,2019
NMi-VSL 100,0926 0,0964
SLM 100,1035 26,4622
UME 100,0936 0,2018
CEM 100,0928 1,7721
IMGC 100,0922 0,1962
OMH 100,0904 2,5141
EIM 100,1017 1,7061
BEV 100,0927 0,2532
SP 100,0920 0,0072
The obtained weighted mean using the 14 laboratories is
y = 100,0917 ml with a u(y) = 0,0006 ml with k=2
Portuguese Institute for Quality
EUROMET Key Comparison 100 ml pycnometer - Final Report – August 2006 11
The chi-square test gives the following results:
3620,22)13;05,0(2 =χ ; =2obsχ 41,3602
The consistency test fails. The value for 4622,262 =SLMχ is higher then 3620,22)13;05,0(2 =χ . The volume value for the SLM is then removed from the weighted mean calculation and a new consistent test is performed.
The results now are the following:
0261,21)12;05,0(2 =χ ; 3879,142 =obsχ
We conclude that the results are consistent and y is the calculated reference value x ref and u(y) the standard uncertainty u(x ref).
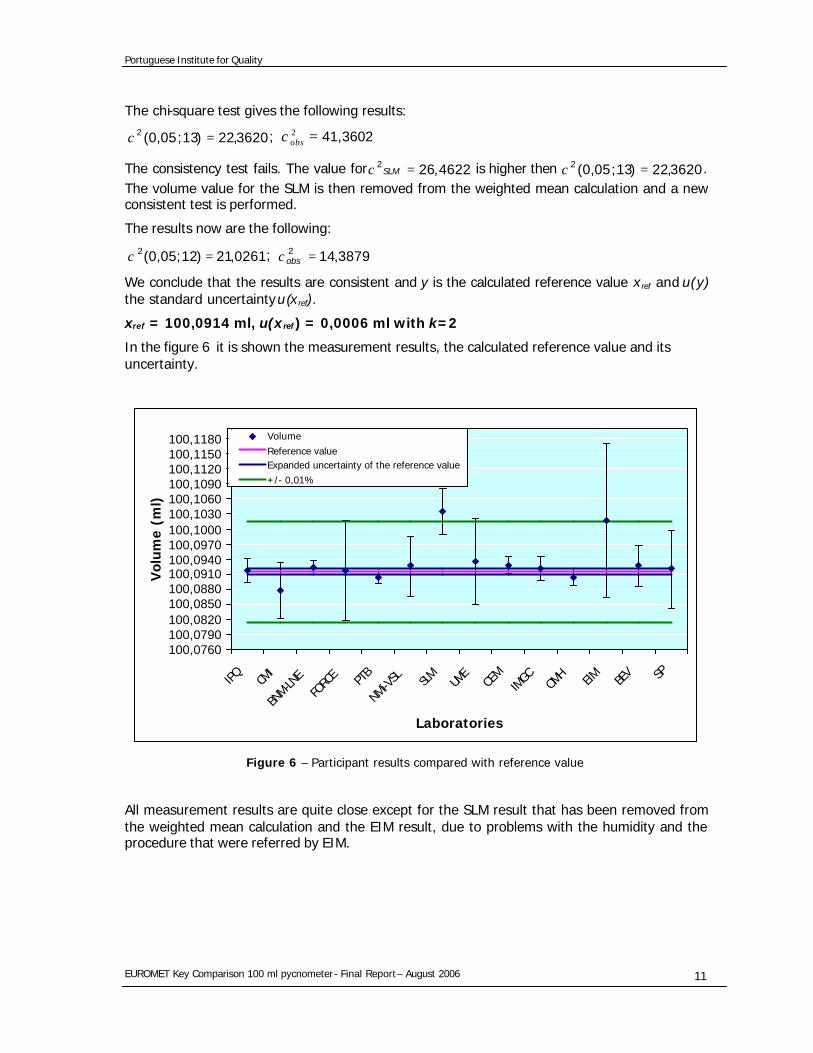
xref = 100,0914 ml, u(xref) = 0,0006 ml with k=2
In the figure 6 it is shown the measurement results, the calculated reference value and its uncertainty.
100,0760100,0790100,0820100,0850100,0880100,0910100,0940100,0970100,1000100,1030100,1060100,1090100,1120100,1150100,1180
IPQ CMI
BNM-LN
EFO
RCE PT
B
NMi-V
SL
SLM UME
CEM
IMGC OM
H EIM BEV SP
Laboratories
Vol
um
e (m
l)
Volume
Reference valueExpanded uncertainty of the reference value
+/- 0,01%
Figure 6 – Participant results compared with reference value
All measurement results are quite close except for the SLM result that has been removed from the weighted mean calculation and the EIM result, due to problems with the humidity and the procedure that were referred by EIM.
Portuguese Institute for Quality
EUROMET Key Comparison 100 ml pycnometer - Final Report – August 2006 12
6.5. Degrees of equivalence
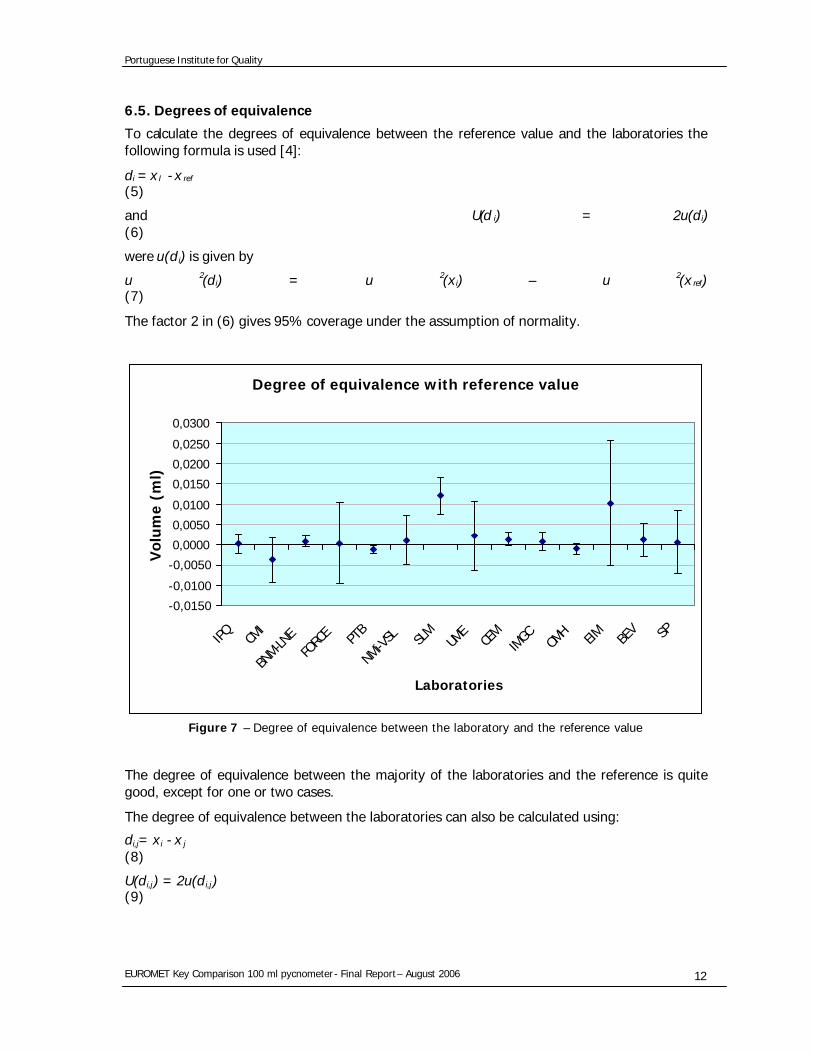
To calculate the degrees of equivalence between the reference value and the laboratories the following formula is used [4]:
di = x I - x ref
(5)
and U(d i) = 2u(d i) (6)
were u(d i) is given by
u 2(di) = u 2(x i) – u 2(x ref) (7)
The factor 2 in (6) gives 95% coverage under the assumption of normality.
Degree of equivalence with reference value
-0,0150
-0,0100
-0,0050
0,0000
0,0050
0,0100
0,0150
0,0200
0,0250
0,0300
IPQ CMI
BNM-LN
EFO
RCE PT
B
NMi-V
SL
SLM
UME
CEM
IMGC OM
H EIM BEV SP
Laboratories
Vo
lum
e (m
l)
Figure 7 – Degree of equivalence between the laboratory and the reference value
The degree of equivalence between the majority of the laboratories and the reference is quite good, except for one or two cases.
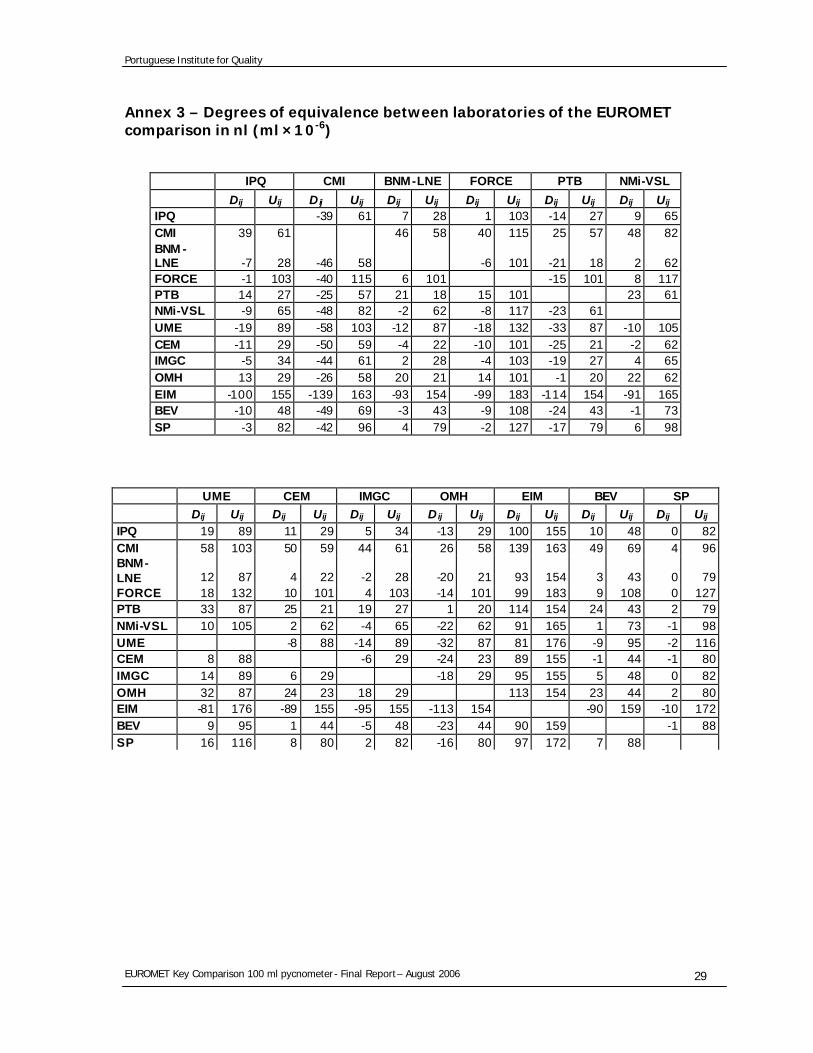
The degree of equivalence between the laboratories can also be calculated using:
di,j= x i - x j (8)
U(di,j) = 2u(d i,j) (9)
Portuguese Institute for Quality
EUROMET Key Comparison 100 ml pycnometer - Final Report – August 2006 13
Where u(d i,j) is given by
u 2(d i,j) = u 2(x i) + u 2(x j) (10)
The results are presented in the table of Annex 3. The uncertainty is with a coverage factor of k =2 presen ted in the lower part of the matrix.
In this table we can have a general idea of the differences in the volume results between the laboratories.
7. Uncertainty presentation
7.1. Type A and type B uncertainty
It was requested that all participants presen t the systematic and random standard uncertainties.
All the presented uncertainties are expanded uncertainty with a cover factor of 2.
Because of some confusion in defining the random uncertainty it was decided to present in this report the standard deviat ion of the mean of the determined volume instead.
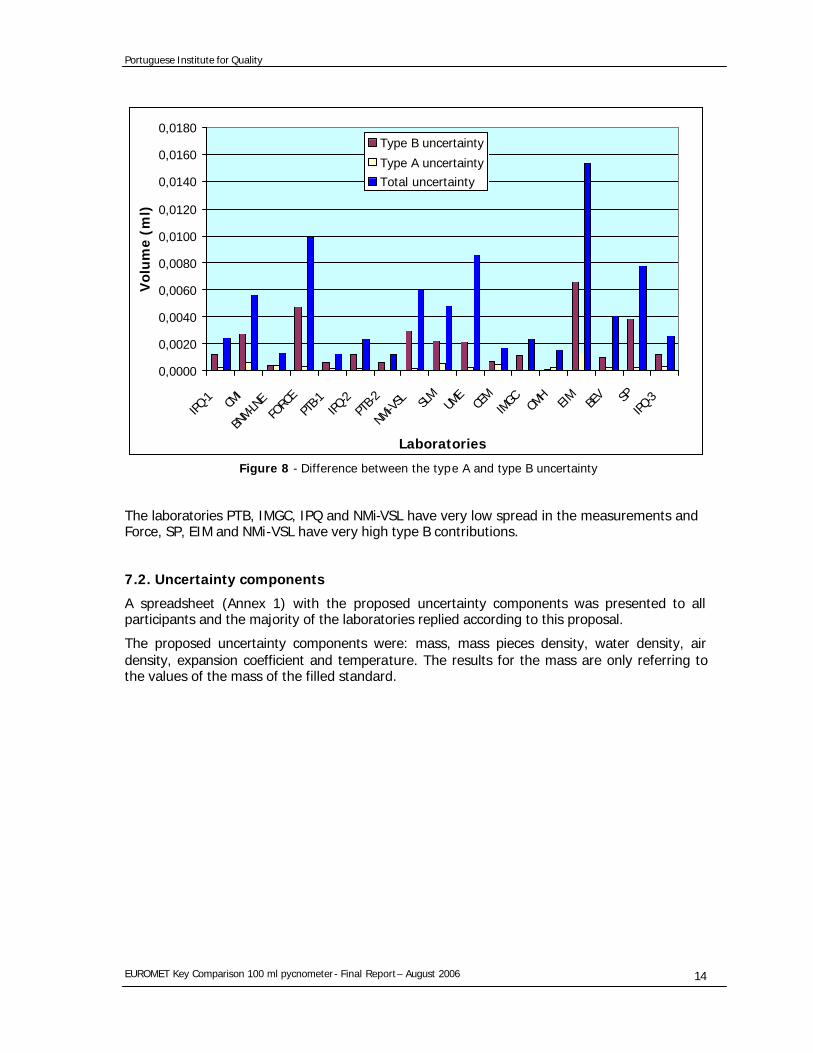
Figure 8 presents the different opinions on the achieved measurement uncertainty. The standard deviation of the mean from 10 repeated measurements was taken as the type A contribution. The remaining uncertainty components of type B comprise the combination on a standard level. The total uncertainty is the value specified by the laboratories themselves on an expanded confidence level of 95 %.
Portuguese Institute for Quality
EUROMET Key Comparison 100 ml pycnometer - Final Report – August 2006 14
0,0000
0,0020
0,0040
0,0060
0,0080
0,0100
0,0120
0,0140
0,0160
0,0180
IPQ-1 CM
I
BNM-
LNE
FORC
EPT
B-1 IPQ-2
PTB-2
NMi-V
SL
SLM
UME
CEM
IMGC OM
HEIM BE
V SPIPQ
-3
Laboratories
Vo
lum
e (m
l)Type B uncertainty
Type A uncertainty
Total uncertainty
Figure 8 - Difference between the type A and type B uncertainty
The laboratories PTB, IMGC, IPQ and NMi-VSL have very low spread in the measurements and Force, SP, EIM and NMi-VSL have very high type B contributions.
7.2. Uncertainty components
A spreadsheet (Annex 1) with the proposed uncertainty components was presented to all participants and the majority of the laboratories replied according to this proposal.
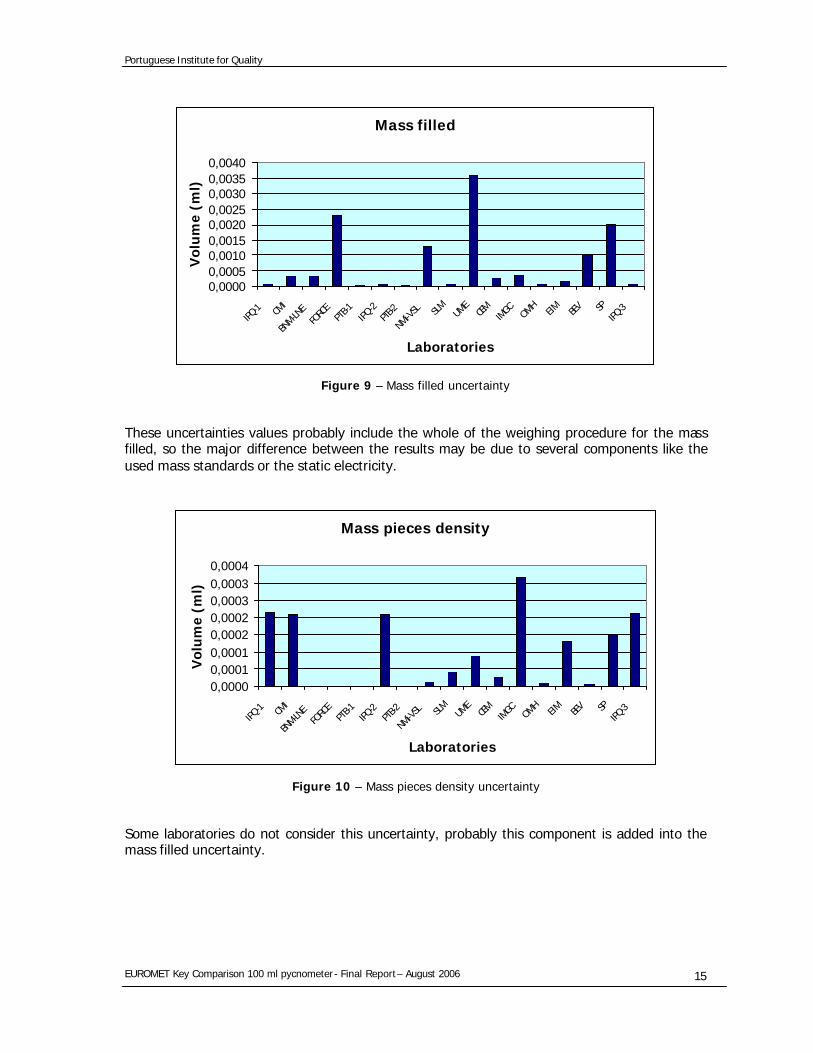
The proposed uncertainty components were: mass, mass pieces density, water density, air density, expansion coefficient and temperature. The results for the mass are only referring to the values of the mass of the filled standard.
Portuguese Institute for Quality
EUROMET Key Comparison 100 ml pycnometer - Final Report – August 2006 15
Mass filled
0,00000,00050,00100,00150,00200,00250,00300,00350,0040
IPQ-1 CM
I
BNM-
LNE
FORC
EPT
B-1IPQ
-2PTB
-2
NMi-V
SL
SLM UME
CEM IMGC OM
HEIM BEV SP
IPQ-3
Laboratories
Vo
lum
e (m
l)
Figure 9 – Mass filled uncertainty
These uncertainties values probably include the whole of the weighing procedure for the mass filled, so the major difference between the results may be due to several components like the used mass standards or the static electricity.
Mass pieces density
0,00000,00010,00010,00020,00020,00030,00030,0004
IPQ-1 CM
I
BNM-LNE
FORC
EPT
B-1IPQ
-2PTB
-2
NMi-VSL SLM UM
ECEM IM
GC OMH
EIM BEV SPIPQ
-3
Laboratories
Vo
lum
e (m
l)
Figure 10 – Mass pieces density uncertainty
Some laboratories do not consider this uncertainty, probably this component is added into the mass filled uncertainty.
Portuguese Institute for Quality
EUROMET Key Comparison 100 ml pycnometer - Final Report – August 2006 16
Water density
0,00000,00050,00100,00150,00200,00250,00300,00350,00400,0045
IPQ-1 CM
I
BNM-L
NEFO
RCE
PTB-1 IPQ
-2PT
B-2
NMi-V
SL
SLM UME
CEM IMGC
OMH
EIM BEV SPIPQ
-3
Laboratories
Vo
lum
e (m
l)
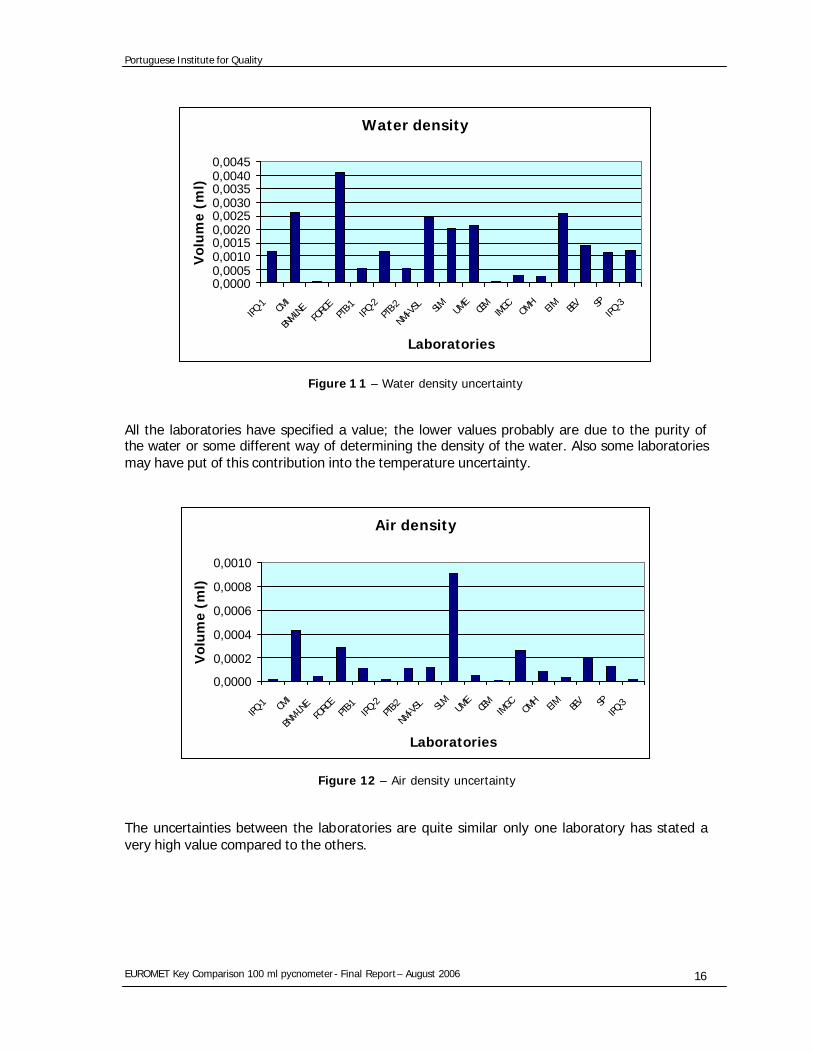
Figure 1 1 – Water density uncertainty
All the laboratories have specified a value; the lower values probably are due to the purity of the water or some different way of determining the density of the water. Also some laboratories may have put of this contribution into the temperature uncertainty.
Air density
0,0000
0,0002
0,0004
0,0006
0,0008
0,0010
IPQ-1 CM
I
BNM-
LNE
FORC
EPTB
-1IPQ
-2PTB
-2
NMi-VSL SLM UM
ECEM IM
GC OMH EIM BEV SP
IPQ-3
Laboratories
Vo
lum
e (m
l)
Figure 12 – Air density uncertainty
The uncertainties between the laboratories are quite similar only one laboratory has stated a very high value compared to the others.
Portuguese Institute for Quality
EUROMET Key Comparison 100 ml pycnometer - Final Report – August 2006 17
Expansion coeficient
0,00000
0,00005
0,00010
0,00015
0,00020
0,00025
0,00030
IPQ-1 CM
I
BNM-
LNE
FORC
EPT
B-1 IPQ-2
PTB-2
NMi-VSL SLM UM
ECEM IMG
COM
H EIM BEV SPIPQ
-3
Laboratories
Vo
lum
e (
ml)
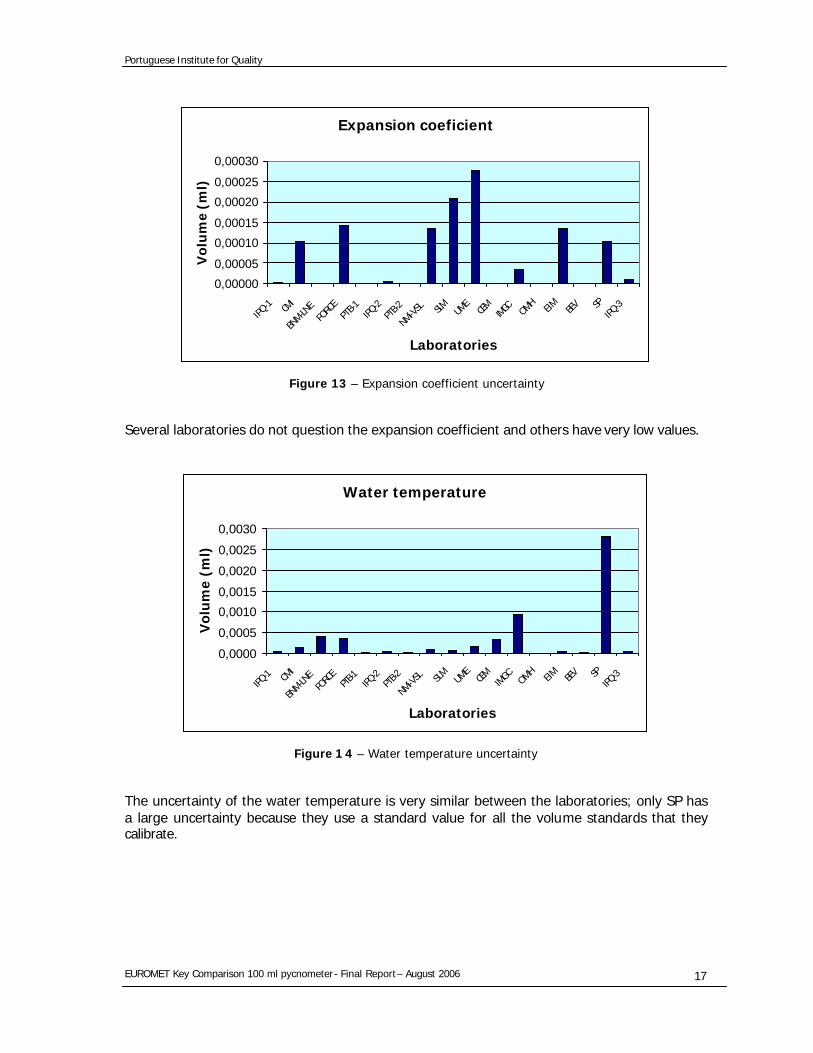
Figure 13 – Expansion coefficient uncertainty
Several laboratories do not question the expansion coefficient and others have very low values.
Water temperature
0,0000
0,0005
0,0010
0,0015
0,0020
0,0025
0,0030
IPQ-1 CM
I
BNM-
LNE
FORC
EPTB
-1IPQ
-2PTB
-2
NMi-VSL SLM UM
ECEM IM
GC OMH
EIM BEV SPIPQ
-3
Laboratories
Vo
lum
e (m
l)
Figure 1 4 – Water temperature uncertainty
The uncertainty of the water temperature is very similar between the laboratories; only SP has a large uncertainty because they use a standard value for all the volume standards that they calibrate.
Portuguese Institute for Quality
EUROMET Key Comparison 100 ml pycnometer - Final Report – August 2006 18
Others
0,00000,00100,00200,00300,00400,00500,00600,00700,00800,0090
IPQ-1 CM
I
BNM-LN
EFO
RCE
PTB-1 IPQ
-2PT
B-2
NMi-V
SL
SLM UME
CEM IMGC OM
HEIM BEV SP
IPQ-3
Laboratories
Vo
lum
e (m
l)
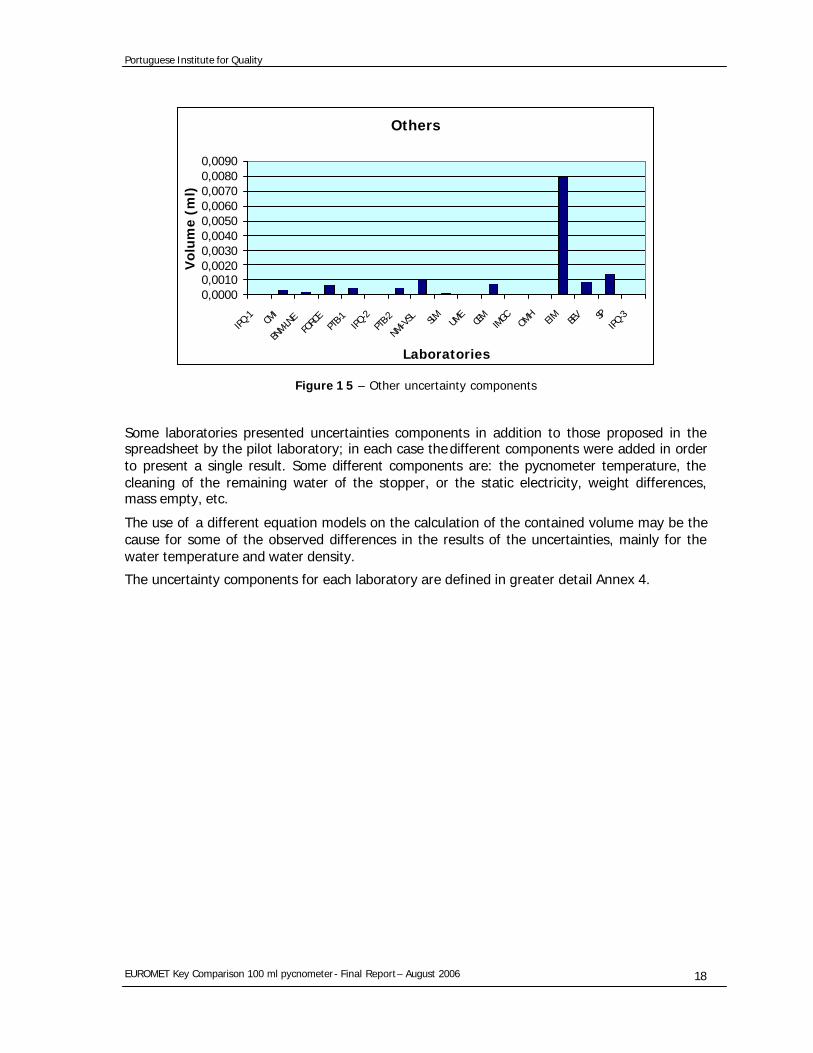
Figure 1 5 – Other uncertainty components
Some laboratories presented uncertainties components in addition to those proposed in the spreadsheet by the pilot laboratory; in each case the different components were added in order to present a single result. Some different components are: the pycnometer temperature, the cleaning of the remaining water of the stopper, or the static electricity, weight differences, mass empty, etc.
The use of a different equation models on the calculation of the contained volume may be the cause for some of the observed differences in the results of the uncertainties, mainly for the water temperature and water density.
The uncertainty components for each laboratory are defined in greater detail Annex 4.
Portuguese Institute for Quality
EUROMET Key Comparison 100 ml pycnometer - Final Report – August 2006 19
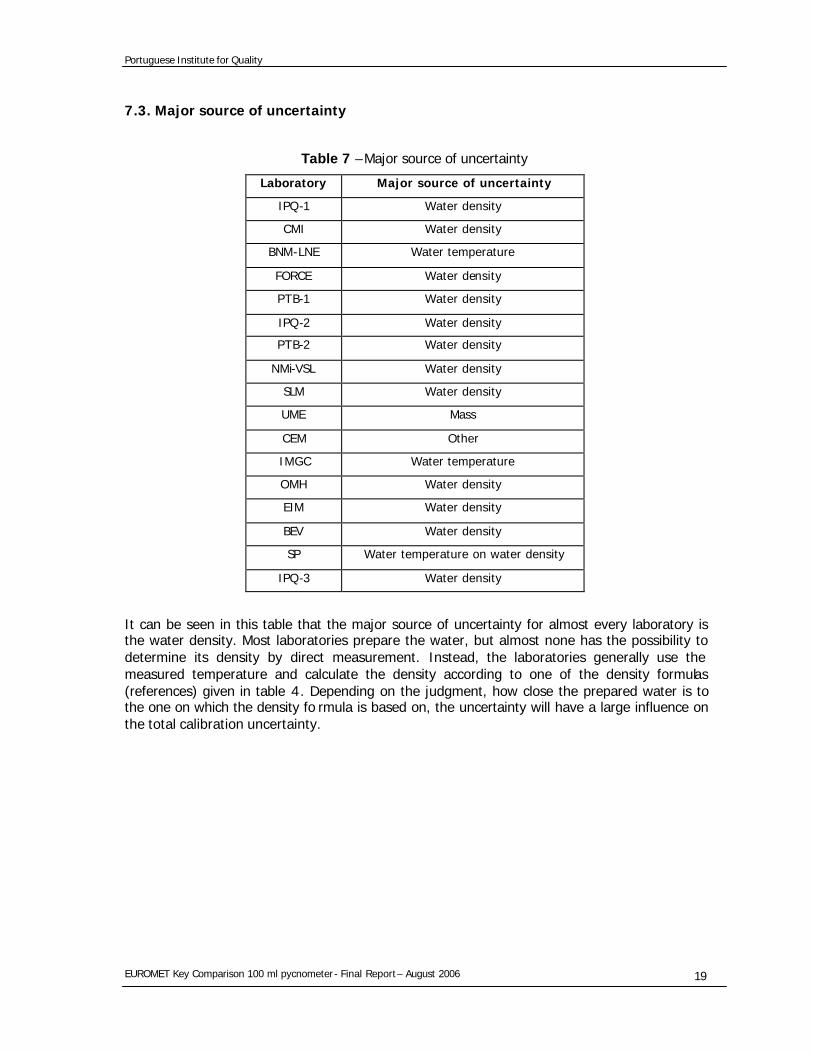
7.3. Major source of uncertainty
Table 7 –Major source of uncertainty
Laboratory Major source of uncertainty
IPQ-1 Water density
CMI Water density
BNM-LNE Water temperature
FORCE Water density
PTB-1 Water density
IPQ-2 Water density
PTB-2 Water density
NMi-VSL Water density
SLM Water density
UME Mass
CEM Other
IMGC Water temperature
OMH Water density
EIM Water density
BEV Water density
SP Water temperature on water density
IPQ-3 Water density
It can be seen in this table that the major source of uncertainty for almost every laboratory is the water density. Most laboratories prepare the water, but almost none has the possibility to determine its density by direct measurement. Instead, the laboratories generally use the measured temperature and calculate the density according to one of the density formulas (references) given in table 4. Depending on the judgment, how close the prepared water is to the one on which the density fo rmula is based on, the uncertainty will have a large influence on the total calibration uncertainty.
Portuguese Institute for Quality
EUROMET Key Comparison 100 ml pycnometer - Final Report – August 2006 20
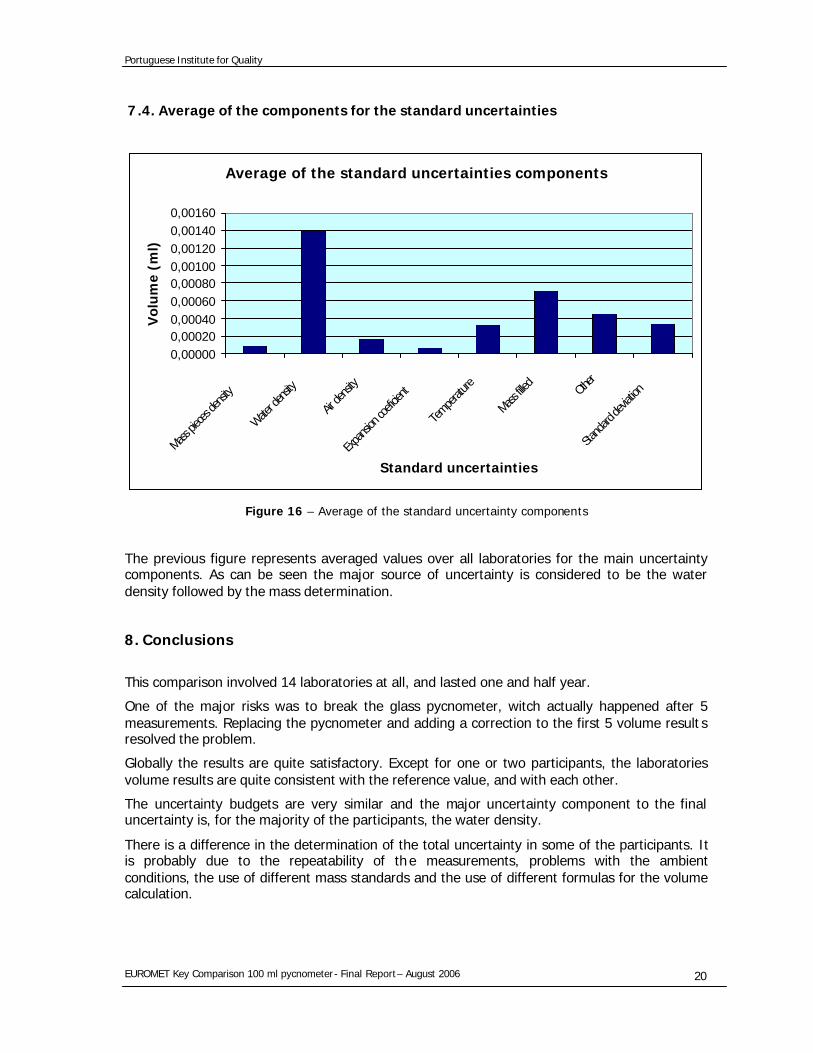
7.4. Average of the components for the standard uncertainties
Average of the standard uncertainties components
0,000000,000200,000400,000600,000800,001000,001200,001400,00160
Mass pie
ces de
nsity
Water d
ensity
Air de
nsity
Expansi
on co
eficien
t
Tempe
rature
Mass fille
dOth
er
Stand
ard de
viation
Standard uncertainties
Vo
lum
e (m
l)
Figure 16 – Average of the standard uncertainty components
The previous figure represents averaged values over all laboratories for the main uncertainty components. As can be seen the major source of uncertainty is considered to be the water density followed by the mass determination.
8. Conclusions
This comparison involved 14 laboratories at all, and lasted one and half year.
One of the major risks was to break the glass pycnometer, witch actually happened after 5 measurements. Replacing the pycnometer and adding a correction to the first 5 volume result s resolved the problem.
Globally the results are quite satisfactory. Except for one or two participants, the laboratories volume results are quite consistent with the reference value, and with each other.
The uncertainty budgets are very similar and the major uncertainty component to the final uncertainty is, for the majority of the participants, the water density.
There is a difference in the determination of the total uncertainty in some of the participants. It is probably due to the repeatability of the measurements, problems with the ambient conditions, the use of different mass standards and the use of different formulas for the volume calculation.
Portuguese Institute for Quality
EUROMET Key Comparison 100 ml pycnometer - Final Report – August 2006 21
Some laboratories reported damages in the pycnometer that could influence the volume result, but at the end of the comparison the pilot laboratory examined the pycnometer and concluded that the reported defect existed already at the beginning of the comparison. The results were confirmed with the last measurement of the volume of the pycnometer by the pilot laboratory.
9. References
1. ISO 3507 - Laboratory glassware - Pyknometers, Genève 1999;
2. ISO 4787 - Laboratory glassware - Volumetric glassware - Methods for use and testing of
capacity; Genève 1984;
3. ISO 3696 – Water for analytical laboratory use: specification and test methods Genève,
1987;
4. M.G. Cox, “The evaluation of key comparison data”, Metrologia, 2002, Vol. 39, 589-595.
Portuguese Institute for Quality
EUROMET Key Comparison 100 ml pycnometer - Final Report – August 2006 22
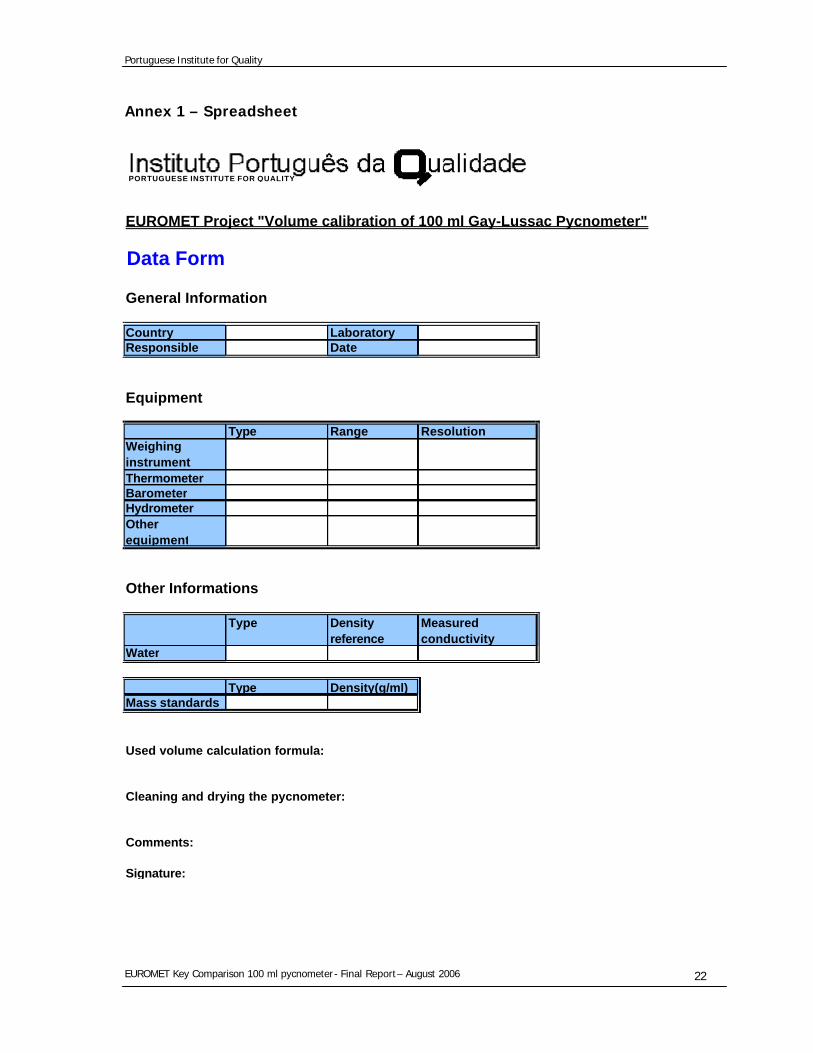
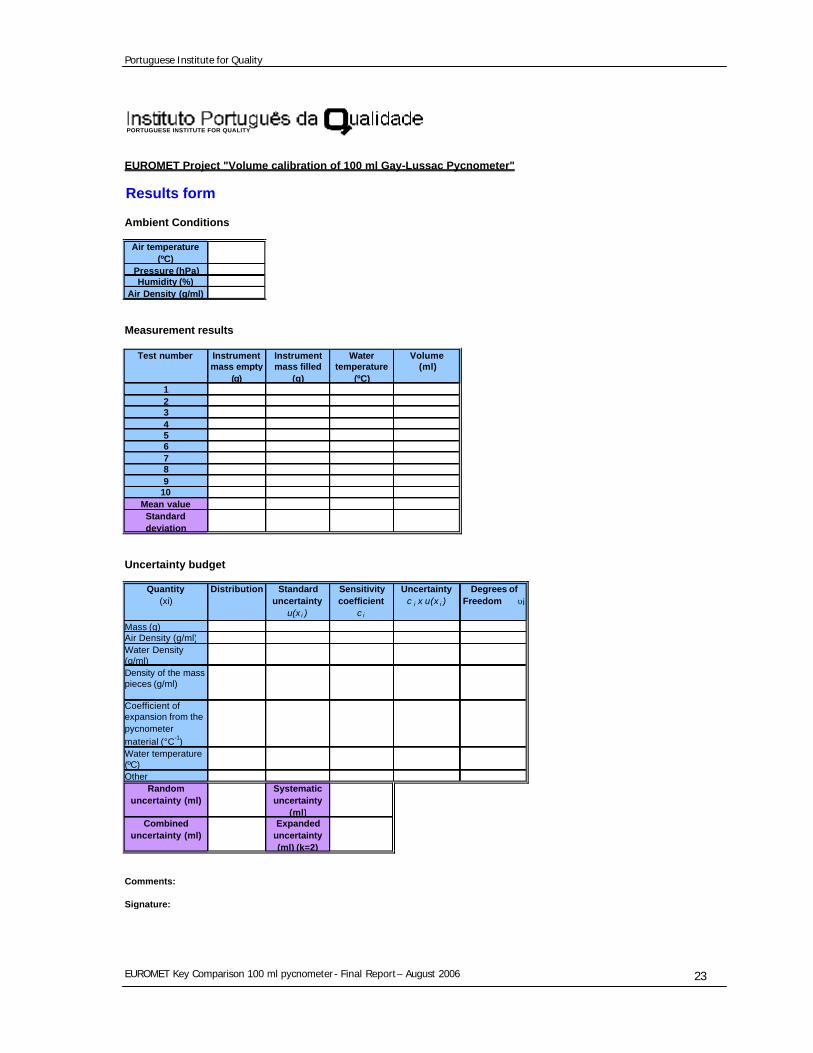
Annex 1 – Spreadsheet
EUROMET Project "Volume calibration of 100 ml Gay-Lussac Pycnometer"
Data Form
General Information
Country LaboratoryResponsible Date
Equipment
Type Range ResolutionWeighing instrumentThermometerBarometerHydrometerOther equipment
Other Informations
Type Density reference
Measured conductivity
Water
Type Density(g/ml)Mass standards
Used volume calculation formula:
Cleaning and drying the pycnometer:
Comments:
Signature:
PORTUGUESE INSTITUTE FOR QUALITY
Portuguese Institute for Quality
EUROMET Key Comparison 100 ml pycnometer - Final Report – August 2006 23
EUROMET Project "Volume calibration of 100 ml Gay-Lussac Pycnometer"
Results form
Ambient Conditions
Air temperature (ºC)
Pressure (hPa)Humidity (%)
Air Density (g/ml)
Measurement results
Test number Instrument mass empty
(g)
Instrument mass filled
(g)
Water temperature
(ºC)
Volume (ml)
123456789
10Mean valueStandard deviation
Uncertainty budget
Quantity (xi)
Distribution Standard uncertainty
u(x i )
Sensitivity coefficient
c i
Uncertainty c i x u(x i )
Degrees of Freedom υi
Mass (g)Air Density (g/ml)Water Density (g/ml)Density of the mass pieces (g/ml)
Coefficient of expansion from the pycnometer material (°C-1)Water temperature (ºC)Other
Random uncertainty (ml)
Systematic uncertainty
(ml)Combined
uncertainty (ml)Expanded
uncertainty (ml) (k=2)
Comments:
Signature:
PORTUGUESE INSTITUTE FOR QUALITY
Portuguese Institute for Quality
EUROMET Key Comparison 100 ml pycnometer - Final Report – August 2006 24
Annex 2 – Equipment
Balance
Laboratory Type Range (g) Resolution (g)
IPQ Mettler, PK 300 0 - 300 0,0001
CMI Mettler-Toledo, AT400/A 0,01 – 405 0,0001
BNM-LNE Mettler, AT400 0 – 405 0,0001
FORCE Mettler-Toledo, AX205 80 / 221 0,00001 / 0,0001
PTB Sartorious, ME414S maximum loading 410 0,0001
NMi-VSL Mettler, PK300 0 – 300 0,0001
SLM Analytical, AG 204 205 0,0001
UME Mettler-Toledo, AT400 0 - 405 0,0001
CEM Mettler, AX-205 220 0,00001
IMGC Electronic, Mettler AT400 400 0,00001
OMH Mettler, AX1004 0 – 1109 0,0001
EIM Mettler, PM 400 0 – 410 0,001
BEV Precisa, 240 A max. 244 0,0001
SP Mettler, AT 200 0,00001
Portuguese Institute for Quality
EUROMET Key Comparison 100 ml pycnometer - Final Report – August 2006 25
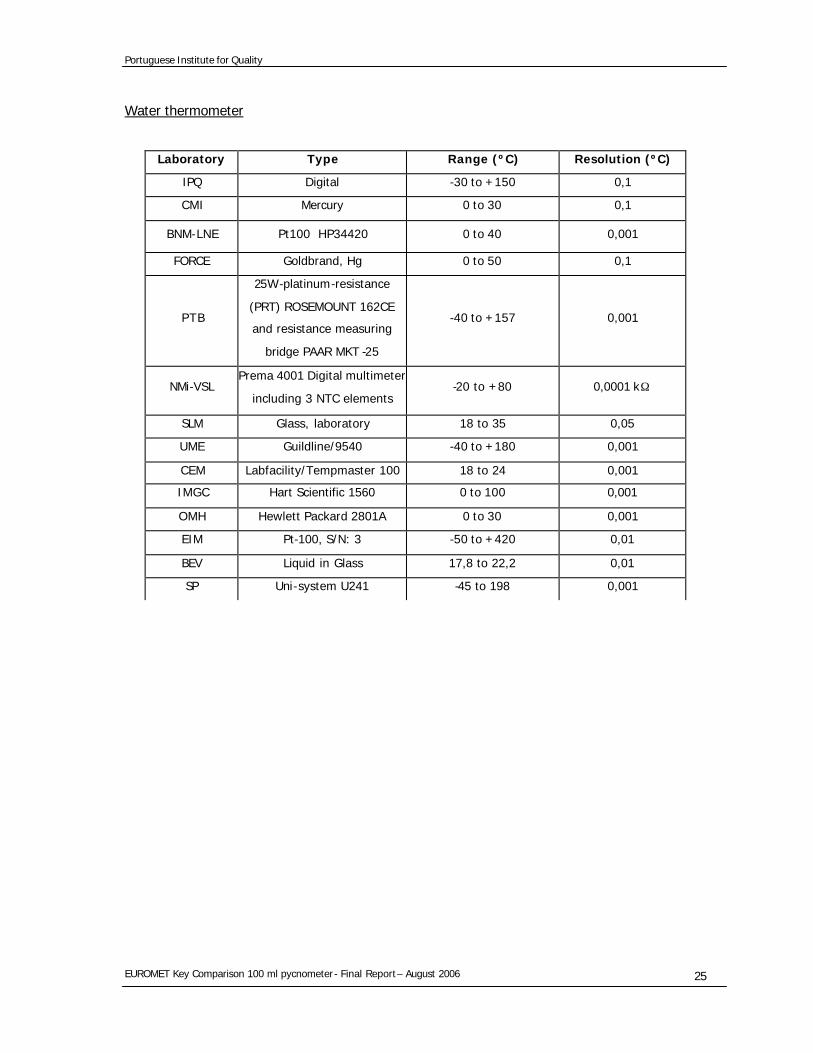
Water thermometer
Laboratory Type Range (ºC) Resolution (ºC)
IPQ Digital -30 to +150 0,1
CMI Mercury 0 to 30 0,1
BNM-LNE Pt100 HP34420 0 to 40 0,001
FORCE Goldbrand, Hg 0 to 50 0,1
PTB
25W-platinum-resistance
(PRT) ROSEMOUNT 162CE
and resistance measuring
bridge PAAR MKT -25
-40 to +157 0,001
NMi-VSL Prema 4001 Digital multimeter
including 3 NTC elements -20 to +80 0,0001 kΩ
SLM Glass, laboratory 18 to 35 0,05
UME Guildline/9540 -40 to +180 0,001
CEM Labfacility/Tempmaster 100 18 to 24 0,001
IMGC Hart Scientific 1560 0 to 100 0,001
OMH Hewlett Packard 2801A 0 to 30 0,001
EIM Pt-100, S/N: 3 -50 to +420 0,01
BEV Liquid in Glass 17,8 to 22,2 0,01
SP Uni-system U241 -45 to 198 0,001
Portuguese Institute for Quality
EUROMET Key Comparison 100 ml pycnometer - Final Report – August 2006 26
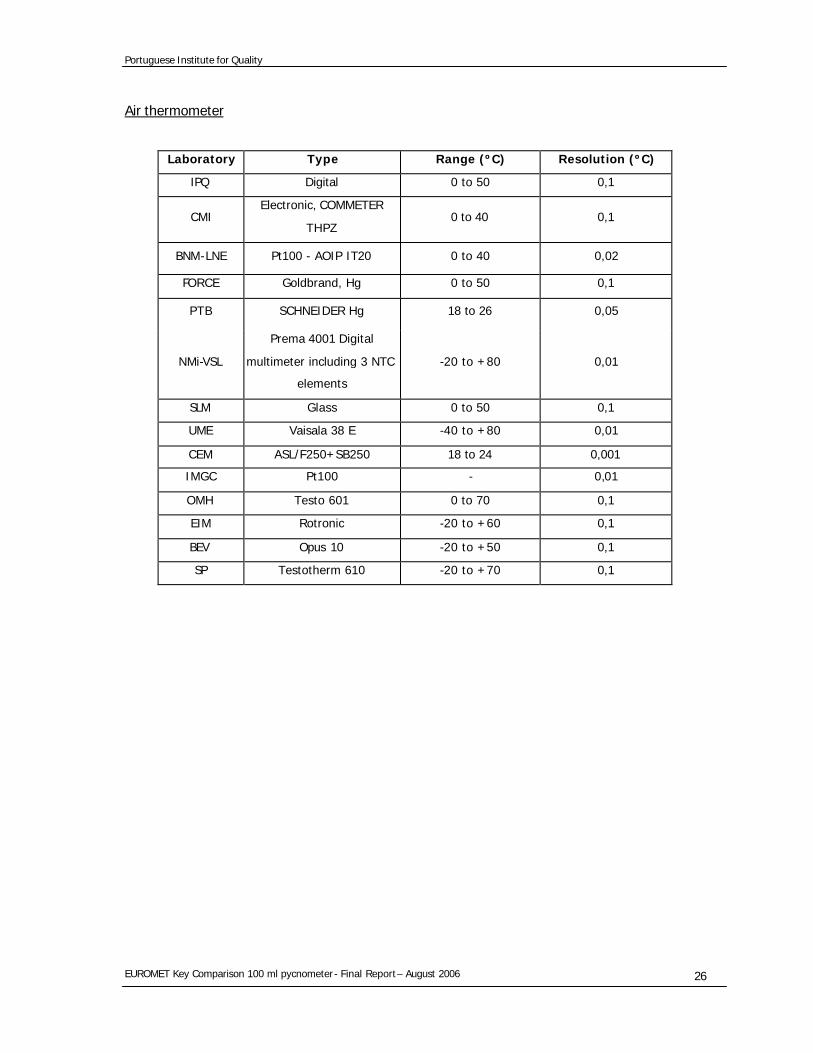
Air thermometer
Laboratory Type Range (ºC) Resolution (ºC)
IPQ Digital 0 to 50 0,1
CMI Electronic, COMMETER
THPZ 0 to 40 0,1
BNM-LNE Pt100 - AOIP IT20 0 to 40 0,02
FORCE Goldbrand, Hg 0 to 50 0,1
PTB SCHNEIDER Hg 18 to 26 0,05
NMi-VSL
Prema 4001 Digital
multimeter including 3 NTC
elements
-20 to +80 0,01
SLM Glass 0 to 50 0,1
UME Vaisala 38 E -40 to +80 0,01
CEM ASL/F250+SB250 18 to 24 0,001
IMGC Pt100 - 0,01
OMH Testo 601 0 to 70 0,1
EIM Rotronic -20 to +60 0,1
BEV Opus 10 -20 to +50 0,1
SP Testotherm 610 -20 to +70 0,1
Portuguese Institute for Quality
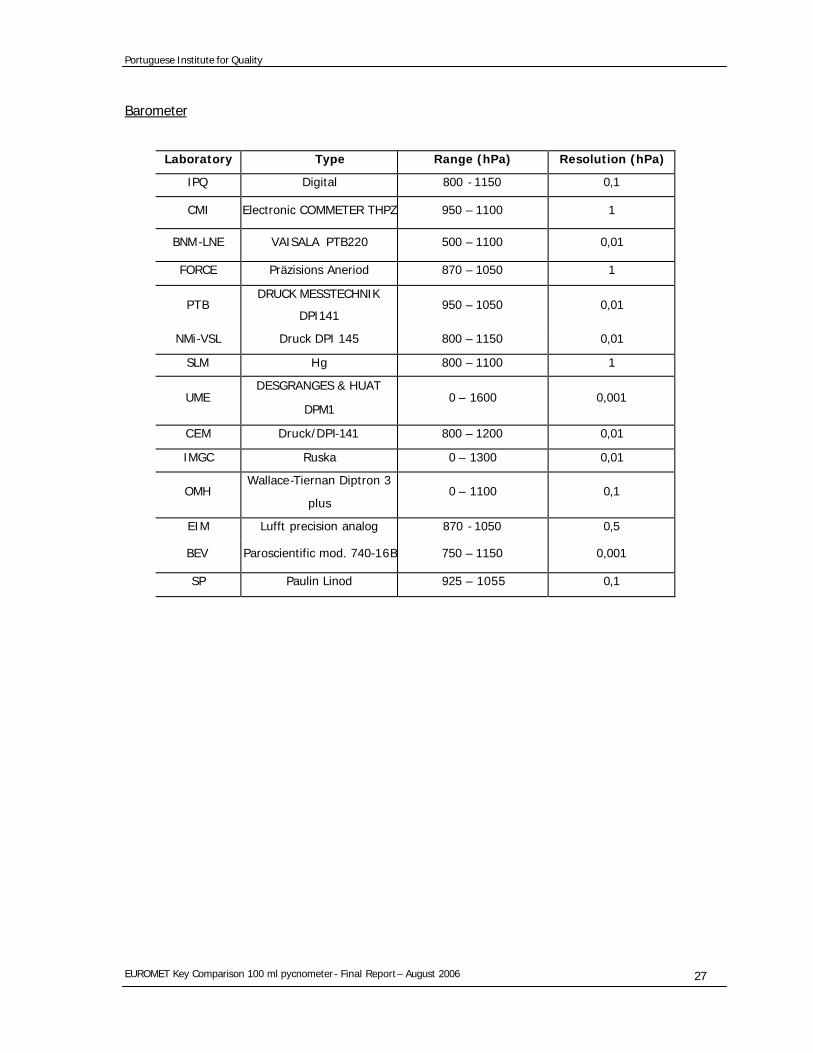
EUROMET Key Comparison 100 ml pycnometer - Final Report – August 2006 27
Barometer
Laboratory Type Range (hPa) Resolution (hPa)
IPQ Digital 800 - 1150 0,1
CMI Electronic COMMETER THPZ 950 – 1100 1
BNM-LNE VAISALA PTB220 500 – 1100 0,01
FORCE Präzisions Aneriod 870 – 1050 1
PTB DRUCK MESSTECHNIK
DPI141 950 – 1050 0,01
NMi-VSL Druck DPI 145 800 – 1150 0,01
SLM Hg 800 – 1100 1
UME DESGRANGES & HUAT
DPM1 0 – 1600 0,001
CEM Druck/DPI-141 800 – 1200 0,01
IMGC Ruska 0 – 1300 0,01
OMH Wallace-Tiernan Diptron 3
plus 0 – 1100 0,1
EIM Lufft precision analog 870 - 1050 0,5
BEV Paroscientific mod. 740-16B 750 – 1150 0,001
SP Paulin Linod 925 – 1055 0,1
Portuguese Institute for Quality
EUROMET Key Comparison 100 ml pycnometer - Final Report – August 2006 28
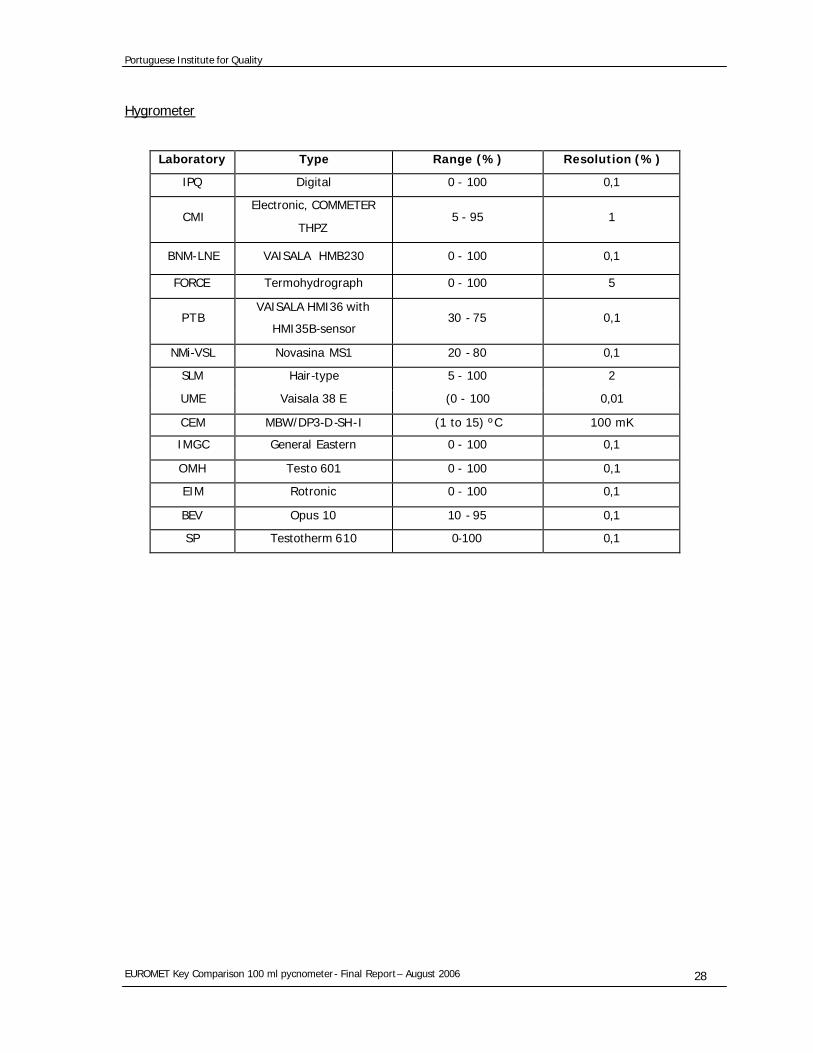
Hygrometer
Laboratory Type Range (%) Resolution (%)
IPQ Digital 0 - 100 0,1
CMI Electronic, COMMETER
THPZ 5 - 95 1
BNM-LNE VAISALA HMB230 0 - 100 0,1
FORCE Termohydrograph 0 - 100 5
PTB VAISALA HMI36 with
HMI35B-sensor 30 - 75 0,1
NMi-VSL Novasina MS1 20 - 80 0,1
SLM Hair-type 5 - 100 2
UME Vaisala 38 E (0 - 100 0,01
CEM MBW/DP3-D -SH-I (1 to 15) ºC 100 mK
IMGC General Eastern 0 - 100 0,1
OMH Testo 601 0 - 100 0,1
EIM Rotronic 0 - 100 0,1
BEV Opus 10 10 - 95 0,1
SP Testotherm 610 0-100 0,1
Portuguese Institute for Quality
EUROMET Key Comparison 100 ml pycnometer - Final Report – August 2006 29
Annex 3 – Degrees of equivalence between laboratories of the EUROMET comparison in nl (ml ×10-6)
IPQ CMI BNM-LNE FORCE PTB NMi-VSL
Dij Uij D ij Uij Dij Uij Dij Uij Dij Uij Dij Uij IPQ -39 61 7 28 1 103 -14 27 9 65 CMI 39 61 46 58 40 115 25 57 48 82 BNM -LNE -7 28 -46 58 -6 101 -21 18 2 62 FORCE -1 103 -40 115 6 101 -15 101 8 117 PTB 14 27 -25 57 21 18 15 101 23 61 NMi-VSL -9 65 -48 82 -2 62 -8 117 -23 61 UME -19 89 -58 103 -12 87 -18 132 -33 87 -10 105 CEM -11 29 -50 59 -4 22 -10 101 -25 21 -2 62 IMGC -5 34 -44 61 2 28 -4 103 -19 27 4 65 OMH 13 29 -26 58 20 21 14 101 -1 20 22 62 EIM -100 155 -139 163 -93 154 -99 183 -114 154 -91 165 BEV -10 48 -49 69 -3 43 -9 108 -24 43 -1 73 SP -3 82 -42 96 4 79 -2 127 -17 79 6 98
UME CEM IMGC OMH EIM BEV SP Dij Uij Dij Uij Dij Uij D ij Uij Dij Uij Dij Uij Dij Uij IPQ 19 89 11 29 5 34 -13 29 100 155 10 48 0 82 CMI 58 103 50 59 44 61 26 58 139 163 49 69 4 96 BNM-LNE 12 87 4 22 -2 28 -20 21 93 154 3 43 0 79 FORCE 18 132 10 101 4 103 -14 101 99 183 9 108 0 127 PTB 33 87 25 21 19 27 1 20 114 154 24 43 2 79 NMi-VSL 10 105 2 62 -4 65 -22 62 91 165 1 73 -1 98 UME -8 88 -14 89 -32 87 81 176 -9 95 -2 116 CEM 8 88 -6 29 -24 23 89 155 -1 44 -1 80 IMGC 14 89 6 29 -18 29 95 155 5 48 0 82 OMH 32 87 24 23 18 29 113 154 23 44 2 80 EIM -81 176 -89 155 -95 155 -113 154 -90 159 -10 172 BEV 9 95 1 44 -5 48 -23 44 90 159 -1 88 SP 16 116 8 80 2 82 -16 80 97 172 7 88
Portuguese Institute for Quality
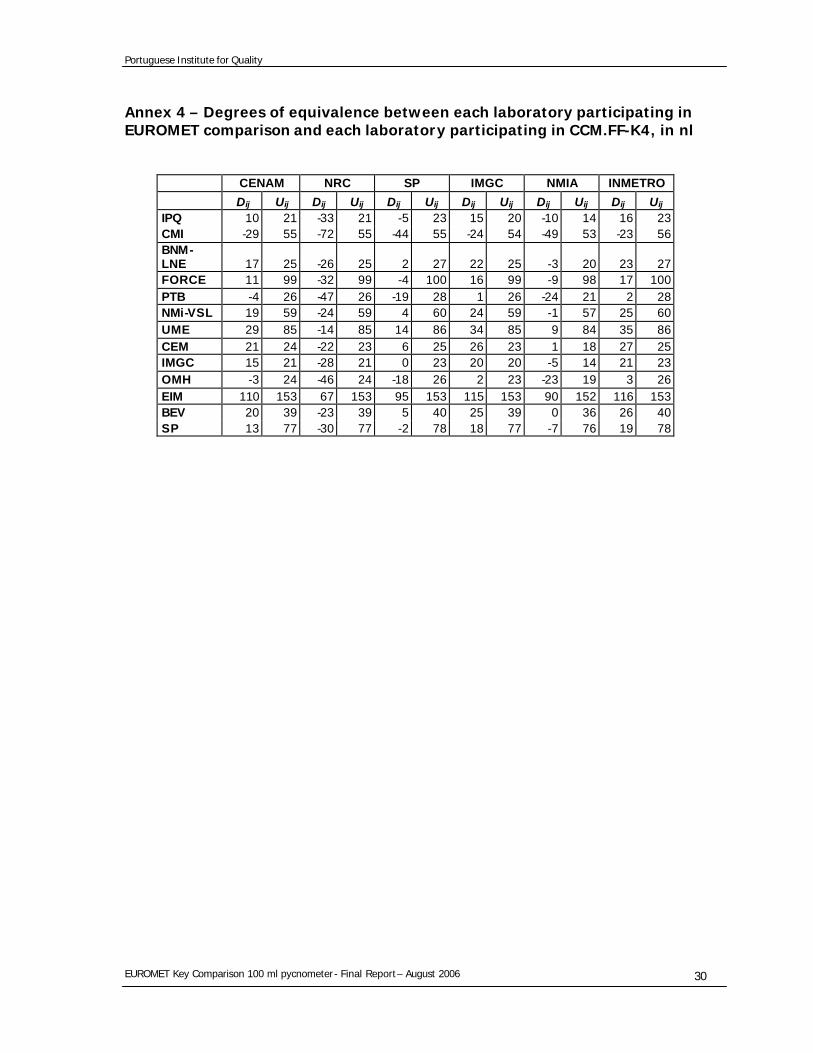
EUROMET Key Comparison 100 ml pycnometer - Final Report – August 2006 30
Annex 4 – Degrees of equivalence between each laboratory participating in EUROMET comparison and each laboratory participating in CCM.FF-K4, in nl
CENAM NRC SP IMGC NMIA INMETRO
Dij Uij Dij Uij Dij Uij Dij Uij Dij Uij Dij Uij IPQ 10 21 -33 21 -5 23 15 20 -10 14 16 23 CMI -29 55 -72 55 -44 55 -24 54 -49 53 -23 56 BNM-LNE 17 25 -26 25 2 27 22 25 -3 20 23 27 FORCE 11 99 -32 99 -4 100 16 99 -9 98 17 100 PTB -4 26 -47 26 -19 28 1 26 -24 21 2 28 NMi-VSL 19 59 -24 59 4 60 24 59 -1 57 25 60 UME 29 85 -14 85 14 86 34 85 9 84 35 86 CEM 21 24 -22 23 6 25 26 23 1 18 27 25 IMGC 15 21 -28 21 0 23 20 20 -5 14 21 23 OMH -3 24 -46 24 -18 26 2 23 -23 19 3 26 EIM 110 153 67 153 95 153 115 153 90 152 116 153 BEV 20 39 -23 39 5 40 25 39 0 36 26 40 SP 13 77 -30 77 -2 78 18 77 -7 76 19 78
Portuguese Institute for Quality
EUROMET Key Comparison 100 ml pycnometer - Final Report – August 2006 31
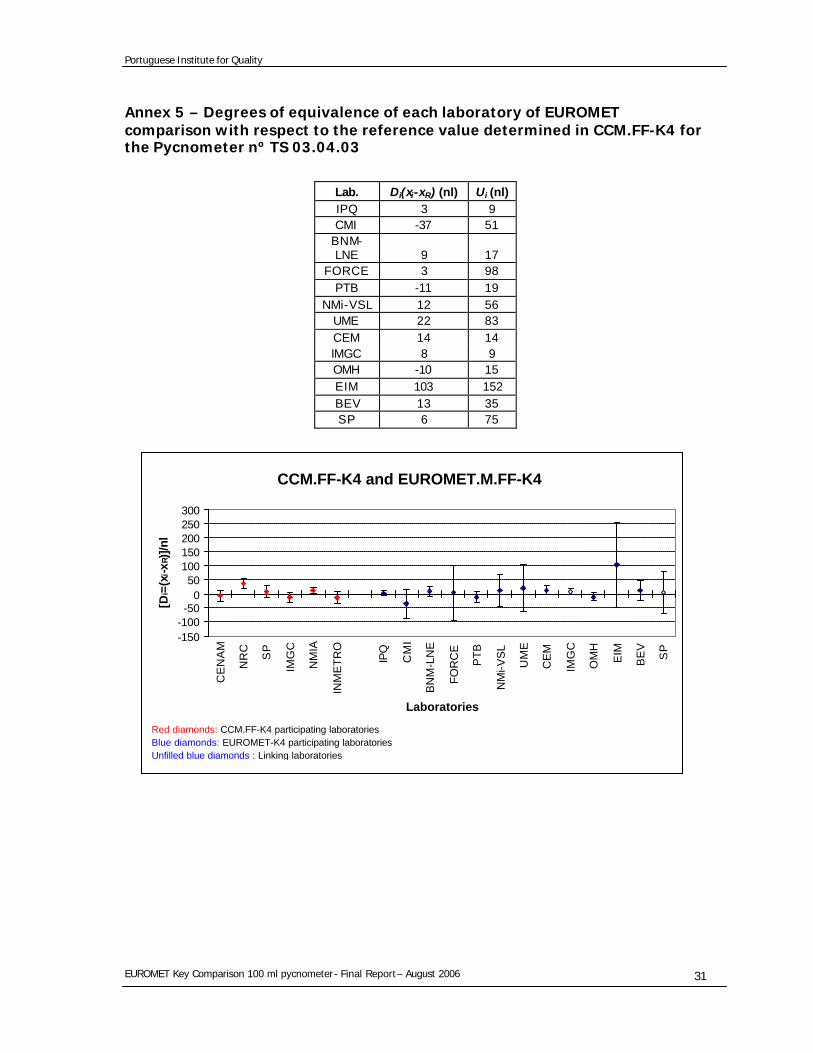
Annex 5 – Degrees of equivalence of each laboratory of EUROMET comparison with respect to the reference value determined in CCM.FF-K4 for the Pycnometer nº TS 03.04.03
Lab. Di(xi-xR) (nl) Ui (nl) IPQ 3 9 CMI -37 51
BNM-LNE 9 17
FORCE 3 98 PTB -11 19
NMi-VSL 12 56 UME 22 83 CEM 14 14 IMGC 8 9 OMH -10 15 EIM 103 152 BEV 13 35 SP 6 75
CCM.FF-K4 and EUROMET.M.FF-K4
-150-100-50
050
100150200250300
CE
NA
M
NR
C
SP
IMG
C
NM
IA
INM
ET
RO
IPQ
CM
I
BN
M-L
NE
FOR
CE
PT
B
NM
i-VS
L
UM
E
CE
M
IMG
C
OM
H
EIM
BE
V
SP
Laboratories
[Di=
(xi-x
R)]/n
l
Red diamonds: CCM.FF-K4 participating laboratoriesBlue diamonds: EUROMET-K4 participating laboratoriesUnfilled blue diamonds : Linking laboratories
Portuguese Institute for Quality
EUROMET Key Comparison 100 ml pycnometer - Final Report – August 2006 32
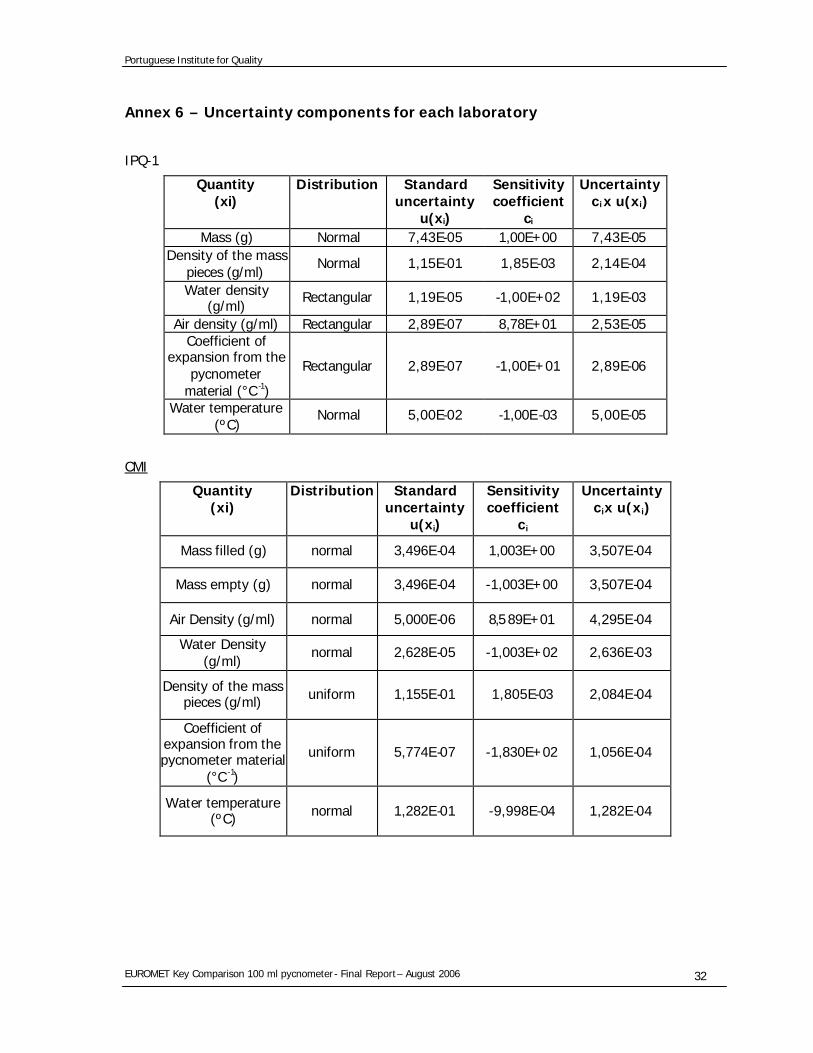
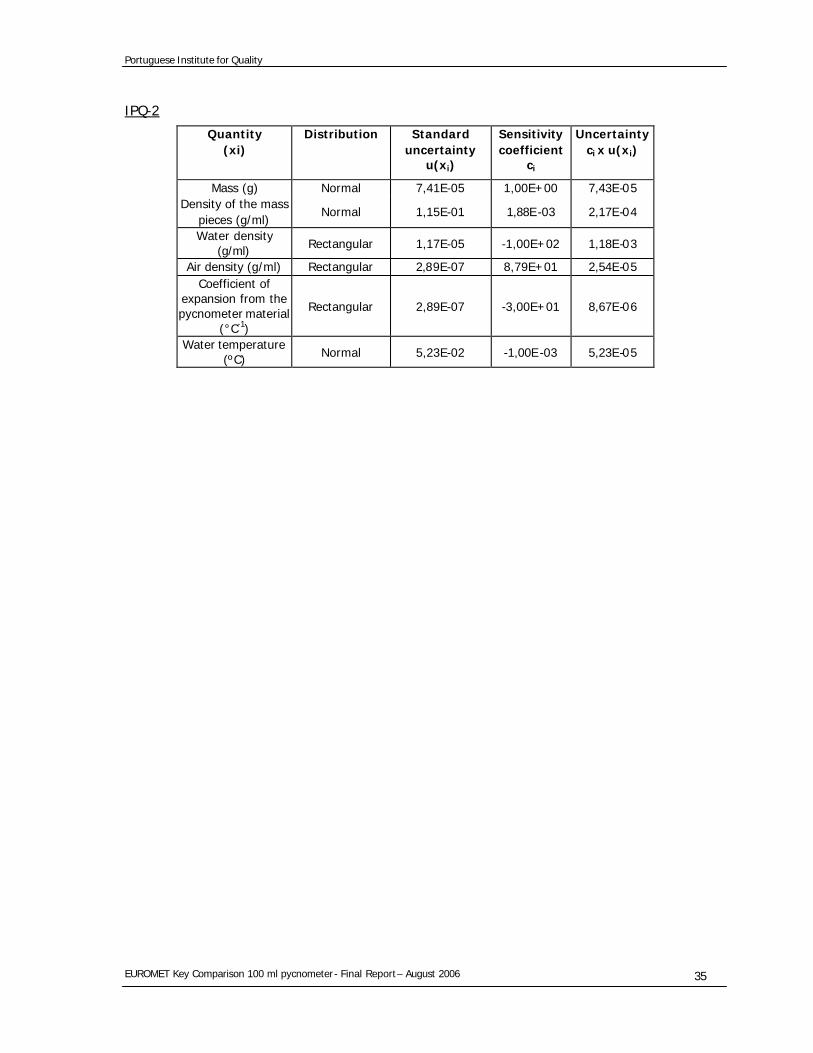
Annex 6 – Uncertainty components for each laboratory
IPQ-1
Quantity (xi)
Distribution Standard uncertainty
u(xi)
Sensitivity coefficient
ci
Uncertainty ci x u(xi)
Mass (g) Normal 7,43E-05 1,00E+00 7,43E-05 Density of the mass
pieces (g/ml) Normal 1,15E-01 1,85E-03 2,14E-04
Water density (g/ml)
Rectangular 1,19E-05 -1,00E+02 1,19E-03
Air density (g/ml) Rectangular 2,89E-07 8,78E+01 2,53E-05 Coefficient of
expansion from the pycnometer
material (°C -1)
Rectangular 2,89E-07 -1,00E+01 2,89E-06
Water temperature (ºC)
Normal 5,00E-02 -1,00E-03 5,00E-05
CMI
Quantity (xi)
Distribution Standard uncertainty
u(xi)
Sensitivity coefficient
ci
Uncertainty ci x u(xi)
Mass filled (g) normal 3,496E-04 1,003E+00 3,507E-04
Mass empty (g) normal 3,496E-04 -1,003E+00 3,507E-04
Air Density (g/ml) normal 5,000E-06 8,589E+01 4,295E-04
Water Density (g/ml)
normal 2,628E-05 -1,003E+02 2,636E-03
Density of the mass pieces (g/ml) uniform 1,155E-01 1,805E-03 2,084E-04
Coefficient of expansion from the pycnometer material
(°C -1)
uniform 5,774E-07 -1,830E+02 1,056E-04
Water temperature (ºC) normal 1,282E-01 -9,998E-04 1,282E-04
Portuguese Institute for Quality
EUROMET Key Comparison 100 ml pycnometer - Final Report – August 2006 33
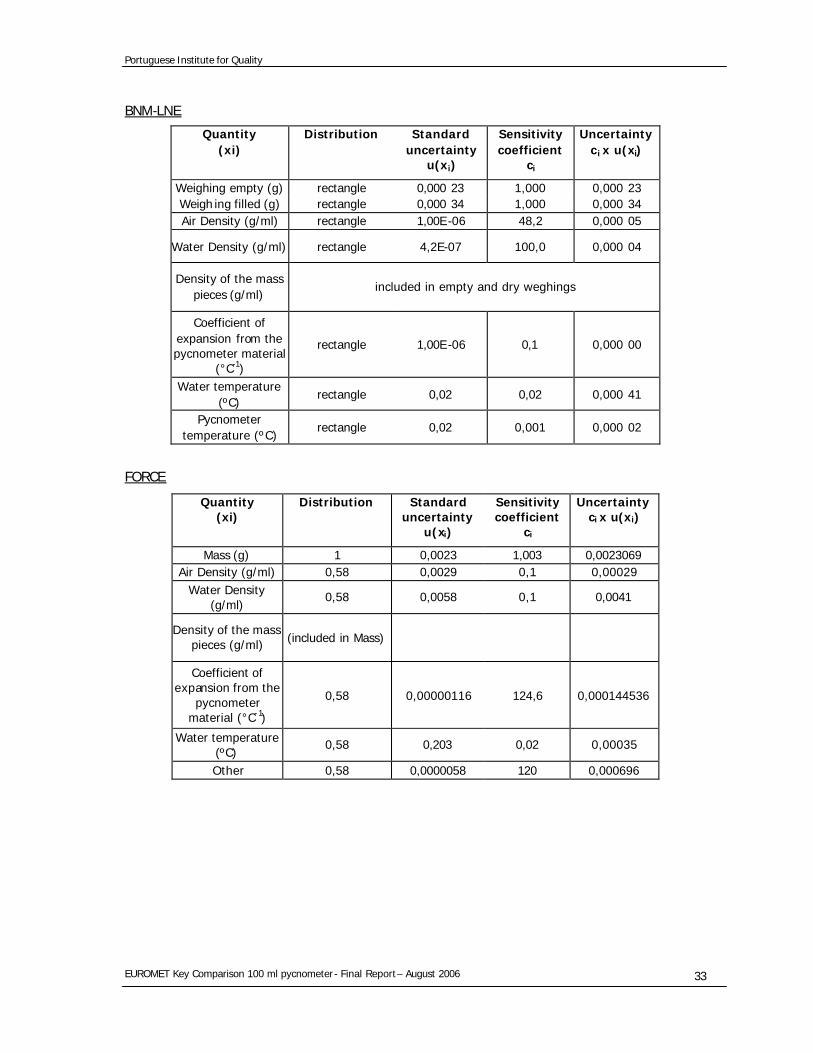
BNM-LNE
Quantity (xi)
Distribution Standard uncertainty
u(xi)
Sensitivity coefficient
ci
Uncertainty ci x u(xi)
Weighing empty (g) rectangle 0,000 23 1,000 0,000 23 Weigh ing filled (g) rectangle 0,000 34 1,000 0,000 34 Air Density (g/ml) rectangle 1,00E -06 48,2 0,000 05
Water Density (g/ml) rectangle 4,2E-07 100,0 0,000 04
Density of the mass pieces (g/ml)
included in empty and dry weghings
Coefficient of expansion from the pycnometer material
(°C-1)
rectangle 1,00E -06 0,1 0,000 00
Water temperature (ºC)
rectangle 0,02 0,02 0,000 41
Pycnometer temperature (ºC)
rectangle 0,02 0,001 0,000 02
FORCE
Quantity (xi)
Distribution Standard uncertainty
u(xi)
Sensitivity coefficient
ci
Uncertainty ci x u(xi)
Mass (g) 1 0,0023 1,003 0,0023069 Air Density (g/ml) 0,58 0,0029 0,1 0,00029
Water Density (g/ml)
0,58 0,0058 0,1 0,0041
Density of the mass pieces (g/ml) (included in Mass)
Coefficient of expansion from the
pycnometer material (°C-1)
0,58 0,00000116 124,6 0,000144536
Water temperature (ºC)
0,58 0,203 0,02 0,00035
Other 0,58 0,0000058 120 0,000696
Portuguese Institute for Quality
EUROMET Key Comparison 100 ml pycnometer - Final Report – August 2006 34
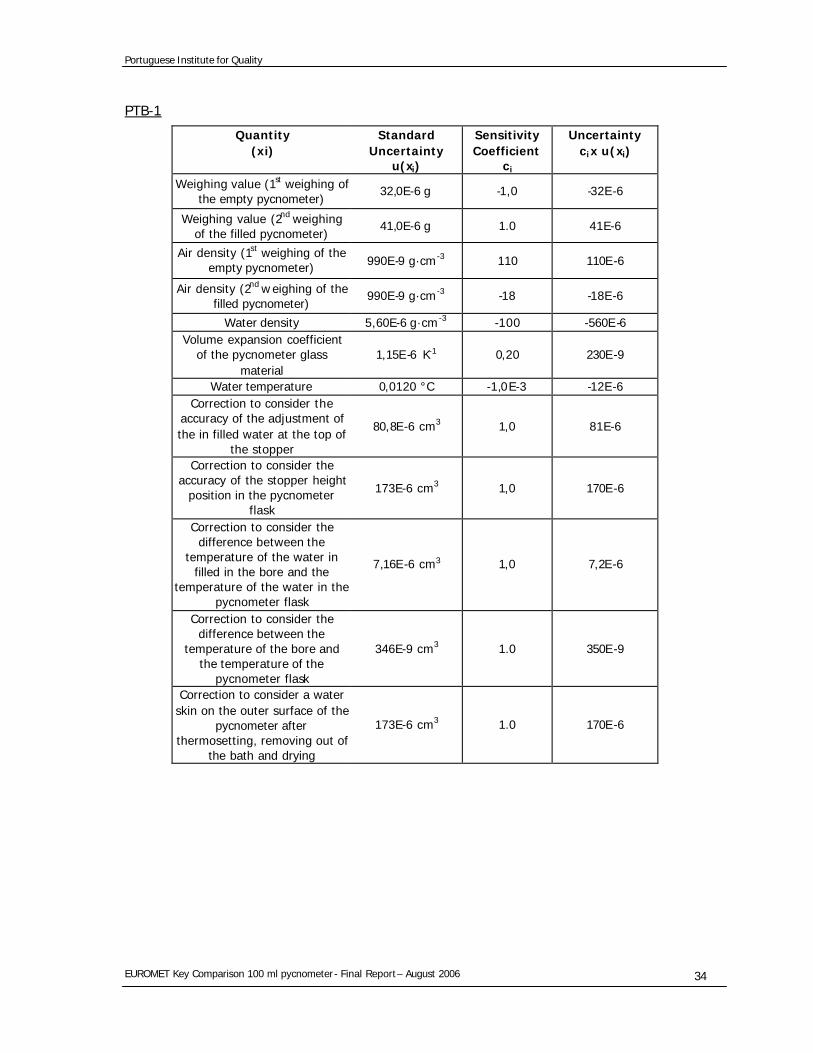
PTB-1
Quantity (xi)
Standard Uncertainty
u(xi)
Sensitivity Coefficient
ci
Uncertainty ci x u(xi)
Weighing value (1st weighing of the empty pycnometer)
32,0E-6 g -1,0 -32E-6
Weighing value (2nd weighing of the filled pycnometer)
41,0E-6 g 1.0 41E-6
Air density (1st weighing of the empty pycnometer) 990E-9 g·cm -3 110 110E-6
Air density (2nd w eighing of the filled pycnometer)
990E-9 g·cm -3 -18 -18E-6
Water density 5,60E-6 g·cm -3 -100 -560E -6 Volume expansion coefficient
of the pycnometer glass material
1,15E-6 K-1 0,20 230E-9
Water temperature 0,0120 °C -1,0E-3 -12E-6 Correction to consider the
accuracy of the adjustment of the in filled water at the top of
the stopper
80,8E-6 cm3 1,0 81E-6
Correction to consider the accuracy of the stopper height
position in the pycnometer flask
173E-6 cm3 1,0 170E-6
Correction to consider the difference between the
temperature of the water in filled in the bore and the
temperature of the water in the pycnometer flask
7,16E-6 cm3 1,0 7,2E-6
Correction to consider the difference between the
temperature of the bore and the temperature of the
pycnometer flask
346E-9 cm3 1.0 350E-9
Correction to consider a water skin on the outer surface of the
pycnometer after thermosetting, removing out of
the bath and drying
173E-6 cm3 1.0 170E-6
Portuguese Institute for Quality
EUROMET Key Comparison 100 ml pycnometer - Final Report – August 2006 35
IPQ-2
Quantity (xi)
Distribution Standard uncertainty
u(xi)
Sensitivity coefficient
ci
Uncertainty ci x u(xi)
Mass (g) Normal 7,41E-05 1,00E+00 7,43E-05 Density of the mass
pieces (g/ml) Normal 1,15E-01 1,88E -03 2,17E-04
Water density (g/ml) Rectangular 1,17E-05 -1,00E+02 1,18E-03
Air density (g/ml) Rectangular 2,89E-07 8,79E+01 2,54E-05 Coefficient of
expansion from the pycnometer material
(°C-1)
Rectangular 2,89E-07 -3,00E+01 8,67E-06
Water temperature (ºC) Normal 5,23E-02 -1,00E -03 5,23E-05
Portuguese Institute for Quality
EUROMET Key Comparison 100 ml pycnometer - Final Report – August 2006 36
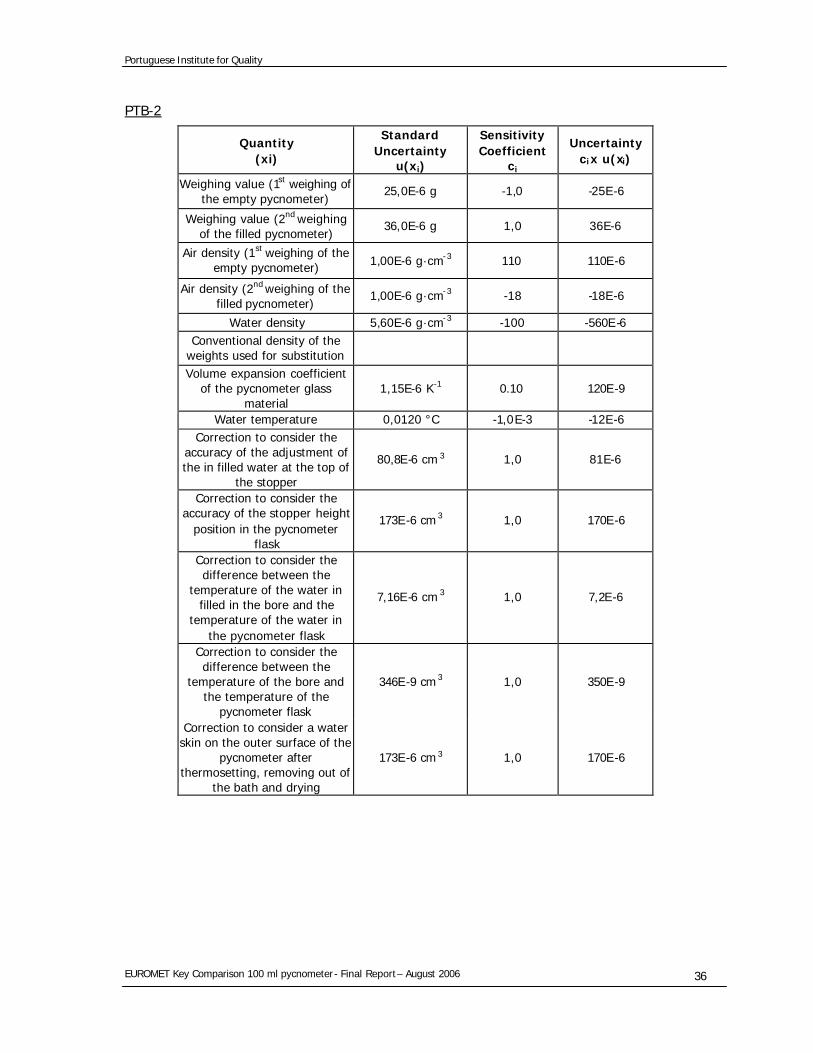
PTB-2
Quantity (xi)
Standard Uncertainty
u(xi)
Sensitivity Coefficient
ci
Uncertainty ci x u(xi)
Weighing value (1st weighing of the empty pycnometer)
25,0E-6 g -1,0 -25E-6
Weighing value (2nd weighing of the filled pycnometer)
36,0E-6 g 1,0 36E-6
Air density (1st weighing of the empty pycnometer) 1,00E-6 g·cm-3 110 110E-6
Air density (2nd weighing of the filled pycnometer)
1,00E-6 g·cm-3 -18 -18E-6
Water density 5,60E-6 g·cm-3 -100 -560E -6 Conventional density of the
weights used for substitution
Volume expansion coefficient of the pycnometer glass
material 1,15E-6 K-1 0.10 120E-9
Water temperature 0,0120 °C -1,0E-3 -12E-6 Correction to consider the
accuracy of the adjustment of the in filled water at the top of
the stopper
80,8E-6 cm 3 1,0 81E-6
Correction to consider the accuracy of the stopper height
position in the pycnometer flask
173E-6 cm 3 1,0 170E-6
Correction to consider the difference between the
temperature of the water in filled in the bore and the
temperature of the water in the pycnometer flask
7,16E-6 cm 3 1,0 7,2E-6
Correction to consider the difference between the
temperature of the bore and the temperature of the
pycnometer flask
346E-9 cm 3 1,0 350E-9
Correction to consider a water skin on the outer surface of the
pycnometer after thermosetting, removing out of
the bath and drying
173E-6 cm 3 1,0 170E-6
Portuguese Institute for Quality
EUROMET Key Comparison 100 ml pycnometer - Final Report – August 2006 37
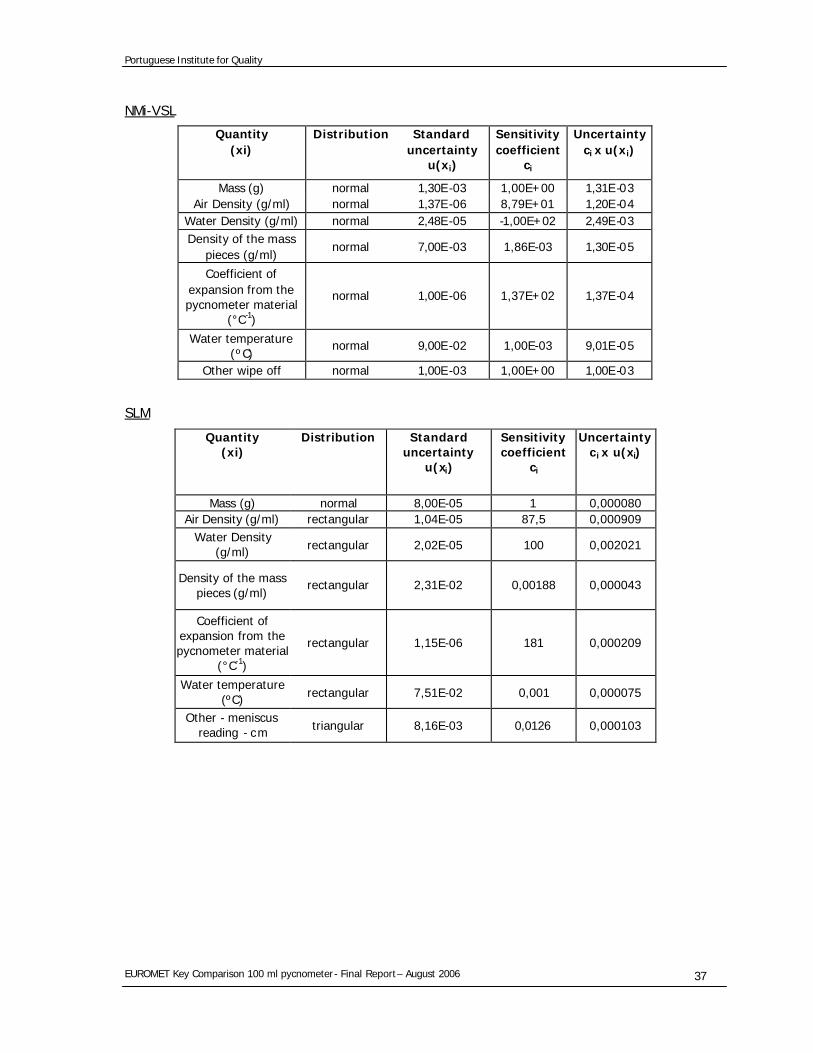
NMi-VSL
Quantity (xi)
Distribution Standard uncertainty
u(xi)
Sensitivity coefficient
ci
Uncertainty ci x u(xi)
Mass (g) normal 1,30E -03 1,00E+00 1,31E -03 Air Density (g/ml) normal 1,37E -06 8,79E+01 1,20E -04
Water Density (g/ml) normal 2,48E -05 -1,00E+02 2,49E -03 Density of the mass
pieces (g/ml) normal 7,00E -03 1,86E-03 1,30E -05
Coefficient of expansion from the pycnometer material
(°C-1)
normal 1,00E -06 1,37E+02 1,37E -04
Water temperature (ºC)
normal 9,00E -02 1,00E-03 9,01E -05
Other wipe off normal 1,00E -03 1,00E+00 1,00E -03
SLM
Quantity (xi)
Distribution Standard uncertainty
u(xi)
Sensitivity coefficient
ci
Uncertainty ci x u(xi)
Mass (g) normal 8,00E-05 1 0,000080 Air Density (g/ml) rectangular 1,04E-05 87,5 0,000909
Water Density (g/ml) rectangular 2,02E-05 100 0,002021
Density of the mass pieces (g/ml)
rectangular 2,31E-02 0,00188 0,000043
Coefficient of expansion from the pycnometer material
(°C-1)
rectangular 1,15E-06 181 0,000209
Water temperature (ºC) rectangular 7,51E-02 0,001 0,000075
Other - meniscus reading - cm triangular 8,16E-03 0,0126 0,000103
Portuguese Institute for Quality
EUROMET Key Comparison 100 ml pycnometer - Final Report – August 2006 38
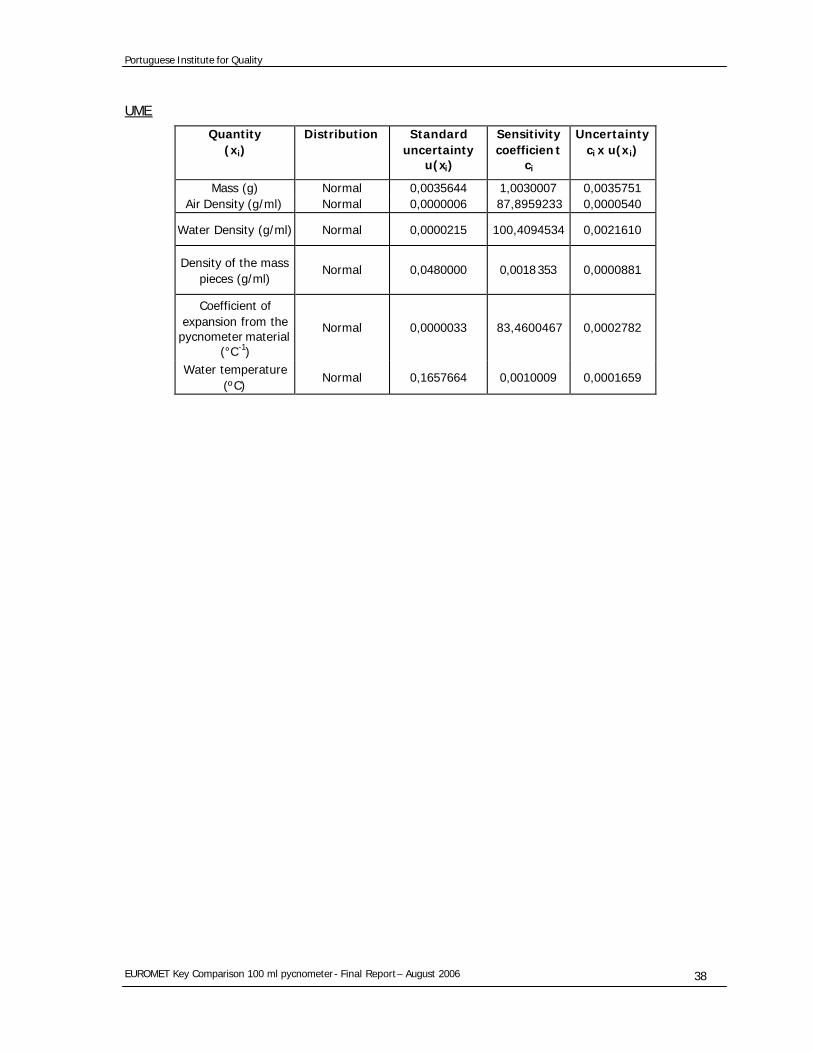
UME
Quantity (xi)
Distribution Standard uncertainty
u(xi)
Sensitivity coefficien t
ci
Uncertainty ci x u(xi)
Mass (g) Normal 0,0035644 1,0030007 0,0035751 Air Density (g/ml) Normal 0,0000006 87,8959233 0,0000540
Water Density (g/ml) Normal 0,0000215 100,4094534 0,0021610
Density of the mass pieces (g/ml)
Normal 0,0480000 0,0018353 0,0000881
Coefficient of expansion from the
pycnometer material (°C-1)
Normal 0,0000033 83,4600467 0,0002782
Water temperature (ºC)
Normal 0,1657664 0,0010009 0,0001659
Portuguese Institute for Quality
EUROMET Key Comparison 100 ml pycnometer - Final Report – August 2006 39
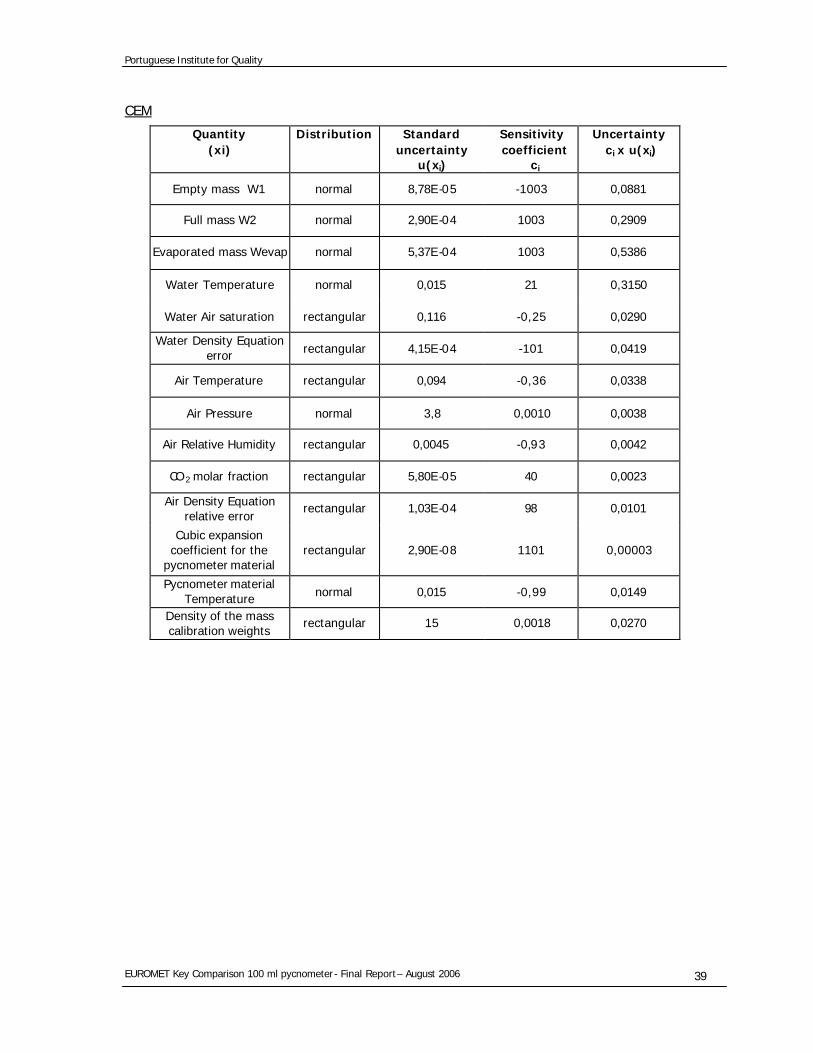
CEM
Quantity (xi)
Distribution Standard uncertainty
u(xi)
Sensitivity coefficient
ci
Uncertainty ci x u(xi)
Empty mass W1 normal 8,78E -05 -1003 0,0881
Full mass W2 normal 2,90E -04 1003 0,2909
Evaporated mass Wevap normal 5,37E -04 1003 0,5386
Water Temperature normal 0,015 21 0,3150
Water Air saturation rectangular 0,116 -0,25 0,0290
Water Density Equation error rectangular 4,15E -04 -101 0,0419
Air Temperature rectangular 0,094 -0,36 0,0338
Air Pressure normal 3,8 0,0010 0,0038
Air Relative Humidity rectangular 0,0045 -0,93 0,0042
CO 2 molar fraction rectangular 5,80E -05 40 0,0023
Air Density Equation relative error
rectangular 1,03E -04 98 0,0101
Cubic expansion coefficient for the
pycnometer material rectangular 2,90E -08 1101 0,00003
Pycnometer material Temperature normal 0,015 -0,99 0,0149
Density of the mass calibration weights
rectangular 15 0,0018 0,0270
Portuguese Institute for Quality
EUROMET Key Comparison 100 ml pycnometer - Final Report – August 2006 40
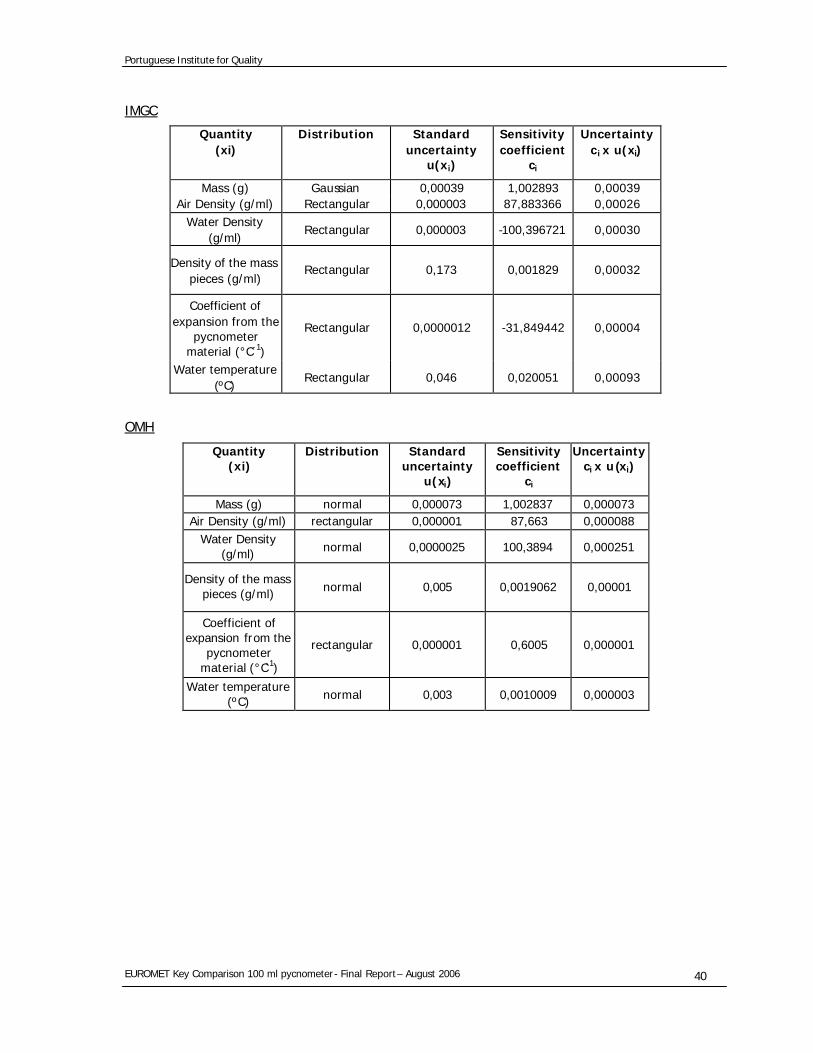
IMGC
Quantity (xi)
Distribution Standard uncertainty
u(xi)
Sensitivity coefficient
ci
Uncertainty ci x u(xi)
Mass (g) Gaussian 0,00039 1,002893 0,00039 Air Density (g/ml) Rectangular 0,000003 87,883366 0,00026
Water Density (g/ml)
Rectangular 0,000003 -100,396721 0,00030
Density of the mass pieces (g/ml)
Rectangular 0,173 0,001829 0,00032
Coefficient of expansion from the
pycnometer material (°C-1)
Rectangular 0,0000012 -31,849442 0,00004
Water temperature (ºC)
Rectangular 0,046 0,020051 0,00093
OMH
Quantity (xi)
Distribution Standard uncertainty
u(xi)
Sensitivity coefficient
ci
Uncertainty ci x u(xi)
Mass (g) normal 0,000073 1,002837 0,000073 Air Density (g/ml) rectangular 0,000001 87,663 0,000088
Water Density (g/ml) normal 0,0000025 100,3894 0,000251
Density of the mass pieces (g/ml) normal 0,005 0,0019062 0,00001
Coefficient of expansion from the
pycnometer material (°C-1)
rectangular 0,000001 0,6005 0,000001
Water temperature (ºC) normal 0,003 0,0010009 0,000003
Portuguese Institute for Quality
EUROMET Key Comparison 100 ml pycnometer - Final Report – August 2006 41
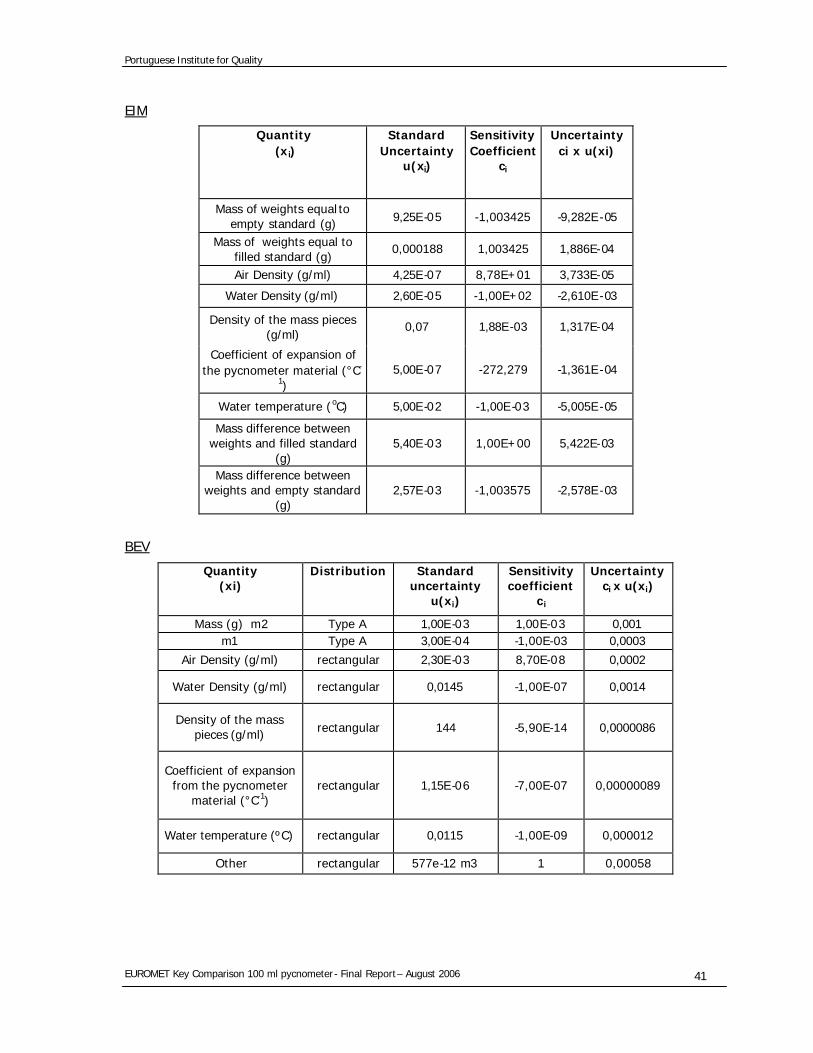
EIM
Quantity (xi)
Standard Uncertainty
u(xi)
Sensitivity Coefficient
ci
Uncertainty ci x u(xi)
Mass of weights equal to empty standard (g) 9,25E -05 -1,003425 -9,282E -05
Mass of weights equal to filled standard (g)
0,000188 1,003425 1,886E-04
Air Density (g/ml) 4,25E -07 8,78E+01 3,733E-05
Water Density (g/ml) 2,60E -05 -1,00E+02 -2,610E -03
Density of the mass pieces (g/ml)
0,07 1,88E -03 1,317E-04
Coefficient of expansion of the pycnometer material (°C-
1) 5,00E -07 -272,279 -1,361E -04
Water temperature (oC) 5,00E -02 -1,00E -03 -5,005E -05
Mass difference between weights and filled standard
(g) 5,40E -03 1,00E+00 5,422E-03
Mass difference between weights and empty standard
(g) 2,57E -03 -1,003575 -2,578E -03
BEV
Quantity (xi)
Distribution Standard uncertainty
u(xi)
Sensitivity coefficient
ci
Uncertainty ci x u(xi)
Mass (g) m2 Type A 1,00E -03 1,00E-03 0,001 m1 Type A 3,00E -04 -1,00E-03 0,0003
Air Density (g/ml) rectangular 2,30E -03 8,70E-08 0,0002
Water Density (g/ml) rectangular 0,0145 -1,00E-07 0,0014
Density of the mass pieces (g/ml) rectangular 144 -5,90E-14 0,0000086
Coefficient of expansion from the pycnometer
material (°C-1) rectangular 1,15E -06 -7,00E-07 0,00000089
Water temperature (ºC) rectangular 0,0115 -1,00E-09 0,000012
Other rectangular 577e-12 m3 1 0,00058
Portuguese Institute for Quality
EUROMET Key Comparison 100 ml pycnometer - Final Report – August 2006 42
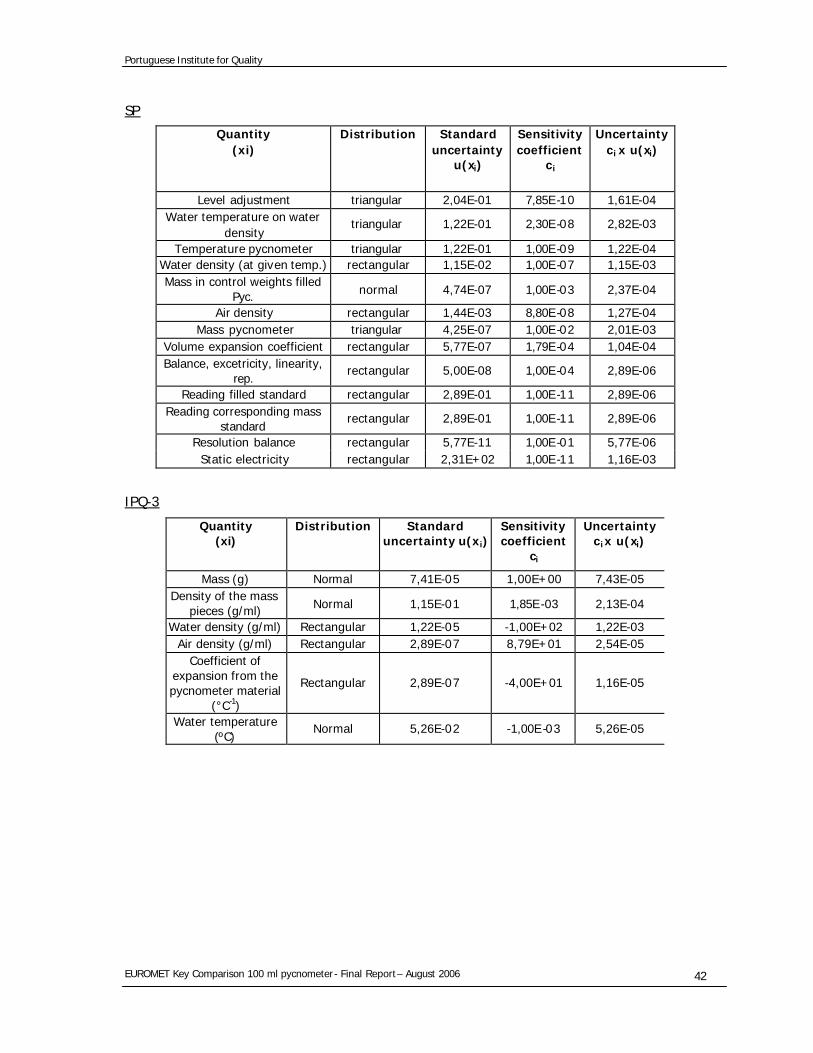
SP
Quantity (xi)
Distribution Standard uncertainty
u(xi)
Sensitivity coefficient
ci
Uncertainty ci x u(xi)
Level adjustment triangular 2,04E-01 7,85E -10 1,61E-04 Water temperature on water
density triangular 1,22E-01 2,30E -08 2,82E-03
Temperature pycnometer triangular 1,22E-01 1,00E -09 1,22E-04 Water density (at given temp.) rectangular 1,15E-02 1,00E -07 1,15E-03 Mass in control weights filled
Pyc. normal 4,74E-07 1,00E -03 2,37E-04
Air density rectangular 1,44E-03 8,80E -08 1,27E-04 Mass pycnometer triangular 4,25E-07 1,00E -02 2,01E-03
Volume expansion coefficient rectangular 5,77E-07 1,79E -04 1,04E-04 Balance, excetricity, linearity,
rep. rectangular 5,00E-08 1,00E -04 2,89E-06
Reading filled standard rectangular 2,89E-01 1,00E -11 2,89E-06 Reading corresponding mass
standard rectangular 2,89E-01 1,00E -11 2,89E-06
Resolution balance rectangular 5,77E-11 1,00E -01 5,77E-06 Static electricity rectangular 2,31E+02 1,00E -11 1,16E-03
IPQ-3
Quantity (xi)
Distribution Standard uncertainty u(xi)
Sensitivity coefficient
ci
Uncertainty ci x u(xi)
Mass (g) Normal 7,41E-05 1,00E+00 7,43E-05 Density of the mass
pieces (g/ml) Normal 1,15E-01 1,85E -03 2,13E-04
Water density (g/ml) Rectangular 1,22E-05 -1,00E+02 1,22E-03 Air density (g/ml) Rectangular 2,89E-07 8,79E+01 2,54E-05
Coefficient of expansion from the pycnometer material
(°C-1)
Rectangular 2,89E-07 -4,00E+01 1,16E-05
Water temperature (ºC)
Normal 5,26E-02 -1,00E -03 5,26E-05