Embed Size (px)
Citation preview
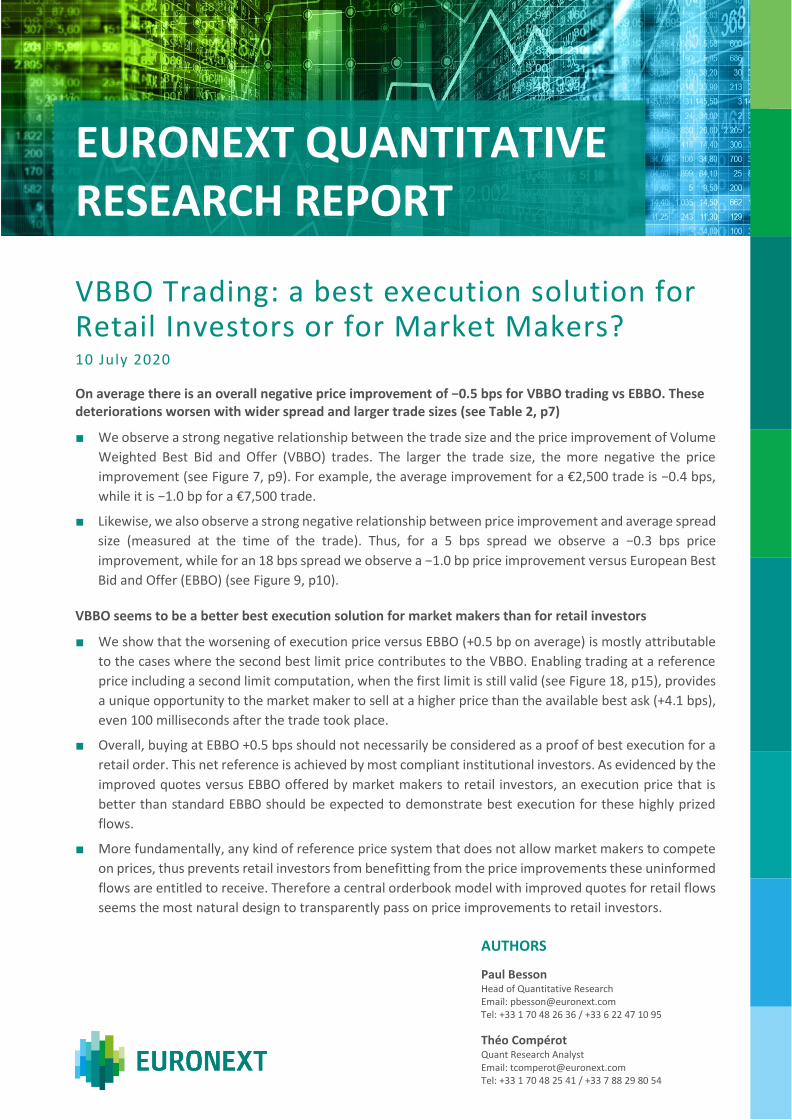
EURONEXT QUANTITATIVE RESEARCH REPORT
VBBO Trading: a best execution solution for Retail Investors or for Market Makers? 10 July 2020
On average there is an overall negative price improvement of −0.5 bps for VBBO trading vs EBBO. These deteriorations worsen with wider spread and larger trade sizes (see Table 2, p7)
■ We observe a strong negative relationship between the trade size and the price improvement of Volume
Weighted Best Bid and Offer (VBBO) trades. The larger the trade size, the more negative the price
improvement (see Figure 7, p9). For example, the average improvement for a €2,500 trade is −0.4 bps,
while it is −1.0 bp for a €7,500 trade.
■ Likewise, we also observe a strong negative relationship between price improvement and average spread
size (measured at the time of the trade). Thus, for a 5 bps spread we observe a −0.3 bps price
improvement, while for an 18 bps spread we observe a −1.0 bp price improvement versus European Best
Bid and Offer (EBBO) (see Figure 9, p10).
VBBO seems to be a better best execution solution for market makers than for retail investors
■ We show that the worsening of execution price versus EBBO (+0.5 bp on average) is mostly attributable
to the cases where the second best limit price contributes to the VBBO. Enabling trading at a reference
price including a second limit computation, when the first limit is still valid (see Figure 18, p15), provides
a unique opportunity to the market maker to sell at a higher price than the available best ask (+4.1 bps),
even 100 milliseconds after the trade took place.
■ Overall, buying at EBBO +0.5 bps should not necessarily be considered as a proof of best execution for a
retail order. This net reference is achieved by most compliant institutional investors. As evidenced by the
improved quotes versus EBBO offered by market makers to retail investors, an execution price that is
better than standard EBBO should be expected to demonstrate best execution for these highly prized
flows.
■ More fundamentally, any kind of reference price system that does not allow market makers to compete
on prices, thus prevents retail investors from benefitting from the price improvements these uninformed
flows are entitled to receive. Therefore a central orderbook model with improved quotes for retail flows
seems the most natural design to transparently pass on price improvements to retail investors.
AUTHORS
Paul Besson Head of Quantitative Research Email: [email protected] Tel: +33 1 70 48 26 36 / +33 6 22 47 10 95
Théo Compérot Quant Research Analyst Email: [email protected] Tel: +33 1 70 48 25 41 / +33 7 88 29 80 54

Purpose
In this study we aim to compare Equiduct VBBO trades with the corresponding EBBO quotes to assess the
performance of these types of trading. Performance of VBBO trading will be measured by the relative
difference between executed prices and their corresponding EBBO reference prices. We have therefore
reviewed all VBBO trades from Equiduct from December 2019 to February 2020. This corresponds to
1.16 million individual retail trades.
EBBO computations were provided by QuantHouse, the leader in high frequency data, chosen for its strong
real-time data expertise.
We will focus on 4 main objectives:
■ Compare prices for VBBO trades with EBBO prices to determine the price improvement or price
deterioration observed in these trades;
■ Study how this relative performance behaves with the corresponding underlying trade sizes and the bid-
ask spreads of stocks;
■ Explain the Equiduct VBBO trading performance by considering independently those trades with sizes
available on the EBBO first limits, and larger trades with sizes that were not available on the EBBO first
limits;
■ Consider the question of best execution for VBBO trading.
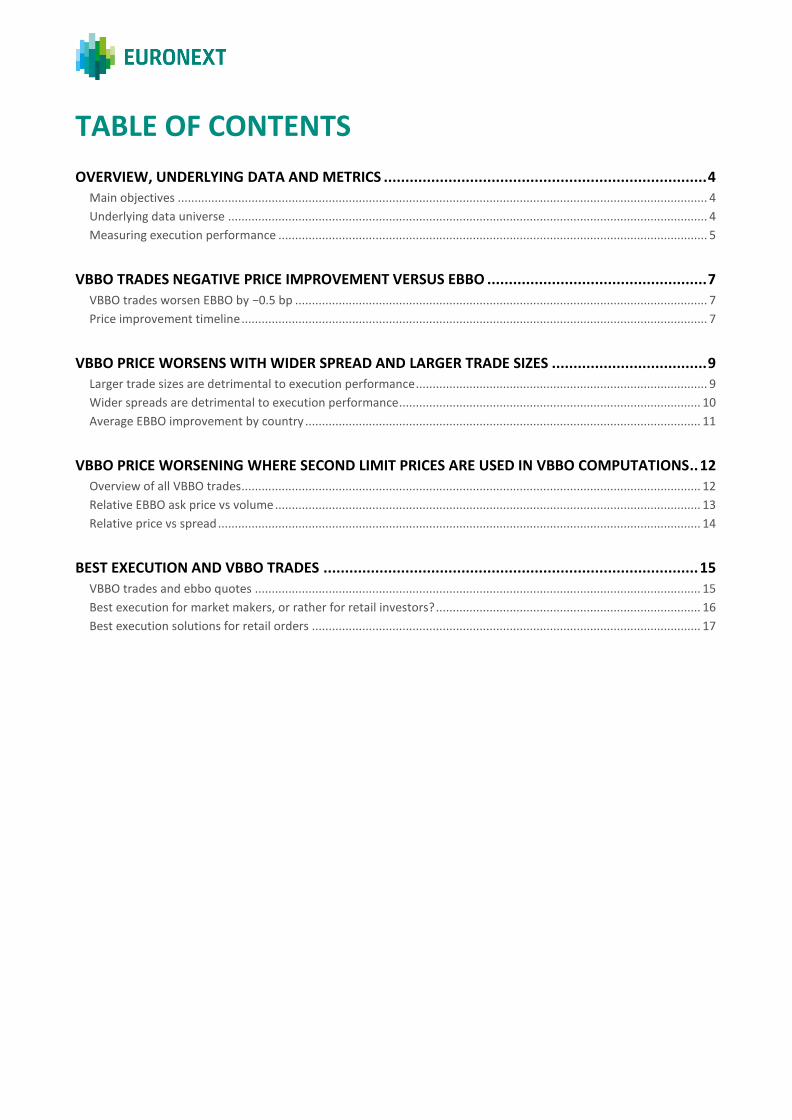
TABLE OF CONTENTS
OVERVIEW, UNDERLYING DATA AND METRICS ........................................................................... 4
Main objectives .............................................................................................................................................................. 4
Underlying data universe ............................................................................................................................................... 4
Measuring execution performance ................................................................................................................................ 5
VBBO TRADES NEGATIVE PRICE IMPROVEMENT VERSUS EBBO ................................................... 7
VBBO trades worsen EBBO by −0.5 bp ........................................................................................................................... 7
Price improvement timeline ........................................................................................................................................... 7
VBBO PRICE WORSENS WITH WIDER SPREAD AND LARGER TRADE SIZES .................................... 9
Larger trade sizes are detrimental to execution performance ....................................................................................... 9
Wider spreads are detrimental to execution performance.......................................................................................... 10
Average EBBO improvement by country ...................................................................................................................... 11
VBBO PRICE WORSENING WHERE SECOND LIMIT PRICES ARE USED IN VBBO COMPUTATIONS .. 12
Overview of all VBBO trades......................................................................................................................................... 12
Relative EBBO ask price vs volume ............................................................................................................................... 13
Relative price vs spread ................................................................................................................................................ 14
BEST EXECUTION AND VBBO TRADES ....................................................................................... 15
VBBO trades and ebbo quotes ..................................................................................................................................... 15
Best execution for market makers, or rather for retail investors? ............................................................................... 16
Best execution solutions for retail orders .................................................................................................................... 17
4 | VBBO Trading: a best execution solution for Retail Investors or for Market Makers?
OVERVIEW, UNDERLYING DATA AND METRICS UNDERLYING DATA UNIVERSE
■ Underlying data comprises Equiduct VBBO trades, as well as reference prices (EBBO
and VBBO, defined below).
■ Trade data are provided by QuantHouse. The data cover every Equiduct trade from
December 2019 to late February 2020, including its execution price, quantity, side,
timestamp (microsecond granularity) and MMT Flags (these allow us to identify the
type of trade flow, in particular VBBO trades). All these metrics are transmitted via
QuantHouse, but the trade characteristics are directly produced by Equiduct.
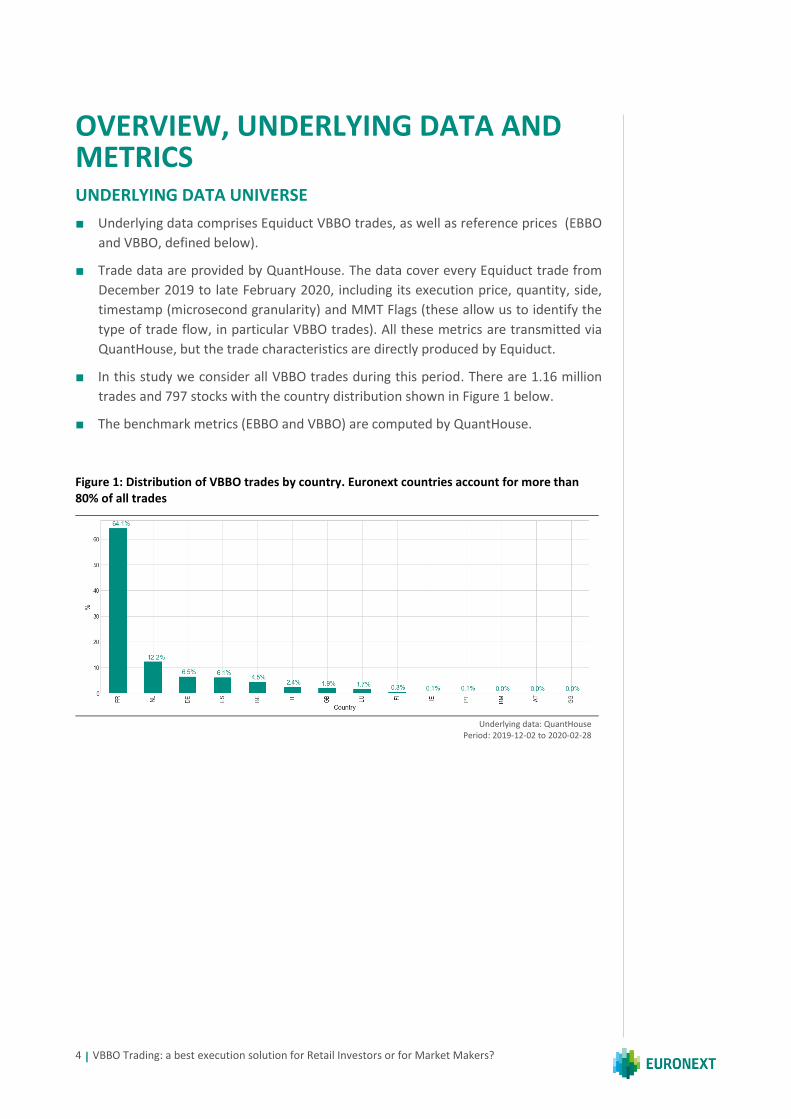
■ In this study we consider all VBBO trades during this period. There are 1.16 million
trades and 797 stocks with the country distribution shown in Figure 1 below.
■ The benchmark metrics (EBBO and VBBO) are computed by QuantHouse.
Figure 1: Distribution of VBBO trades by country. Euronext countries account for more than 80% of all trades
Underlying data: QuantHouse
Period: 2019-12-02 to 2020-02-28
5 | VBBO Trading: a best execution solution for Retail Investors or for Market Makers?
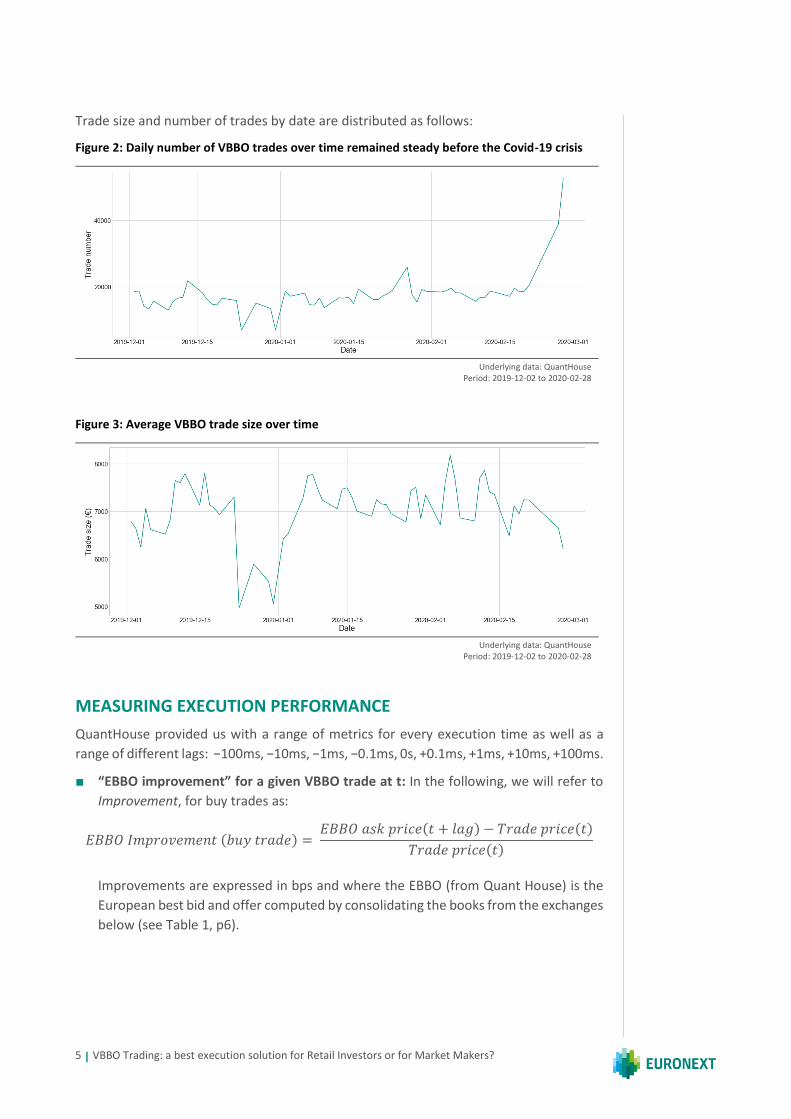
Trade size and number of trades by date are distributed as follows:
Figure 2: Daily number of VBBO trades over time remained steady before the Covid-19 crisis
Underlying data: QuantHouse
Period: 2019-12-02 to 2020-02-28
Figure 3: Average VBBO trade size over time
Underlying data: QuantHouse
Period: 2019-12-02 to 2020-02-28
MEASURING EXECUTION PERFORMANCE
QuantHouse provided us with a range of metrics for every execution time as well as a
range of different lags: −100ms, −10ms, −1ms, −0.1ms, 0s, +0.1ms, +1ms, +10ms, +100ms.
■ “EBBO improvement” for a given VBBO trade at t: In the following, we will refer to
Improvement, for buy trades as:
𝐸𝐵𝐵𝑂 𝐼𝑚𝑝𝑟𝑜𝑣𝑒𝑚𝑒𝑛𝑡 (𝑏𝑢𝑦 𝑡𝑟𝑎𝑑𝑒) = 𝐸𝐵𝐵𝑂 𝑎𝑠𝑘 𝑝𝑟𝑖𝑐𝑒(𝑡 + 𝑙𝑎𝑔) − 𝑇𝑟𝑎𝑑𝑒 𝑝𝑟𝑖𝑐𝑒(𝑡)
𝑇𝑟𝑎𝑑𝑒 𝑝𝑟𝑖𝑐𝑒(𝑡)
Improvements are expressed in bps and where the EBBO (from Quant House) is the
European best bid and offer computed by consolidating the books from the exchanges
below (see Table 1, p6).
6 | VBBO Trading: a best execution solution for Retail Investors or for Market Makers?
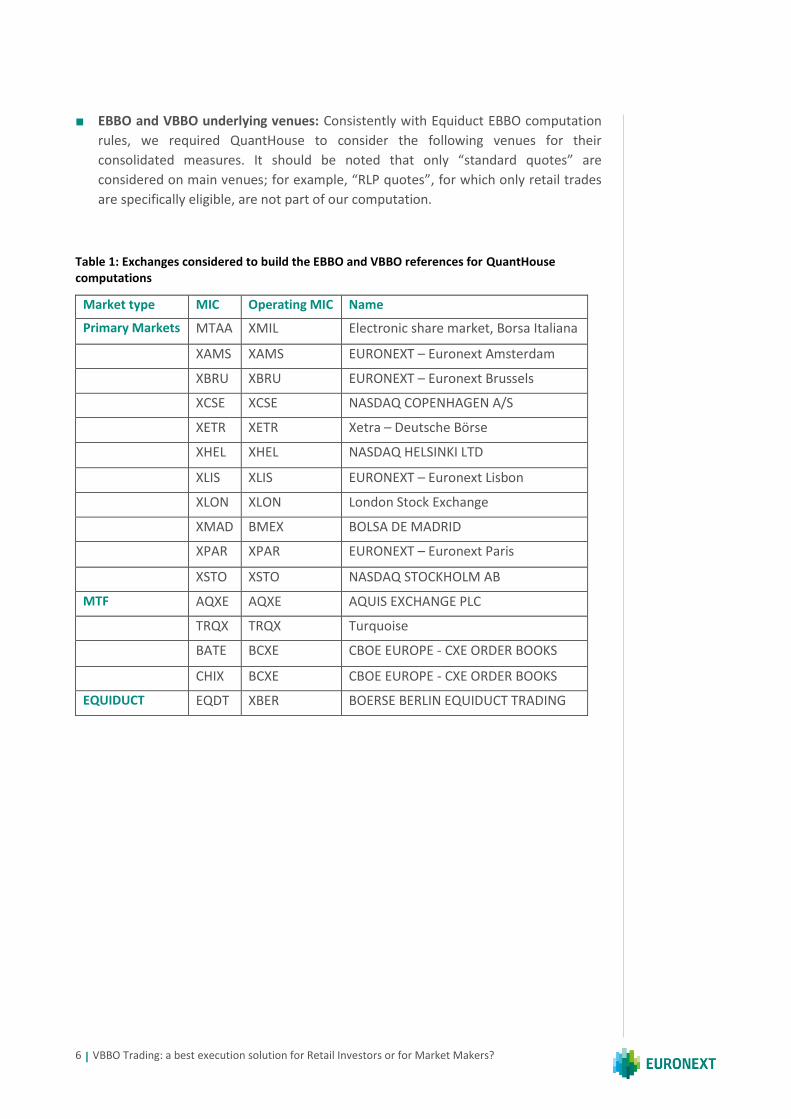
■ EBBO and VBBO underlying venues: Consistently with Equiduct EBBO computation
rules, we required QuantHouse to consider the following venues for their
consolidated measures. It should be noted that only “standard quotes” are
considered on main venues; for example, “RLP quotes”, for which only retail trades
are specifically eligible, are not part of our computation.
Table 1: Exchanges considered to build the EBBO and VBBO references for QuantHouse computations
Market type MIC Operating MIC Name
Primary Markets MTAA XMIL Electronic share market, Borsa Italiana
XAMS XAMS EURONEXT – Euronext Amsterdam
XBRU XBRU EURONEXT – Euronext Brussels
XCSE XCSE NASDAQ COPENHAGEN A/S
XETR XETR Xetra – Deutsche Börse
XHEL XHEL NASDAQ HELSINKI LTD
XLIS XLIS EURONEXT – Euronext Lisbon
XLON XLON London Stock Exchange
XMAD BMEX BOLSA DE MADRID
XPAR XPAR EURONEXT – Euronext Paris
XSTO XSTO NASDAQ STOCKHOLM AB
MTF AQXE AQXE AQUIS EXCHANGE PLC
TRQX TRQX Turquoise
BATE BCXE CBOE EUROPE - CXE ORDER BOOKS
CHIX BCXE CBOE EUROPE - CXE ORDER BOOKS
EQUIDUCT EQDT XBER BOERSE BERLIN EQUIDUCT TRADING
7 | VBBO Trading: a best execution solution for Retail Investors or for Market Makers?
VBBO TRADES NEGATIVE PRICE IMPROVEMENT VERSUS EBBO VBBO TRADES WORSEN EBBO BY −0.5 BP
On average, VBBO trades deteriorate against the corresponding EBBO reference (best ask
for buy trades, or best bid for sell trades) by −0.49 to −0.53 bps respectively (see Table 2,
line 2). This corresponds to a negative price improvement.
Table 2: VBBO executions: number of trades and price improvement
VBBO Orders
Buy Sell
Number of trades 0.61 million (52.4%) 0.55 million (47.6%)
EBBO improvement −0.53 bps −0.49 bps
Underlying data: QuantHouse Period: 2019-12-02 to 2020-02-28
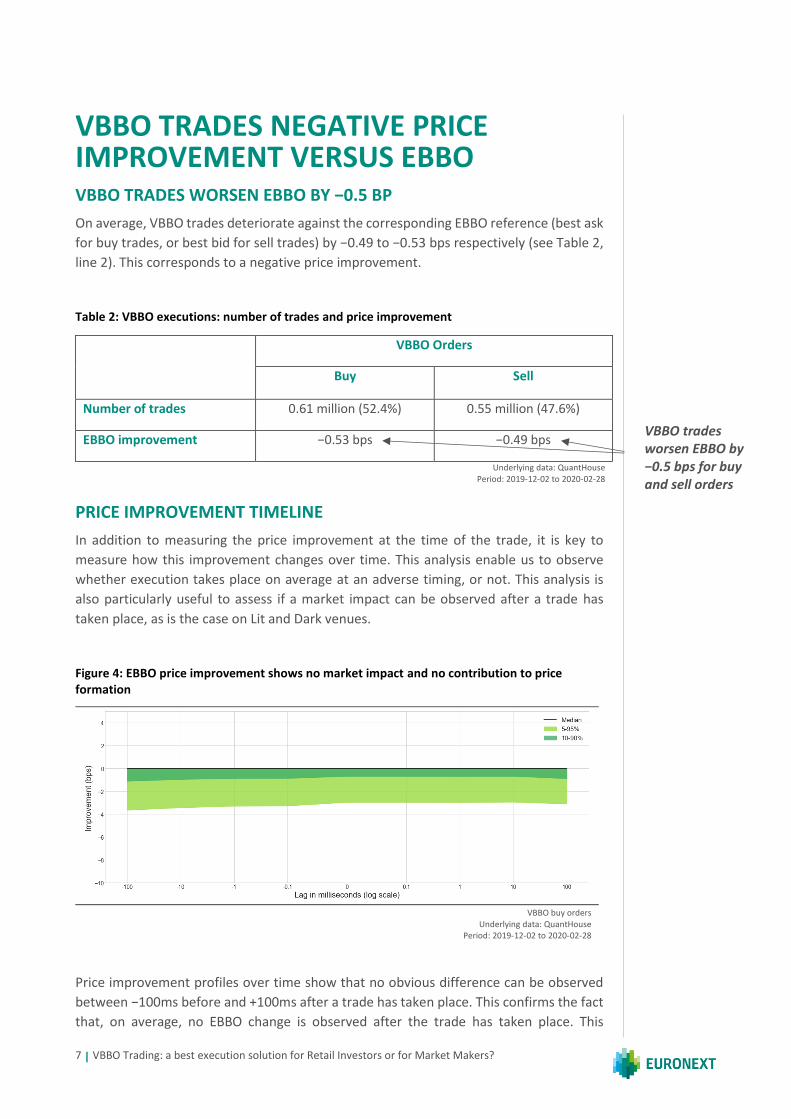
PRICE IMPROVEMENT TIMELINE
In addition to measuring the price improvement at the time of the trade, it is key to
measure how this improvement changes over time. This analysis enable us to observe
whether execution takes place on average at an adverse timing, or not. This analysis is
also particularly useful to assess if a market impact can be observed after a trade has
taken place, as is the case on Lit and Dark venues.
Figure 4: EBBO price improvement shows no market impact and no contribution to price formation
VBBO buy orders
Underlying data: QuantHouse Period: 2019-12-02 to 2020-02-28
Price improvement profiles over time show that no obvious difference can be observed
between −100ms before and +100ms after a trade has taken place. This confirms the fact
that, on average, no EBBO change is observed after the trade has taken place. This
VBBO trades worsen EBBO by −0.5 bps for buy and sell orders
8 | VBBO Trading: a best execution solution for Retail Investors or for Market Makers?
confirms that these retail orders do not create market, since unlike institutional trades,
these trades are not part of a larger order. This unique feature make retail orders
particularly attractive to market makers, as after a trade, the ensuing adverse selection
risk is almost negligible. This is also why retail trades are referred to as ‘uninformed’ by
many academics. This property explains why market makers often agree to improve
quotes on Lit venues, when these quotes are only tradable by retail investors (see Figure
4, p7).
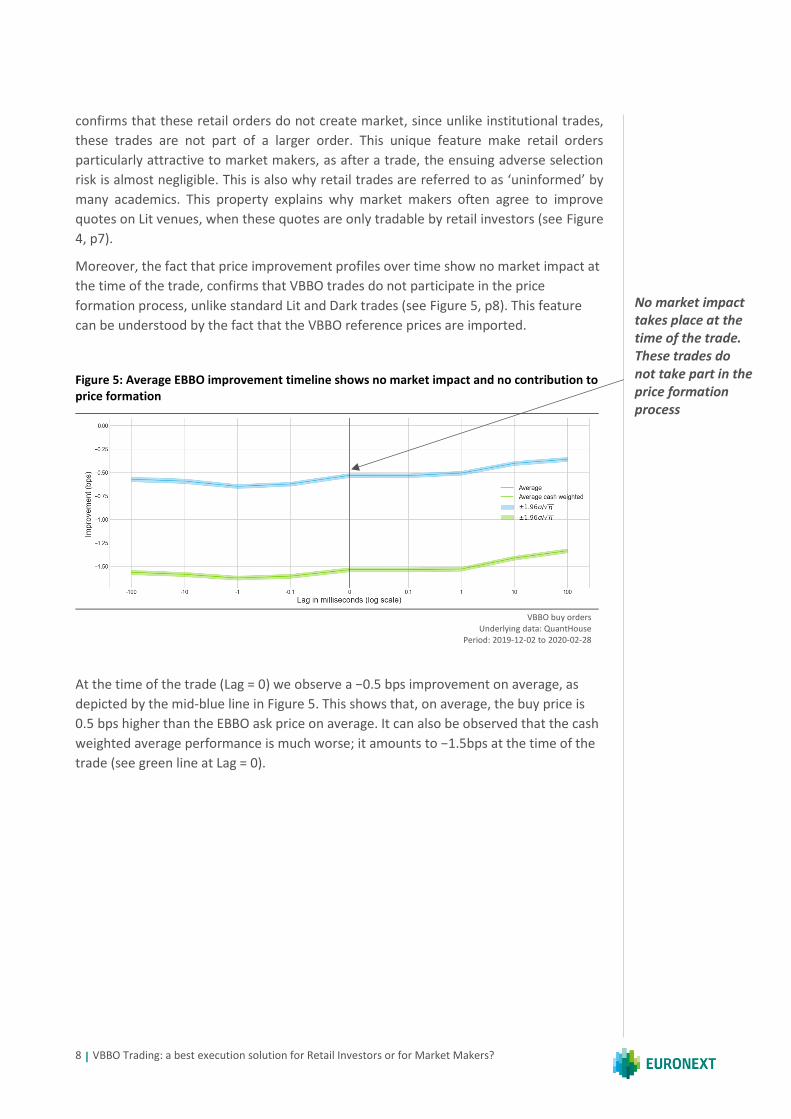
Moreover, the fact that price improvement profiles over time show no market impact at
the time of the trade, confirms that VBBO trades do not participate in the price
formation process, unlike standard Lit and Dark trades (see Figure 5, p8). This feature
can be understood by the fact that the VBBO reference prices are imported.
Figure 5: Average EBBO improvement timeline shows no market impact and no contribution to price formation
VBBO buy orders
Underlying data: QuantHouse Period: 2019-12-02 to 2020-02-28
At the time of the trade (Lag = 0) we observe a −0.5 bps improvement on average, as
depicted by the mid-blue line in Figure 5. This shows that, on average, the buy price is
0.5 bps higher than the EBBO ask price on average. It can also be observed that the cash
weighted average performance is much worse; it amounts to −1.5bps at the time of the
trade (see green line at Lag = 0).
No market impact takes place at the time of the trade. These trades do not take part in the price formation process
9 | VBBO Trading: a best execution solution for Retail Investors or for Market Makers?
VBBO PRICE WORSENS WITH WIDER SPREAD AND LARGER TRADE SIZES LARGER TRADE SIZES ARE DETRIMENTAL TO EXECUTION PERFORMANCE
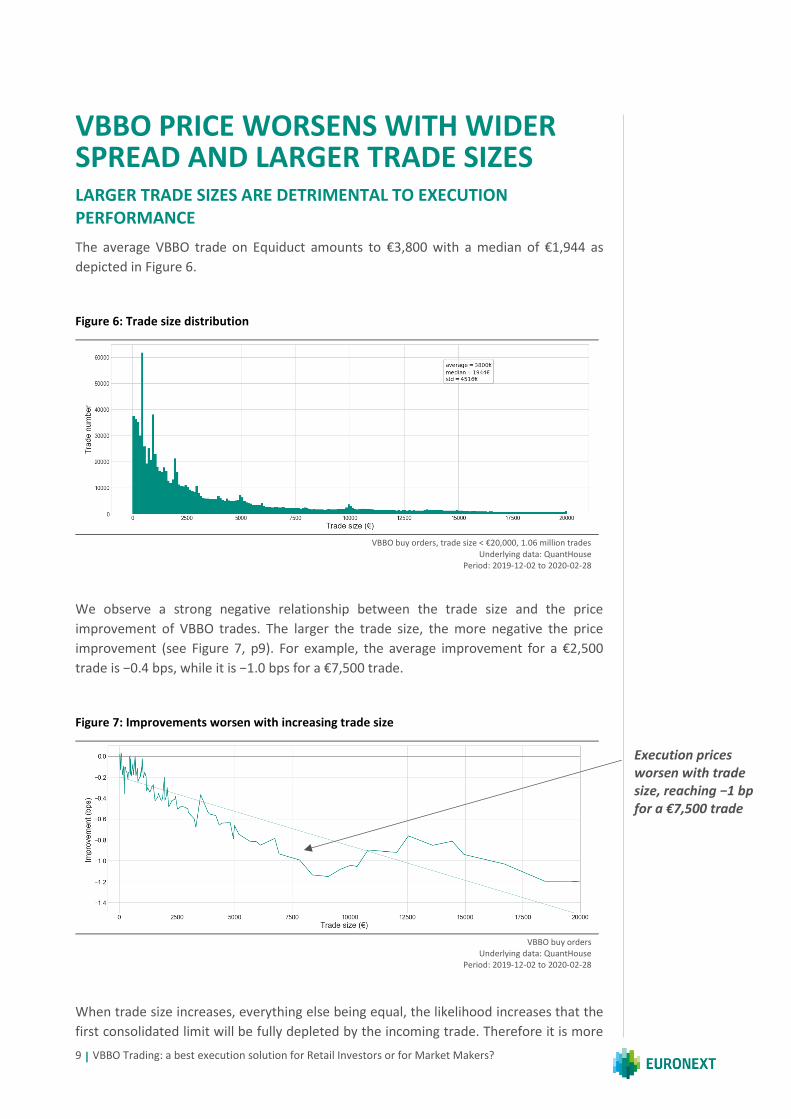
The average VBBO trade on Equiduct amounts to €3,800 with a median of €1,944 as
depicted in Figure 6.
Figure 6: Trade size distribution
VBBO buy orders, trade size < €20,000, 1.06 million trades
Underlying data: QuantHouse Period: 2019-12-02 to 2020-02-28
We observe a strong negative relationship between the trade size and the price
improvement of VBBO trades. The larger the trade size, the more negative the price
improvement (see Figure 7, p9). For example, the average improvement for a €2,500
trade is −0.4 bps, while it is −1.0 bps for a €7,500 trade.
Figure 7: Improvements worsen with increasing trade size
VBBO buy orders
Underlying data: QuantHouse Period: 2019-12-02 to 2020-02-28
When trade size increases, everything else being equal, the likelihood increases that the
first consolidated limit will be fully depleted by the incoming trade. Therefore it is more
Execution prices worsen with trade size, reaching −1 bp for a €7,500 trade
10 | VBBO Trading: a best execution solution for Retail Investors or for Market Makers?
likely that the second limit will be taken into account, worsening the average trade price
and thereby the resulting trading improvement versus EBBO.
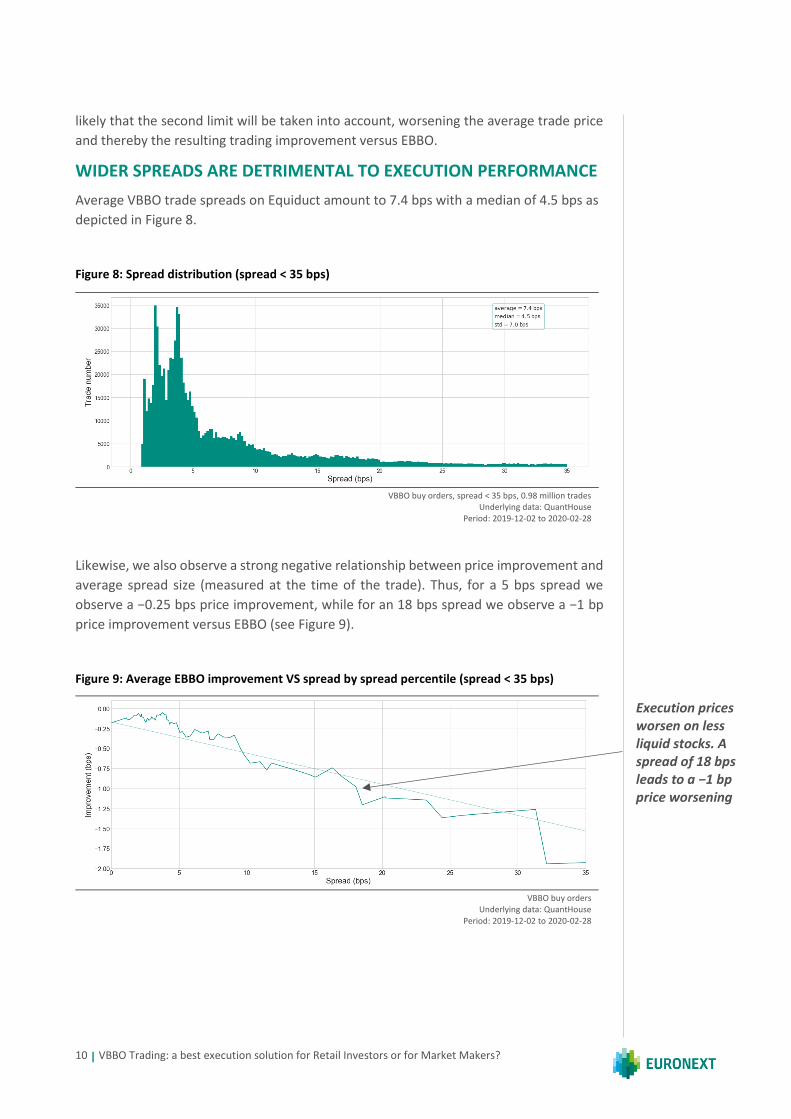
WIDER SPREADS ARE DETRIMENTAL TO EXECUTION PERFORMANCE
Average VBBO trade spreads on Equiduct amount to 7.4 bps with a median of 4.5 bps as
depicted in Figure 8.
Figure 8: Spread distribution (spread < 35 bps)
VBBO buy orders, spread < 35 bps, 0.98 million trades
Underlying data: QuantHouse Period: 2019-12-02 to 2020-02-28
Likewise, we also observe a strong negative relationship between price improvement and
average spread size (measured at the time of the trade). Thus, for a 5 bps spread we
observe a −0.25 bps price improvement, while for an 18 bps spread we observe a −1 bp
price improvement versus EBBO (see Figure 9).
Figure 9: Average EBBO improvement VS spread by spread percentile (spread < 35 bps)
VBBO buy orders
Underlying data: QuantHouse Period: 2019-12-02 to 2020-02-28
Execution prices worsen on less liquid stocks. A spread of 18 bps leads to a −1 bp price worsening
11 | VBBO Trading: a best execution solution for Retail Investors or for Market Makers?
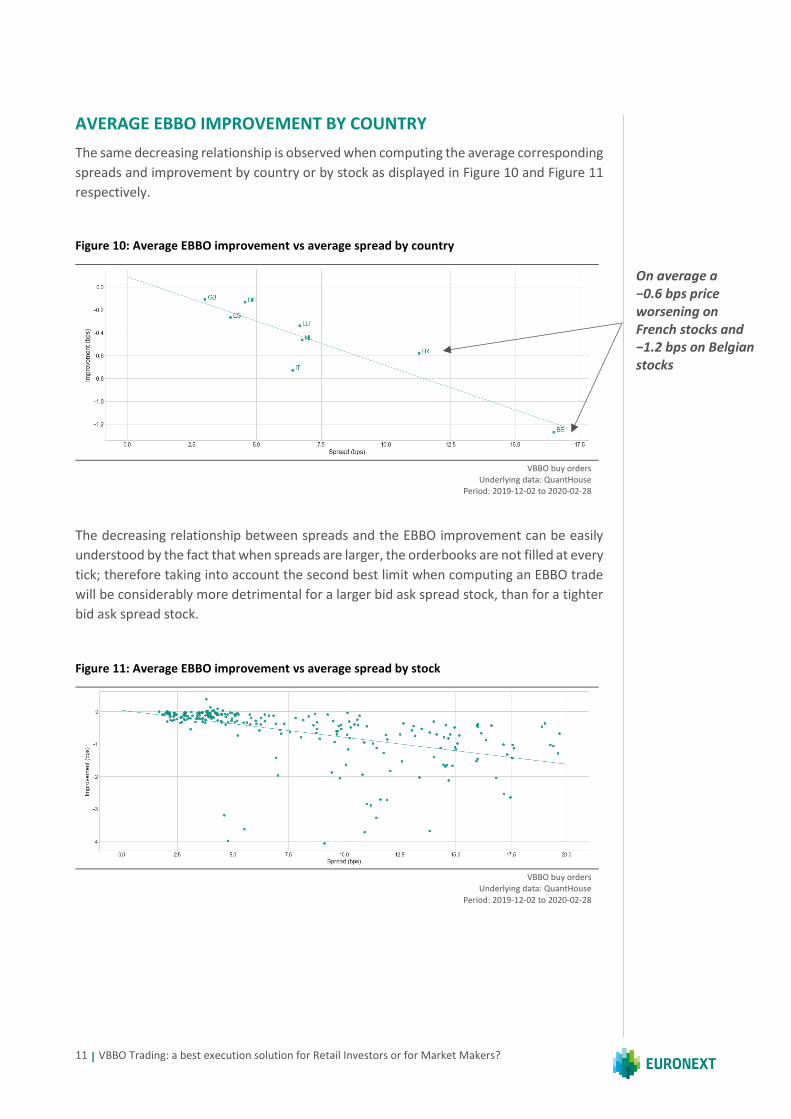
AVERAGE EBBO IMPROVEMENT BY COUNTRY
The same decreasing relationship is observed when computing the average corresponding
spreads and improvement by country or by stock as displayed in Figure 10 and Figure 11
respectively.
Figure 10: Average EBBO improvement vs average spread by country
VBBO buy orders
Underlying data: QuantHouse Period: 2019-12-02 to 2020-02-28
The decreasing relationship between spreads and the EBBO improvement can be easily
understood by the fact that when spreads are larger, the orderbooks are not filled at every
tick; therefore taking into account the second best limit when computing an EBBO trade
will be considerably more detrimental for a larger bid ask spread stock, than for a tighter
bid ask spread stock.
Figure 11: Average EBBO improvement vs average spread by stock
VBBO buy orders
Underlying data: QuantHouse Period: 2019-12-02 to 2020-02-28
On average a −0.6 bps price worsening on French stocks and −1.2 bps on Belgian stocks
12 | VBBO Trading: a best execution solution for Retail Investors or for Market Makers?
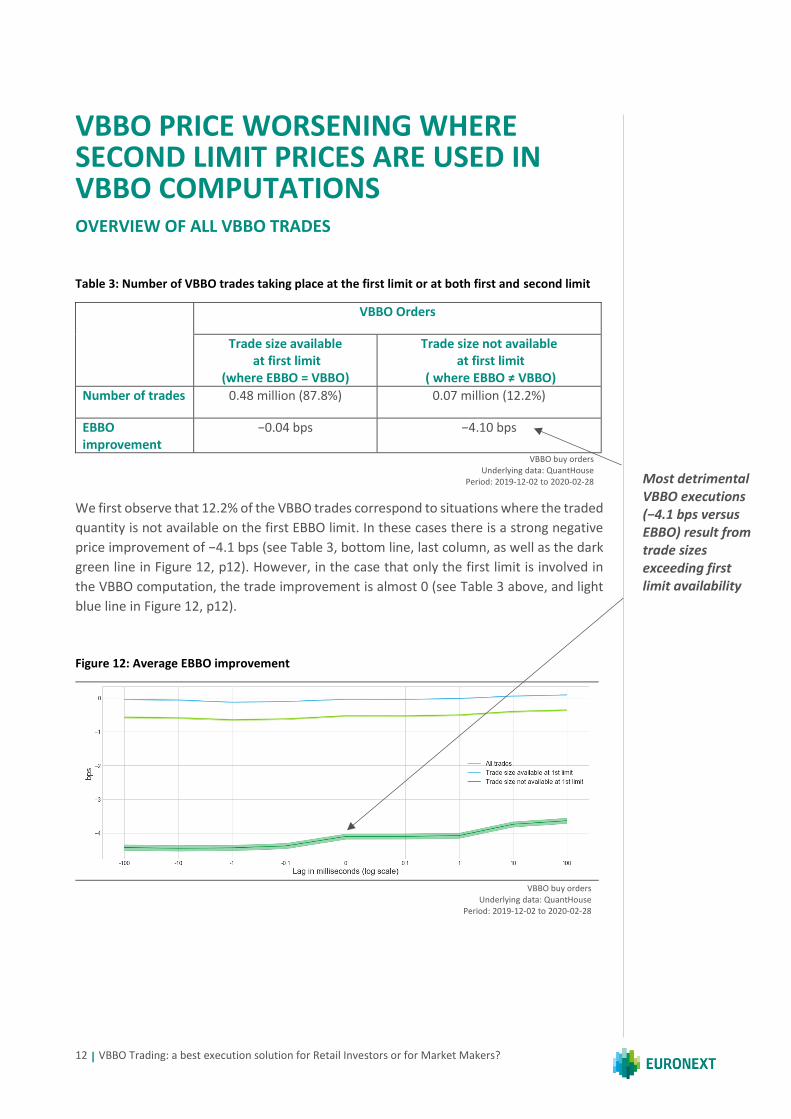
VBBO PRICE WORSENING WHERE SECOND LIMIT PRICES ARE USED IN VBBO COMPUTATIONS OVERVIEW OF ALL VBBO TRADES
Table 3: Number of VBBO trades taking place at the first limit or at both first and second limit
VBBO Orders
Trade size available at first limit
(where EBBO = VBBO)
Trade size not available at first limit
( where EBBO ≠ VBBO)
Number of trades 0.48 million (87.8%) 0.07 million (12.2%)
EBBO improvement
−0.04 bps −4.10 bps
VBBO buy orders Underlying data: QuantHouse
Period: 2019-12-02 to 2020-02-28
We first observe that 12.2% of the VBBO trades correspond to situations where the traded
quantity is not available on the first EBBO limit. In these cases there is a strong negative
price improvement of −4.1 bps (see Table 3, bottom line, last column, as well as the dark
green line in Figure 12, p12). However, in the case that only the first limit is involved in
the VBBO computation, the trade improvement is almost 0 (see Table 3 above, and light
blue line in Figure 12, p12).
Figure 12: Average EBBO improvement
VBBO buy orders
Underlying data: QuantHouse Period: 2019-12-02 to 2020-02-28
Most detrimental VBBO executions (−4.1 bps versus EBBO) result from trade sizes exceeding first limit availability
13 | VBBO Trading: a best execution solution for Retail Investors or for Market Makers?
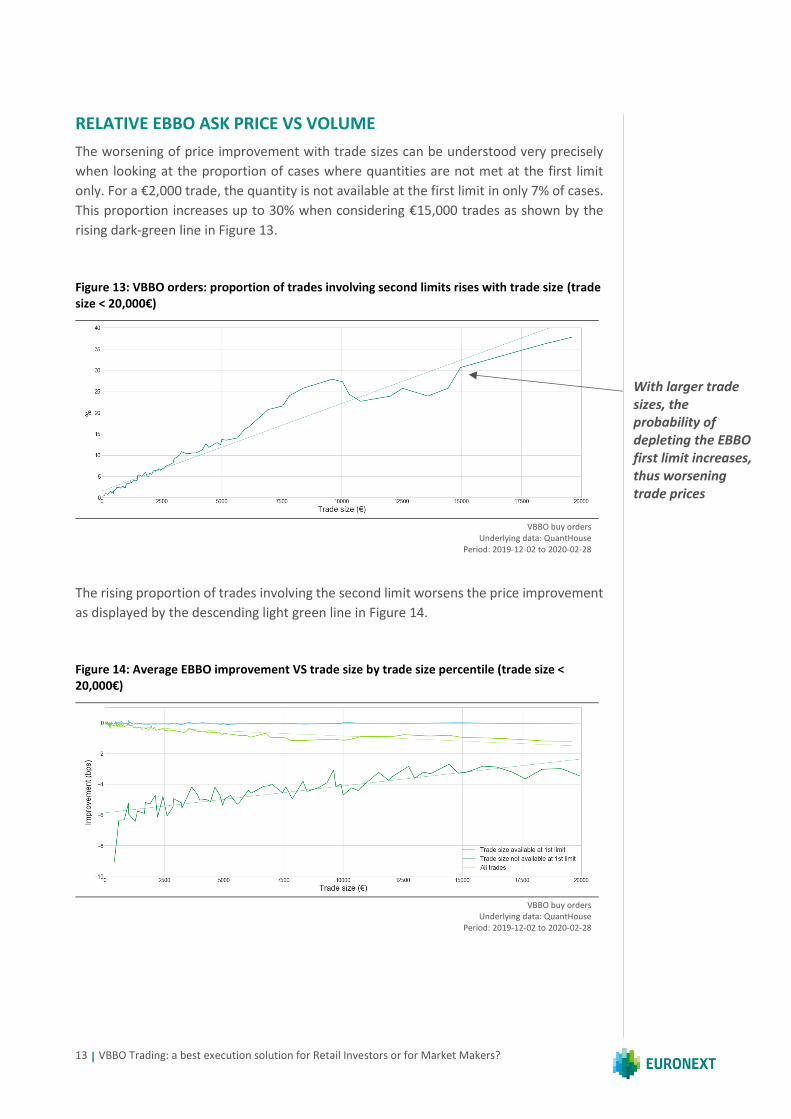
RELATIVE EBBO ASK PRICE VS VOLUME
The worsening of price improvement with trade sizes can be understood very precisely
when looking at the proportion of cases where quantities are not met at the first limit
only. For a €2,000 trade, the quantity is not available at the first limit in only 7% of cases.
This proportion increases up to 30% when considering €15,000 trades as shown by the
rising dark-green line in Figure 13.
Figure 13: VBBO orders: proportion of trades involving second limits rises with trade size (trade size < 20,000€)
VBBO buy orders
Underlying data: QuantHouse Period: 2019-12-02 to 2020-02-28
The rising proportion of trades involving the second limit worsens the price improvement
as displayed by the descending light green line in Figure 14.
Figure 14: Average EBBO improvement VS trade size by trade size percentile (trade size < 20,000€)
VBBO buy orders
Underlying data: QuantHouse Period: 2019-12-02 to 2020-02-28
With larger trade sizes, the probability of depleting the EBBO first limit increases, thus worsening trade prices
14 | VBBO Trading: a best execution solution for Retail Investors or for Market Makers?
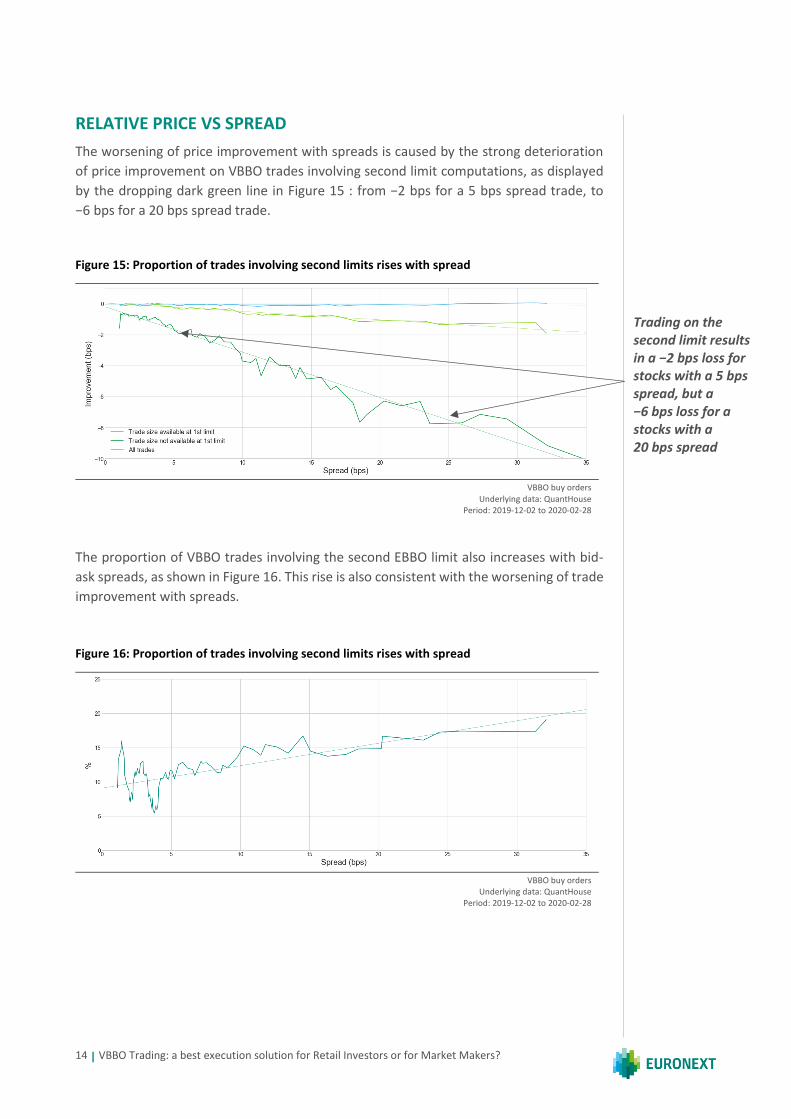
RELATIVE PRICE VS SPREAD
The worsening of price improvement with spreads is caused by the strong deterioration
of price improvement on VBBO trades involving second limit computations, as displayed
by the dropping dark green line in Figure 15 : from −2 bps for a 5 bps spread trade, to
−6 bps for a 20 bps spread trade.
Figure 15: Proportion of trades involving second limits rises with spread
VBBO buy orders
Underlying data: QuantHouse Period: 2019-12-02 to 2020-02-28
The proportion of VBBO trades involving the second EBBO limit also increases with bid-
ask spreads, as shown in Figure 16. This rise is also consistent with the worsening of trade
improvement with spreads.
Figure 16: Proportion of trades involving second limits rises with spread
VBBO buy orders
Underlying data: QuantHouse Period: 2019-12-02 to 2020-02-28
Trading on the second limit results in a −2 bps loss for stocks with a 5 bps spread, but a −6 bps loss for a stocks with a 20 bps spread
15 | VBBO Trading: a best execution solution for Retail Investors or for Market Makers?
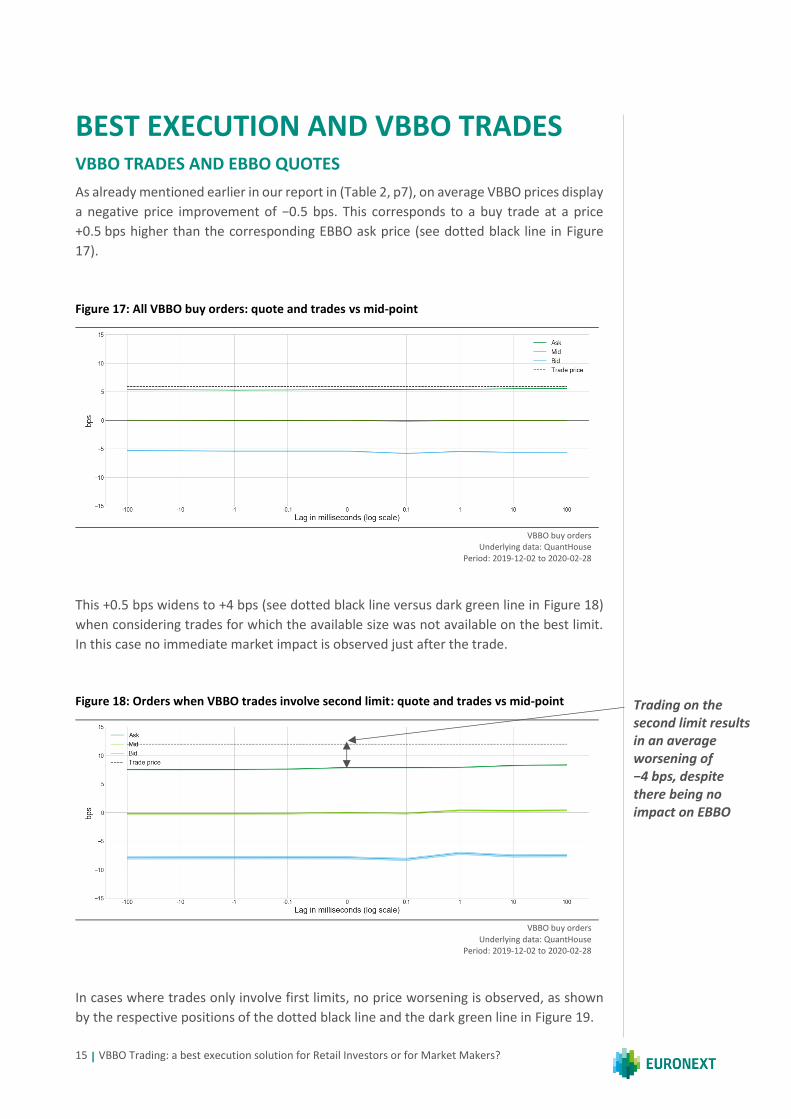
BEST EXECUTION AND VBBO TRADES VBBO TRADES AND EBBO QUOTES
As already mentioned earlier in our report in (Table 2, p7), on average VBBO prices display
a negative price improvement of −0.5 bps. This corresponds to a buy trade at a price
+0.5 bps higher than the corresponding EBBO ask price (see dotted black line in Figure
17).
Figure 17: All VBBO buy orders: quote and trades vs mid-point
VBBO buy orders
Underlying data: QuantHouse Period: 2019-12-02 to 2020-02-28
This +0.5 bps widens to +4 bps (see dotted black line versus dark green line in Figure 18)
when considering trades for which the available size was not available on the best limit.
In this case no immediate market impact is observed just after the trade.
Figure 18: Orders when VBBO trades involve second limit: quote and trades vs mid-point
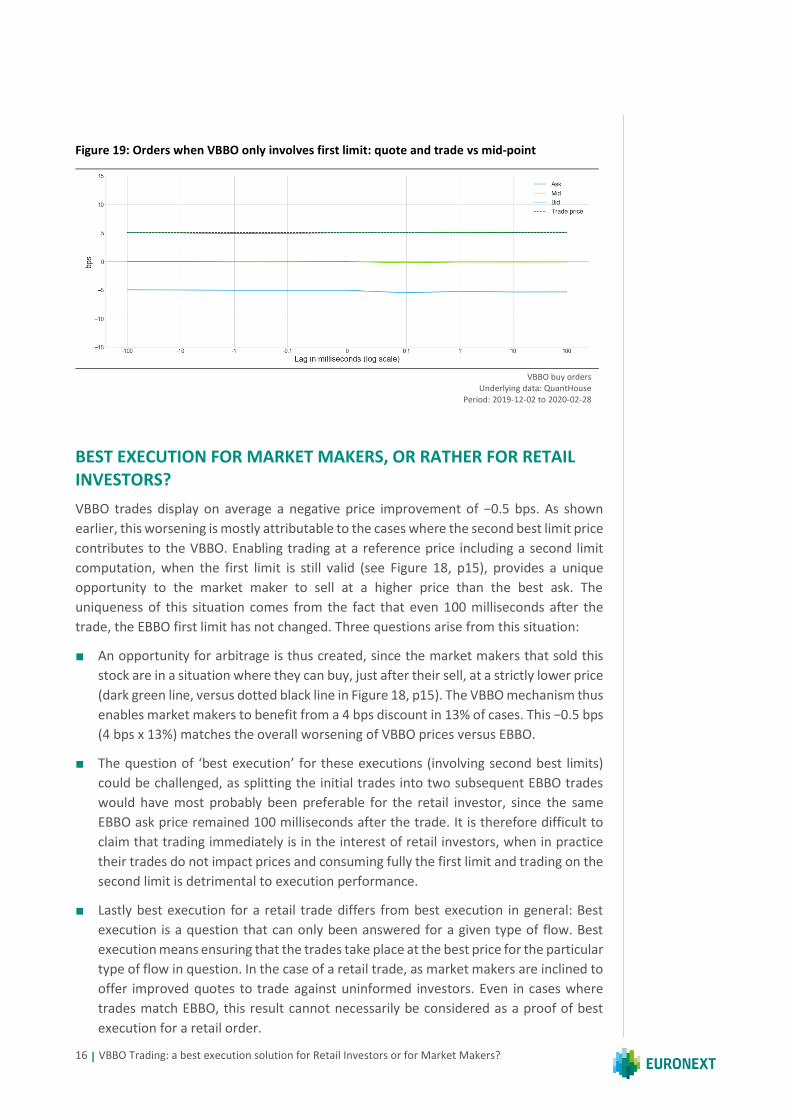
In cases where trades only involve first limits, no price worsening is observed, as shown
by the respective positions of the dotted black line and the dark green line in Figure 19.
VBBO buy orders
Underlying data: QuantHouse Period: 2019-12-02 to 2020-02-28
Trading on the second limit results in an average worsening of −4 bps, despite there being no impact on EBBO
16 | VBBO Trading: a best execution solution for Retail Investors or for Market Makers?
Figure 19: Orders when VBBO only involves first limit: quote and trade vs mid-point
VBBO buy orders
Underlying data: QuantHouse Period: 2019-12-02 to 2020-02-28
BEST EXECUTION FOR MARKET MAKERS, OR RATHER FOR RETAIL INVESTORS?
VBBO trades display on average a negative price improvement of −0.5 bps. As shown
earlier, this worsening is mostly attributable to the cases where the second best limit price
contributes to the VBBO. Enabling trading at a reference price including a second limit
computation, when the first limit is still valid (see Figure 18, p15), provides a unique
opportunity to the market maker to sell at a higher price than the best ask. The
uniqueness of this situation comes from the fact that even 100 milliseconds after the
trade, the EBBO first limit has not changed. Three questions arise from this situation:
■ An opportunity for arbitrage is thus created, since the market makers that sold this
stock are in a situation where they can buy, just after their sell, at a strictly lower price
(dark green line, versus dotted black line in Figure 18, p15). The VBBO mechanism thus
enables market makers to benefit from a 4 bps discount in 13% of cases. This −0.5 bps
(4 bps x 13%) matches the overall worsening of VBBO prices versus EBBO.
■ The question of ‘best execution’ for these executions (involving second best limits)
could be challenged, as splitting the initial trades into two subsequent EBBO trades
would have most probably been preferable for the retail investor, since the same
EBBO ask price remained 100 milliseconds after the trade. It is therefore difficult to
claim that trading immediately is in the interest of retail investors, when in practice
their trades do not impact prices and consuming fully the first limit and trading on the
second limit is detrimental to execution performance.
■ Lastly best execution for a retail trade differs from best execution in general: Best
execution is a question that can only been answered for a given type of flow. Best
execution means ensuring that the trades take place at the best price for the particular
type of flow in question. In the case of a retail trade, as market makers are inclined to
offer improved quotes to trade against uninformed investors. Even in cases where
trades match EBBO, this result cannot necessarily be considered as a proof of best
execution for a retail order.
17 | VBBO Trading: a best execution solution for Retail Investors or for Market Makers?
BEST EXECUTION SOLUTIONS FOR RETAIL ORDERS
Retail orders are less risky for market makers: Academics often refer to retail trades as
‘uninformed trades’. This notion characterises the fact that, unlike other institutional
orders which often form part of a larger order sliced into several executions, retail orders
do not generate the same market impact as institutional orders and are therefore much
less risky for market-makers.
Two main types of market model design provide price improvements for retail trades:
Because retail trades are less risky, market makers are keen to provide price improvement
for trading against retail flows and avoid adverse selection. Two types of market design
exist to serve this specific aim:
■ Market maker quotes for retail flow: The first solution is for Lit Markets to allow
market makers to post specific quotes that can only be executed by retail flows. This
way, market makers can compete against one another to attract retail flows and
competition ensures that retail investors will get the best price improvement that
market makers are willing to pay based on current market conditions. In order to
ensure best execution, retail brokers must rely on a smart order router that will
compare the best available quotes for retail investors.
■ Retail venues using reference price: In order to alleviate the burden for retail
investors of comparing prices available on different venues, retail venues have
emerged which offer prices based on a reference price, often portrayed by these
venues as the best available price. The use of a consolidated reference price is made
to convince retail investors that best execution will thus be enforced by construction.
In addition, these venues often offer lower execution fees than Lit venues, some even
proposing negative fees.
Academics often refer to retail trading as ‘cream-skimming’. They insist on the fact that
the price improvements should be passed on to final participants for this model to be
efficient. Structurally, as market makers cannot effectively compete on price in a
reference price model, it is not surprising that the improvements made by market makers
on their retail trading are not passed on to investors thanks to competition, but instead
kept by market makers (as shown earlier in the VBBO case).

CONTACTS
This publication is for information purposes only and is not a recommendation to engage in investment activities. This publication is provided “as is” without representation or warranty of any kind. Whilst all reasonable care has been taken to ensure the accuracy of the content, Euronext does not guarantee its accuracy or completeness. Euronext will not be held liable for any loss or damages of any nature ensuing from using, trusting or acting on information provided. No information set out or referred to in this publication shall form the basis of any contract. The creation of rights and obligations in respect of financial products that are traded on the exchanges operated by Euronext’s subsidiaries shall depend solely on the applicable rules of the market operator. All proprietary rights and interest in or connected with this publication shall vest in Euronext. No part of it may be redistributed or reproduced in any form without the prior written permission of Euronext. Euronext refers to Euronext N.V. and its affiliates. Information regarding trademarks and intellectual property rights of Euronext is located at www.euronext.com/terms-use
© 2020, Euronext N.V. - All rights reserved.
www.euronext.com
Paul Besson Head of Quantitative Research Email: [email protected] Tel: +33 1 70 48 26 36 / +33 6 22 47 10 95
Théo Compérot Quant Research Analyst Email: [email protected] Tel: +33 1 70 48 25 41 / +33 7 88 29 80 54