Embed Size (px)
Citation preview

Accepted Manuscript
Europa Planetary Protection for Juno Jupiter Orbiter
Douglas E. Bernard, Robert D. Abelson, Jennie R. Johannesen, Try Lam,
William J. McAlpine, Laura E. Newlin
PII: S0273-1177(13)00151-8
DOI: http://dx.doi.org/10.1016/j.asr.2013.03.015
Reference: JASR 11293
To appear in: Advances in Space Research
Received Date: 9 August 2012
Revised Date: 21 February 2013
Accepted Date: 3 March 2013
Please cite this article as: Bernard, D.E., Abelson, R.D., Johannesen, J.R., Lam, T., McAlpine, W.J., Newlin, L.E.,
Europa Planetary Protection for Juno Jupiter Orbiter, Advances in Space Research (2013), doi: http://dx.doi.org/
10.1016/j.asr.2013.03.015
This is a PDF file of an unedited manuscript that has been accepted for publication. As a service to our customers
we are providing this early version of the manuscript. The manuscript will undergo copyediting, typesetting, and
review of the resulting proof before it is published in its final form. Please note that during the production process
errors may be discovered which could affect the content, and all legal disclaimers that apply to the journal pertain.

1 2 3 4 5 6 7 8 9 10 11 12 13 14 15 16 17 18 19 20 21 22 23 24 25 26 27 28 29 30 31 32 33 34 35 36 37 38 39 40 41 42 43 44 45 46 47 48 49 50 51 52 53 54 55 56 57 58 59 60 61 62 63 64 65
Europa Planetary Protection for Juno Jupiter Orbiter Douglas E. Bernard, Robert D. Abelson, Jennie R. Johannesen, Try Lam, William J. McAlpine, and Laura E. Newlin Jet Propulsion Laboratory, California Institute of Technology, 4800 Oak Grove Drive, Pasadena, CA 91109, USA, [email protected], [email protected], [email protected], [email protected], [email protected], [email protected] © 2011 California Institute of Technology. Government sponsorship acknowledged. Abstract
NASA's Juno mission launched in 2011 and will explore Jupiter and its near environment starting in 2016. Planetary protection requirements for avoiding the contamination of Europa have been taken into account in the Juno mission design. In particular Juno's polar orbit, which enables scientific investigations of parts of Jupiter's environment never before visited, also greatly assist avoiding close flybys of Europa and the other Galilean satellites.
The science mission is designed to conclude with a deorbit burn that disposes of the spacecraft in Jupiter’s atmosphere. Compliance with planetary protection requirements is verified through a set of analyses including analysis of initial bioburden, analysis of the effect of bioburden reduction due to the space and Jovian radiation environments, probabilistic risk assessment of successful deorbit, Monte-Carlo orbit propagation, and bioburden reduction in the event of impact with an icy body.
1. Introduction
NASA’s next mission to the outer planets will send a spacecraft to Jupiter for a detailed scientific investigation of the planet itself. The Juno mission—named for the mythological wife of the Roman god Jupiter—was launched in 2011 and will arrive at Jupiter in 2016. Like the eponymous Roman Juno, the Juno mission is designed to figuratively brush away the clouds to learn about Jupiter’s true behavior. NASA’s New Frontiers Program selects among competing high-science-return Principal Investigator-led planetary science investigations. In 2005, NASA selected Juno as the second mission of this Program with Scott Bolton of Southwest Research Institute as the Principal Investigator. Juno is managed by the California Institute of Technology’s Jet Propulsion Laboratory (JPL).
Juno’s highly elliptical polar orbit and low perijove (above the cloud tops by about 7% of Jupiter’s radius) allow it to explore portions of the Jovian

1 2 3 4 5 6 7 8 9 10 11 12 13 14 15 16 17 18 19 20 21 22 23 24 25 26 27 28 29 30 31 32 33 34 35 36 37 38 39 40 41 42 43 44 45 46 47 48 49 50 51 52 53 54 55 56 57 58 59 60 61 62 63 64 65
2
environment never before visited. Its suite of instruments is designed to investigate the atmosphere, gravitational fields, magnetic fields, and auroral regions of Jupiter from this vantage point. This orbit also helps avoid or limit exposure to the most intense portion of Jupiter’s radiation belts. This limited radiation exposure, along with the low-power spacecraft and instrument design, make it possible for Juno to perform its observation using solar power – making it the first solar-powered mission to the outer planets.
The Juno mission is not orbiting or flying close to Europa or any other Galilean satellite – its polar orbit does not even bring it close to them. Nevertheless, planetary protection requirements for avoiding the contamination of Europa have been taken into account in the Juno mission design.
The science mission is designed to conclude with a deorbit burn that disposes of the spacecraft in Jupiter’s atmosphere. Compliance with planetary protection (PP) requirements is verified through a set of analyses including analysis of initial bioburden, analysis of the effect of bioburden reduction due to the space and Jovian radiation environments, probabilistic risk assessment of successful deorbit, Monte Carlo orbit propagation, and bioburden reduction due to impact with an icy body.
This paper discusses the Juno mission’s approach to meeting planetary protection requirements for missions in orbit at Jupiter. The approach that meets Europa planetary protection requirements easily meets planetary protection requirements for the other Galilean satellites, so this paper focuses on Europa.
2. Juno Overview
Juno is a science mission, so this overview starts with the science objectives. The mission design and spacecraft design are then outlined.
2.1. Science
The overall goal of the Juno mission is to improve our understanding of the solar system by understanding the origin and evolution of Jupiter. The science objectives for Juno are laid out in the New Frontiers Program Plan:
Atmospheric Composition: Juno investigates the formation and origin of Jupiter’s atmosphere and the potential migration of planets through the measurement of Jupiter’s global abundance of oxygen (water) and nitrogen (ammonia).
Atmospheric Structure: Juno investigates variations in Jupiter’s deep atmosphere related to meteorology, composition, temperature profiles, cloud opacity, and atmospheric dynamics.
Magnetic Field: Juno investigates the fine structure of Jupiter’s magnetic field, providing information on its internal structure and the nature of the dynamo.

1 2 3 4 5 6 7 8 9 10 11 12 13 14 15 16 17 18 19 20 21 22 23 24 25 26 27 28 29 30 31 32 33 34 35 36 37 38 39 40 41 42 43 44 45 46 47 48 49 50 51 52 53 54 55 56 57 58 59 60 61 62 63 64 65
3
Gravity Field: Gravity sounding by Juno explores the distribution of mass inside the planet.
Polar Magnetosphere: Juno explores Jupiter’s three-dimensional polar magnetosphere and aurorae.
The science objectives will be accomplished by a payload suite supporting 9
investigations: a magnetometer (MAG), a microwave radiometer (MWR), a gravity science experiment using the spacecraft’s X-band communications system plus a Ka-band translator, a plasma instrument with four sensors to measure electron and ion particle distributions (JADE), an energetic particle detector with three sensors (JEDI), a electromagnetic field sensor (Waves), an ultraviolet imaging spectrometer (UVS), an infrared imaging spectrometer (JIRAM), and an optical camera (JunoCam) (Matousek, 2005).
2.2. Interplanetary Trajectory
Juno was launched from Cape Canaveral Air Force Station in August 2011 on an Atlas V 551 launch vehicle. The Juno spacecraft interplanetary trajectory to Jupiter is shown in Figure 1. After separation of the spacecraft from the launch vehicle, the flight system (spacecraft) began an almost 5-year cruise phase to Jupiter with two Deep Space Maneuvers (DSM) roughly at aphelion (~ 1 year after launch), and an Earth flyby (EFB) at 500 km altitude, 26 months after launch. The spacecraft will arrive at Jupiter in July 2016. Interplanetary cruise concludes with a Jupiter Orbit Insertion (JOI) burn that places Juno into a polar 107-day capture orbit around Jupiter.
Only the spacecraft and the upper stage escape Earth orbit. Earth and Jupiter are the only solar system bodies encountered—at no time does the spacecraft come closer than 1.6 AU to Mars.
2.3. Orbital Mission
At Jupiter, Juno’s initial 107-day capture orbit and its ~11-day science orbits are all polar orbits, allowing unprecedented views of the North and South polar regions and in-situ measurements at all latitudes. See Figure 2. The red circles in Figure 2 represent the orbits of Io, Europa, Ganymede, and Callisto (in increasing distance from Jupiter). The Period Reduction Maneuver (PRM) at the end of the capture orbit sets up the 10.9725-day orbit that keeps each successive perijove (PJ) visible at the Goldstone Deep Space Network (DSN) complex in California. This timing is necessary so that mapping of the gravity field at Jupiter may be done using X-band and the Ka-band uplink/downlink capability at that complex. The precise timing of the orbit period is achieved by an Orbit Trim Maneuver (OTM) scheduled 4 hours after each perijove; this enables the equator crossings to be equally spaced with respect to each other. Following the full set of science orbits plus one spare orbit, the spacecraft will perform a deorbit maneuver near apojove of the last orbit to impact Jupiter,

1 2 3 4 5 6 7 8 9 10 11 12 13 14 15 16 17 18 19 20 21 22 23 24 25 26 27 28 29 30 31 32 33 34 35 36 37 38 39 40 41 42 43 44 45 46 47 48 49 50 51 52 53 54 55 56 57 58 59 60 61 62 63 64 65
4
thereby ending the mission and providing continued avoidance of the Galilean satellites as required for planetary protection.
2.4. Juno Flight System
The Juno spacecraft is shown in Figure 3. The most prominent features are the three solar array (SA) wings. Two wings have four solar panels each and the third has three solar panels plus a magnetometer boom. The magnetometer boom is the home for MAG investigation sensors that include Fluxgate Magnetometers (FGM) and the Advanced Stellar Compass (ASC) optical heads.
Figure 4 provides close-up views of the central core of the spacecraft. Of particular interest from a planetary protection viewpoint are the Stellar Reference Unit (SRU) Optical Heads and the electronics vault. In Figure 4, the electronics vault is situated beneath the High Gain Antenna (HGA). In addition to sensors for Instruments mentioned above, this view also shows the Medium Gain Antenna (MGA), the Fore Low Gain Antenna (FLGA), and the Reaction Control System Rocket Engine Modules (RCS REM).
The vault walls are solid titanium and the electronics boxes are packed fairly closely together to allow each box to help shield its neighbors from radiation. The Inertial Measurement Units (IMUs) and SRU electronics are the most heavily shielded units inside the vault.
3. Europa Planetary Protection requirements
The Planetary Protection requirements and goals for Juno address Mars, Io, Europa, Ganymede, and Callisto. This paper addresses the most difficult requirements: Europa planetary protection. NASA has defined three Europa-related planetary protection requirements for the Juno mission (Newlin 2008). They are (paraphrased):
1. Keep the probability of Europa impacts during the prime Juno mission less than 1x10⁻⁴;
2. Provide an end-of-mission plan that addresses disposition of the spacecraft and ensures continued avoidance of Galilean satellite impact after the mission has completed its observations;
3. Demonstrate that the probability of contamination of an Europan ocean is less than 1x10⁻⁴, taking into account the possibility of an unsuccessful deorbit burn.
The first requirement is met by a mission design that avoids close flybys of Europa. The second requirement is met by the inclusion of a deorbit burn at the end of the science mission.

1 2 3 4 5 6 7 8 9 10 11 12 13 14 15 16 17 18 19 20 21 22 23 24 25 26 27 28 29 30 31 32 33 34 35 36 37 38 39 40 41 42 43 44 45 46 47 48 49 50 51 52 53 54 55 56 57 58 59 60 61 62 63 64 65
5
The third requirement has required much deeper analysis than the other two and is the subject of this paper. For contamination of the Europan ocean to occur, the following low probability events would all need to occur:
1. A spacecraft failure prevents it from being able to successfully complete the deorbit maneuver;
2. A failed spacecraft impacts the Europan surface prior to radiation sterilization (7 Mrad);
3. Microbes survive the impact long enough to contaminate the ocean.
Each of these will be considered in turn below.
4. Juno PP Approach
Juno’s meets its planetary protection requirements through design of the trajectory, sterilization in the Jupiter environment, and sterilization by impact.
4.1. Trajectory Design
Note that Juno’s science objectives are all related to the planet Jupiter. There are no science objectives related to the moons of Jupiter and Juno’s trajectory is designed to avoid—rather than encounter—the Galilean satellites. In addition, the Jupiter mission design includes an end-of-mission deorbit burn that targets disposal of Juno in Jupiter’s atmosphere.
Based on the above, the Juno mission, operating as designed, will not impact any Galilean satellites. Therefore, in order to completely assess the Juno mission’s compliance with planetary protection (PP) requirements, an analysis of Juno failure modes and implications is also required.
Juno’s interplanetary trajectory has been analyzed to determine the probability of impact in the event that a failure in cruise prevents later re-targeting. The Europa impact probabilities are negligible—and the Juno spacecraft would fly by the Jupiter system without going into orbit.
In addition, Juno’s Jupiter orbit trajectory has been analyzed to determine the probability of impact in the event that a failure in orbit prevents later re-targeting. The Europa impact probabilities during the Juno science mission are also negligible.
The more interesting analysis assesses the probability of spacecraft-Europa impact following the planned deorbit maneuver in the event that the spacecraft is in Jupiter orbit but is unable to perform the planned deorbit maneuver.
1 2 3 4 5 6 7 8 9 10 11 12 13 14 15 16 17 18 19 20 21 22 23 24 25 26 27 28 29 30 31 32 33 34 35 36 37 38 39 40 41 42 43 44 45 46 47 48 49 50 51 52 53 54 55 56 57 58 59 60 61 62 63 64 65
6
For the discussion of spacecraft reliability and the probability of spacecraft failure, see Section 5. For a discussion of the probability of Europa impact given a spacecraft failure, see Section 6.
4.2. Space Environmental effects
Several aspects of the space environment are lethal to some organisms and prevent others from repairing radiation damage.
Jupiter’s radiation environment is much more intense than the radiation environment at the Earth (or any other planet in our solar system). Although Juno’s orbit is designed to avoid the worst of the radiation during the mission, the orbit naturally evolves in such a manner that there would be a much higher radiation dose per orbit for times after the planned deorbit burn. For a discussion of the orbit evolution if the deorbit burn is not successful, see Section 6. For a discussion of the radiation environment for Juno components in that eventuality, see Section 7.
About half of the solar power harvested by the solar panels is used for heaters at Jupiter. This means that after a complete spacecraft failure, the heaters would cease functioning and spacecraft components would experience much colder temperatures than they do on a working spacecraft. A failure that left Juno uncommandable would terminate the periodic commanded precessions that keep the solar arrays pointed at the sun. Within a few years as Jupiter continues to orbit the sun, the solar arrays would be expected to be pointed so far from the sun that the electrical power to the vehicle would be lost and never recovered. And that is generously assuming that the spacecraft would survive for years without ground commanding. Thermal analysis of the Juno spacecraft with no internal power dissipation predicts steady state temperatures in the -110 C to -170 C range.
The estimated initial bioburden and the combined effects of vacuum, radiation, and cold on micro-organisms are discussed in Section 8. Section 8 also shows a high likelihood that complete sterilization is achieved after 150 years in Jupiter orbit. However, Juno is using a 400 year time to sterility (corresponding to 7 Mrad) in order to demonstrate compliance to NASA PP requirements.
4.3. Sterilization due to impact Impact of Juno into Europa does not imply contamination of the Europan
ocean. Because Juno would be impacting from Jupiter orbit, in almost all cases the impact would be at a speed greater than 20 km/s. In addition, an impact would be a surface impact and would not penetrate the thick Europan ice. Contamination of the Europan ocean would require surface contamination followed by the transfer of viable micro-organisms to the deeply buried ocean.

1 2 3 4 5 6 7 8 9 10 11 12 13 14 15 16 17 18 19 20 21 22 23 24 25 26 27 28 29 30 31 32 33 34 35 36 37 38 39 40 41 42 43 44 45 46 47 48 49 50 51 52 53 54 55 56 57 58 59 60 61 62 63 64 65
7
Section 9 analyzes the physics of such an impact and discusses the likelihood of microbe survival.
5. Spacecraft Reliability
Juno has performed a limited-scope probabilistic risk assessment (PRA) to quantify the reliability of the Juno spacecraft and its ability to successfully deorbit at the end of the mission. PRA is a systematic and comprehensive methodology used to numerically evaluate the risks associated with complex systems, and is widely used in the nuclear and aircraft industries. The use of PRA for NASA robotic spacecraft missions has previously been limited, and thus a combination of standard tools and techniques, along with new approaches and reliability models, was used for Juno.
The scope of the Juno PRA was limited to those spacecraft components required for deorbit whose failure could result in the spacecraft being unable to perform its deorbit maneuver. The PRA modeled the entire mission duration, from launch to end-of-mission (EOM), in order to account for any partial spacecraft failures that might occur during Cruise and JOI (potentially resulting in a less than fully functional spacecraft reaching Jupiter). However, the interval of interest for assessing compliance with Europa Planetary Protection requirements is the ~15 month period between JOI and End-of-Mission (EOM). Critical spacecraft failures occurring earlier in the mission (e.g., launch, cruise, or JOI) would prevent Juno from achieving JOI, thus mitigating the Europa impact threat.
The spacecraft subsystems analyzed included:
Electrical Power System (EPS)
Guidance, Navigation, and Control (GNC)
Command and Data Handling (C&DH)
Telecommunications (Telecom)
Thermal Control System (TCS)
Propulsion (Prop)
For each of the subsystems above, the critical components required for spacecraft operations and control between JOI and deorbit were identified, along with the profile of how they were to be used (i.e., number of power on-off cycles, exposure durations, etc.). Additionally, spacecraft component redundancy and cross strapping were also included in the PRA.
In addition to spacecraft hardware components, the reliability of system-level interactions was modeled, including the contributions of software and mission operations. Analysis of previous mission failures had identified these as potential risk drivers for robotic missions in general. As there was no existing approach to estimating this risk for JPL robotic missions, Juno developed a novel approach based on heritage mission data and Juno’s specific operating profile.

1 2 3 4 5 6 7 8 9 10 11 12 13 14 15 16 17 18 19 20 21 22 23 24 25 26 27 28 29 30 31 32 33 34 35 36 37 38 39 40 41 42 43 44 45 46 47 48 49 50 51 52 53 54 55 56 57 58 59 60 61 62 63 64 65
8
Lastly, micrometeoroids were explicitly accounted for in the spacecraft reliability model.
The PRA methodology is typically used to compare relative risks between options. The numerical results are usually skewed to the conservative side, particularly when there is limited flight data available for evaluation. Results of the PRA indicate a 95% probability of successfully performing the deorbit maneuver at end of mission. The key risk drivers are the spacecraft C&DH/power subsystems (~2.8% failure probability per the PRA methodology), and systems-level interactions (~2% failure probability, extrapolating from historical in-flight anomaly data). The risk contribution from micrometeoroids and other spacecraft subsystems is small relative to the above risk drivers.
There is additional conservatism in the above PRA results in that many mitigations options were identified but not included in the reliability model. These mitigations include operating the spacecraft in a degraded mode (the model currently assumes a part either works or doesn’t work) and attempting recovery of a ―failed‖ component. Had these mitigations been included in the reliability model, they would have further increased the probability of successfully deorbiting the spacecraft.
Given this PRA-based estimate of a 5% chance of failing to perform the deorbit burn, we turn our attention to the mission design and the possibility of Europa impact in that eventuality.
6. Mission Design Throughout this section, the term RJ represents one Jupiter Radius. So, for example, 5 RJ is a non-dimensional distance equal to 5 Jupiter radii.
6.1. Jupiter approach
There is negligible probability of impacting Europa during the Jupiter approach phase. Five maneuvers are used to set up the Jupiter arrival conditions. The first of these, at Earth flyby + 10 days, has the largest uncertainty in position and timing (5 RJ and 2 hours), but even this 3-sigma uncertainty is much less than the orbital range of Europa at 9.4 RJ. If no additional maneuvers were possible, the spacecraft would not impact Europa. Additional maneuvers at Earth + 6 months and JOI - 6 months reduce the uncertainty to the order of 0.1 RJ and 2 minutes, while maneuvers at JOI - 35 days and JOI - 9 days refine the targeting to further reduce uncertainties by another factor of 10, to 0.01 RJ and 14 seconds. Additionally, if JOI did not occur for some reason, the spacecraft would pass by Jupiter on a polar trajectory with a perijove altitude of about 0.1 RJ and would not be captured with respect to Jupiter.
6.2. Polar orbit

1 2 3 4 5 6 7 8 9 10 11 12 13 14 15 16 17 18 19 20 21 22 23 24 25 26 27 28 29 30 31 32 33 34 35 36 37 38 39 40 41 42 43 44 45 46 47 48 49 50 51 52 53 54 55 56 57 58 59 60 61 62 63 64 65
9
One key feature of the orbital design that greatly reduces the probability of
impact with the Galilean satellites is that the Juno orbit is polar (90º inclination), while the satellites orbit in the plane of Jupiter’s equator. A spacecraft in an equatorial orbit with comparable perijove and apojove ranges (< 0.1 RJ x 38.8 RJ) would cross the orbits of the Galilean satellites twice on each orbit, since the orbit ranges for the Galilean satellites (Io: 5.9 RJ, Europa: 9.3 RJ, Ganymede: 15.0 RJ, Callisto: 26.3 RJ) are less than the apojove range. As a consequence, a spacecraft in an equatorial orbit could have its orbit greatly perturbed if it crossed a satellite orbit when the satellite was nearby, or it might even impact the satellite. Because Juno is in a polar orbit, it cannot encounter the Galilean satellites except when crossing the equatorial plane, and therefore, its trajectory maintains an orbital shape throughout the mission. In addition the crossing of the equatorial plane just after perijove occurs at a range < 0.1 RJ (well away from Galilean satellites), so there is only one possibility per orbit of impacting a satellite, when crossing the equatorial plane on approach to perijove (i.e., at the ascending node).
6.3. Apsidal rotation
At the beginning of Juno’s mission, the perijove latitude is about 3 deg (north) while the apojove position is slightly below the equatorial plane. Juno’s ascending-node equatorial crossing (traversing from apojove to the next perijove and ascending from below the equatorial plane to above the plane) is initially at a very large distance (160 RJ) on the capture orbit and near 37 RJ early in the 11-day orbits. Because Jupiter’s shape is markedly oblate, the trajectory undergoes a rotation of the line of apsides (the imaginary line through Jupiter between perijove and apojove locations). The apsidal rotation is about –0.95 deg per orbit, causing more northerly latitudes at perijove and causing the ascending nodal range to move closer to Jupiter. This crossing of the equator on approach to the next perijove provides the only opportunity for Juno to impact a satellite. The apsidal rotation also causes the spacecraft to enter more severe radiation areas as the mission evolves.
Near the end of mission, the perijove latitude reaches about 34 deg north, while the ascending node range decreases to just under Europa’s orbital range. Figure 5 shows that Callisto’s orbit is crossed near orbit 12, Ganymede’s orbit is crossed between orbits 23 and 24, and Europa’s orbit is crossed on orbit 34 (the final ascending node between deorbit and Jupiter impact). The selection of PRM date (when 11-day orbits are established) greatly influences the proximity of the satellites at the ascending node crossings. The choice of October 19, 2016 as the PRM date provides good separation between Juno near equatorial crossings and the individual Galilean satellite positions throughout the orbital mission. This is true even at the final equatorial crossing, where the separation of Juno and Europa is about 10 hours.

1 2 3 4 5 6 7 8 9 10 11 12 13 14 15 16 17 18 19 20 21 22 23 24 25 26 27 28 29 30 31 32 33 34 35 36 37 38 39 40 41 42 43 44 45 46 47 48 49 50 51 52 53 54 55 56 57 58 59 60 61 62 63 64 65
10
Fairly distant satellite encounters cause some perturbations to the Juno trajectory. These perturbations behave as a small gravity assist delta-V, much as Juno’s flyby of the Earth produced a (much larger) gravity assist delta-V for the trajectory. The perturbations affect the orbit inclination and the orbit period (related to perijove altitude). Ganymede and Callisto, because of their larger sizes, have more influence on the trajectory and cause larger altitude variations than do Europa and Io. Callisto, at 240,000 km range (orbit 4) and 170,000 km range (orbit 7), causes drops in the perijove altitude of about 400 km. The figure also shows that the close approaches with Ganymede and Callisto (and Europa) do not occur near the equatorial crossings at the ascending node. This is also a consequence of the choice of the PRM date.
The orbit trim maneuvers (OTMs) at PJ+4hrs target the spacecraft to the proper equator-crossing longitude at the descending node of the following orbit (for the magnetic field investigation), and they help dampen the effect of the satellite flybys by maintaining the orbital period. These OTMs range in size from 0.1 m/s to about 3 m/s, with a total of about 40 m/s needed for OTMs for the entire orbital mission. The orbit inclination is not controlled and changes by only a few degrees over the course of the mission.
The nominal mission plan calls for Juno to deorbit into Jupiter on PJ34 (October 16, 2017), after 33 11-day orbits. This is accomplished by making a burn on the RCS thrusters at apojove to reduce the perijove altitude to a subsurface value. The current design uses –700 km as the target perijove altitude.
If deorbit is not possible because of spacecraft failure, an analysis of the propagated trajectory shows that the apsidal rotation continues with the orbit remaining basically polar and with similar orbit period and shape. Figure 6 shows this apsidal rotation behavior. The location of the equator crossing (where satellite impact could occur) switches twice between inbound and outbound legs with respect to perijove before 360 deg of apsidal rotation causes the pattern to repeat. The full cycle of rotation takes about 12 years, which is about the same as the period of Jupiter around the sun. During that period of time, the perijove altitude rises and falls, with the possibility of impact with Jupiter for low perijove altitudes.
A Monte Carlo analysis was undertaken to determine the probability of impact with Europa (and with Jupiter and other Galilean satellites) if deorbit were not possible. This analysis (Lam, et al., 2008) included sampling uncertainties in spacecraft state, satellite ephemeris, and Jupiter’s spherical harmonics, and was performed on supercomputers using JPL’s Mission analysis and Operational Navigation Toolkit Environment (MONTE) software. An atmospheric model adapted from one provided by Sushil Atreya of the University of Michigan was used to provide the basis for drag modeling. Solar radiation pressure modeling was also included. Figure 7 shows the results of a total of 4000 cases, each propagated for 300 years. The probability of impact with Europa over 150 years

1 2 3 4 5 6 7 8 9 10 11 12 13 14 15 16 17 18 19 20 21 22 23 24 25 26 27 28 29 30 31 32 33 34 35 36 37 38 39 40 41 42 43 44 45 46 47 48 49 50 51 52 53 54 55 56 57 58 59 60 61 62 63 64 65
11
for a failed deorbit is 0.81% ± 0.28% (2-sigma uncertainty). During this period, 3/5 of the trajectories impacted Jupiter and about another 1/3 had no impacts with Europa or any other Galilean satellite.
In addition to looking at impact probabilities for the failed deorbit case, a more complete impact probability analysis was performed for failure anywhere along the nominal mission while in orbit around Jupiter. Here, the apojove state at each orbit was sampled and included with uncertainties in satellite ephemeris and Jupiter spherical harmonics. Atmospheric drag and solar radiation pressure modeling were also included. The results of propagation of 4000 trajectories per apojove for 400 years are shown in Figure 8 on an individual orbit basis and in Table 1, where the impact probabilities for all orbits were averaged. For 150 years the average percentage of Europa impacts was 0.51% ± 0.04% (2-sigma uncertainty). For 400 years, the average percentage of Europa impacts grew to 1.06% when weighting each orbit equally. In will be shown in Section 10 that the average percentage of Europa impacts over 400 years is 0.93% when weighting each orbit by the probability of failure in that orbit.
7. Radiation
Bioburden within the Juno spacecraft will decrease over time once in Jupiter orbit due to increasing radiation exposure from magnetically trapped high-energy electrons and protons around Jupiter. The Juno spacecraft will be exposed to these high-energy particles once per orbit, from Jupiter Orbit Insertion (JOI) to the nominal end of mission at Jupiter orbit 33, as shown in Figure 9
In the very unlikely scenario that the spacecraft cannot perform the deorbit burn, analyses were performed to calculate the long-term radiation exposure to the Juno spacecraft as an input into the bioburden reduction analyses. The computation of the radiation exposure to the Juno spacecraft over long time durations were determined by first propagating the spacecraft trajectory over one complete period of apsidal rotation around Jupiter (approximately 12 years). The spacecraft orbit trajectory over 12 years was integrated with the Jovian trapped radiation models to yield the external charged particle environment expected over one apsidal rotation period. Charged particles will deposit energy, primarily through ionization, as they interact with the Juno spacecraft materials. The deposited energy (henceforth called total ionizing dose (TID)) is dependent on energy spectra and species of the external charged particle environment, the thickness and composition of the material that is traversed between the external environment (henceforth called shielding), and the composition of the absorbing material. A dose depth curve, Figure 10, is often used to show how the energy deposited by the external environment is attenuated by shielding material. The TID in water is expressed in terms of rad (water) as a function of aluminum shield thickness. Radiation exposure in rad (water) is used in the bioburden calculations.

1 2 3 4 5 6 7 8 9 10 11 12 13 14 15 16 17 18 19 20 21 22 23 24 25 26 27 28 29 30 31 32 33 34 35 36 37 38 39 40 41 42 43 44 45 46 47 48 49 50 51 52 53 54 55 56 57 58 59 60 61 62 63 64 65
12
A dose depth curve, while useful for generating rough estimates of TID, is of limited usefulness when complex shielding configurations and numerous different materials are used in spacecraft construction. For these types of complex spacecraft shielding configurations and multiple construction materials, radiation transport codes are used to determine the total ionizing dose at specific locations within the spacecraft. For the Juno project, the NOVICE radiation transport code was used to calculate radiation exposures in materials, electronic parts, and sensors throughout the spacecraft for the 33-orbit mission. The mechanical configuration of the spacecraft, instruments, and electronics units used in the radiation exposure calculations were generated using CAD models, and contain mechanical information down to the electronic part and circuit card level, as shown in Figure 11. The flat planar structures in Figure 11 are circuit boards populated with electronic devices. The composition and density of materials used in unit construction and surrounding spacecraft structure are used in dose calculations at the electronic components on the circuit boards. Similar models were used to generate the dose input to bioburden reduction calculations for all electronics boxes and spacecraft structure.
The same mechanical models and radiation transport code that were used to calculate doses for electronic devices, materials, and sensors were used to calculate doses in water at several points within each electronics unit and within structural elements on the spacecraft for one complete apsidal rotation. For each electronics unit, the best-protected point in the box was used to determine the amount of shielding surrounding the entire box volume. Assuming that the maximum shielding is present over the entire volume of each electronics unit provides a worst case bound for bioburden reduction calculations.
All spacecraft electronics units and spacecraft structure elements were then grouped by shielding thickness into different zones. The average annual dose for each of the units was derived by dividing the dose accumulated over one 12-year apsidal rotation by 12 years. The most heavily shielded electronics within the Juno spacecraft are listed in Table 2. Assuming sterilization at 7 Mrad, note that the last item sterilized will be the SRU optical head – at about 400 years. These electronics units have significantly more shielding than the rest of the spacecraft to protect sensitive electronics parts from the charged particle environment. These are also the units that would have the lowest annual doses available for bioburden reduction.
8. Bioburden
8.1. Approach To determine the time to spacecraft sterility, Juno is using 7 Mrad as the
threshold dose value as clarified by the NASA Planetary Protection Office (Conley, 2011, personal communication). This value is independent of initial bioburden and spacecraft temperature.

1 2 3 4 5 6 7 8 9 10 11 12 13 14 15 16 17 18 19 20 21 22 23 24 25 26 27 28 29 30 31 32 33 34 35 36 37 38 39 40 41 42 43 44 45 46 47 48 49 50 51 52 53 54 55 56 57 58 59 60 61 62 63 64 65
13
In addition to using a 7 Mrad threshold value, Juno performed a detailed bioburden assessment to determine the time for the bioburden population to be reduced to non-reproducible levels (0.1 organisms). The remainder of this section details this approach, which yielded <150 years to sterility were the spacecraft to fail in any of Juno’s 11-day science orbits, and <1500 years were the spacecraft to fail in the capture orbit.
The estimation of spacecraft bioburden and time to sterility in the Jovian radiation environment must consider the number of organisms on the spacecraft at launch as a function of location; the radiation sensitivities of the various organisms likely to be present on the spacecraft at launch; the sensitivities of the various organisms to the deep space environment experienced during cruise; and the total ionizing dose of radiation expected over time for various spacecraft locations (discussed in Section 7).
The spacecraft bioburden or total number of microorganisms at launch, was estimated by considering the spore bioburden specifications in NPR 8020.12C (NASA, 2005) and historical spore bioburden information from past Mars missions; reviewing Appendix A of the SSB Report (Space Studies Board, 2000) for their non-spore-forming organism population assumptions; reviewing the work done by the JIMO project (Kohlhase, 2004) for their microorganism population assumptions; and by using Mars Reconnaissance Orbiter (MRO) historical bioburden information, where applicable, for Juno’s MRO heritage hardware. Focus was placed on the hardware with the best protection from the Jovian radiation environment. As shown in Table 2, the best-protected hardware components are the SRU Optical Heads, followed by the IMUs and the SRU electronics modules. As will be discussed below, the SRU optical heads would be the last items sterilized if Juno were to remain in Jupiter orbit.
To determine the radiation sensitivities of organisms, the Juno project performed a literature search for radiation sensitivity data; reviewed Appendix A of the Space Studies Board (SSB) Report, Preventing the Forward Contamination of Europa (Space Studies Board, 2000) for the SSB’s radiation sensitivity assumptions; and reviewed work done by the JIMO project (Kohlhase, 2004) for its radiation sensitivity assumptions.
The microbial responses to low water activity (Grant, 2004) and to low temperatures (Price, 2004) were investigated. The spacecraft bioburden was then reduced based upon those sensitivities and on the survivability in deep space assumptions stated in Appendix A of the SSB Report (Space Studies Board, 2000).
8.2. Parameter Specifications and Assumptions
8.2.1. Planetary Protection Parameter Specifications The following PP Parameter Specifications of NPR 8020.12C (NASA, 2005)
have been used in the bioburden estimation:

1 2 3 4 5 6 7 8 9 10 11 12 13 14 15 16 17 18 19 20 21 22 23 24 25 26 27 28 29 30 31 32 33 34 35 36 37 38 39 40 41 42 43 44 45 46 47 48 49 50 51 52 53 54 55 56 57 58 59 60 61 62 63 64 65
14
Time-Temperature for Sterility: A surface, the temperature of which exceeds 500°C for more than 0.5 seconds, may be considered sterile (bioburden equal to zero).
D Value, Z Value: Dry heat microbial reduction at a relative humidity less than 25% (referenced to 0°C and 1 atmosphere) for spores has a D value at 125°C (i.e., the time for a reduction by 10 at that temperature) of 0.5 hour for free surfaces, 1 hour for mated surfaces, and 5 hours for encapsulated non-metallic material, and a Z value of 21°C (i.e., the change in temperature for a factor of 10 change in the D value), on the temperature interval 104°C to 125°C.
Hardy Organisms: The maximum reduction factor that may be taken for dry heat microbial reduction is 10–4. (This parameter specification is based on an assumed fraction of ―hardies‖ of 10–3 and a reduction of only one order of magnitude in a nominal sterilization cycle.)
Surface Microbial Density: Various parameter specifications permitted for surface burden estimates: 1 x 10⁵ spores/m2 for uncontrolled manufacturing; 1 x 10⁴ spores/m2 for class 100,000 clean room with normal controls; 1 x 10³ spores/m2 for class 100,000 clean room with stringent controls. Surface density for vegetative microorganisms is 10 times the surface density for spores.
Encapsulated Microbial Density: Various parameter specifications permitted for encapsulated burden estimates (in non-metallic materials): average 130 cm-3, specific to electronic parts, 3-150 cm-3; and specific to other non-metallic materials, 1-30 cm-3.
8.2.2. Planetary Protection Parameter Assumptions The following parameter assumptions were used in the bioburden estimation:
Microbial Population: The SSB Europa Report (Space Studies Board, 2000) suggests that the microbial population of a spacecraft be described by four types of organisms, as shown in Table 3. The SSB also made an estimate of the fraction of each type of organism within the total population. Later, the JIMO project proposed alternative fractions of each type of organism (Kohlhase, 2004) and then further defined four disjoint population sets based on the four types of organisms of the SSB report, as shown in Table 4. The Juno project has adopted the use of these disjoint groups and associated population fractions. Table 4 also cites the source of the radiation survival curves to be used by the Juno project.
Microbial Abundance: It was conservatively assumed that laboratory cultivation by the NASA Standard Assay (NASA, pending), underestimates actual microbial abundance by a factor of 1,000 for each type of microbial subpopulation (Space Studies Board, 2000).
1 2 3 4 5 6 7 8 9 10 11 12 13 14 15 16 17 18 19 20 21 22 23 24 25 26 27 28 29 30 31 32 33 34 35 36 37 38 39 40 41 42 43 44 45 46 47 48 49 50 51 52 53 54 55 56 57 58 59 60 61 62 63 64 65
15
Encapsulated Microbial Density: It was assumed that the encapsulated density for vegetative microorganisms is 5 times the encapsulated density for spores (Newlin, 2008).
Exposure to ultrahigh vacuum of deep space: It was assumed that exposure to the ultrahigh vacuum of deep space has the following effect on the microbial population (Space Studies Board, 2000): (i) the bacterial spores of Types B and C are known to be generally resistant to high vacuum, so no reduction credit should be taken; (ii) the vegetative cells of Type A are often susceptible to inactivation by extreme vacuum, so a survival fraction of 0.1 will be assumed; (iii) some of the radiation-resistant vegetative cells of Type D are highly resistant to desiccation and others are not, so a survival fraction of 0.5 will be assumed. These are conservative assumptions, as illustrated by work done by Gerda Horneck of DLR and others (e.g., (Hornek, 1993), (Mileikowsky, 2000), and (Saffary, 2002)).
Exposure to water activity below 0.2: Water activity, aw, is defined as the ratio of vapor pressure of water in the substance to the vapor pressure of pure water at the same temperature. For the Juno spacecraft hardware in deep space, aw values will vary from 10–17 to 10–15 depending on the temperature. It was conservatively assumed that the exposure to water activity below 0.2 will cause the radiation-resistant non-spore-formers to be unable to repair radiation damage (Grant, 2004), so Group 4 will be treated as Group 1.
Exposure to extreme cold of deep space: It will be conservatively assumed that the exposure to the extreme cold of deep space, temperatures below –80 C (193 K) will cause the radiation resistant non-spore-formers to be unable to repair radiation damage (Price, 2004), so Group 4 organisms at this temperature (i.e., in/on a non-operational spacecraft at Jupiter) will be treated as Group 1.
8.2.3. Other Assumptions and Considerations The following additional assumptions were made, and considerations used,
during the bioburden estimation:
Spacecraft components are to be developed and assembled in a class 100K clean room or better;
Hardware exterior surfaces are alcohol wiped to class 100K typical cleanliness;
MRO heritage bioburden densities (based on actual bioassays and manufacturing conditions/processes), surface areas, and volumes were used where appropriate;
Radiation levels used in calculations are the minimums for each module;
SRU Electronics Module assumptions: o Surface area of internal surfaces of module is 10 times the external
surface area of the module; o Board volume 50% of module volume;

1 2 3 4 5 6 7 8 9 10 11 12 13 14 15 16 17 18 19 20 21 22 23 24 25 26 27 28 29 30 31 32 33 34 35 36 37 38 39 40 41 42 43 44 45 46 47 48 49 50 51 52 53 54 55 56 57 58 59 60 61 62 63 64 65
16
o Three orders of magnitude reduction in spores due to cure of component boards and no vegetative organisms;
o Juno is not taking any credit for bioburden reductions due to manufacture or burn-in of electronic components.
8.3. Initial Microorganism Populations Initial microorganism population densities were developed based on the
parameters, assumptions, and considerations listed above. Table 5 summarizes the population densities by Type. Table 5 starts with organisms culturable by the NASA Standard Assay (NASA, pending) present at launch. Then the densities for the culturable organisms are scaled (up) to include all organisms that are present at launch. Finally the densities are adjusted for space effects to summarize the total number of organisms at JOI. The initial microorganism populations for Jupiter orbit are established by combining the population densities at JOI with the surface areas and non-metallic material volumes for the components of interest. This data by type is the starting point for developing population densities by group using the set relations in Table 4.
8.4. Time to Sterilization The time to sterilization is estimated by applying the radiation dose for each
component and the radiation sensitivities for each Group (see Section 8.2.2), to the number of organisms for each Group in each component. Table 6 provides the microorganism survival fraction for each component by Group as a function of years after launch. Table 7 provides the number of surviving microorganisms for each component by Group, also as a function of years after launch. The time to sterility is predicted to be 126 years, and is dependent on the microorganisms of Groups 2 and 3 in the SRU optical heads.
As previously mentioned, Juno is using a 400 year time to sterility (corresponding to 7 Mrad) in order to demonstrate compliance to NASA PP requirements for the 11-day orbits (4000 years is used for the capture orbit).
9. Impact Analysis
Previous Sections addressed the reliability of the spacecraft, the low probability of Europa impact even if the deorbit maneuver is unsuccessful, and the rate of microbial sterilization in the low-temperature, high radiation environment that Juno would be in after a failure.
This Section explores the question of the likelihood of microbe survival if Juno were to impact Europa prior to sterilization.
9.1. Impact Geometry

1 2 3 4 5 6 7 8 9 10 11 12 13 14 15 16 17 18 19 20 21 22 23 24 25 26 27 28 29 30 31 32 33 34 35 36 37 38 39 40 41 42 43 44 45 46 47 48 49 50 51 52 53 54 55 56 57 58 59 60 61 62 63 64 65
17
Section 6 described the Monte Carlo analysis that was used to determine the probability of Europa impact. This same analysis can be used to understand the statistics related to the dynamics of the impact; both impact velocity and impact angle are important. In the development that follows, some situations are not analyzed, and since there is adequate margin against the requirement, Juno takes the very conservative position of assuming surface contamination in all un-analyzed situations.
Over a collection of Monte Carlo runs, all 220 instances of Europa impact were analyzed to understand the impact velocity and geometry. Figure 12 shows the cumulative distribution function of impact velocity. Note that the impact velocity is typically around 22 km/s and that only 1% of the cases have an impact velocity of less than 20.8 km/s. Higher impact velocities give greater likelihood of sterilization, so to simplify the analysis, the Juno Project adopts 20.8 km/s as the impact velocity and assumes that surface contamination occurs for the 1% of cases where the impact velocity is less that 20.8 km/s.
These same 220 cases were also analyzed to understand the distribution of impact angle. The angle of obliquity is defined to be 0° for a normal impact and 90° for a grazing impact. The distribution of angle of obliquity for this sample is shown in Figure 13. Note that 7% of the cases have obliquity greater than 75° and only 2% have obliquity higher than 80°. Since the analysis becomes more difficult for higher obliquity cases, Juno does not analyze cases with obliquity higher than 80°. Instead, the conservative assumption is made that surface contamination is possible for obliquity higher than 80°.
9.2. Assumptions on Sterilization
Before analyzing the impact, the Juno Project established criteria to determine if microbes should be assumed to have been killed or sterilized by the conditions of impact. The criteria in Table 8 are used:
Note that if the substrate on which the microbe is located is merely fragmented by the hypervelocity shock of impact (but not vaporized or liquefied), the microbe is conservatively assumed to have survived and the analysis continues.
9.3. Impact Analysis
The analysis of high energy/ high velocity impacts is a specialized field of study. To gain access to state-of-the-art analytical tools, the Juno Project contracted with Steve Hancock of Foils Engineering. At Juno’s direction, Mr. Hancock analyzed:

1 2 3 4 5 6 7 8 9 10 11 12 13 14 15 16 17 18 19 20 21 22 23 24 25 26 27 28 29 30 31 32 33 34 35 36 37 38 39 40 41 42 43 44 45 46 47 48 49 50 51 52 53 54 55 56 57 58 59 60 61 62 63 64 65
18
Spacecraft impact into Europa at 20.8 km/s at varying angles of obliquity;
Resulting temperatures of spacecraft materials for intact multiple-substrate impact, and for isolated single material substrate impact (giving more conservative results);
Physical effect on spacecraft materials: fragmentation? Liquefaction? Vaporization?
Particle cooling analysis and maximum size of sufficiently cooled particle;
Fragment size analysis as a function of obliquity ;
Burial depth analysis as a function of fragment size.
The Hancock analysis used the CTH tool with a library of SESAME materials
models. CTH is a Sandia Shock Physics Code for hypervelocity impact modeling. SESAME, developed by Los Alamos National Laboratory, captures the equations of state in tabular form. Most models include melting, vaporization, ionization, and molecular dissociation for molecules.
The shock strength is shown in Figure 14. In this figure, intersections of the curves give shock pressure and particle velocity for each spacecraft material/ice combination. The specific internal energy of a shocked material is ½ Du2 , where Du is its velocity change. Note that the ice density has a significant effect on shock strength. Since the lower shock strength (and lower resulting temperatures) occurs for the 60% density ice, the analysis that follows assumes 60% ice, since it is less effective in sterilizing the impacting material. The plate material is heated nearly uniformly through its thickness by the shock; the thickness influences the duration, but not the strength of the shock.
An early conclusion of the study is that at this impact velocity, there is a potential for very high temperatures even if only a small fraction of the kinetic energy is converted to heat, and one needs to look very closely to find a way for a spore or other microbe to survive. For scale, the specific total energy is 216 MJ/Kg or about 50 times the energy density of TNT.
Looking next at the expansion after a shock, Figure 15 shows the variation in temperature and volume for a variety of engineering materials following the shock. Solid and liquid materials expand and will fragment when tension occurs, then cool over a much longer time scale. Vaporized material will continue to expand and cool.
Figure 16 shows the results of applying the CTH tool to the case of a solid aluminum plate impacting 60% density ice at 0° obliquity.
In this simulation, the vapor expands and envelops the plate, leading to temperatures of around 6000 K on the back of the plate, with much higher temperatures on the front. The entire plate exceeds 3500 K for 2.5 ms.

1 2 3 4 5 6 7 8 9 10 11 12 13 14 15 16 17 18 19 20 21 22 23 24 25 26 27 28 29 30 31 32 33 34 35 36 37 38 39 40 41 42 43 44 45 46 47 48 49 50 51 52 53 54 55 56 57 58 59 60 61 62 63 64 65
19
The above is just a single dense plate. Temperatures rise higher if the material is less dense or there are multiple separated plates.
Hancock explains the higher temperatures for the multiple plate situation associated with a spacecraft as follows:
The impact of the corresponding stack of materials will be much more complex than for a single slab. An impact involving multiple layers will result in residual temperatures which are much higher than for a single layer. Among the reasons are:
• There are multiple shocks and consequently more irreversible shock heating.
• The plates may impact rebounding material, thus producing higher effective impact velocities and shock strengths than for the incident impact velocity alone.
• Plates impacting and recompressing vaporized material will greatly increase the heating of the vaporized material.
Even the last layer to impact will have a higher amount of heating than it
would have if it impacted alone. This seems somewhat counter-intuitive if we think about a low speed impact, such as a car crash, in which the first structural elements to impact can have a cushioning effect on the following regions. However, at an impact velocity well above the speed of sound in metal, there is no time for the first impacting layers to send stress waves back to slow the trailing layers, so there is no time for any buckling to cushion the later impacts. The final layer probably impacts into rebounding material, increasing its effective impact velocity, and it is probably subjected to many shocks from the impacts ahead of it, each one doing irreversible heating.
A very simple but more realistic model for the entire spacecraft impacting ice is 90% porous aluminum (which approximates Juno’s average density). Figure 17 is a simulation of this case. Note that in this simulation, the entire spacecraft vaporizes at temperatures above 20,000 K.
A key conclusion is that bringing a spacecraft fragment to a stop from 20.8 km/s with temperature below 773 K is not credible. This would require more than 99% of the kinetic energy to be absorbed by the environment and that is not considered reasonable for a fragment that is being destroyed. So the temperature is expected to exceed 773 K, but the time above 773 K may be less than the required 0.5 s if the fragment is small enough to cool rapidly. This leaves rapid cooling on a very small particle as one chance for survival.
Rapid cooling needs a cold environment, away from the (hot) impact site, so such survival requires:
A particle small enough to cool rapidly is created by the initial impact;

1 2 3 4 5 6 7 8 9 10 11 12 13 14 15 16 17 18 19 20 21 22 23 24 25 26 27 28 29 30 31 32 33 34 35 36 37 38 39 40 41 42 43 44 45 46 47 48 49 50 51 52 53 54 55 56 57 58 59 60 61 62 63 64 65
20
A microbe survives the destruction of the substrate and is carried by the particle;
The small particle is ejected at high speed up and away from the impact site so that rapid cooling occurs;
The particle later impacts at the velocity that gives it the highest possible penetration into the ice.
A small particle cannot penetrate deeply (Possible Survival Case 1), but it might fall into a crack with some finite probability (Possible Survival Case 2). For high obliquity, the initial impact does not release most of the kinetic energy, and multiple ricochets might be envisioned that slowly bleed off energy (although it is still not credible to expect almost all of this energy to be absorbed by the environment). Since analysis of such multiple ricochets to prove this is extremely complex, an alternate ―fragmentation followed by radiation sterilization‖ analysis is used to address these cases (Possible Survival Case 3).
9.3.1. Possible Survival Case 1: Small Particle Blasted Clear, Cooled, and Buried in Ice
This case assumes that a particle is heated above 800 K. Temperatures above 773 K for > 0.5 s will sterilize the particle, and large particles cannot radiate heat away fast enough to avoid this sterilization. However, if the particle is small enough, it can cool in less than half a second. For these particles, sterilization relies on radiation. The Hancock report assesses the maximum burial depth in 50% density ice for particles of differing materials and mass. The SSB report on Forward Contamination of Europa (Space Studies Board, 2000) estimates the radiation dose accumulated under varying depths of ice. Combining the Hancock depths with the NRC radiation dose, and an assumption of sterility after 7 Mrad (Space Studies Board, 2000), gives the results in Table 9.
Note that for such small particles, rapid sterilization is expected following such a shallow burial in the ice. Survival probability: 0%.
9.3.2. Possible Survival Case 2: Small Particle Blasted Clear, Cools and Falls in deep crevasse
This is the same as the case just discussed, but relies on a small particle
following a trajectory to the bottom of an existing crevasse that is so deep that radiation will not sterilize the particle in times sufficient for geological processes to transport surviving organisms to liquid water. Since this possibility seems remote, but cannot be excluded, this is included in our analysis with a conservative 1% probability.
For time scale context, the time to sterilization of a particle buried 1.3 m deep is estimated to be 30,00 years as discussed in the next section and the average

1 2 3 4 5 6 7 8 9 10 11 12 13 14 15 16 17 18 19 20 21 22 23 24 25 26 27 28 29 30 31 32 33 34 35 36 37 38 39 40 41 42 43 44 45 46 47 48 49 50 51 52 53 54 55 56 57 58 59 60 61 62 63 64 65
21
resurfacing time for Europa is estimated to be greater than 20 million years (National Research Council, 2012).
9.3.3. Possible Survival Case 3: Oblique Impact and Fragmentation
For high obliquity impacts, the magnitude of residual velocity increases with increasing obliquity because less energy is absorbed in the impact. The debris center-of-mass velocity greatly exceeds Europa’s escape velocity of 2 km/s in all cases, meaning debris will either return to space or impact other terrain at very high velocity. See Figure 18.
Higher obliquity impacts provide less heating and lower temperatures from the initial impact since the debris can outrun the vapor, and most of the kinetic energy is still with the material. The material may either return to space or later, less oblique impacts may result in the high temperatures required for sterilization.
Hancock cites Cordelli’s work (Cordelli et al, 1998) on fragmentation of space debris to assess the debris that results from even highly oblique impacts at such high velocities. He concludes that fragment size increases with angle of obliquity. This provides an analytic alternative. It is not necessary to analyze the possible multiple collisions that might allow a fragment of a spacecraft to come to rest after an oblique impact. It is sufficient to understand the maximum fragment size resulting from the first oblique impact and determine how deep fragments of that size can be buried and how long it will take for them to be sterilized by radiation. Starting from an assumption that any time to radiation sterilization of < 100,000 years is acceptably small compared to the time required to transport living microbes to liquid water, we find that we can demonstrate sterilization for all particles from oblique impacts up to 80°. The vault wall ends up being the driving case. Table 10 shows several of the most significant fragments after an 80° oblique impact and the time required for radiation sterilization – taken as 7 Mrad if no credit is taken for clean-room assembly (Space Studies Board, 2000).
Conclusion: all fragments from impacts at angles < 80° are sterilized. Although fragments from the 2% of impacts at angles > 80° are most likely also sterilized, the numbers are so few that planetary protection requirements are met even if the project assumes that all such impacts lead to contamination, so they are not analyzed further. Note: although one could imagine a nearly horizontal cave that lines up with the debris path following an oblique impact, it is assumed that the likelihood the debris finding its way into that cave and then decelerating through a special combination of multiple bounces—none of which heats the debris above 773 K—is considered to be negligible compared to the 2% already allocated to the case of oblique impacts.
9.4. Impact Summary

1 2 3 4 5 6 7 8 9 10 11 12 13 14 15 16 17 18 19 20 21 22 23 24 25 26 27 28 29 30 31 32 33 34 35 36 37 38 39 40 41 42 43 44 45 46 47 48 49 50 51 52 53 54 55 56 57 58 59 60 61 62 63 64 65
22
Summing together all instances of possible contamination due to impact gives:
1% possible contamination from impacts at less than the analyzed impact velocity of 20.8 km/s (Section 9.1, 9.3.1);
1% possible contamination from small particles landing in deep crevasses (Section 9.3.2);
2% possible contamination from impacts at angles of obliquity greater than the 80° case analyzed (Section 9.1, 9.3.3).
Note that none of these cases are cases of likely contamination. Rather, they are all cases where the limitations of the analytical tools plus the low likelihood of Europa impact allow the project to accept conservatively large estimates and still meet planetary protection requirements. Another project with higher likelihood of Europa impact could reasonably expect to ―sharpen the pencil‖ in this analysis and demonstrate even lower probability of contamination given a non-sterile impact.
10. Capability vs. Requirement
Juno’s project-level allocation for Europa impact (not contamination) probability is <1.5x10⁻³. The approach used to demonstrate compliance with this requirement was to combine the results from the spacecraft reliability model and the Monte Carlo-based trajectory analysis into a single, integrated result.
Spacecraft reliability was computed over a series of 11-day intervals (corresponding to the period of each MWR and Gravity Science orbit), Figure 19. As seen from the figure, spacecraft reliability over each interval varies depending on the activities performed during that interval, driven primarily by the number of ground commands executed by the spacecraft. The relatively low failure probability during the capture orbit (between JOI and PRM) is due to the low level of commanding during that period. The higher failure probabilities just prior to the PRM maneuver and during the MWR and Gravity science orbits is due to heightened commanding during those periods.
The spacecraft reliability results were then combined with the probability of Europa Impact within 400 years assuming the spacecraft failed during a specified orbit number (i.e., the spacecraft could no longer be controlled from that point forward), Figure 20.
The spacecraft reliability and Europa impact results were combined on an orbit-by-orbit basis such that the temporal variations of each could be properly accounted for in the composite result, shown in Figure 21. Note that the spacecraft reliability results are integrated over time to show how the overall Europa impact probability varies with mission duration at Jupiter. As shown in the figure, the composite Europa impact probability is 4.6x10⁻⁴ at end of mission.
1 2 3 4 5 6 7 8 9 10 11 12 13 14 15 16 17 18 19 20 21 22 23 24 25 26 27 28 29 30 31 32 33 34 35 36 37 38 39 40 41 42 43 44 45 46 47 48 49 50 51 52 53 54 55 56 57 58 59 60 61 62 63 64 65
23
To demonstrate compliance with NASA’s <1x10⁻⁴ requirement of not contaminating the Europa ocean, Juno’s Europa impact probability (4.6x10⁻⁴) is combined with its ocean contamination probability (<0.04, Section 9), to yield an overall probability of <1.8x10⁻⁵. Thus, Juno is shown to meet NASA’s Europa planetary protection requirement with a large degree of margin (~5x), Table 11.
11. Summary
The Juno science mission does not pass close to Europa or the other
Galilean satellites. The mission is designed to conclude with a deorbit burn that disposes of the spacecraft in Jupiter’s atmosphere. If that deorbit burn is successful as planned, planetary protection compliance of the Juno mission with respect to Europa is assured and the story is complete.
This paper has included analysis of the finite possibility that the deorbit
maneuver does not occur as planned, examining the initial bioburden, the bioburden reduction due to the space and Jovian radiation environments, the likelihood of successful deorbit, the expected orbit propagation with and without a deorbit burn, and the bioburden reduction in the event of impact into an icy body. These combined analyses demonstrate that Juno satisfies NASA’s planetary protection requirements.
Acknowledgements The authors were members of the development team for the Juno Project. Doug Bernard and Rob Abelson were Project System Engineer and Deputy Project System Engineer, respectively. Jennie Johannesen was the Mission Design Manager and Try Lam was a member of her team. Bill McAlpine was the Radiation Manager and Laura Newlin was the Planetary Protection engineer for the Juno Project.
Stuart Stephens of JPL contributed to the mission and trajectory design portions of this paper including creating Figures 1, 2, and 9 using SOAP software. Amanda Briden and Chet Everline of JPL contributed technical content to mission design and probabilistic risk analysis portions of this paper, respectively. Steve Hancock of Foils Engineering helped the Juno team appreciate the physical implications of high-speed impact into an icy body and created Figures 14-18. Lockheed Martin is the Juno spacecraft developer and produced Figures 3 and 4. The research was carried out at the Jet Propulsion Laboratory, California Institute of Technology, under a contract with the National Aeronautics and Space Administration.
References

1 2 3 4 5 6 7 8 9 10 11 12 13 14 15 16 17 18 19 20 21 22 23 24 25 26 27 28 29 30 31 32 33 34 35 36 37 38 39 40 41 42 43 44 45 46 47 48 49 50 51 52 53 54 55 56 57 58 59 60 61 62 63 64 65
24
Cordelli, A., P. Farinella, and A. Rossi. ―The influence of the fragmentation threshold on the long term evolution of the orbital debris environment,‖ Planetary and Space Science, v. 46, p. 691-699, Feb 1998. Grant W. D., “Life at Low Water Activity,‖ Philosophical Transactions of The Royal Society of London, Biological Sciences, Vol. 359, No. 1448, pp. 1249-1267, August, 2004.
Horneck, Gerda, "Responses of Bacillus subtilis spores to space environment: Results from experiments in space," presented at the 26th General Assembly of the European Geophysical Society, Wiesbaden, Germany, 22-26 April, 1991, Origins of Life and Evolution of Biospheres, Springer Netherlands, Vol. 23, No. 1, February, 1993.
Kohlhase, C. E., et al., ―Meeting the Planetary Protection Requirement for JIMO/Europa‖, presentation to JIMO SDT, May 13, 2004, California.
La Duc, M., Dekas, A., Osman, S., Moissl, C., Newcombe, D., and Venkateswaran, K., ―Isolation and Characterization of Bacteria Capable of Tolerating the Extreme Conditions of Clean Room Environments,‖ Applied and Environmental Microbiology, Vol. 73, No. 8, Apr. 2007, p. 2600–2611.
Lam, T., Johannesen. J. R., and Kowalkowski, T. D., "Planetary Protection Trajectory Analysis for the Juno Mission", AIAA/AAS Astrodynamics Specialist Conference, AIAA-2008-7368, Aug. 2008.
Li, S. W., et al., ―Isolation and Characterization of Ionizing Radiation-Resistant Soil Bacteria from the Hanford Site, Washington,‖ 107th General Meeting of the American Society for Microbiology, ASM Press, Toronto, Canada, May 21-25, 2007.
Matousek, S.W., ―The Juno New Frontiers Mission,‖ International Astronautical Congress, Fukuoka, Japan, IAC-05-A3.2.A.04, October 17-21, 2005
Mileikowsky, Curt, Cucinotta, Francis A. Wilson, John W., Gladman, Brett, Horneck, Gerda, et al., "Risks threatening viable transfer of microbes between bodies of our solar system," Planetary and Space Science, Vol. 48, Issue 11, September, 2000.
National Aeronautics and Space Administration, Science Mission Directorate, Biological Contamination Control for Outbound and Inbound Planetary Spacecraft, NPD 8020.7F, Washington, D.C., February 19, 1999 (Revalidated 10/23/03).
National Aeronautics and Space Administration, Science Mission Directorate, Planetary Protection Provisions for Robotic Extraterrestrial Missions, NPR 8020.12C, Washington, D.C., April 27, 2005.

1 2 3 4 5 6 7 8 9 10 11 12 13 14 15 16 17 18 19 20 21 22 23 24 25 26 27 28 29 30 31 32 33 34 35 36 37 38 39 40 41 42 43 44 45 46 47 48 49 50 51 52 53 54 55 56 57 58 59 60 61 62 63 64 65
25
National Aeronautics and Space Administration, Science Mission Directorate, NASA Handbook for the Microbiological Examination of Space Hardware, NASA-HDBK-6022, Washington, D.C. (release pending).
National Research Council, Assessment of Planetary Protection Requirements for Spacecraft Missions to Icy Solar System Bodies, The National Academies Press, 2012.
Newlin, L. E., Juno Project Planetary Protection Plan, Rev. A, JPL D-34003, May, 2008.
Price, P. Buford, and Sowers, Todd, ―Temperature Dependence of Metabolic Rates for Microbial Growth, Maintenance, and Survival,‖ Proceedings of the National Academy of Sciences of the United States of America, Vol. 101, No. 13, pp. 4631-4636, March 30, 2004.
Saffary, Roya, et al., "Microbial Survival of Space Vacuum and Extreme Ultraviolet Irradiation: Strain Isolation and Analysis During a Rocket Flight," FEMS Microbiology Letters, Vol. 215, Issue 1, pp. 163-168, September, 2002.
Space Studies Board, National Research Council, Preventing the Forward Contamination of Europa, National Academy Press, Washington, D.C., 2000.
Urgiles, E., Wilcox, J., Montes, O., Osman, S., Venkateswaran, K., et al., "Electron Beam Irradiation for Microbial Reduction on Spacecraft Components," 2007 IEEE Aerospace Conference, Big Sky, Montana, March, 2007.
Figure Captions
Figure 1. Interplanetary Trajectory
Figure 2. Juno Orbits of Jupiter Shown in Earth-to-Jupiter and Jupiter North Pole Views
Figure 3. Juno Spacecraft Post Solar Array Deployment
Figure 4. Close-up View of Juno Flight System Core
Figure 5. Satellite Range at Closest Approaches
Figure 6. Apsidal Rotation
Figure 7. Impact Probability Evolution Over Time Following Failed Deorbit Attempt
Figure 8. Europa Impact Probability Assuming S/C Failure After Each Orbit
Figure 9. Juno Orbit Trajectory and the Jovian Magnetically Trapped Radiation Belts.
Figure 10. The Total Ionizing Dose Absorbed in Water per 12-Year Period.
1 2 3 4 5 6 7 8 9 10 11 12 13 14 15 16 17 18 19 20 21 22 23 24 25 26 27 28 29 30 31 32 33 34 35 36 37 38 39 40 41 42 43 44 45 46 47 48 49 50 51 52 53 54 55 56 57 58 59 60 61 62 63 64 65
26
Figure 11. NOVICE Model of a Juno Electronics Unit.
Figure 12. Impact Velocity
Figure 13. Obliquity
Figure 14. Shock Strength for Ice Impact
Figure 15. Shock, Expansion, and Temperature
Figure 16. Normal Impact of a Solid Aluminum Plate
Figure 17. Normal Impact of a Porous Aluminum Plate
Figure 18. Oblique Impacts
Figure 19. Juno Spacecraft Failure Probability per Orbit Number
Figure 20. Europa Impact Probability as a Function of Orbit Number
Figure 21. Composite Europa Impact Probability Versus Mission Duration

Table 1: Average Impact Probability Assuming S/C Failure before Deorbit
Impact type % Occurrence over
150 years % Occurrence over
400 years
No Impacts 24.1% +/– 1.24% 13.2%
Jupiter impacts 72.9% +/– 1.29% 80.8%
Io impacts 1.75% +/– 0.40% 3.52%
Europa impacts 0.52% +/– 0.22% 1.06%
Ganymede impacts 0.55% +/– 0.22% 1.10%
Callisto impacts 0.18% +/– 0.12% 0.35%
Table

Table 2. Average Annual Dose in Water for most Heavily Shielded Juno Equipment.
Unit Name Shielding
(mils equiv. Al)
Average Annual Dose (krad water/yr)
Stellar Reference Unit Opt. Head 3300 17.7
Inertial Measurement Unit A 2400 35.6
Inertial Measurement Unit B 2280 39.9
Stellar Reference Unit Elect. A 2200 43.3
Stellar Reference Unit Elect. B 2190 43.7
Small Deep Space Transponder B 2170 44.6
Command and Data Handling Unit A 2140 46.1
Command and Data Handling Unit B 2030 51.9
Small Deep Space Transponder A 2020 52.5
Power Distribution and Drive Unit 2020 52.5

Table 3: Summary of Micro-organism Types Proposed by SSB Europa Report
Type Definition Population Fractions
SSB JIMO / Juno
A Culturable using the NASA Standard Assay TSA plating technique (NASA, pending)
– –
B Spore-forming bacteria 2% of A ~ 10% of A
C Radiation resistant spores, with ≥ 10% survival above 0.8 Mrad
~ 0.1% of B ~ 10% of B
D Radiation resistant non-spore-forming bacteria, with ≥ 10% survival above 4.0 Mrad
~ 0.1% of A ~ 2% of A

Table 4: Summary of Micro-organism Groups Proposed by JIMO and Juno
Group Relation to
Types Definition Curve Source
1 A–B–C Radiation sensitive non-spore-forming bacteria*
Kohlhase, 2004
2 B–C Radiation sensitive spore-forming bacteria*
Kohlhase, 2004
3 C Radiation resistant spore-forming bacteria*
B. megaterium Urgiles, 2007
4 D Radiation resistant non-spore-forming bacteria*
Isolate 3B1 Li, 2007
* culturable using the NASA Standard Assay TSA plating technique
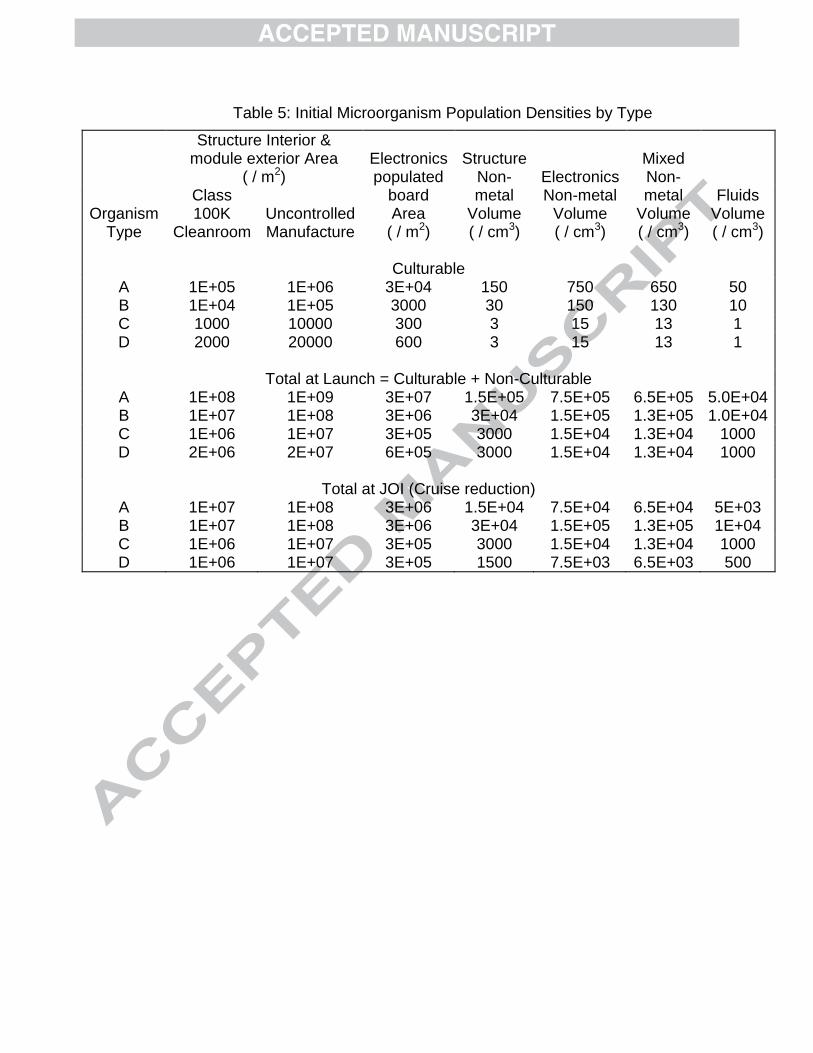
Table 5: Initial Microorganism Population Densities by Type
Organism Type
Structure Interior & module exterior Area
( / m2) Electronics populated
board Area
( / m2)
Structure Non-metal
Volume ( / cm3)
Electronics Non-metal
Volume ( / cm3)
Mixed Non-metal
Volume ( / cm3)
Fluids Volume ( / cm3)
Class 100K
Cleanroom Uncontrolled Manufacture
Culturable
A 1E+05 1E+06 3E+04 150 750 650 50 B 1E+04 1E+05 3000 30 150 130 10 C 1000 10000 300 3 15 13 1 D 2000 20000 600 3 15 13 1
Total at Launch = Culturable + Non-Culturable
A 1E+08 1E+09 3E+07 1.5E+05 7.5E+05 6.5E+05 5.0E+04 B 1E+07 1E+08 3E+06 3E+04 1.5E+05 1.3E+05 1.0E+04 C 1E+06 1E+07 3E+05 3000 1.5E+04 1.3E+04 1000 D 2E+06 2E+07 6E+05 3000 1.5E+04 1.3E+04 1000
Total at JOI (Cruise reduction)
A 1E+07 1E+08 3E+06 1.5E+04 7.5E+04 6.5E+04 5E+03 B 1E+07 1E+08 3E+06 3E+04 1.5E+05 1.3E+05 1E+04 C 1E+06 1E+07 3E+05 3000 1.5E+04 1.3E+04 1000 D 1E+06 1E+07 3E+05 1500 7.5E+03 6.5E+03 500

Table 6: Microorganism Survival Fraction as a Function of Years After Launch
N / No Years After Launch
0 25 50 75 100 125 150
SRU Optical Heads
Group 1 1 6.1E-03 3.8E-05 2.3E-07 1.4E-09 8.7E-12 5.3E-14 Group 2 1 3.4E-02 1.1E-03 3.8E-05 1.3E-06 4.2E-08 1.4E-09 Group 3 1 5.3E-02 2.8E-03 1.5E-04 7.7E-06 4.0E-07 2.1E-08 Group 4 1 6.2E-01 3.8E-01 2.3E-01 1.4E-01 8.8E-02 5.4E-02
IMUs
Group 1 1 3.6E-05 1.3E-09 4.5E-14 1.6E-18 5.6E-23 2.0E-27 Group 2 1 1.1E-03 1.2E-06 1.3E-09 1.4E-12 1.5E-15 1.6E-18 Group 3 1 2.7E-03 7.2E-06 1.9E-08 5.1E-11 1.4E-13 3.7E-16 Group 4 1 3.8E-01 1.4E-01 5.4E-02 2.0E-02 7.6E-03 2.9E-03
SRU Electronics
Modules
Group 1 1 3.9E-06 1.5E-11 5.8E-17 2.2E-22 8.7E-28 3.4E-33 Group 2 1 2.5E-04 6.1E-08 1.5E-11 3.7E-15 9.1E-19 2.2E-22 Group 3 1 7.4E-04 5.5E-07 4.1E-10 3.1E-13 2.3E-16 1.7E-19 Group 4 1 3.1E-01 9.3E-02 2.8E-02 8.7E-03 2.7E-03 8.1E-04
Combined Total
Group 1 1 4.9E-06 2.5E-08 1.6E-10 9.5E-13 5.8E-15 3.6E-17 Group 2 1 4.4E-04 5.0E-06 1.6E-07 5.5E-09 1.8E-10 6.1E-12 Group 3 1 1.1E-03 1.3E-05 6.3E-07 3.3E-08 1.8E-09 9.2E-11 Group 4 1 2.3E-05 1.2E-07 7.3E-10 4.5E-12 2.7E-14 1.7E-16

Table 7: Surviving Microorganisms as a Function of Years After Launch
N Years After Launch
0 25 50 75 100 125 150
SRU Optical Heads
Group 1 1.1E+07 6.8E+03 4.2E+01 2.6E-01 1.6E-03 <0.001 <0.001 Group 2 1.4E+06 4.6E+04 1.5E+03 5.1E+01 1.7E+00 5.7E-02 1.9E-03 Group 3 1.5E+05 7.9E+03 4.2E+02 2.2E+01 1.2E+00 6.1E-02 3.2E-03 Group 4 2.6E+05 7.9E+02 4.8E+00 3.0E-02 <0.001 <0.001 6.8E-09
Total 1.3E+07 6.1E+04 2.0E+03 7.3E+01 2.9E+00 1.2E-01 5.1E-03
IMUs
Group 1 3.3E+08 7.0E+02 2.1E-02 7.0E-07 <0.001 <0.001 <0.001 Group 2 3.7E+07 2.7E+04 2.4E+01 2.3E-02 <0.001 <0.001 <0.001 Group 3 4.1E+06 7.6E+03 1.7E+01 4.1E-02 <0.001 <0.001 <0.001 Group 4 7.6E+06 8.0E+01 2.4E-03 8.0E-08 <0.001 <0.001 <0.001
Total 3.8E+08 3.5E+04 4.1E+01 6.4E-02 <0.001 <0.001 <0.001
SRU Elec-
tronics Modules
Group 1 1.3E+09 4.7E+02 1.7E-03 6.4E-09 <0.001 <0.001 <0.001 Group 2 2.8E+08 6.5E+04 1.5E+01 3.7E-03 <0.001 <0.001 <0.001 Group 3 3.1E+07 2.2E+04 1.6E+01 1.1E-02 <0.001 <0.001 <0.001 Group 4 3.3E+07 6.0E+01 2.2E-04 8.0E-10 <0.001 <0.001 <0.001
Total 1.6E+09 8.7E+04 3.1E+01 1.5E-02 <0.001 <0.001 <0.001
Com-bined Total
Group 1 1.7E+09 8.0E+03 4.2E+01 2.6E-01 1.6E-03 <0.001 <0.001 Group 2 3.1E+08 1.4E+05 1.6E+03 5.1E+01 1.7E+00 5.7E-02 1.9E-03 Group 3 3.5E+07 3.7E+04 4.5E+02 2.2E+01 1.2E+00 6.1E-02 3.2E-03 Group 4 4.1E+07 9.3E+02 4.8E+00 3.0E-02 <0.001 <0.001 <0.001
Total 2.0E+09 1.8E+05 2.1E+03 7.3E+01 2.9E+00 1.2E-01 5.1E-03

Table 8: Assumed Sterilized Conditions
Temperature exceeds 500 C (773 K) for at least 0.5 s
Substrate vaporized or liquefied by hypervelocity shock
Radiation dose exceeds 7 Mrad
Fragmented and escapes Europa orbit (negligible protection from radiation in Jupiter orbit)

Table 9: Burial of a Small Particle
Material
Maximum non-
sterilized size
Max burial depth
Time to 7 Mrad in Europa
ice
Tungsten 0.4 mm 5 cm 30 years
Titanium 0.2 mm 1 cm 2 years

Table 10: Burial of a Spacecraft Fragment
Material (density)
Largest solid piece prior to impact
Diameter of largest fragment
after impact
Max burial depth
Dose rate at depth
Time to 7 Mrad in
Europa ice
Titanium (4.5 g/cc)
34 kg (vault wall)
4 cm 130 cm 20 rad/mo 30,000 years
Tungsten (19 g/cc)
1.0 kg (JEDI shield wall)
0.8 cm 110 cm 50 rad/mo 12,000 years
Aluminum (2.7 g/cc)
48 kg (top deck)
5.5 cm 110 cm 50 rad/mo 12,000 years

Table 11. Juno Project-Level Planetary Protection Requirements
Probability suballocations Current
Best Estimate
Sub-Allocation
Spacecraft failure analysis: Probability that a spacecraft failure prevents it from being able to deorbit by EOM
0.05 <0.10
Mission Design: Probability of Europa impact of a non-sterile spacecraft (assumes no deorbit burn)
0.0093 <0.015
Spacecraft/Europa Impact Analysis: Probability of contamination in the event of a non-sterile impact
<0.04 <0.06
Combined Probability of Contamination of the Europan Ocean
<1.8x10⁻⁵ <9x10⁻⁵
NASA Requirement <1x10⁻⁴

Figure 1. Interplanetary Trajectory
Figure

Figure 2. Juno Orbits of Jupiter Shown in Earth-to-Jupiter and Jupiter North Pole Views
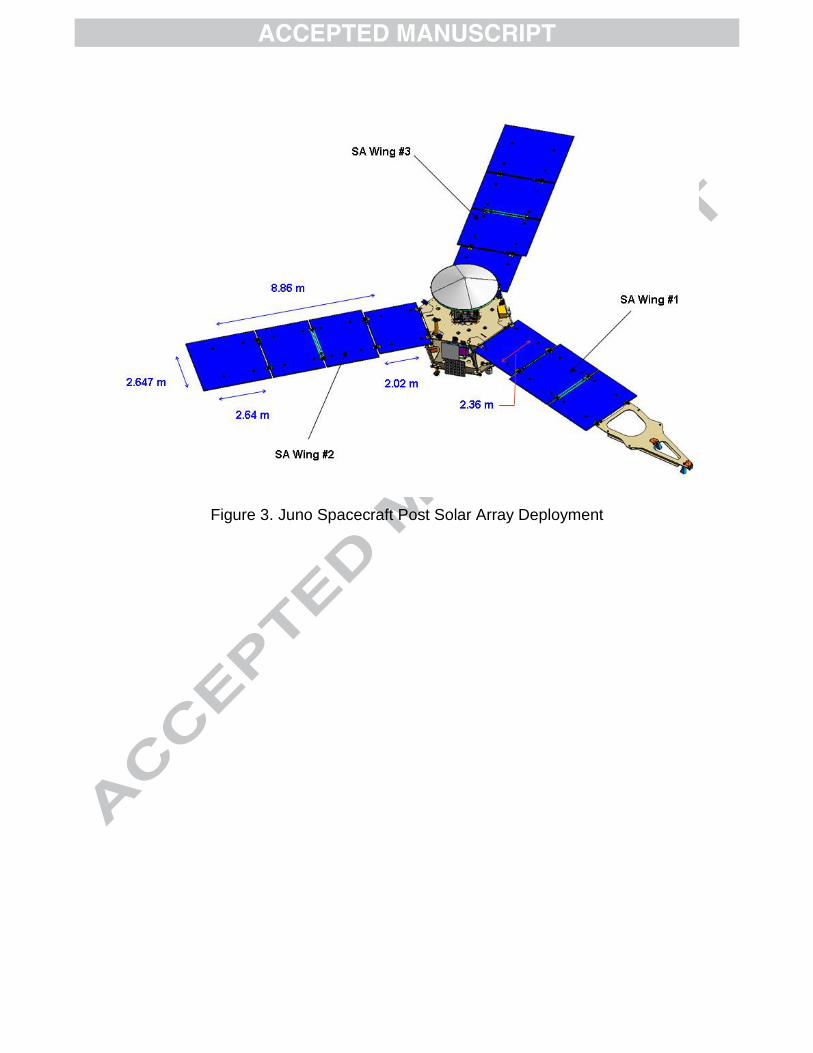
Figure 3. Juno Spacecraft Post Solar Array Deployment

Figure 4. Close-up View of Juno Flight System Core
Figure 5. Satellite Range at Closest Approaches

Figure 6. Apsidal Rotation
Figure 7. Impact Probability Evolution Over Time Following Failed Deorbit Attempt

Figure 8. Europa Impact Probability Assuming S/C Failure After Each Orbit
Figure 9. Juno Orbit Trajectory and the Jovian Magnetically Trapped Radiation Belts.

Figure 10. The Total Ionizing Dose Absorbed in Water per 12-Year Period.

Figure 11. NOVICE Model of a Juno Electronics Unit.
Figure 12. Impact Velocity
Figure 13. Obliquity

Figure 14. Shock Strength for Ice Impact
Figure 15. Shock, Expansion, and Temperature

Figure 16. Normal Impact of a Solid Aluminum Plate
Figure 17. Normal Impact of a Porous Aluminum Plate

Figure 18. Oblique Impacts
0.08%
0.09%
0.10%
0.11%
0.12%
0.13%
0.14%
0.15%
0.16%
0.17%
Pro
bab
ility
of
S/C
Fai
lure
(%)
Orbit No.
Probability of S/C Failure within the Indicated Orbit Number
Capture Orbit PRM MWR Gravity Orbits Deorbit
Figure 19. Juno Spacecraft Failure Probability per Orbit Number

0.0%
0.5%
1.0%
1.5%
2.0%
2.5%
0 0b 0d 0f 0h 1 3 5 7 9 11 13 15 17 19 21 23 25 27 29 31 33
Pro
bab
ility
of
Euro
pa
Imp
act
Giv
en
a F
aile
d
Spac
ecr
aft,
(%
)
Orbit Number (Measured from PJn to PJn+1)
Probability of Europa Impact Assuming the S/C Fails During the Indicated Orbit Number
Propagated for
4000 yrs Propagated for 400 yrs
Figure 20. Europa Impact Probability as a Function of Orbit Number
0.000%
0.005%
0.010%
0.015%
0.020%
0.025%
0.030%
0.035%
0.040%
0.045%
0.050%
0 0b 0d 0f 0h 1 3 5 7 9 11 13 15 17 19 21 23 25 27 29 31 33
Inte
grat
ed
Pro
bab
ility
of E
uro
pa
Imp
act,
(%)
Orbit Number (Measured from PJn to PJn+1)
Integrated Composite Europa Impact Probability Accounting for Spacecraft Reliability
Composite Europa Impact Probability at EOM = 4.6E-4
Figure 21. Composite Europa Impact Probability Versus Mission Duration
Highlights The Juno Mission to Jupiter meets planetary protection requirements by design and analysis
The nominal mission is designed to be concluded with a deorbit maneuver leading to disposal of the spacecraft in Jupiter’s atmosphere
Juno’s orbit is never on an impact trajectory with Europa and the most likely end-state even without a deorbit maneuver is disposal in Jupiter’s atmosphere
Analyses include initial bioburden at launch and bioburden reduction due to space and Jovian environments including temperature, vacuum, and (most importantly) radiation
Analysis of hypothetical impacts between the Juno spacecraft and Europa shows a high likelihood of sterilization by the impact event