Embed Size (px)
Citation preview
Assessment of Renewable Investments in
Europe by Leading Companies &
Perspectives to 2025
Marc-Antoine Eyl-Mazzega, Carole Mathieu, Thibault MenuCenter for Energy & Climate
09 December 2020 1
2
1. Introduction to the EU top 20 Renewable Power Index (EU20 RPI) and implications of the new – 55% target for electricity investments
2. The period 2015-2019: renewables not the priority of the EU20 RPI3. The medium term perspective to 2025: on track for the new -55% target?4. Highlights & conclusion5. Annexes
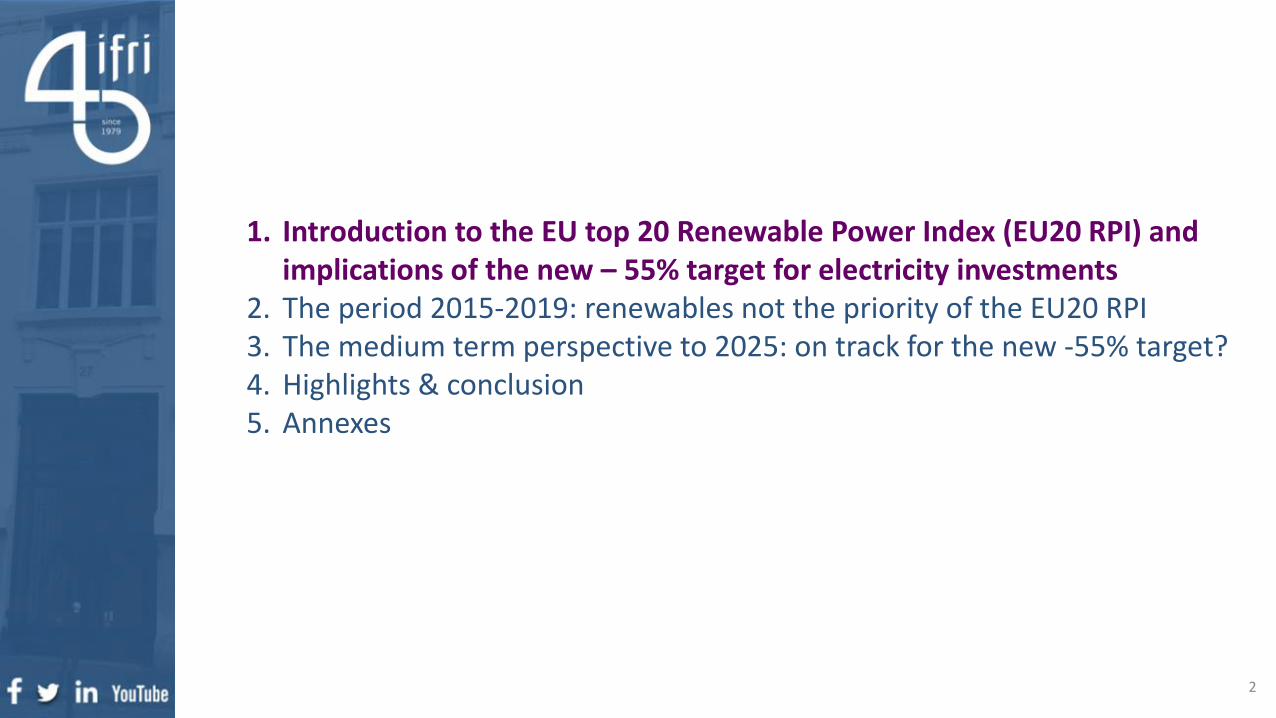
The EU Green Deal calls for massive electricity sector investments
➢ The -55% target for 2030 means that the pace of average annual emission reductions will have to
double in the period 2020-2030 versus 1990-2017. Reaching carbon neutrality by 2050 means
tripling the effort in the period 2030-2050 versus 1990-2017.
➢ The European Commission (EC) points to additional energy investments in supply & demand: the
new -55% intermediary objective requires about +350 billion EUR per year until 2030
➢ The electricity sector will concentrate part of these additional investments:
• Overall, the investment level of 55 billion EUR/year in 2011-2020 in this sector will have to
double in the period 2021-2030, to reach 65% of renewables in final energy demand.
• Total renewable energy source (RES) capacity should increase from 300 GW in 2019 to up to
800 GW by 2030, equivalent to +50 GW/year of solar and wind capacity additions.
• Notably, offshore wind investments will have to double from 15 billion EUR/year to 30 billion
EUR/year, with 2/3 located in the North Sea.
➢ These investments into RES will require private companies willing and able to invest, public support
(contracts for difference, tenders), enabling regulation, as well as grids and large storage additions.
This analysis looks at Europe’s leading energy companies, the trajectory of their investments into RES
since 2015 and whether their investments plans into solar and wind are on track by 2025 to deliver on
the required scale to reach the -55% emission reduction target by 2030. 3
4
1. Introduction to the EU top 20 Renewable Power Index (EU20 RPI) and implications of the new – 55% target for electricity investments
2. The period 2015-2019: renewables not the priority of the EU20 RPI3. The medium-term perspective to 2025: on track for the new -55% target?4. Highlights & conclusion5. Annexes
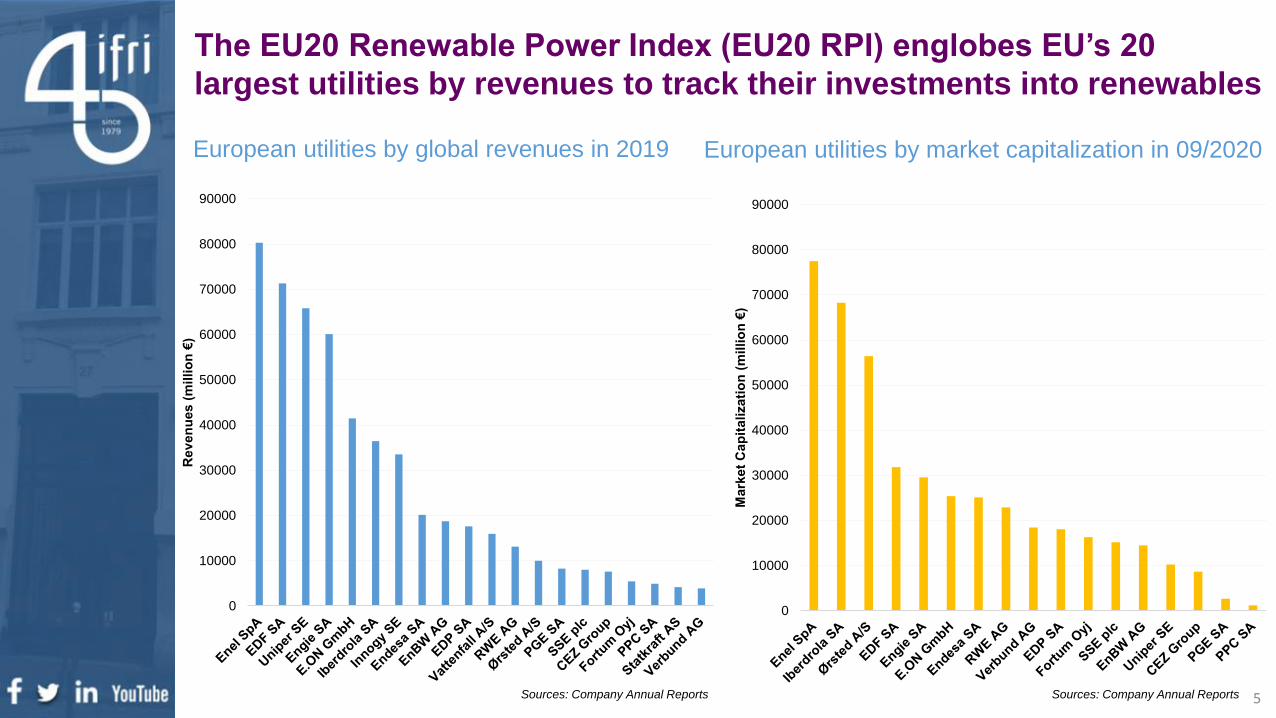
The EU20 Renewable Power Index (EU20 RPI) englobes EU’s 20
largest utilities by revenues to track their investments into renewables
0
10000
20000
30000
40000
50000
60000
70000
80000
90000
Mark
et
Ca
pit
alizati
on
(m
illio
n €
)
0
10000
20000
30000
40000
50000
60000
70000
80000
90000R
ev
en
ues (
millio
n €
)
European utilities by global revenues in 2019 European utilities by market capitalization in 09/2020
Sources: Company Annual Reports Sources: Company Annual Reports 5
136 GW 204 GW
240 GW 249 GW
95 GW 150 GW
25 GW 25 GW
496 GW 628 GW
33 GW 45 GW(24% of Europe) (22% of Europe)
122 GW 124 GW(51% of Europe) (50% of Europe)
1,5 GW 3 GW(1,5% of Europe) (2% of Europe)
2015 2019 2015 2019
3 GW 3,5 GW(12% of Europe) (14% of Europe)
160 GW 175,5 GW(32% of Europe) (28% of Europe)
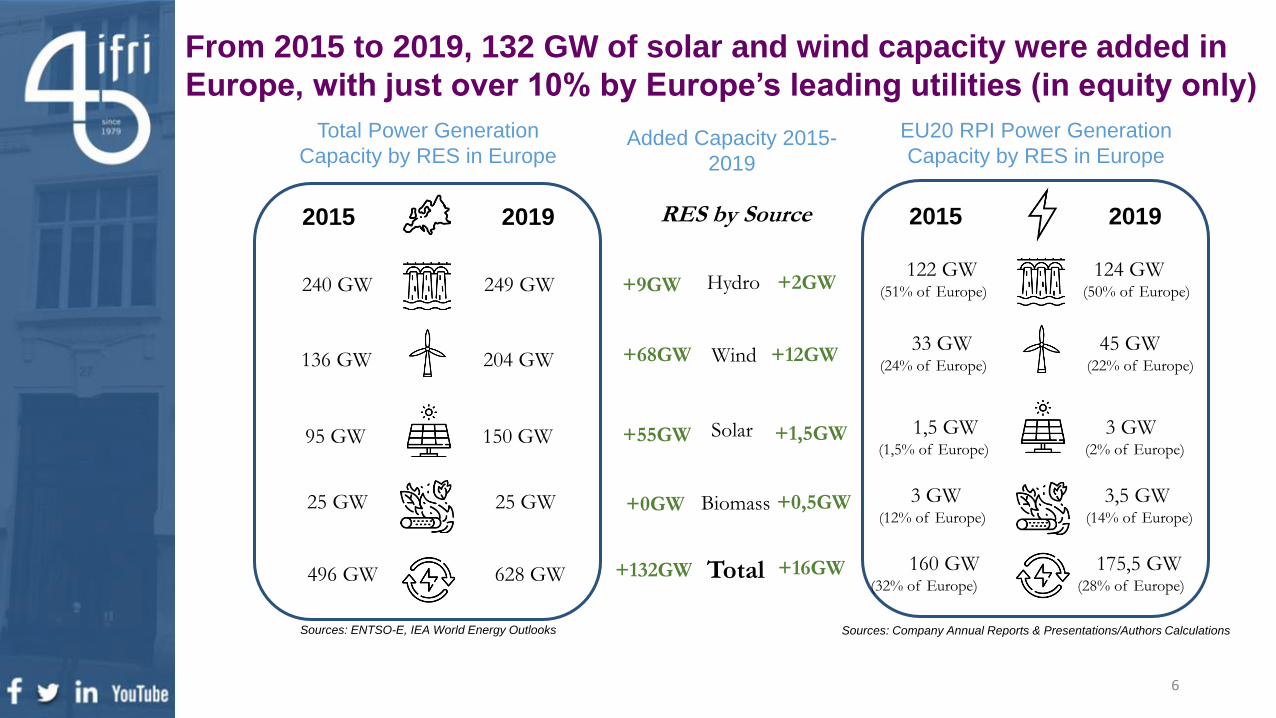
From 2015 to 2019, 132 GW of solar and wind capacity were added in
Europe, with just over 10% by Europe’s leading utilities (in equity only)
Total Power Generation
Capacity by RES in Europe
EU20 RPI Power Generation
Capacity by RES in Europe
Hydro
Wind
Solar
Biomass
Total
RES by Source
Sources: ENTSO-E, IEA World Energy Outlooks Sources: Company Annual Reports & Presentations/Authors Calculations
+9GW +2GW
+68GW +12GW
+55GW +1,5GW
+0GW +0,5GW
+132GW +16GW
Added Capacity 2015-
2019
6
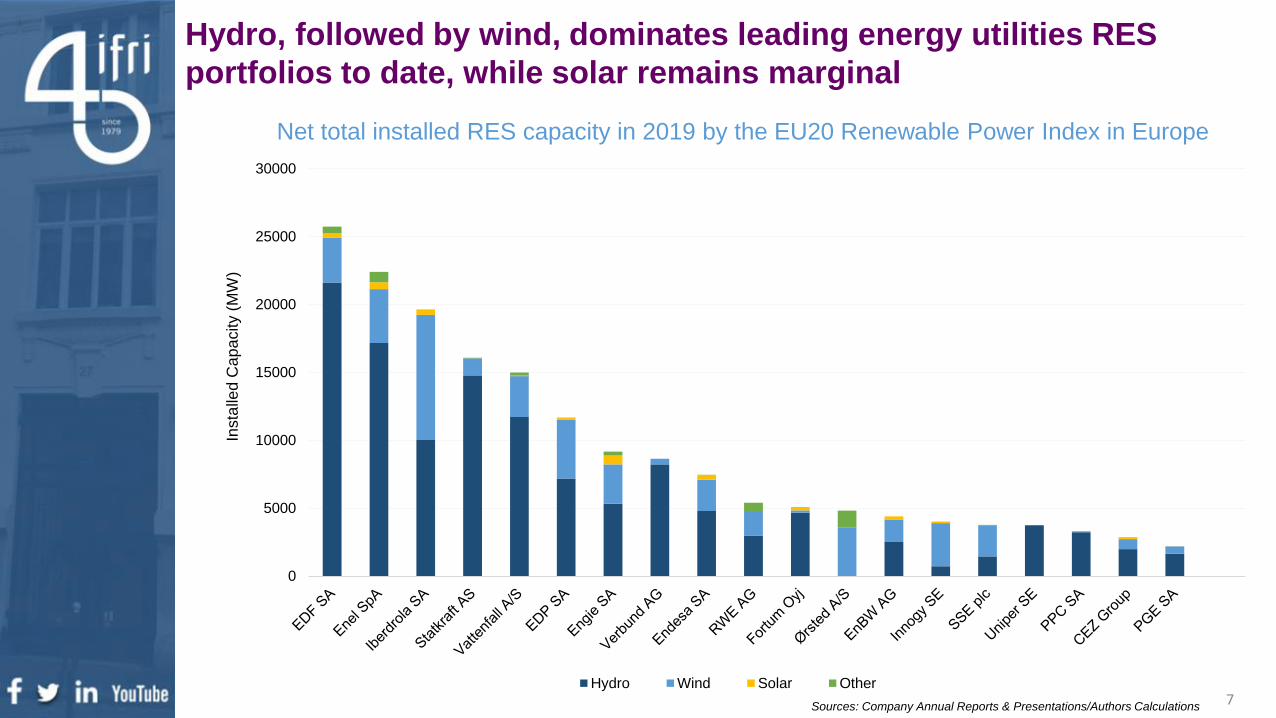
Hydro, followed by wind, dominates leading energy utilities RES
portfolios to date, while solar remains marginal
Sources: Company Annual Reports & Presentations/Authors Calculations
Net total installed RES capacity in 2019 by the EU20 Renewable Power Index in Europe
7
0
5000
10000
15000
20000
25000
30000
Insta
lled
Cap
acity (
MW
)
Hydro Wind Solar Other
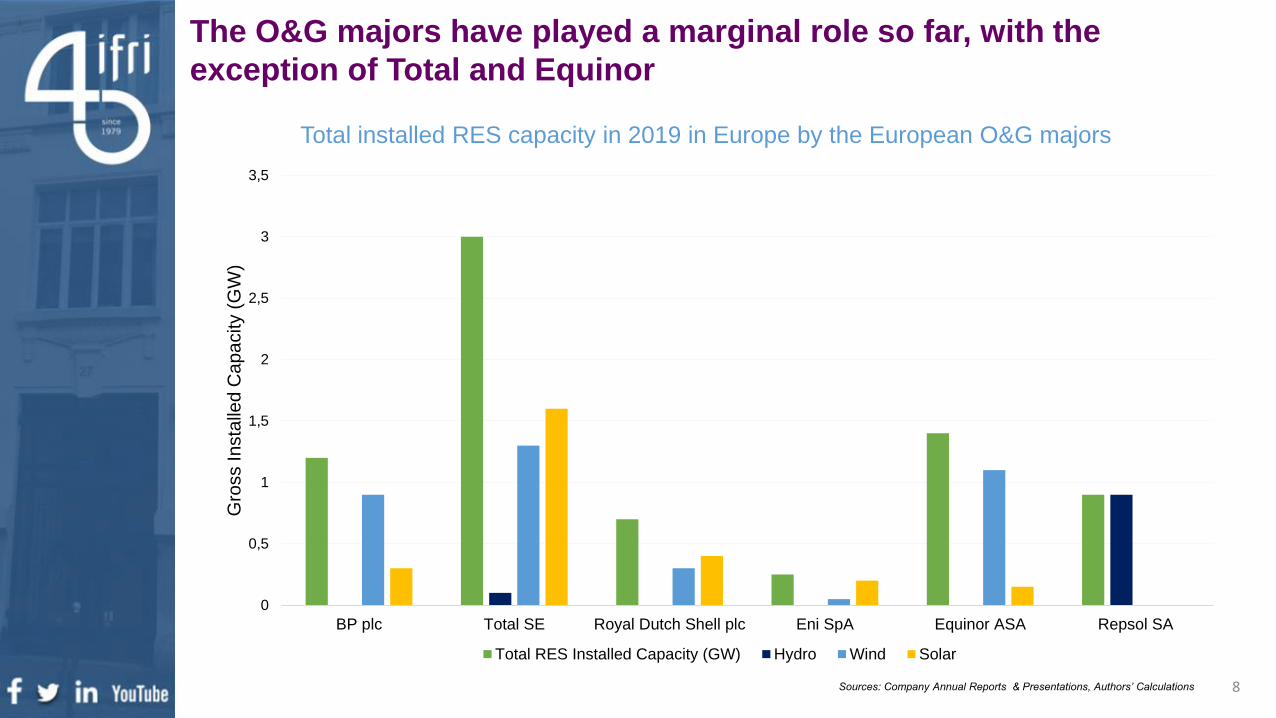
The O&G majors have played a marginal role so far, with the
exception of Total and Equinor
Total installed RES capacity in 2019 in Europe by the European O&G majors
Sources: Company Annual Reports & Presentations, Authors’ Calculations 8
0
0,5
1
1,5
2
2,5
3
3,5
BP plc Total SE Royal Dutch Shell plc Eni SpA Equinor ASA Repsol SA
Gro
ss In
sta
lled
Ca
pa
city (
GW
)
Total RES Installed Capacity (GW) Hydro Wind Solar
9Sources: Company Annual Reports & Presentations, Authors’ Calculations
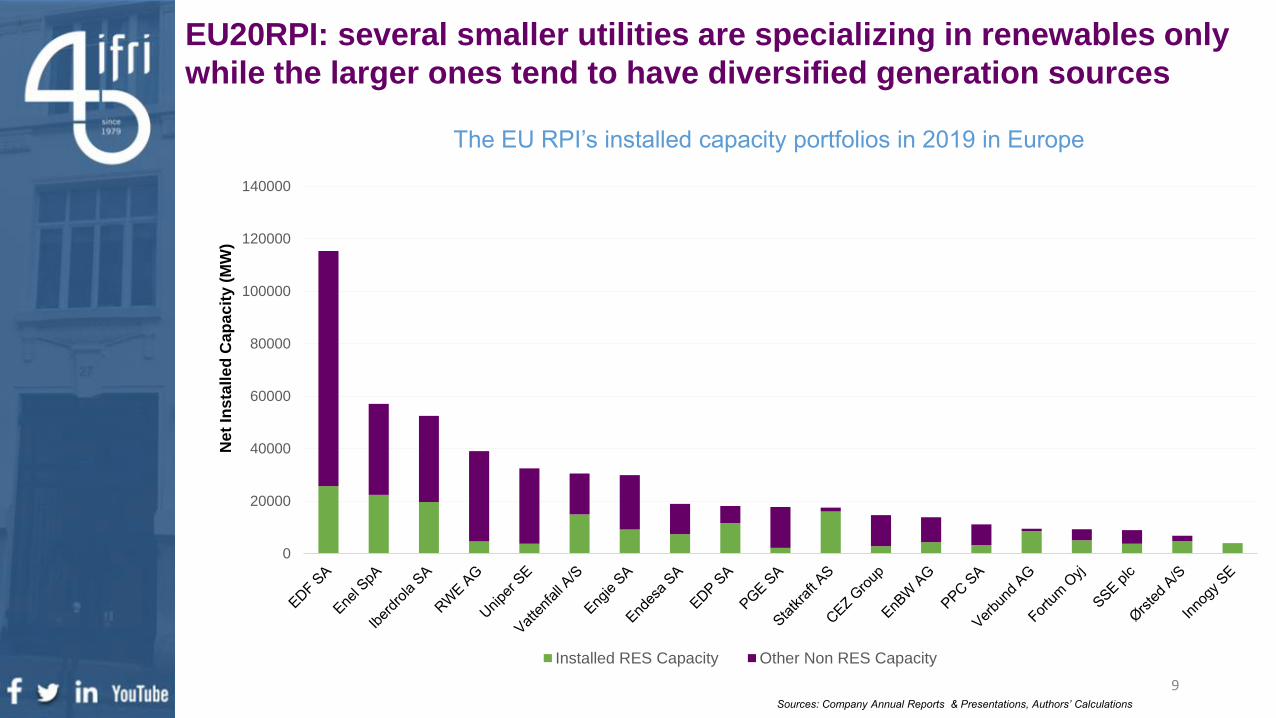
EU20RPI: several smaller utilities are specializing in renewables only
while the larger ones tend to have diversified generation sources
The EU RPI’s installed capacity portfolios in 2019 in Europe
0
20000
40000
60000
80000
100000
120000
140000
Net
Ins
tall
ed
Cap
ac
ity (
MW
)
Installed RES Capacity Other Non RES Capacity
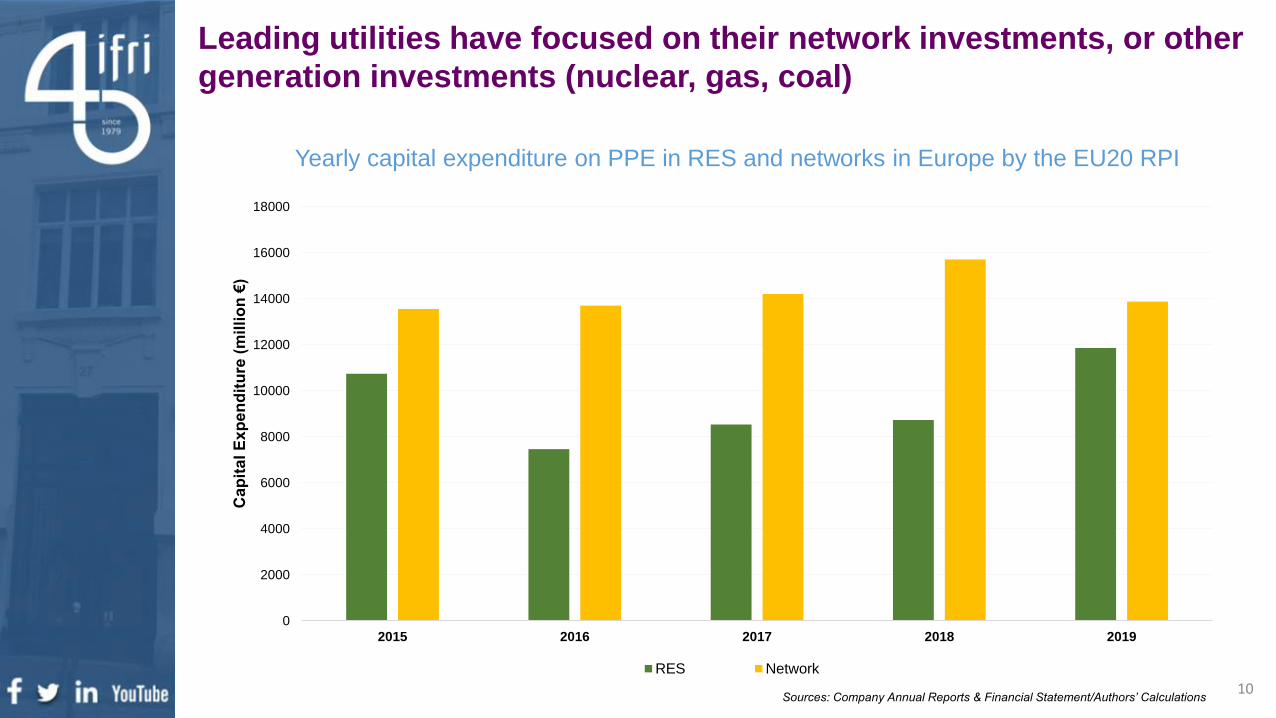
Leading utilities have focused on their network investments, or other
generation investments (nuclear, gas, coal)
Yearly capital expenditure on PPE in RES and networks in Europe by the EU20 RPI
Sources: Company Annual Reports & Financial Statement/Authors’ Calculations
0
2000
4000
6000
8000
10000
12000
14000
16000
18000
2015 2016 2017 2018 2019
Cap
ital E
xp
en
dit
ure
(m
illi
on
€)
RES Network
10
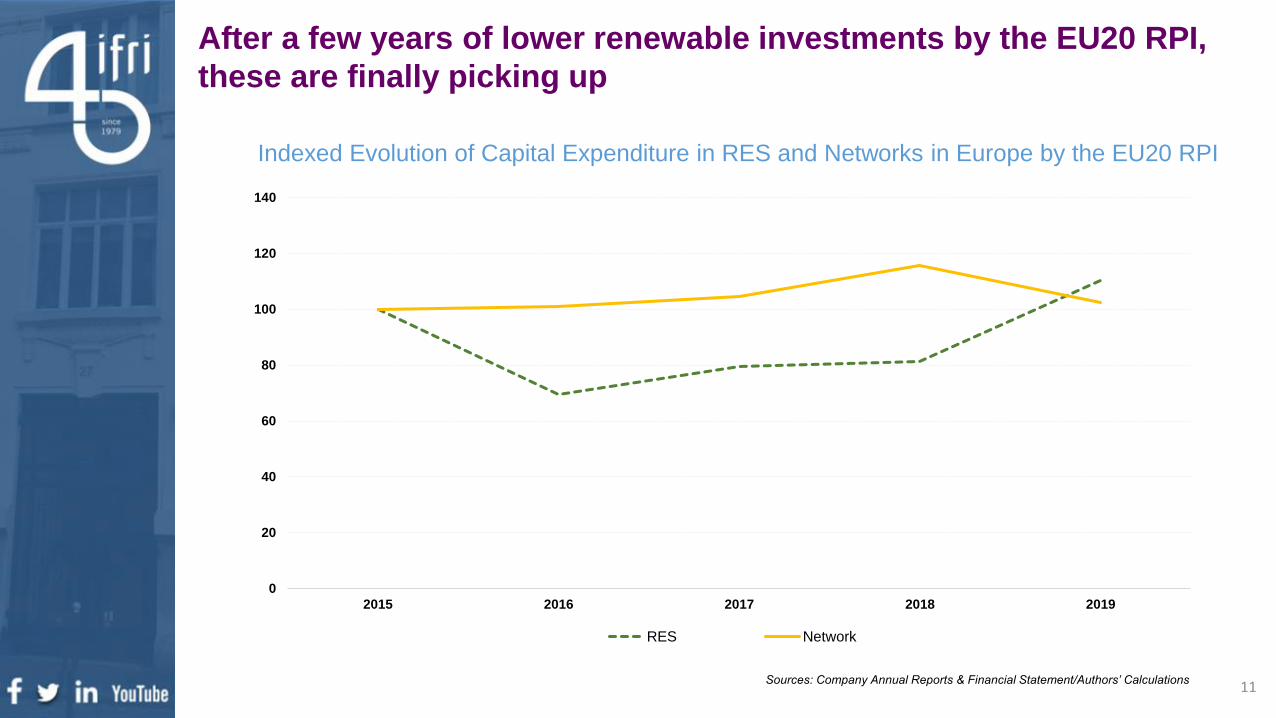
After a few years of lower renewable investments by the EU20 RPI,
these are finally picking up
0
20
40
60
80
100
120
140
2015 2016 2017 2018 2019
RES Network
Indexed Evolution of Capital Expenditure in RES and Networks in Europe by the EU20 RPI
Sources: Company Annual Reports & Financial Statement/Authors’ Calculations11

➢ Overall, RES installed capacity in Europe has increased by 132 GW over this period. Yet
only, 20GW of the newly added RES capacity is owned by the EU20 RPI.
➢ Europe added a total of 68 GW of wind of which 12 GW belongs to the EU20 RPI.
➢ Over the same period, European solar capacity increased by 55 GW of which the EU20 RPI
owns only 1,5 GW.
➢ Biomass and hydro capacity has remained relatively stable, with a null increase in biomass
and a respectable 9GW of additional hydro capacity in Europe of which 2 GW is owned by
the EU20 RPI.
➢ Capital expenditure in networks have remained relatively stable across the 2015-2019. Yet,
more RES penetration will trigger more investment needs.
The capex and competences required for wind as opposed to solar may explain the
dominance of the utilities in wind technology as opposed to solar. Yet, these utilities have
installed solar capacities for other actors including private citizens, farms and businesses.
First takeaways, period 2015-2019: despite their size, utilities played a
marginal role in the European renewable energy investments
12
13
1. Introduction to the EU top 20 Renewable Power Index (EU20 RPI) and implications of the new – 55% target for electricity investments
2. The period 2015-2019: renewables not the priority of the EU20 RPI3. The medium term perspective to 2025: on track for the new -55%
target?4. Highlights & conclusion5. Annexes
Sources: Company Annual Reports & Presentations/Authors Calculations14
0
50
100
150
200
250
300
350
2015 2016 2017 2018 2019 2025
Insta
lled
Cap
ac
ity
(GW
)
Hydro Wind Solar Total
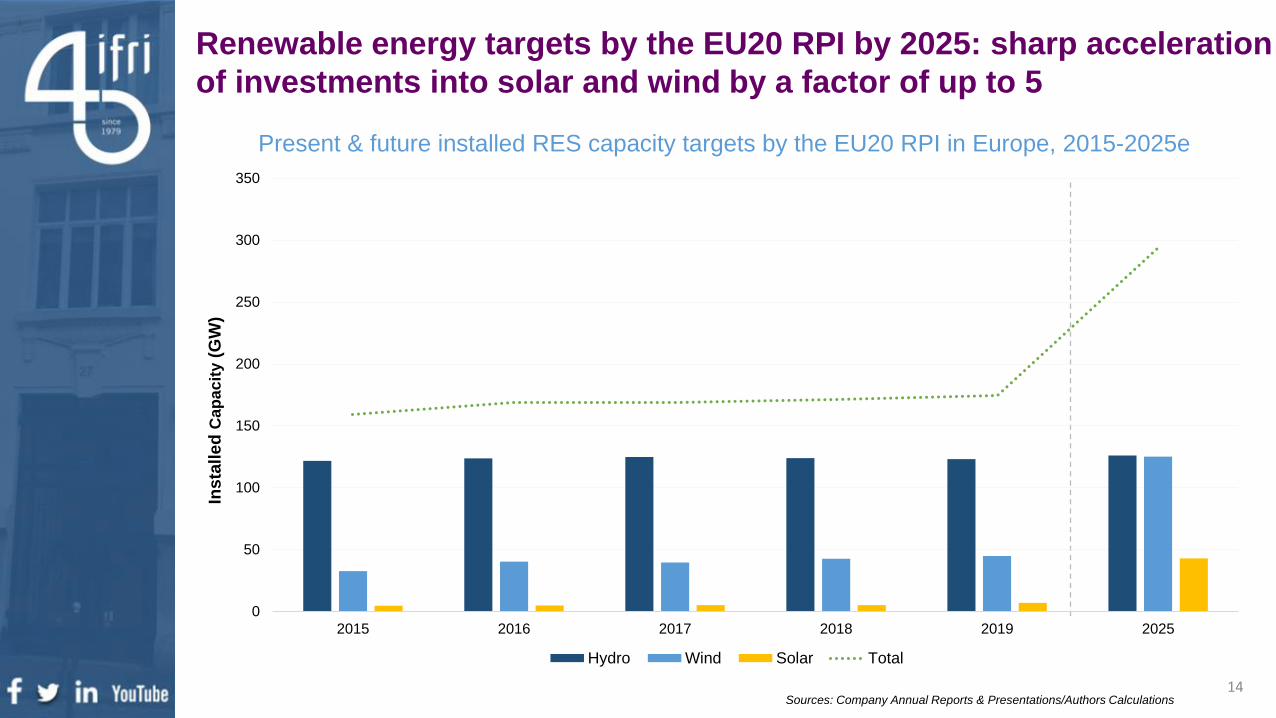
Present & future installed RES capacity targets by the EU20 RPI in Europe, 2015-2025e
Renewable energy targets by the EU20 RPI by 2025: sharp acceleration
of investments into solar and wind by a factor of up to 5
15
0
100
200
300
400
500
600
700
800
900
2015 2016 2017 2018 2019 2025
Ins
tall
ed
Cap
ac
ity (
GW
)
Hydro Wind Solar Total
Source: IEA World Energy Outlooks, ENTSOE Statistical Factbooks,
European Commission
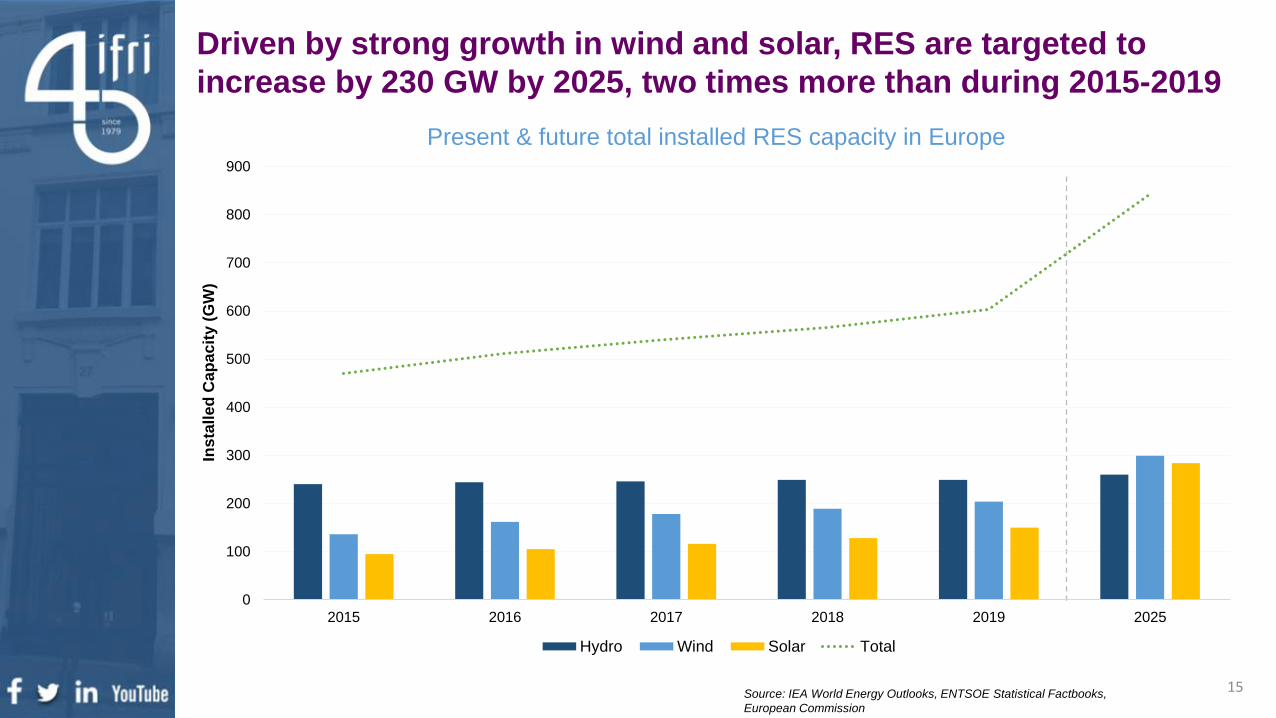
Present & future total installed RES capacity in Europe
Driven by strong growth in wind and solar, RES are targeted to
increase by 230 GW by 2025, two times more than during 2015-2019
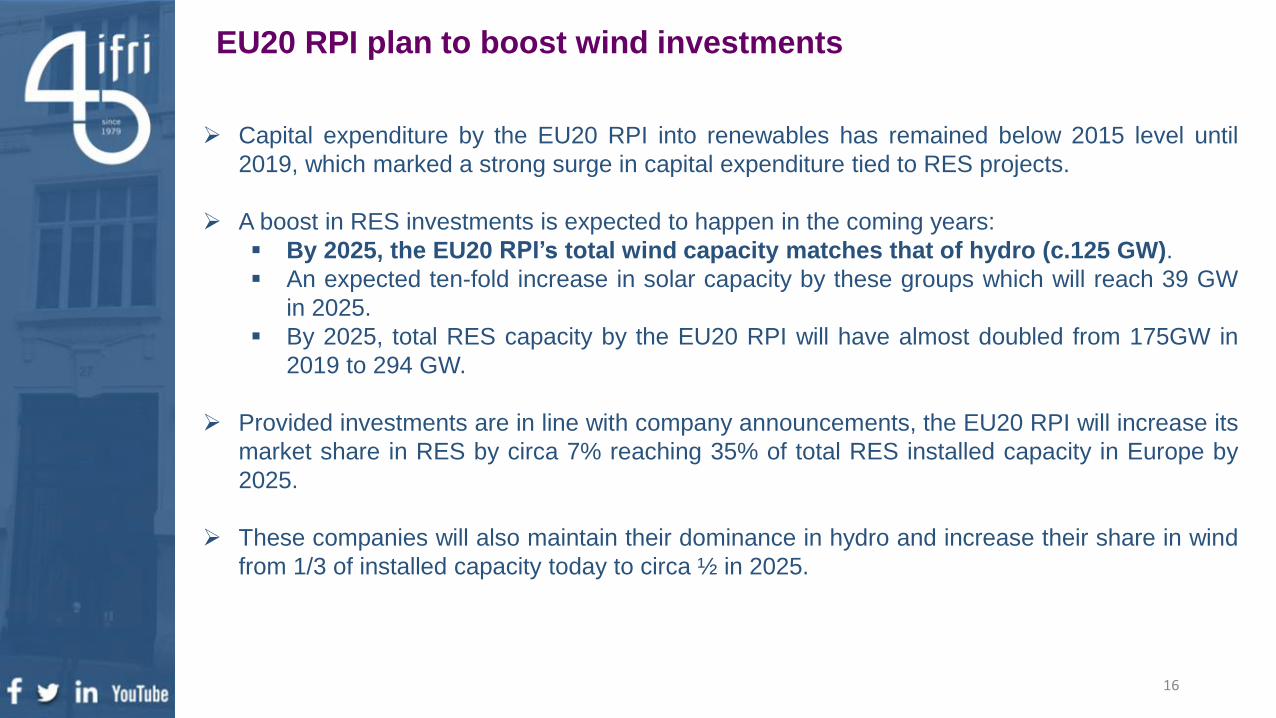
EU20 RPI plan to boost wind investments
➢ Capital expenditure by the EU20 RPI into renewables has remained below 2015 level until
2019, which marked a strong surge in capital expenditure tied to RES projects.
➢ A boost in RES investments is expected to happen in the coming years:
▪ By 2025, the EU20 RPI’s total wind capacity matches that of hydro (c.125 GW).
▪ An expected ten-fold increase in solar capacity by these groups which will reach 39 GW
in 2025.
▪ By 2025, total RES capacity by the EU20 RPI will have almost doubled from 175GW in
2019 to 294 GW.
➢ Provided investments are in line with company announcements, the EU20 RPI will increase its
market share in RES by circa 7% reaching 35% of total RES installed capacity in Europe by
2025.
➢ These companies will also maintain their dominance in hydro and increase their share in wind
from 1/3 of installed capacity today to circa ½ in 2025.
16
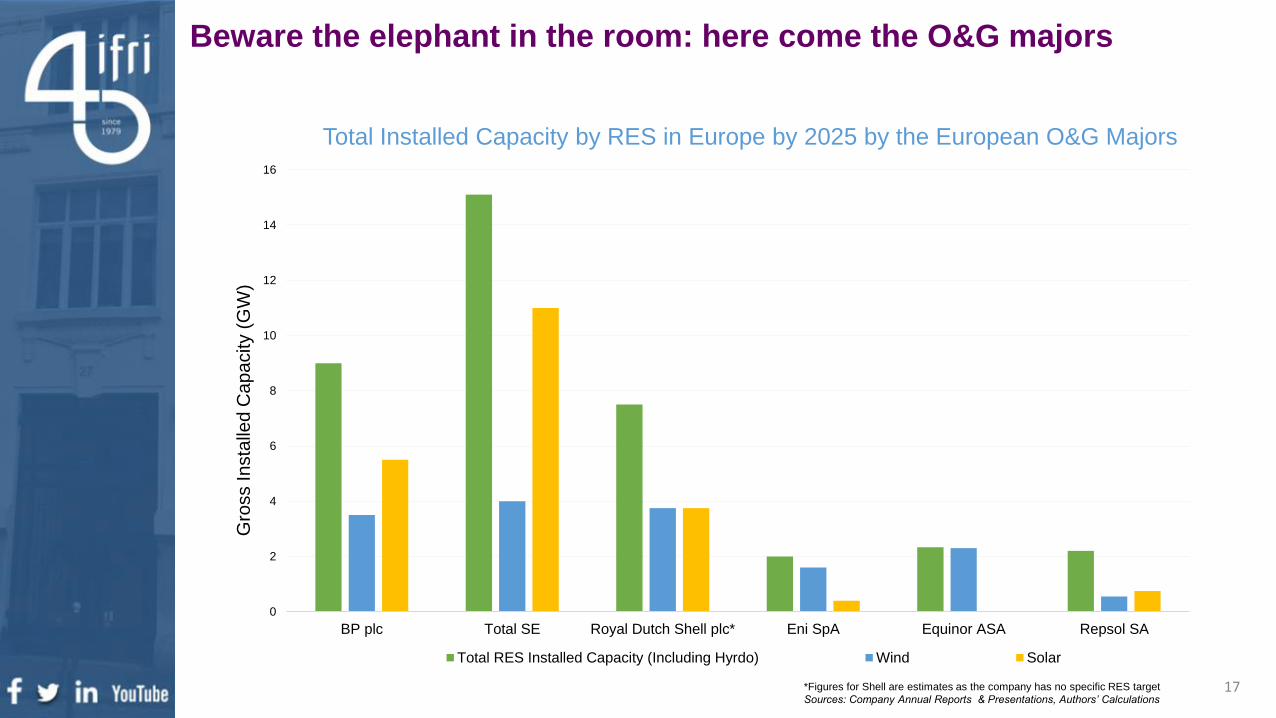
Beware the elephant in the room: here come the O&G majors
0
2
4
6
8
10
12
14
16
BP plc Total SE Royal Dutch Shell plc* Eni SpA Equinor ASA Repsol SA
Gro
ss In
sta
lled
Ca
pa
city (
GW
)
Total RES Installed Capacity (Including Hyrdo) Wind Solar
Total Installed Capacity by RES in Europe by 2025 by the European O&G Majors
*Figures for Shell are estimates as the company has no specific RES target
Sources: Company Annual Reports & Presentations, Authors’ Calculations17
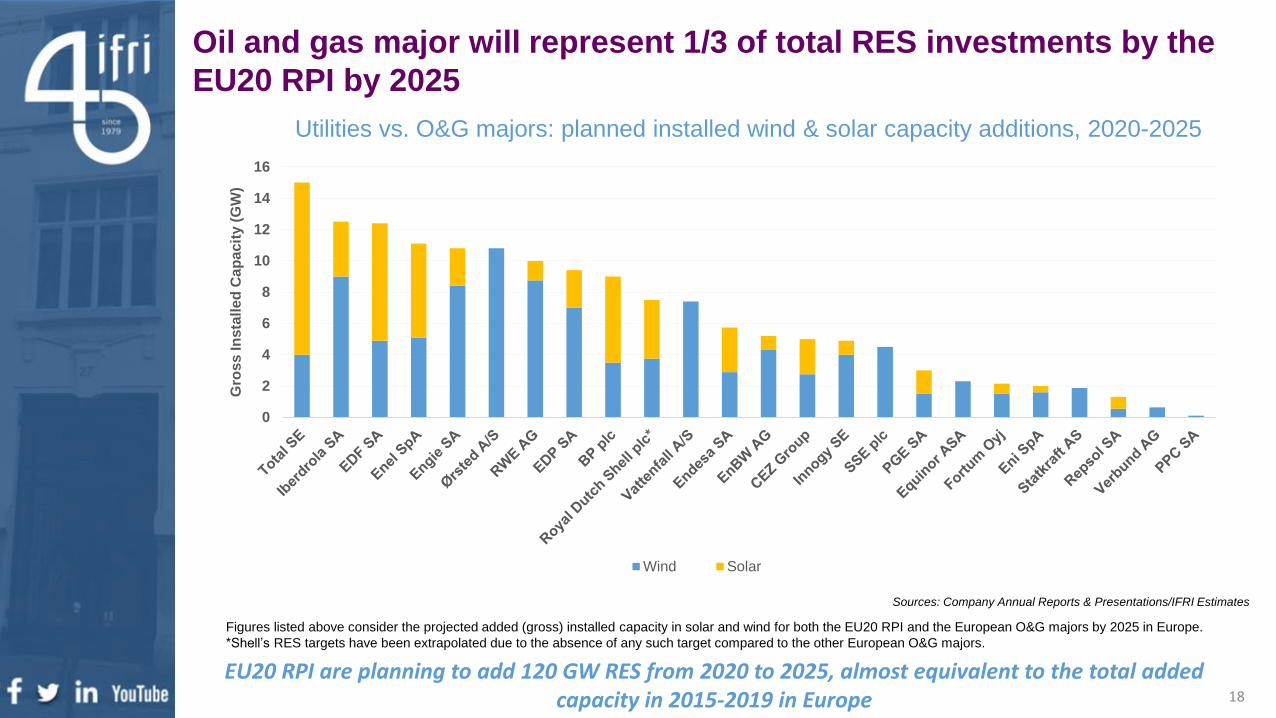
Utilities vs. O&G majors: planned installed wind & solar capacity additions, 2020-2025
Figures listed above consider the projected added (gross) installed capacity in solar and wind for both the EU20 RPI and the European O&G majors by 2025 in Europe.
*Shell’s RES targets have been extrapolated due to the absence of any such target compared to the other European O&G majors.
Sources: Company Annual Reports & Presentations/IFRI Estimates
Oil and gas major will represent 1/3 of total RES investments by the
EU20 RPI by 2025
18
EU20 RPI are planning to add 120 GW RES from 2020 to 2025, almost equivalent to the total addedcapacity in 2015-2019 in Europe
0
2
4
6
8
10
12
14
16
Gro
ss In
sta
lle
d C
ap
acit
y (
GW
)
Wind Solar
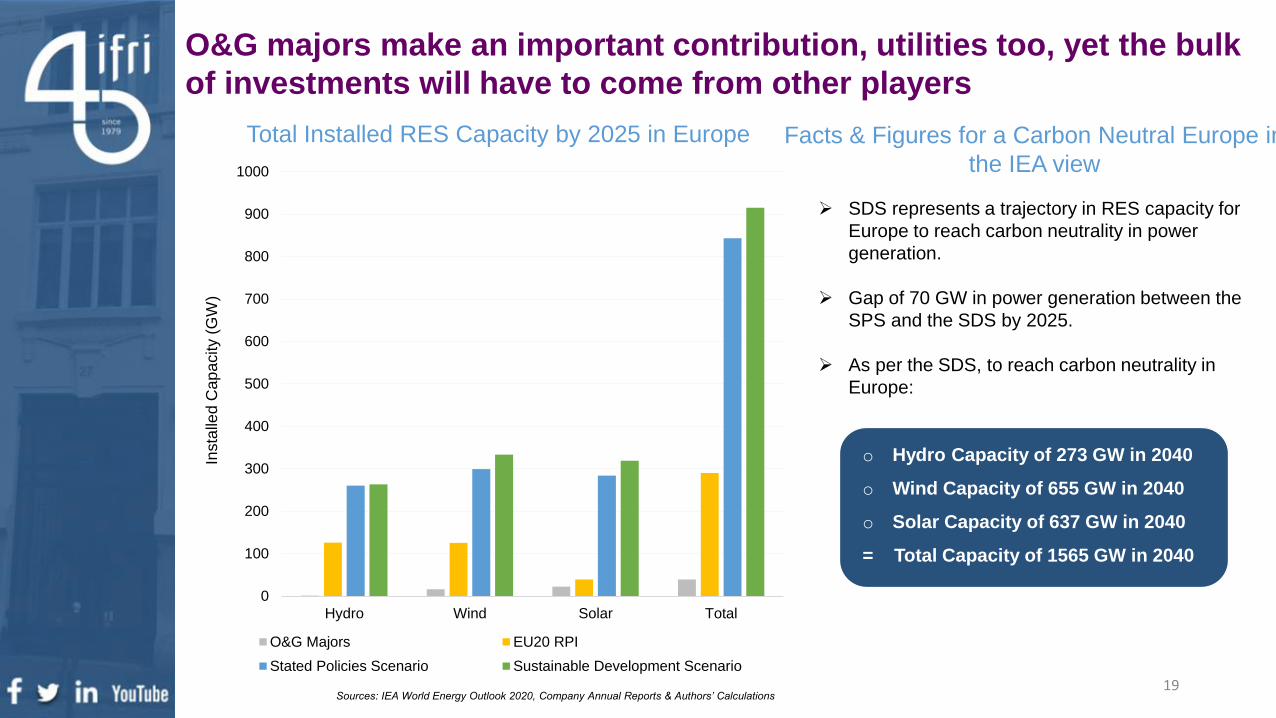
O&G majors make an important contribution, utilities too, yet the bulk
of investments will have to come from other players
Total Installed RES Capacity by 2025 in Europe
Sources: IEA World Energy Outlook 2020, Company Annual Reports & Authors’ Calculations
Facts & Figures for a Carbon Neutral Europe in
the IEA view
➢ SDS represents a trajectory in RES capacity for
Europe to reach carbon neutrality in power
generation.
➢ Gap of 70 GW in power generation between the
SPS and the SDS by 2025.
➢ As per the SDS, to reach carbon neutrality in
Europe:
o Hydro Capacity of 273 GW in 2040
o Wind Capacity of 655 GW in 2040
o Solar Capacity of 637 GW in 2040
= Total Capacity of 1565 GW in 2040
0
100
200
300
400
500
600
700
800
900
1000
Hydro Wind Solar Total
Insta
lled
Cap
acity (
GW
)
O&G Majors EU20 RPI
Stated Policies Scenario Sustainable Development Scenario
19
20
1. Introduction to the EU top 20 Renewable Power Index (EU20 RPI) and implications of the new – 55% target for electricity investments
2. The period 2015-2019: renewables not the priority of the EU20 RPI3. The medium term perspective to 2025: on track for the new -55% target?4. Highlights & conclusion5. Annexes
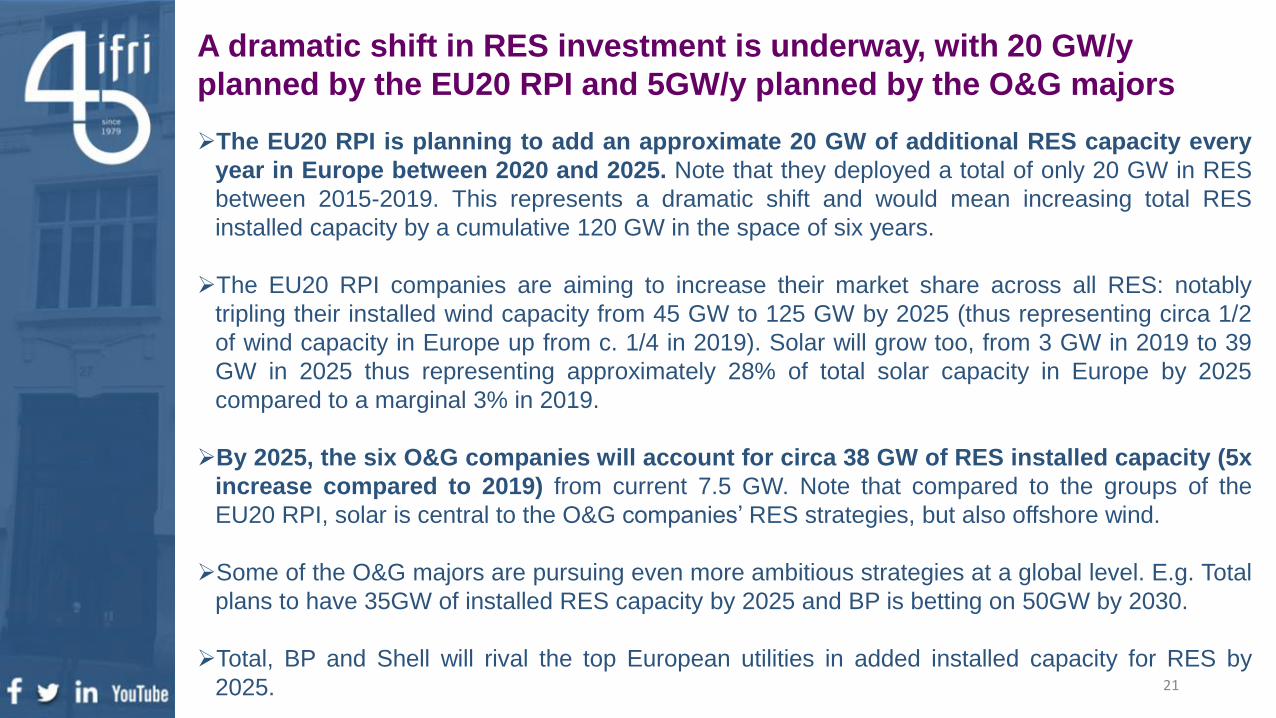
A dramatic shift in RES investment is underway, with 20 GW/y
planned by the EU20 RPI and 5GW/y planned by the O&G majors
➢The EU20 RPI is planning to add an approximate 20 GW of additional RES capacity every
year in Europe between 2020 and 2025. Note that they deployed a total of only 20 GW in RES
between 2015-2019. This represents a dramatic shift and would mean increasing total RES
installed capacity by a cumulative 120 GW in the space of six years.
➢The EU20 RPI companies are aiming to increase their market share across all RES: notably
tripling their installed wind capacity from 45 GW to 125 GW by 2025 (thus representing circa 1/2
of wind capacity in Europe up from c. 1/4 in 2019). Solar will grow too, from 3 GW in 2019 to 39
GW in 2025 thus representing approximately 28% of total solar capacity in Europe by 2025
compared to a marginal 3% in 2019.
➢By 2025, the six O&G companies will account for circa 38 GW of RES installed capacity (5x
increase compared to 2019) from current 7.5 GW. Note that compared to the groups of the
EU20 RPI, solar is central to the O&G companies’ RES strategies, but also offshore wind.
➢Some of the O&G majors are pursuing even more ambitious strategies at a global level. E.g. Total
plans to have 35GW of installed RES capacity by 2025 and BP is betting on 50GW by 2030.
➢Total, BP and Shell will rival the top European utilities in added installed capacity for RES by
2025. 21
Oil & gas major make a much-needed boost, but more is needed to
be on track for the new -55% objective by 2030
From O&G to fully
integrated energy
company
The European
power generation
sector and the new
2030 target
The next steps?
➢ The European O&G majors are still relatively minor players in RES. However, this situation will
likely change as by 2025, the total capacity installed in RES in Europe by these players
could reach 38 GW (+30GW in six years), which will also foster competition.
➢ When compared with the IEA SDS scenario, capacity additions that are planned by EU20
RPI and O&G majors are compatible with the levels required for Europe to reach -55% by
2030. Yet, the following conditions have to be met:
▪ Governments provide public support & enabling regulation, there is consensus and certainty
over the new 2030 target
▪ Despite the covid19 pandemic, the EU20 RPI and O&G majors are still able and willing to
pursue these objectives
▪ EU20 RPI and O&G majors meet deployment needs with net capacity additions, not M&A.
▪ The EU20 RPI and O&G majors represent just over half of the total capacity additions
needed. Hence why it is adamant that the other players ramp up their investments too.
➢ Investments in network technologies will have to pick up the pace in order to deal with the
increasing influx of RES in a bid to guarantee grid resilience and stability. Indeed grid investments
have not increased over said period despite greater RES deployment.
22
23
1. Introduction to the EU top 20 Renewable Power Index (EU20 RPI) and implications of the new – 55% target for electricity investments
2. The period 2015-2019: renewables not the priority of the EU20 RPI3. The medium term perspective to 2025: on track for the new -55% target?4. Highlights & conclusion5. Annexes
0
50
100
150
200
250
2015 2016 2017 2018 2019
Hydro Wind Solar Other
0
20000
40000
60000
80000
100000
120000
140000
2015 2016 2017 2018 2019
Insta
lled
Cap
acit
y (
MW
)
Hydro Wind Solar Other
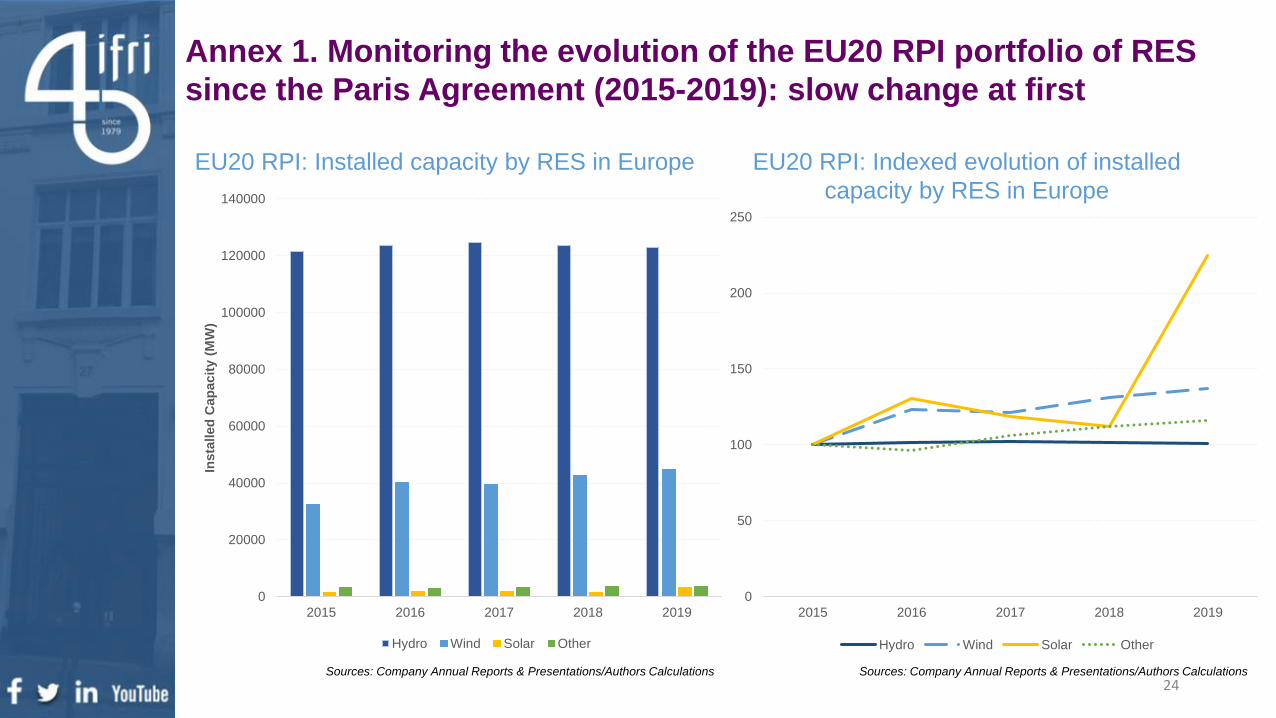
Annex 1. Monitoring the evolution of the EU20 RPI portfolio of RES
since the Paris Agreement (2015-2019): slow change at first
EU20 RPI: Indexed evolution of installed
capacity by RES in Europe
EU20 RPI: Installed capacity by RES in Europe
Sources: Company Annual Reports & Presentations/Authors Calculations Sources: Company Annual Reports & Presentations/Authors Calculations
24
0
50
100
150
200
250
300
350
2015 2016 2017 2018 2019 2020 2021 2022 2023 2024 2025
Insta
lled
Cap
acity (
GW
)
Hydro Wind Solar Total
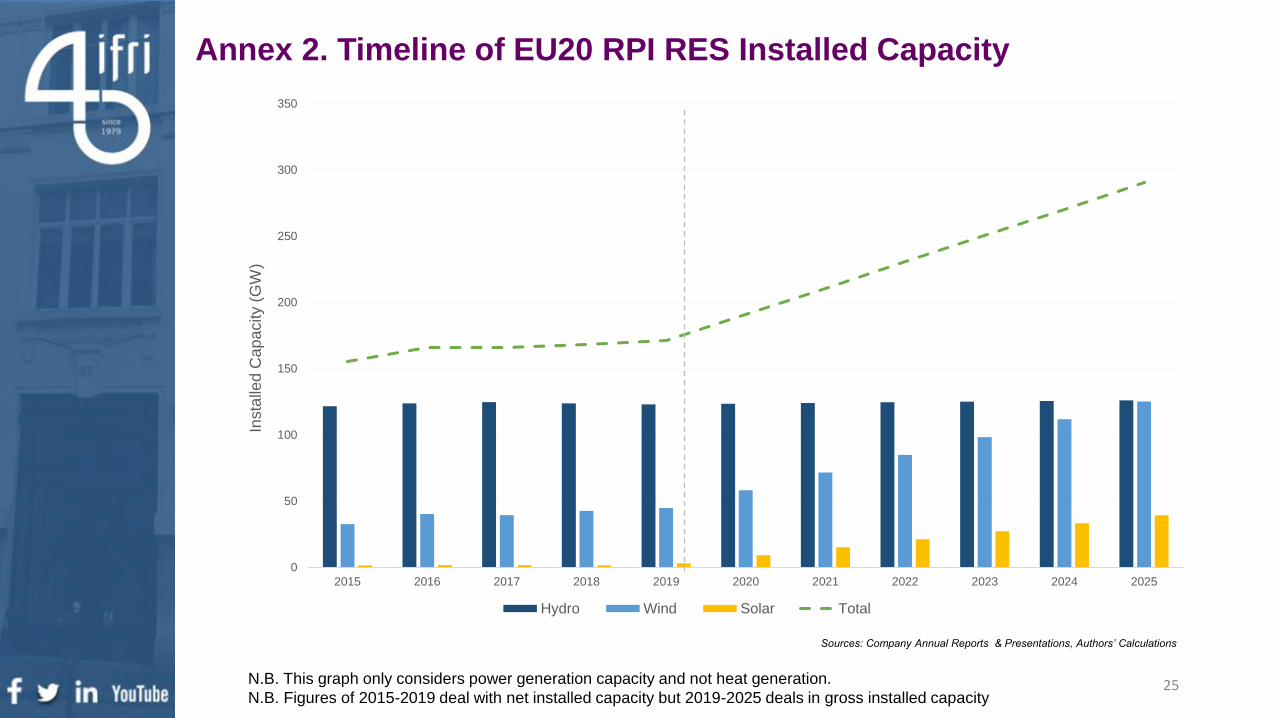
Annex 2. Timeline of EU20 RPI RES Installed Capacity
N.B. This graph only considers power generation capacity and not heat generation.
N.B. Figures of 2015-2019 deal with net installed capacity but 2019-2025 deals in gross installed capacity
Sources: Company Annual Reports & Presentations, Authors’ Calculations
25
26
0%
20%
40%
60%
80%
100%
120%
Sources: Company Annual Reports & Presentations, Authors’ Calculations
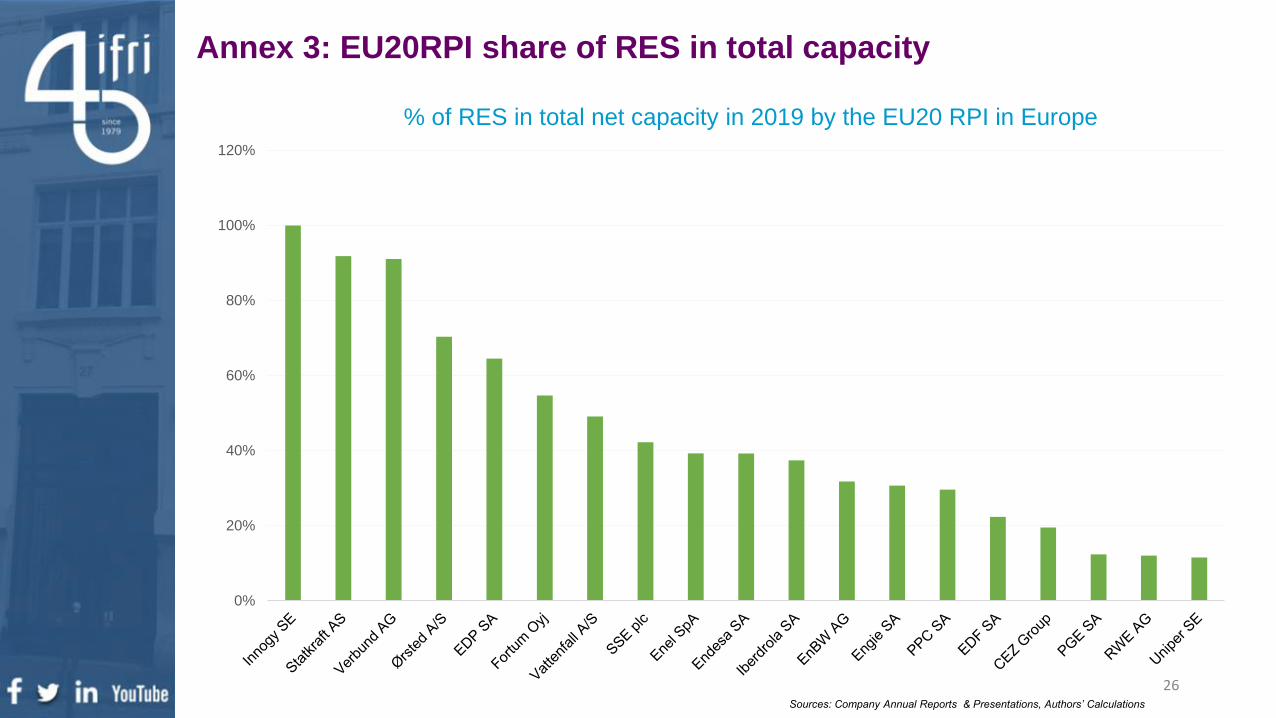
Annex 3: EU20RPI share of RES in total capacity
% of RES in total net capacity in 2019 by the EU20 RPI in Europe
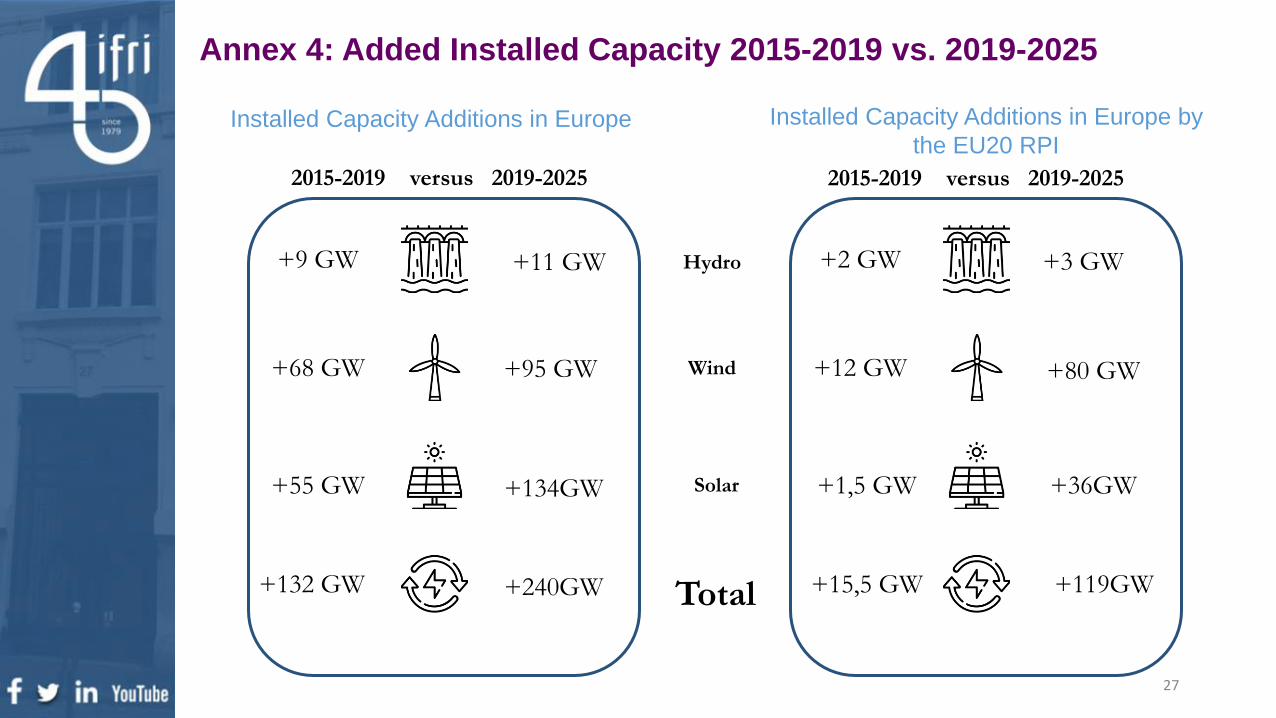
Annex 4: Added Installed Capacity 2015-2019 vs. 2019-2025
+9 GW +11 GW
+68 GW +95 GW
+55 GW +134GW
+132 GW +240GW
+2 GW +3 GW
+12 GW +80 GW
+1,5 GW +36GW
+15,5 GW +119GW
Hydro
Wind
Solar
Total
Installed Capacity Additions in Europe Installed Capacity Additions in Europe by
the EU20 RPI
2015-2019 versus 2019-2025 2015-2019 versus 2019-2025
27
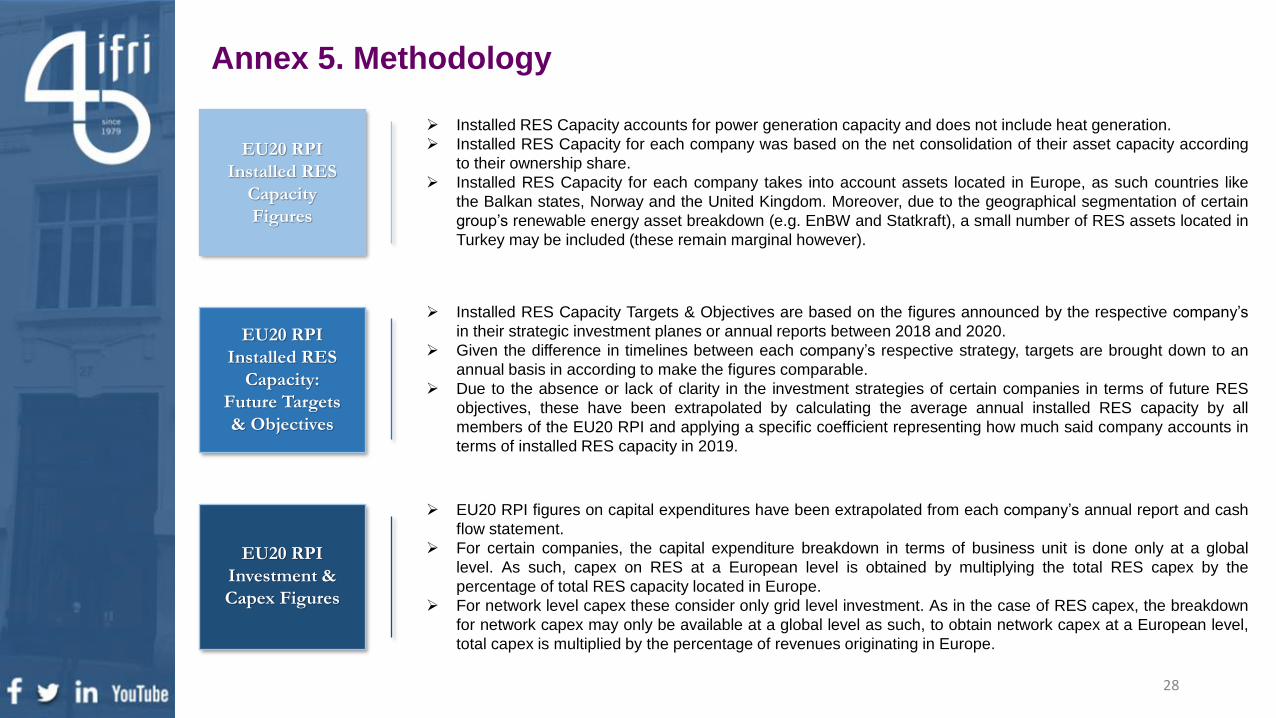
Annex 5. Methodology
➢ Installed RES Capacity accounts for power generation capacity and does not include heat generation.
➢ Installed RES Capacity for each company was based on the net consolidation of their asset capacity according
to their ownership share.
➢ Installed RES Capacity for each company takes into account assets located in Europe, as such countries like
the Balkan states, Norway and the United Kingdom. Moreover, due to the geographical segmentation of certain
group’s renewable energy asset breakdown (e.g. EnBW and Statkraft), a small number of RES assets located in
Turkey may be included (these remain marginal however).
EU20 RPI
Installed RES
Capacity
Figures
EU20 RPI
Installed RES
Capacity:
Future Targets
& Objectives
➢ Installed RES Capacity Targets & Objectives are based on the figures announced by the respective company’s
in their strategic investment planes or annual reports between 2018 and 2020.
➢ Given the difference in timelines between each company’s respective strategy, targets are brought down to an
annual basis in according to make the figures comparable.
➢ Due to the absence or lack of clarity in the investment strategies of certain companies in terms of future RES
objectives, these have been extrapolated by calculating the average annual installed RES capacity by all
members of the EU20 RPI and applying a specific coefficient representing how much said company accounts in
terms of installed RES capacity in 2019.
EU20 RPI
Investment &
Capex Figures
➢ EU20 RPI figures on capital expenditures have been extrapolated from each company’s annual report and cash
flow statement.
➢ For certain companies, the capital expenditure breakdown in terms of business unit is done only at a global
level. As such, capex on RES at a European level is obtained by multiplying the total RES capex by the
percentage of total RES capacity located in Europe.
➢ For network level capex these consider only grid level investment. As in the case of RES capex, the breakdown
for network capex may only be available at a global level as such, to obtain network capex at a European level,
total capex is multiplied by the percentage of revenues originating in Europe.
28

Center for Energy & Climate
27, rue de la Procession, 75740 PARIS CEDEX 15
Tél. +33 (0) 1 40 61 60 00 • Fax : +33 (0) 1 40 61 60 60
www.ifri.org
29