Embed Size (px)
Citation preview

UniCredit Research page 1 See last pages for disclaimer..
4 November 2019 Credit Research
Sector Report - Automobiles & Parts
European auto sector: Electrification in the 2020s – A decade of green investments by Dr. Sven Kreitmair, CFA, Head of Credit Research (UniCredit Bank, Munich)
Summary Increased awareness related to climate change and urban air quality and regulation intended to reduce the CO2 and NOx emissions of passenger cars have led to significant investment announcements both in new electric-vehicle (EV) production and battery-production capacities. They have also led to increased long-term growth projections for EV sales over the last few years. Incentives, declining battery prices, widening model choice and post-EU6 regulation are expected to drive battery electric vehicle (BEV) adoption in Europe. The share of EVs driven in Europe is expected to overtake that of China in the mid-2020s. Out of the more than 300 EV models expected to be available on the European market by 2025, Volkswagen Group (VW) is projected to offer the largest share by far. It is expected to defend its No. 1 market share in Europe also in the EV segment and (given its sheer size and the amount of investment it has focused on EVs) globally. Key barriers to EV growth forecasts are associated with raw materials, charging infrastructure and grids but also with employment considerations and the affordability of EVs. At automobile manufacturers, the transformation towards electrification is projected to lead to high investment needs and, in many cases initially, to lower profitability in EV sales and as a result is a driver of industry consolidation. At auto suppliers, the EV growth scenario has led to lower valuations of powertrain businesses and spin-off transactions. With increasing EV sales, there are increasing opportunities in the auto sector to refinance electro-mobility projects with sustainable finance instruments.
The contents of this sector report are as follows:
1. Regulatory push to reduce CO2 2. EV growth forecast by drivetrain, region and manufacturer 3. Battery factory demand, capacity and investment need 4. Barrier 1: raw materials for batteries and ESG risks 5. Barrier 2: charging infrastructure and grid investments 6. Barrier 3: employment and affordability 7. The high initial investments and low profitability of EV
sales for auto manufacturers 8. Auto suppliers and low powertrain business valuations 9. Sustainable financing in the auto sector should increase
Regulatory push to reduce CO2 The need for green automobiles ■ At the 21st annual session of the Conference of the
Parties meeting in Paris in 2015, 195 countries signed a legally binding agreement to keep global warming “well below 2 degrees Celsius above pre-industrial levels, and to pursue efforts to limit the temperature increase even further to 1.5 degrees Celsius” within this century1. Transport is Europe’s largest source of carbon emissions contributing 27% to the EU’s total CO2 emissions, with cars representing 44% of these, according to the European Environment Agency, as quoted by Transport & Environment (T&E).2 Transport is the only major sector in which emissions have grown since 1990, driving an increase in the EU’s overall emissions in 2017 (latest year available). According to T&E,3 the European Commission has proposed a net zero 2050 scenario, estimating that all new car sales will have to be zero emission by the mid-2030s. At least 24 EU countries support the 2050 carbon neutrality goal – the high level agreement is expected in autumn 2019.
CHART 1: GERMANY’S GHG EMISSIONS AND TARGETS
Source: Umweltbundesamt4
1European Commission on Paris Agreement; United Nations‘ FAQ on Paris Agreement 2Transport & Environment “Electric surge – Carmakers’ electric car plans across Europe 2019-2025” 3Transport & Environment “Electric surge – Carmakers’ electric car plans across Europe 2019-2025” 4Website Klimaschutzziele Deutschlands

11 December 2019 Credit Research
Sector Report - Automobiles & Parts
UniCredit Research page 2 See last pages for disclaimer.
■ An important aspect of the German Klimapaket (climate protection package) is its encouragement of the transition to electric car use.5 Seven million to 10mn EVs are slated to be registered in Germany by 2030. With the law on tax incentives for electric mobility, the company car rules for the use of a BEV or a plug-in hybrid vehicle (PHEV) will be prolonged until 2030. The company car tax on all EVs priced up to and including those priced at EUR 40,000 will be reduced from 0.5% to 0.25%. In addition, the tax exemption stipulated by Section 3d of Germany’s Kraftfahrzeugsteuergesetz (motor vehicle tax act) will be extended until 31 December 2025. The ten-year duration of the tax exemption is limited to 31 December 2030 at the latest. From 2021, the buying premium (paid by the federal government and the manufacturers) for passenger cars with electric, hybrid and hydrogen engines/fuel-cell drivetrains will be prolonged, and for cars priced below EUR 40,000, this premium will be increased.
■ To achieve the two-degree scenario, the equivalent of 160mn low-emission vehicles – 80mn zero-emission and 80mn PHEVs – will need to be on the roads by 2030, just 12 years from today6. The German Climate Action Plan 2050 outlined by the UN is the country’s long-term development strategy to lower GHG emissions, as required under the Paris Agreement.7 The energy sector causes more than 80% of total emissions in Germany, and the electricity supply is responsible for 40% of the energy sector’s CO2 emissions. In order to achieve an 80-90% reduction in greenhouse gas (GHG) emissions by 2050, the energy target is to have a 100% renewable electricity supply8 in contrast with the 40.2% target associated with 20189.
■ There are currently 47.1mn passenger cars registered in Germany (as of 1 January 2019), and the share of German brands is 64.1%.10 The average car age is 9.5 years, with a car density of 692 vehicles per 1,000 inhabitants. The share of registered vehicles equipped with a diesel engine is 32.2%, 1.0% are gas-powered vehicles, and the share of electrified vehicles is 0.9%, or 424,586 vehicles. The share of newly registered vehicles with alternative engines has been strongly increasing, and stood at 5.3% in 2018. Assuming, for example, 50mn registered passenger cars in 2030 in Germany, 7-10mn electrified vehicles would make up a share of 14-20%.
5Sector Report Germany’s Big 3 auto manufacturers: Klimapaket to support electrified product pipeline 6IEA as quoted by Hydrogen Council, November 2017, page 30 7Federal Ministry for the Environment, Nature Conservation and Nuclear Safety 8Umweltbundesamt, July 2010 9Fraunhofer ISE, December 2018 10Source: Kraftfahrt-Bundesamt
CHART 2: ALL-ELETRIC VEHICLE
Source: U.S. Department of Energy
■ BEVs do not burn fossil fuels directly unlike internal combustion engines (ICEs) and therefore have zero (local) emissions. Plug-in hybrid electric vehicles (PHEVs) typically use batteries to power an electric motor and use another fuel, such as gasoline, to power an internal combustion engine (ICE).11 PHEV batteries can be charged using a wall outlet or charging station, by the ICE, or through regenerative braking. The vehicle typically runs on electric power until the battery is depleted, and then the car automatically switches over to use the ICE.
■ 48V mild hybrid propulsion systems are not part of plug-in EVs. They reduce CO2 for gasoline and diesel engines by between 5-15% and reduces emissions (e.g. EURO 7).
■ EVs, however, are not necessarily more environmentally friendly than conventional combustion vehicles. If the electricity used to charge the EV comes from a coal power plant12, for example, they can lead to more emissions than even the worst ICE vehicle (see Chart 3).
11Definition by U.S. Department of Energy 12China coal usage as a portion of total energy consumption was 60.4% in 2017. See Reuters, January 2018.

11 December 2019 Credit Research
Sector Report - Automobiles & Parts
UniCredit Research page 3 See last pages for disclaimer.
CHART 3: CO2 EMISSIONS OVER THE WHOLE LIFECYCLE DEPENDS ON POWER MIX
Source: Hydrogen Council November 201713
■ According to the International Energy Agency (IEA), in 2018, the combined contribution of all renewable sources was only responsible for 27.4% of electricity generation, led by hydro (13.8%), wind (7.0%) and solar (3.0%). Natural gas overtook coal to become the leading source of electricity for the first time: natural gas accounted for 27.4% of this mix, compared to 25.4% for coal. In Germany, the renewable share is 46.5% in 2019 (2018: 40.6%)14. As mentioned, in order to improve the lifecycle CO2 emission of EVs, the renewable share needs to be increased further.
CHART 4: ELECTRICIY MIX OECD 2018
Source: iea.org
13Hydrogen council, November 2017, page 36; See MIT research, as quoted by Manager Magazin, which compares the life-cycle CO2 emissions (production, driving, disposal) of a Tesla Model X P100D, a Ford Fiesta SFE Eco boost and a BMW X5 xDrive 35d. 14 energy-charts.de
Potential fines in the EU for European automakers ■ End of 2018, Europe accelerated regulation to reduce
CO2 emissions. Emissions from new cars will have to be 37.5% lower in 2030 compared to 2021, and emissions from new vans will have to be 31% lower, with an intermediary step of a 15% cut for both cars and vans to be achieved by 202515. It is certainly difficult or maybe even impossible to reach these goals without a sufficient share of EVs in the sold fleet.
CHART 5: REGULATIONS TO REDUCE CO2 EMISSIONS IN NEW VEHICLE FLEETS
Source: ICCT, quoted by adea.be
■ There is already a discussion surrounding post-Euro-6 regulation (Euro 7).16 This discussion might lead to a lower and fuel-neutral set of limits for NOx, which would in turn increase costs for diesel-vehicle manufacturers in the form of more expensive exhaust-after-treatment technology.
■ China’s government requires carmakers to sell a minimum number of new-energy vehicles (NEV) annually from 2019. The new policy requires that NEV (i.e. PHEVs and BEVs) reach a threshold equivalent of 10% of total vehicles sales in 2019 and 12% in 202017.
15European Commission, December 2018 16International Council on Clean Transportation, March 2018 “Pathways for a post-Euro 6 regulation for LDV", AECC statement on Post-Euro 6/VI, October 2018 17Sector Flash dated 29 September 2017

11 December 2019 Credit Research
Sector Report - Automobiles & Parts
UniCredit Research page 4 See last pages for disclaimer.
■ On 7 December 2018, PA Consulting published its annual forecast for CO2 fines by the EU for European automakers, presented in Automobilwoche. PA said that those carmakers whose new-car fleet does not reach the calculated CO2 emissions target by the end of 2020 will have to pay EUR 95 per gram of CO2 emitted above the target. Eight of the thirteen manufacturers investigated risk being punished. In PA’s aggressive scenario (in terms of company strategy to reduce the CO2 emissions of the sold EU fleet), it sees Hyundai-Kia, BMW and Daimler, but also Groupe PSA, Mazda and the VW as still being able to narrow the gap.
CHART 6: ESTIMATED FINES (IN GERMAN LANGUAGE)
Source: Automobilwoche December 2018
■ The estimated fines are as follows: VW EUR 1.4bn, Fiat Chrysler Automobiles (FCA) EUR 700mn, PSA EUR 600mn, Ford EUR 430mn, Hyundai-Kia EUR 300mn, BMW EUR 200mn, Daimler EUR 190mn, and Mazda EUR 75mn. In its last estimate in 2017, PA estimated VW’s fine to be EUR 1.7bn, FCA at EUR 1.2bn and BMW’s at EUR 700mn. Therefore, the estimates were slightly lowered. See our comment in the Daily Credit Briefing dated 25 September 2017.
■ According to an article published in the Financial Times in April 2019, FCA pooled its fleet with Tesla to comply with the EU’s stricter CO2 emission rules and agreed to pay Tesla hundreds of millions of euros so that Tesla’s vehicles are counted in its fleet to avoid large fines for breaking EU emissions rules. A notification on the European Commission website shows that FCA formed an open pool with Tesla on 25 February. Mazda and Toyota are also forming a pool. The so-called open-pool option available in the EU allows automakers to group their fleets together to meet targets.
Petrol and diesel bans in many countries and cities ■ Different countries have announced (proposed and put
into law) bans on the sale of new petrol or diesel vehicles in the period 2025-50. The following table shows an overview of countries that have proposed or put into law a ban, excluding countries with a target of only no full petrol or diesel vehicles (e.g. Japan) or a partial target (e.g. Mexico).
CHART 7: CITIES ARE INCREASINGLY INTRODUCING RESTRICTIONS ON ICE VEHICLES, WHILE MANY NATIONAL GOVERNMENTS ARE CONSIDERING ENDING ICE VEHICLE SALES
Source: McKinsey18
■ A number of major cities also aim to reduce air pollution and improve safety. In addition to implementing outright bans, cities have enacted measures to encourage cycling and to make public spaces more pedestrian-friendly.19 Most of the cities that are starting to ban cars are located in Europe. The 15 major cities around the world that are starting to ban cars in different forms are Madrid, Paris, New York, Oslo, London, Mexico City, Copenhagen, Brussels, Milan, Rome, Athens, Frankfurt, Berlin, Bogota, and Amsterdam.
EV growth forecast by drivetrain, region and manufacturer ■ Over 2mn EVs were sold globally in 2018, and this
growth rate continues to stay significant. Lithium-ion-battery-powered EVs are becoming larger in capacity and being built quicker than the majority expected.20 This trend seems to have been accelerated by increasingly stringent CO2 legislation, particularly in Europe and China, leading to potential fines, climate action plans of different countries with targets dates to ending the sale of new petrol or diesel vehicles, city bans on cars equipped with ICEs and increasing public awareness on ESG topics and at investors.
18McKinsey June 2019, “Recharging economies: The EV-battery manufacturing outlook for Europe” 19Business Insider, “5 major cities around the world that are starting to ban cars”, January 2019 20Benchmarkminerals.com

11 December 2019 Credit Research
Sector Report - Automobiles & Parts
UniCredit Research page 5 See last pages for disclaimer.
CHART 8: SIGNIFICANT GLOBAL GROWTH IN PLUG-IN VEHICLES SALES 2017-19
Source: ev-volumes.com
■ T&E expects that as more EV models are produced and become available, the number of EVs will also grow as carmakers will be more actively selling these EVs. The reason for this is the need to comply with CO2 regulations in early 2020s, and after 2024, EVs are expected to reach market maturity given price parity with conventional cars. EU car makers are investing EUR 145.8bn in electric cars and batteries, and the success of EVs has become a key industrial priority.21 By 2040, 57% of all passenger vehicle sales and over 30% of the global passenger vehicle fleet are expected to be electric.22 We assume that a significant increase in the EV share also assumes decreasing EV prices, increasing EV ranges and more charging stations, in particular at work and at home.
CHART 9: GLOBAL LONG-TERM PASSENGER-VEHICLE SALES BY DRIVETRAIN
Source: BloombergNEF Electric Vehicle Outlook 201923
21Transport & Environment “Electric surge – Carmakers’ electric car plans across Europe 2019-2025” 22BloombergNEF Electric Vehicle Outlook 2019 23BloombergNEF Electric Vehicle Outlook 2019
CHART 10: BNEF PROJECTIONS FO GLOBAL ELECTRIC CAR STOCK
Source: Quartz, BNEF24
■ We note that there are important differences across long-term EV-development projections (e.g. those from OPEC, Bloomberg New Energy Finance (BNEF), Exxon, US Energy Information Administration.25 BNEF seems to be the most optimistic. Nevertheless, an important general observation is that all projections went up every year in the period 2016-19. Regional development and shares also vary significantly by affordability, customer acceptance and government incentives. Countries or companies with high employment in ICE powertrain technology have an interest in increasing the share of PHEVs on the market given that such EVs require more employment as they also utilize both ICEs and batteries.
■ According to BNEF26, China continues to lead on EVs in all segments in its forecast. The country accounts for 48% of the passenger EV sales market in 2025, 34% in 2030 and 26% in 2040. Thanks to China’s policy support, China’s new energy vehicle sector surged to more than 1.26mn units in 2019 from fewer than 10,000 in 2009.
24Quartz, "Researchers have no idea when electric cars are going to take over", May 2019 25Quartz, "Researchers have no idea when electric cars are going to take over", May 2019 26BloombergNEF Electric Vehicle Outlook 2019

11 December 2019 Credit Research
Sector Report - Automobiles & Parts
UniCredit Research page 6 See last pages for disclaimer.
CHART 11: EUROPE IS EXPECTED TO OVERTAKE CHINA ON TOUGH CO2 TARGETS
Source: BNEF Electric Vehicle Outlook 2019
■ On 26 June 2019, China cut its subsidies for NEV by about 45-60% and have been completely scrapped for NEV with ranges below 250km per charge.27 This is intended to encourage carmakers to focus on product innovation, but will lead to intensified competition not only from fuel vehicle producers, but also from domestic and foreign NEV companies.28 NEV sales in China declined by 34.2% yoy in September compared to declines of 15.8% and 4.7% in August and July, respectively according to CAAM (China Association of Automobile Manufacturers.29
■ In March 2019, the Trump administration proposed in its 2020 US federal budget eliminating a tax credit worth up to USD 7,500 on the purchase of new EVs. It says this would save the U.S. government USD 2.5bn over a decade,30 Major automakers have been lobbying Congress to extend the credit that phases out after companies hit 200,000 vehicles sold. Tesla and GM both hit the 200,000 figure in 2018, but other major automakers were far from that figure in March 2019. The credit consumers receive for buying Teslas fell to USD 3,750 on 1 January 2019, dropped to USD 1,875 from 1 July 2019. The credit for GM vehicles will fell to USD 3,750 on 1 April 2019, and then drop to USD 1,875 on 1 October 2019 and it will completely disappear for Tesla buyers in January 2020 and in April 2020 for GM.
27CNBC June 2019 28China daily July 2019 29quoted by marketrealist.com October 2019 30Reuters March 2019
■ BNEF estimates that Europe quickly pulls ahead of the U.S. as the number two EV market in the 2020s. This change is driven by tightening fuel economy regulations and growing commitments from domestic automakers. BNEF added that India and other emerging economies go electric much slower, leading to a globally fragmented auto market. In markets like India and South East Asia, two- and three-wheeled vehicles are more attractive targets for electrification in the short term. Japan, South Korea and Australia all see significant adoption of EVs by 2040 with EVs representing 63%, 52% and 61% of passenger-vehicles sales respectively, according to BNEF forecasts.
CHART 12: INCENTIVES, WIDENING MODEL CHOICE AND POST-EU6 DRIVE BEV GROWTH
Source: LMC Automotive Executive Briefings – Internationale Automobil-Ausstellung (IAA) September 2019
■ In March 2019, just a few months after the announcement of the new and significantly reduced CO2 targets for 2030 in Europe, VW Group increased its plans for EVs. It announced that it now has plans to produce almost 70 new electric models by 2028, instead of the 50 previously planned.31 As a result, it projects the number of vehicles to be built on its electric platforms will increase from 15mn to 22mn. VW aims to reduce the CO2 footprint of its vehicle fleet by 30% across their lifecycles, compared to 2015. It is electrifying its vehicle portfolio with an investment of more than EUR 30bn by 2023, and the share of EVs it produces is to rise to at least 40% by 2030. The first wave will comprise the AUDI e-tron, Porsche Taycan, Volkswagen ID, ID.CROZZ, SEAT el-born, SKODA Vision E, ID.BUZZ, ID.VIZZION.32
■ Various car manufacturers have announced the production and launch of many new EVs. According to T&E,33 333 EV models are expected to be on the European market in 2025, compared to 176 in 2020.
31"VW plans 22mn electric vehicles in ten years", March 2019 32 Reportedly, pre-orders for Porsche Taycan are at 30,000 and for the VW ID3 at 22,000 in mid-July 2019; ADAC reported 30,000 orders for ID 3 in September 2019 33Transport & Environment ”Electric surge – Carmakers’ electric car plans across Europe 2019-2025”
11 December 2019 Credit Research
Sector Report - Automobiles & Parts
UniCredit Research page 7 See last pages for disclaimer.
CHART 13: VW WITH MOST AND TESLA WITH LEAST NUMBER OF EV MODELS
Source: Transport & Environment (IHS Markit)34, UniCredit Research
CHART 14: VW GROUP IS EXPECTED TO BECOME GLOBAL BEV LEADER
Source: LMC Automotive, UniCredit Research
■ In terms of EVs coming to the market in Europe, and in terms of global unit sales of EVs, VW Group is expected to outperform all other manufacturers. VW Group is expected to offer 78 EV models in 2025, up from 23 in 2019. This represents around 23% of all EV models on the market in Europe and is close to VW Group’s market share in European passenger-car registrations. Most competitors are expected to offer around 20-30 EV models by 2025.
34Transport & Environment “Electric surge – Carmakers’ electric car plans across Europe 2019-2025”
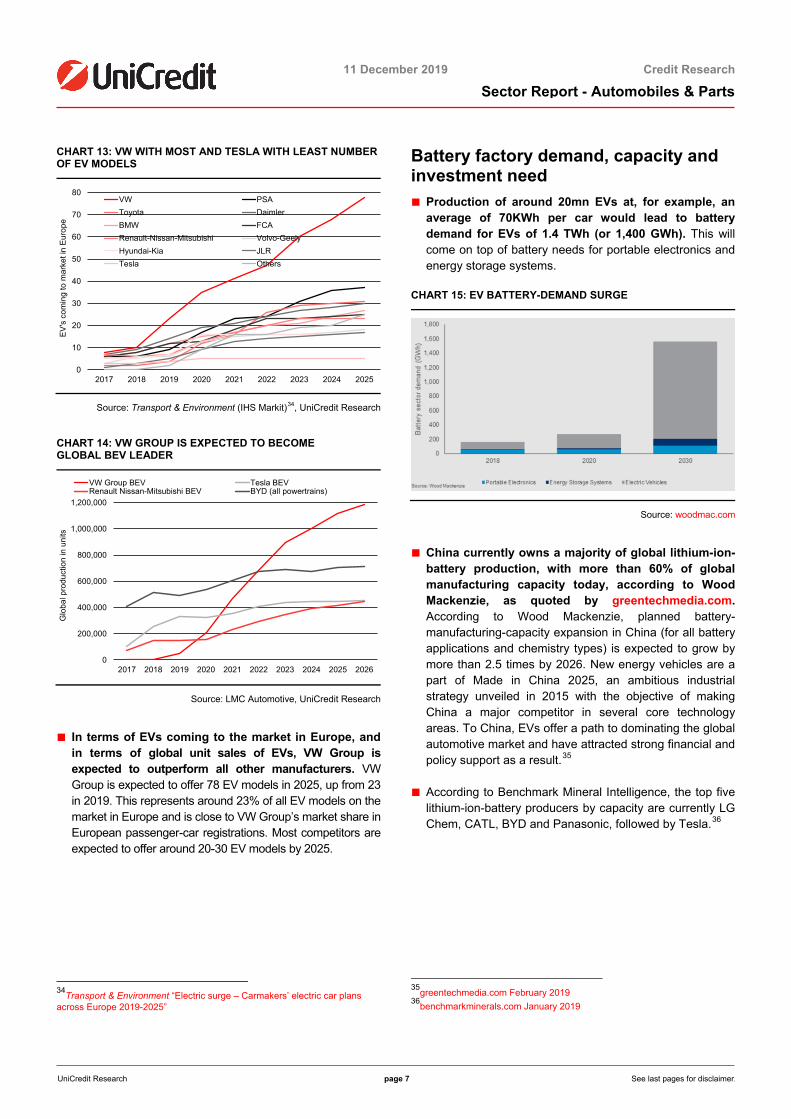
Battery factory demand, capacity and investment need ■ Production of around 20mn EVs at, for example, an
average of 70KWh per car would lead to battery demand for EVs of 1.4 TWh (or 1,400 GWh). This will come on top of battery needs for portable electronics and energy storage systems.
CHART 15: EV BATTERY-DEMAND SURGE
Source: woodmac.com
■ China currently owns a majority of global lithium-ion-battery production, with more than 60% of global manufacturing capacity today, according to Wood Mackenzie, as quoted by greentechmedia.com. According to Wood Mackenzie, planned battery-manufacturing-capacity expansion in China (for all battery applications and chemistry types) is expected to grow by more than 2.5 times by 2026. New energy vehicles are a part of Made in China 2025, an ambitious industrial strategy unveiled in 2015 with the objective of making China a major competitor in several core technology areas. To China, EVs offer a path to dominating the global automotive market and have attracted strong financial and policy support as a result.35
■ According to Benchmark Mineral Intelligence, the top five lithium-ion-battery producers by capacity are currently LG Chem, CATL, BYD and Panasonic, followed by Tesla.36
35greentechmedia.com February 2019 36benchmarkminerals.com January 2019
0
10
20
30
40
50
60
70
80
2017 2018 2019 2020 2021 2022 2023 2024 2025
EV
's c
omin
g to
mar
ket i
n E
urop
e
VW PSAToyota DaimlerBMW FCARenault-Nissan-Mitsubishi Volvo-GeelyHyundai-Kia JLRTesla Others
0
200,000
400,000
600,000
800,000
1,000,000
1,200,000
2017 2018 2019 2020 2021 2022 2023 2024 2025 2026
Glo
bal p
rodu
ctio
n in
uni
ts
VW Group BEV Tesla BEVRenault Nissan-Mitsubishi BEV BYD (all powertrains)

11 December 2019 Credit Research
Sector Report - Automobiles & Parts
UniCredit Research page 8 See last pages for disclaimer.
■ In October 2017, the European Commission launched the European Battery Alliance (see web link) as battery production is a strategic imperative for clean energy transition and the competitiveness of the European automotive sector. The European Battery Alliance has set a target of 200 GWh of annual battery production capacity to be available in the EU as of 2025. T&E has reported that the production of lithium-ion battery cells is a key industrial opportunity to prevent Europe from relying on foreign battery-cell manufacturing, which would negatively affect the competitiveness of European vehicle producers and expose the EU industry to global supply shocks and fluctuations. In addition, producing batteries within the EU guarantees that more value will be retained from the overall e-mobility value chain and thus secures the creation of new jobs. Based on existing factory announcements, Benchmark Mineral Intelligence has estimated the future battery-manufacturing capacity to be at least 131 GWh in 2023 and 274 GWh in 2028.37
CHART 16: TOP 10 CELL PRODUCTION PLANTS IN 2023
Source: visualcapitalist.com, UniCredit Research
■ According to T&E38, European manufacturing capacity in 2023 of 131 GWh is estimated based on the announcements of the following battery manufacturing facilities: 1. Northvolt in Skellefteå, Sweden (initially 16 GWh [2021] and increasing to 32 GWh by 2023);
37Transport & Environment ”Electric surge – Carmakers’ electric car plans across Europe 2019-2025” 38Transport & Environment ”Electric surge – Carmakers’ electric car plans across Europe 2019-2025”
2. Northvolt in Salzgitter, Germany (cooperation with VW, to start in March 2020 with 12 GWh and with the potential to increase to 30 GWh [not included in the estimated capacity])39; 3. CATL in Erfurt, Germany (14 GWh as of 2021 and rising to 60 GWh from 2026 [and likely to be boosted further to 100 GWh])40; 4. a German partnership (Batterien-Montage-Zentrum [BMZ] and others) formerly known as TerraE consortium (aims to build two factories and achieve capacity of 34 GWh by 2028); 5. LG Chem in Wroclaw, Poland (from 6 GWh today to 70 GWh within two to three years); 6. Samsung SDI in Göd, Hungary (2-3 GWh from 2016, undergoing expansion to reach 15 GWh in 2020); 7. Samsung SDI in Premstaetten, Austria (details on planned capacity are not known); 8. SK Innovation 1 in Komárom, Hungary (production to start in early 2020 and to increase to up to 7.5 GWh by 2022); 9. SK Innovation 2 in Komárom, Hungary (completed by 2021, production capacity unknown); 10. AESC in Sunderland, the UK (2 GWh); 11. Farasis, Germany (6 GWh and from 2022, up to 10 GWh)
CHART 17: BATTERY-CELL-FACTORY PRODUCTION IN EUROPE IN 2025
Share of EU EV production 2025
Lithium-ion battery cell factories
EV production
ICE BEV PHEV
Germany 37% CATL, Northvolt, Farasis, BMZ Factory (formerly TerraE)
1,590,511 72.0 18.7 9.3
France 18% PSA-Saft factory 784,466 64.9 20.9 14.2 Spain 12% - 510,605 82.9 10.3 6.8 Italy 3% - 382,501 61.9 11.8 26.3 UK 8% AESC 354,818 78.6 13.0 8.5 Sweden 3% Northvolt, GSR
Capital 143,249 34.1 26.3 39.6
Belgium 3% - 140,695 39.0 40.5 20.5 Slovakia 3% - 137,421 88.8 5.7 5.6 Czech Republic
3% - 127,115 90.6 4.3 5.1
Hungary 1% Samsung, 2 SK Innovation
56,709 90.9 1.4 7.7
Austria <1% Samsung SDI 40,177 81.7 6.8 11.5 Portugal <1% - 15,563 94.5 0.0 5.5 Slovenia <1% - 6,560 95.0 5.0 0.0
Source: Transport & Environment (IHS Markit), UniCredit Research
39VW and Northvolt AB created a 50/50 JV to build a factory for lithium-ion-battery production. Construction is scheduled to start in Salzgitter (Lower Saxony) in 2020, and production is planned to begin at the end of 2023/beginning of 2024. The initial output is to be 16 GWh. Part of the approximately EUR 900mn invested by VW is now flowing into the JV. Another part goes directly to Northvolt. In return, VW has received about 20 percent of the shares in Northvolt and a seat on its supervisory board. (see VW press release from 6 September 2019). 40Manager Magazin 6 September 2019
05
101520253035404550
CA
TL (C
hina
)
Tesl
a M
otor
sG
igaf
acto
ry 1
(US
)
LG C
hem
Nan
jing
1(C
hina
)
LG C
hem
Nan
jing
2(C
hina
)
Sam
sung
SD
I Xia
n(C
hina
)
Fune
ng T
echn
olog
y(C
hina
)
BYD
Qin
ghai
(Chi
na)
LG C
hem
Wro
claw
,P
olan
d
Sam
sung
SD
I (K
orea
)
Lish
en (C
hina
)
2023
cap
acity
in G
Wh

11 December 2019 Credit Research
Sector Report - Automobiles & Parts
UniCredit Research page 9 See last pages for disclaimer.
■ Five more battery production plants are likely but have not been officially confirmed at the time of writing (these have not been included in the planned production-capacity estimates): 1. SVOLT, Chinese Great Wall (location in Europe not yet announced with 20 GWh from 2022); 2. GSR Capital in Trollhättan, Sweden (not confirmed yet but between 400,000 and 500,000 battery packs per year if approved, production to take place at National Electric Vehicle Sweden’s facility); 3. PSA-Saft consortium in France (under review by the European Commission); 4. LG Chem (location of second factory in Europe not yet announced); 5. BYD, (location in Europe not yet announced). According to Handelsblatt, there are currently two consortiums focused on battery production in Europe. The first is a German-French initiative by Opel, Peugeot and Total subsidiary Saft, and the second one involves BMW, BASF, VARTA and BMZ.41
■ Regarding the scale of new plants, larger facilities with more than 8 GWh per year in capacity have been shown to be twice as productive per euro invested than smaller projects.42 The investment required to build battery capacity in a small production facility with a capacity of 4.5 GWh is estimated to be around USD 250/KWh or USD 250mn/GWh (source: RWTH-Aachen).
■ Northvolt estimates that its +32 GWh production site will require an investment of more than EUR 4bn over six years. The plant is expected to start production in 2020. Tesla’s 35 GWh Gigafactory is investing USD 4-5bn through 2020 (shared by Gigafactory partners [including Panasonic]), with Tesla investing USD 2bn directly. Northvolt’s investors are Vattenfall, Vinnova, the Swedish Energy Agency, Stena and InnoEnergy. Northvolt and Tesla have indicated that a Gigafactory requires an investment of close to 150 USD/KWh, i.e. USD 150mn/GWh. Recent projects involving more than 8 GWh per year have involved investment, on average, of about USD 120mn/GWh per year in capacity.
■ An extrapolation of this to cover the 1,200 GWh per year required by 2040 reveals a total investment of approximately USD 150bn across Europe to manufacture such cells. Further investment in R&D and in value chains (such as in electrolytes and electrodes) would add to this figure.43
41Handelsblatt 6 September 2019 42McKinsey 2019 43McKinsey 2019
Barrier 1: raw materials for batteries and ESG risks ■ EV batteries will need large amounts of key metals,
with lithium, cobalt and graphite being the most critical. Other necessary raw materials, such as nickel, manganese and aluminum, are more abundant and cheaper (source: electrek).
■ According to the US Geological Survey’s Mineral Commodity Summaries, these raw materials are sourced from the following countries: 1. In 2018, mine production of lithium was as follows: 60% Australia, 19% Chile and 9% China. Reserves are split as follows: 57% Chile, 19% Australia and 14% Argentina. 2. In 2018, mine production of cobalt was as follows: 64% Congo, 4% Russia and 4% Cuba. Reserves are split as follows: 49% Congo, 17% Australia and 7% Cuba. 3. In 2018, mine production of nickel was as follows: 24% Indonesia and 15% Philippines. Reserves are split as follows: 24% Indonesia and 21% Australia. In 2018, global mine production and estimated reserves, respectively, amounted to 1. 85,000t and 14mn tons of lithium, 2. 140,000t and 6.9mn tons of cobalt and 3. 2.3mn tons and 89mn tons of nickel.
CHART 18: LITHIUM, COBALT, NICKEL DEMAND ATTRIBUTED TO LITHIUM-ION BATTERIES
Source: woodmac.com
■ Wood Mackenzie estimates that the world could face a supply crunch in these raw materials by the mid-2020s, increasing the pressure on the supply chain of raw materials for batteries. Wood Mackenzie says that many of the new sources of supply are located in areas with particularly high levels of political, social and environmental risk. Having emerged as the largest global source of lithium, Australia is an exception. Despite the alarm raised by some in the sector, Wood Mackenzie does not perceive any major supply-side challenges here.

11 December 2019 Credit Research
Sector Report - Automobiles & Parts
UniCredit Research page 10 See last pages for disclaimer.
The traditional brine operations of the lithium triangle of Chile, Argentina and Bolivia present the greatest lithium supply challenges given that it is unclear if these water-intensive operations are scalable without inflicting lasting damage on the surrounding environment. The supply situation pertaining to cobalt is even more challenging. In 2018, 72% of the world's primary cobalt output originated in the Democratic Republic of the Congo, a war-torn country notorious for high levels of poverty, corruption and risk, not to mention a recent Ebola outbreak, according to Wood Mackenzie. There are also environmental challenges associated with bringing on new nickel supply in Indonesia.
■ While sustainalytics.com recognizes the indisputable benefits of EVs, it remains wary of the environmental and social impact related to the production of lithium batteries. In addition to energy use, water use, pollution and ecological toxicity, investors also need to consider potential labor and human rights issues affecting the mining sector. Research by sustainalytics shows that leaders in the EV market, such as Tesla, trail traditional carmakers when it comes to approaches to monitoring and managing ESG-related risks in supply chains.
CHART 19: COMPANY AND SUPPLY-CHAIN ESG RATINGS FOR AUTOMAKERS
Source: sustainalytics.com
■ As production numbers of EV batteries increase, the issue of recycling will be increasingly important. McKinsey44 states that finding applications for still-useful batteries can create significant value and ultimately help to bring down the cost of storage to enable further renewable-power integration in grids.
44McKinsey “Second-life EV batteries: The newest value pool in energy storage”, April 2019
CHART 20: LITHIUM-ION BATTERY VS. SOLID-STATE BATTERY
Source: androidauthority.com, UniCredit Research
■ The EV industry is researching alternatives to lithium-ion batteries. According to Wood Mackenzie, there were major investments in this area in 1H19, with technology and transport firms (including Tesla and Samsung) working on alternate lithium-ion battery chemistries. This has resulted, for example, in the development of low-cobalt cathodes, solid-state electrolytes, silicon-based anodes and more. Over time, some of these new technologies are likely to become commercialized to meet growing EV demand, according to Wood Mackenzie.
CHART 21: ROADMAP BATTERY CELL CHEMISTRY AND ENERGY DENSITY
Source: VW presentation from 7 March 2017
■ VW has said that solid-state batteries have great potential. In the future, VW aims to enable an industrial level of production with this technology, together with VW partner QuantumScape.45 According to Wired, the main benefits of solid-state batteries as an alternative to lithium-ion batteries are that they are smaller, have higher capacity, are theoretically non-flammable, have a longer life span and are cheaper than current liquid-based lithium-ion batteries. A solid-state battery would remove all the cooling elements in favor of a larger battery, in turn saving space and therefore cutting cost per KWh. Solid-state batteries replace the liquid or polymer electrolyte found in current lithium-ion batteries with solid material. The challenge is to find a thin film of solid material that is conductive enough for use in large batteries.
45VW plans 22mn electric vehicles in ten years, March 2019

11 December 2019 Credit Research
Sector Report - Automobiles & Parts
UniCredit Research page 11 See last pages for disclaimer.
Barrier 2: charging Infrastructure and grid investments ■ According to BNEF, charging infrastructure remains a
challenge. There are already 630,000 public charging points installed globally, and utilities, oil and gas companies, automakers and pure-play operators are currently all active in this area. However, much more will be needed to serve the growing EV fleet.
CHART22: PUBLIC CHARGING OUTLETS INSTALLED GLOBALLY
Source: BNEF Energy Vehicle Outlook 2019
■ A patchwork of solutions is emerging to improve the public charging experience, such as ultra-fast chargers (150kW+, and up to 350kW in some cases), wireless charging, battery swapping and new roaming agreements between charging operators. BNEF has said that none of these will make EVs fully competitive with ICE vehicles for consumers without access to home or workplace charging. BNEF said that buyers with access to home charging will adopt EVs at a much faster rate than those without. Many of the most interesting questions over the next ten and 20 years will have to do with how to address buyers in the latter group. If, through technology innovation and government policy, EV charging barriers are significantly lowered, adoption could be faster in the 2030s.
■ T&E has said46 that, although public recharging is perceived as a major barrier to the mass uptake of EVs, public chargers are only used for about 5% of charging events, including on-street city charging, car parks and fast charging along road corridors. IONITY is a JV of BMW, Daimler, Ford and VW Group (Audi und Porsche). It aims to build a high-power charging network for EVs along major highways in Europe. Its headquarters is located in Munich and it has an office outside of Oslo, Norway.47
46T&E, September 2018 47This refers to the IONITY network. See also our Sector Flash “Ionity: a Pan-European High-Power Charging JV”, 6 November 2017.
According to ChargePoint (see website), 80% of charging will take place at home and at work and another 20% will take place at public sites (parking lots, street-side or fast-charging stations).48
■ An important goal of Germany’s Klimapaket (climate protection package) is the development of charging-station infrastructure for electro mobility.49 Germany’s federal government aims to further develop publicly accessible charging infrastructure so that a total of 1mn loading points will be made available in Germany by 2030.50 As mentioned, most charging is expected to occur at home or at work. For this reason, shared private and commercial charging infrastructure (e.g. in multi-family dwellings and at employee parking spaces) will be promoted. With the craftsman bonus in the income tax return, the installation of private charging infrastructure is promoted. In addition, the recharging of batteries at an employer's site and the provision of the necessary infrastructure for recharging at an employee's premises must be tax-privileged and not be taxed as wage elements. In the Wohneigentumsgesetz (German condominium act) and in Germany’s tenancy law, regulations for the construction of charging infrastructure are intended to be simplified. Particularly, the unanimity principle is to be replaced with a majority principle. Landlords must tolerate the installation of charging infrastructure. In addition, further legal hurdles are to be overcome in the construction of charging infrastructure (e.g. the accelerated connecting of charging infrastructure to grids as stipulated in grid-connection regulations).
■ McKinsey51 has reported that three broad categories of EV charging infrastructure exist today: 1. Alternate-current (AC) charging, also known as level 1 or level 2, operates and powers up to roughly 20Kw. 2. direct-current (DC) charging, also known as level 3 or direct-current fast charging (DCFC), operates at powers from 25Kw to more than 350Kw. 3. Wireless charging makes use of electromagnetic waves to charge batteries. Such a system usually entails a charging pad connected to a wall socket and a plate attached to vehicles. Current technologies align with level 2 chargers and can provide up to 11Kw of power.
48insideevs.com, May 2017 49See our Sector Flash “Germany’s Big 3 auto manufacturers: Klimapaket to support electrified product pipeline” dated 23 September 50German government “Masterplan Ladeinfrastruktur” targets 100,000 public charging points by 2021 from the current 20,000 according to an article in Handelsblatt 4 November 51McKinsey “Charging ahead: Electric vehicle infrastructure demand”, August 2018

11 December 2019 Credit Research
Sector Report - Automobiles & Parts
UniCredit Research page 12 See last pages for disclaimer.
■ Based on charging profiles and available technologies, McKinsey estimates that the industry could require approximately 40mn chargers across China, Europe and the US, representing an estimated USD 50bn of cumulative capital investment through 2030. The US alone will need a cumulative 13mn chargers and approximately USD 11bn of investment by 2030. The EU will need a cumulative 15mn chargers and roughly USD 17bn of investment during the same period. For China, these numbers are a cumulative 14mn chargers and USD 19bn of investment.
CHART 23: ESTIMATED INVESTMENT NEED FOR CHARGERS
Source: McKinsey
■ McKinsey estimates that, while most chargers (over 95%) will be located in homes and workplaces, from a charger-count perspective, the share of capital investment they represent is closer to roughly 70% of the total. This reflects the significantly higher cost of faster chargers. On average, a level 2 charger used in a home costs less than USD 1,000, and one used in a workplace or in public can cost between USD 3,000 and USD 5,000. The cost of a DCFC starts at about USD 25,000 and, depending on power capacity, can rise to more than USD 200,000 per unit.
■ A study by consultancy firm Oliver Wyman and the Technical University of Munich52 found that grid expansion needs to be accelerated to prevent energy shortages. The average loss of load hours in Germany is currently at 12 minutes. Depending on the expected EV share, large investment is needed if local distribution grids are to cope with the supply-and-demand patterns of electro-mobility. The necessity of investment starts at an EV share of 30%, according to the study, and would be at EUR 11bn at an EV share of 50%. This is in line with the results of a study conducted by E.ON53, which concluded that, there are 6.5mn registered passenger cars in its total grid area. If the EV share reaches 100% by 2045, E.ON would need to invest EUR 2.5bn, i.e. just under EUR 400 per vehicle on average. The study by Oliver Wyman and TU Munich calculates an average investment of around EUR 440 per EV if a 50% EV share in Germany is equal to 25mn registered passenger cars.
CHART 24: POTENTIAL GRID INVESTMENTS BY EV SHARE SCENARIO
Source: Oliver Wyman/TU Munich, UniCredit Research
■ E.ON added that such investment sums could be halved by introducing digital solutions (smart e-car charging solutions) and incentives for customers. These technologies should shift most charging from high-load evening hours to low-load night hours. Smart charging for EVs minimizes their load impact and unlocks the flexibility to use more solar and wind power.54
52Oliver Wyman/TU München, January 2018, “The e-mobility blackout” 53 E.ON grids will be upgrade for 100% e-mobility, May 2019 54International Renewable Energy Agency “Innovation outlook: smart charging for electric vehicles”; irena.org
0
100
200
300
400
500
600
700
0
5
10
15
20
25
30
10 20 30 40 50 60 70 80 90 100EV share in Germany in %
Grid investments in Germany in EUR bn (ls)
Loss of load hours (rs)

11 December 2019 Credit Research
Sector Report - Automobiles & Parts
UniCredit Research page 13 See last pages for disclaimer.
Barrier 3: employment and affordability Impact of EV transition on employment in Germany and the EU ■ It is generally perceived that the architecture and the
production process of the BEV are less complex than that associated with ICEs. 55 For example, with the fading out of ICE vehicles, ICEs, exhaust systems, alternators, fuel pumps and fuel filters will no longer be needed. EVs’ transmissions are less complex, and BEVs’ brakes and brake pads experience less wear.56
■ Compared to ICE vehicles, more employment is needed for BEV electronics (semiconductors) and for PHEVs. As the complexity of EV electronics increases, six to ten times more semiconductor content will be needed.57 Moreover, BEVs are less labor-intensive (i.e. associated with a reduction in employment) and PHEVs more labor-intensive (i.e. associated with an increase in employment) than ICE vehicles.
CHART 25: KEY DIFFERENCES BETWEEN ICE VEHICLES AND BEVS
Source: FTI Consulting58
■ That BEVs feature fewer and less-complex components means that they require relatively less maintenance and fewer spare parts. As a result, FTI Consulting expects that the reduction in automotive employment that is expected to result from the switch to BEVs would be large: around 60% in powertrain manufacturing, spare-part manufacturing and maintenance. In Germany, 58% of German automotive-manufacturing employment is dependent on ICE production.
55Fraunhofer Insitute for Industrial Engineering IAO “ELAB 2.0 – Effects of vehicle electrification on employment in Germany”, page 47, (available only in German), December 2018 56Ifo, "Fahrzeugbau – wie verändert sich die Wertschöpfungskette", 2019 57For more details on the automotive semiconductor market and semiconductor content at different EVs, please refer to Infineon’s presentation dated October 2019 58FTI Consulting “Impact of Electrically Chargeable Vehicles on Jobs and Growth in the EU”, May 2018
FTI Consulting added that, even if batteries were produced in the EU, the BEV switch’s impact on employment would be small and would not make up for such employment losses. In addition, since the skills needed for battery production are different from those needed for ICE production, even partially offsetting automotive employment losses will require significant re-training.59
■ According to the Fraunhofer Institute for Industrial Engineering, powertrain electrification, along with productivity increases, should have a substantial impact on employment in the automotive industry. In Germany, on the basis of likely developments, this is projected to result in the loss of some 75,000 jobs in powertrain production, where around 210,000 people are currently employed. This figure factors in the creation of some 25,000 new jobs related to components, such as batteries and power electronics.60 These numbers are based on the following estimated drivetrain shares: 25% BEV, 15% PHEV and 60% ICE by 2030.61
CHART 26: EU REGIONS WHERE AUTOMOTIVE MANUFACTURING MAKES UP MORE THAN 20% OF TOTAL MANUFACTURING
Source: FTI Consulting
59FTI Consulting “Impact of Electrically Chargeable Vehicles on Jobs and Growth in the EU”, May 2018 60This is the conclusion of Fraunhofer Insitute for Industrial Engineering IAO “ELAB 2.0 – Effects of vehicle electrification on employment in Germany” (available only in German), December 2018. See also the Ifo’s Consequences of a Potential Ban on New Cars and Light Trucks with Combustion Engines, June 2017 and Transport & Enivronment’s “How will electric vehicle transition impact EU jobs”, September 2017. 61There are also higher estimates of job losses in the automotive industry, which take into account the effects of increasing productivity, electrification , public transport and new mobility services; Spiegel online November 2019

11 December 2019 Credit Research
Sector Report - Automobiles & Parts
UniCredit Research page 14 See last pages for disclaimer.
■ T&E estimates that this scale of battery manufacturing will bring around 120,000 jobs in 2023 and 250,000 jobs in 2028 from direct and indirect employment in the battery value chain. T&E’s estimate is based on the assumption that, in 2023, the demand needed to electrify vehicles (cars, vans, buses and trucks) and for stationary-storage batteries will be 130 GWh. According to analysis by the European Commission’s Joint Research Center (JRC), the estimated number of direct jobs created in battery cell manufacturing is on average 140 jobs per GWh produced per year (ranges between 90 and 180).62 T&E has reported that, with 131 GWh produced in 2023 and 274 GWh in 2030, this means there would be around 18,000 new jobs created in battery cell manufacturing in 2023 (between 12,000 and 24,000) and 38,400 new jobs created in 2028 (between 25,000 and 49,000). On top of such direct-manufacturing jobs, a significant number of indirect jobs are also likely to be created. According to Northvolt, its 32 GWh factory would create more than 20,000 indirect jobs. These jobs are expected to be created in the immediate vicinity of the cell production plant and include jobs with suppliers, with subcontractors, in logistics, in mechanical engineering, in construction and with automation companies. Similarly, the JRC estimates the multiplication factor between the total number of jobs created along the complete value chain and the direct ones created in cell manufacturing is in the range of 3.7-7.5. At a European level, indirect jobs created from battery cell manufacturing would amount to between 68,000 and 138,000 (central estimate: 103,000) in 2023 and between 142,000 and 288,000 (central estimate: 215,000) in 2028.
■ T&E has reported that one of the key benefits from a shift to e-mobility is that it will reduce Europe’s dependence on oil. Transport is oil's biggest customer. It drives two-thirds of the demand for final petroleum products. Europe’s dependence on imports of crude oil has increased sharply in the past 15 years (as North Sea oil reserves have sharply declined) to the point where 88% of all of Europe’s crude oil is imported. In 2015, Europe spent, in total, around EUR 215bn on crude-oil and diesel imports. This money flows out of the EU economy – only one EU company (Shell) is a top-ten oil supplier.
62All data are taken from Transport & Environment ”Electric surge – Carmakers’ electric car plans across Europe 2019-2025”.
CHART 27: EMPLOYEMENT IMPACT OF MOVING TOWARDS BEV’S
Source: FTI Consulting
Consumer acceptance and affordability ■ At a glance, in a car buyer’s perspective, EVs have
the following advantages and disadvantages63. 1. Advantages include the following: EVs do not emit exhaust when driven. Their high torque makes driving fun because of their superior traction. EVs are associated with low maintenance costs because they feature fewer movable parts. EVs also are associated with low operating costs; a full charge costs only a few euros. EVs can be integrated into infrastructure (vehicle-to-grid). EVs are comfortable to drive due to their quiet motors and that there is no need to shift gears when operating them. Depending on storage technology, ranges of 400km or more can be achieved. EVs are efficient; 95% of their energy is put into motion ICEs are only 30% efficient. 2. Disadvantages are as follows: EVs are projected to be associated with high purchase prices in the short-to-medium term. Charging infrastructure still needs to be expanded. EVs heavy weight reduces range. Their traction batteries feature comparatively low energy density. The permanent magnets in the engines of EVs consist of rare metals. EVs’ charging cycles can be time-intensive when fast-charging stations are not used.
■ The price, range and charging of EVs are constantly mentioned as key concerns by potential car buyers. We note that there has already been significant improvement in these areas in the last few years, with declining battery prices and improvements in technology.
63E.ON, “Go electric or (com)bust”

11 December 2019 Credit Research
Sector Report - Automobiles & Parts
UniCredit Research page 15 See last pages for disclaimer.
CHART 28: NISSAN LEAF PRICES & BATTERY PERFORMANCE 2012-19
Source: Green Energy Consumers Alliance
■ The European Automobile Manufacturers Association (ACEA) highlighted that there is a correlation between the affordability (GDP per capita) of electric cars and their market uptake.64 ACEA data from 2018 show that all countries with an EV market share of less than 1% (half of all EU member states) have a GDP per capita of below EUR 29,000. This is the case in several southern European countries – such as Spain, Italy and Greece – as well as in central and eastern European countries, like Lithuania, Bulgaria and Slovakia. The ACEA also highlighted that there is a correlation between the availability of tax benefits and incentives and the market uptake of EVs.65 Another finding of ACEA was that, of the 144,000 charging points available across the EU, 76% of all EV charging points are located in just four countries (the Netherlands, Germany, France, UK), although they cover only 27% of the EU’s total surface area.66
■ In May 2019, the ACEA reported67 that, although fiscal measures to stimulate EV sales are available in nearly all EU member states now, this overview shows that the nature and (especially) the monetary value of these benefits and incentives still varies widely. Stimuli for electrically-chargeable cars are available in 24 out of 28 EU states. However, just 12 EU member states offer bonus payments or premiums to buyers. Most countries only grant tax reductions or tax exemptions for EVs.
■ As a result, it can be expected that the share of EV cars will most likely be initially higher in higher-income countries and regions, and among technology affine and environmentally conscious car buyers. As battery prices decrease, battery technology and range should, and production scale should increase – the share of EVs on the market should increase over time.
64ACEA May 2019 65ACEA July 2019 66ACEA July 2019 67ACEA May 2019
The high initial investments and low profitability of EV sales for auto manufacturers ■ The electrification transition will place a significant
burden on auto manufacturers and suppliers in terms of investment and profitability. In September 2017, Frank Lindenberg, Vice President of Finance and Controlling at Mercedes Benz Cars, said that, "In the beginning of the cycle we believe that we will have to face a significantly lower margin. For some vehicles half of the margin of the vehicles they replace”, according to Reuters68. In October 2017, FCA said that FCA loses USD 20,000 on every one of its all-electric cars. It also said that its 500e model also has value as a "compliance vehicle", helping FCA meet government-mandated fuel-economy requirements for the automaker's fleet, which includes a large share of SUV and pickup-truck sales.69 According to Reuters, VW said, in September 2017, that growing investment in electric cars will not undermine profitability as the brand is pursuing cost savings and cutting jobs as agreed with unions last year. As a result, the VW brand is sticking to targets: for an operating margin of at least 4% by 2020 and 6% by 2025, compared with 1.8% last year. With this, VW would generate just about enough cash to shoulder investments but would have very little leeway and would not be able to afford to make many mistakes”.70
■ In March 2019, the German Association of the Automotive Industry (VDA) said that, over the next three years, the German automotive sector will invest EUR 40bn into alternative powertrains. The sector is the leader in patents on alternative propulsion, and one-third of all global patents in the field of electric mobility and hybrid drive anywhere are held by German companies, according to VDA. During the next three years, the automotive industry will treble its range of EVs to around 100 models. The VDA added that the German automotive industry leads in connected and automated driving. In this field, VDA’s OEMs and suppliers account for 48% of all patents worldwide. During the next three years, VDA’s OEMs and suppliers will invest an additional EUR 18bn into this technology, which also represents huge CO2 leverage.
68Reuters 69businessinsider.com 70Reuters September 2017

11 December 2019 Credit Research
Sector Report - Automobiles & Parts
UniCredit Research page 16 See last pages for disclaimer.
■ According to McKinsey71, most auto manufacturers (OEMs) do not make a profit from the sale of EVs. These vehicles often cost USD 12,000 more to produce than comparable vehicles powered by CEs in the small-to-midsize-car segment and the small-utility-vehicle segment. In addition, carmakers often struggle to recoup these costs through pricing alone. The result, according to McKinsey, is that apart from a few premium models, OEMs stand to lose money on almost every EV sold, and this is clearly unsustainable.
CHART 29: COST WALK OF ICE TO EV IN 2019 (ESTIMATED AVERAGE PER VEHICLE)
Source: McKinsey
■ McKinsey72 has reported that battery costs represent the largest single factor in this price difference. As industry battery prices decline, the economics of EVs should improve. According to McKinsey, current thinking is that the auto industry will continue to produce EVs and will, in the meantime, absorb such losses. McKinsey’s analysis shows that there are existing options to accelerate the industry toward profitability from both product and business-model perspectives. Some of these options include aggressively reducing costs through what is referred to as decontenting, optimizing range for urban mobility, partnering with other automakers to reduce R&D and capex, targeting specific customer segments and exploring battery leasing, according to McKinsey.
71Making electric vehicles profitable, McKinsey, March 2019 72Making electric vehicles profitable, McKinsey, March 2019
■ In terms of the platform strategy for EVs, the company follow different strategies. VW Group developed the modular electric drive matrix (MEB)73, a platform that complements the previous modular transverse toolkit (MQB). VW Group is opening its MEB to other manufacturers. The purpose is to achieve a significant reduction in the cost of e-mobility through the widest possible deployment of the MEB across the entire VW group and other manufacturers leading to the associated economies of scale. VW Group is currently projecting a first wave of some 15mn pure EVs based on the MEB. e.GO Mobile AG based in Aachen, Germany, is to be the world’s first external partner to use the MEB to launch further EVs in addition to VW’s model range. Within the global collaboration between Ford and VW, Ford will use VW’s EV architecture and MEB to design and build at least one high-volume fully electric vehicle in Europe for European customers starting in 2023, more efficiently advancing its promise to deliver expressive passenger cars while taking advantage of VW’s scale.
CHART 30: VW’S ROADMAP BATTERY COST
Source: VW presentation from 7 March 2017
■ By 2025, the BMW Group74 expects electrified vehicles to account for between 15-25% of sales. The company said that factors such as regulation, incentives and charging infrastructure will play a major role in determining the scale of electrification from market to market. In order to react quickly and appropriately to customer demand, BMW has developed a uniquely flexible system across its global production network. In the future, the BMW Group production system will create structures that enable its production facilities to build models with a combustion engine, plug-in hybrid or fully electric drive train at the same time. The BMW Group currently produces electrified models at ten plants worldwide; since 2013, all the significant elements of the electric drivetrain for these vehicles come from the company’s plants in Dingolfing and Landshut.
73Volkswagen “The modular electric drive matrix” 74BMW electrification strategy

11 December 2019 Credit Research
Sector Report - Automobiles & Parts
UniCredit Research page 17 See last pages for disclaimer.
Dingolfing additionally builds the plug-in hybrid versions of the 5 and 7 Series and from 2021, it will build the BMW i NEXT. The BMW Group has invested a total of more than EUR 100mn in electro-mobility at the Dingolfing site to date, with investment continuing as the BMW Group’s range of electrified vehicles further expands.
■ Mercedes-Benz Cars’ ambition 2039 strategy is to have 50% of the fleet being electrified by 2030 and to be CO2 neutral by 2039. The EQC and EQV are still build on a classical architecture, but Daimler presented Vision EQS75, an electro platform for its future electric car models.
■ About 40% of the cost of an EV is estimated to be represented by its battery pack. Therefore, with lower lithium-ion battery prices, manufacturers could reduce the cost of electric cars and increase their price attractiveness relative to ICE vehicles significantly. USD 100/kWh is widely accepted as the cost point at which EVs will become affordable to larger segments of society and are able to compete effectively against traditional ICE vehicles, according to qnovo.com.
■ According to LMC Automotive, the average wholesale cost of battery packs had fallen below USD 200/KWh by end-2018. LMC expects this price to reach USD 100/KWh by the mid-2020s but does not expect to see a tech breakthrough for solid-state batteries before 2030.76 BNEF expects price parity between EVs and ICE vehicles to be reached by the mid-2020s in most segments, although there is wide variation between geographies and vehicle segments.77
CHART 31: EUROPE: BEV BATTERY PACK PRICE OUTLOOK
Source: LMC Automotive Executive Briefings – IAA September 2019
■ VW estimates commodities and raw materials to make up around 70% of the cost of a battery. According to an estimate by qnovo.com from January 2016, the cost of a battery can be broken down as follows: 60% material costs and 35% in manufacturing overhead and profit.
75Daimler Vision EQS 76LMC Automotive Executive Briefings – IAA September 2019 77BNEF Electric Vehicle Outlook 2019
Labor represents a relatively small component of overall lithium-ion battery costs as battery manufacturing combines significant automation in countries with low labor costs, particularly in China. At 30%, overhead costs (related to depreciation of capital, energy, R&D, sales and administration) are much more significant. Therefore, the largest cost-reduction potential is in the costs for raw materials and overhead. Overhead costs can be reduced by way of larger battery factories, and raw-material costs can be lowered as a result of large automotive manufacturers exerting influence on supply chains to improve efficiency and reduce cost.
CHART 32: ANALYSIS OF THE VALUE CHAIN TO ACHIEVE TARGET OF LESS THAN EUR 100/KWH
Source: VW presentation from 7 March 2017
CHART 33: LITHIUM-ION BATTERY COST COMPONENTS
Source: www.qnovo.com, Bloomberg, UniCredit Research

11 December 2019 Credit Research
Sector Report - Automobiles & Parts
UniCredit Research page 18 See last pages for disclaimer.
Auto suppliers and low powertrain business valuations ■ Schaeffler expects that 88% and 70% of globally
produced light vehicles in 2025 and 2030, respectively, will still contain a combustion engine. This will be in the form of ICEs and HEVs (full hybrids, mild hybrids or 48-volt mild hybrids and plug-in hybrids. As mentioned earlier the content per vehicle and necessary employment at plug-in hybrids and certain other hybrids is higher than at pure ICEs.
■ As a result of lower complexity of EVs compared to ICEs, as the share of BEVs being produced increases, the more the producers of ICE related components will come under pressure. This is especially true for smaller suppliers if they cannot fully offset this decline with an increase in EV component revenues (e.g. 48V electrification solutions, electric drives, power electronics for hybrid and BEVs). Certainly, this difficulties associated with this transition can be alleviated somewhat as a result of the increasing share of PHEVs, which operate with an ICE and a BEV system and offer a higher content per vehicle. Moreover, automotive companies and powertrain divisions that produce components for ICEs need to invest and research in BEV technology plus (maybe less but still) ICE technology.
CHART: 34: 88% OF GLOBALLY PRODUCED LIGHT VEHICLES ARE STILL EXPECTED TO CONTAIN COMBUSTION ENGINES
Source: Schaeffler Capital Markets Day, September 2018
■ As mentioned earlier, BEVs have a lower complexity compared to ICEs. In BEV’s, the overall vehicle content increases, but the content of parts suppliers and OEM decreases as the content of battery suppliers and powertrain electronics suppliers increases.
CHART 35: VEHICLE CONTENT ON TIER-1 LEVEL BY SUB-SECTOR (IN USD ‘000)
Source: UBS, quoted by FTI Consulting78
CHART 31: P/E MULTIPLES OF AUTO SUPPLIERS
LONG_COMP_NAME P/E ratio consensus 2020 Aptiv Plc 16.5 Valeo SA 13.3 Autoliv Inc. 11.5 Continental AG 10.9 Pirelli & C SpA 10.1 BorgWarner Inc. 10.6 Adient Plc 9.8 Michelin SCA 9.8 Magna International Inc. 8.2 Faurecia SE 8.3 Schaeffler AG 6.8 Goodyear Tire & Rubber Co. 7.4 Delphi Technologies Plc 5.3 Garrett Motion Inc. 3.0
Median 9.8
Source: Bloomberg, UniCredit Research
■ We believe that, as a result of these industry trends and outlook expectations, powertrain businesses are valued at the lower end of auto supplier businesses. For example, the P/E ratio at Delphi Technologies Plc is at 5.3x, and at Garrett Motion, it is 3.0x. This compares to 9.8x for the companies listed in the chart 31.
78FTI Consulting Impact of Electrically Chargeable Vehicles on Jobs and Growth in the EU, May 2018

11 December 2019 Credit Research
Sector Report - Automobiles & Parts
UniCredit Research page 19 See last pages for disclaimer.
In this way, auto suppliers can increase their valuation if they manage to separate their lower-value powertrain businesses (e.g. in the cases of Delphi Automotive/Delphi Technologies, Honeywell/Garrett Motion or Continental/Vitesco).
■ Continental AG has decided to pursue the spinning-off of 100% of Vitesco Technologies (currently the Powertrain division, see website) with a subsequent listing. Subject to the approval by the supervisory board of Continental AG, the planned spin-off is to be submitted for its approval at the Annual General Meeting on 30 April 2020. 79
Sustainable financing in the auto sector should increase ■ We think that with increasing EV sales figures and
increasing demand for sustainable finance, there are increasing opportunities in the automotive sector to refinance electro-mobility projects via green bonds/loans, but also on a company level via sustainability-linked bonds/loans.
■ Green Schuldschein issued by Porsche: In August 2019, Porsche has issued the largest green Schuldschein (see link) to date with a volume of EUR 1bn. It was the first transaction of its kind by a car manufacturer: the funds will be used exclusively to refinance sustainable projects. The Fully electric Porsche Taycan forms the core of Porsche’s green product portfolio that qualified for the financing through green financial instruments.
■ Green bonds issued by Toyota Motor Credit Corporation: TMCC introduced the auto industry’s first-ever asset-backed Green Bond in 2014. TMCC’s Green Bond issuances support the sale of environmentally friendly vehicles, which meet certain eligibility criteria. For TMCC’s Green Bond Framework and Use of Proceeds reports, please refer here.
■ Green bonds issued by LeasePlan Corporation N.V. (link): In March 2019, LeasePlan issued EUR 500mn Green bonds and the proceeds will only be used to finance or refinance the purchase of BEVs.
■ Green Schuldschein issued by German filtration specialist and auto supplier Mann + Hummel (link): In October 2019, the company issued its second Green Schuldschein to refinance projects in the fields of air and water filtration, renewable energies, sustainability and environmental protection.
■ Sustainability-linked Schuldschein issued by Dürr AG (link) in June 2019.
79Continental press release from 22 October
Please refer to our related publications to the growing sustainable finance market.
■ Sector Report - Green lending is thriving: Green loans and sustainability-linked loans
■ The Green Bonds Chartbook – Issuance of green bonds in 2019 marks another record (4Q19)
■ Sector Report - Corporates/Green Bonds: ESG considerations by rating agencies
■ Sector Flash - Green Bonds: EU publishes Taxonomy Technical Report including funding needs
Author
Dr. Sven Kreitmair, CFA Head of Credit Research, Credit Analyst Automotive & Mobility (UniCredit Bank, Munich) +49 89 378-13246 [email protected]

4 November 2019 Credit Research
Sector Report - Automobiles & Parts
UniCredit Research page 20 See last pages for disclaimer.
Moody’s carbon transition assessment scores for 20 auto manufacturers
Source: Moody’s, 4 November 2019, “Substantial variation exists in automakers’ carbon transition risk profiles

4 November 2019 Credit Research
Sector Report - Automobiles & Parts
UniCredit Research page 21 See last pages for disclaimer.
Appendix
European EV market EV growth and share statistics in Europe
■ September 2019: Plug-in EVs +76% yoy, BEVs +109% yoy, PHEVs +28%; BEVs have a share of 69% of all plug-in EVs (9M19: 67%), overall BEV share was 3.2% (9M19: 2.0%), BEV+PHEV share: 4.6% (9M19: 3.0%; 2018: 2.5%), BEV+PHEV+unplugged hybrids share was 10% in September.
■ EU28 (2014-2018), ACEA data: Electrically-chargeable cars (BEV+PHEV) market share +1.4 PP to 2.0%; CAGR +44%; market share of hybrid EVs +2.4 PP to 3.8%; CAGR +34%
EUROPE - PLUG-IN VEHICLE SALES GERMANY - PLUG-IN VEHICLE SALES
Source: cleantecnica.com, insideevs.com, ev-sales.com
ALTERNATIVELY-POWERED CARS BY COUNTRY (2018)
Source: ACEA October 2019

4 November 2019 Credit Research
Sector Report - Automobiles & Parts
UniCredit Research page 22 See last pages for disclaimer.
EV markets September 2019 – Global, USA, China GLOBAL PLUG-IN CAR SALES GLOBAL LEADERS IN PLUG-IN CAR SALES BY BRANDS
Source: ev-sales.com
PLUG-IN CAR SALES IN USA PLUG-IN CAR SALES IN CHINA
Source: ev-sales.com (left table), ev-sales.com (right table)

4 November 2019 Credit Research
Sector Report - Automobiles & Parts
UniCredit Research page 23 See last pages for disclaimer.
VW Group - Production forecast 2018-2026 for selected EV light vehicles COUNTRY MODEL 2018 2019 2020 2021 2022 2023 2024 2025 2026 China Audi e-tron 0 0 3,878 13,227 13,994 17,822 19,453 23,602 25,841 China Audi Q6 e-tron 0 0 0 0 0 0 0 1,806 7,459 China Audi Q4 e-tron 0 0 429 1,554 2,299 1,321 1,718 1,924 2,549 China Audi Q9 e-tron 0 0 0 0 0 0 0 1,559 3,457 China Skoda Coupe SUV EV 0 0 0 8,790 21,682 21,895 23,455 24,845 27,350 China Skoda SUV EV 0 0 0 4,097 21,666 21,352 22,778 24,125 26,443 China Volkswagen ID Roomzz 0 0 0 0 5,278 35,042 37,166 39,176 42,099 China Volkswagen ID 4 0 0 20,781 58,352 61,951 64,575 68,522 72,018 77,178 China Volkswagen ID 3 0 6,407 29,933 66,712 69,775 71,504 74,661 77,777 81,248 China Volkswagen ID AEROe 0 0 0 0 0 38,611 43,567 45,742 49,037 Czech Republic Skoda Coupe SUV EV 0 0 2,999 16,111 17,328 18,432 19,290 22,718 22,744 Czech Republic Skoda Compact EV 0 0 0 0 16,011 23,919 28,612 31,039 35,326 Czech Republic Skoda SUV EV 0 0 0 21,197 28,733 32,674 40,933 42,332 44,967 Slovakia Audi Q9 e-tron 0 0 0 0 0 0 13,634 24,431 27,435 USA Volkswagen ID Roomzz 0 0 0 0 11,923 33,467 41,127 45,913 41,551 USA Volkswagen ID 4 0 0 0 0 21,501 29,307 26,733 24,750 24,219 USA Volkswagen ID Buzz 0 0 0 0 2,650 15,924 15,191 14,597 14,208 Belgium Audi e-tron 2,394 32,050 45,099 40,220 40,509 40,087 40,816 39,543 46,227 Belgium Audi e-tron Sportback 0 938 5,823 11,953 14,776 16,735 18,725 18,739 19,002 Germany Audi Compact EV 0 0 7,408 21,290 23,568 29,656 33,051 34,670 35,775 Germany Audi e-tron GT 0 0 4,398 8,319 12,573 18,995 21,234 22,614 24,248 Germany Audi Q6 e-tron 0 0 0 0 12,491 23,115 21,535 20,842 20,463 Germany Audi Q6 e-tron Sportback 0 0 0 0 2,178 7,777 8,607 8,510 8,354 Germany Audi Q4 e-tron 0 0 393 9,451 15,100 16,173 17,857 18,302 19,229 Germany Audi e-tron GTR 0 0 0 0 1,215 2,207 2,311 3,053 3,571 Germany Bentley Sports EV 0 0 0 398 3,542 3,995 2,353 2,286 2,279 Germany Porsche Taycan 0 5,400 34,057 37,012 36,688 37,737 38,916 37,769 37,381 Germany Seat el-Born 0 185 17,410 19,642 21,388 22,847 24,026 24,618 25,374 Germany Seat SUV EV 0 0 0 4,665 21,923 24,285 26,382 30,001 32,332 Germany Skoda Coupe EV 0 0 0 0 0 0 5,744 11,547 12,035 Germany Volkswagen ID Roomzz 0 0 0 0 12,064 15,339 16,567 17,070 18,159 Germany Volkswagen ID 4 0 0 8,900 26,423 39,717 58,960 64,387 65,851 66,852 Germany Volkswagen ID 3 0 1,122 31,948 79,236 96,128 108,605 111,911 113,398 121,511 Germany Volkswagen ID AEROe 0 0 0 17,031 30,246 32,702 39,686 43,734 44,939 Germany Volkswagen ID Buzz 0 0 0 0 1,335 5,563 8,103 8,303 8,505 Germany Volkswagen ID Buzz 0 0 0 0 2,476 5,042 7,815 7,967 8,089 Germany Volkswagen ID B SUV 0 0 0 0 0 0 13,216 71,308 76,527 VW Group 2,394 46,102 213,456 465,680 682,708 895,665 1,000,082 1,118,479 1,183,963
Source: LMC Automotive, UniCredit Research

4 November 2019 Credit Research
Sector Report - Automobiles & Parts
UniCredit Research page 24 See last pages for disclaimer.
Related automotive-sector flashes/reports » Truck sector: Potential new bond issuers, disruptive technological … - 10 October 2019 » Germany's Big 3 auto manufacturers: Klimapaket … – 23 Sep 2019
» Germany's big three auto manufacturers - tariff-exposure … – 12 Aug 2019
» German auto suppliers: Transformation needs in volatile times – 4 Jul 2019
» HY car rental companies: Growth amid structural change – 19 June 2019
» Automotive Credit Conference Handbook – 27 May 2019
» Germany’s Big 3 auto manufacturers: Reduced rating headroom – 2 April 2019
» Looking further into 2019 – 24 January 2019
» Global light vehicle sales outlook – 15 January 2019
» Corporates: Hard Brexit - Impact on our covered universe in a worst-case scenario – 14 January 2019
» Fitch's ESG relevance scores – 9 January 2019
» Hydrogen fuel cell or battery electric vehicles? – 4 January 2019
» Battery cell production in Germany and the rest of Europe – 29 November 2018
» Guidance pressure as rating momentum in 2H18 has turned negative – 28 September 2018
» Diesel share prospects – 18 July 2018
» Tariff repercussions – 27 June 2018
» Valuation pressure & break-up stories – 29 January 2018
» Autonomous driving: closer than it appears? – 15 November 2017
» Ionity: a Pan-European High-Power Charging JV – 6 November 2017
» Electric vehicles charging network expansion – 4 October 2017
» China sets 10% new energy vehicles quota for 2019 – 29 September 2017
» From electrification squeeze to robo-taxi fleets – 12 October 2017
» EU battery and CO2 roadmap leads to investment needs – 12 October 2017
» E-Mobility transformation gathers pace – 20 July 2017

UniCredit Research page 25 .
4 November 2019 Credit Research
Sector Report - Automobiles & Parts
Legal Notices Glossary A comprehensive glossary for many of the terms used in the report is available on our website: link
Disclaimer Our recommendations are based on information obtained from or are based upon public information sources that we consider to be reliable, but for the completeness and accuracy of which we assume no liability. All information, estimates, opinions, projections and forecasts included in this report represent the independent judgment of the analysts as of the date of the issue unless stated otherwise. We reserve the right to modify the views expressed herein at any time without notice. Moreover, we reserve the right not to update this information or to discontinue it altogether without notice. This report may contain links to websites of third parties, the content of which is not controlled by UniCredit Bank. No liability is assumed for the content of these third-party websites. This report is for information purposes only and (i) does not constitute or form part of any offer for sale or subscription of or solicitation of any offer to buy or subscribe for any financial, money market or investment instrument or any security, (ii) is neither intended as such an offer for sale or subscription of or solicitation of an offer to buy or subscribe for any financial, money market or investment instrument or any security nor (iii) as marketing material within the meaning of applicable prospectus law . The investment possibilities discussed in this report may not be suitable for certain investors depending on their specific investment objectives and time horizon or in the context of their overall financial situation. The investments discussed may fluctuate in price or value. Investors may get back less than they invested. Fluctuations in exchange rates may have an adverse effect on the value of investments. Furthermore, past performance is not necessarily indicative of future results. In particular, the risks associated with an investment in the financial, money market or investment instrument or security under discussion are not explained in their entirety. This information is given without any warranty on an "as is" basis and should not be regarded as a substitute for obtaining individual advice. Investors must make their own determination of the appropriateness of an investment in any instruments referred to herein based on the merits and risks involved, their own investment strategy and their legal, fiscal and financial position. As this document does not qualify as an investment recommendation or as a direct investment recommendation, neither this document nor any part of it shall form the basis of, or be relied on in connection with or act as an inducement to enter into, any contract or commitment whatsoever. Investors are urged to contact their bank's investment advisor for individual explanations and advice. Neither UniCredit Bank AG, UniCredit Bank AG London Branch, UniCredit Bank AG Milan Branch, UniCredit Bank AG Vienna Branch, UniCredit Bank Austria AG, UniCredit Bulbank, Zagrebačka banka d.d., UniCredit Bank Czech Republic and Slovakia, ZAO UniCredit Bank Russia, UniCredit Bank Czech Republic and Slovakia Slovakia Branch, UniCredit Bank Romania, UniCredit Bank AG New York Branch nor any of their respective directors, officers or employees nor any other person accepts any liability whatsoever (in negligence or otherwise) for any loss howsoever arising from any use of this document or its contents or otherwise arising in connection therewith. This report is being distributed by electronic and ordinary mail to professional investors, who are expected to make their own investment decisions without undue reliance on this publication, and may not be redistributed, reproduced or published in whole or in part for any purpose. This report was completed and first published on 11 December 2019 at 12:07. Responsibility for the content of this publication lies with: UniCredit Group and its subsidiaries are subject to regulation by the European Central Bank a) UniCredit Bank AG (UniCredit Bank, Munich or Frankfurt), Arabellastraße 12, 81925 Munich, Germany, (also responsible for the distribution pursuant to §34b WpHG). Regulatory authority: “BaFin“ – Bundesanstalt für Finanzdienstleistungsaufsicht, Marie-Curie-Str. 24-28, 60439 Frankfurt, Germany. b) UniCredit Bank AG London Branch (UniCredit Bank, London), Moor House, 120 London Wall, London EC2Y 5ET, United Kingdom. Regulatory authority: “BaFin“ – Bundesanstalt für Finanzdienstleistungsaufsicht, Marie-Curie-Str. 24-28, 60439 Frankfurt, Germany and subject to limited regulation by the Financial Conduct Authority, 12 Endeavour Square, London E20 1JN, United Kingdom and Prudential Regulation Authority 20 Moorgate, London, EC2R 6DA, United Kingdom. Further details regarding our regulatory status are available on request. c) UniCredit Bank AG Milan Branch (UniCredit Bank, Milan), Piazza Gae Aulenti, 4 - Torre C, 20154 Milan, Italy, duly authorized by the Bank of Italy to provide investment services. Regulatory authority: “Bank of Italy”, Via Nazionale 91, 00184 Roma, Italy and Bundesanstalt für Finanzdienstleistungsaufsicht, Marie-Curie-Str. 24-28, 60439 Frankfurt, Germany. d) UniCredit Bank AG Vienna Branch (UniCredit Bank, Vienna), Rothschildplatz 1, 1020 Vienna, Austria. Regulatory authority: Finanzmarktaufsichtsbehörde (FMA), Otto-Wagner-Platz 5, 1090 Vienna, Austria and subject to limited regulation by the “BaFin“ – Bundesanstalt für Finanzdienstleistungsaufsicht, Marie-Curie-Str. 24-28, 60439 Frankfurt, Germany. Details about the extent of our regulation by the Bundesanstalt für Finanzdienstleistungsaufsicht are available from us on request. e) UniCredit Bank Austria AG (Bank Austria), Rothschildplatz 1, 1020 Vienna, Austria. Regulatory authority: Finanzmarktaufsichtsbehörde (FMA), Otto-Wagner-Platz 5, 1090 Vienna, Austria f) UniCredit Bulbank, Sveta Nedelya Sq. 7, BG-1000 Sofia, Bulgaria. Regulatory authority: Financial Supervision Commission (FSC), 16 Budapeshta str., 1000 Sofia, Bulgaria g) Zagrebačka banka d.d., Trg bana Josipa Jelačića 10, HR-10000 Zagreb, Croatia. Regulatory authority: Croatian Agency for Supervision of Financial Services, Franje Račkoga 6, 10000 Zagreb, Croatia h) UniCredit Bank Czech Republic and Slovakia, Želetavská 1525/1, 140 92 Praga 4, Czech Republic. Regulatory authority: CNB Czech National Bank, Na Příkopě 28, 115 03 Praga 1, Czech Republic i) ZAO UniCredit Bank Russia (UniCredit Russia), Prechistenskaya nab. 9, RF-119034 Moscow, Russia. Regulatory authority: Federal Service on Financial Markets, 9 Leninsky prospekt, Moscow 119991, Russia j) UniCredit Bank Czech Republic and Slovakia, Slovakia Branch, Šancova 1/A, SK-813 33 Bratislava, Slovakia. Regulatory authority: CNB Czech National Bank, Na Příkopě 28, 115 03 Praha 1, Czech Republic and subject to limited regulation by the National Bank of Slovakia, Imricha Karvaša 1, 813 25 Bratislava, Slovakia. Regulatory authority: National Bank of Slovakia, Imricha Karvaša 1, 813 25 Bratislava, Slovakia k) UniCredit Bank Romania, Bucharest 1F Expozitiei Boulevard, 012101 Bucharest 1, Romania. Regulatory authority: National Bank of Romania, 25 Lipscani Street, 030031, 3rd District, Bucharest, Romania l) UniCredit Bank AG New York Branch (UniCredit Bank, New York), 150 East 42nd Street, New York, NY 10017. Regulatory authority: “BaFin“ – Bundesanstalt für Finanzdienstleistungsaufsicht, Marie-Curie-Str. 24-28, 60439 Frankfurt, Germany and New York State Department of Financial Services, One State Street, New York, NY 10004-1511 Further details regarding our regulatory status are available on request. ANALYST DECLARATION The analyst’s remuneration has not been, and will not be, geared to the recommendations or views expressed in this report, neither directly nor indirectly. All of the views expressed accurately reflect the analyst’s views, which have not been influenced by considerations of UniCredit Bank’s business or client relationships. POTENTIAL CONFLICTS OF INTERESTS You will find a list of keys for company specific regulatory disclosures on our website https://www.unicreditresearch.eu/index.php?id=disclaimer. RECOMMENDATIONS, RATINGS AND EVALUATION METHODOLOGY You will find the history of rating regarding recommendation changes as well as an overview of the breakdown in absolute and relative terms of our investment ratings, and a note on the evaluation basis for interest-bearing securities on our website https://www.unicreditresearch.eu/index.php?id=disclaimer and https://www.unicreditresearch.eu/index.php?id=legalnotices. ADDITIONAL REQUIRED DISCLOSURES UNDER THE LAWS AND REGULATIONS OF JURISDICTIONS INDICATED You will find a list of further additional required disclosures under the laws and regulations of the jurisdictions indicated on our website https://www.unicreditresearch.eu/index.php?id=disclaimer. E 19/3

UniCredit Research page 26 .
4 November 2019 Credit Research
Sector Report - Automobiles & Parts
UniCredit Research* Credit Research
Erik F. Nielsen Group Chief Economist Global Head of CIB Research +44 207 826-1765 [email protected]
Dr. Ingo Heimig Head of Research Operations & Regulatory Controls +49 89 378-13952 [email protected]
Head of Credit Research
Dr. Sven Kreitmair, CFA Head of Credit Research +49 89 378-13246 [email protected]
Financials Credit Research
Franz Rudolf, CEFA Head Covered Bonds +49 89 378-12449 [email protected]
Dr. Michael Teig Deputy Head Banks +49 89 378-12429 [email protected]
Matthias Dax Sub-Sovereigns & Agencies, ESG [email protected]
Florian Hillenbrand, CFA Securitization [email protected]
Tobias Keller Banks +49 89 378-12960 [email protected]
Julian Kreipl, CFA Covered Bonds +49 89 378-12961 [email protected]
Natalie Tehrani Monfared Regulatory & Accounting Service, Insurance, Real Estate +49 89 378-12242 [email protected]
Corporate Credit Research
Christian Aust, CFA Head Industrials, Oil & Gas +49 89 378-17564 [email protected]
Gianfranco Arcovito, CFA Utilities, Hybrids +49 89 378-15449 [email protected]
Sergey Bolshakov EEMEA Corporates & Financials [email protected]
Mehmet Dere EEMEA Energy, Consumer +49 89 378-11294 [email protected]
Dr. Sven Kreitmair, CFA Automotive & Mobility +49 89 378-13246 [email protected]
Ulrich Scholz, CFA, FRM Telecoms, Technology [email protected]
Jonathan Schroer, CFA Telecoms, Media/Cable, Logistics, Business Services +49 89 378-13212 [email protected]
Jana Schuler, CFA Industrials +49 89 378-13211 [email protected]
Dr. Silke Stegemann, CEFA Health Care & Pharma, Food & Beverage +49 89 378-18202 [email protected]
UniCredit Research, Corporate & Investment Banking, UniCredit Bank AG, Am Eisbach 4, D-80538 Munich, [email protected] Bloomberg: UCCR, Internet: www.unicreditresearch.eu CR 19/12
*UniCredit Research is the joint research department of UniCredit Bank AG (UniCredit Bank, Munich or Frankfurt), UniCredit Bank AG London Branch (UniCredit Bank, London), UniCredit Bank AG Milan Branch (UniCredit Bank, Milan), UniCredit Bank AG Vienna Branch (UniCredit Bank, Vienna), UniCredit Bank Austria AG (Bank Austria), UniCredit Bulbank, Zagrebačka banka d.d., UniCredit Bank Czech Republic and Slovakia, ZAO UniCredit Bank Russia (UniCredit Russia), UniCredit Bank Romania.