Embed Size (px)
Citation preview

DISCLOSURE APPENDIX CONTAINS ANALYST CERTIFICATIONS AND THE STATUS OF NON US ANALYSTS. FOR OTHER IMPORTANT DISCLOSURES, visit www.credit-suisse.com/researchdisclosures or call +1 (877) 291-2683 US Disclosure: Credit Suisse does and seeks to do business with companies covered in its research reports. As a result, investors should be aware that the Firm may have a conflict of interest that could affect the objectivity of this report. Investors should consider this report as only a single factor in making their investment decision.
CREDIT SUISSE SECURITIES RESEARCH & ANALYTICS BEYOND INFORMATION®
Client-Driven Solutions, Insights, and Access
12 February 2013
Europe
Equity Research
European Cable Sector Connections Series
The Cable Guys: Follow the leader
We launch coverage of the European cable sector, initiating with an Outperform rating on Prysmian (TP €19) and a Neutral rating on Nexans (TP €36). We analyse the key growth end markets, focusing on submarine cables and the SURF segment, and map out the global competitive landscape, taking a closer look at optical fibre & cables.
■ Attractive medium-term growth. We view submarine cables as an attractive market for both Prysmian and Nexans. On our analysis of recent contracts and industry relationships, we prefer Prysmian as a play on this theme as we believe it can take market share over the next five years. In the SURF segment we analyse the supply and demand of flexible pipes and show three capacity utilisation scenarios for Prysmian’s Flexible pipe plant.
■ Mapping the competitive landscape: Based on market size and
characteristics, we focus on optical fibre & cable and particularly the fast-growing Chinese market where we view the medium-term competitive threat as manageable. In Land High Voltage, we believe the competitive threat is well understood by the market but view the risk of pricing pressure as greater for Nexans due to its higher exposure to the Middle East.
■ Stock calls: We favour Prysmian for its 1) exposure to growth themes,
2) competitive positioning, 3) improving end market exposure and 4) self-help. We view risk/reward at Nexans as balanced, as its exposure to growth end markets is offset by 1) lack of valuation upside on reaching the low end of 2015 targets and 2) the relatively higher risk of near-term earnings volatility. Our €19 target price for Prysmian is derived using a 2013E sector multiple (ex lifts) vs the current discount of 10%. For Nexans our €36 target price is driven by a 8.1x 2014E EV/EBIT multiple (10% sector discount).
Figure 1: Competitive risk matrix in cable markets (more detail on page 31)
Risk Rating 1 2 3 4 5
Land High Voltage
Optical Fibre Telecom
Rail cables
Mining cables
Aerospace cables
Established
relationships
Low
Building cables
Market size less
attractive
High barriers to
entry
Electrical Distribution
Time frame in years
HighCopper telecom cable
Submarine cables
Medium
Automotive cables
Emerging mkt
competition has
had an impact
Source: Credit Suisse estimates
The Credit Suisse Connections Series
leverages our exceptional breadth of
macro and micro research to deliver
incisive cross-sector and cross-border
thematic insights for our clients.
Research Analysts
Max Yates
44 20 7883 8501
Andre Kukhnin CFA
44 20 7888 0350
Simon Toennessen
44 20 7883 6893
Jonathan Hurn, CFA
44 20 7883 4532
Julian Mitchell
212 325 6668
Specialist Sales: David Arnold
44 20 7883 3549
End-market primers series
This report contains a detailed primer on
the Global Cable end-market as well as in-
depth analysis of the key thematic
drivers. For other detailed global end-
market primers published by the team,
please click here:
Industrial Automation, Elevators, Global
Power Generation
12 February 2013
European Cable Sector 2
Table of contents Key charts 3
Executive summary 4
Prysmian Investment Case 7
Nexans Investment Case 8
Medium-term sector drivers 9
#1: Submarine cables 9
Submarine opportunity for Prysmian and Nexans 11
Prysmian’s market share may increase in the medium term 12
We also see greater project execution risk at Nexans 14
#2: SURF: Limited downside risk in the near term 19
Why is the market concerned about SURF products? 22
Scenario analysis for flexible pipe ramp-up 25
#3: Mapping the global cable competitive landscape 28
Global cable competitor growth and margin trends 30
Optical fibre cables: attractive in the medium term 32
Land HV: Expect more moderate pricing pressure 36
#4: Self-help is key to margin expansion 38
We expect €170m of Draka synergies by 2015E 39
Nexans: 2015 targets but limited near-term impact 44
Company section 47
Prysmian (PRY.MI) 48
Prysmian investment case 51
Nexans (NEXS.PA) 70
Nexans investment case 72
End market primer 91
Energy cables 93
Building cables 97
Industrial cables 101
Telecom cables 105
Appendix: Further company details (Metal price impact,
Management remuneration, Shareholder structure) 109
12 February 2013
European Cable Sector 3
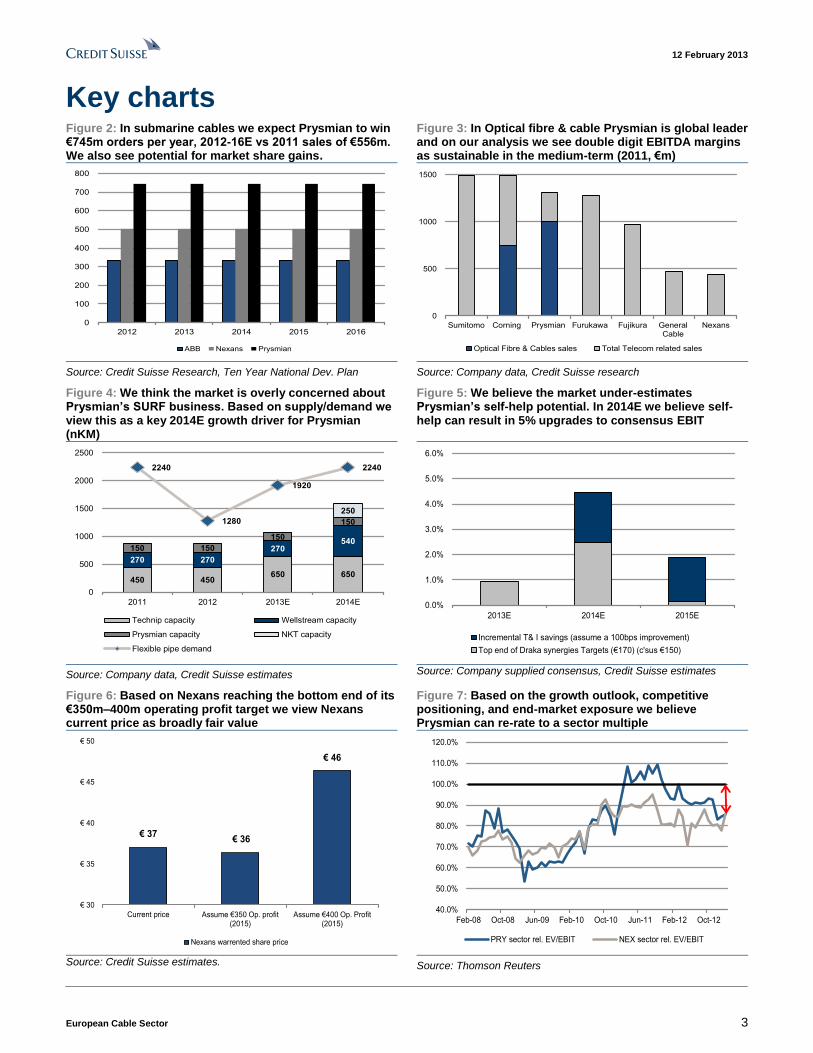
Key charts Figure 2: In submarine cables we expect Prysmian to win €745m orders per year, 2012-16E vs 2011 sales of €556m. We also see potential for market share gains.
Figure 3: In Optical fibre & cable Prysmian is global leader and on our analysis we see double digit EBITDA margins as sustainable in the medium-term (2011, €m)
0
100
200
300
400
500
600
700
800
2012 2013 2014 2015 2016
ABB Nexans Prysmian
0
500
1000
1500
Sumitomo Corning Prysmian Furukawa Fujikura GeneralCable
Nexans
Optical Fibre & Cables sales Total Telecom related sales
Source: Credit Suisse Research, Ten Year National Dev. Plan Source: Company data, Credit Suisse research
Figure 4: We think the market is overly concerned about Prysmian’s SURF business. Based on supply/demand we view this as a key 2014E growth driver for Prysmian (nKM)
Figure 5: We believe the market under-estimates Prysmian’s self-help potential. In 2014E we believe self-help can result in 5% upgrades to consensus EBIT
450 450650 650
270 270
270540
150 150
150
150
250
2240
1280
1920
2240
0
500
1000
1500
2000
2500
2011 2012 2013E 2014E
Technip capacity Wellstream capacity
Prysmian capacity NKT capacity
Flexible pipe demand
0.0%
1.0%
2.0%
3.0%
4.0%
5.0%
6.0%
2013E 2014E 2015E
Incremental T& I savings (assume a 100bps improvement)
Top end of Draka synergies Targets (€170) (c'sus €150)
Source: Company data, Credit Suisse estimates Source: Company supplied consensus, Credit Suisse estimates
Figure 6: Based on Nexans reaching the bottom end of its €350m–400m operating profit target we view Nexans current price as broadly fair value
Figure 7: Based on the growth outlook, competitive positioning, and end-market exposure we believe Prysmian can re-rate to a sector multiple
€ 37€ 36
€ 46
€ 30
€ 35
€ 40
€ 45
€ 50
Current price Assume €350 Op. profit (2015)
Assume €400 Op. Profit (2015)
Nexans warrented share price
40.0%
50.0%
60.0%
70.0%
80.0%
90.0%
100.0%
110.0%
120.0%
Feb-08 Oct-08 Jun-09 Feb-10 Oct-10 Jun-11 Feb-12 Oct-12
PRY sector rel. EV/EBIT NEX sector rel. EV/EBIT
Source: Credit Suisse estimates. Source: Thomson Reuters
12 February 2013
European Cable Sector 4
Executive summary In this report:
■ Take an in-depth look at key growth markets in the sector focusing on Submarine
Cables (go to pages 9 to 18) and SURF products that are used in subsea oil
production (go to pages 19 to 27);
■ Map out the global cable competitive landscape in terms of growth rates and margins
among the large cable players (go to pages 29 to 31);
■ Take a deep-dive into the optical fibre & cable market, assessing the risk to Prysmian
both in the developed markets and the fast-growing Chinese market (pages 33 to 35);
■ Include a cable sector primer running through the key end markets for Prysmian and
Nexans (go to pages 91 to 108).
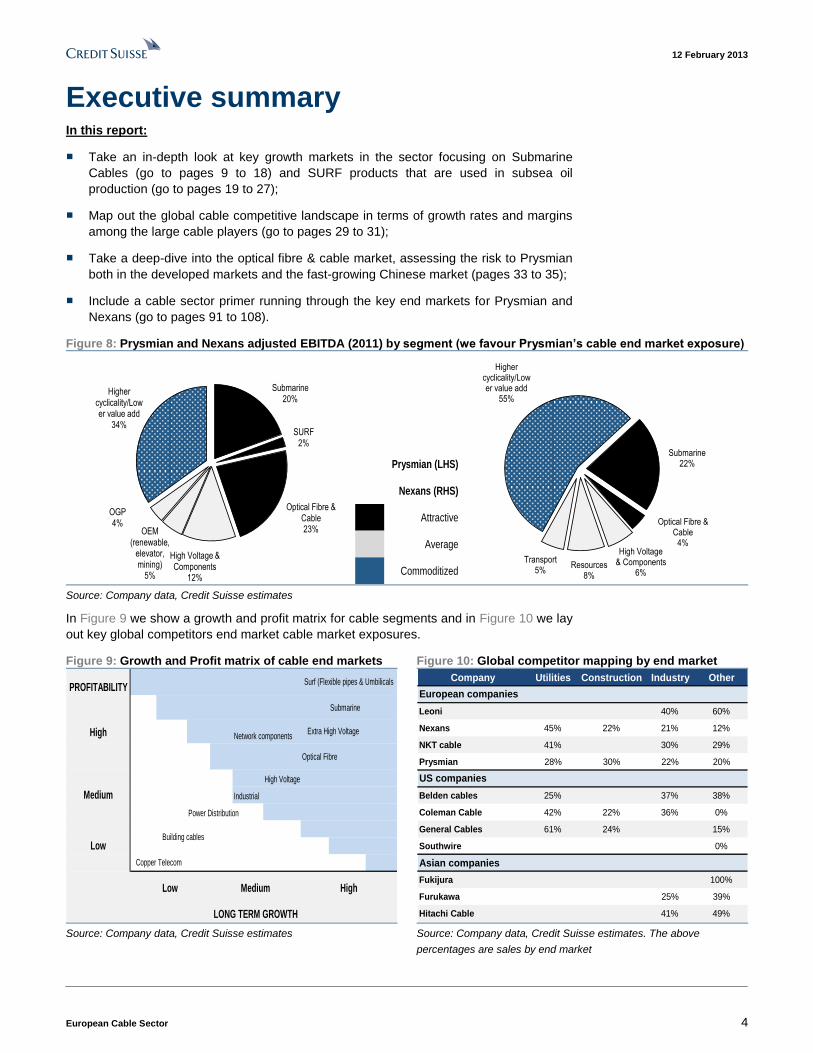
Figure 8: Prysmian and Nexans adjusted EBITDA (2011) by segment (we favour Prysmian’s cable end market exposure)
Submarine20%
SURF2%
Optical Fibre & Cable23%
High Voltage & Components
12%
OEM (renewable,
elevator, mining)
5%
OGP4%
Higher cyclicality/Lower value add
34%
Prysmian (LHS)
Nexans (RHS)
Attractive
Average
Commoditized
Submarine22%
Optical Fibre & Cable
4%High Voltage
& Components6%
Resources8%
Transport5%
Higher cyclicality/Lower value add
55%
Source: Company data, Credit Suisse estimates
In Figure 9 we show a growth and profit matrix for cable segments and in Figure 10 we lay
out key global competitors end market cable market exposures.
Figure 9: Growth and Profit matrix of cable end markets Figure 10: Global competitor mapping by end market
Submarine
Network components
Optical Fibre
High Voltage
Industrial
Power Distribution
High
LONG TERM GROWTH
Surf (Flexible pipes & Umbilicals
LowBuilding cables
Copper Telecom
Low Medium
PROFITABILITY
High Extra High Voltage
Medium
Company Utilities Construction Industry Other
Leoni 40% 60%
Nexans 45% 22% 21% 12%
NKT cable 41% 30% 29%
Prysmian 28% 30% 22% 20%
Belden cables 25% 37% 38%
Coleman Cable 42% 22% 36% 0%
General Cables 61% 24% 15%
Southwire 0%
Asian companies
Fukijura 100%
Furukawa 25% 39%
Hitachi Cable 41% 49%
US companies
European companies
Source: Company data, Credit Suisse estimates Source: Company data, Credit Suisse estimates. The above
percentages are sales by end market
12 February 2013
European Cable Sector 5
Medium-term sector drivers
1. Submarine cables; Medium term structural growth
This market is driven by renewable additions (offshore wind connections) and the need to
transport power further from areas of power supply to power demand (Submarine
interconnections). We have focused on the European market which we estimate generates
90% of Prysmian’s and Nexans’ Submarine sales. We view this as a structurally growing
market, with high technological barriers to entry and strong pricing based on there being
only three producers in the market (Prysmian, Nexans and ABB).
Based on our analysis of the Ten Year National Development Plan (TYNDP 2012) we
believe this market can generate €745m of orders for Prysmian per year, 2012-16E, vs
current sales of €556m. For Nexans we expect €503m vs current sales of €491m.
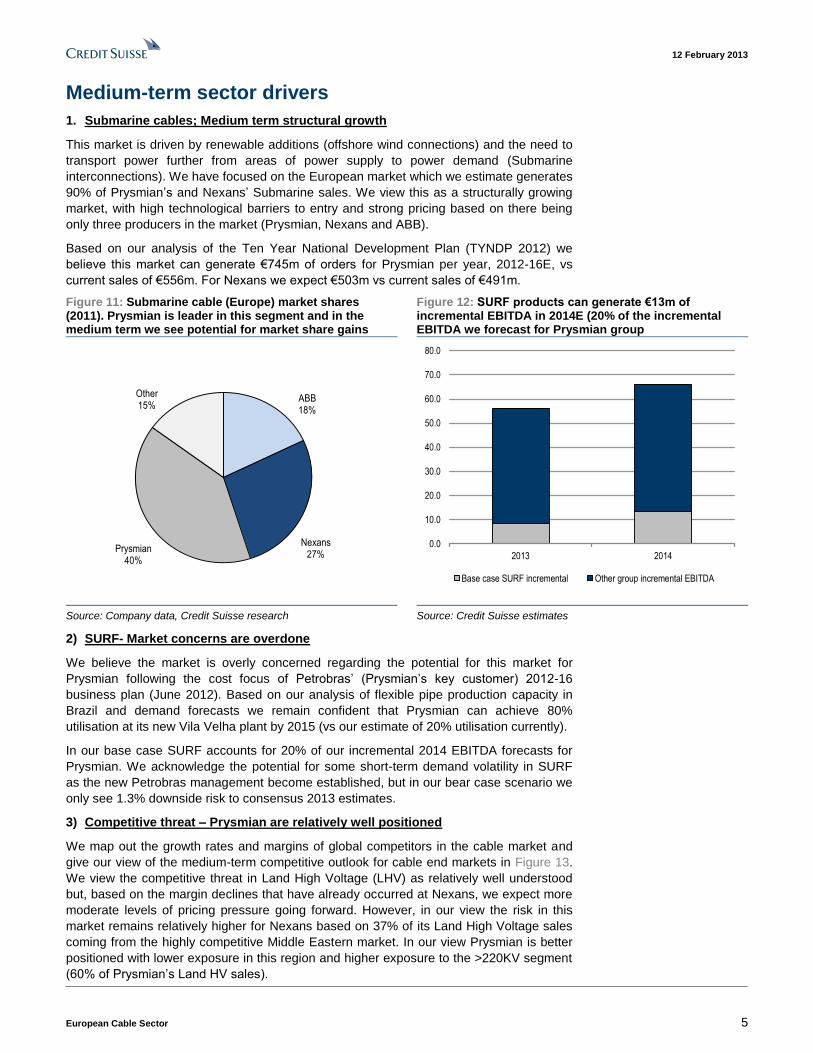
Figure 11: Submarine cable (Europe) market shares (2011). Prysmian is leader in this segment and in the medium term we see potential for market share gains
Figure 12: SURF products can generate €13m of incremental EBITDA in 2014E (20% of the incremental EBITDA we forecast for Prysmian group
ABB18%
Nexans 27%
Prysmian40%
Other15%
0.0
10.0
20.0
30.0
40.0
50.0
60.0
70.0
80.0
2013 2014
Base case SURF incremental Other group incremental EBITDA
Source: Company data, Credit Suisse research Source: Credit Suisse estimates
2) SURF- Market concerns are overdone
We believe the market is overly concerned regarding the potential for this market for
Prysmian following the cost focus of Petrobras’ (Prysmian’s key customer) 2012-16
business plan (June 2012). Based on our analysis of flexible pipe production capacity in
Brazil and demand forecasts we remain confident that Prysmian can achieve 80%
utilisation at its new Vila Velha plant by 2015 (vs our estimate of 20% utilisation currently).
In our base case SURF accounts for 20% of our incremental 2014 EBITDA forecasts for
Prysmian. We acknowledge the potential for some short-term demand volatility in SURF
as the new Petrobras management become established, but in our bear case scenario we
only see 1.3% downside risk to consensus 2013 estimates.
3) Competitive threat – Prysmian are relatively well positioned
We map out the growth rates and margins of global competitors in the cable market and
give our view of the medium-term competitive outlook for cable end markets in Figure 13.
We view the competitive threat in Land High Voltage (LHV) as relatively well understood
but, based on the margin declines that have already occurred at Nexans, we expect more
moderate levels of pricing pressure going forward. However, in our view the risk in this
market remains relatively higher for Nexans based on 37% of its Land High Voltage sales
coming from the highly competitive Middle Eastern market. In our view Prysmian is better
positioned with lower exposure in this region and higher exposure to the >220KV segment
(60% of Prysmian’s Land HV sales).

12 February 2013
European Cable Sector 6
Figure 13: Competitive risk matrix for key cable end markets (more detail on page 31)
Risk Rating 1 2 3 4 5
Land High Voltage
Optical Fibre Telecom
Rail cables
Mining cables
Aerospace cables
Established
relationships
Low
Building cables
Market size less
attractive
High barriers to
entry
Electrical Distribution
Time frame in years
HighCopper telecom cable
Submarine cables
Medium
Automotive cables
Emerging mkt
competition has
had an impact
Source: Credit Suisse estimates
We have also focused on the threat in Optical Fibre and Cable where Prysmian is global leader and has 2011 sales of €1bn. In Europe (Prysmian’s core market) we see limited threat as we believe large Japanese competitors will likely focus on the faster-growing Chinese market in the medium term. Specifically in China we view the threat as manageable and see the market as attractive in the medium term based on 1) Prysmian’s #1 share in China through its JV with YOFC (Yangtze Optical Fibre & Cable), 2) greater pricing discipline due to the market structure (five key players), and 3) expected high demand limiting the risk of over-capacity and therefore the likelihood of pricing strategies. We expect local players to grow in size—however Prysmian operates primarily through its Chinese JV, making it competitive on price.
4) Self-help- Key driver of margin expansion in 2013/14
Prysmian: We believe Prysmian can achieve the top end (€170m) of synergies from its recent acquisition of Draka faster than consensus expects. We also see potential for further restructuring of its underperforming building cables business (Figure 14). Combined, we believe these factors could drive 5% upgrades to 2014 consensus EBIT.
Nexans: Nexans’ 2015 operating profit target is €350m–400m—our estimate is at the
lower end. We remain cautious because 1) we expect some slippage in targeted cost
savings, and 2) we believe details of the cost savings programme have not been finalised.
However, the level of saving as a percentage of sales is reasonable relative to the sector
(Figure 15) despite our caution on the eventual drop through to profits. If Nexans achieves
the low end of the targeted range we calculate the current price as broadly fair value.
Figure 14: In our Nexans Trade & Installers division restructuring scenario we estimate a 100bps improvement could generate €21m of savings
Figure 15: €65m of cost savings per year in 2014E–15E at Nexans looks credible relative to cost savings programmes across the sector as a % of sales
T&I restructuring scenario 100bps 200bps
2011 group employees 21,547 21,547
T&I (assume 30% of total) 6,464 6,464
Employee cost
Group Personnel Cost (€mn) 916 916
Implied annual employee salary (€,000) 42,512 42,512
Scenario cost savings
Targeted cost saving (€mn) 21 42
Implied redundancies (based on av salary) 494 988
as a % of T&I employees 7.6% 15.3%
as a % of group employees 2.3% 4.6%
Cost savings as a % of sales
2012E 2013E 2014E 2015E
Nexans 1.3% 1.2%
Electricals
Philips 1.8% 3.5%
Schneider 1.0% 1.4%
Siemens 1.7% 3.1%
Electrical Average 1.5% 2.7%
Mechanical
Alfa Laval 1.1% 0.3%
Assa Abloy 0.7% 0.4%
Electrolux 1.5% 2.3%
Metso nm 0.7%
Sandvik 0.8% 1.0%
SKF 0.4% 0.2%
Mechanical Average 0.7% 0.7% Source: Company data, Credit Suisse estimates Source: Credit Suisse estimates
12 February 2013
European Cable Sector 7
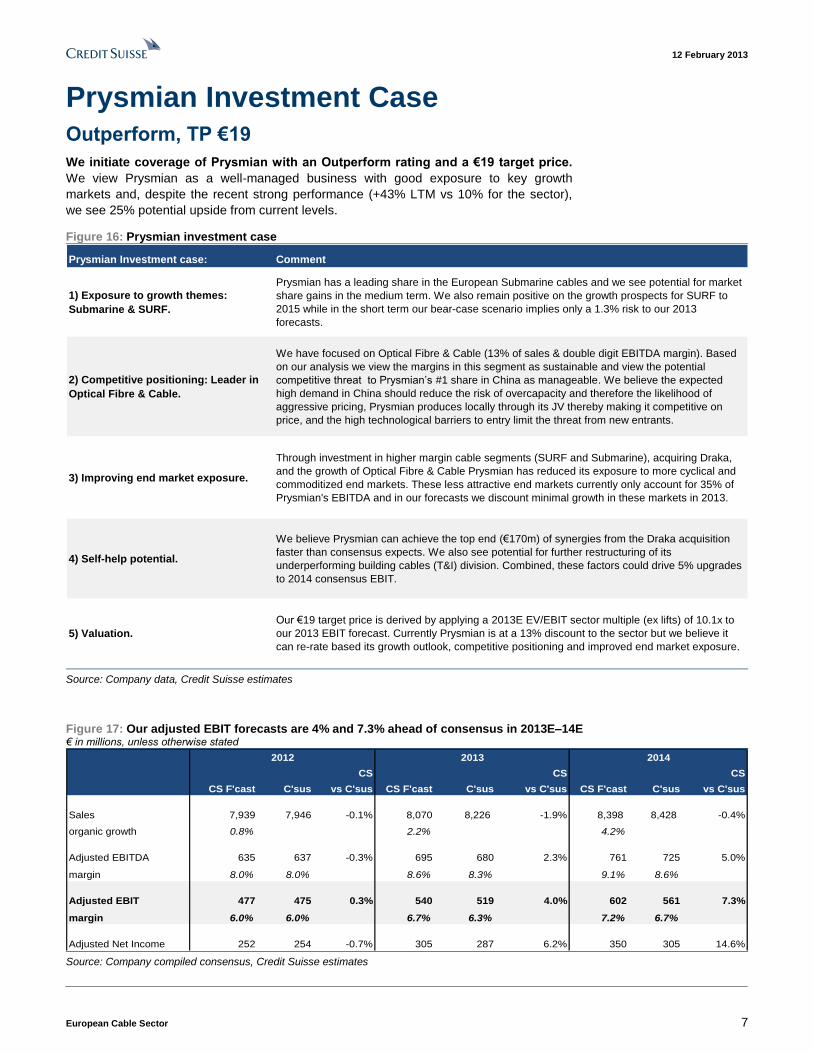
Prysmian Investment Case Outperform, TP €19
We initiate coverage of Prysmian with an Outperform rating and a €19 target price.
We view Prysmian as a well-managed business with good exposure to key growth
markets and, despite the recent strong performance (+43% LTM vs 10% for the sector),
we see 25% potential upside from current levels.
Figure 16: Prysmian investment case
Prysmian Investment case: Comment
1) Exposure to growth themes:
Submarine & SURF.
Prysmian has a leading share in the European Submarine cables and we see potential for market
share gains in the medium term. We also remain positive on the growth prospects for SURF to
2015 while in the short term our bear-case scenario implies only a 1.3% risk to our 2013
forecasts.
2) Competitive positioning: Leader in
Optical Fibre & Cable.
We have focused on Optical Fibre & Cable (13% of sales & double digit EBITDA margin). Based
on our analysis we view the margins in this segment as sustainable and view the potential
competitive threat to Prysmian’s #1 share in China as manageable. We believe the expected
high demand in China should reduce the risk of overcapacity and therefore the likelihood of
aggressive pricing, Prysmian produces locally through its JV thereby making it competitive on
price, and the high technological barriers to entry limit the threat from new entrants.
3) Improving end market exposure.
Through investment in higher margin cable segments (SURF and Submarine), acquiring Draka,
and the growth of Optical Fibre & Cable Prysmian has reduced its exposure to more cyclical and
commoditized end markets. These less attractive end markets currently only account for 35% of
Prysmian's EBITDA and in our forecasts we discount minimal growth in these markets in 2013.
4) Self-help potential.
We believe Prysmian can achieve the top end (€170m) of synergies from the Draka acquisition
faster than consensus expects. We also see potential for further restructuring of its
underperforming building cables (T&I) division. Combined, these factors could drive 5% upgrades
to 2014 consensus EBIT.
5) Valuation.
Our €19 target price is derived by applying a 2013E EV/EBIT sector multiple (ex lifts) of 10.1x to
our 2013 EBIT forecast. Currently Prysmian is at a 13% discount to the sector but we believe it
can re-rate based its growth outlook, competitive positioning and improved end market exposure.
Source: Company data, Credit Suisse estimates
Figure 17: Our adjusted EBIT forecasts are 4% and 7.3% ahead of consensus in 2013E–14E € in millions, unless otherwise stated
CS CS CS
CS F'cast C'sus vs C'sus CS F'cast C'sus vs C'sus CS F'cast C'sus vs C'sus
Sales 7,939 7,946 -0.1% 8,070 8,226 -1.9% 8,398 8,428 -0.4%
organic growth 0.8% 2.2% 4.2%
Adjusted EBITDA 635 637 -0.3% 695 680 2.3% 761 725 5.0%
margin 8.0% 8.0% 8.6% 8.3% 9.1% 8.6%
Adjusted EBIT 477 475 0.3% 540 519 4.0% 602 561 7.3%
margin 6.0% 6.0% 6.7% 6.3% 7.2% 6.7%
Adjusted Net Income 252 254 -0.7% 305 287 6.2% 350 305 14.6%
2012 2013 2014
Source: Company compiled consensus, Credit Suisse estimates
12 February 2013
European Cable Sector 8
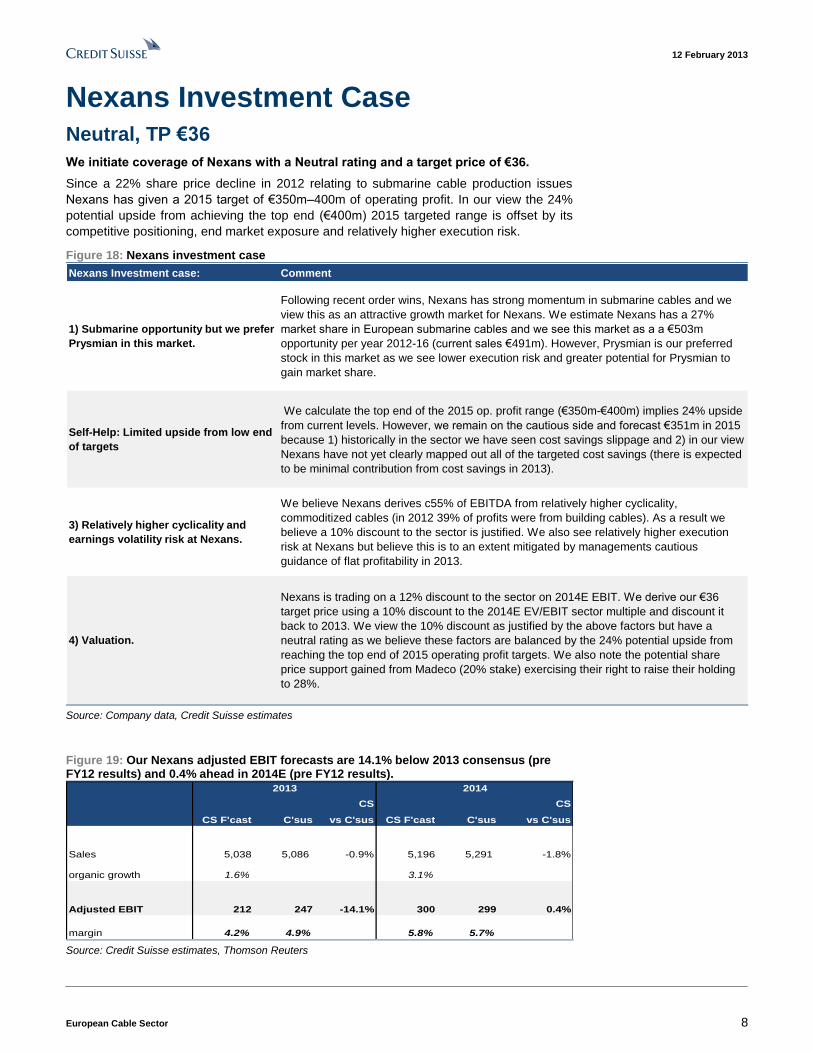
Nexans Investment Case Neutral, TP €36
We initiate coverage of Nexans with a Neutral rating and a target price of €36.
Since a 22% share price decline in 2012 relating to submarine cable production issues
Nexans has given a 2015 target of €350m–400m of operating profit. In our view the 24%
potential upside from achieving the top end (€400m) 2015 targeted range is offset by its
competitive positioning, end market exposure and relatively higher execution risk.
Figure 18: Nexans investment case
Nexans Investment case: Comment
1) Submarine opportunity but we prefer
Prysmian in this market.
Following recent order wins, Nexans has strong momentum in submarine cables and we
view this as an attractive growth market for Nexans. We estimate Nexans has a 27%
market share in European submarine cables and we see this market as a a €503m
opportunity per year 2012-16 (current sales €491m). However, Prysmian is our preferred
stock in this market as we see lower execution risk and greater potential for Prysmian to
gain market share.
Self-Help: Limited upside from low end
of targets
We calculate the top end of the 2015 op. profit range (€350m-€400m) implies 24% upside
from current levels. However, we remain on the cautious side and forecast €351m in 2015
because 1) historically in the sector we have seen cost savings slippage and 2) in our view
Nexans have not yet clearly mapped out all of the targeted cost savings (there is expected
to be minimal contribution from cost savings in 2013).
3) Relatively higher cyclicality and
earnings volatility risk at Nexans.
We believe Nexans derives c55% of EBITDA from relatively higher cyclicality,
commoditized cables (in 2012 39% of profits were from building cables). As a result we
believe a 10% discount to the sector is justified. We also see relatively higher execution
risk at Nexans but believe this is to an extent mitigated by managements cautious
guidance of flat profitability in 2013.
4) Valuation.
Nexans is trading on a 12% discount to the sector on 2014E EBIT. We derive our €36
target price using a 10% discount to the 2014E EV/EBIT sector multiple and discount it
back to 2013. We view the 10% discount as justified by the above factors but have a
neutral rating as we believe these factors are balanced by the 24% potential upside from
reaching the top end of 2015 operating profit targets. We also note the potential share
price support gained from Madeco (20% stake) exercising their right to raise their holding
to 28%.
Source: Company data, Credit Suisse estimates
Figure 19: Our Nexans adjusted EBIT forecasts are 14.1% below 2013 consensus (pre FY12 results) and 0.4% ahead in 2014E (pre FY12 results).
CS CS
CS F'cast C'sus vs C'sus CS F'cast C'sus vs C'sus
Sales 5,038 5,086 -0.9% 5,196 5,291 -1.8%
organic growth 1.6% 3.1%
Adjusted EBIT 212 247 -14.1% 300 299 0.4%
margin 4.2% 4.9% 5.8% 5.7%
2013 2014
Source: Credit Suisse estimates, Thomson Reuters
12 February 2013
European Cable Sector 9
Four medium-term sector drivers #1: Submarine cables
#2: SURF: Limited downside risk in the near term
#3: Mapping the global cable competitive landscape
#4: Self-help is key to margin expansion
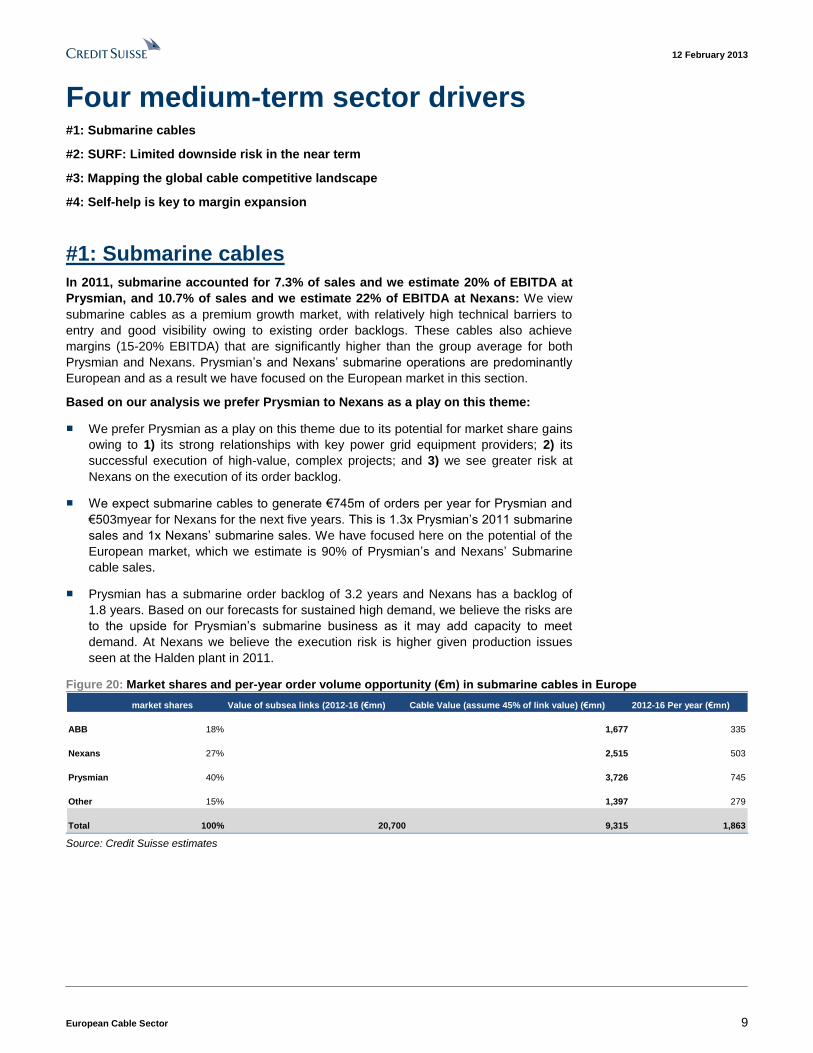
#1: Submarine cables
In 2011, submarine accounted for 7.3% of sales and we estimate 20% of EBITDA at
Prysmian, and 10.7% of sales and we estimate 22% of EBITDA at Nexans: We view
submarine cables as a premium growth market, with relatively high technical barriers to
entry and good visibility owing to existing order backlogs. These cables also achieve
margins (15-20% EBITDA) that are significantly higher than the group average for both
Prysmian and Nexans. Prysmian’s and Nexans’ submarine operations are predominantly
European and as a result we have focused on the European market in this section.
Based on our analysis we prefer Prysmian to Nexans as a play on this theme:
■ We prefer Prysmian as a play on this theme due to its potential for market share gains
owing to 1) its strong relationships with key power grid equipment providers; 2) its
successful execution of high-value, complex projects; and 3) we see greater risk at
Nexans on the execution of its order backlog.
■ We expect submarine cables to generate €745m of orders per year for Prysmian and
€503myear for Nexans for the next five years. This is 1.3x Prysmian’s 2011 submarine
sales and 1x Nexans’ submarine sales. We have focused here on the potential of the
European market, which we estimate is 90% of Prysmian’s and Nexans’ Submarine
cable sales.
■ Prysmian has a submarine order backlog of 3.2 years and Nexans has a backlog of
1.8 years. Based on our forecasts for sustained high demand, we believe the risks are
to the upside for Prysmian’s submarine business as it may add capacity to meet
demand. At Nexans we believe the execution risk is higher given production issues
seen at the Halden plant in 2011.
Figure 20: Market shares and per-year order volume opportunity (€m) in submarine cables in Europe
market shares Value of subsea links (2012-16 (€mn) Cable Value (assume 45% of link value) (€mn) 2012-16 Per year (€mn)
ABB 18% 1,677 335
Nexans 27% 2,515 503
Prysmian 40% 3,726 745
Other 15% 1,397 279
Total 100% 20,700 9,315 1,863 Source: Credit Suisse estimates

12 February 2013
European Cable Sector 10
Forecasting grid investment over the next 10 years
To forecast the submarine cable market we have used data from the Ten Year Network
Development Plan (TYNDP) 2012, which analyses required grid investment based on
research and feedback from stakeholders.
According to the TYNDP 2012 renewable capacity will increase by 250GW over the next
ten years. Renewable additions are most commonly away from the areas of high electricity
demand (eg off-shore wind) and as a result electricity will have to travel further through the
grid to meet demand. This is forecast to drive total investment in the grid of €104bn,
of which €23bn is for subsea cables.
In Figure 21 we show the TYNDP forecasts broken down by cable type for subsea cables
in the medium term (2012-2017) and the long term (2017-2022). We highlight that
submarine in this instance includes interconnections (to connect Islands or regions under
the sea) and off-shore wind connection cables (to connect off-shore wind farms to the
grid).
Figure 21: The TYNDP forecasts subsea cables in the medium term (2012-17) to account
for 46% of extra high voltage cables (KM)
0
10000
20000
30000
40000
Mid Term (2012-2017) Long Term (2017-2022)
Subsea Cables Overhead Lines Inland Cables Upgrades
Source: TYNDP 2012
From Figure 21 we would highlight:
■ Over the next ten years, €23bn is expected to be spent on subsea links and we
estimate 45% (€10.4bn) of this will be related specifically to cables and therefore
within Prysmian’s and Nexans’ addressable markets.
■ 90% (€20.7bn) of subsea links in the TYNDP are expected to be installed in the next
five years. This makes the total subsea link market (including substations, cables and
other equipment) valued at €4.1bn per year for the next five years.
■ Assuming 45% of the cost of subsea links is associated with the cables, we
estimate the total value of the cable market at €1.9bn per year.
12 February 2013
European Cable Sector 11
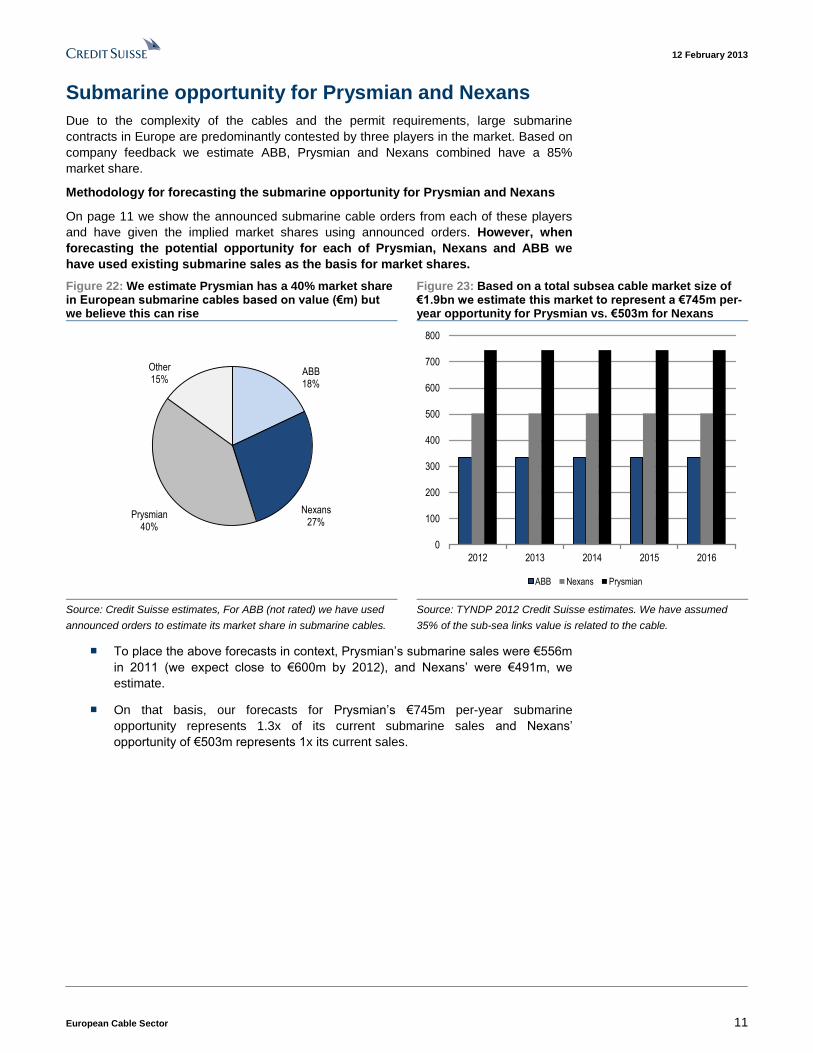
Submarine opportunity for Prysmian and Nexans
Due to the complexity of the cables and the permit requirements, large submarine
contracts in Europe are predominantly contested by three players in the market. Based on
company feedback we estimate ABB, Prysmian and Nexans combined have a 85%
market share.
Methodology for forecasting the submarine opportunity for Prysmian and Nexans
On page 11 we show the announced submarine cable orders from each of these players
and have given the implied market shares using announced orders. However, when
forecasting the potential opportunity for each of Prysmian, Nexans and ABB we
have used existing submarine sales as the basis for market shares.
Figure 22: We estimate Prysmian has a 40% market share in European submarine cables based on value (€m) but we believe this can rise
Figure 23: Based on a total subsea cable market size of €1.9bn we estimate this market to represent a €745m per-year opportunity for Prysmian vs. €503m for Nexans
ABB18%
Nexans 27%
Prysmian40%
Other15%
0
100
200
300
400
500
600
700
800
2012 2013 2014 2015 2016
ABB Nexans Prysmian
Source: Credit Suisse estimates, For ABB (not rated) we have used
announced orders to estimate its market share in submarine cables.
Source: TYNDP 2012 Credit Suisse estimates. We have assumed
35% of the sub-sea links value is related to the cable.
■ To place the above forecasts in context, Prysmian’s submarine sales were €556m
in 2011 (we expect close to €600m by 2012), and Nexans’ were €491m, we
estimate.
■ On that basis, our forecasts for Prysmian’s €745m per-year submarine
opportunity represents 1.3x of its current submarine sales and Nexans’
opportunity of €503m represents 1x its current sales.
12 February 2013
European Cable Sector 12
Prysmian’s market share may increase in the
medium term
We see Prysmian’s market share in the submarine market as well established and,
based on its ability to bring on new capacity, we see potential for this share to rise.
■ Prysmian has established relationships with key power grid equipment players, eg
Siemens. Siemens is not only prominent in installing offshore wind turbines in Europe
(74% share in 2012) but also in providing the substations to connect wind farms to the
grid (Figure 25).
■ Prysmian has the most experience in complex, high-value extra high voltage (EHV)
interconnections and in offshore wind connections, which are among the deepest and
furthest offshore connections that have been laid. The European Wind Energy
Association expects both the average water depth and distance to shore of projects to
increase over the coming years.
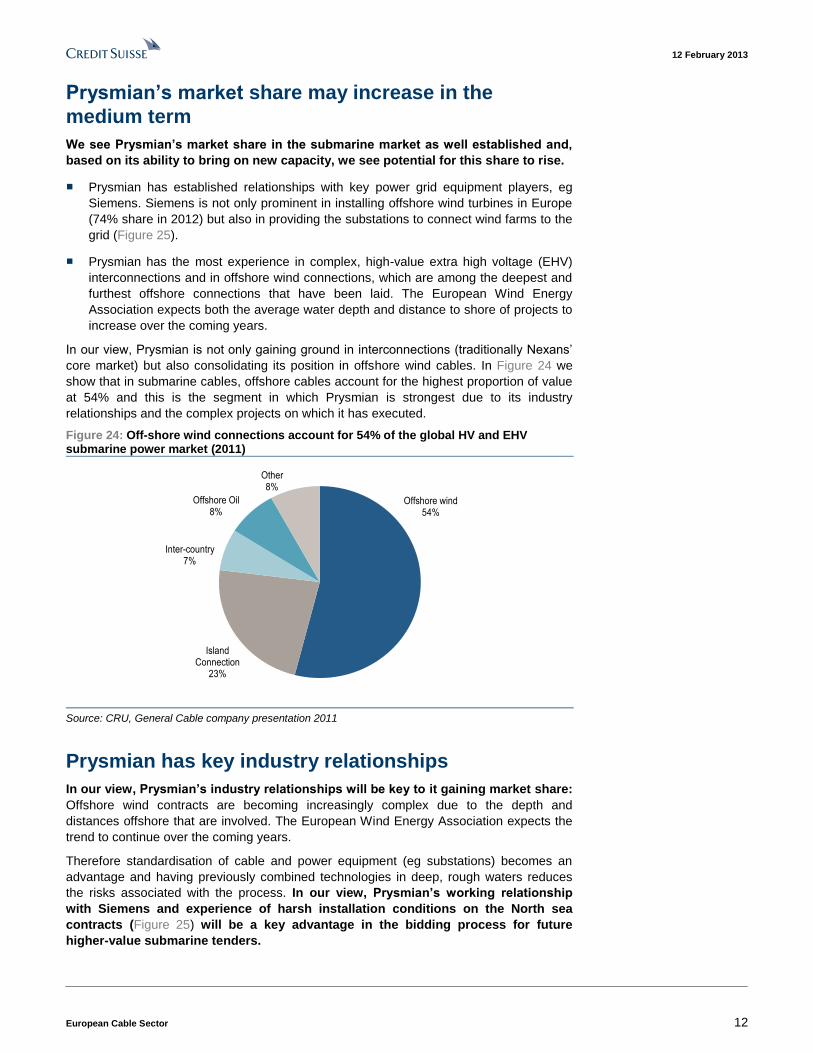
In our view, Prysmian is not only gaining ground in interconnections (traditionally Nexans’
core market) but also consolidating its position in offshore wind cables. In Figure 24 we
show that in submarine cables, offshore cables account for the highest proportion of value
at 54% and this is the segment in which Prysmian is strongest due to its industry
relationships and the complex projects on which it has executed.
Figure 24: Off-shore wind connections account for 54% of the global HV and EHV submarine power market (2011)
Offshore wind54%
Island Connection
23%
Inter-country7%
Offshore Oil8%
Other8%
Source: CRU, General Cable company presentation 2011
Prysmian has key industry relationships
In our view, Prysmian’s industry relationships will be key to it gaining market share:
Offshore wind contracts are becoming increasingly complex due to the depth and
distances offshore that are involved. The European Wind Energy Association expects the
trend to continue over the coming years.
Therefore standardisation of cable and power equipment (eg substations) becomes an
advantage and having previously combined technologies in deep, rough waters reduces
the risks associated with the process. In our view, Prysmian’s working relationship
with Siemens and experience of harsh installation conditions on the North sea
contracts (Figure 25) will be a key advantage in the bidding process for future
higher-value submarine tenders.

12 February 2013
European Cable Sector 13
Prysmian, through the German North Sea offshore wind projects, has worked on four large
projects where Siemens has provided the substations. These contracts are laid out below
in Figure 25 and we would note their relatively high value accounting for a combined
€850m of orders for Prysmian. We expect Prysmian to continue to win a significant share
of the next round of North Sea offshore wind connections such as Borwin 3, Helwin 3 and
the next Sylwin, which are likely to be announced in 2013.
Figure 25: German offshore wind transmission contracts
Connection Operator Wind Farm MW Power System Value (€ mn) Cables Value (EUR mn) Exp. Completion
Borwin 2 TenneT Veja Mate and Global Tech 1 800 Siemens 250 Prysmian 250 2013
Helwin1 TenneT Nordsee-Ost 576 Siemens 350 Prysmian 150 2013
Sylwin TenneT DanTysk 288 Siemens 470 Prysmian 180 2014
Helwin2 TenneT Amrum Bank West 300-400 Siemens 400 Prysmian 200 2015
Source: Company data, Credit Suisse research
These contracts have caused Siemens to take charges relating to the Borwin 2 and Helwin
1 contracts, while Prysmian management guides for some push-out to cash milestones in
2013. The issues on these contracts however were related to TenneT (the grid operator)
which halted installation over financial risk concerns (delays were unrelated to Prysmian’s
cable production). We believe that the German government is close to a legislative
solution that would allow transmission system operators to pass on the costs of connection
delays on to consumers.
We expect Prysmian to win future North sea contracts…
■ Prysmian management commented on its nine month 2012 results conference call
that it was currently tendering for further North Sea contracts, which include Borwin 3,
Helwin 3 and the next Sylwin contract.
■ We expect Prysmian to hold a significant advantage over its competitors in the tender
process, as it is working alongside Siemens on similar contracts which include Borwin
3 and 4, and Helwin 3.
■ The combined value of the Borwin 2, Helwin 1 and Sylwin contracts for Prysmian was
€600m and potentially the next three North Sea contracts could be of a similar value.
The opportunity for Nexans is in French offshore wind…
■ France aims to add 6GW of offshore wind, to come online by 2020. However, EDF
published a report (18 July, 2012) estimating France would only be able to achieve
3.9GW by 2020.
■ 2GW of capacity was awarded in April 2012 in four development zones while the
awarding of the last one will take place at a later date.
■ EDF and Alstom have won three out of four and Iberdrola won one. We would expect
Nexans to play a relatively central role in providing cables for these.
■ These wind farms will be less distance offshore than in the North Sea farms (c20km vs
>100km in the North Sea). We estimate the value per grid connection is likely to be
€30m-50m based on previously won contracts of a similar specification.

12 February 2013
European Cable Sector 14
Prysmian has won higher value, higher specification
Submarine cable contracts
We also believe Prysmian may take share via winning the higher value, more
complex submarine contracts which we have seen since 2010.
In Figure 28 we have listed announced submarine contract wins in Europe—on average
Prysmian’s value per contract has been €266m vs. €105m per contract at Nexans.
The European Wind Energy Association expects the trend towards large projects to
continue over the coming years with both average water depth and distance to shore
expected to increase.
In the last two years, Prysmian has won large contracts including the €800m Westlink
interconnection and the German offshore wind contracts. Not only are these contracts of
significant value but the company is achieving record technical specifications on them.
■ For example, the €800m Westlink interconnection contract set a record in terms of
voltage for an insulated cable as it will achieve 600KV.
■ Similarly the German offshore wind connections in the North Sea have involved
Siemens’ Voltage Sourced Converters (VSC), which has allowed Prysmian to use
extruded HVDC cables for the connections. These were the first commercial 300KV
DC cables made using extruded technology, which has the advantage of being lighter
and less susceptible to faults than impregnated technology.
As a result of these advances, we expect Prysmian to remain the market leader with an
opportunity to extend its market share (in euro value terms) depending on its ability to
increase capacity. However, we expect Prysmian to remain at the forefront of cable
technology resulting in its winning the higher value submarine contracts.
We also see greater project execution risk at Nexans
Submarine cable production processes are very complex. Due to undersupply in Europe,
Prysmian and Nexans’ submarine factories are running at full capacity. Figure 26 shows
Prysmian’s and Nexans’ order backlogs in submarine and high voltage cables, indicating
greater earnings visibility at Prysmian. We also believe there is greater execution risk at
Nexans based on a recent production issue at its Halden plant. Despite announced
plans to increase capacity at Prysmian, and past increases at Nexans, we expect
both to continue running their submarine plants at near-full capacity over the next
12 months.
12 February 2013
European Cable Sector 15
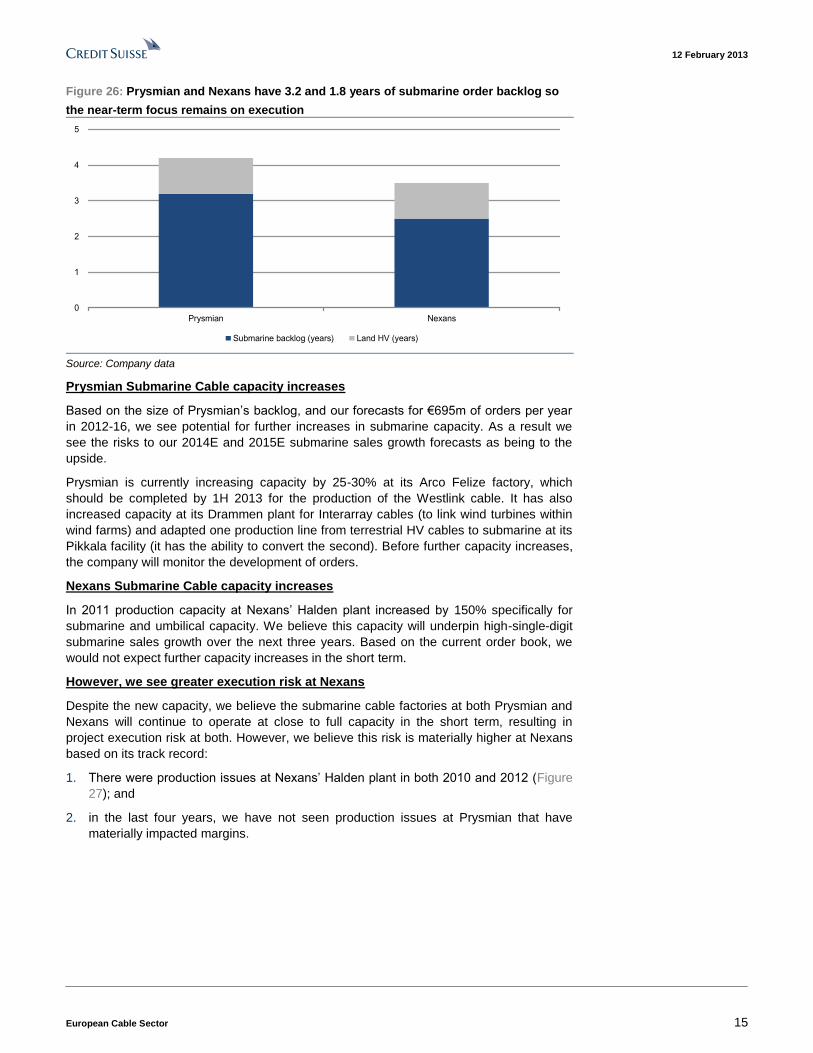
Figure 26: Prysmian and Nexans have 3.2 and 1.8 years of submarine order backlog so
the near-term focus remains on execution
0
1
2
3
4
5
Prysmian Nexans
Submarine backlog (years) Land HV (years)
Source: Company data
Prysmian Submarine Cable capacity increases
Based on the size of Prysmian’s backlog, and our forecasts for €695m of orders per year
in 2012-16, we see potential for further increases in submarine capacity. As a result we
see the risks to our 2014E and 2015E submarine sales growth forecasts as being to the
upside.
Prysmian is currently increasing capacity by 25-30% at its Arco Felize factory, which
should be completed by 1H 2013 for the production of the Westlink cable. It has also
increased capacity at its Drammen plant for Interarray cables (to link wind turbines within
wind farms) and adapted one production line from terrestrial HV cables to submarine at its
Pikkala facility (it has the ability to convert the second). Before further capacity increases,
the company will monitor the development of orders.
Nexans Submarine Cable capacity increases
In 2011 production capacity at Nexans’ Halden plant increased by 150% specifically for
submarine and umbilical capacity. We believe this capacity will underpin high-single-digit
submarine sales growth over the next three years. Based on the current order book, we
would not expect further capacity increases in the short term.
However, we see greater execution risk at Nexans
Despite the new capacity, we believe the submarine cable factories at both Prysmian and
Nexans will continue to operate at close to full capacity in the short term, resulting in
project execution risk at both. However, we believe this risk is materially higher at Nexans
based on its track record:
1. There were production issues at Nexans’ Halden plant in both 2010 and 2012 (Figure
27); and
2. in the last four years, we have not seen production issues at Prysmian that have
materially impacted margins.

12 February 2013
European Cable Sector 16
Figure 27: Nexans reported production issues on more than one occasion in its high voltage business
Reporting period Commentary
Q2 10
The margin on high voltage business was affected by additional cost incurred as a result of execution
difficulties in the submarine cable business. A large reorganization and capacity investments should see a
return to normal operations in the second half of the year
Q1 12Regarding submarine transmission activity, the Group experienced in the quarter a slower than expected rate in
commencing certain production runs. Source: Company data
■ Nexans’ production issues in Q1 12 resulted in an organic decline of -32% in
submarine and caused the overall group margin in H1 12 to fall to 3.6% (down 150bps
yoy). We view the risks in 2013 and 2014 as relatively higher for Nexans based on
these historical production issues.
■ Nexans has been proactive in its approach to solving these issues and has changed
the management of the division. It has also renegotiated delivery dates to reduce the
pressure on the production schedule.
■ However, given the impact production issues can have on group profitability, we see
the successful execution of the existing backlogs as a key driver of earnings stability
over the next 12 months. We would need to see a few quarters of normalised
transmission margins before being reassured that these production issues have been
fully resolved.
12 February 2013
European Cable Sector 17
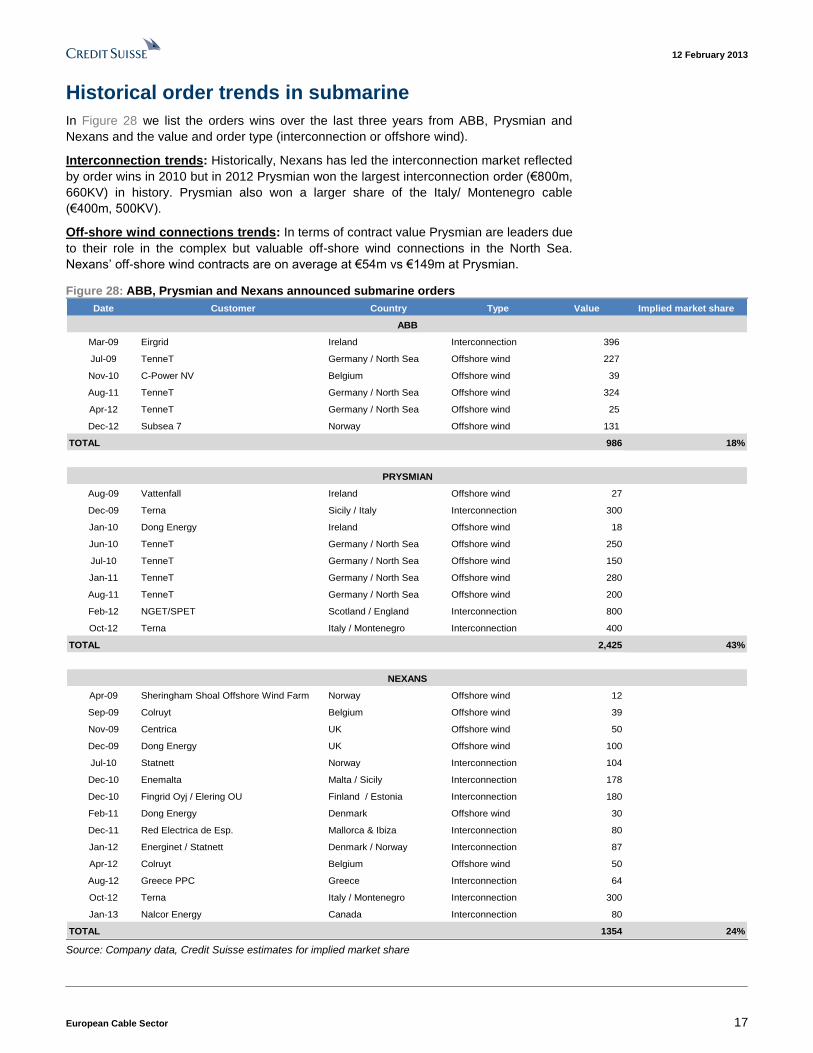
Historical order trends in submarine
In Figure 28 we list the orders wins over the last three years from ABB, Prysmian and
Nexans and the value and order type (interconnection or offshore wind).
Interconnection trends: Historically, Nexans has led the interconnection market reflected
by order wins in 2010 but in 2012 Prysmian won the largest interconnection order (€800m,
660KV) in history. Prysmian also won a larger share of the Italy/ Montenegro cable
(€400m, 500KV).
Off-shore wind connections trends: In terms of contract value Prysmian are leaders due
to their role in the complex but valuable off-shore wind connections in the North Sea.
Nexans’ off-shore wind contracts are on average at €54m vs €149m at Prysmian.
Figure 28: ABB, Prysmian and Nexans announced submarine orders
Date Customer Country Type Value Implied market share
Mar-09 Eirgrid Ireland Interconnection 396
Jul-09 TenneT Germany / North Sea Offshore wind 227
Nov-10 C-Power NV Belgium Offshore wind 39
Aug-11 TenneT Germany / North Sea Offshore wind 324
Apr-12 TenneT Germany / North Sea Offshore wind 25
Dec-12 Subsea 7 Norway Offshore wind 131
TOTAL 986 18%
Aug-09 Vattenfall Ireland Offshore wind 27
Dec-09 Terna Sicily / Italy Interconnection 300
Jan-10 Dong Energy Ireland Offshore wind 18
Jun-10 TenneT Germany / North Sea Offshore wind 250
Jul-10 TenneT Germany / North Sea Offshore wind 150
Jan-11 TenneT Germany / North Sea Offshore wind 280
Aug-11 TenneT Germany / North Sea Offshore wind 200
Feb-12 NGET/SPET Scotland / England Interconnection 800
Oct-12 Terna Italy / Montenegro Interconnection 400
TOTAL 2,425 43%
Apr-09 Sheringham Shoal Offshore Wind Farm Norway Offshore wind 12
Sep-09 Colruyt Belgium Offshore wind 39
Nov-09 Centrica UK Offshore wind 50
Dec-09 Dong Energy UK Offshore wind 100
Jul-10 Statnett Norway Interconnection 104
Dec-10 Enemalta Malta / Sicily Interconnection 178
Dec-10 Fingrid Oyj / Elering OU Finland / Estonia Interconnection 180
Feb-11 Dong Energy Denmark Offshore wind 30
Dec-11 Red Electrica de Esp. Mallorca & Ibiza Interconnection 80
Jan-12 Energinet / Statnett Denmark / Norway Interconnection 87
Apr-12 Colruyt Belgium Offshore wind 50
Aug-12 Greece PPC Greece Interconnection 64
Oct-12 Terna Italy / Montenegro Interconnection 300
Jan-13 Nalcor Energy Canada Interconnection 80
TOTAL 1354 24%
NEXANS
PRYSMIAN
ABB
Source: Company data, Credit Suisse estimates for implied market share
12 February 2013
European Cable Sector 18
Risks to our positive stance on submarine cables
■ Renewable subsidies: We acknowledge that renewables are becoming an expensive
option given the current low cost of electricity in Europe. Despite this we do not expect
any material change in governmental policy in the medium term (2012-2017) and
expect the EU to keep to the 20-20-20 target. We also note that Germany returning to
nuclear remains unlikely, making the 10GW of offshore wind additions a necessity. On
this basis we remain confident in our €830m and €437m per year sales
opportunity estimates for Prysmian and Nexans in submarine cables.
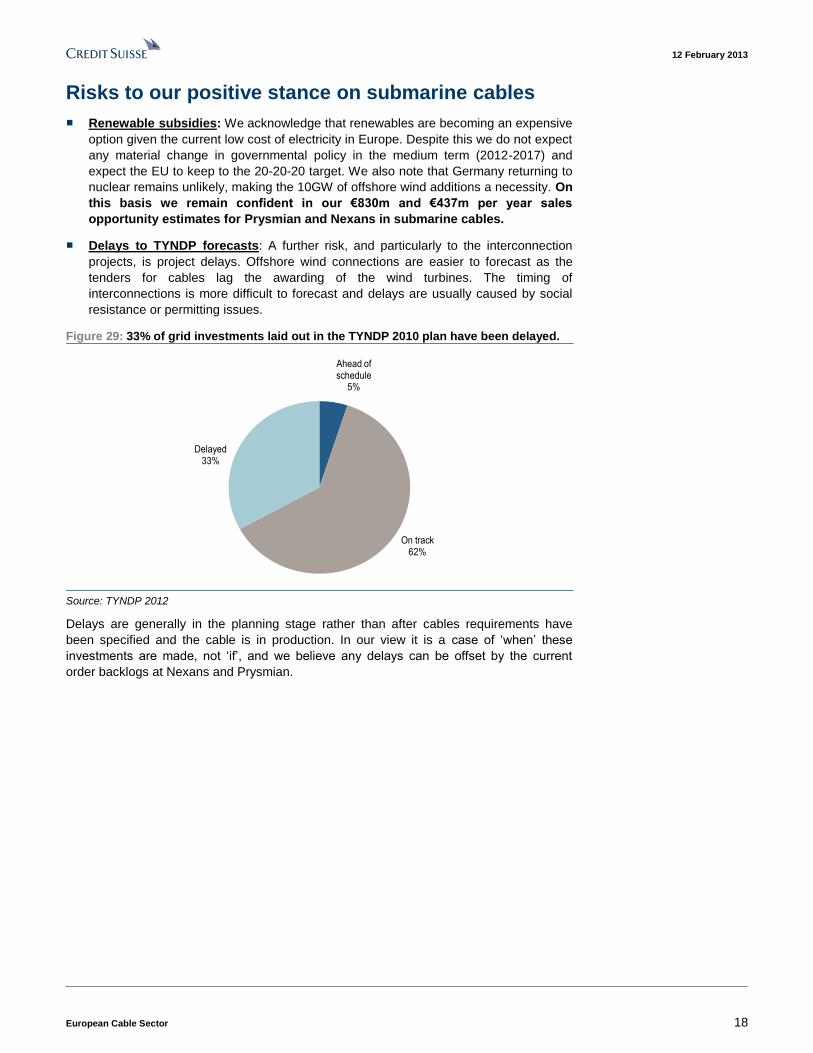
■ Delays to TYNDP forecasts: A further risk, and particularly to the interconnection
projects, is project delays. Offshore wind connections are easier to forecast as the
tenders for cables lag the awarding of the wind turbines. The timing of
interconnections is more difficult to forecast and delays are usually caused by social
resistance or permitting issues.
Figure 29: 33% of grid investments laid out in the TYNDP 2010 plan have been delayed.
Ahead of schedule
5%
On track62%
Delayed33%
Source: TYNDP 2012
Delays are generally in the planning stage rather than after cables requirements have
been specified and the cable is in production. In our view it is a case of ‘when’ these
investments are made, not ‘if’, and we believe any delays can be offset by the current
order backlogs at Nexans and Prysmian.
12 February 2013
European Cable Sector 19
#2: SURF: Limited downside risk in the near term
SURF (Subsea Umbilicals, Risers (or flexible pipes) & Flow lines) accounts for 2% of
group sales but we view it as an important growth driver and in our base case it accounts
for 12% and 20% of incremental group EBITDA in 2013E and 2014E, respectively.
We believe the market has become overly concerned regarding Prysmian’s ability to ramp
up capacity utilisation (currently 20%) in flexible pipes at its Vila Velha plant following
Petrobras’ (largest customer) 2012-2016 business plan release (June 2012). This is
because 1) it is a newly built asset that could result in potential write-downs and 2) SURF
is an important growth driver for Prysmian owing to the flexible pipe capacity ramp-up and
high margins on these products. We have also looked at Saipem’s (Oil Field services)
profit warning on 30/01/13 and see limited threat to our thesis for the SURF business.
In our base case for SURF we assume it accounts for 12% of the incremental EBITDA we
forecast for the group in 2013 and 20% in 2014. Stress testing our assumptions using a
bear case only implies 1.3% downgrades to our group EBITDA forecast in 2013 and 2014.
We worked with our Petrobras analyst and looked at competitors (Technip), and
conclude that these concerns are overdone. We would highlight the following:
■ PROMINP forecasts demand for flexible pipes in 2014 at 2,240 nKM vs. installed
production capacity in Brazil of 1,590 nKM (nKM stands for normalised kilometres),
which we believe underpins our base case SURF assumptions.
■ In our base case we forecast a conservative rise to 35% flexible pipe capacity
utilisation in 2013 rising to 80% by 2015. In 2013 and 2014 respectively our SURF
forecasts account for 12% and 20% of incremental EBITDA for the group
■ In our bear case scenario we see potential for limited downgrades to consensus
(-1.3%). However we would also note that in our base case scenario we see
upside risk for the remaining 93% of sales in the industrial division as our
current forecasts imply limited growth in these areas.
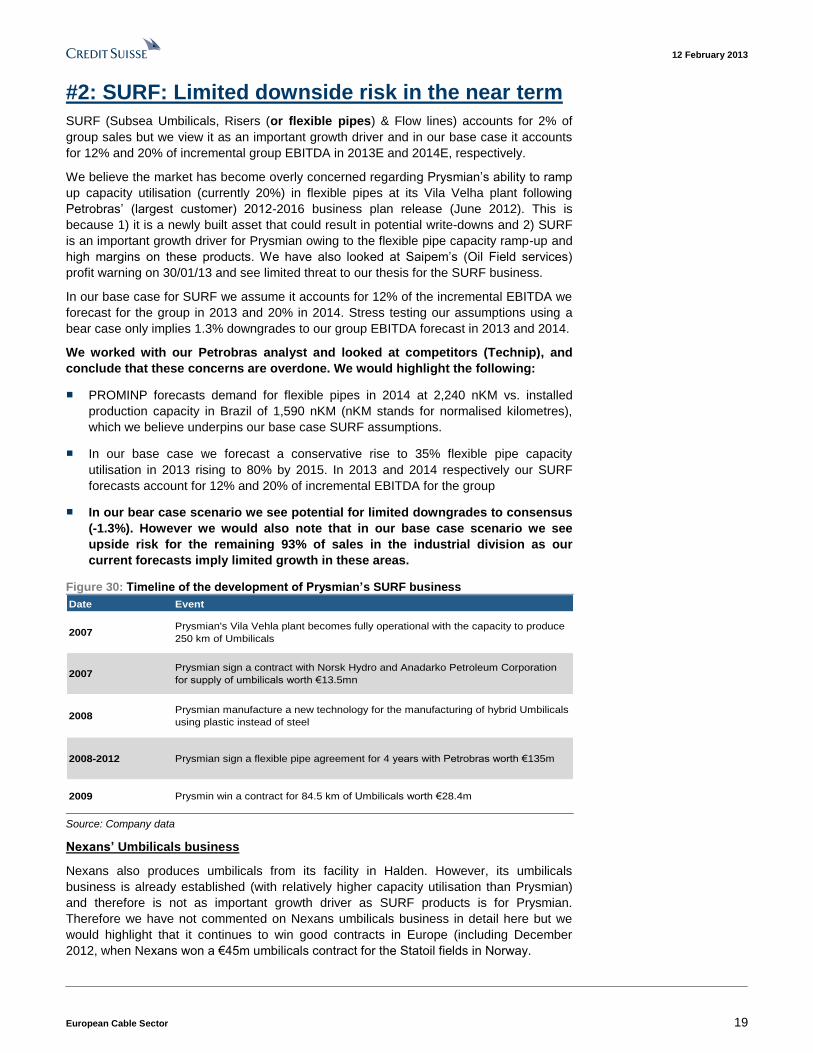
Figure 30: Timeline of the development of Prysmian’s SURF business
Date Event
2007Prysmian's Vila Vehla plant becomes fully operational with the capacity to produce
250 km of Umbilicals
2007Prysmian sign a contract with Norsk Hydro and Anadarko Petroleum Corporation
for supply of umbilicals worth €13.5mn
2008Prysmian manufacture a new technology for the manufacturing of hybrid Umbilicals
using plastic instead of steel
2008-2012 Prysmian sign a flexible pipe agreement for 4 years with Petrobras worth €135m
2009 Prysmin win a contract for 84.5 km of Umbilicals worth €28.4m
Source: Company data
Nexans’ Umbilicals business
Nexans also produces umbilicals from its facility in Halden. However, its umbilicals
business is already established (with relatively higher capacity utilisation than Prysmian)
and therefore is not as important growth driver as SURF products is for Prysmian.
Therefore we have not commented on Nexans umbilicals business in detail here but we
would highlight that it continues to win good contracts in Europe (including December
2012, when Nexans won a €45m umbilicals contract for the Statoil fields in Norway.
12 February 2013
European Cable Sector 20
What are SURF products?
SURF products are used in the production of oil from the sea floor to floating or fixed
platforms. In Prysmian’s SURF business specifically, they include umbilicals (2012E
revenue €45m), downhole technology (2012E revenue €45m) and flexible pipes (€30m).
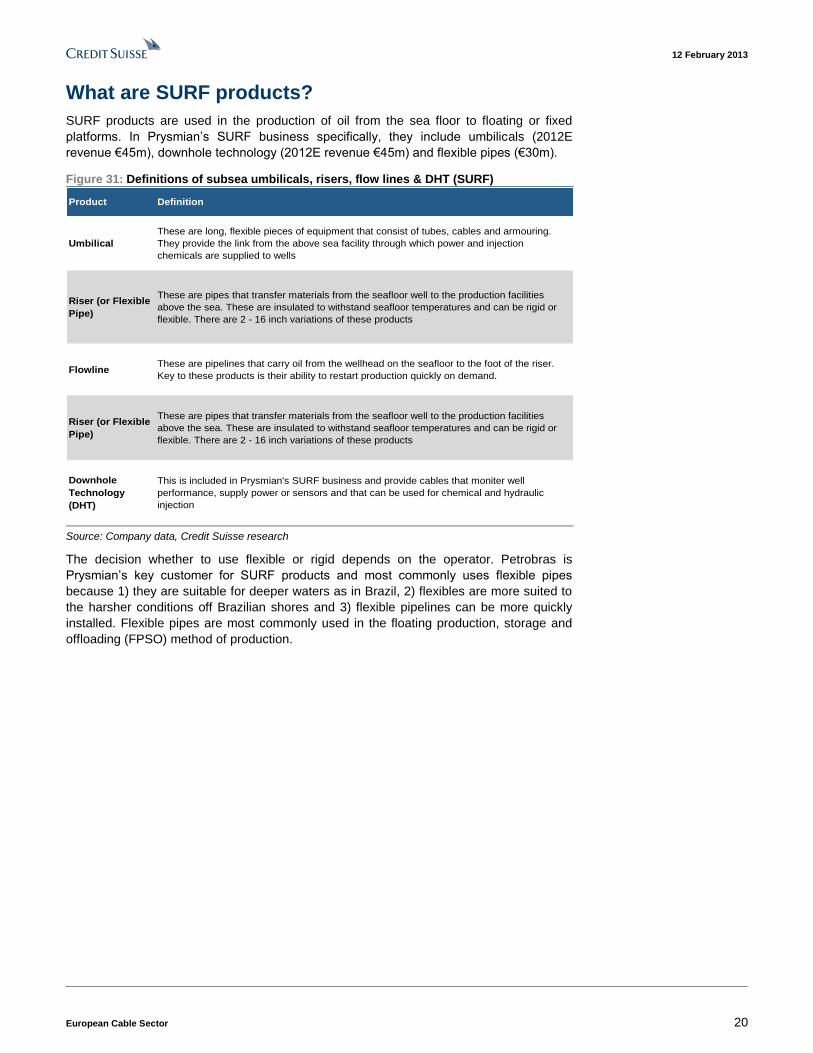
Figure 31: Definitions of subsea umbilicals, risers, flow lines & DHT (SURF)
Product Definition
Umbilical
These are long, flexible pieces of equipment that consist of tubes, cables and armouring.
They provide the link from the above sea facility through which power and injection
chemicals are supplied to wells
Riser (or Flexible
Pipe)
These are pipes that transfer materials from the seafloor well to the production facilities
above the sea. These are insulated to withstand seafloor temperatures and can be rigid or
flexible. There are 2 - 16 inch variations of these products
Flowline These are pipelines that carry oil from the wellhead on the seafloor to the foot of the riser.
Key to these products is their ability to restart production quickly on demand.
Riser (or Flexible
Pipe)
These are pipes that transfer materials from the seafloor well to the production facilities
above the sea. These are insulated to withstand seafloor temperatures and can be rigid or
flexible. There are 2 - 16 inch variations of these products
Downhole
Technology
(DHT)
This is included in Prysmian's SURF business and provide cables that moniter well
performance, supply power or sensors and that can be used for chemical and hydraulic
injection
Source: Company data, Credit Suisse research
The decision whether to use flexible or rigid depends on the operator. Petrobras is
Prysmian’s key customer for SURF products and most commonly uses flexible pipes
because 1) they are suitable for deeper waters as in Brazil, 2) flexibles are more suited to
the harsher conditions off Brazilian shores and 3) flexible pipelines can be more quickly
installed. Flexible pipes are most commonly used in the floating production, storage and
offloading (FPSO) method of production.
12 February 2013
European Cable Sector 21
Technical specifications of flexible pipes
■ Flexible pipes range from 2 inches to 16 inches in diameter.
■ The qualification process is complex, particularly for pre-salt conditions (water
depths of 2000KM+, high CO2 and H2S) which place extra pressure on the pipe.
■ Currently Technip and Wellstream are the largest producers of flexible pipes for
Petrobras and to an extent have a monopoly over the higher-end specification flexible
pipes.
■ Prysmian is qualified to produce 2- and 4-inch flexible pipes and is expected to gain
accreditation for 6-inch pipes from Petrobras in the near future. This broader offering
will allow Prysmian’s flexible pipes to be used in more locations in the Santos and
Campos basins.
The qualification process for flexible pipes is complex and makes flexible pipes relatively
R&D intensive. We believe there is a 4-5-year lead time for a new entrant to be able to
compete at the high end of the market, which is still dominated by Technip and
Wellstream.
On this basis Prysmian may be able to sell to the very high end (pre-salt) of the flexible
pipe market in 2014. However, qualification for high-end flexible pipes is not a formality
and NKT-flexibles have not managed to break the high-end duopoly of Technip and
Wellstream despite being in this market for a relatively long time.
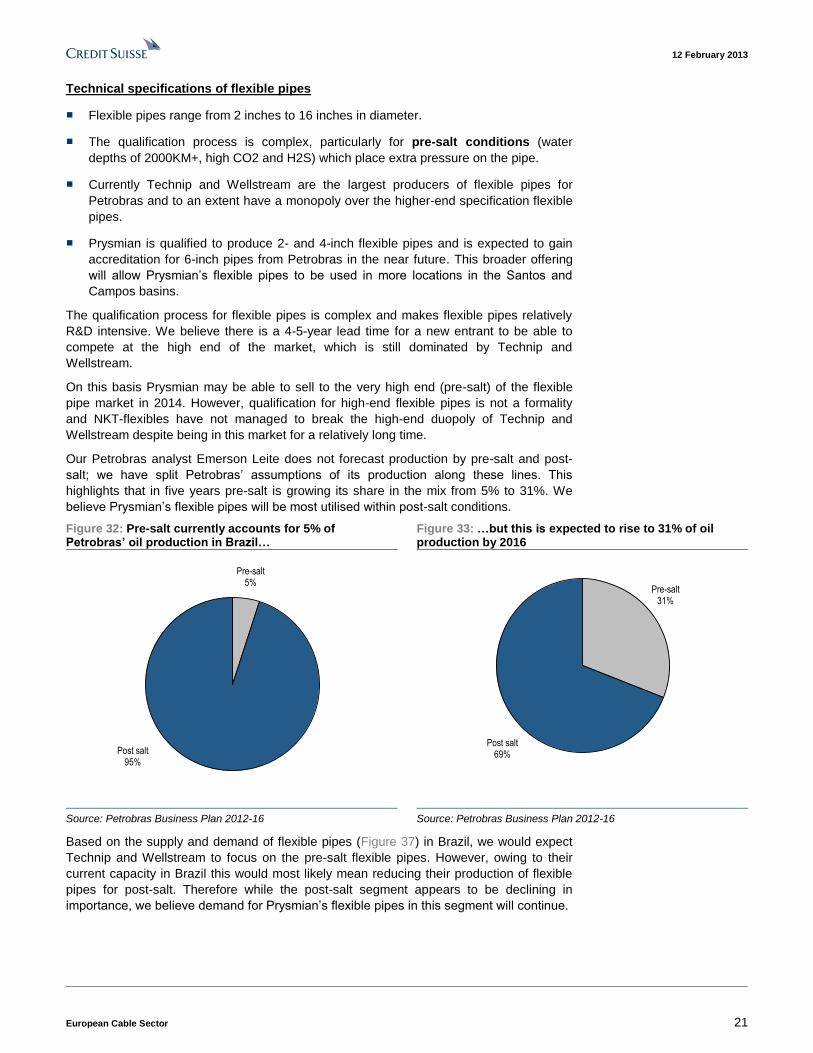
Our Petrobras analyst Emerson Leite does not forecast production by pre-salt and post-
salt; we have split Petrobras’ assumptions of its production along these lines. This
highlights that in five years pre-salt is growing its share in the mix from 5% to 31%. We
believe Prysmian’s flexible pipes will be most utilised within post-salt conditions.
Figure 32: Pre-salt currently accounts for 5% of Petrobras’ oil production in Brazil…
Figure 33: …but this is expected to rise to 31% of oil production by 2016
Pre-salt 5%
Post salt95%
Pre-salt 31%
Post salt69%
Source: Petrobras Business Plan 2012-16 Source: Petrobras Business Plan 2012-16
Based on the supply and demand of flexible pipes (Figure 37) in Brazil, we would expect
Technip and Wellstream to focus on the pre-salt flexible pipes. However, owing to their
current capacity in Brazil this would most likely mean reducing their production of flexible
pipes for post-salt. Therefore while the post-salt segment appears to be declining in
importance, we believe demand for Prysmian’s flexible pipes in this segment will continue.
12 February 2013
European Cable Sector 22
Why is the market concerned about SURF products?
Petrobras’ 2012-16 business plan and management change have had a negative
readacross to Prysmian based on the cost-saving focus that could affect the ramp-up of its
Vila Velha plant. While we do not believe it has materially affected consensus forecasts,
this was one of the bull cases for Prysmian in 1H12 and we believe recent news flow may
have weighed on the multiple. We assume only a moderate pick-up in capacity in
2013E, but based on the currently tight flexible pipe market in Brazil we expect
capacity saturation can be achieved by 2015.
Key points of the Petrobras 2012-2016 business plan
■ Exploration and production will account for 60% of Petrobras’ total investment
between 2012 and 2016 of US$236.5bn.
■ All projects under implementation or evaluation will be monitored and evaluated using
the physical and financial evolution of the project.
■ There are three structural programmes: 1) Campos basin operational efficiency
improvement programme, 2) operational cost optimisation programme and 3) local
content management programme.
We view these concerns as overdone
■ The cost of flexible pipe is low relative to the entire production process and therefore
we think it unlikely these will be a focus of Petrobras’ plan. Furthermore, as part of the
2012-16 plan Petrobras has committed to “maximizing the use of the Brazilian
equipment and services industry capacity…”. We believe this focus is positive for
Prysmian given it produces its flexible pipes locally at its Vila Velha plant in Brazil.
■ Petrobras continues to encourage large players (Wellstream and Technip) to add
Flexible pipe capacity in Brazil. Technip is installing a new plant and Wellstream is
planning plant expansions in 2013, reflecting the tight flexible pipe market in Brazil.
Demand for flexible pipes in Brazil is still forecast by PROMINP to be 40% higher
than installed flexible pipe capacity in 2014 (see Figure 37).
■ Prysmian has started to deliver flexible pipes produced at the Vila Velha plants outside
Brazil, which can help offset any short-term soft demand from Petrobras.
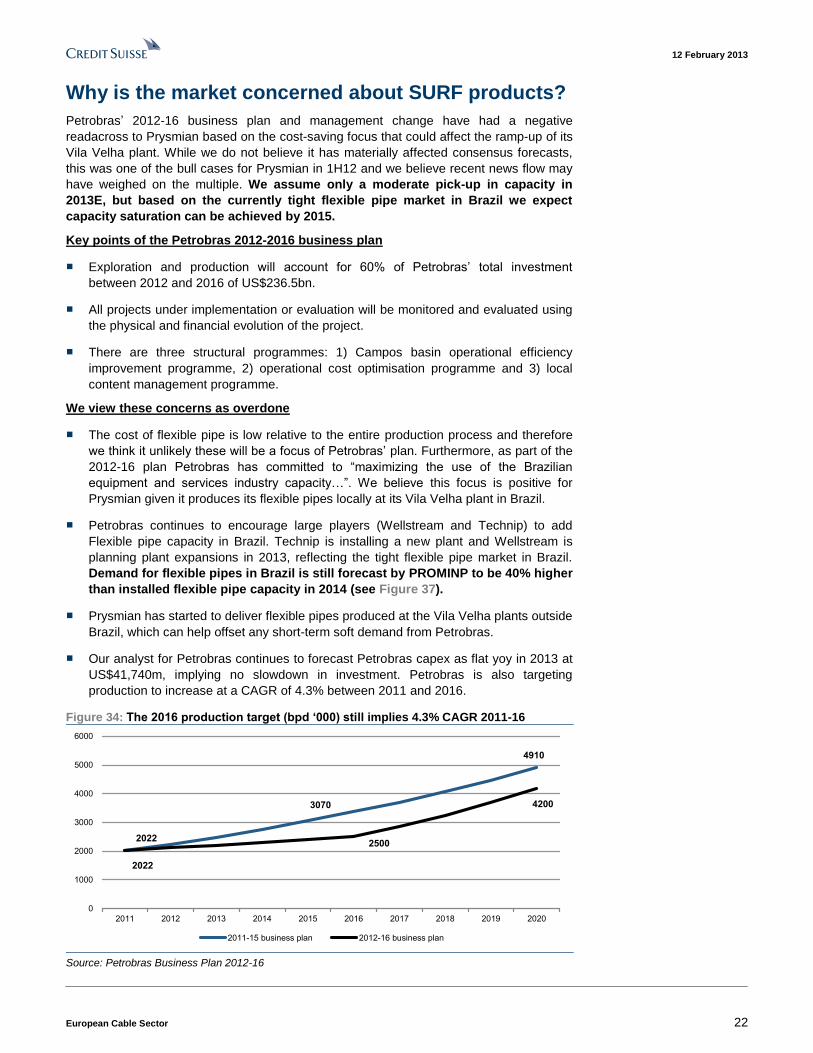
■ Our analyst for Petrobras continues to forecast Petrobras capex as flat yoy in 2013 at
US$41,740m, implying no slowdown in investment. Petrobras is also targeting
production to increase at a CAGR of 4.3% between 2011 and 2016.
Figure 34: The 2016 production target (bpd ‘000) still implies 4.3% CAGR 2011-16
2022
3070
4910
2022
2500
4200
0
1000
2000
3000
4000
5000
6000
2011 2012 2013 2014 2015 2016 2017 2018 2019 2020
2011-15 business plan 2012-16 business plan
Source: Petrobras Business Plan 2012-16
12 February 2013
European Cable Sector 23
Further offshore O&G news flow: Read-across from Saipem profit warning
(30/01/13)
What happened? Following an internal review Saipem (offshore and on-shore E&C) pre-
announced 2012 profits 10% below consensus and guided for 2013 more than 50% below
consensus.
What’s changed: The review commented on lower activity in high-margin pre-09
contracts, competitive market conditions in 2009-11 in offshore and high levels of
investment in Brazil. New management has also taken a more conservative approach to
revenue recognition.
Read-across to Prysmian: Saipem is a small customer of Prysmian’s but this profit
warning does not change our view on the Prysmian flexible pipe ramp-up. This is because
the majority of the above issues are company specific and Brazil appears, given Saipem’s
higher investment, to have been one of areas of more resilient demand. As we have
mentioned Petrobras is Prysmian’s key customer and we therefore view flexible pipe
supply and demand in Brazil as a much clearer indicator of the potential for Prysmian’s
business.
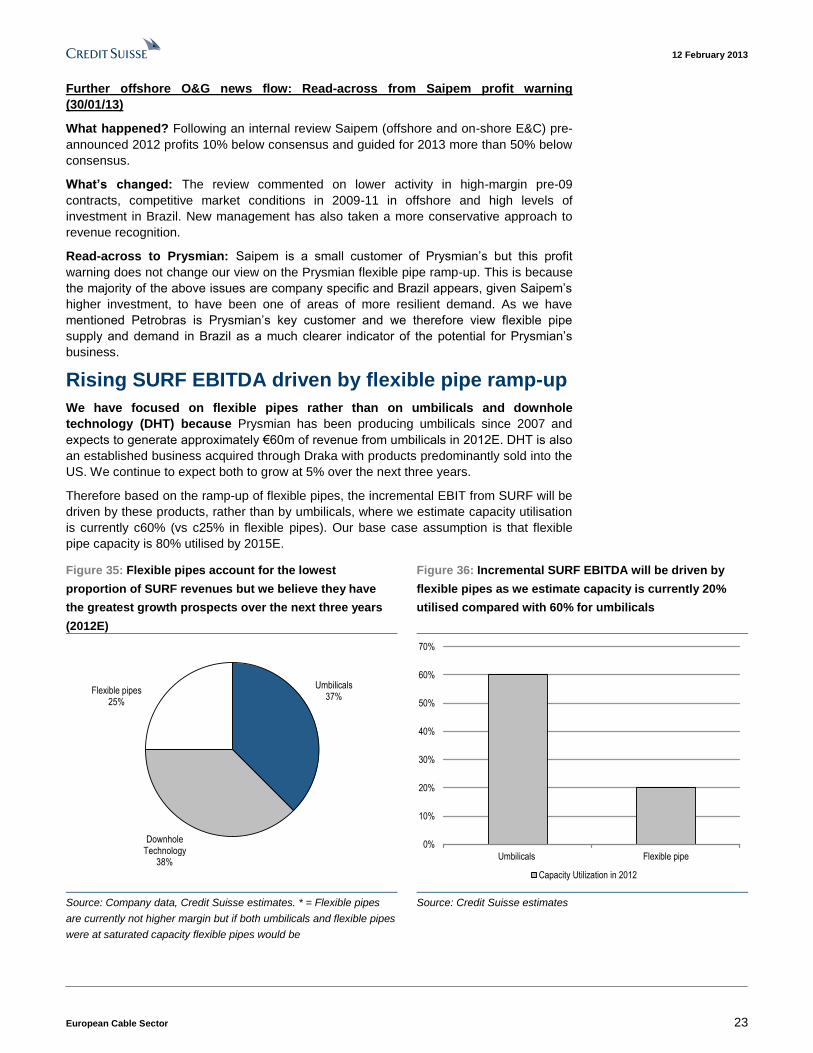
Rising SURF EBITDA driven by flexible pipe ramp-up
We have focused on flexible pipes rather than on umbilicals and downhole
technology (DHT) because Prysmian has been producing umbilicals since 2007 and
expects to generate approximately €60m of revenue from umbilicals in 2012E. DHT is also
an established business acquired through Draka with products predominantly sold into the
US. We continue to expect both to grow at 5% over the next three years.
Therefore based on the ramp-up of flexible pipes, the incremental EBIT from SURF will be
driven by these products, rather than by umbilicals, where we estimate capacity utilisation
is currently c60% (vs c25% in flexible pipes). Our base case assumption is that flexible
pipe capacity is 80% utilised by 2015E.
Figure 35: Flexible pipes account for the lowest
proportion of SURF revenues but we believe they have
the greatest growth prospects over the next three years
(2012E)
Figure 36: Incremental SURF EBITDA will be driven by
flexible pipes as we estimate capacity is currently 20%
utilised compared with 60% for umbilicals
Umbilicals37%
Downhole Technology
38%
Flexible pipes25%
0%
10%
20%
30%
40%
50%
60%
70%
Umbilicals Flexible pipe
Capacity Utilization in 2012
Source: Company data, Credit Suisse estimates. * = Flexible pipes
are currently not higher margin but if both umbilicals and flexible pipes
were at saturated capacity flexible pipes would be
Source: Credit Suisse estimates
12 February 2013
European Cable Sector 24
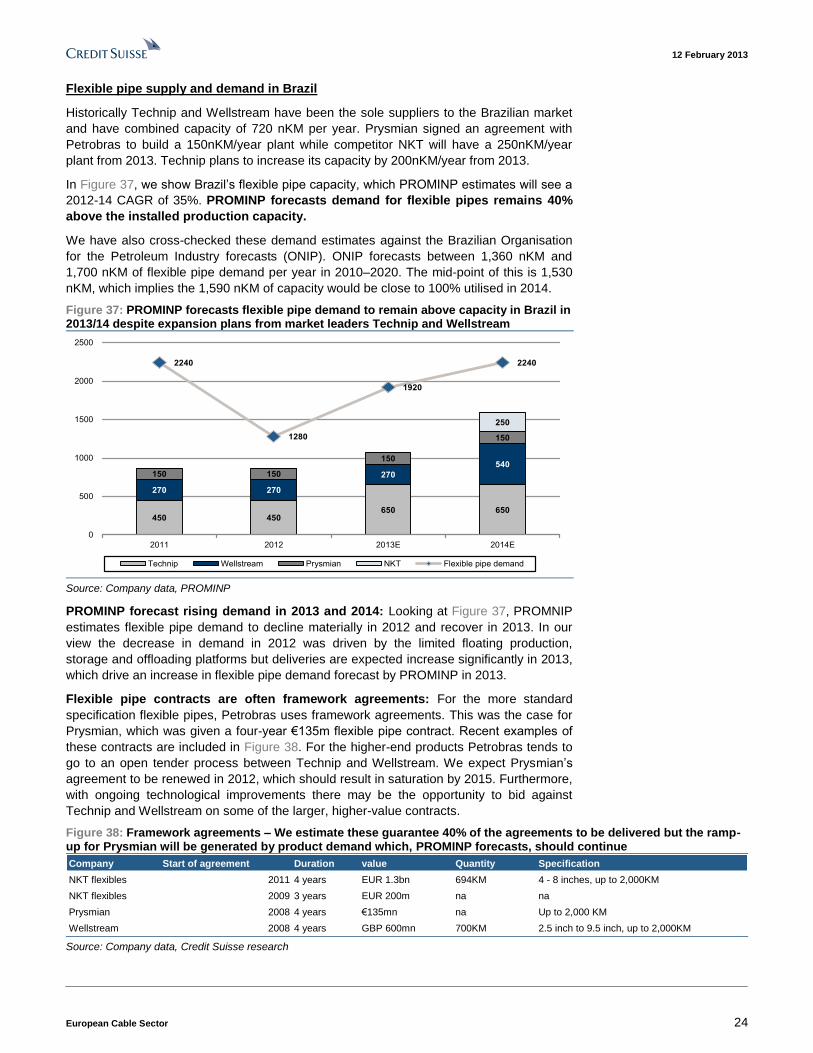
Flexible pipe supply and demand in Brazil
Historically Technip and Wellstream have been the sole suppliers to the Brazilian market
and have combined capacity of 720 nKM per year. Prysmian signed an agreement with
Petrobras to build a 150nKM/year plant while competitor NKT will have a 250nKM/year
plant from 2013. Technip plans to increase its capacity by 200nKM/year from 2013.
In Figure 37, we show Brazil’s flexible pipe capacity, which PROMINP estimates will see a
2012-14 CAGR of 35%. PROMINP forecasts demand for flexible pipes remains 40%
above the installed production capacity.
We have also cross-checked these demand estimates against the Brazilian Organisation
for the Petroleum Industry forecasts (ONIP). ONIP forecasts between 1,360 nKM and
1,700 nKM of flexible pipe demand per year in 2010–2020. The mid-point of this is 1,530
nKM, which implies the 1,590 nKM of capacity would be close to 100% utilised in 2014.
Figure 37: PROMINP forecasts flexible pipe demand to remain above capacity in Brazil in 2013/14 despite expansion plans from market leaders Technip and Wellstream
450 450650 650
270 270
270
540150 150
150
150
250
2240
1280
1920
2240
0
500
1000
1500
2000
2500
2011 2012 2013E 2014E
Technip Wellstream Prysmian NKT Flexible pipe demand
Source: Company data, PROMINP
PROMINP forecast rising demand in 2013 and 2014: Looking at Figure 37, PROMNIP
estimates flexible pipe demand to decline materially in 2012 and recover in 2013. In our
view the decrease in demand in 2012 was driven by the limited floating production,
storage and offloading platforms but deliveries are expected increase significantly in 2013,
which drive an increase in flexible pipe demand forecast by PROMINP in 2013.
Flexible pipe contracts are often framework agreements: For the more standard
specification flexible pipes, Petrobras uses framework agreements. This was the case for
Prysmian, which was given a four-year €135m flexible pipe contract. Recent examples of
these contracts are included in Figure 38. For the higher-end products Petrobras tends to
go to an open tender process between Technip and Wellstream. We expect Prysmian’s
agreement to be renewed in 2012, which should result in saturation by 2015. Furthermore,
with ongoing technological improvements there may be the opportunity to bid against
Technip and Wellstream on some of the larger, higher-value contracts.
Figure 38: Framework agreements – We estimate these guarantee 40% of the agreements to be delivered but the ramp-up for Prysmian will be generated by product demand which, PROMINP forecasts, should continue
Company Start of agreement Duration value Quantity Specification
NKT flexibles 2011 4 years EUR 1.3bn 694KM 4 - 8 inches, up to 2,000KM
NKT flexibles 2009 3 years EUR 200m na na
Prysmian 2008 4 years €135mn na Up to 2,000 KM
Wellstream 2008 4 years GBP 600mn 700KM 2.5 inch to 9.5 inch, up to 2,000KM Source: Company data, Credit Suisse research

12 February 2013
European Cable Sector 25
Scenario analysis for flexible pipe ramp-up
In Figure 39 we have included our base, bull and bear case assumptions for the ramp-up
of Prysmian’s flexible pipe capacity at its Vila Velha plant in Brazil. In each scenario, we
have assumed a price of $1,500 per metre of flexible pipe. Prysmian’s total capacity is
150KM per year but we assume saturation is 80% (or 120KM).
Base case: In our base case, we assume a small ramp-up to 35% utilisation in 2013,
which we believe fairly accounts for the impact of the new Petrobras business plan.
However, based on the production targets and forecast flexible pipe demand, we see a
material pick-up in utilisation in 2014E to 65% and capacity to be saturated by 2015E.
Bull case: Our bull case scenario implies a broadly stable ramp-up in capacity utilisation
to 85% in 2015E. Based on demand vs flexible pipe capacity in Brazil we see this scenario
as realistic but note that the current internal business plan at Petrobras may cause some
short-term demand volatility. This implies 1% upgrades to our 2014 EBITDA forecasts.
Bear case: Here we stress test our forecasts assuming no ramp-up in capacity in 2013
(which we view as highly unlikely) and then for 45% capacity to be achieved in 2015. We
also assume the umbilical and DHT businesses do not grow in 2013-15. However, we
reiterate our view that this is unlikely as the large flexible pipe players such as Technip
and Wellstream continue to add capacity in Brazil to meet increasing flexible pipe demand.
This implies 1.3% downgrades to our 2014 EBITDA forecasts.

12 February 2013
European Cable Sector 26
Scenario analysis for SURF contribution, 2012-2015
Figure 39: Scenario analysis for the ramp-up of flexible pipe capacity at Prysmian (€m)
Bull case Scenario 2012E 2013E 2014E 2015E
FLEXIBLE PIPES
KM of Flexible pipes 30 67 120 128
Implied utilization 20% 45% 80% 85%
Revenue 33.6 75.1 134.4 143.4
EBITDA 1.7 14.1 31.9 34.6
implied EBITDA margin 5.0% 18.8% 23.8% 24.1%
Umbilicals and DHT
Revenue 82.2 86.3 90.6 95.1
EBITDA margin 20% 20% 20% 20%
EBITDA 16.4 17.3 18.1 19.0
TOTAL SURF REVENUE 115.8 161.3 225.0 238.5
SURF EBITDA 18.1 31.4 50.0 53.6
INCREMENTAL EBITDA FROM SURF 13.3 18.7 3.6
Base Case Scenario 2012E 2013E 2014E 2015E
FLEXIBLE PIPES
KM of Flexible pipes 30 53 90 120
Implied utilization 20% 35% 60% 80%
Revenue 33.6 59.4 100.8 134.4
EBITDA 1.7 9.4 21.8 31.9
implied EBITDA margin 5.0% 15.8% 21.7% 23.8%
Umbilicals and DHT
Revenue 82.2 86.3 90.6 95.1
EBITDA margin 20% 20% 20% 20%
EBITDA 16.4 17.3 18.1 19.0
TOTAL SURF REVENUE 115.8 145.6 191.4 229.5
SURF EBITDA 18.1 26.7 40.0 50.9
INCREMENTAL EBITDA FROM SURF 8.6 13.3 11.0
Bear Case Scenario 2012E 2013E 2014E 2015E
FLEXIBLE PIPES
KM of Flexible pipes 30 30 45 68
Implied utilization 20% 20% 30% 45%
Revenue 33.6 33.6 50.4 76.2
EBITDA margin 5% 30% 30% 30%
EBITDA 1.7 1.7 5.9 12.3
implied EBITDA margin 5.0% 5.0% 11.7% 16.2%
Umbilicals and DHT
Revenue 82.7 82.7 82.7 82.7
EBITDA margin 20% 20% 20% 20%
EBITDA 16.5 16.5 16.5 16.5
TOTAL SURF REVENUE 116.3 116.3 133.1 158.9
SURF EBITDA 18.2 18.2 22.4 28.9
INCREMENTAL EBITDA FROM SURF 0.0 4.2 6.4 Source: Credit Suisse estimates
12 February 2013
European Cable Sector 27
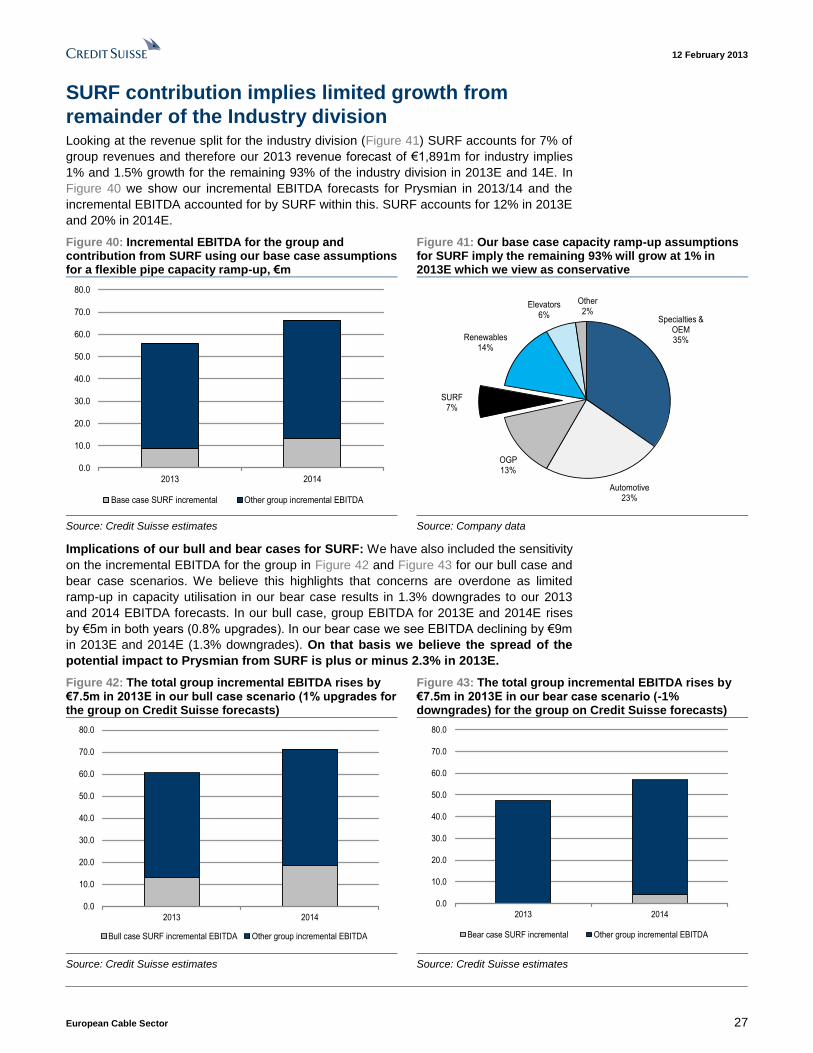
SURF contribution implies limited growth from
remainder of the Industry division Looking at the revenue split for the industry division (Figure 41) SURF accounts for 7% of
group revenues and therefore our 2013 revenue forecast of €1,891m for industry implies
1% and 1.5% growth for the remaining 93% of the industry division in 2013E and 14E. In
Figure 40 we show our incremental EBITDA forecasts for Prysmian in 2013/14 and the
incremental EBITDA accounted for by SURF within this. SURF accounts for 12% in 2013E
and 20% in 2014E.
Figure 40: Incremental EBITDA for the group and contribution from SURF using our base case assumptions for a flexible pipe capacity ramp-up, €m
Figure 41: Our base case capacity ramp-up assumptions for SURF imply the remaining 93% will grow at 1% in 2013E which we view as conservative
0.0
10.0
20.0
30.0
40.0
50.0
60.0
70.0
80.0
2013 2014
Base case SURF incremental Other group incremental EBITDA
Specialties & OEM35%
Automotive23%
OGP13%
SURF7%
Renewables14%
Elevators6%
Other2%
Source: Credit Suisse estimates Source: Company data
Implications of our bull and bear cases for SURF: We have also included the sensitivity
on the incremental EBITDA for the group in Figure 42 and Figure 43 for our bull case and
bear case scenarios. We believe this highlights that concerns are overdone as limited
ramp-up in capacity utilisation in our bear case results in 1.3% downgrades to our 2013
and 2014 EBITDA forecasts. In our bull case, group EBITDA for 2013E and 2014E rises
by €5m in both years (0.8% upgrades). In our bear case we see EBITDA declining by €9m
in 2013E and 2014E (1.3% downgrades). On that basis we believe the spread of the
potential impact to Prysmian from SURF is plus or minus 2.3% in 2013E.
Figure 42: The total group incremental EBITDA rises by €7.5m in 2013E in our bull case scenario (1% upgrades for the group on Credit Suisse forecasts)
Figure 43: The total group incremental EBITDA rises by €7.5m in 2013E in our bear case scenario (-1% downgrades) for the group on Credit Suisse forecasts)
0.0
10.0
20.0
30.0
40.0
50.0
60.0
70.0
80.0
2013 2014
Bull case SURF incremental EBITDA Other group incremental EBITDA
0.0
10.0
20.0
30.0
40.0
50.0
60.0
70.0
80.0
2013 2014
Bear case SURF incremental Other group incremental EBITDA
Source: Credit Suisse estimates Source: Credit Suisse estimates
12 February 2013
European Cable Sector 28
#3: Mapping the global cable competitive landscape
2011 operating profit margins at Prysmian and Nexans were 370bps and 330bps
respectively below peak, with increasing competition being one of the factors responsible
for the decline. In this section we have looked in detail at competitors’ growth rates and
margins, and Prysmian’s and Nexans’ recent commentaries to consider the broader
competitive landscape. Based on the threat in Land High Voltage being relatively well
understood we have focused on the threat in Optical fibre & cable.
Our conclusions from this analysis are:
■ Combined, Europe and the US account for 45% of Prysmian’s optical fibre & cable
sales and Prysmian has a leading market share in most European countries. In our
view the large Japanese competitors are unlikely to focus primarily on expansion in
this market and rather focus on China given the demand outlook.
■ In China (25% of Prysmian’s optical fibre & cable sales) we view the threat from
Japanese competitors to Prysmian’s leading market share as manageable. Given the
high expected demand (limiting the risk of over-capacity), and consolidated market
(five key players) we would not expect aggressive pricing strategies from competitors
that could ultimately destroy the longer-term value of this market.
■ Currently, domestic Chinese competitors do not represent a significant threat to
Prysmian in China, in our view. In the medium term we expect existing smaller players
to grow to meet demand but, based on the technology and high cost of developing
optical fibre, we see limited scope for new entrants. We also believe Prysmian can
continue to compete on price with existing domestic players as it produces locally
through its JV (YOFC).
■ In Land High Voltage (6% of Nexans’ sales and 7% of Prysmian’s sales) these
players, and particularly Nexans, have flagged emerging market competition in the
Middle Eastern and Chinese markets. We expect pricing pressure to moderate over
the next two years as prices have already fallen so significantly (Nexans now has a
low single digit EBITDA margin in Land HV compared with double digits previously).
However, we believe pricing pressure will continue to be of greater concern for
Nexans as 37% of its Land HV sales were in the Middle East in 2012 (vs 49% in
2010). We think Prysmian’s business has a greater focus on the higher voltage
segments, with only 40% of sales in the <220KV segment.
12 February 2013
European Cable Sector 29
Global competitor mapping; end market presence
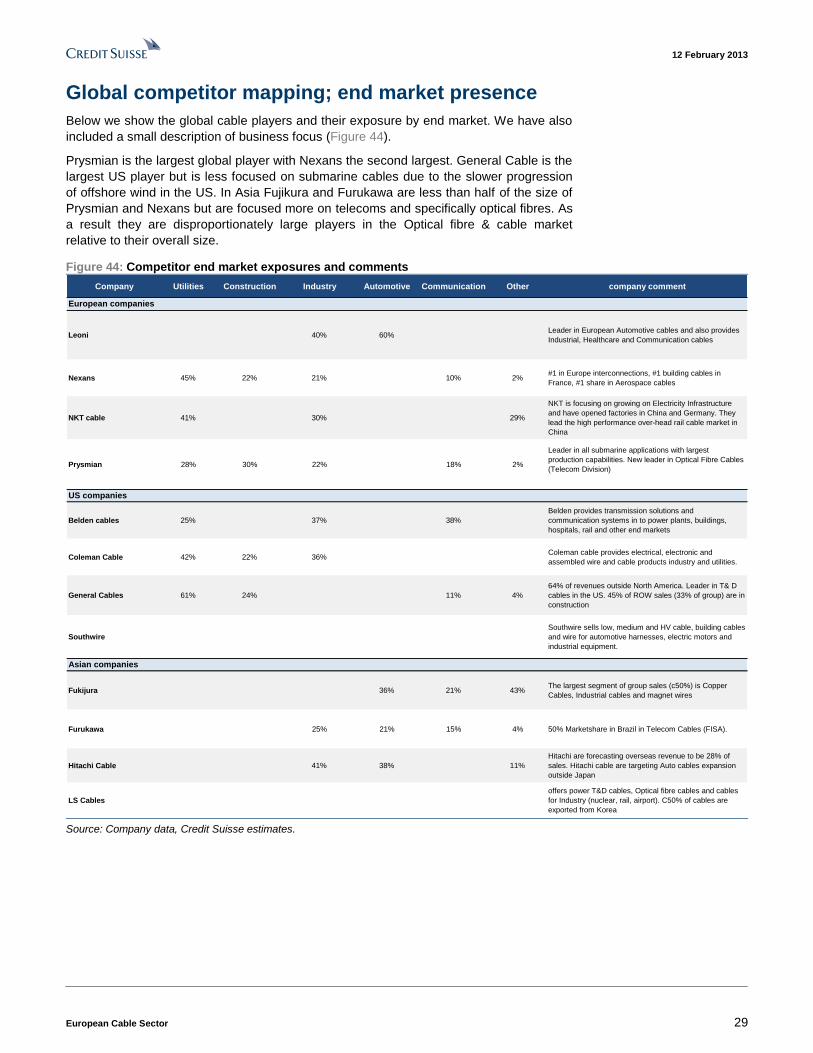
Below we show the global cable players and their exposure by end market. We have also
included a small description of business focus (Figure 44).
Prysmian is the largest global player with Nexans the second largest. General Cable is the
largest US player but is less focused on submarine cables due to the slower progression
of offshore wind in the US. In Asia Fujikura and Furukawa are less than half of the size of
Prysmian and Nexans but are focused more on telecoms and specifically optical fibres. As
a result they are disproportionately large players in the Optical fibre & cable market
relative to their overall size.
Figure 44: Competitor end market exposures and comments
Company Utilities Construction Industry Automotive Communication Other company comment
Leoni 40% 60%Leader in European Automotive cables and also provides
Industrial, Healthcare and Communication cables
Nexans 45% 22% 21% 10% 2%#1 in Europe interconnections, #1 building cables in
France, #1 share in Aerospace cables
NKT cable 41% 30% 29%
NKT is focusing on growing on Electricity Infrastructure
and have opened factories in China and Germany. They
lead the high performance over-head rail cable market in
China
Prysmian 28% 30% 22% 18% 2%
Leader in all submarine applications with largest
production capabilities. New leader in Optical Fibre Cables
(Telecom Division)
Belden cables 25% 37% 38%
Belden provides transmission solutions and
communication systems in to power plants, buildings,
hospitals, rail and other end markets
Coleman Cable 42% 22% 36%Coleman cable provides electrical, electronic and
assembled wire and cable products industry and utilities.
General Cables 61% 24% 11% 4%
64% of revenues outside North America. Leader in T& D
cables in the US. 45% of ROW sales (33% of group) are in
construction
Southwire
Southwire sells low, medium and HV cable, building cables
and wire for automotive harnesses, electric motors and
industrial equipment.
Fukijura 36% 21% 43%The largest segment of group sales (c50%) is Copper
Cables, Industrial cables and magnet wires
Furukawa 25% 21% 15% 4% 50% Marketshare in Brazil in Telecom Cables (FISA).
Hitachi Cable 41% 38% 11%
Hitachi are forecasting overseas revenue to be 28% of
sales. Hitachi cable are targeting Auto cables expansion
outside Japan
LS Cables
offers power T&D cables, Optical fibre cables and cables
for Industry (nuclear, rail, airport). C50% of cables are
exported from Korea
European companies
US companies
Asian companies
Source: Company data, Credit Suisse estimates.
12 February 2013
European Cable Sector 30
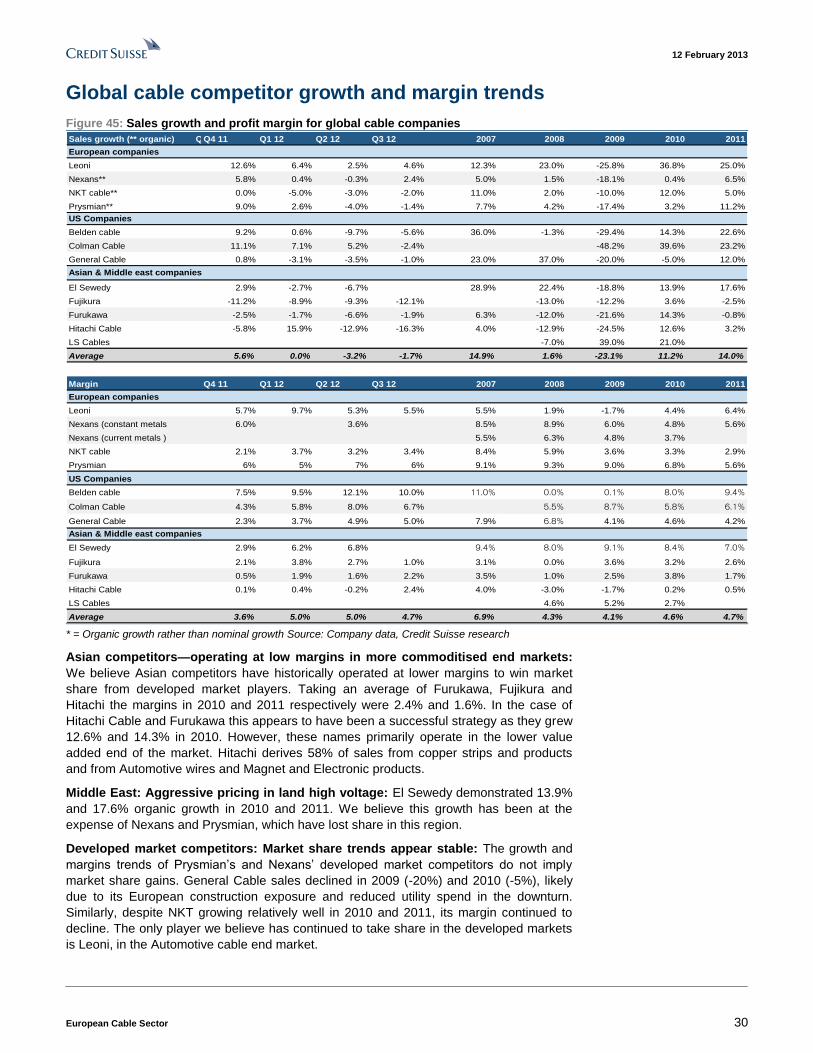
Global cable competitor growth and margin trends
Figure 45: Sales growth and profit margin for global cable companies
Sales growth (** organic) Q2 10Q4 11 Q1 12 Q2 12 Q3 12 2007 2008 2009 2010 2011
Leoni 12.6% 6.4% 2.5% 4.6% 12.3% 23.0% -25.8% 36.8% 25.0%
Nexans** 5.8% 0.4% -0.3% 2.4% 5.0% 1.5% -18.1% 0.4% 6.5%
NKT cable** 0.0% -5.0% -3.0% -2.0% 11.0% 2.0% -10.0% 12.0% 5.0%
Prysmian** 9.0% 2.6% -4.0% -1.4% 7.7% 4.2% -17.4% 3.2% 11.2%
Belden cable 9.2% 0.6% -9.7% -5.6% 36.0% -1.3% -29.4% 14.3% 22.6%
Colman Cable 11.1% 7.1% 5.2% -2.4% -48.2% 39.6% 23.2%
General Cable 0.8% -3.1% -3.5% -1.0% 23.0% 37.0% -20.0% -5.0% 12.0%
El Sewedy 2.9% -2.7% -6.7% 28.9% 22.4% -18.8% 13.9% 17.6%
Fujikura -11.2% -8.9% -9.3% -12.1% -13.0% -12.2% 3.6% -2.5%
Furukawa -2.5% -1.7% -6.6% -1.9% 6.3% -12.0% -21.6% 14.3% -0.8%
Hitachi Cable -5.8% 15.9% -12.9% -16.3% 4.0% -12.9% -24.5% 12.6% 3.2%
LS Cables -7.0% 39.0% 21.0%
Average 5.6% 0.0% -3.2% -1.7% 14.9% 1.6% -23.1% 11.2% 14.0%
Margin Q4 11 Q1 12 Q2 12 Q3 12 2007 2008 2009 2010 2011
Leoni 5.7% 9.7% 5.3% 5.5% 5.5% 1.9% -1.7% 4.4% 6.4%
Nexans (constant metals 6.0% 3.6% 8.5% 8.9% 6.0% 4.8% 5.6%
Nexans (current metals ) 5.5% 6.3% 4.8% 3.7%
NKT cable 2.1% 3.7% 3.2% 3.4% 8.4% 5.9% 3.6% 3.3% 2.9%
Prysmian 6% 5% 7% 6% 9.1% 9.3% 9.0% 6.8% 5.6%
Belden cable 7.5% 9.5% 12.1% 10.0% 11.0% 0.0% 0.1% 8.0% 9.4%
Colman Cable 4.3% 5.8% 8.0% 6.7% 5.5% 8.7% 5.8% 6.1%
General Cable 2.3% 3.7% 4.9% 5.0% 7.9% 6.8% 4.1% 4.6% 4.2%
El Sewedy 2.9% 6.2% 6.8% 9.4% 8.0% 9.1% 8.4% 7.0%
Fujikura 2.1% 3.8% 2.7% 1.0% 3.1% 0.0% 3.6% 3.2% 2.6%
Furukawa 0.5% 1.9% 1.6% 2.2% 3.5% 1.0% 2.5% 3.8% 1.7%
Hitachi Cable 0.1% 0.4% -0.2% 2.4% 4.0% -3.0% -1.7% 0.2% 0.5%
LS Cables 4.6% 5.2% 2.7%
Average 3.6% 5.0% 5.0% 4.7% 6.9% 4.3% 4.1% 4.6% 4.7%
European companies
US Companies
Asian & Middle east companies
European companies
Asian & Middle east companies
US Companies
* = Organic growth rather than nominal growth Source: Company data, Credit Suisse research
Asian competitors—operating at low margins in more commoditised end markets:
We believe Asian competitors have historically operated at lower margins to win market
share from developed market players. Taking an average of Furukawa, Fujikura and
Hitachi the margins in 2010 and 2011 respectively were 2.4% and 1.6%. In the case of
Hitachi Cable and Furukawa this appears to have been a successful strategy as they grew
12.6% and 14.3% in 2010. However, these names primarily operate in the lower value
added end of the market. Hitachi derives 58% of sales from copper strips and products
and from Automotive wires and Magnet and Electronic products.
Middle East: Aggressive pricing in land high voltage: El Sewedy demonstrated 13.9%
and 17.6% organic growth in 2010 and 2011. We believe this growth has been at the
expense of Nexans and Prysmian, which have lost share in this region.
Developed market competitors: Market share trends appear stable: The growth and
margins trends of Prysmian’s and Nexans’ developed market competitors do not imply
market share gains. General Cable sales declined in 2009 (-20%) and 2010 (-5%), likely
due to its European construction exposure and reduced utility spend in the downturn.
Similarly, despite NKT growing relatively well in 2010 and 2011, its margin continued to
decline. The only player we believe has continued to take share in the developed markets
is Leoni, in the Automotive cable end market.
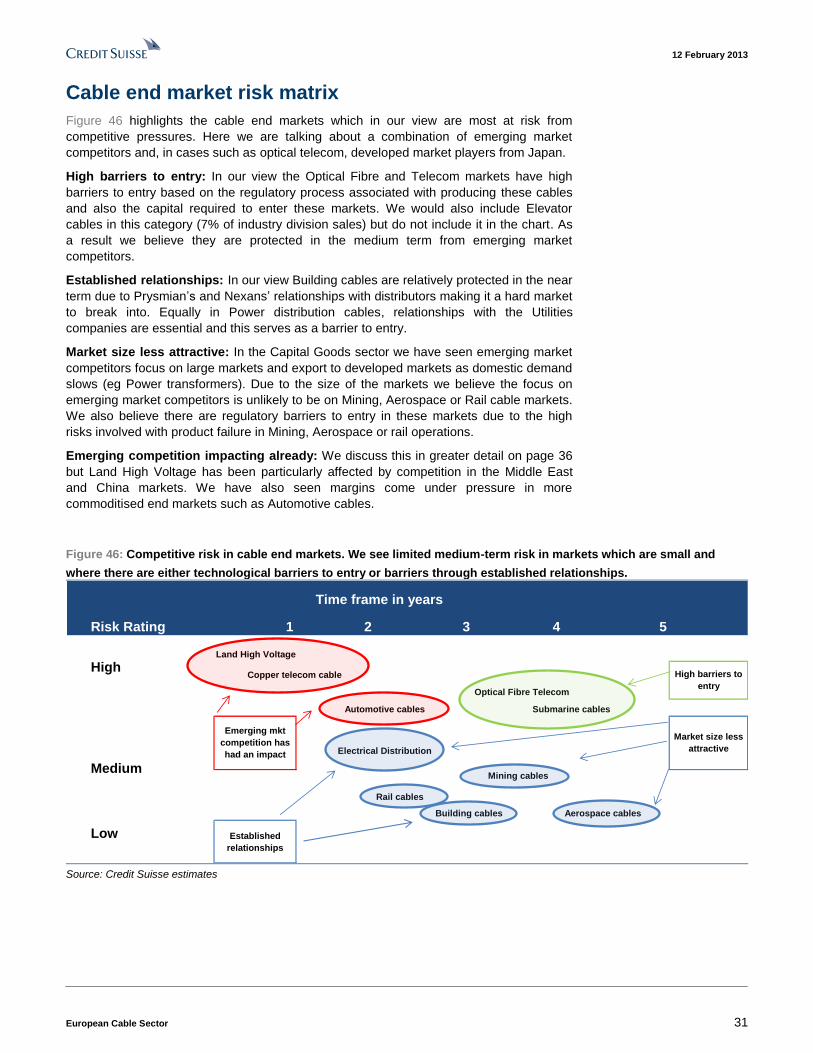
12 February 2013
European Cable Sector 31
Cable end market risk matrix
Figure 46 highlights the cable end markets which in our view are most at risk from
competitive pressures. Here we are talking about a combination of emerging market
competitors and, in cases such as optical telecom, developed market players from Japan.
High barriers to entry: In our view the Optical Fibre and Telecom markets have high
barriers to entry based on the regulatory process associated with producing these cables
and also the capital required to enter these markets. We would also include Elevator
cables in this category (7% of industry division sales) but do not include it in the chart. As
a result we believe they are protected in the medium term from emerging market
competitors.
Established relationships: In our view Building cables are relatively protected in the near
term due to Prysmian’s and Nexans’ relationships with distributors making it a hard market
to break into. Equally in Power distribution cables, relationships with the Utilities
companies are essential and this serves as a barrier to entry.
Market size less attractive: In the Capital Goods sector we have seen emerging market
competitors focus on large markets and export to developed markets as domestic demand
slows (eg Power transformers). Due to the size of the markets we believe the focus on
emerging market competitors is unlikely to be on Mining, Aerospace or Rail cable markets.
We also believe there are regulatory barriers to entry in these markets due to the high
risks involved with product failure in Mining, Aerospace or rail operations.
Emerging competition impacting already: We discuss this in greater detail on page 36
but Land High Voltage has been particularly affected by competition in the Middle East
and China markets. We have also seen margins come under pressure in more
commoditised end markets such as Automotive cables.
Figure 46: Competitive risk in cable end markets. We see limited medium-term risk in markets which are small and
where there are either technological barriers to entry or barriers through established relationships.
Risk Rating 1 2 3 4 5
Land High Voltage
Optical Fibre Telecom
Rail cables
Mining cables
Aerospace cables
Established
relationships
Low
Building cables
Market size less
attractive
High barriers to
entry
Electrical Distribution
Time frame in years
HighCopper telecom cable
Submarine cables
Medium
Automotive cables
Emerging mkt
competition has
had an impact
Source: Credit Suisse estimates

12 February 2013
European Cable Sector 32
Optical fibre cables: attractive in the medium term
Prysmian’s telecom division has risen in importance, accounting for 26% of group
EBITDA having in H1 12 versus 18% in H1 10. We have assessed the competitive risk for
Prysmian in optical connectivity and fibre, as this accounts for 47% of the telecom division
(or 75% including JV’s) and, we estimate, generates approximately at least a double digit
EBITDA margin.
Our conclusions from our analysis are as follows:
■ We see limited risks to telecom margins over the next three years due to the high
technological barriers to entry. There are five key players (Prysmian, Corning,
Furukawa, Fujikura, Sumitomo) that can produce both fibre and cable and therefore it
is a relatively consolidated market.
■ China (25% of Prysmian’s Optical fibre & cable sales) is forecast to represent 45% of
the global fibre optical cable market in terms of length (kilometres), growing
cumulatively at +46% over the next four years. Prysmian has a leading market share
via its JV, which produces locally, making it competitive on price.
■ In China we view the threat from Japanese competitors to Prysmian’s leading market
share as manageable. Given the high expected demand (limiting the risk of over-
capacity), and consolidated market (five key players producing cable and fibre) we
would not expect aggressive pricing strategies from established players that could
ultimately destroy the longer-term value of this market.
■ Currently, domestic Chinese competitors do not represent a significant threat to
Prysmian in China in our view. In the medium term we expect existing players to grow
to meet demand but based on the technology and high cost of developing Optical
Fibre we see limited scope for new entrants. We also believe Prysmian can continue
to compete on price with existing domestic players as it produces locally through its JV
(YOFC).

12 February 2013
European Cable Sector 33
Optical fibre and cable market landscape
Globally there are multiple optical cable producers but there is an important distinction
between cable manufacturers, fibre-only manufacturers and those companies that can
produce both the fibre and the cable, which reduces cost and improves overall cable
design quality. Within optical cables it is the optical fibre which is both the major cost
component and the major value added element. For this reason we think it may be difficult
for local Chinese competitors to aggressively compete on price.
With the acquisition of Draka in 2011 Prysmian became #1 in Europe and China, and
#1 worldwide in optical fibre. There are five key established players who produce both
the optical fibre and the optical fibre cables: Corning in the US (sells optical Fibre and
cables), the Japanese players Furukawa, Fujikura and Sumitomo, and Prysmian.
Figure 47: Prysmian is number 3 in terms of Total Telecom sales but #1 in the higher margin optical fibre & telecom segment (Corning is #2). 2011
0
200
400
600
800
1000
1200
1400
1600
Sumitomo Corning Prysmian Furukawa Fujikura General Cable Nexans
Optical Fibre & Cables sales Total Telecom related sales
Source: Company data;
In Figure 47 we show Prysmian’s overall telecom sales but we would highlight that most
importantly it has a leading global market share in Optical fibre & cable. Corning is number
two with €750m of sales in 2011 vs €1bn at Prysmian.
Competition from Asia unlikely to threaten Europe and US Optical markets
Competition from Asia in the Capital Goods sector has tended to intensify when: 1) the
growth prospects for a domestic industry are soft (because when the Asian market slows
exports become a priority); 2) the domestic Chinese market is important to an international
company and they are squeezed out of the local market and 3) there are low barriers to
entry. We have used this criteria to assess the threat to Prysmian’s growth and margins in
both its core European market and its positions in emerging markets.
We have concluded the competitive threat to Prysmian from Asia is manageable
because of three factors (please see the three next pages for details)
1) Optical fibre & cable in China is a consolidated market (five key players) and high
demand is likely to prevent overcapacity, both of which should reduce the risk of
aggressive pricing strategies from competitors in this market.
2) There are barriers to entry against aggressive new entrants (high cost of optical
fibre production and the technological expertise involved).
3) The focus of Japanese players on China is likely to take focus away from the
European and US markets (45% of optical fibre & cable sales), both of which
exhibit good growth potential for Prysmian.
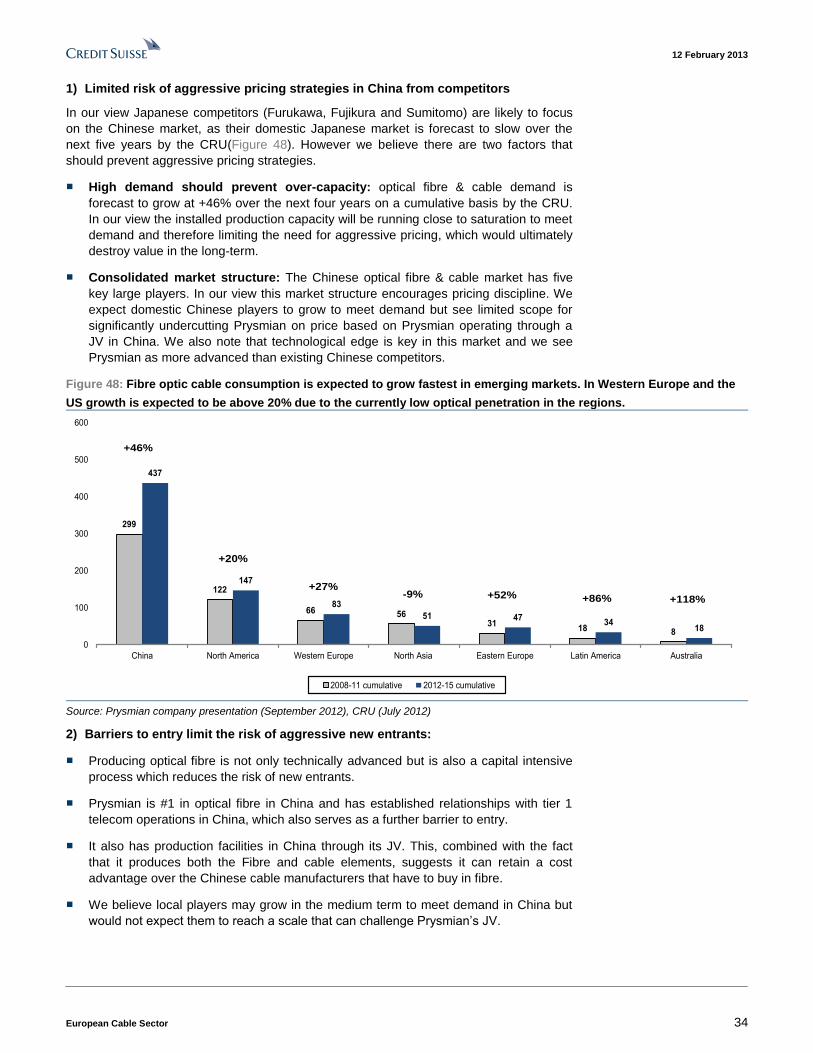
12 February 2013
European Cable Sector 34
1) Limited risk of aggressive pricing strategies in China from competitors
In our view Japanese competitors (Furukawa, Fujikura and Sumitomo) are likely to focus
on the Chinese market, as their domestic Japanese market is forecast to slow over the
next five years by the CRU(Figure 48). However we believe there are two factors that
should prevent aggressive pricing strategies.
■ High demand should prevent over-capacity: optical fibre & cable demand is
forecast to grow at +46% over the next four years on a cumulative basis by the CRU.
In our view the installed production capacity will be running close to saturation to meet
demand and therefore limiting the need for aggressive pricing, which would ultimately
destroy value in the long-term.
■ Consolidated market structure: The Chinese optical fibre & cable market has five
key large players. In our view this market structure encourages pricing discipline. We
expect domestic Chinese players to grow to meet demand but see limited scope for
significantly undercutting Prysmian on price based on Prysmian operating through a
JV in China. We also note that technological edge is key in this market and we see
Prysmian as more advanced than existing Chinese competitors.
Figure 48: Fibre optic cable consumption is expected to grow fastest in emerging markets. In Western Europe and the
US growth is expected to be above 20% due to the currently low optical penetration in the regions.
299
122
66 5631
18 8
437
147
83
51 4734
18
0
100
200
300
400
500
600
China North America Western Europe North Asia Eastern Europe Latin America Australia
2008-11 cumulative 2012-15 cumulative
+20%
+27%-9% +52% +86% +118%
+46%
Source: Prysmian company presentation (September 2012), CRU (July 2012)
2) Barriers to entry limit the risk of aggressive new entrants:
■ Producing optical fibre is not only technically advanced but is also a capital intensive
process which reduces the risk of new entrants.
■ Prysmian is #1 in optical fibre in China and has established relationships with tier 1
telecom operations in China, which also serves as a further barrier to entry.
■ It also has production facilities in China through its JV. This, combined with the fact
that it produces both the Fibre and cable elements, suggests it can retain a cost
advantage over the Chinese cable manufacturers that have to buy in fibre.
■ We believe local players may grow in the medium term to meet demand in China but
would not expect them to reach a scale that can challenge Prysmian’s JV.

12 February 2013
European Cable Sector 35
3) We expect Asian competitors to have a limited impact on Prysmian’s’ position in
the European market
Europe is a key region for Prysmian in optical fibre cables—according to the
company it is leader in most European countries. Europe accounts for 25% of Optical
sales while the US is 20%. In our view the focus of the Japanese players on the larger and
faster growing Chinese market and also we believe it would be difficult to break
Prysmian’s dominant market share in Europe.
Prysmian sees Western Europe remaining an attractive optical cable market, with a
forecast for 27% cumulative growth over the next four years (Figure 48).
Figure 49: We believe China (25% of Prysmian’s optical fibre & Cable sales) will be the focus of Japanese competitors
Figure 50: Based on the low penetration of Fibre in Europe we expect this to be a significant growth opportunity for Prysmian in the medium term.
China25%
Europe25%
North America20%
South America25%
Australia5%
DSL81%
Cable Modem16%
Fibre + LAN3%
Source: Company data Source: Prysmian ‘Company Presentation’ December 2012. Originally
from OECD, June 2011
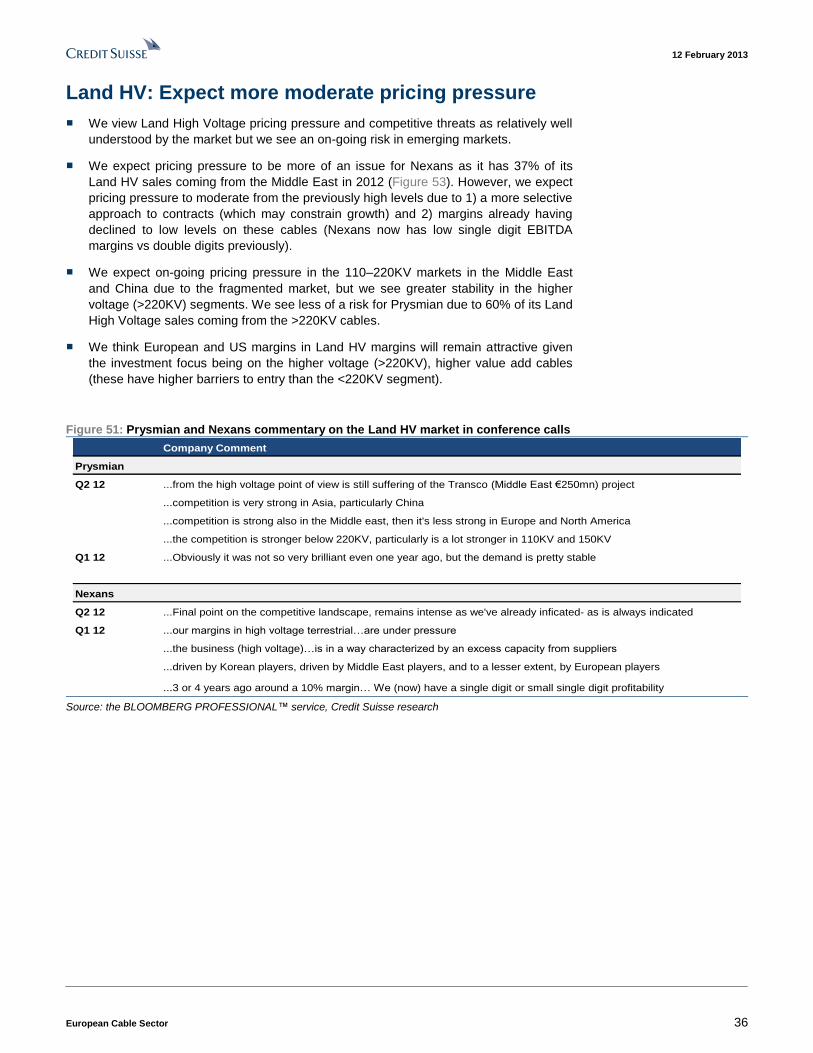
12 February 2013
European Cable Sector 36
Land HV: Expect more moderate pricing pressure
■ We view Land High Voltage pricing pressure and competitive threats as relatively well
understood by the market but we see an on-going risk in emerging markets.
■ We expect pricing pressure to be more of an issue for Nexans as it has 37% of its
Land HV sales coming from the Middle East in 2012 (Figure 53). However, we expect
pricing pressure to moderate from the previously high levels due to 1) a more selective
approach to contracts (which may constrain growth) and 2) margins already having
declined to low levels on these cables (Nexans now has low single digit EBITDA
margins vs double digits previously).
■ We expect on-going pricing pressure in the 110–220KV markets in the Middle East
and China due to the fragmented market, but we see greater stability in the higher
voltage (>220KV) segments. We see less of a risk for Prysmian due to 60% of its Land
High Voltage sales coming from the >220KV cables.
■ We think European and US margins in Land HV margins will remain attractive given
the investment focus being on the higher voltage (>220KV), higher value add cables
(these have higher barriers to entry than the <220KV segment).
Figure 51: Prysmian and Nexans commentary on the Land HV market in conference calls
Prysmian
Q2 12 ...from the high voltage point of view is still suffering of the Transco (Middle East €250mn) project
...competition is very strong in Asia, particularly China
...competition is strong also in the Middle east, then it's less strong in Europe and North America
...the competition is stronger below 220KV, particularly is a lot stronger in 110KV and 150KV
Q1 12 ...Obviously it was not so very brilliant even one year ago, but the demand is pretty stable
Nexans
Q2 12 ...Final point on the competitive landscape, remains intense as we've already inficated- as is always indicated
Q1 12 ...our margins in high voltage terrestrial…are under pressure
...the business (high voltage)…is in a way characterized by an excess capacity from suppliers
...driven by Korean players, driven by Middle East players, and to a lesser extent, by European players
...3 or 4 years ago around a 10% margin… We (now) have a single digit or small single digit profitability
Company Comment
Source: the BLOOMBERG PROFESSIONAL™ service, Credit Suisse research
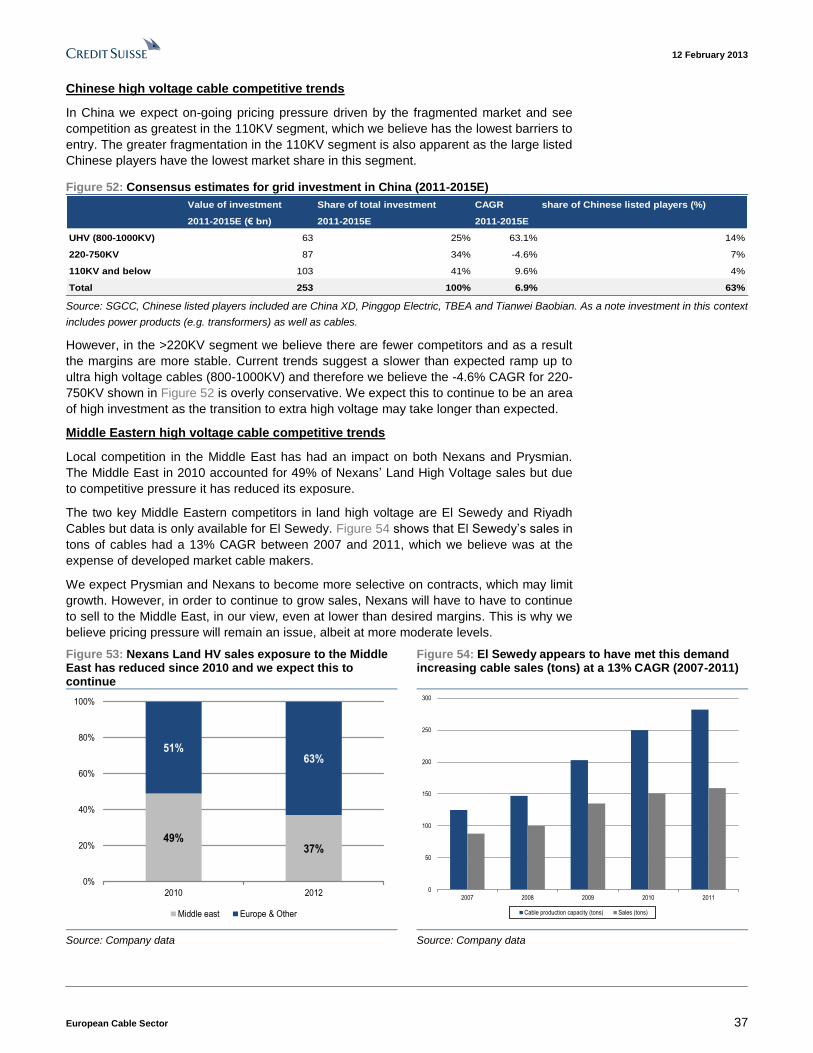
12 February 2013
European Cable Sector 37
Chinese high voltage cable competitive trends
In China we expect on-going pricing pressure driven by the fragmented market and see
competition as greatest in the 110KV segment, which we believe has the lowest barriers to
entry. The greater fragmentation in the 110KV segment is also apparent as the large listed
Chinese players have the lowest market share in this segment.
Figure 52: Consensus estimates for grid investment in China (2011-2015E)
Value of investment Share of total investment CAGR share of Chinese listed players (%)
2011-2015E (€ bn) 2011-2015E 2011-2015E
UHV (800-1000KV) 63 25% 63.1% 14%
220-750KV 87 34% -4.6% 7%
110KV and below 103 41% 9.6% 4%
Total 253 100% 6.9% 63% Source: SGCC, Chinese listed players included are China XD, Pinggop Electric, TBEA and Tianwei Baobian. As a note investment in this context
includes power products (e.g. transformers) as well as cables.
However, in the >220KV segment we believe there are fewer competitors and as a result
the margins are more stable. Current trends suggest a slower than expected ramp up to
ultra high voltage cables (800-1000KV) and therefore we believe the -4.6% CAGR for 220-
750KV shown in Figure 52 is overly conservative. We expect this to continue to be an area
of high investment as the transition to extra high voltage may take longer than expected.
Middle Eastern high voltage cable competitive trends
Local competition in the Middle East has had an impact on both Nexans and Prysmian.
The Middle East in 2010 accounted for 49% of Nexans’ Land High Voltage sales but due
to competitive pressure it has reduced its exposure.
The two key Middle Eastern competitors in land high voltage are El Sewedy and Riyadh
Cables but data is only available for El Sewedy. Figure 54 shows that El Sewedy’s sales in
tons of cables had a 13% CAGR between 2007 and 2011, which we believe was at the
expense of developed market cable makers.
We expect Prysmian and Nexans to become more selective on contracts, which may limit
growth. However, in order to continue to grow sales, Nexans will have to have to continue
to sell to the Middle East, in our view, even at lower than desired margins. This is why we
believe pricing pressure will remain an issue, albeit at more moderate levels.
Figure 53: Nexans Land HV sales exposure to the Middle East has reduced since 2010 and we expect this to continue
Figure 54: El Sewedy appears to have met this demand increasing cable sales (tons) at a 13% CAGR (2007-2011)
49%37%
51%63%
0%
20%
40%
60%
80%
100%
2010 2012
Middle east Europe & Other
0
50
100
150
200
250
300
2007 2008 2009 2010 2011
Cable production capacity (tons) Sales (tons)
Source: Company data Source: Company data
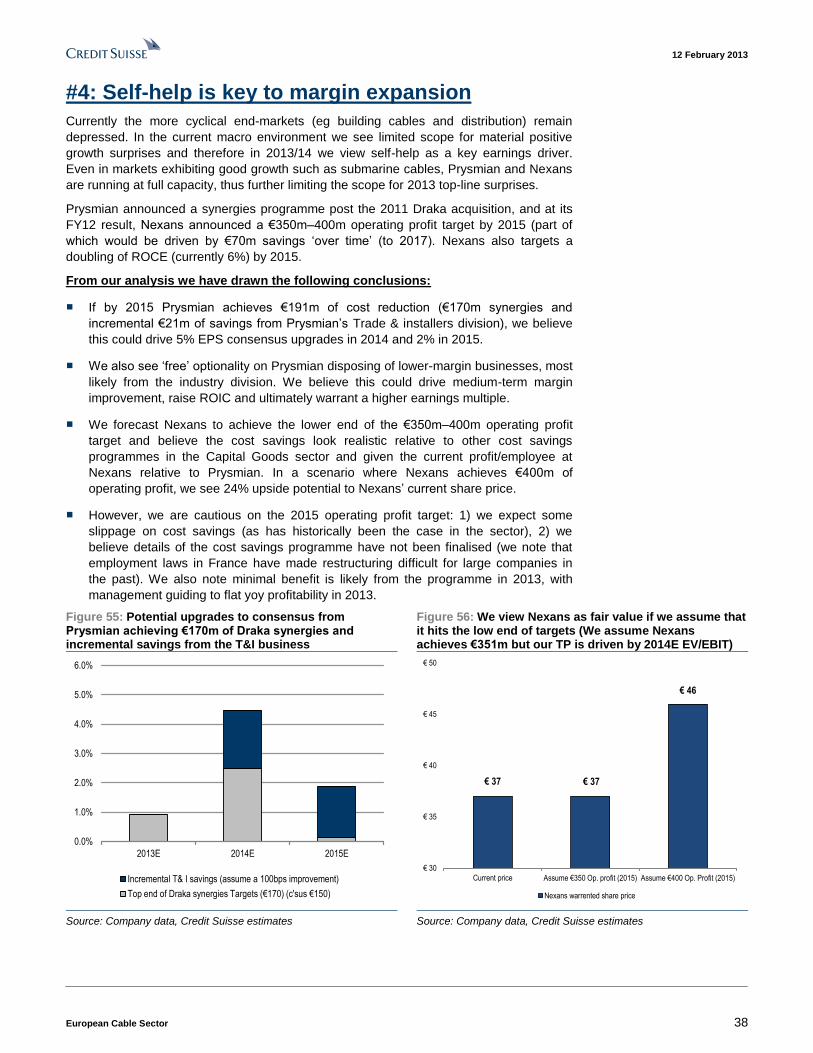
12 February 2013
European Cable Sector 38
#4: Self-help is key to margin expansion
Currently the more cyclical end-markets (eg building cables and distribution) remain
depressed. In the current macro environment we see limited scope for material positive
growth surprises and therefore in 2013/14 we view self-help as a key earnings driver.
Even in markets exhibiting good growth such as submarine cables, Prysmian and Nexans
are running at full capacity, thus further limiting the scope for 2013 top-line surprises.
Prysmian announced a synergies programme post the 2011 Draka acquisition, and at its
FY12 result, Nexans announced a €350m–400m operating profit target by 2015 (part of
which would be driven by €70m savings ‘over time’ (to 2017). Nexans also targets a
doubling of ROCE (currently 6%) by 2015.
From our analysis we have drawn the following conclusions:
■ If by 2015 Prysmian achieves €191m of cost reduction (€170m synergies and
incremental €21m of savings from Prysmian’s Trade & installers division), we believe
this could drive 5% EPS consensus upgrades in 2014 and 2% in 2015.
■ We also see ‘free’ optionality on Prysmian disposing of lower-margin businesses, most
likely from the industry division. We believe this could drive medium-term margin
improvement, raise ROIC and ultimately warrant a higher earnings multiple.
■ We forecast Nexans to achieve the lower end of the €350m–400m operating profit
target and believe the cost savings look realistic relative to other cost savings
programmes in the Capital Goods sector and given the current profit/employee at
Nexans relative to Prysmian. In a scenario where Nexans achieves €400m of
operating profit, we see 24% upside potential to Nexans’ current share price.
■ However, we are cautious on the 2015 operating profit target: 1) we expect some
slippage on cost savings (as has historically been the case in the sector), 2) we
believe details of the cost savings programme have not been finalised (we note that
employment laws in France have made restructuring difficult for large companies in
the past). We also note minimal benefit is likely from the programme in 2013, with
management guiding to flat yoy profitability in 2013.
Figure 55: Potential upgrades to consensus from Prysmian achieving €170m of Draka synergies and incremental savings from the T&I business
Figure 56: We view Nexans as fair value if we assume that it hits the low end of targets (We assume Nexans achieves €351m but our TP is driven by 2014E EV/EBIT)
0.0%
1.0%
2.0%
3.0%
4.0%
5.0%
6.0%
2013E 2014E 2015E
Incremental T& I savings (assume a 100bps improvement)
Top end of Draka synergies Targets (€170) (c'sus €150)
€ 37 € 37
€ 46
€ 30
€ 35
€ 40
€ 45
€ 50
Current price Assume €350 Op. profit (2015) Assume €400 Op. Profit (2015)
Nexans warrented share price
Source: Company data, Credit Suisse estimates Source: Company data, Credit Suisse estimates
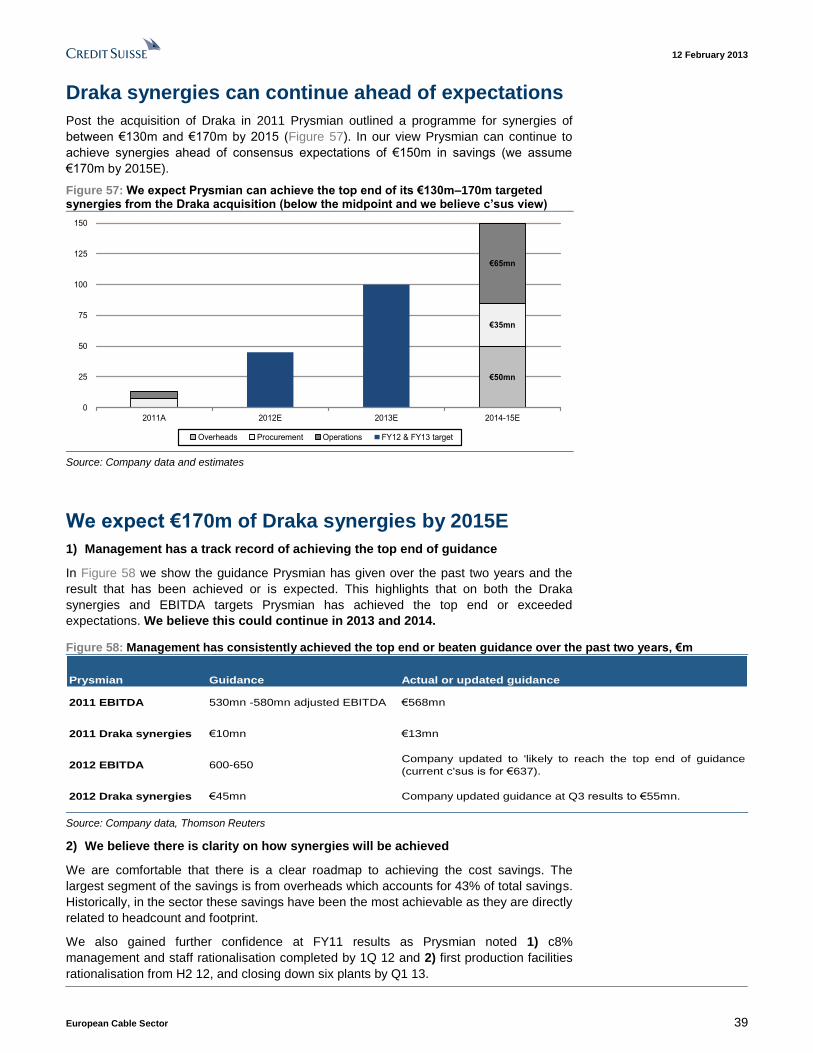
12 February 2013
European Cable Sector 39
Draka synergies can continue ahead of expectations
Post the acquisition of Draka in 2011 Prysmian outlined a programme for synergies of
between €130m and €170m by 2015 (Figure 57). In our view Prysmian can continue to
achieve synergies ahead of consensus expectations of €150m in savings (we assume
€170m by 2015E).
Figure 57: We expect Prysmian can achieve the top end of its €130m–170m targeted synergies from the Draka acquisition (below the midpoint and we believe c’sus view)
€50mn
€35mn
€65mn
0
25
50
75
100
125
150
2011A 2012E 2013E 2014-15E
Overheads Procurement Operations FY12 & FY13 target
Source: Company data and estimates
We expect €170m of Draka synergies by 2015E
1) Management has a track record of achieving the top end of guidance
In Figure 58 we show the guidance Prysmian has given over the past two years and the
result that has been achieved or is expected. This highlights that on both the Draka
synergies and EBITDA targets Prysmian has achieved the top end or exceeded
expectations. We believe this could continue in 2013 and 2014.
Figure 58: Management has consistently achieved the top end or beaten guidance over the past two years, €m
Prysmian Guidance Actual or updated guidance
2011 EBITDA 530mn -580mn adjusted EBITDA €568mn
2011 Draka synergies €10mn €13mn
2012 EBITDA 600-650Company updated to 'likely to reach the top end of guidance
(current c'sus is for €637).
2012 Draka synergies €45mn Company updated guidance at Q3 results to €55mn.
Source: Company data, Thomson Reuters
2) We believe there is clarity on how synergies will be achieved
We are comfortable that there is a clear roadmap to achieving the cost savings. The
largest segment of the savings is from overheads which accounts for 43% of total savings.
Historically, in the sector these savings have been the most achievable as they are directly
related to headcount and footprint.
We also gained further confidence at FY11 results as Prysmian noted 1) c8%
management and staff rationalisation completed by 1Q 12 and 2) first production facilities
rationalisation from H2 12, and closing down six plants by Q1 13.
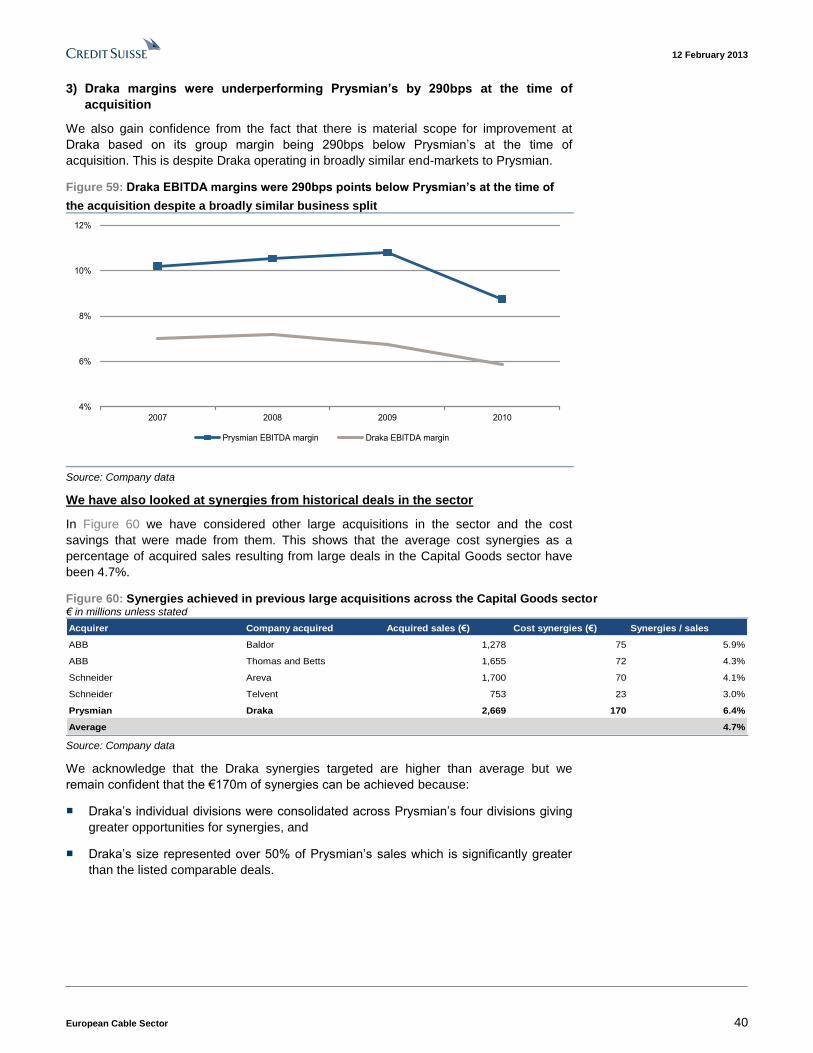
12 February 2013
European Cable Sector 40
3) Draka margins were underperforming Prysmian’s by 290bps at the time of
acquisition
We also gain confidence from the fact that there is material scope for improvement at
Draka based on its group margin being 290bps below Prysmian’s at the time of
acquisition. This is despite Draka operating in broadly similar end-markets to Prysmian.
Figure 59: Draka EBITDA margins were 290bps points below Prysmian’s at the time of
the acquisition despite a broadly similar business split
4%
6%
8%
10%
12%
2007 2008 2009 2010
Prysmian EBITDA margin Draka EBITDA margin
Source: Company data
We have also looked at synergies from historical deals in the sector
In Figure 60 we have considered other large acquisitions in the sector and the cost
savings that were made from them. This shows that the average cost synergies as a
percentage of acquired sales resulting from large deals in the Capital Goods sector have
been 4.7%.
Figure 60: Synergies achieved in previous large acquisitions across the Capital Goods sector € in millions unless stated
Acquirer Company acquired Acquired sales (€) Cost synergies (€) Synergies / sales
ABB Baldor 1,278 75 5.9%
ABB Thomas and Betts 1,655 72 4.3%
Schneider Areva 1,700 70 4.1%
Schneider Telvent 753 23 3.0%
Prysmian Draka 2,669 170 6.4%
Average 4.7% Source: Company data
We acknowledge that the Draka synergies targeted are higher than average but we
remain confident that the €170m of synergies can be achieved because:
■ Draka’s individual divisions were consolidated across Prysmian’s four divisions giving
greater opportunities for synergies, and
■ Draka’s size represented over 50% of Prysmian’s sales which is significantly greater
than the listed comparable deals.

12 February 2013
European Cable Sector 41
Potential for incremental savings to Draka synergies
■ In our forecasts we assume synergies can continue to come through faster than
consensus expects and that Prysmian can reach the top end of the targeted range
(€130m–170m).
■ We also see potential for a further restructuring of Prysmian’s Trade & Installers
(building cables) division. We run a 100bps margin improvement scenario where we
assume €21m of savings in 2014 & 2015 (incremental to €170m synergies). We also
run a sensitivity to a 200bps margin improvement based on a more extensive
restructuring programme.
■ We believe that a 100bps improvement would generate €21m incremental EBIT in
2014 and 2015 and 200bps would generate €42m. We believe this is possible
because the T&I division is underperforming both relative to its peer Nexans and
relative to its own history
■ We believe combining our €170m Draka synergy savings and the incremental
€21m savings (split between 2014 and 2015) can generate consensus upgrades
of 5% in 2014E (3% from synergies and 2% from T&I restructuring).
In Figure 61 we show what we believe to be consensus expectations for Draka synergies
and we include our synergy assumption, and the potential T&I divisional restructuring. In
2014E we assume Prysmian makes €17m more savings than consensus and we also see
potential for a further €11m of savings in a scenario in which a deeper restructuring of the
T&I division is undertaken.
Figure 61: Credit Suisse cost-cutting scenario: Synergies (€170m total by 2015E) and T&I savings (an incremental €21m split between 2014E and 2015E), 2011A–15E € in millions, unless otherwise stated
0
50
100
150
200
250
0
10
20
30
40
50
60
70
2011A 2012E 2013E 2014E 2015E
C'sus assumed savings Incremental savings (€170mn total)
T&I (incremental restructuring) Cumulative scenario savings
Source: Company data, Credit Suisse estimates
Our view that Prysmian could save €21m of cost in 2014/15 (incremental to €170m
synergies) is driven by the following:
■ Prysmian undertook minimal restructuring programmes prior to the Draka deal; and
■ The T&I business is the clear underperformer in Prysmian’s portfolio.
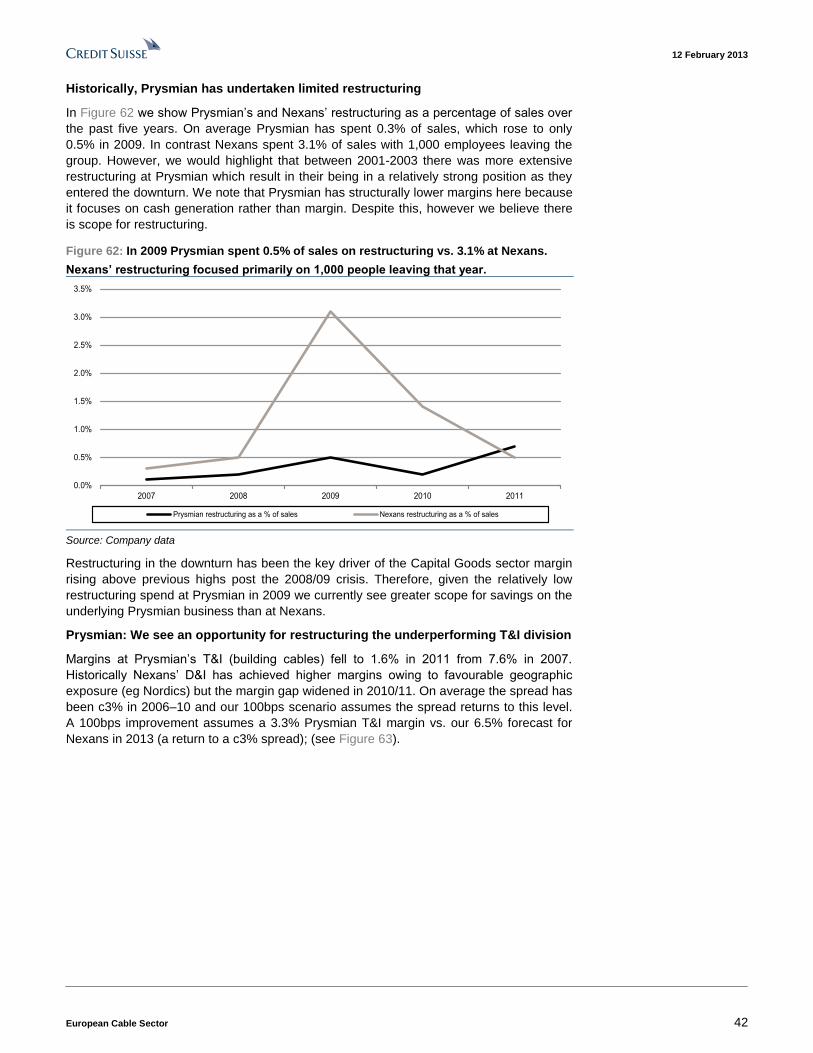
12 February 2013
European Cable Sector 42
Historically, Prysmian has undertaken limited restructuring
In Figure 62 we show Prysmian’s and Nexans’ restructuring as a percentage of sales over
the past five years. On average Prysmian has spent 0.3% of sales, which rose to only
0.5% in 2009. In contrast Nexans spent 3.1% of sales with 1,000 employees leaving the
group. However, we would highlight that between 2001-2003 there was more extensive
restructuring at Prysmian which result in their being in a relatively strong position as they
entered the downturn. We note that Prysmian has structurally lower margins here because
it focuses on cash generation rather than margin. Despite this, however we believe there
is scope for restructuring.
Figure 62: In 2009 Prysmian spent 0.5% of sales on restructuring vs. 3.1% at Nexans.
Nexans’ restructuring focused primarily on 1,000 people leaving that year.
0.0%
0.5%
1.0%
1.5%
2.0%
2.5%
3.0%
3.5%
2007 2008 2009 2010 2011
Prysmian restructuring as a % of sales Nexans restructuring as a % of sales
Source: Company data
Restructuring in the downturn has been the key driver of the Capital Goods sector margin
rising above previous highs post the 2008/09 crisis. Therefore, given the relatively low
restructuring spend at Prysmian in 2009 we currently see greater scope for savings on the
underlying Prysmian business than at Nexans.
Prysmian: We see an opportunity for restructuring the underperforming T&I division
Margins at Prysmian’s T&I (building cables) fell to 1.6% in 2011 from 7.6% in 2007.
Historically Nexans’ D&I has achieved higher margins owing to favourable geographic
exposure (eg Nordics) but the margin gap widened in 2010/11. On average the spread has
been c3% in 2006–10 and our 100bps scenario assumes the spread returns to this level.
A 100bps improvement assumes a 3.3% Prysmian T&I margin vs. our 6.5% forecast for
Nexans in 2013 (a return to a c3% spread); (see Figure 63).
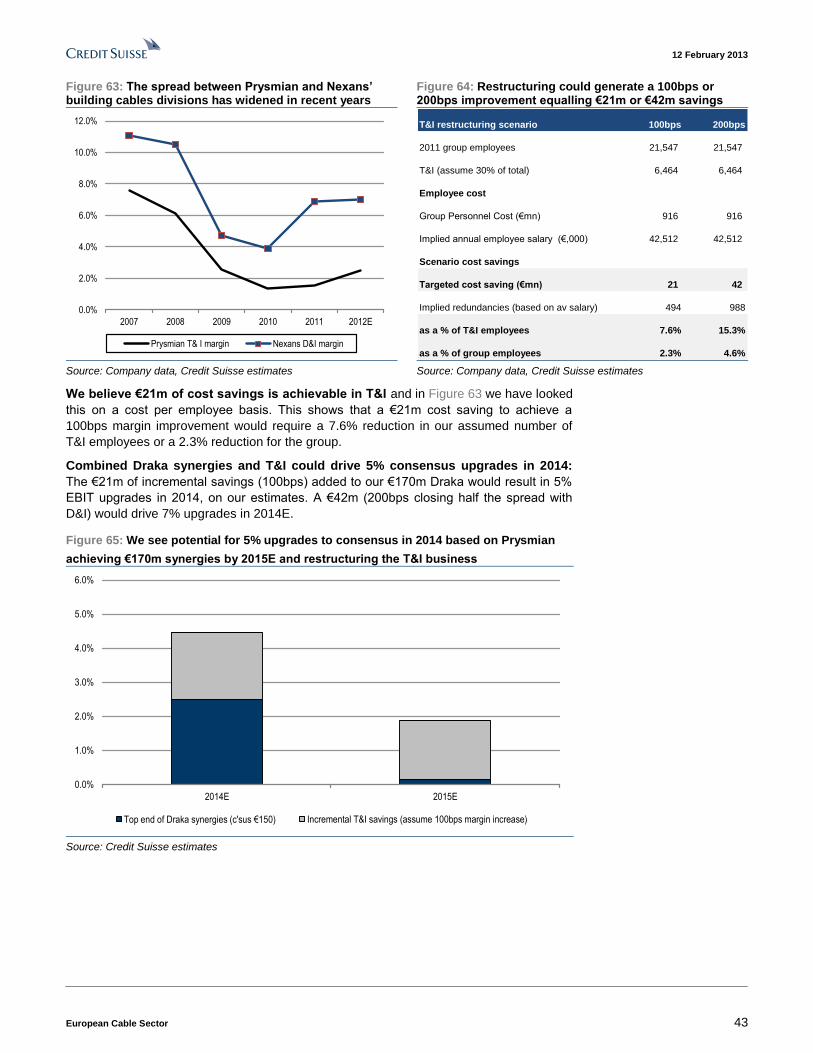
12 February 2013
European Cable Sector 43
Figure 63: The spread between Prysmian and Nexans’ building cables divisions has widened in recent years
Figure 64: Restructuring could generate a 100bps or 200bps improvement equalling €21m or €42m savings
0.0%
2.0%
4.0%
6.0%
8.0%
10.0%
12.0%
2007 2008 2009 2010 2011 2012E
Prysmian T& I margin Nexans D&I margin
T&I restructuring scenario 100bps 200bps
2011 group employees 21,547 21,547
T&I (assume 30% of total) 6,464 6,464
Employee cost
Group Personnel Cost (€mn) 916 916
Implied annual employee salary (€,000) 42,512 42,512
Scenario cost savings
Targeted cost saving (€mn) 21 42
Implied redundancies (based on av salary) 494 988
as a % of T&I employees 7.6% 15.3%
as a % of group employees 2.3% 4.6% Source: Company data, Credit Suisse estimates Source: Company data, Credit Suisse estimates
We believe €21m of cost savings is achievable in T&I and in Figure 63 we have looked
this on a cost per employee basis. This shows that a €21m cost saving to achieve a
100bps margin improvement would require a 7.6% reduction in our assumed number of
T&I employees or a 2.3% reduction for the group.
Combined Draka synergies and T&I could drive 5% consensus upgrades in 2014:
The €21m of incremental savings (100bps) added to our €170m Draka would result in 5%
EBIT upgrades in 2014, on our estimates. A €42m (200bps closing half the spread with
D&I) would drive 7% upgrades in 2014E.
Figure 65: We see potential for 5% upgrades to consensus in 2014 based on Prysmian
achieving €170m synergies by 2015E and restructuring the T&I business
0.0%
1.0%
2.0%
3.0%
4.0%
5.0%
6.0%
2014E 2015E
Top end of Draka synergies (c'sus €150) Incremental T&I savings (assume 100bps margin increase)
Source: Credit Suisse estimates
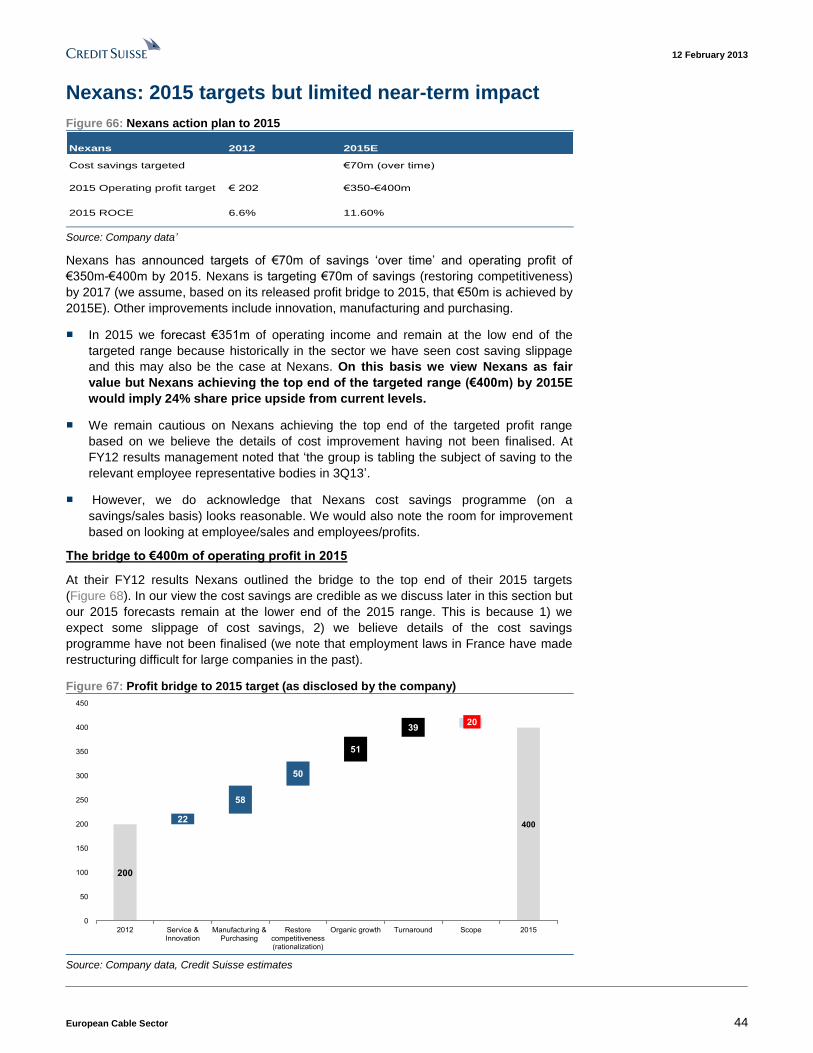
12 February 2013
European Cable Sector 44
Nexans: 2015 targets but limited near-term impact
Figure 66: Nexans action plan to 2015
Nexans 2012 2015E
Cost savings targeted €70m (over time)
2015 Operating profit target € 202 €350-€400m
2015 ROCE 6.6% 11.60%
Source: Company data’
Nexans has announced targets of €70m of savings ‘over time’ and operating profit of
€350m-€400m by 2015. Nexans is targeting €70m of savings (restoring competitiveness)
by 2017 (we assume, based on its released profit bridge to 2015, that €50m is achieved by
2015E). Other improvements include innovation, manufacturing and purchasing.
■ In 2015 we forecast €351m of operating income and remain at the low end of the
targeted range because historically in the sector we have seen cost saving slippage
and this may also be the case at Nexans. On this basis we view Nexans as fair
value but Nexans achieving the top end of the targeted range (€400m) by 2015E
would imply 24% share price upside from current levels.
■ We remain cautious on Nexans achieving the top end of the targeted profit range
based on we believe the details of cost improvement having not been finalised. At
FY12 results management noted that ‘the group is tabling the subject of saving to the
relevant employee representative bodies in 3Q13’.
■ However, we do acknowledge that Nexans cost savings programme (on a
savings/sales basis) looks reasonable. We would also note the room for improvement
based on looking at employee/sales and employees/profits.
The bridge to €400m of operating profit in 2015
At their FY12 results Nexans outlined the bridge to the top end of their 2015 targets
(Figure 68). In our view the cost savings are credible as we discuss later in this section but
our 2015 forecasts remain at the lower end of the 2015 range. This is because 1) we
expect some slippage of cost savings, 2) we believe details of the cost savings
programme have not been finalised (we note that employment laws in France have made
restructuring difficult for large companies in the past).
Figure 67: Profit bridge to 2015 target (as disclosed by the company)
400
200
22
58
50
51
3920
0
50
100
150
200
250
300
350
400
450
2012 Service &Innovation
Manufacturing &Purchasing
Restorecompetitiveness(rationalization)
Organic growth Turnaround Scope 2015
Source: Company data, Credit Suisse estimates
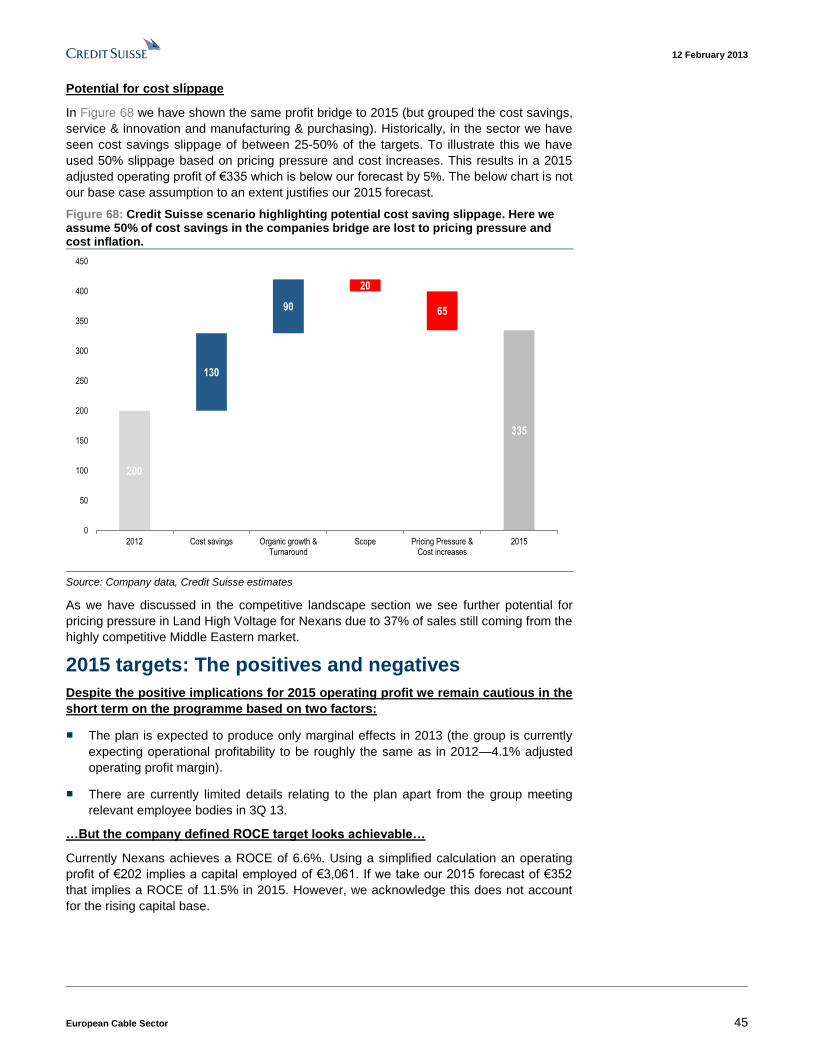
12 February 2013
European Cable Sector 45
Potential for cost slippage
In Figure 68 we have shown the same profit bridge to 2015 (but grouped the cost savings,
service & innovation and manufacturing & purchasing). Historically, in the sector we have
seen cost savings slippage of between 25-50% of the targets. To illustrate this we have
used 50% slippage based on pricing pressure and cost increases. This results in a 2015
adjusted operating profit of €335 which is below our forecast by 5%. The below chart is not
our base case assumption to an extent justifies our 2015 forecast.
Figure 68: Credit Suisse scenario highlighting potential cost saving slippage. Here we assume 50% of cost savings in the companies bridge are lost to pricing pressure and cost inflation.
335
200
130
90
20
65
0
50
100
150
200
250
300
350
400
450
2012 Cost savings Organic growth &Turnaround
Scope Pricing Pressure &Cost increases
2015
Source: Company data, Credit Suisse estimates
As we have discussed in the competitive landscape section we see further potential for
pricing pressure in Land High Voltage for Nexans due to 37% of sales still coming from the
highly competitive Middle Eastern market.
2015 targets: The positives and negatives
Despite the positive implications for 2015 operating profit we remain cautious in the
short term on the programme based on two factors:
■ The plan is expected to produce only marginal effects in 2013 (the group is currently
expecting operational profitability to be roughly the same as in 2012—4.1% adjusted
operating profit margin).
■ There are currently limited details relating to the plan apart from the group meeting
relevant employee bodies in 3Q 13.
…But the company defined ROCE target looks achievable…
Currently Nexans achieves a ROCE of 6.6%. Using a simplified calculation an operating
profit of €202 implies a capital employed of €3,061. If we take our 2015 forecast of €352
that implies a ROCE of 11.5% in 2015. However, we acknowledge this does not account
for the rising capital base.
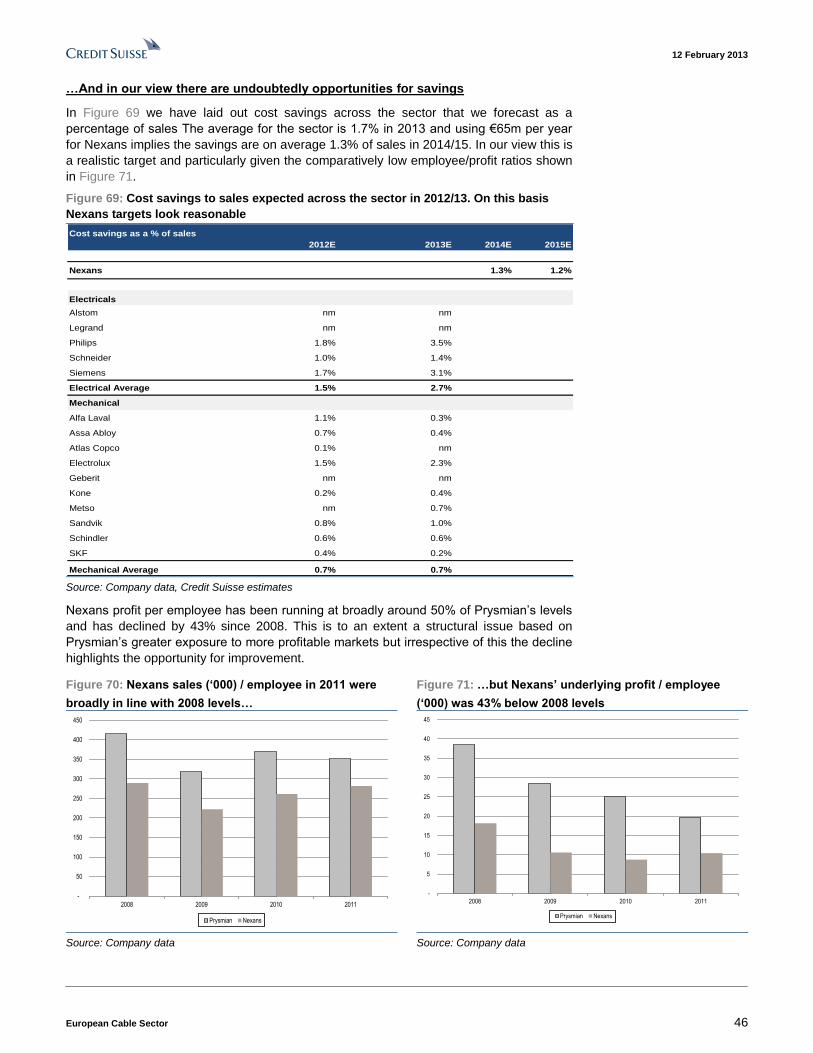
12 February 2013
European Cable Sector 46
…And in our view there are undoubtedly opportunities for savings
In Figure 69 we have laid out cost savings across the sector that we forecast as a
percentage of sales The average for the sector is 1.7% in 2013 and using €65m per year
for Nexans implies the savings are on average 1.3% of sales in 2014/15. In our view this is
a realistic target and particularly given the comparatively low employee/profit ratios shown
in Figure 71.
Figure 69: Cost savings to sales expected across the sector in 2012/13. On this basis
Nexans targets look reasonable
Cost savings as a % of sales
2012E 2013E 2014E 2015E
Nexans 1.3% 1.2%
Electricals
Alstom nm nm
Legrand nm nm
Philips 1.8% 3.5%
Schneider 1.0% 1.4%
Siemens 1.7% 3.1%
Electrical Average 1.5% 2.7%
Mechanical
Alfa Laval 1.1% 0.3%
Assa Abloy 0.7% 0.4%
Atlas Copco 0.1% nm
Electrolux 1.5% 2.3%
Geberit nm nm
Kone 0.2% 0.4%
Metso nm 0.7%
Sandvik 0.8% 1.0%
Schindler 0.6% 0.6%
SKF 0.4% 0.2%
Mechanical Average 0.7% 0.7% Source: Company data, Credit Suisse estimates
Nexans profit per employee has been running at broadly around 50% of Prysmian’s levels
and has declined by 43% since 2008. This is to an extent a structural issue based on
Prysmian’s greater exposure to more profitable markets but irrespective of this the decline
highlights the opportunity for improvement.
Figure 70: Nexans sales (‘000) / employee in 2011 were
broadly in line with 2008 levels…
Figure 71: …but Nexans’ underlying profit / employee
(‘000) was 43% below 2008 levels
-
50
100
150
200
250
300
350
400
450
2008 2009 2010 2011
Prysmian Nexans
-
5
10
15
20
25
30
35
40
45
2008 2009 2010 2011
Prysmian Nexans
Source: Company data Source: Company data

12 February 2013
European Cable Sector 47
Company section
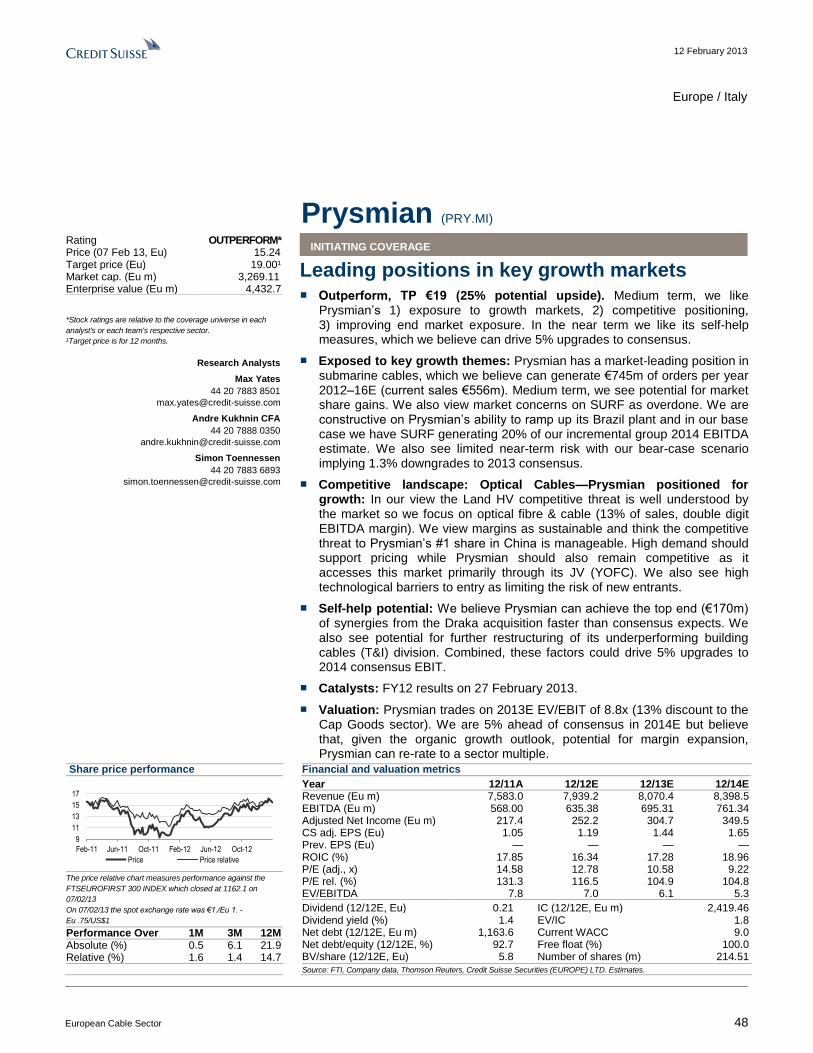
12 February 2013
European Cable Sector 48
Europe / Italy
Prysmian (PRY.MI) INITIATING COVERAGE
Leading positions in key growth markets ■ Outperform, TP €19 (25% potential upside). Medium term, we like
Prysmian’s 1) exposure to growth markets, 2) competitive positioning, 3) improving end market exposure. In the near term we like its self-help measures, which we believe can drive 5% upgrades to consensus.
■ Exposed to key growth themes: Prysmian has a market-leading position in submarine cables, which we believe can generate €745m of orders per year 2012–16E (current sales €556m). Medium term, we see potential for market share gains. We also view market concerns on SURF as overdone. We are constructive on Prysmian’s ability to ramp up its Brazil plant and in our base case we have SURF generating 20% of our incremental group 2014 EBITDA estimate. We also see limited near-term risk with our bear-case scenario implying 1.3% downgrades to 2013 consensus.
■ Competitive landscape: Optical Cables—Prysmian positioned for growth: In our view the Land HV competitive threat is well understood by the market so we focus on optical fibre & cable (13% of sales, double digit EBITDA margin). We view margins as sustainable and think the competitive threat to Prysmian’s #1 share in China is manageable. High demand should support pricing while Prysmian should also remain competitive as it accesses this market primarily through its JV (YOFC). We also see high technological barriers to entry as limiting the risk of new entrants.
■ Self-help potential: We believe Prysmian can achieve the top end (€170m) of synergies from the Draka acquisition faster than consensus expects. We also see potential for further restructuring of its underperforming building cables (T&I) division. Combined, these factors could drive 5% upgrades to 2014 consensus EBIT.
■ Catalysts: FY12 results on 27 February 2013.
■ Valuation: Prysmian trades on 2013E EV/EBIT of 8.8x (13% discount to the Cap Goods sector). We are 5% ahead of consensus in 2014E but believe that, given the organic growth outlook, potential for margin expansion, Prysmian can re-rate to a sector multiple.
Share price performance
9
11
13
15
17
Feb-11 Jun-11 Oct-11 Feb-12 Jun-12 Oct-12
Price Price relative
The price relative chart measures performance against the
FTSEUROFIRST 300 INDEX which closed at 1162.1 on
07/02/13
On 07/02/13 the spot exchange rate was €1./Eu 1. -
Eu .75/US$1
Performance Over 1M 3M 12M Absolute (%) 0.5 6.1 21.9 Relative (%) 1.6 1.4 14.7
Financial and valuation metrics
Year 12/11A 12/12E 12/13E 12/14E Revenue (Eu m) 7,583.0 7,939.2 8,070.4 8,398.5 EBITDA (Eu m) 568.00 635.38 695.31 761.34 Adjusted Net Income (Eu m) 217.4 252.2 304.7 349.5 CS adj. EPS (Eu) 1.05 1.19 1.44 1.65 Prev. EPS (Eu) — — — — ROIC (%) 17.85 16.34 17.28 18.96 P/E (adj., x) 14.58 12.78 10.58 9.22 P/E rel. (%) 131.3 116.5 104.9 104.8 EV/EBITDA 7.8 7.0 6.1 5.3
Dividend (12/12E, Eu) 0.21 IC (12/12E, Eu m) 2,419.46 Dividend yield (%) 1.4 EV/IC 1.8 Net debt (12/12E, Eu m) 1,163.6 Current WACC 9.0 Net debt/equity (12/12E, %) 92.7 Free float (%) 100.0 BV/share (12/12E, Eu) 5.8 Number of shares (m) 214.51
Source: FTI, Company data, Thomson Reuters, Credit Suisse Securities (EUROPE) LTD. Estimates.
Rating OUTPERFORM* Price (07 Feb 13, Eu) 15.24 Target price (Eu) 19.00¹ Market cap. (Eu m) 3,269.11 Enterprise value (Eu m) 4,432.7
*Stock ratings are relative to the coverage universe in each
analyst's or each team's respective sector.
¹Target price is for 12 months.
Research Analysts
Max Yates
44 20 7883 8501
Andre Kukhnin CFA
44 20 7888 0350
Simon Toennessen
44 20 7883 6893
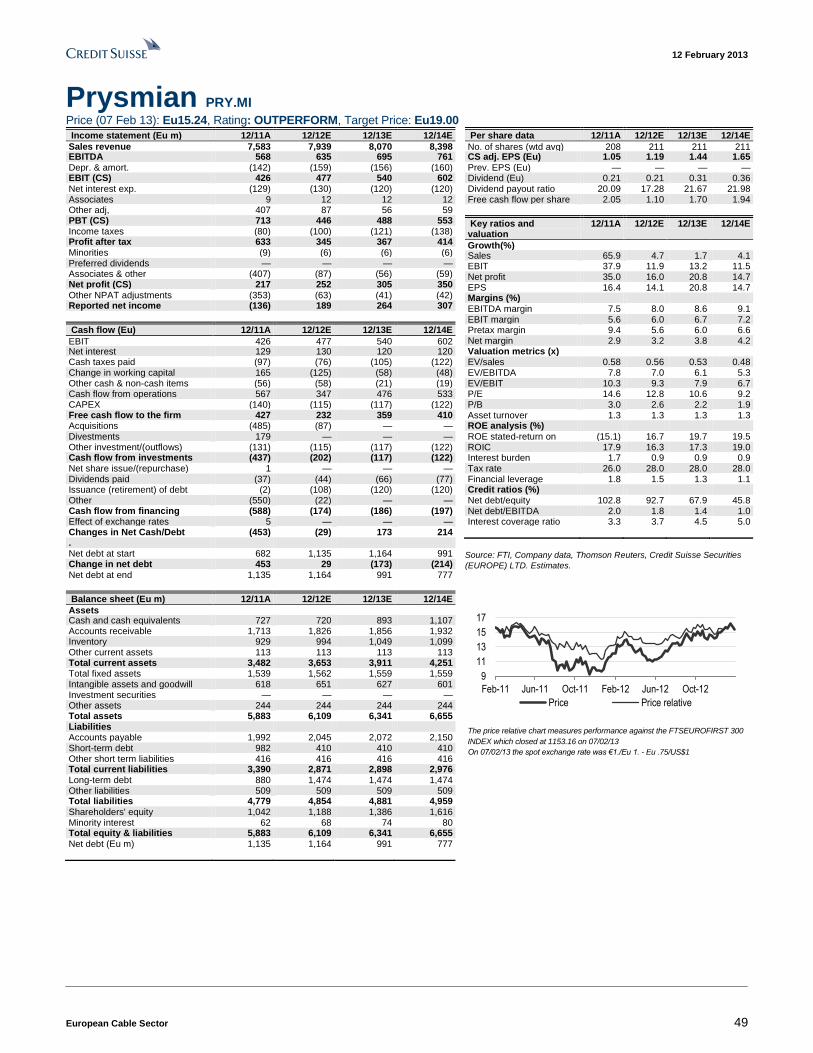
12 February 2013
European Cable Sector 49
Prysmian PRY.MI Price (07 Feb 13): Eu15.24, Rating: OUTPERFORM, Target Price: Eu19.00
Income statement (Eu m) 12/11A 12/12E 12/13E 12/14E
Sales revenue 7,583 7,939 8,070 8,398 EBITDA 568 635 695 761 Depr. & amort. (142) (159) (156) (160) EBIT (CS) 426 477 540 602 Net interest exp. (129) (130) (120) (120) Associates 9 12 12 12 Other adj, 407 87 56 59 PBT (CS) 713 446 488 553 Income taxes (80) (100) (121) (138) Profit after tax 633 345 367 414 Minorities (9) (6) (6) (6) Preferred dividends — — — — Associates & other (407) (87) (56) (59) Net profit (CS) 217 252 305 350 Other NPAT adjustments (353) (63) (41) (42) Reported net income (136) 189 264 307
Cash flow (Eu) 12/11A 12/12E 12/13E 12/14E
EBIT 426 477 540 602 Net interest 129 130 120 120 Cash taxes paid (97) (76) (105) (122) Change in working capital 165 (125) (58) (48) Other cash & non-cash items (56) (58) (21) (19) Cash flow from operations 567 347 476 533 CAPEX (140) (115) (117) (122) Free cash flow to the firm 427 232 359 410 Acquisitions (485) (87) — — Divestments 179 — — — Other investment/(outflows) (131) (115) (117) (122) Cash flow from investments (437) (202) (117) (122) Net share issue/(repurchase) 1 — — — Dividends paid (37) (44) (66) (77) Issuance (retirement) of debt (2) (108) (120) (120) Other (550) (22) — — Cash flow from financing activities
(588) (174) (186) (197) Effect of exchange rates 5 — — — Changes in Net Cash/Debt (453) (29) 173 214 . Net debt at start 682 1,135 1,164 991 Change in net debt 453 29 (173) (214) Net debt at end 1,135 1,164 991 777
Balance sheet (Eu m) 12/11A 12/12E 12/13E 12/14E
Assets Cash and cash equivalents 727 720 893 1,107 Accounts receivable 1,713 1,826 1,856 1,932 Inventory 929 994 1,049 1,099 Other current assets 113 113 113 113 Total current assets 3,482 3,653 3,911 4,251 Total fixed assets 1,539 1,562 1,559 1,559 Intangible assets and goodwill 618 651 627 601 Investment securities — — — — Other assets 244 244 244 244 Total assets 5,883 6,109 6,341 6,655 Liabilities Accounts payable 1,992 2,045 2,072 2,150 Short-term debt 982 410 410 410 Other short term liabilities 416 416 416 416 Total current liabilities 3,390 2,871 2,898 2,976 Long-term debt 880 1,474 1,474 1,474 Other liabilities 509 509 509 509 Total liabilities 4,779 4,854 4,881 4,959 Shareholders' equity 1,042 1,188 1,386 1,616 Minority interest 62 68 74 80 Total equity & liabilities 5,883 6,109 6,341 6,655 Net debt (Eu m) 1,135 1,164 991 777
Per share data 12/11A 12/12E 12/13E 12/14E
No. of shares (wtd avg) 208 211 211 211 CS adj. EPS (Eu) 1.05 1.19 1.44 1.65 Prev. EPS (Eu) — — — — Dividend (Eu) 0.21 0.21 0.31 0.36 Dividend payout ratio 20.09 17.28 21.67 21.98 Free cash flow per share (Eu)
2.05 1.10 1.70 1.94
Key ratios and valuation
12/11A 12/12E 12/13E 12/14E
Growth(%) Sales 65.9 4.7 1.7 4.1 EBIT 37.9 11.9 13.2 11.5 Net profit 35.0 16.0 20.8 14.7 EPS 16.4 14.1 20.8 14.7 Margins (%) EBITDA margin 7.5 8.0 8.6 9.1 EBIT margin 5.6 6.0 6.7 7.2 Pretax margin 9.4 5.6 6.0 6.6 Net margin 2.9 3.2 3.8 4.2 Valuation metrics (x) EV/sales 0.58 0.56 0.53 0.48 EV/EBITDA 7.8 7.0 6.1 5.3 EV/EBIT 10.3 9.3 7.9 6.7 P/E 14.6 12.8 10.6 9.2 P/B 3.0 2.6 2.2 1.9 Asset turnover 1.3 1.3 1.3 1.3 ROE analysis (%) ROE stated-return on equity
(15.1) 16.7 19.7 19.5 ROIC 17.9 16.3 17.3 19.0 Interest burden 1.7 0.9 0.9 0.9 Tax rate 26.0 28.0 28.0 28.0 Financial leverage 1.8 1.5 1.3 1.1 Credit ratios (%) Net debt/equity 102.8 92.7 67.9 45.8 Net debt/EBITDA 2.0 1.8 1.4 1.0 Interest coverage ratio 3.3 3.7 4.5 5.0
Source: FTI, Company data, Thomson Reuters, Credit Suisse Securities
(EUROPE) LTD. Estimates.
9
11
13
15
17
Feb-11 Jun-11 Oct-11 Feb-12 Jun-12 Oct-12
Price Price relative
The price relative chart measures performance against the FTSEUROFIRST 300
INDEX which closed at 1153.16 on 07/02/13
On 07/02/13 the spot exchange rate was €1./Eu 1. - Eu .75/US$1
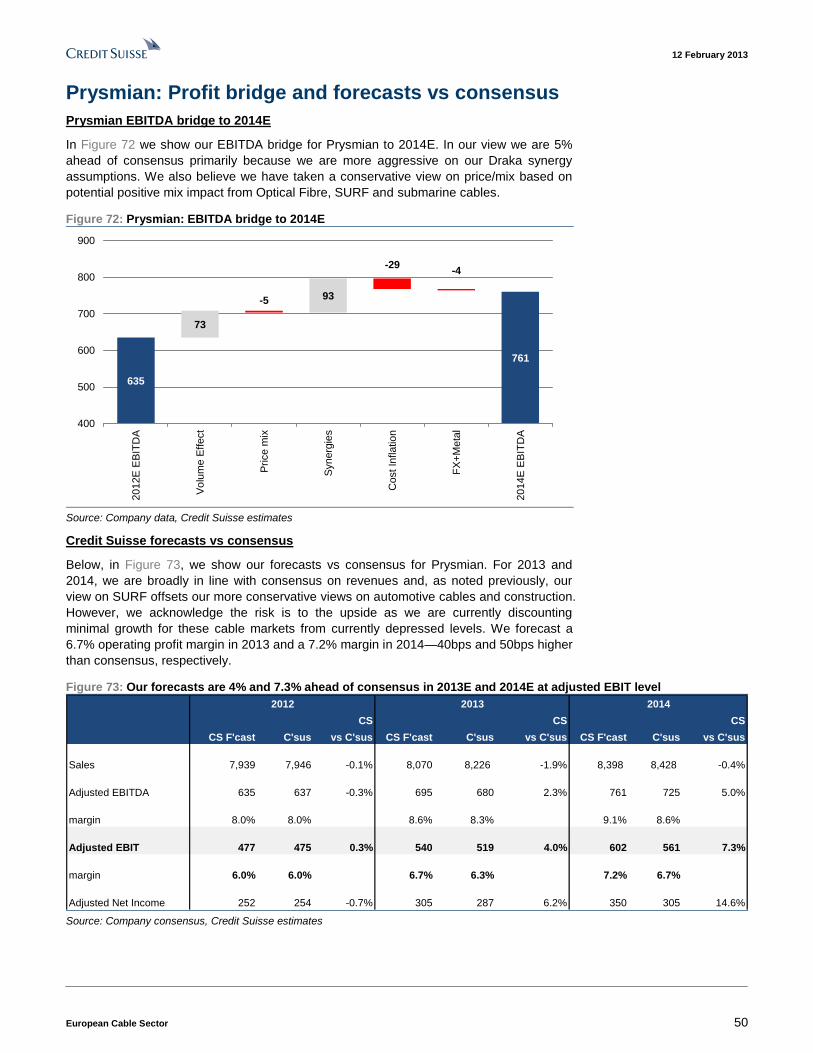
12 February 2013
European Cable Sector 50
Prysmian: Profit bridge and forecasts vs consensus
Prysmian EBITDA bridge to 2014E
In Figure 72 we show our EBITDA bridge for Prysmian to 2014E. In our view we are 5%
ahead of consensus primarily because we are more aggressive on our Draka synergy
assumptions. We also believe we have taken a conservative view on price/mix based on
potential positive mix impact from Optical Fibre, SURF and submarine cables.
Figure 72: Prysmian: EBITDA bridge to 2014E
635
761
73
-5 93
-29-4
400
500
600
700
800
900
2012E
EB
ITD
A
Vo
lum
e E
ffect
Price m
ix
Synerg
ies
Cost In
flation
FX
+M
eta
l
2014E
EB
ITD
A
Source: Company data, Credit Suisse estimates
Credit Suisse forecasts vs consensus
Below, in Figure 73, we show our forecasts vs consensus for Prysmian. For 2013 and
2014, we are broadly in line with consensus on revenues and, as noted previously, our
view on SURF offsets our more conservative views on automotive cables and construction.
However, we acknowledge the risk is to the upside as we are currently discounting
minimal growth for these cable markets from currently depressed levels. We forecast a
6.7% operating profit margin in 2013 and a 7.2% margin in 2014—40bps and 50bps higher
than consensus, respectively.
Figure 73: Our forecasts are 4% and 7.3% ahead of consensus in 2013E and 2014E at adjusted EBIT level
CS CS CS
CS F'cast C'sus vs C'sus CS F'cast C'sus vs C'sus CS F'cast C'sus vs C'sus
Sales 7,939 7,946 -0.1% 8,070 8,226 -1.9% 8,398 8,428 -0.4%
Adjusted EBITDA 635 637 -0.3% 695 680 2.3% 761 725 5.0%
margin 8.0% 8.0% 8.6% 8.3% 9.1% 8.6%
Adjusted EBIT 477 475 0.3% 540 519 4.0% 602 561 7.3%
margin 6.0% 6.0% 6.7% 6.3% 7.2% 6.7%
Adjusted Net Income 252 254 -0.7% 305 287 6.2% 350 305 14.6%
2012 2013 2014
Source: Company consensus, Credit Suisse estimates
12 February 2013
European Cable Sector 51
Prysmian investment case We initiate on Prysmian with an Outperform rating and a €19 target price. We view
Prysmian as a well-managed business with good exposure to structurally growing markets
and, despite the recent strong performance (+43% LTM vs 10% for the sector), we see
25% potential upside from current levels.
Our investment case is based on five factors:
1) Exposure to growth themes
2) Competitive positioning
3) Improving end market exposure
4) Self-help potential
5) Valuation
In the medium term we view Prysmian as a re-rating story based on its 1) exposure to
growth themes, 2) competitive positioning, and 3) improving end market exposure, and in
the near-term we see potential for 5% consensus upgrades driven by self-help.
1) Attractive exposure to growth themes
As we discuss earlier in this report, we view Prysmian as attractive based on its
positioning in submarine (go to page 9) and for its exposure to SURF in the medium term
(to go page 19). In our view the potential for Prysmian market share gains in submarine
are underestimated by the market while we believe SURF is an attractive growth market
and concerns in the near term are overdone.
Below we have included short summaries of our conclusions on these themes:
Submarine cables—potential for Prysmian to gain share in the medium term
Submarine cables account for 7% of group sales and we estimate 18% of EBITDA in
2011. We view this as a consolidated (three players have 85% share), structurally growing
market, with high technological barriers to entry. In submarine, Prysmian has a three-year
order backlog but we continue to see upside to our double digit sales growth forecasts if
Prysmian were to increase its submarine production capacity at its Pikkala plant.
We believe Europe submarine cables will be a €745m market for Prysmian (2012E–17E)
vs. current sales of €556m. We also see potential for Prysmian to take share in this market
based on 1) its relationships with key grid players, eg Siemens, and 2) as it has won the
higher-value, more complex contracts since 2009.
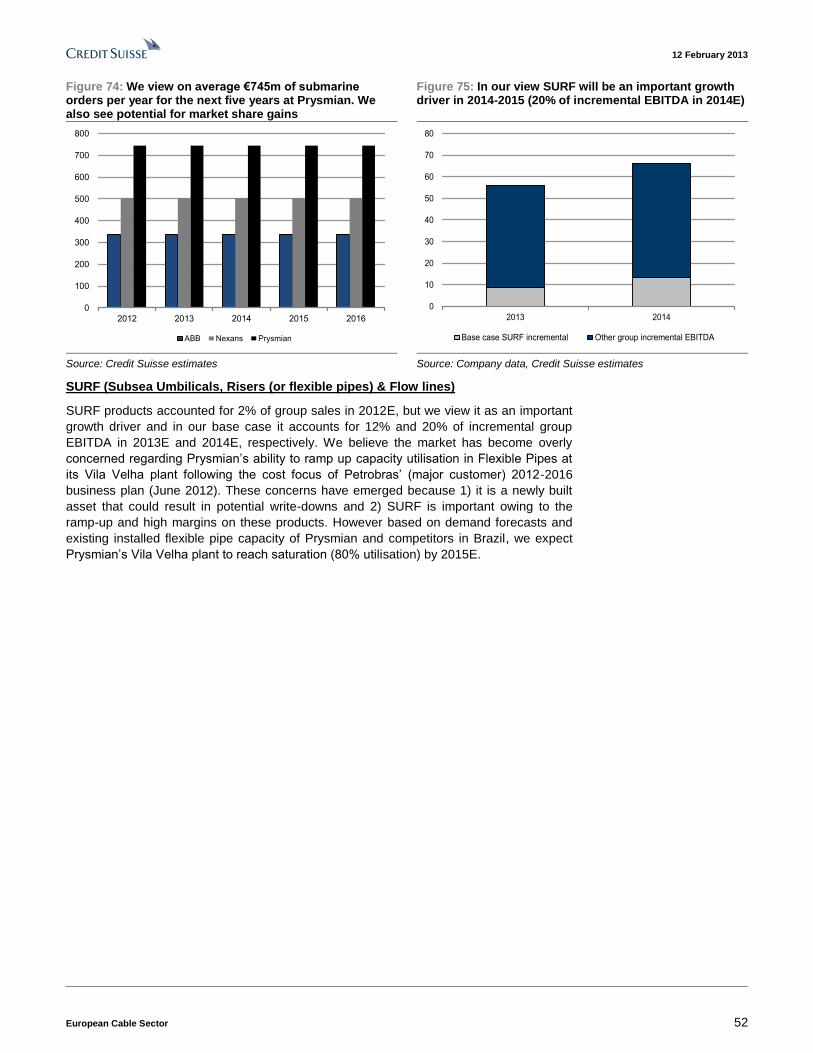
12 February 2013
European Cable Sector 52
Figure 74: We view on average €745m of submarine orders per year for the next five years at Prysmian. We also see potential for market share gains
Figure 75: In our view SURF will be an important growth driver in 2014-2015 (20% of incremental EBITDA in 2014E)
0
100
200
300
400
500
600
700
800
2012 2013 2014 2015 2016
ABB Nexans Prysmian
0
10
20
30
40
50
60
70
80
2013 2014
Base case SURF incremental Other group incremental EBITDA
Source: Credit Suisse estimates Source: Company data, Credit Suisse estimates
SURF (Subsea Umbilicals, Risers (or flexible pipes) & Flow lines)
SURF products accounted for 2% of group sales in 2012E, but we view it as an important
growth driver and in our base case it accounts for 12% and 20% of incremental group
EBITDA in 2013E and 2014E, respectively. We believe the market has become overly
concerned regarding Prysmian’s ability to ramp up capacity utilisation in Flexible Pipes at
its Vila Velha plant following the cost focus of Petrobras’ (major customer) 2012-2016
business plan (June 2012). These concerns have emerged because 1) it is a newly built
asset that could result in potential write-downs and 2) SURF is important owing to the
ramp-up and high margins on these products. However based on demand forecasts and
existing installed flexible pipe capacity of Prysmian and competitors in Brazil, we expect
Prysmian’s Vila Velha plant to reach saturation (80% utilisation) by 2015E.
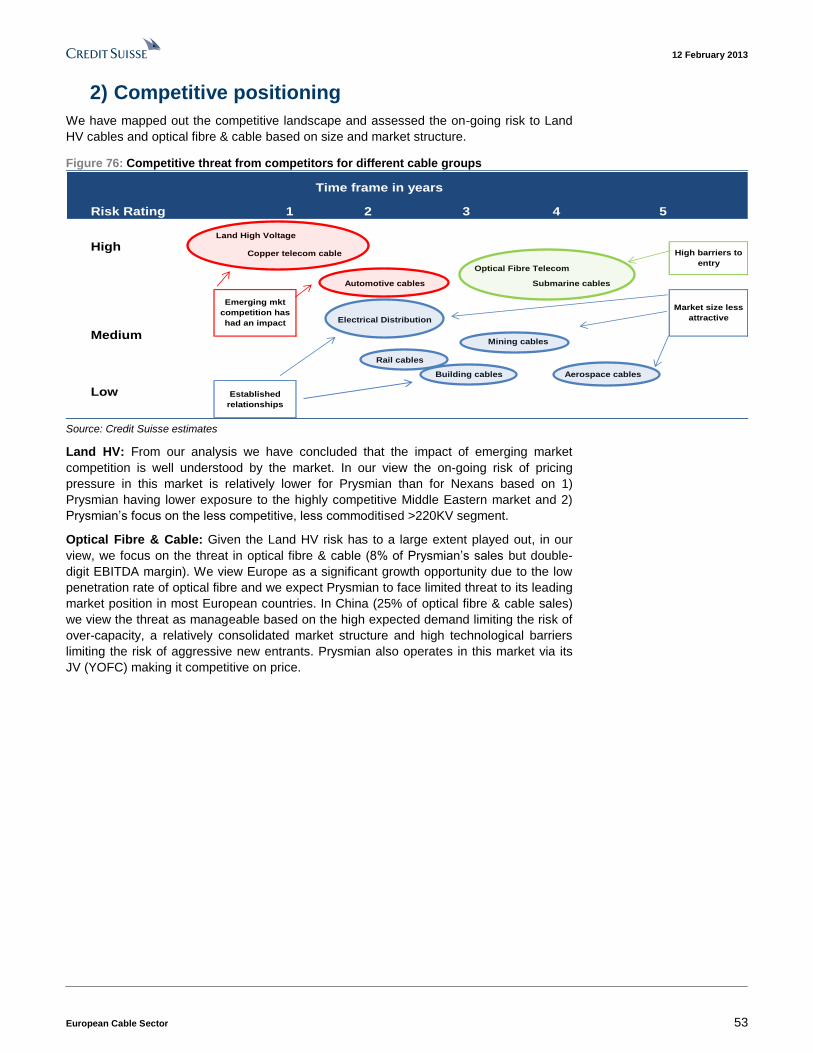
12 February 2013
European Cable Sector 53
2) Competitive positioning
We have mapped out the competitive landscape and assessed the on-going risk to Land
HV cables and optical fibre & cable based on size and market structure.
Figure 76: Competitive threat from competitors for different cable groups
Risk Rating 1 2 3 4 5
Land High Voltage
Optical Fibre Telecom
Rail cables
Mining cables
Aerospace cables
Established
relationships
Low
Building cables
Market size less
attractive
High barriers to
entry
Electrical Distribution
Time frame in years
HighCopper telecom cable
Submarine cables
Medium
Automotive cables
Emerging mkt
competition has
had an impact
Source: Credit Suisse estimates
Land HV: From our analysis we have concluded that the impact of emerging market
competition is well understood by the market. In our view the on-going risk of pricing
pressure in this market is relatively lower for Prysmian than for Nexans based on 1)
Prysmian having lower exposure to the highly competitive Middle Eastern market and 2)
Prysmian’s focus on the less competitive, less commoditised >220KV segment.
Optical Fibre & Cable: Given the Land HV risk has to a large extent played out, in our
view, we focus on the threat in optical fibre & cable (8% of Prysmian’s sales but double-
digit EBITDA margin). We view Europe as a significant growth opportunity due to the low
penetration rate of optical fibre and we expect Prysmian to face limited threat to its leading
market position in most European countries. In China (25% of optical fibre & cable sales)
we view the threat as manageable based on the high expected demand limiting the risk of
over-capacity, a relatively consolidated market structure and high technological barriers
limiting the risk of aggressive new entrants. Prysmian also operates in this market via its
JV (YOFC) making it competitive on price.
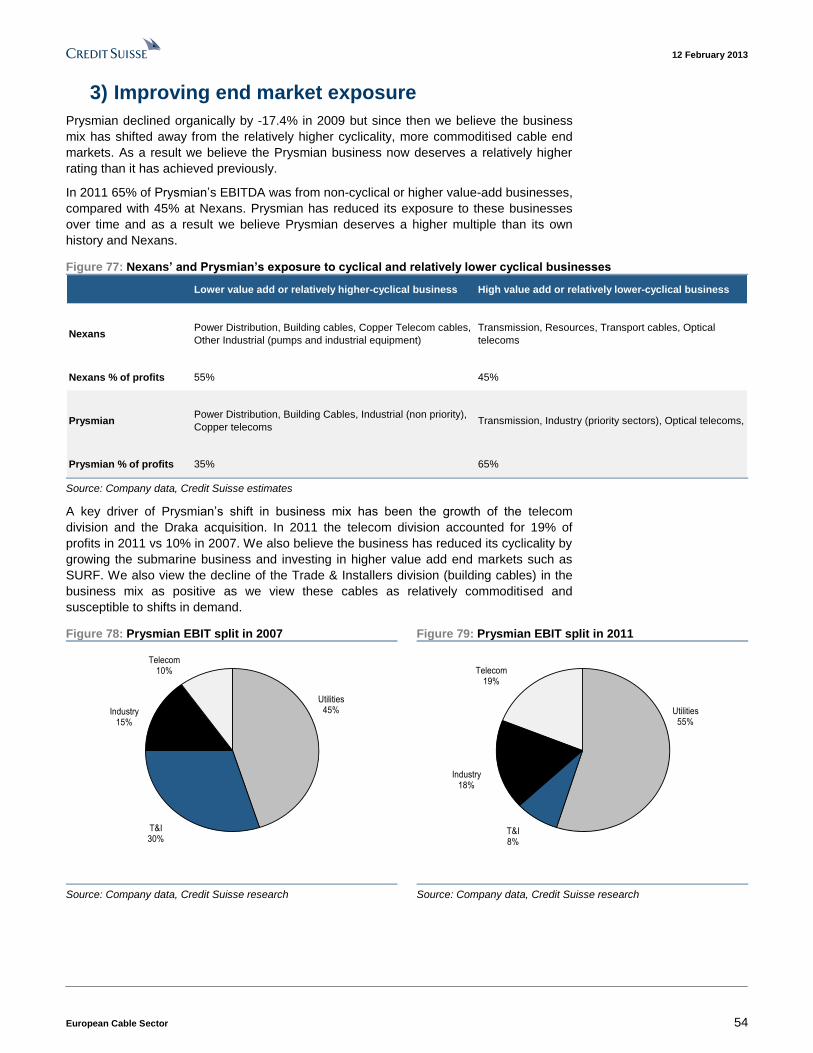
12 February 2013
European Cable Sector 54
3) Improving end market exposure
Prysmian declined organically by -17.4% in 2009 but since then we believe the business
mix has shifted away from the relatively higher cyclicality, more commoditised cable end
markets. As a result we believe the Prysmian business now deserves a relatively higher
rating than it has achieved previously.
In 2011 65% of Prysmian’s EBITDA was from non-cyclical or higher value-add businesses,
compared with 45% at Nexans. Prysmian has reduced its exposure to these businesses
over time and as a result we believe Prysmian deserves a higher multiple than its own
history and Nexans.
Figure 77: Nexans’ and Prysmian’s exposure to cyclical and relatively lower cyclical businesses
Lower value add or relatively higher-cyclical business High value add or relatively lower-cyclical business
Nexans Power Distribution, Building cables, Copper Telecom cables,
Other Industrial (pumps and industrial equipment)
Transmission, Resources, Transport cables, Optical
telecoms
Nexans % of profits 55% 45%
PrysmianPower Distribution, Building Cables, Industrial (non priority),
Copper telecomsTransmission, Industry (priority sectors), Optical telecoms,
Prysmian % of profits 35% 65%
Source: Company data, Credit Suisse estimates
A key driver of Prysmian’s shift in business mix has been the growth of the telecom
division and the Draka acquisition. In 2011 the telecom division accounted for 19% of
profits in 2011 vs 10% in 2007. We also believe the business has reduced its cyclicality by
growing the submarine business and investing in higher value add end markets such as
SURF. We also view the decline of the Trade & Installers division (building cables) in the
business mix as positive as we view these cables as relatively commoditised and
susceptible to shifts in demand.
Figure 78: Prysmian EBIT split in 2007 Figure 79: Prysmian EBIT split in 2011
Utilities45%
T&I30%
Industry15%
Telecom10%
Utilities55%
T&I8%
Industry18%
Telecom19%
Source: Company data, Credit Suisse research Source: Company data, Credit Suisse research

12 February 2013
European Cable Sector 55
4) Self Help: Potential for 5% consensus upgrades
We believe Prysmian can reach the top end (€170m) of its targeted synergies faster than
consensus assumes. Our view is underpinned by three factors: 1) we view
management as conservative and Prysmian has consistently achieved close to the top
end of previous guidance ranges; 2) we have gained confidence from details on
headcount and footprint rationalization, and 3) Draka EBITDA margins were 290bps below
Prysmian’s in 2009, indicating significant scope for improvement.
We also see potential for savings on Prysmian’s underlying business incremental to Draka
synergies. If Prysmian further restructured its T&I (building cables) division resulting in a
100bps margin improvement this could result in €21m of savings (return to historical
margin spread between Prysmian and Nexans building cables businesses). In our view
this is achievable because Prysmian has undertaken limited restructuring in the past, and
T&I is underperforming relative to history and relative to Nexans’ comparable D&I division.
Figure 80: We see potential for 5% upgrades to consensus in 2014E based on Prysmian achieving €170m synergies by 2015E and restructuring the T&I business.
0
50
100
150
200
250
0
10
20
30
40
50
60
70
2011A 2012E 2013E 2014E 2015E
C'sus assumed savings Reaching top end of Draka synergies (€170m)"
T&I (incremental restructuring) Cumulative scenario savings
Source: Company data, Credit Suisse estimates
Based on our cost saving scenario we see potential for 5% upgrades to 2014
consensus. In our view consensus is discounting €150m of Draka synergies and no
further incremental saving on the underlying Prysmian business. In the above scenario we
assume that the €14m of the €20m synergy gap (€170m vs €150m), and half of the
incremental €21m T&I synergies are achieved, which would drive 5% upgrades to
consensus in 2014E.
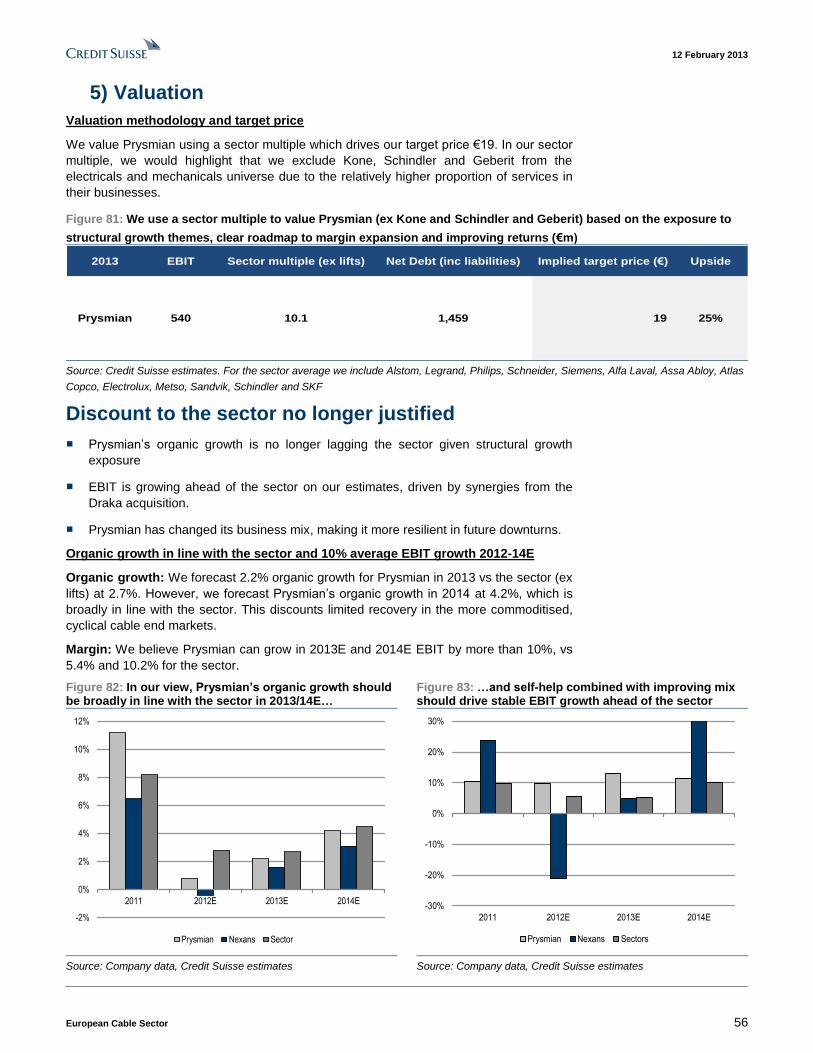
12 February 2013
European Cable Sector 56
5) Valuation
Valuation methodology and target price
We value Prysmian using a sector multiple which drives our target price €19. In our sector
multiple, we would highlight that we exclude Kone, Schindler and Geberit from the
electricals and mechanicals universe due to the relatively higher proportion of services in
their businesses.
Figure 81: We use a sector multiple to value Prysmian (ex Kone and Schindler and Geberit) based on the exposure to
structural growth themes, clear roadmap to margin expansion and improving returns (€m)
2013 EBIT Sector multiple (ex lifts) Net Debt (inc liabilities) Implied target price (€) Upside
Prysmian 540 10.1 1,459 19 25%
Source: Credit Suisse estimates. For the sector average we include Alstom, Legrand, Philips, Schneider, Siemens, Alfa Laval, Assa Abloy, Atlas
Copco, Electrolux, Metso, Sandvik, Schindler and SKF
Discount to the sector no longer justified
■ Prysmian’s organic growth is no longer lagging the sector given structural growth
exposure
■ EBIT is growing ahead of the sector on our estimates, driven by synergies from the
Draka acquisition.
■ Prysmian has changed its business mix, making it more resilient in future downturns.
Organic growth in line with the sector and 10% average EBIT growth 2012-14E
Organic growth: We forecast 2.2% organic growth for Prysmian in 2013 vs the sector (ex
lifts) at 2.7%. However, we forecast Prysmian’s organic growth in 2014 at 4.2%, which is
broadly in line with the sector. This discounts limited recovery in the more commoditised,
cyclical cable end markets.
Margin: We believe Prysmian can grow in 2013E and 2014E EBIT by more than 10%, vs
5.4% and 10.2% for the sector.
Figure 82: In our view, Prysmian’s organic growth should be broadly in line with the sector in 2013/14E…
Figure 83: …and self-help combined with improving mix should drive stable EBIT growth ahead of the sector
-2%
0%
2%
4%
6%
8%
10%
12%
2011 2012E 2013E 2014E
Prysmian Nexans Sector
-30%
-20%
-10%
0%
10%
20%
30%
2011 2012E 2013E 2014E
Prysmian Nexans Sectors
Source: Company data, Credit Suisse estimates Source: Company data, Credit Suisse estimates
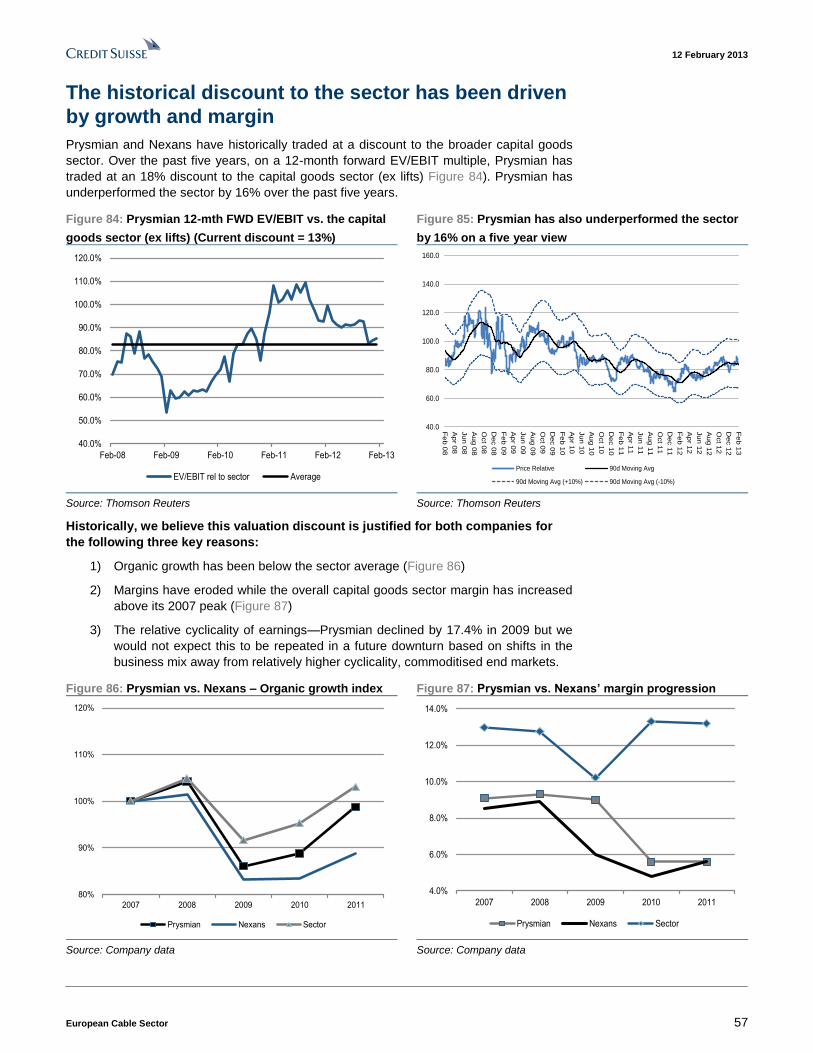
12 February 2013
European Cable Sector 57
The historical discount to the sector has been driven
by growth and margin
Prysmian and Nexans have historically traded at a discount to the broader capital goods
sector. Over the past five years, on a 12-month forward EV/EBIT multiple, Prysmian has
traded at an 18% discount to the capital goods sector (ex lifts) Figure 84). Prysmian has
underperformed the sector by 16% over the past five years.
Figure 84: Prysmian 12-mth FWD EV/EBIT vs. the capital
goods sector (ex lifts) (Current discount = 13%)
Figure 85: Prysmian has also underperformed the sector
by 16% on a five year view
40.0%
50.0%
60.0%
70.0%
80.0%
90.0%
100.0%
110.0%
120.0%
Feb-08 Feb-09 Feb-10 Feb-11 Feb-12 Feb-13
EV/EBIT rel to sector Average
40.0
60.0
80.0
100.0
120.0
140.0
160.0
Fe
b 0
8
Ap
r 08
Jun
08
Au
g 0
8
Oct 0
8
Dec 0
8
Fe
b 0
9
Ap
r 09
Jun
09
Au
g 0
9
Oct 0
9
Dec 0
9
Fe
b 1
0
Ap
r 10
Jun
10
Au
g 1
0
Oct 1
0
Dec 1
0
Fe
b 1
1
Ap
r 11
Jun
11
Au
g 1
1
Oct 1
1
Dec 1
1
Fe
b 1
2
Ap
r 12
Jun
12
Au
g 1
2
Oct 1
2
Dec 1
2
Fe
b 1
3
Price Relative 90d Moving Avg
90d Moving Avg (+10%) 90d Moving Avg (-10%)
Source: Thomson Reuters Source: Thomson Reuters
Historically, we believe this valuation discount is justified for both companies for
the following three key reasons:
1) Organic growth has been below the sector average (Figure 86)
2) Margins have eroded while the overall capital goods sector margin has increased
above its 2007 peak (Figure 87)
3) The relative cyclicality of earnings—Prysmian declined by 17.4% in 2009 but we
would not expect this to be repeated in a future downturn based on shifts in the
business mix away from relatively higher cyclicality, commoditised end markets.
Figure 86: Prysmian vs. Nexans – Organic growth index Figure 87: Prysmian vs. Nexans’ margin progression
80%
90%
100%
110%
120%
2007 2008 2009 2010 2011
Prysmian Nexans Sector
4.0%
6.0%
8.0%
10.0%
12.0%
14.0%
2007 2008 2009 2010 2011
Prysmian Nexans Sector
Source: Company data Source: Company data
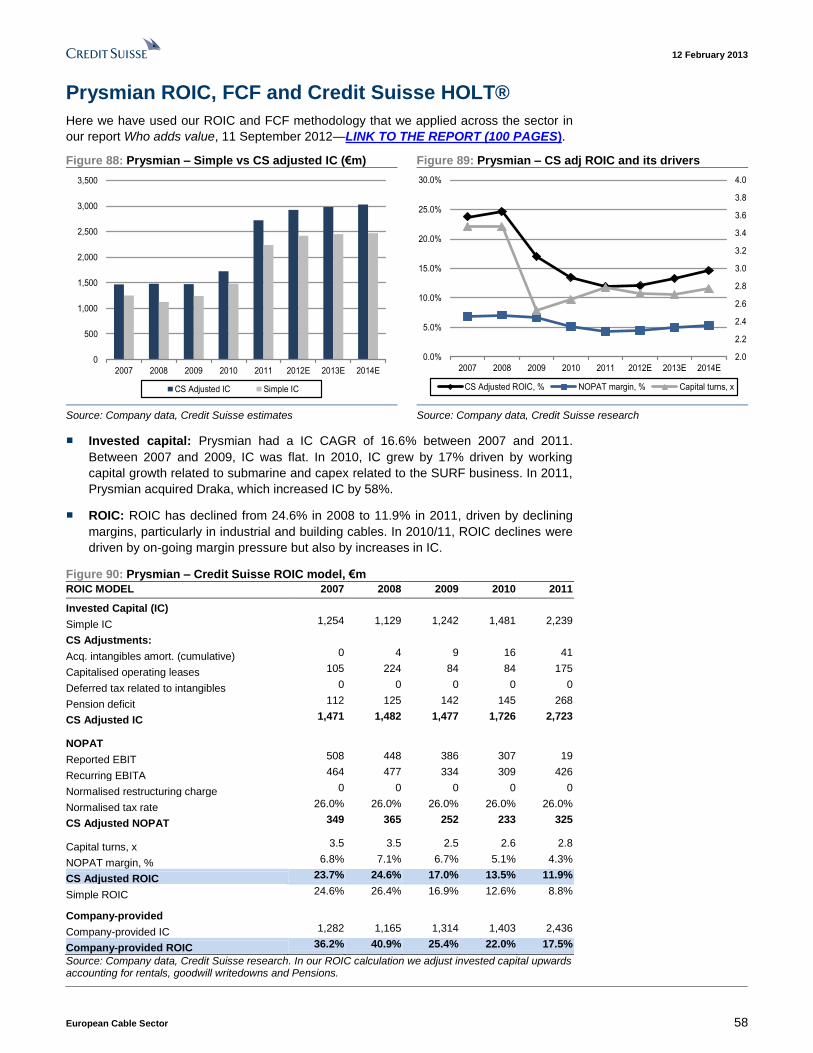
12 February 2013
European Cable Sector 58
Prysmian ROIC, FCF and Credit Suisse HOLT®
Here we have used our ROIC and FCF methodology that we applied across the sector in
our report Who adds value, 11 September 2012—LINK TO THE REPORT (100 PAGES).
Figure 88: Prysmian – Simple vs CS adjusted IC (€m) Figure 89: Prysmian – CS adj ROIC and its drivers
0
500
1,000
1,500
2,000
2,500
3,000
3,500
2007 2008 2009 2010 2011 2012E 2013E 2014E
CS Adjusted IC Simple IC
2.0
2.2
2.4
2.6
2.8
3.0
3.2
3.4
3.6
3.8
4.0
0.0%
5.0%
10.0%
15.0%
20.0%
25.0%
30.0%
2007 2008 2009 2010 2011 2012E 2013E 2014E
CS Adjusted ROIC, % NOPAT margin, % Capital turns, x
Source: Company data, Credit Suisse estimates Source: Company data, Credit Suisse research
■ Invested capital: Prysmian had a IC CAGR of 16.6% between 2007 and 2011.
Between 2007 and 2009, IC was flat. In 2010, IC grew by 17% driven by working
capital growth related to submarine and capex related to the SURF business. In 2011,
Prysmian acquired Draka, which increased IC by 58%.
■ ROIC: ROIC has declined from 24.6% in 2008 to 11.9% in 2011, driven by declining
margins, particularly in industrial and building cables. In 2010/11, ROIC declines were
driven by on-going margin pressure but also by increases in IC.
Figure 90: Prysmian – Credit Suisse ROIC model, €m
ROIC MODEL 2007 2008 2009 2010 2011
Invested Capital (IC)
Simple IC 1,254 1,129 1,242 1,481 2,239
CS Adjustments:
Acq. intangibles amort. (cumulative) 0 4 9 16 41
Capitalised operating leases 105 224 84 84 175
Deferred tax related to intangibles 0 0 0 0 0
Pension deficit 112 125 142 145 268
CS Adjusted IC 1,471 1,482 1,477 1,726 2,723
NOPAT
Reported EBIT 508 448 386 307 19
Recurring EBITA 464 477 334 309 426
Normalised restructuring charge 0 0 0 0 0
Normalised tax rate 26.0% 26.0% 26.0% 26.0% 26.0%
CS Adjusted NOPAT 349 365 252 233 325
Capital turns, x 3.5 3.5 2.5 2.6 2.8
NOPAT margin, % 6.8% 7.1% 6.7% 5.1% 4.3%
CS Adjusted ROIC 23.7% 24.6% 17.0% 13.5% 11.9%
Simple ROIC 24.6% 26.4% 16.9% 12.6% 8.8%
Company-provided
Company-provided IC 1,282 1,165 1,314 1,403 2,436
Company-provided ROIC 36.2% 40.9% 25.4% 22.0% 17.5%
Source: Company data, Credit Suisse research. In our ROIC calculation we adjust invested capital upwards accounting for rentals, goodwill writedowns and Pensions.
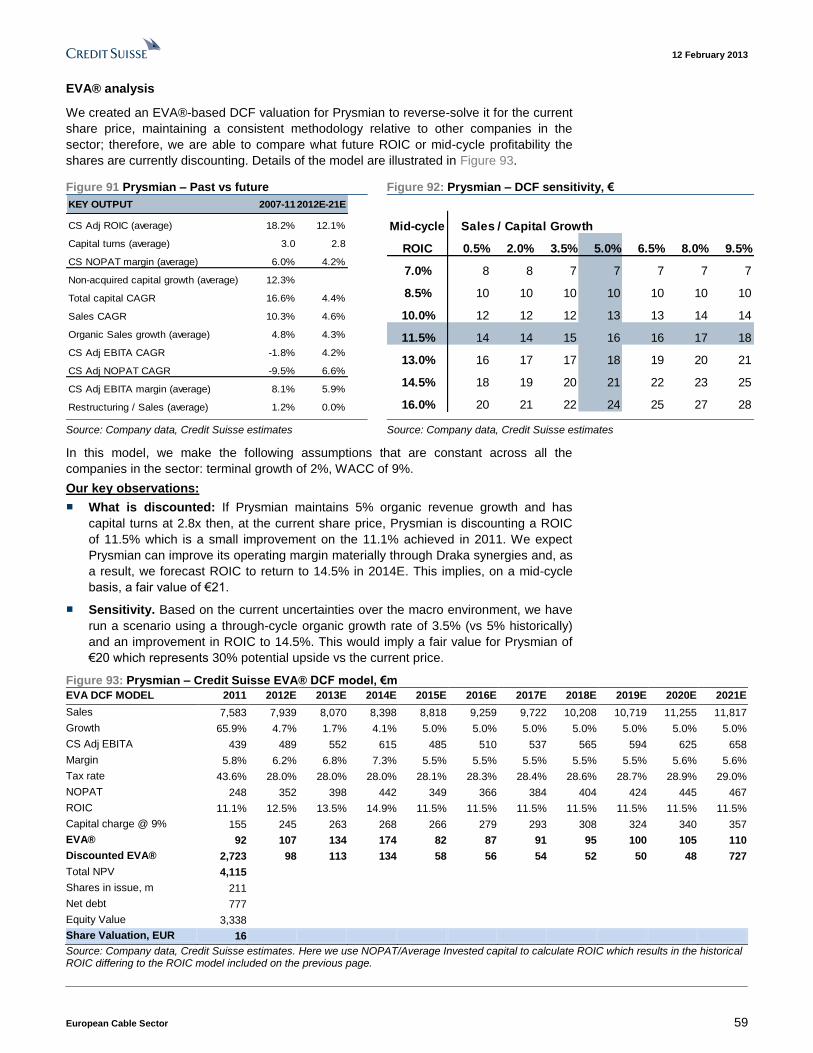
12 February 2013
European Cable Sector 59
EVA® analysis
We created an EVA®-based DCF valuation for Prysmian to reverse-solve it for the current
share price, maintaining a consistent methodology relative to other companies in the
sector; therefore, we are able to compare what future ROIC or mid-cycle profitability the
shares are currently discounting. Details of the model are illustrated in Figure 93.
Figure 91 Prysmian – Past vs future Figure 92: Prysmian – DCF sensitivity, €
KEY OUTPUT 2007-112012E-21E
CS Adj ROIC (average) 18.2% 12.1%
Capital turns (average) 3.0 2.8
CS NOPAT margin (average) 6.0% 4.2%
Non-acquired capital growth (average) 12.3%
Total capital CAGR 16.6% 4.4%
Sales CAGR 10.3% 4.6%
Organic Sales growth (average) 4.8% 4.3%
CS Adj EBITA CAGR -1.8% 4.2%
CS Adj NOPAT CAGR -9.5% 6.6%
CS Adj EBITA margin (average) 8.1% 5.9%
Restructuring / Sales (average) 1.2% 0.0%
Mid-cycle Sales / Capital Growth
ROIC 0.5% 2.0% 3.5% 5.0% 6.5% 8.0% 9.5%
7.0% 8 8 7 7 7 7 7
8.5% 10 10 10 10 10 10 10
10.0% 12 12 12 13 13 14 14
11.5% 14 14 15 16 16 17 18
13.0% 16 17 17 18 19 20 21
14.5% 18 19 20 21 22 23 25
16.0% 20 21 22 24 25 27 28
Source: Company data, Credit Suisse estimates Source: Company data, Credit Suisse estimates
In this model, we make the following assumptions that are constant across all the
companies in the sector: terminal growth of 2%, WACC of 9%.
Our key observations:
■ What is discounted: If Prysmian maintains 5% organic revenue growth and has
capital turns at 2.8x then, at the current share price, Prysmian is discounting a ROIC
of 11.5% which is a small improvement on the 11.1% achieved in 2011. We expect
Prysmian can improve its operating margin materially through Draka synergies and, as
a result, we forecast ROIC to return to 14.5% in 2014E. This implies, on a mid-cycle
basis, a fair value of €21.
■ Sensitivity. Based on the current uncertainties over the macro environment, we have
run a scenario using a through-cycle organic growth rate of 3.5% (vs 5% historically)
and an improvement in ROIC to 14.5%. This would imply a fair value for Prysmian of
€20 which represents 30% potential upside vs the current price.
Figure 93: Prysmian – Credit Suisse EVA® DCF model, €m
Source: Company data, Credit Suisse estimates. Here we use NOPAT/Average Invested capital to calculate ROIC which results in the historical ROIC differing to the ROIC model included on the previous page.
EVA DCF MODEL 2011 2012E 2013E 2014E 2015E 2016E 2017E 2018E 2019E 2020E 2021E
Sales 7,583 7,939 8,070 8,398 8,818 9,259 9,722 10,208 10,719 11,255 11,817
Growth 65.9% 4.7% 1.7% 4.1% 5.0% 5.0% 5.0% 5.0% 5.0% 5.0% 5.0%
CS Adj EBITA 439 489 552 615 485 510 537 565 594 625 658
Margin 5.8% 6.2% 6.8% 7.3% 5.5% 5.5% 5.5% 5.5% 5.5% 5.6% 5.6%
Tax rate 43.6% 28.0% 28.0% 28.0% 28.1% 28.3% 28.4% 28.6% 28.7% 28.9% 29.0%
NOPAT 248 352 398 442 349 366 384 404 424 445 467
ROIC 11.1% 12.5% 13.5% 14.9% 11.5% 11.5% 11.5% 11.5% 11.5% 11.5% 11.5%
Capital charge @ 9% 155 245 263 268 266 279 293 308 324 340 357
EVA® 92 107 134 174 82 87 91 95 100 105 110
Discounted EVA® 2,723 98 113 134 58 56 54 52 50 48 727
Total NPV 4,115
Shares in issue, m 211
Net debt 777
Equity Value 3,338
Share Valuation, EUR 16
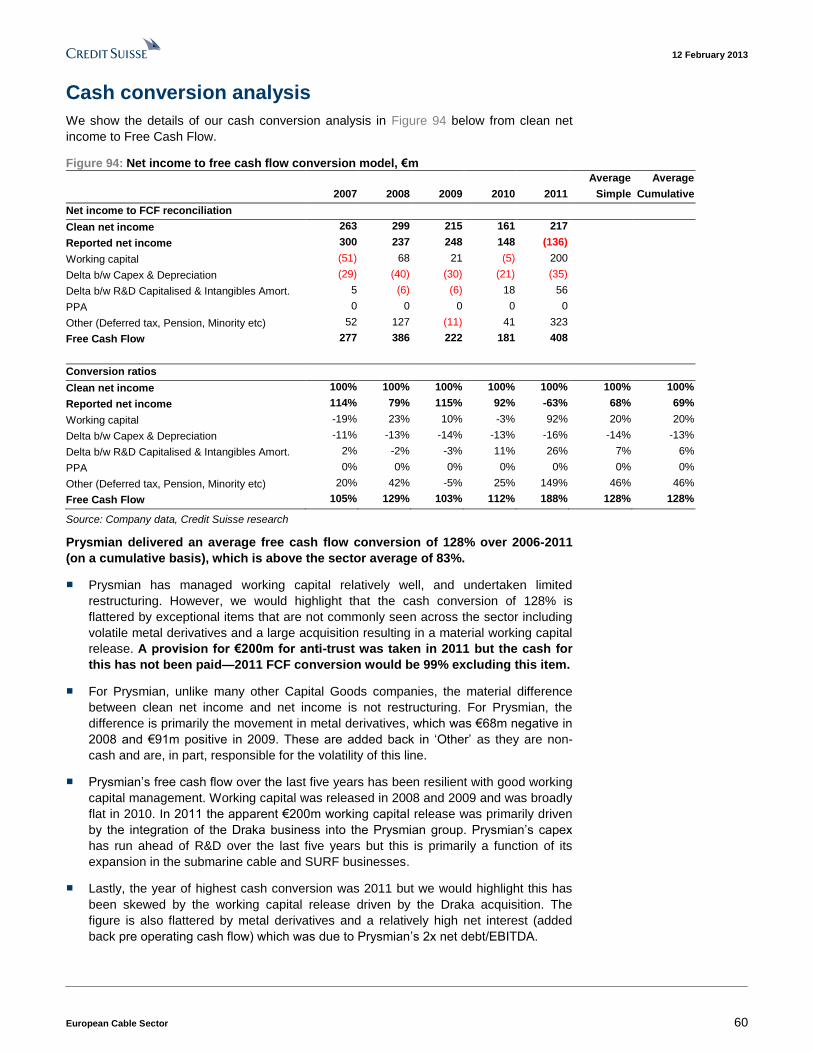
12 February 2013
European Cable Sector 60
Cash conversion analysis
We show the details of our cash conversion analysis in Figure 94 below from clean net
income to Free Cash Flow.
Figure 94: Net income to free cash flow conversion model, €m
Average Average
2007 2008 2009 2010 2011 Simple Cumulative
Net income to FCF reconciliation
Clean net income 263 299 215 161 217
Reported net income 300 237 248 148 (136)
Working capital (51) 68 21 (5) 200
Delta b/w Capex & Depreciation (29) (40) (30) (21) (35)
Delta b/w R&D Capitalised & Intangibles Amort. 5 (6) (6) 18 56
PPA 0 0 0 0 0
Other (Deferred tax, Pension, Minority etc) 52 127 (11) 41 323
Free Cash Flow 277 386 222 181 408
Conversion ratios
Clean net income 100% 100% 100% 100% 100% 100% 100%
Reported net income 114% 79% 115% 92% -63% 68% 69%
Working capital -19% 23% 10% -3% 92% 20% 20%
Delta b/w Capex & Depreciation -11% -13% -14% -13% -16% -14% -13%
Delta b/w R&D Capitalised & Intangibles Amort. 2% -2% -3% 11% 26% 7% 6%
PPA 0% 0% 0% 0% 0% 0% 0%
Other (Deferred tax, Pension, Minority etc) 20% 42% -5% 25% 149% 46% 46%
Free Cash Flow 105% 129% 103% 112% 188% 128% 128%
Source: Company data, Credit Suisse research
Prysmian delivered an average free cash flow conversion of 128% over 2006-2011
(on a cumulative basis), which is above the sector average of 83%.
■ Prysmian has managed working capital relatively well, and undertaken limited
restructuring. However, we would highlight that the cash conversion of 128% is
flattered by exceptional items that are not commonly seen across the sector including
volatile metal derivatives and a large acquisition resulting in a material working capital
release. A provision for €200m for anti-trust was taken in 2011 but the cash for
this has not been paid—2011 FCF conversion would be 99% excluding this item.
■ For Prysmian, unlike many other Capital Goods companies, the material difference
between clean net income and net income is not restructuring. For Prysmian, the
difference is primarily the movement in metal derivatives, which was €68m negative in
2008 and €91m positive in 2009. These are added back in ‘Other’ as they are non-
cash and are, in part, responsible for the volatility of this line.
■ Prysmian’s free cash flow over the last five years has been resilient with good working
capital management. Working capital was released in 2008 and 2009 and was broadly
flat in 2010. In 2011 the apparent €200m working capital release was primarily driven
by the integration of the Draka business into the Prysmian group. Prysmian’s capex
has run ahead of R&D over the last five years but this is primarily a function of its
expansion in the submarine cable and SURF businesses.
■ Lastly, the year of highest cash conversion was 2011 but we would highlight this has
been skewed by the working capital release driven by the Draka acquisition. The
figure is also flattered by metal derivatives and a relatively high net interest (added
back pre operating cash flow) which was due to Prysmian’s 2x net debt/EBITDA.
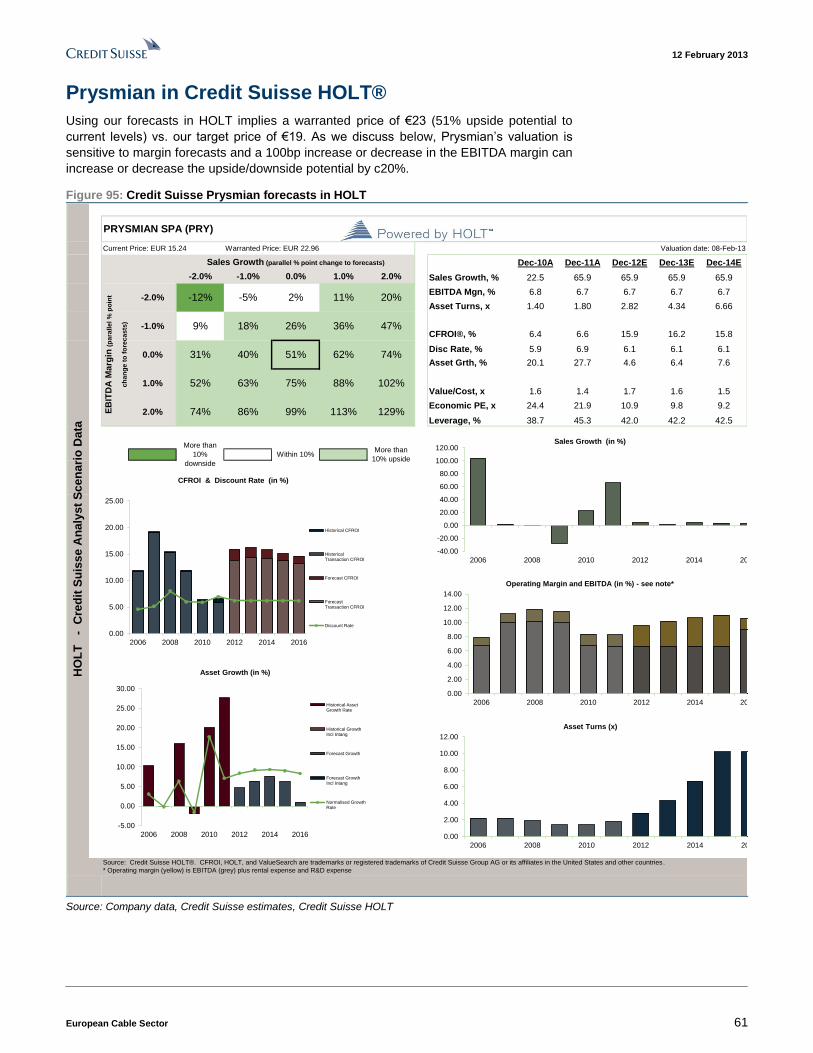
12 February 2013
European Cable Sector 61
Prysmian in Credit Suisse HOLT®
Using our forecasts in HOLT implies a warranted price of €23 (51% upside potential to
current levels) vs. our target price of €19. As we discuss below, Prysmian’s valuation is
sensitive to margin forecasts and a 100bp increase or decrease in the EBITDA margin can
increase or decrease the upside/downside potential by c20%.
Figure 95: Credit Suisse Prysmian forecasts in HOLT
Current Price: EUR 15.24 Warranted Price: EUR 22.96 Valuation date: 08-Feb-13
Sales Growth (parallel % point change to forecasts) Dec-10A Dec-11A Dec-12E Dec-13E Dec-14E
-2.0% -1.0% 0.0% 1.0% 2.0% Sales Growth, % 22.5 65.9 65.9 65.9 65.9
EBITDA Mgn, % 6.8 6.7 6.7 6.7 6.7
Asset Turns, x 1.40 1.80 2.82 4.34 6.66
CFROI®, % 6.4 6.6 15.9 16.2 15.8
Disc Rate, % 5.9 6.9 6.1 6.1 6.1
Asset Grth, % 20.1 27.7 4.6 6.4 7.6
Value/Cost, x 1.6 1.4 1.7 1.6 1.5
Economic PE, x 24.4 21.9 10.9 9.8 9.2
Leverage, % 38.7 45.3 42.0 42.2 42.5
More than
10%
downside
Within 10%More than
10% upside
Source: Credit Suisse HOLT®. CFROI, HOLT, and ValueSearch are trademarks or registered trademarks of Credit Suisse Group AG or its affiliates in the United States and other countries.
* Operating margin (yellow) is EBITDA (grey) plus rental expense and R&D expense
2.0% 74% 86% 99% 113%
1.0% 52% 63% 75% 88%
26% 36% 47%
129%
51% 62% 74%
102%
HO
LT
-
C
red
it S
uis
se
An
aly
st
Sc
en
ari
o D
ata
PRYSMIAN SPA (PRY)
EB
ITD
A M
arg
in (
pa
rall
el
% p
oin
t
ch
an
ge
to
fo
rec
as
ts)
-2.0% -12% -5% 2%
0.0% 31% 40%
11% 20%
-1.0% 9% 18%
-40.00
-20.00
0.00
20.00
40.00
60.00
80.00
100.00
120.00
2006 2008 2010 2012 2014 2016
Sales Growth (in %)
0.00
2.00
4.00
6.00
8.00
10.00
12.00
14.00
2006 2008 2010 2012 2014 2016
Operating Margin and EBITDA (in %) - see note*
0.00
2.00
4.00
6.00
8.00
10.00
12.00
2006 2008 2010 2012 2014 2016
Asset Turns (x)
0.00
5.00
10.00
15.00
20.00
25.00
2006 2008 2010 2012 2014 2016
Historical CFROI
HistoricalTransaction CFROI
Forecast CFROI
ForecastTransaction CFROI
Discount Rate
CFROI & Discount Rate (in %)
-5.00
0.00
5.00
10.00
15.00
20.00
25.00
30.00
2006 2008 2010 2012 2014 2016
Historical AssetGrowth Rate
Historical GrowthIncl Intang
Forecast Growth
Forecast GrowthIncl Intang
Normalised GrowthRate
Asset Growth (in %)
Source: Company data, Credit Suisse estimates, Credit Suisse HOLT
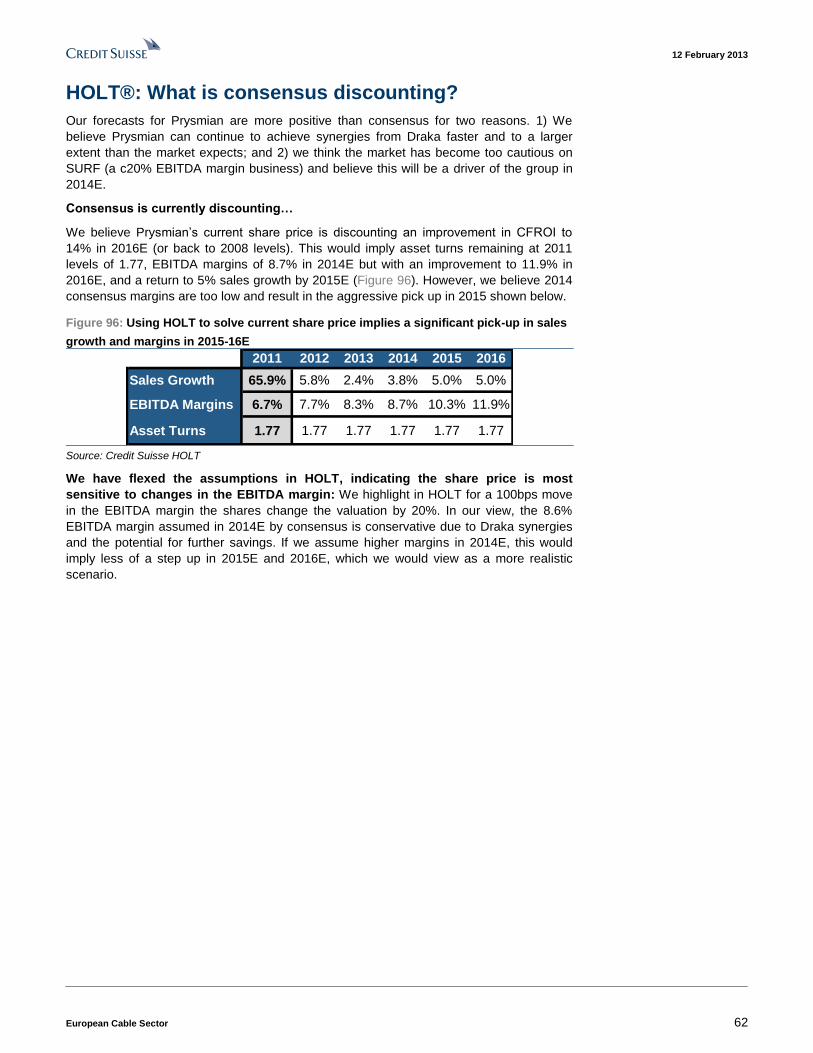
12 February 2013
European Cable Sector 62
HOLT®: What is consensus discounting?
Our forecasts for Prysmian are more positive than consensus for two reasons. 1) We
believe Prysmian can continue to achieve synergies from Draka faster and to a larger
extent than the market expects; and 2) we think the market has become too cautious on
SURF (a c20% EBITDA margin business) and believe this will be a driver of the group in
2014E.
Consensus is currently discounting…
We believe Prysmian’s current share price is discounting an improvement in CFROI to
14% in 2016E (or back to 2008 levels). This would imply asset turns remaining at 2011
levels of 1.77, EBITDA margins of 8.7% in 2014E but with an improvement to 11.9% in
2016E, and a return to 5% sales growth by 2015E (Figure 96). However, we believe 2014
consensus margins are too low and result in the aggressive pick up in 2015 shown below.
Figure 96: Using HOLT to solve current share price implies a significant pick-up in sales
growth and margins in 2015-16E
2011 2012 2013 2014 2015 2016
Sales Growth 65.9% 5.8% 2.4% 3.8% 5.0% 5.0%
EBITDA Margins 6.7% 7.7% 8.3% 8.7% 10.3% 11.9%
Asset Turns 1.77 1.77 1.77 1.77 1.77 1.77
Source: Credit Suisse HOLT
We have flexed the assumptions in HOLT, indicating the share price is most
sensitive to changes in the EBITDA margin: We highlight in HOLT for a 100bps move
in the EBITDA margin the shares change the valuation by 20%. In our view, the 8.6%
EBITDA margin assumed in 2014E by consensus is conservative due to Draka synergies
and the potential for further savings. If we assume higher margins in 2014E, this would
imply less of a step up in 2015E and 2016E, which we would view as a more realistic
scenario.
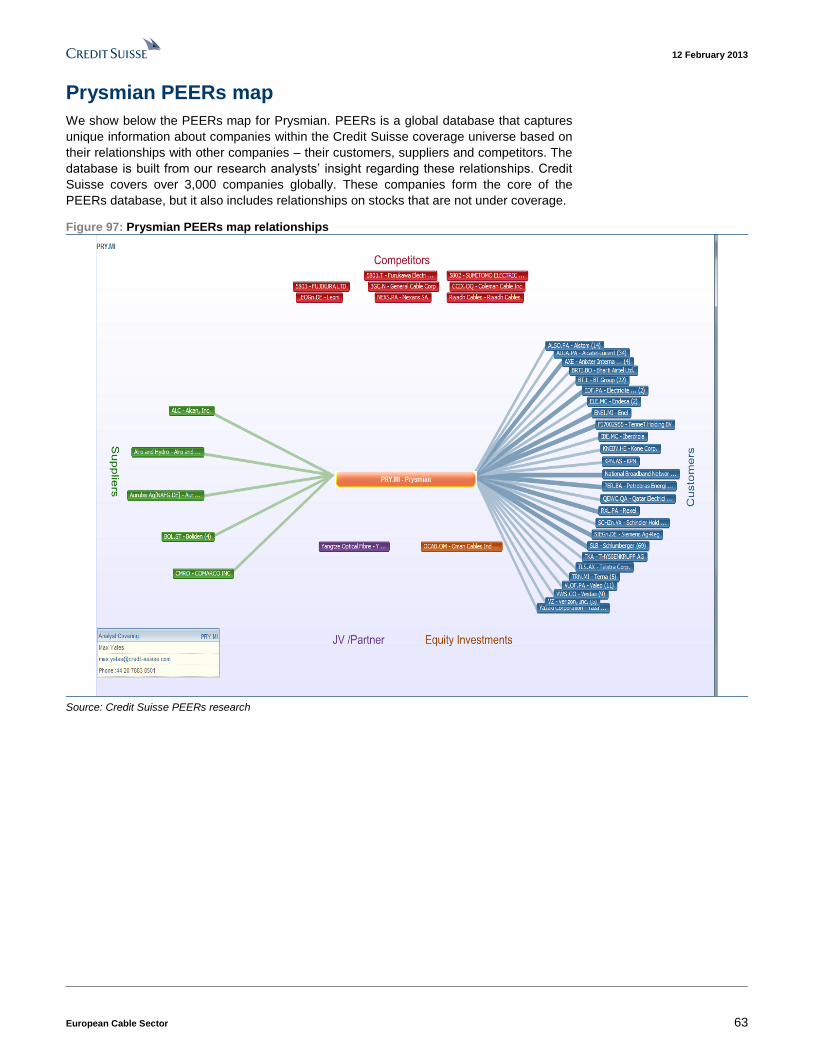
12 February 2013
European Cable Sector 63
Prysmian PEERs map
We show below the PEERs map for Prysmian. PEERs is a global database that captures
unique information about companies within the Credit Suisse coverage universe based on
their relationships with other companies – their customers, suppliers and competitors. The
database is built from our research analysts’ insight regarding these relationships. Credit
Suisse covers over 3,000 companies globally. These companies form the core of the
PEERs database, but it also includes relationships on stocks that are not under coverage.
Figure 97: Prysmian PEERs map relationships
Source: Credit Suisse PEERs research
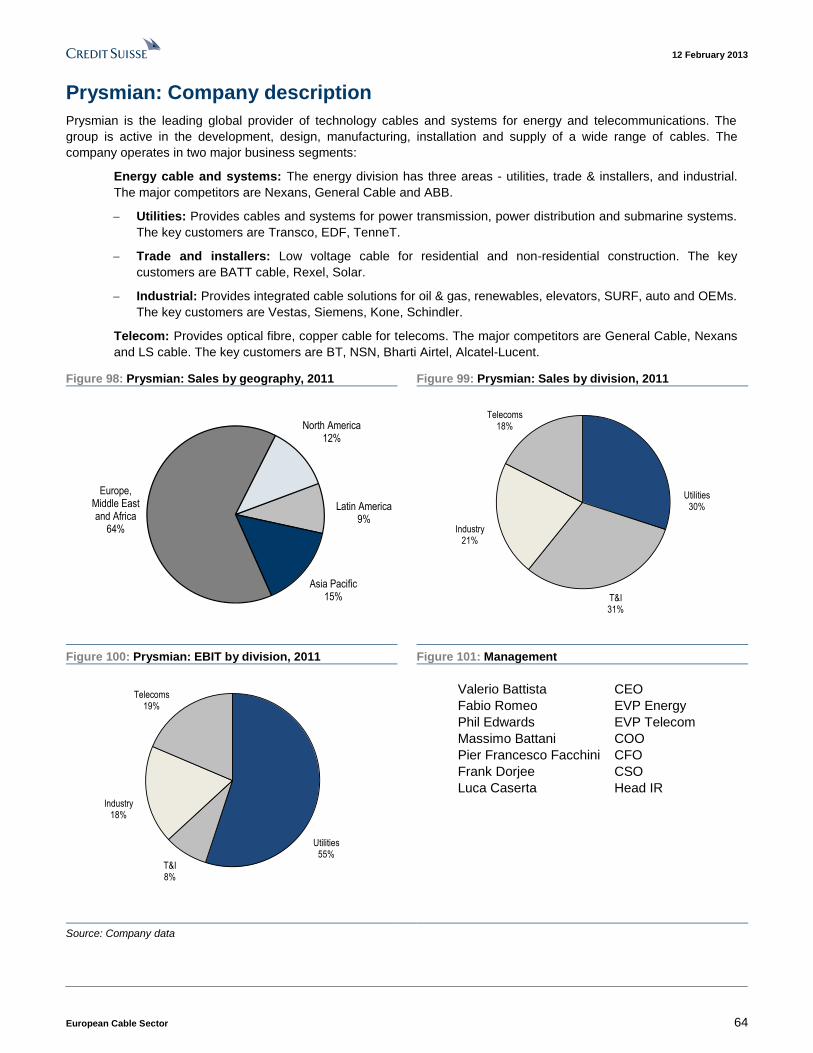
12 February 2013
European Cable Sector 64
Prysmian: Company description
Prysmian is the leading global provider of technology cables and systems for energy and telecommunications. The
group is active in the development, design, manufacturing, installation and supply of a wide range of cables. The
company operates in two major business segments:
Energy cable and systems: The energy division has three areas - utilities, trade & installers, and industrial.
The major competitors are Nexans, General Cable and ABB.
− Utilities: Provides cables and systems for power transmission, power distribution and submarine systems.
The key customers are Transco, EDF, TenneT.
− Trade and installers: Low voltage cable for residential and non-residential construction. The key
customers are BATT cable, Rexel, Solar.
− Industrial: Provides integrated cable solutions for oil & gas, renewables, elevators, SURF, auto and OEMs.
The key customers are Vestas, Siemens, Kone, Schindler.
Telecom: Provides optical fibre, copper cable for telecoms. The major competitors are General Cable, Nexans
and LS cable. The key customers are BT, NSN, Bharti Airtel, Alcatel-Lucent.
Figure 98: Prysmian: Sales by geography, 2011 Figure 99: Prysmian: Sales by division, 2011
Latin America9%
Asia Pacific15%
Europe, Middle East and Africa
64%
North America12%
Utilities30%
T&I31%
Industry21%
Telecoms18%
Figure 100: Prysmian: EBIT by division, 2011 Figure 101: Management
Utilities55%
T&I8%
Industry18%
Telecoms19%
Valerio Battista CEO
Fabio Romeo EVP Energy
Phil Edwards EVP Telecom
Massimo Battani COO
Pier Francesco Facchini CFO
Frank Dorjee CSO
Luca Caserta Head IR
Source: Company data
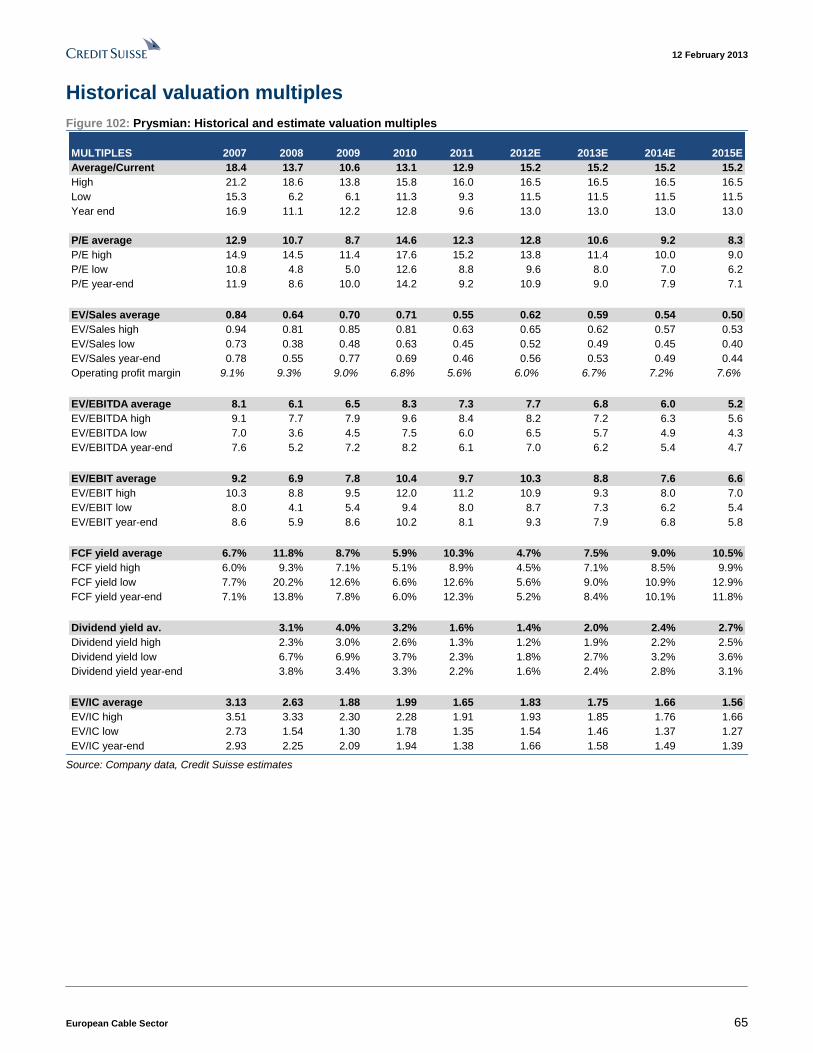
12 February 2013
European Cable Sector 65
Historical valuation multiples
Figure 102: Prysmian: Historical and estimate valuation multiples
MULTIPLES 2007 2008 2009 2010 2011 2012E 2013E 2014E 2015E
Average/Current 18.4 13.7 10.6 13.1 12.9 15.2 15.2 15.2 15.2
High 21.2 18.6 13.8 15.8 16.0 16.5 16.5 16.5 16.5
Low 15.3 6.2 6.1 11.3 9.3 11.5 11.5 11.5 11.5
Year end 16.9 11.1 12.2 12.8 9.6 13.0 13.0 13.0 13.0
P/E average 12.9 10.7 8.7 14.6 12.3 12.8 10.6 9.2 8.3
P/E high 14.9 14.5 11.4 17.6 15.2 13.8 11.4 10.0 9.0
P/E low 10.8 4.8 5.0 12.6 8.8 9.6 8.0 7.0 6.2
P/E year-end 11.9 8.6 10.0 14.2 9.2 10.9 9.0 7.9 7.1
EV/Sales average 0.84 0.64 0.70 0.71 0.55 0.62 0.59 0.54 0.50
EV/Sales high 0.94 0.81 0.85 0.81 0.63 0.65 0.62 0.57 0.53
EV/Sales low 0.73 0.38 0.48 0.63 0.45 0.52 0.49 0.45 0.40
EV/Sales year-end 0.78 0.55 0.77 0.69 0.46 0.56 0.53 0.49 0.44
Operating profit margin 9.1% 9.3% 9.0% 6.8% 5.6% 6.0% 6.7% 7.2% 7.6%
EV/EBITDA average 8.1 6.1 6.5 8.3 7.3 7.7 6.8 6.0 5.2
EV/EBITDA high 9.1 7.7 7.9 9.6 8.4 8.2 7.2 6.3 5.6
EV/EBITDA low 7.0 3.6 4.5 7.5 6.0 6.5 5.7 4.9 4.3
EV/EBITDA year-end 7.6 5.2 7.2 8.2 6.1 7.0 6.2 5.4 4.7
EV/EBIT average 9.2 6.9 7.8 10.4 9.7 10.3 8.8 7.6 6.6
EV/EBIT high 10.3 8.8 9.5 12.0 11.2 10.9 9.3 8.0 7.0
EV/EBIT low 8.0 4.1 5.4 9.4 8.0 8.7 7.3 6.2 5.4
EV/EBIT year-end 8.6 5.9 8.6 10.2 8.1 9.3 7.9 6.8 5.8
FCF yield average 6.7% 11.8% 8.7% 5.9% 10.3% 4.7% 7.5% 9.0% 10.5%
FCF yield high 6.0% 9.3% 7.1% 5.1% 8.9% 4.5% 7.1% 8.5% 9.9%
FCF yield low 7.7% 20.2% 12.6% 6.6% 12.6% 5.6% 9.0% 10.9% 12.9%
FCF yield year-end 7.1% 13.8% 7.8% 6.0% 12.3% 5.2% 8.4% 10.1% 11.8%
Dividend yield av. 3.1% 4.0% 3.2% 1.6% 1.4% 2.0% 2.4% 2.7%
Dividend yield high 2.3% 3.0% 2.6% 1.3% 1.2% 1.9% 2.2% 2.5%
Dividend yield low 6.7% 6.9% 3.7% 2.3% 1.8% 2.7% 3.2% 3.6%
Dividend yield year-end 3.8% 3.4% 3.3% 2.2% 1.6% 2.4% 2.8% 3.1%
EV/IC average 3.13 2.63 1.88 1.99 1.65 1.83 1.75 1.66 1.56
EV/IC high 3.51 3.33 2.30 2.28 1.91 1.93 1.85 1.76 1.66
EV/IC low 2.73 1.54 1.30 1.78 1.35 1.54 1.46 1.37 1.27
EV/IC year-end 2.93 2.25 2.09 1.94 1.38 1.66 1.58 1.49 1.39 Source: Company data, Credit Suisse estimates
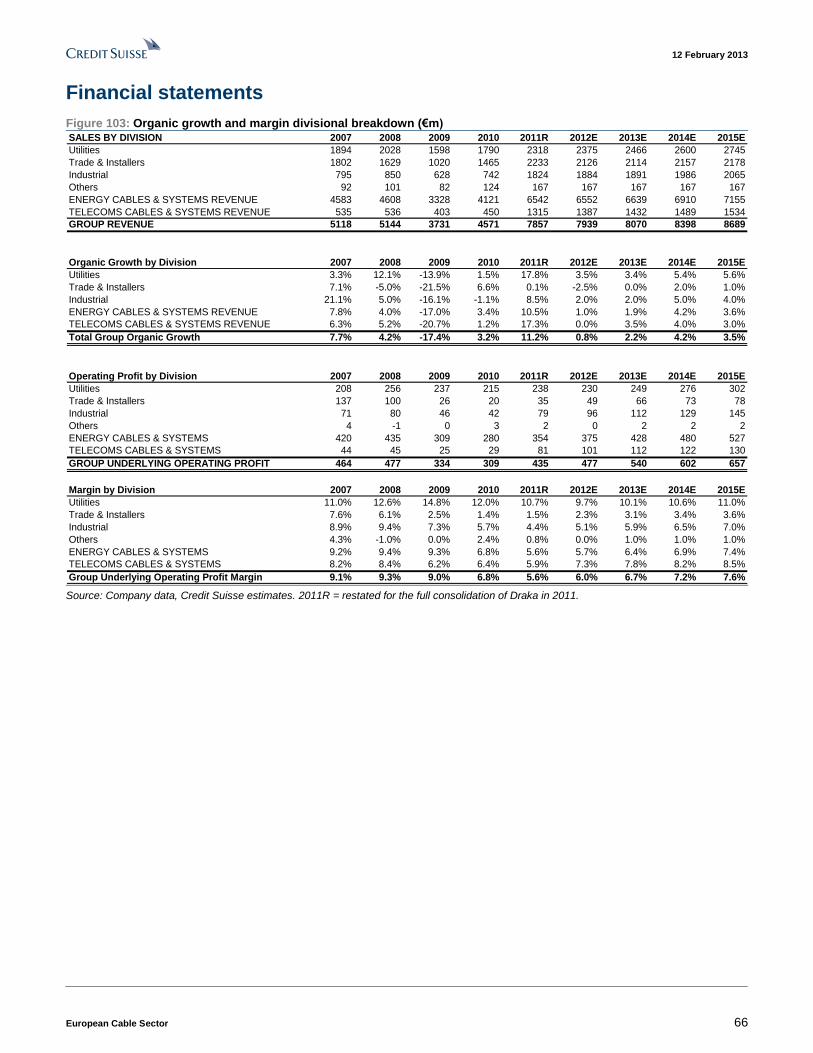
12 February 2013
European Cable Sector 66
Financial statements
Figure 103: Organic growth and margin divisional breakdown (€m) SALES BY DIVISION 2007 2008 2009 2010 2011R 2012E 2013E 2014E 2015E
Utilities 1894 2028 1598 1790 2318 2375 2466 2600 2745
Trade & Installers 1802 1629 1020 1465 2233 2126 2114 2157 2178
Industrial 795 850 628 742 1824 1884 1891 1986 2065
Others 92 101 82 124 167 167 167 167 167
ENERGY CABLES & SYSTEMS REVENUE 4583 4608 3328 4121 6542 6552 6639 6910 7155
TELECOMS CABLES & SYSTEMS REVENUE 535 536 403 450 1315 1387 1432 1489 1534
GROUP REVENUE 5118 5144 3731 4571 7857 7939 8070 8398 8689
Organic Growth by Division 2007 2008 2009 2010 2011R 2012E 2013E 2014E 2015E
Utilities 3.3% 12.1% -13.9% 1.5% 17.8% 3.5% 3.4% 5.4% 5.6%
Trade & Installers 7.1% -5.0% -21.5% 6.6% 0.1% -2.5% 0.0% 2.0% 1.0%
Industrial 21.1% 5.0% -16.1% -1.1% 8.5% 2.0% 2.0% 5.0% 4.0%
ENERGY CABLES & SYSTEMS REVENUE 7.8% 4.0% -17.0% 3.4% 10.5% 1.0% 1.9% 4.2% 3.6%
TELECOMS CABLES & SYSTEMS REVENUE 6.3% 5.2% -20.7% 1.2% 17.3% 0.0% 3.5% 4.0% 3.0%
Total Group Organic Growth 7.7% 4.2% -17.4% 3.2% 11.2% 0.8% 2.2% 4.2% 3.5%
Operating Profit by Division 2007 2008 2009 2010 2011R 2012E 2013E 2014E 2015E
Utilities 208 256 237 215 238 230 249 276 302
Trade & Installers 137 100 26 20 35 49 66 73 78
Industrial 71 80 46 42 79 96 112 129 145
Others 4 -1 0 3 2 0 2 2 2
ENERGY CABLES & SYSTEMS 420 435 309 280 354 375 428 480 527
TELECOMS CABLES & SYSTEMS 44 45 25 29 81 101 112 122 130
GROUP UNDERLYING OPERATING PROFIT 464 477 334 309 435 477 540 602 657
Margin by Division 2007 2008 2009 2010 2011R 2012E 2013E 2014E 2015E
Utilities 11.0% 12.6% 14.8% 12.0% 10.7% 9.7% 10.1% 10.6% 11.0%
Trade & Installers 7.6% 6.1% 2.5% 1.4% 1.5% 2.3% 3.1% 3.4% 3.6%
Industrial 8.9% 9.4% 7.3% 5.7% 4.4% 5.1% 5.9% 6.5% 7.0%
Others 4.3% -1.0% 0.0% 2.4% 0.8% 0.0% 1.0% 1.0% 1.0%
ENERGY CABLES & SYSTEMS 9.2% 9.4% 9.3% 6.8% 5.6% 5.7% 6.4% 6.9% 7.4%
TELECOMS CABLES & SYSTEMS 8.2% 8.4% 6.2% 6.4% 5.9% 7.3% 7.8% 8.2% 8.5%
Group Underlying Operating Profit Margin 9.1% 9.3% 9.0% 6.8% 5.6% 6.0% 6.7% 7.2% 7.6% Source: Company data, Credit Suisse estimates. 2011R = restated for the full consolidation of Draka in 2011.
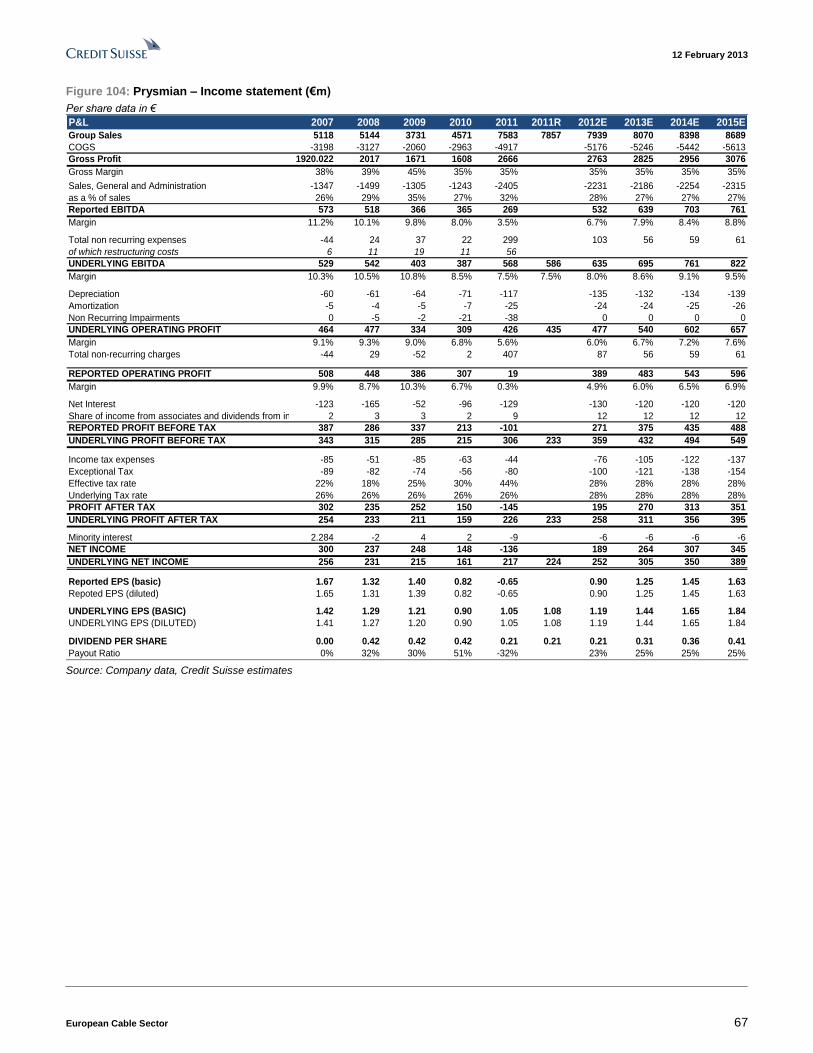
12 February 2013
European Cable Sector 67
Figure 104: Prysmian – Income statement (€m)
Per share data in €
P&L 2007 2008 2009 2010 2011 2011R 2012E 2013E 2014E 2015E
Group Sales 5118 5144 3731 4571 7583 7857 7939 8070 8398 8689
COGS -3198 -3127 -2060 -2963 -4917 -5176 -5246 -5442 -5613
Gross Profit 1920.022 2017 1671 1608 2666 2763 2825 2956 3076
Gross Margin 38% 39% 45% 35% 35% 35% 35% 35% 35%
Sales, General and Administration -1347 -1499 -1305 -1243 -2405 -2231 -2186 -2254 -2315
as a % of sales 26% 29% 35% 27% 32% 28% 27% 27% 27%
Reported EBITDA 573 518 366 365 269 532 639 703 761
Margin 11.2% 10.1% 9.8% 8.0% 3.5% 6.7% 7.9% 8.4% 8.8%
Total non recurring expenses -44 24 37 22 299 103 56 59 61
of which restructuring costs 6 11 19 11 56
UNDERLYING EBITDA 529 542 403 387 568 586 635 695 761 822
Margin 10.3% 10.5% 10.8% 8.5% 7.5% 7.5% 8.0% 8.6% 9.1% 9.5%
Depreciation -60 -61 -64 -71 -117 -135 -132 -134 -139
Amortization -5 -4 -5 -7 -25 -24 -24 -25 -26
Non Recurring Impairments 0 -5 -2 -21 -38 0 0 0 0
UNDERLYING OPERATING PROFIT 464 477 334 309 426 435 477 540 602 657
Margin 9.1% 9.3% 9.0% 6.8% 5.6% 6.0% 6.7% 7.2% 7.6%
Total non-recurring charges -44 29 -52 2 407 87 56 59 61
REPORTED OPERATING PROFIT 508 448 386 307 19 389 483 543 596
Margin 9.9% 8.7% 10.3% 6.7% 0.3% 4.9% 6.0% 6.5% 6.9%
Net Interest -123 -165 -52 -96 -129 -130 -120 -120 -120
Share of income from associates and dividends from investments2 3 3 2 9 12 12 12 12
REPORTED PROFIT BEFORE TAX 387 286 337 213 -101 271 375 435 488
UNDERLYING PROFIT BEFORE TAX 343 315 285 215 306 233 359 432 494 549
Income tax expenses -85 -51 -85 -63 -44 -76 -105 -122 -137
Exceptional Tax -89 -82 -74 -56 -80 -100 -121 -138 -154
Effective tax rate 22% 18% 25% 30% 44% 28% 28% 28% 28%
Underlying Tax rate 26% 26% 26% 26% 26% 28% 28% 28% 28%
PROFIT AFTER TAX 302 235 252 150 -145 195 270 313 351
UNDERLYING PROFIT AFTER TAX 254 233 211 159 226 233 258 311 356 395
Minority interest 2.284 -2 4 2 -9 -6 -6 -6 -6
NET INCOME 300 237 248 148 -136 189 264 307 345
UNDERLYING NET INCOME 256 231 215 161 217 224 252 305 350 389
Reported EPS (basic) 1.67 1.32 1.40 0.82 -0.65 0.90 1.25 1.45 1.63
Repoted EPS (diluted) 1.65 1.31 1.39 0.82 -0.65 0.90 1.25 1.45 1.63
UNDERLYING EPS (BASIC) 1.42 1.29 1.21 0.90 1.05 1.08 1.19 1.44 1.65 1.84
UNDERLYING EPS (DILUTED) 1.41 1.27 1.20 0.90 1.05 1.08 1.19 1.44 1.65 1.84
DIVIDEND PER SHARE 0.00 0.42 0.42 0.42 0.21 0.21 0.21 0.31 0.36 0.41
Payout Ratio 0% 32% 30% 51% -32% 23% 25% 25% 25% Source: Company data, Credit Suisse estimates

12 February 2013
European Cable Sector 68
Figure 105: Prysmian - Balance sheet (€m)
Balance Sheet 2007 2008 2009 2010 2011 2012E 2013E 2014E 2015E
Inventories 583 514 443 600 929 994 1049 1099 1145
Trade receivables 831 732 622 764 1197 0 0 0 0
Other current receivables 277 301 359 397 516 0 0 0 0
Total Receivables 1108 1033 981 1161 1713 1826 1856 1932 1998
Financial assets held for trading 40 38 42 66 80 80 80 80 80
Derivatives 25 46 44 52 28 28 28 28 28
Available of sales financial assets 0 0 0 142 0 0 0 0 0
cash and cash equivalents 252 492 492 630 727 720 893 1107 1353
Asset held for sale 0 26 28 9 5 5 5 5 5
CURRENT ASSETS 2008 2149 2030 2660 3482 3653 3911 4251 4609
Property,plant and equipment 838 806 872 949 1539 1562 1559 1559 1559
Intangible assets 21 31 43 59 618 651 627 601 575
Investment in associates 9 9 9 9 87 87 87 87 87
Available for sale financial assets 13 10 6 3 6 6 6 6 6
Derivatives 32 21 9 14 2 2 2 2 2
Deferred tax assets 29 44 47 30 97 97 97 97 97
Trade receivables 2 2 0 0 0 0 0 0 0
Other non-current receivables 34 26 28 41 52 52 52 52 52
NON-CURRENT ASSETS 978 949 1014 1105 2401 2456 2430 2404 2378
TOTAL ASSETS 2986 3098 3044 3765 5883 6109 6341 6655 6988
Short-term borrowings 61 189 152 201 982 410 410 410 410
Trade payables 738 650 561 862 1421 0 0 0 0
Other current payables 356 346 326 355 571 0 0 0 0
Total payables 1094 996 887 1217 1992 2045 2072 2150 2217
Derivatives 29 120 46 28 71 71 71 71 71
Provisions for risks and charges 75 67 62 62 295 295 295 295 295
Tax payables 35 42 45 46 50 50 50 50 50
CURRENT LIABILITIES 1295 1414 1192 1554 3390 2871 2898 2976 3043
Long-term borrowings 990 969 884 1111 880 1474 1474 1474 1474
Other non-current payables 43 30 13 20 32 32 32 32 32
Provisions for risks and charges 27 34 41 44 67 67 67 67 67
Derivatives 2 33 7 48 36 36 36 36 36
Defered tax liabilities 62 30 67 44 106 106 106 106 106
Employee benefits liability 112 125 142 145 268 268 268 268 268
NON CURRENT LIABILITIES 1237 1221 1154 1412 1389 1983 1983 1983 1983
TOTAL LIABILITIES 2532 2635 2346 2966 4779 4854 4881 4959 5026
SHAREHOLDERS EQUITY (GROUP) 433 447 677 756 1042 1188 1386 1616 1875
Share capital 18 18 18 18 21 21 21 21 21
Reserves 114 192 411 590 1157 1021 1167 1365 1595
Net income/(loss) for the period 300 237 248 148 -136 189 264 307 345
Dividend 0 0 0 0 0 -44 -66 -77 -86
SHAREHOLDERS EQUITY (MINORITY) 21 16 21 43 62 68 74 80 86
Share capital and reserves 19 18 17 41 71 62 68 74 80
Profit/ (loss) for the year 2 -2 4 2 -9 -6 -6 -6 -6
Total shareholders equity 454 463 698 799 1104 1256 1460 1696 1961
TOTAL EQUITY & LIABILITIES 2986 3098 3044 3765 5883 6109 6341 6655 6988 Source: Company data, Credit Suisse estimates
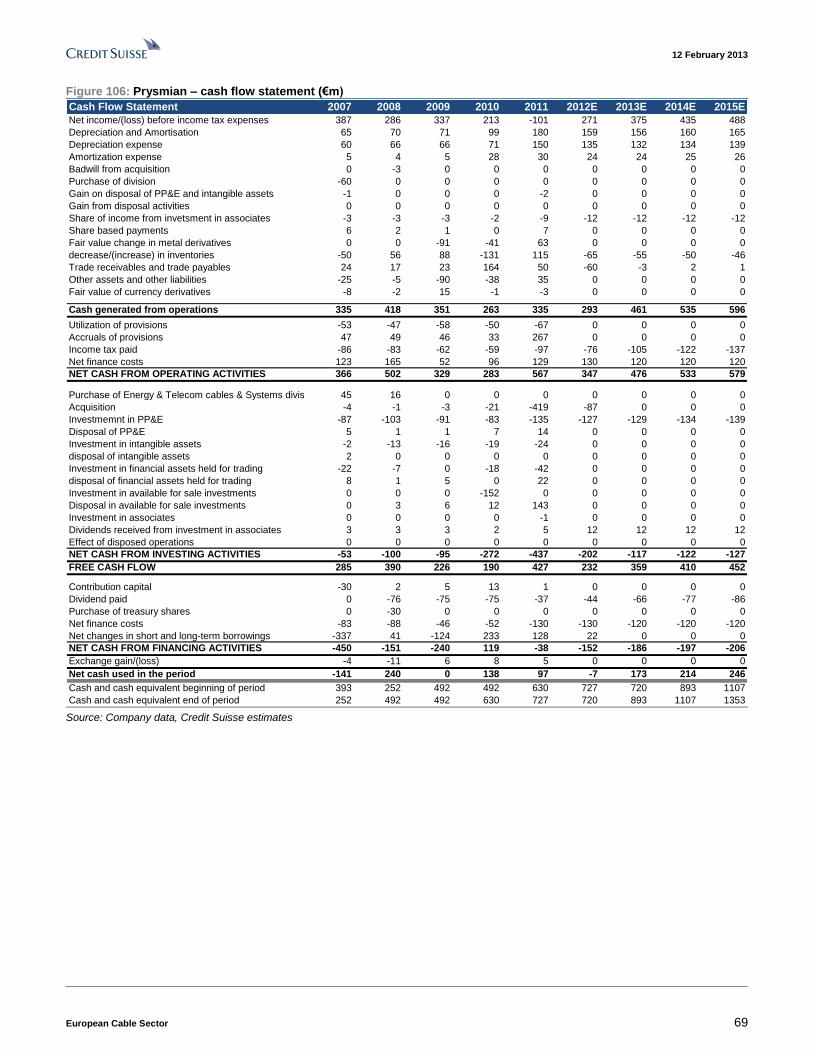
12 February 2013
European Cable Sector 69
Figure 106: Prysmian – cash flow statement (€m)
Cash Flow Statement 2007 2008 2009 2010 2011 2012E 2013E 2014E 2015E
Net income/(loss) before income tax expenses 387 286 337 213 -101 271 375 435 488
Depreciation and Amortisation 65 70 71 99 180 159 156 160 165
Depreciation expense 60 66 66 71 150 135 132 134 139
Amortization expense 5 4 5 28 30 24 24 25 26
Badwill from acquisition 0 -3 0 0 0 0 0 0 0
Purchase of division -60 0 0 0 0 0 0 0 0
Gain on disposal of PP&E and intangible assets -1 0 0 0 -2 0 0 0 0
Gain from disposal activities 0 0 0 0 0 0 0 0 0
Share of income from invetsment in associates -3 -3 -3 -2 -9 -12 -12 -12 -12
Share based payments 6 2 1 0 7 0 0 0 0
Fair value change in metal derivatives 0 0 -91 -41 63 0 0 0 0
decrease/(increase) in inventories -50 56 88 -131 115 -65 -55 -50 -46
Trade receivables and trade payables 24 17 23 164 50 -60 -3 2 1
Other assets and other liabilities -25 -5 -90 -38 35 0 0 0 0
Fair value of currency derivatives -8 -2 15 -1 -3 0 0 0 0
Cash generated from operations 335 418 351 263 335 293 461 535 596
Utilization of provisions -53 -47 -58 -50 -67 0 0 0 0
Accruals of provisions 47 49 46 33 267 0 0 0 0
Income tax paid -86 -83 -62 -59 -97 -76 -105 -122 -137
Net finance costs 123 165 52 96 129 130 120 120 120
NET CASH FROM OPERATING ACTIVITIES 366 502 329 283 567 347 476 533 579
Purchase of Energy & Telecom cables & Systems division 45 16 0 0 0 0 0 0 0
Acquisition -4 -1 -3 -21 -419 -87 0 0 0
Investmemnt in PP&E -87 -103 -91 -83 -135 -127 -129 -134 -139
Disposal of PP&E 5 1 1 7 14 0 0 0 0
Investment in intangible assets -2 -13 -16 -19 -24 0 0 0 0
disposal of intangible assets 2 0 0 0 0 0 0 0 0
Investment in financial assets held for trading -22 -7 0 -18 -42 0 0 0 0
disposal of financial assets held for trading 8 1 5 0 22 0 0 0 0
Investment in available for sale investments 0 0 0 -152 0 0 0 0 0
Disposal in available for sale investments 0 3 6 12 143 0 0 0 0
Investment in associates 0 0 0 0 -1 0 0 0 0
Dividends received from investment in associates 3 3 3 2 5 12 12 12 12
Effect of disposed operations 0 0 0 0 0 0 0 0 0
NET CASH FROM INVESTING ACTIVITIES -53 -100 -95 -272 -437 -202 -117 -122 -127
FREE CASH FLOW 285 390 226 190 427 232 359 410 452
Contribution capital -30 2 5 13 1 0 0 0 0
Dividend paid 0 -76 -75 -75 -37 -44 -66 -77 -86
Purchase of treasury shares 0 -30 0 0 0 0 0 0 0
Net finance costs -83 -88 -46 -52 -130 -130 -120 -120 -120
Net changes in short and long-term borrowings -337 41 -124 233 128 22 0 0 0
NET CASH FROM FINANCING ACTIVITIES -450 -151 -240 119 -38 -152 -186 -197 -206
Exchange gain/(loss) -4 -11 6 8 5 0 0 0 0
Net cash used in the period -141 240 0 138 97 -7 173 214 246
Cash and cash equivalent beginning of period 393 252 492 492 630 727 720 893 1107
Cash and cash equivalent end of period 252 492 492 630 727 720 893 1107 1353 Source: Company data, Credit Suisse estimates
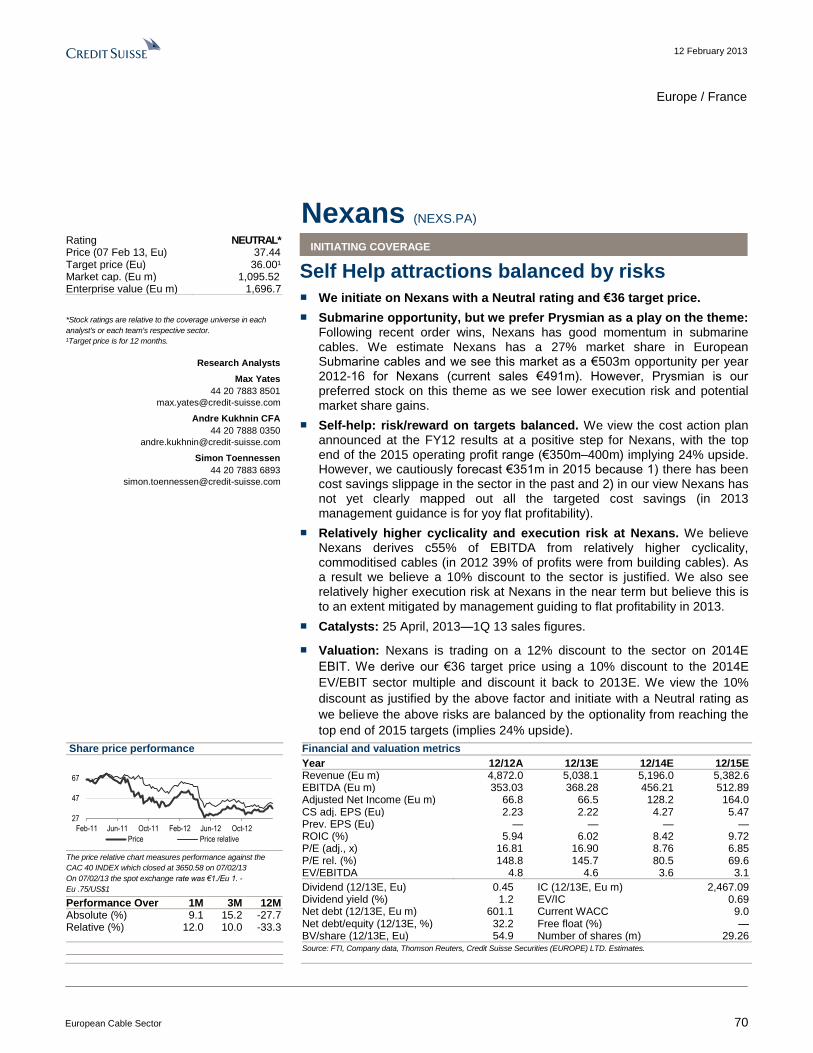
12 February 2013
European Cable Sector 70
Europe / France
Nexans (NEXS.PA) INITIATING COVERAGE
Self Help attractions balanced by risks
■ We initiate on Nexans with a Neutral rating and €36 target price.
■ Submarine opportunity, but we prefer Prysmian as a play on the theme: Following recent order wins, Nexans has good momentum in submarine cables. We estimate Nexans has a 27% market share in European Submarine cables and we see this market as a €503m opportunity per year 2012-16 for Nexans (current sales €491m). However, Prysmian is our preferred stock on this theme as we see lower execution risk and potential market share gains.
■ Self-help: risk/reward on targets balanced. We view the cost action plan announced at the FY12 results at a positive step for Nexans, with the top end of the 2015 operating profit range (€350m–400m) implying 24% upside. However, we cautiously forecast €351m in 2015 because 1) there has been cost savings slippage in the sector in the past and 2) in our view Nexans has not yet clearly mapped out all the targeted cost savings (in 2013 management guidance is for yoy flat profitability).
■ Relatively higher cyclicality and execution risk at Nexans. We believe Nexans derives c55% of EBITDA from relatively higher cyclicality, commoditised cables (in 2012 39% of profits were from building cables). As a result we believe a 10% discount to the sector is justified. We also see relatively higher execution risk at Nexans in the near term but believe this is
to an extent mitigated by management guiding to flat profitability in 2013.
■ Catalysts: 25 April, 2013—1Q 13 sales figures.
■ Valuation: Nexans is trading on a 12% discount to the sector on 2014E
EBIT. We derive our €36 target price using a 10% discount to the 2014E
EV/EBIT sector multiple and discount it back to 2013E. We view the 10%
discount as justified by the above factor and initiate with a Neutral rating as
we believe the above risks are balanced by the optionality from reaching the
top end of 2015 targets (implies 24% upside).
Share price performance
27
47
67
Feb-11 Jun-11 Oct-11 Feb-12 Jun-12 Oct-12
Price Price relative
The price relative chart measures performance against the
CAC 40 INDEX which closed at 3650.58 on 07/02/13
On 07/02/13 the spot exchange rate was €1./Eu 1. -
Eu .75/US$1
Performance Over 1M 3M 12M Absolute (%) 9.1 15.2 -27.7 Relative (%) 12.0 10.0 -33.3
Financial and valuation metrics
Year 12/12A 12/13E 12/14E 12/15E Revenue (Eu m) 4,872.0 5,038.1 5,196.0 5,382.6 EBITDA (Eu m) 353.03 368.28 456.21 512.89 Adjusted Net Income (Eu m) 66.8 66.5 128.2 164.0 CS adj. EPS (Eu) 2.23 2.22 4.27 5.47 Prev. EPS (Eu) — — — — ROIC (%) 5.94 6.02 8.42 9.72 P/E (adj., x) 16.81 16.90 8.76 6.85 P/E rel. (%) 148.8 145.7 80.5 69.6 EV/EBITDA 4.8 4.6 3.6 3.1
Dividend (12/13E, Eu) 0.45 IC (12/13E, Eu m) 2,467.09 Dividend yield (%) 1.2 EV/IC 0.69 Net debt (12/13E, Eu m) 601.1 Current WACC 9.0 Net debt/equity (12/13E, %) 32.2 Free float (%) — BV/share (12/13E, Eu) 54.9 Number of shares (m) 29.26
Source: FTI, Company data, Thomson Reuters, Credit Suisse Securities (EUROPE) LTD. Estimates.
Rating NEUTRAL* Price (07 Feb 13, Eu) 37.44 Target price (Eu) 36.00¹ Market cap. (Eu m) 1,095.52 Enterprise value (Eu m) 1,696.7
*Stock ratings are relative to the coverage universe in each
analyst's or each team's respective sector.
¹Target price is for 12 months.
Research Analysts
Max Yates
44 20 7883 8501
Andre Kukhnin CFA
44 20 7888 0350
Simon Toennessen
44 20 7883 6893
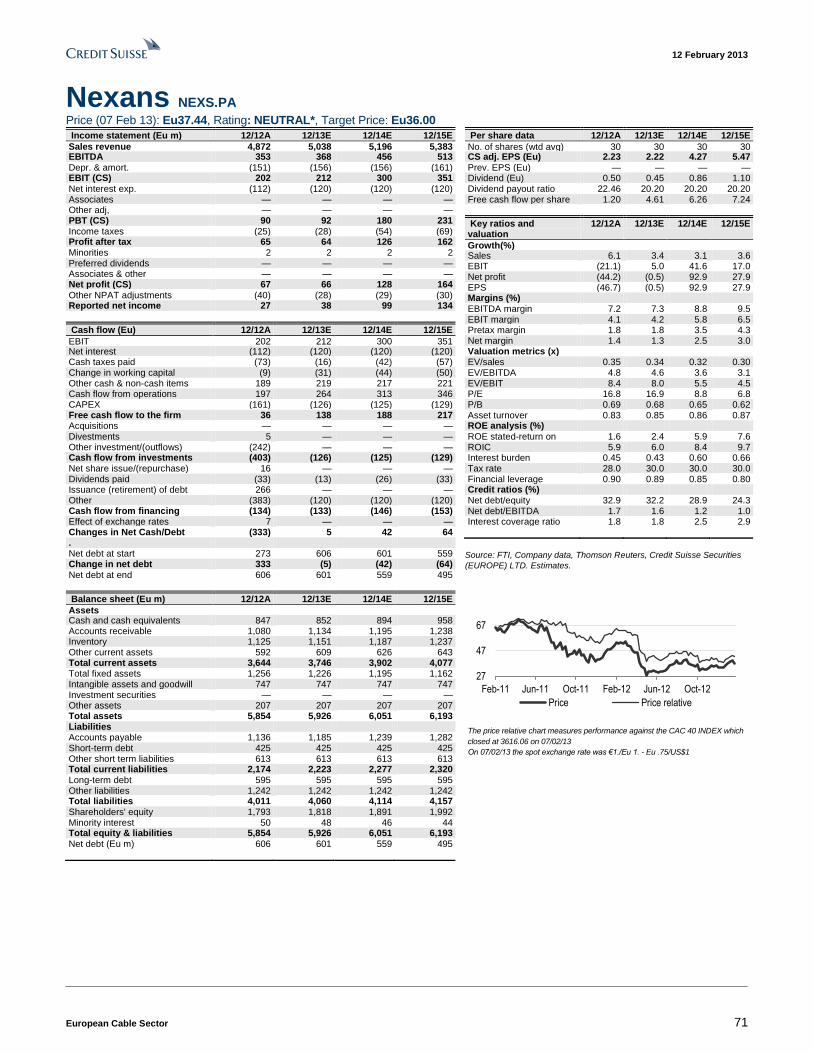
12 February 2013
European Cable Sector 71
Nexans NEXS.PA Price (07 Feb 13): Eu37.44, Rating: NEUTRAL*, Target Price: Eu36.00
Income statement (Eu m) 12/12A 12/13E 12/14E 12/15E
Sales revenue 4,872 5,038 5,196 5,383 EBITDA 353 368 456 513 Depr. & amort. (151) (156) (156) (161) EBIT (CS) 202 212 300 351 Net interest exp. (112) (120) (120) (120) Associates — — — — Other adj, — — — — PBT (CS) 90 92 180 231 Income taxes (25) (28) (54) (69) Profit after tax 65 64 126 162 Minorities 2 2 2 2 Preferred dividends — — — — Associates & other — — — — Net profit (CS) 67 66 128 164 Other NPAT adjustments (40) (28) (29) (30) Reported net income 27 38 99 134
Cash flow (Eu) 12/12A 12/13E 12/14E 12/15E
EBIT 202 212 300 351 Net interest (112) (120) (120) (120) Cash taxes paid (73) (16) (42) (57) Change in working capital (9) (31) (44) (50) Other cash & non-cash items 189 219 217 221 Cash flow from operations 197 264 313 346 CAPEX (161) (126) (125) (129) Free cash flow to the firm 36 138 188 217 Acquisitions — — — — Divestments 5 — — — Other investment/(outflows) (242) — — — Cash flow from investments (403) (126) (125) (129) Net share issue/(repurchase) 16 — — — Dividends paid (33) (13) (26) (33) Issuance (retirement) of debt 266 — — — Other (383) (120) (120) (120) Cash flow from financing activities
(134) (133) (146) (153) Effect of exchange rates 7 — — — Changes in Net Cash/Debt (333) 5 42 64 . Net debt at start 273 606 601 559 Change in net debt 333 (5) (42) (64) Net debt at end 606 601 559 495
Balance sheet (Eu m) 12/12A 12/13E 12/14E 12/15E
Assets Cash and cash equivalents 847 852 894 958 Accounts receivable 1,080 1,134 1,195 1,238 Inventory 1,125 1,151 1,187 1,237 Other current assets 592 609 626 643 Total current assets 3,644 3,746 3,902 4,077 Total fixed assets 1,256 1,226 1,195 1,162 Intangible assets and goodwill 747 747 747 747 Investment securities — — — — Other assets 207 207 207 207 Total assets 5,854 5,926 6,051 6,193 Liabilities Accounts payable 1,136 1,185 1,239 1,282 Short-term debt 425 425 425 425 Other short term liabilities 613 613 613 613 Total current liabilities 2,174 2,223 2,277 2,320 Long-term debt 595 595 595 595 Other liabilities 1,242 1,242 1,242 1,242 Total liabilities 4,011 4,060 4,114 4,157 Shareholders' equity 1,793 1,818 1,891 1,992 Minority interest 50 48 46 44 Total equity & liabilities 5,854 5,926 6,051 6,193 Net debt (Eu m) 606 601 559 495
Per share data 12/12A 12/13E 12/14E 12/15E
No. of shares (wtd avg) 30 30 30 30 CS adj. EPS (Eu) 2.23 2.22 4.27 5.47 Prev. EPS (Eu) — — — — Dividend (Eu) 0.50 0.45 0.86 1.10 Dividend payout ratio 22.46 20.20 20.20 20.20 Free cash flow per share (Eu)
1.20 4.61 6.26 7.24
Key ratios and valuation
12/12A 12/13E 12/14E 12/15E
Growth(%) Sales 6.1 3.4 3.1 3.6 EBIT (21.1) 5.0 41.6 17.0 Net profit (44.2) (0.5) 92.9 27.9 EPS (46.7) (0.5) 92.9 27.9 Margins (%) EBITDA margin 7.2 7.3 8.8 9.5 EBIT margin 4.1 4.2 5.8 6.5 Pretax margin 1.8 1.8 3.5 4.3 Net margin 1.4 1.3 2.5 3.0 Valuation metrics (x) EV/sales 0.35 0.34 0.32 0.30 EV/EBITDA 4.8 4.6 3.6 3.1 EV/EBIT 8.4 8.0 5.5 4.5 P/E 16.8 16.9 8.8 6.8 P/B 0.69 0.68 0.65 0.62 Asset turnover 0.83 0.85 0.86 0.87 ROE analysis (%) ROE stated-return on equity
1.6 2.4 5.9 7.6 ROIC 5.9 6.0 8.4 9.7 Interest burden 0.45 0.43 0.60 0.66 Tax rate 28.0 30.0 30.0 30.0 Financial leverage 0.90 0.89 0.85 0.80 Credit ratios (%) Net debt/equity 32.9 32.2 28.9 24.3 Net debt/EBITDA 1.7 1.6 1.2 1.0 Interest coverage ratio 1.8 1.8 2.5 2.9
Source: FTI, Company data, Thomson Reuters, Credit Suisse Securities
(EUROPE) LTD. Estimates.
27
47
67
Feb-11 Jun-11 Oct-11 Feb-12 Jun-12 Oct-12
Price Price relative
The price relative chart measures performance against the CAC 40 INDEX which
closed at 3616.06 on 07/02/13
On 07/02/13 the spot exchange rate was €1./Eu 1. - Eu .75/US$1
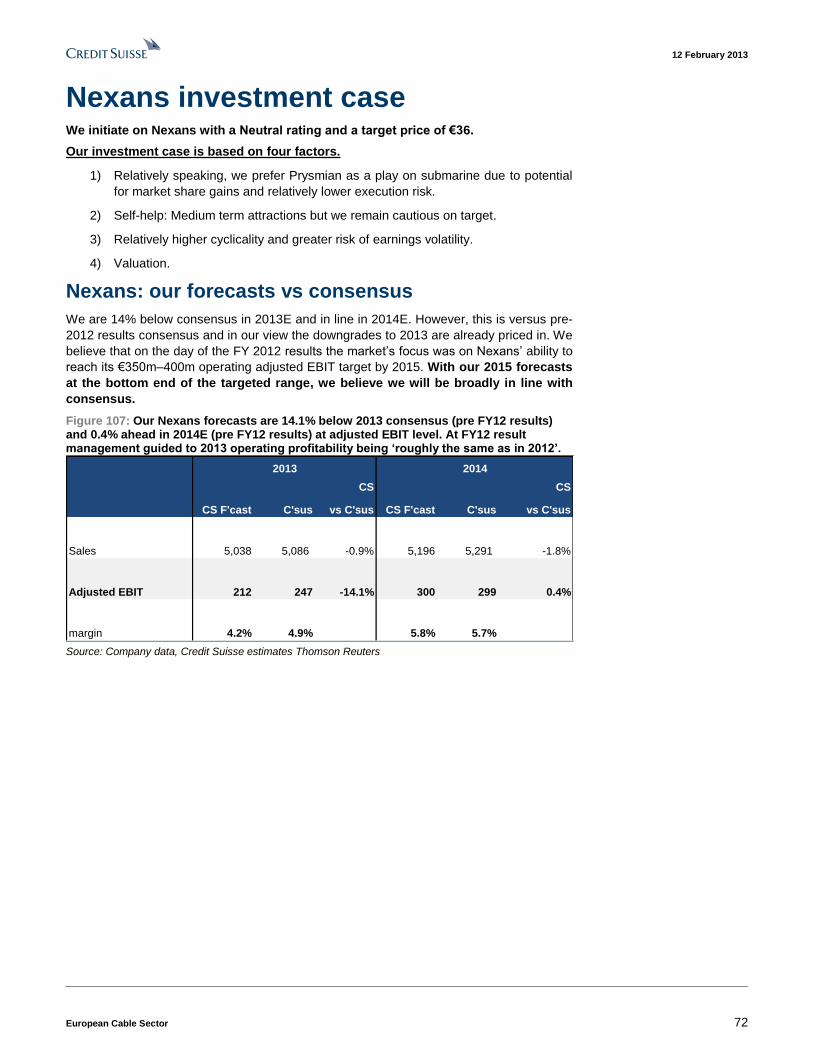
12 February 2013
European Cable Sector 72
Nexans investment case We initiate on Nexans with a Neutral rating and a target price of €36.
Our investment case is based on four factors.
1) Relatively speaking, we prefer Prysmian as a play on submarine due to potential
for market share gains and relatively lower execution risk.
2) Self-help: Medium term attractions but we remain cautious on target.
3) Relatively higher cyclicality and greater risk of earnings volatility.
4) Valuation.
Nexans: our forecasts vs consensus
We are 14% below consensus in 2013E and in line in 2014E. However, this is versus pre-
2012 results consensus and in our view the downgrades to 2013 are already priced in. We
believe that on the day of the FY 2012 results the market’s focus was on Nexans’ ability to
reach its €350m–400m operating adjusted EBIT target by 2015. With our 2015 forecasts
at the bottom end of the targeted range, we believe we will be broadly in line with
consensus.
Figure 107: Our Nexans forecasts are 14.1% below 2013 consensus (pre FY12 results) and 0.4% ahead in 2014E (pre FY12 results) at adjusted EBIT level. At FY12 result management guided to 2013 operating profitability being ‘roughly the same as in 2012’.
CS CS
CS F'cast C'sus vs C'sus CS F'cast C'sus vs C'sus
Sales 5,038 5,086 -0.9% 5,196 5,291 -1.8%
Adjusted EBIT 212 247 -14.1% 300 299 0.4%
margin 4.2% 4.9% 5.8% 5.7%
2013 2014
Source: Company data, Credit Suisse estimates Thomson Reuters
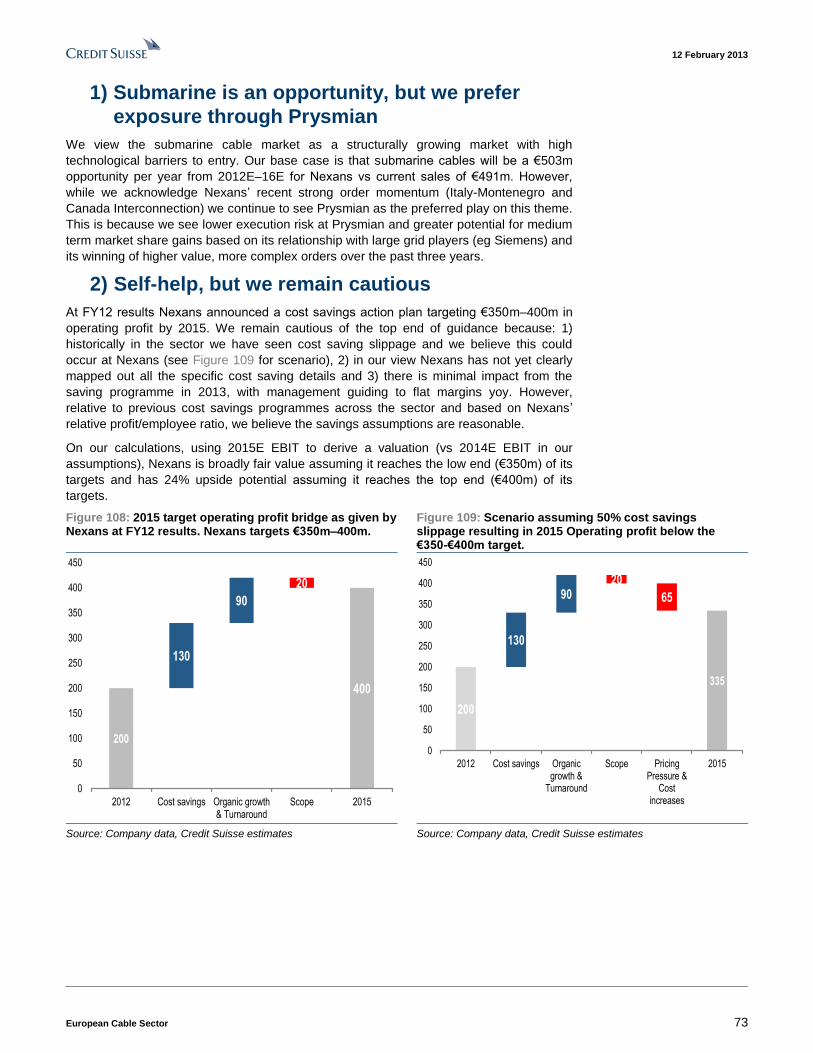
12 February 2013
European Cable Sector 73
1) Submarine is an opportunity, but we prefer
exposure through Prysmian
We view the submarine cable market as a structurally growing market with high
technological barriers to entry. Our base case is that submarine cables will be a €503m
opportunity per year from 2012E–16E for Nexans vs current sales of €491m. However,
while we acknowledge Nexans’ recent strong order momentum (Italy-Montenegro and
Canada Interconnection) we continue to see Prysmian as the preferred play on this theme.
This is because we see lower execution risk at Prysmian and greater potential for medium
term market share gains based on its relationship with large grid players (eg Siemens) and
its winning of higher value, more complex orders over the past three years.
2) Self-help, but we remain cautious
At FY12 results Nexans announced a cost savings action plan targeting €350m–400m in
operating profit by 2015. We remain cautious of the top end of guidance because: 1)
historically in the sector we have seen cost saving slippage and we believe this could
occur at Nexans (see Figure 109 for scenario), 2) in our view Nexans has not yet clearly
mapped out all the specific cost saving details and 3) there is minimal impact from the
saving programme in 2013, with management guiding to flat margins yoy. However,
relative to previous cost savings programmes across the sector and based on Nexans’
relative profit/employee ratio, we believe the savings assumptions are reasonable.
On our calculations, using 2015E EBIT to derive a valuation (vs 2014E EBIT in our
assumptions), Nexans is broadly fair value assuming it reaches the low end (€350m) of its
targets and has 24% upside potential assuming it reaches the top end (€400m) of its
targets.
Figure 108: 2015 target operating profit bridge as given by Nexans at FY12 results. Nexans targets €350m–400m.
Figure 109: Scenario assuming 50% cost savings slippage resulting in 2015 Operating profit below the €350-€400m target.
200
130
90
20
400
0
50
100
150
200
250
300
350
400
450
2012 Cost savings Organic growth& Turnaround
Scope 2015
335
200
130
9020
65
0
50
100
150
200
250
300
350
400
450
2012 Cost savings Organicgrowth &
Turnaround
Scope PricingPressure &
Costincreases
2015
Source: Company data, Credit Suisse estimates Source: Company data, Credit Suisse estimates

12 February 2013
European Cable Sector 74
3) Relatively higher cyclicality and earnings
volatility at Nexans
In our target price methodology we assume that Nexans trades at a 10% discount to the
sector while we value Prysmian using a sector multiple (ex lifts). Since Nexans’ organic
growth declined by 18.1% in 2009 there have been limited shifts in the business mix, with
relatively higher cyclicality or lower value add cables still accounting for more than 50% of
sales (vs 35% at Prysmian).
In 2012 we also saw earnings volatility at Nexans driven by submarine production issues
and Land HV contract delays. We continue to see greater risk of earnings volatility in the
near term at Nexans, which we believe is supportive of the multiples we use to generate
our Prysmian and Nexans target prices.
Figure 110: Nexans has a greater reliance on cyclical or lower value add businesses, in particular building cables which is a market we remain cautious on in 2013
Figure 111: 12 mth fwd earnings at Nexans have been volatile and we see potential for a continuation in 2013
0%
20%
40%
60%
80%
100%
Prysmian Nexans
Cyclical or lower value add Less-cyclical or higher value add
3
3.5
4
4.5
5
1
1.1
1.2
1.3
1.4
1.5
1.6
Jan-11 Apr-11 Jul-11 Oct-11 Jan-12 Apr-12 Jul-12 Oct-12 Jan-13
Prysmian (12 mth fwd EPS) Nexans (12 mth fwd EPS) (RHS)
Source: Company data, Credit Suisse estimates Source: Thomson Reuters
We would also highlight that since the downturn Nexans’ business has not shifted enough
to justify our applying a significantly higher multiple to earnings relative to its history. We
would highlight that >30% of profit is still derived from building cable. We also believe that
Power distribution cables (within T,D,O) still accounts for 23% of profit and we view this as
a relatively commoditised product.
Figure 112: Nexans operating profit split in 2007 Figure 113: Nexans operating profit split in 2011
T,D,O41%
Industry21%
D&I38%
T,D,O53%
Industry14%
D&I32%
Other1%
Source: Company data Source: Company data
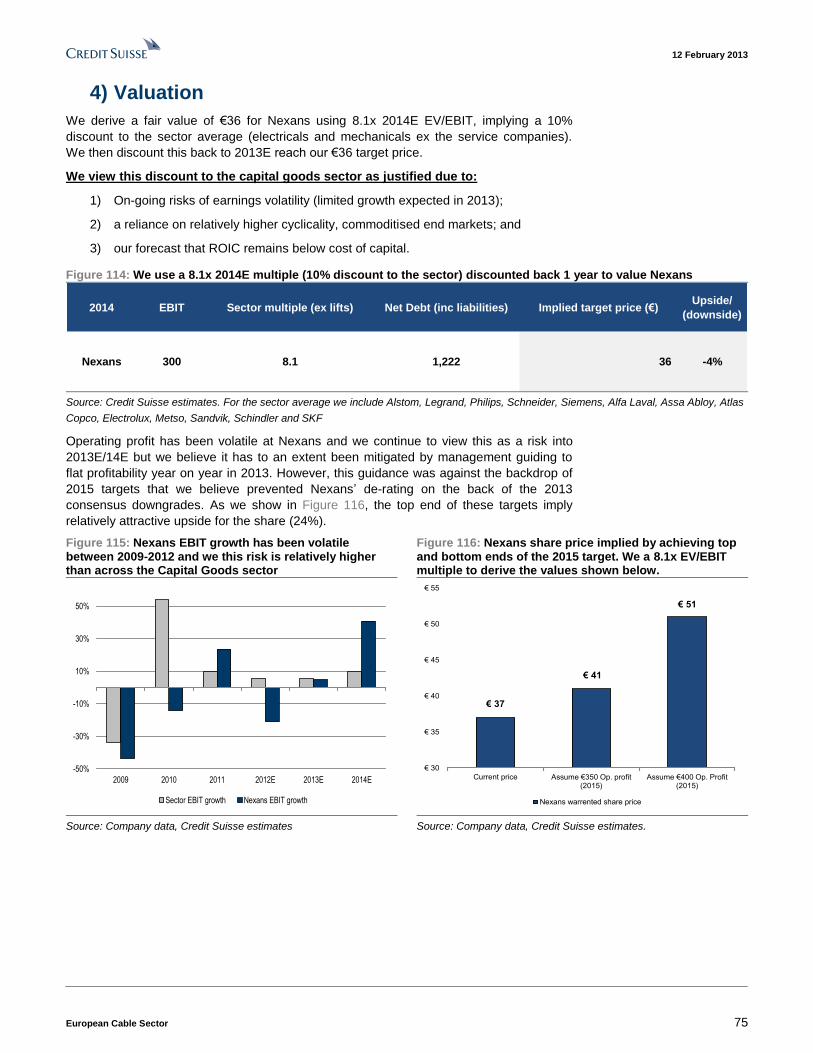
12 February 2013
European Cable Sector 75
4) Valuation
We derive a fair value of €36 for Nexans using 8.1x 2014E EV/EBIT, implying a 10%
discount to the sector average (electricals and mechanicals ex the service companies).
We then discount this back to 2013E reach our €36 target price.
We view this discount to the capital goods sector as justified due to:
1) On-going risks of earnings volatility (limited growth expected in 2013);
2) a reliance on relatively higher cyclicality, commoditised end markets; and
3) our forecast that ROIC remains below cost of capital.
Figure 114: We use a 8.1x 2014E multiple (10% discount to the sector) discounted back 1 year to value Nexans
2014 EBIT Sector multiple (ex lifts) Net Debt (inc liabilities) Implied target price (€)Upside/
(downside)
Nexans 300 8.1 1,222 36 -4%
Source: Credit Suisse estimates. For the sector average we include Alstom, Legrand, Philips, Schneider, Siemens, Alfa Laval, Assa Abloy, Atlas
Copco, Electrolux, Metso, Sandvik, Schindler and SKF
Operating profit has been volatile at Nexans and we continue to view this as a risk into
2013E/14E but we believe it has to an extent been mitigated by management guiding to
flat profitability year on year in 2013. However, this guidance was against the backdrop of
2015 targets that we believe prevented Nexans’ de-rating on the back of the 2013
consensus downgrades. As we show in Figure 116, the top end of these targets imply
relatively attractive upside for the share (24%).
Figure 115: Nexans EBIT growth has been volatile between 2009-2012 and we this risk is relatively higher than across the Capital Goods sector
Figure 116: Nexans share price implied by achieving top and bottom ends of the 2015 target. We a 8.1x EV/EBIT multiple to derive the values shown below.
-50%
-30%
-10%
10%
30%
50%
2009 2010 2011 2012E 2013E 2014E
Sector EBIT growth Nexans EBIT growth
€ 37
€ 41
€ 51
€ 30
€ 35
€ 40
€ 45
€ 50
€ 55
Current price Assume €350 Op. profit (2015)
Assume €400 Op. Profit (2015)
Nexans warrented share price
Source: Company data, Credit Suisse estimates Source: Company data, Credit Suisse estimates.
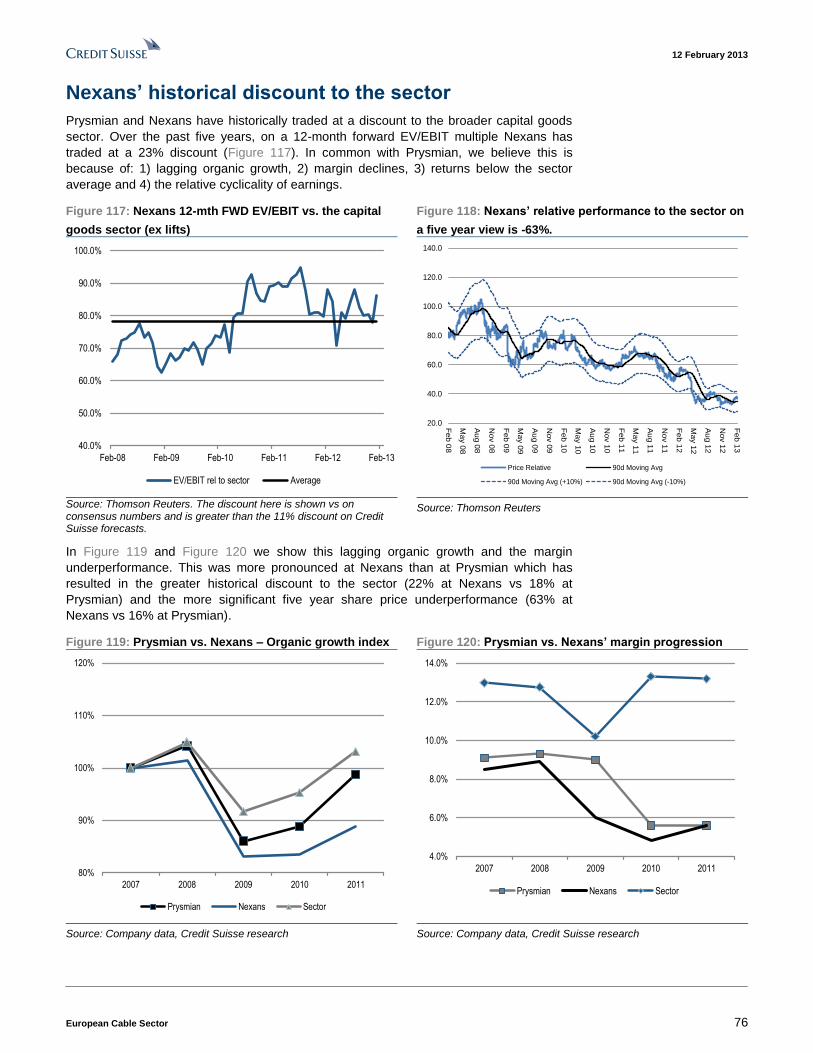
12 February 2013
European Cable Sector 76
Nexans’ historical discount to the sector
Prysmian and Nexans have historically traded at a discount to the broader capital goods
sector. Over the past five years, on a 12-month forward EV/EBIT multiple Nexans has
traded at a 23% discount (Figure 117). In common with Prysmian, we believe this is
because of: 1) lagging organic growth, 2) margin declines, 3) returns below the sector
average and 4) the relative cyclicality of earnings.
Figure 117: Nexans 12-mth FWD EV/EBIT vs. the capital
goods sector (ex lifts)
Figure 118: Nexans’ relative performance to the sector on
a five year view is -63%.
40.0%
50.0%
60.0%
70.0%
80.0%
90.0%
100.0%
Feb-08 Feb-09 Feb-10 Feb-11 Feb-12 Feb-13
EV/EBIT rel to sector Average
20.0
40.0
60.0
80.0
100.0
120.0
140.0
Feb 0
8
May 0
8
Au
g 0
8
Nov 0
8
Feb 0
9
May 0
9
Au
g 0
9
Nov 0
9
Feb 1
0
May 1
0
Au
g 1
0
Nov 1
0
Feb 1
1
May 1
1
Au
g 1
1
Nov 1
1
Feb 1
2
May 1
2
Au
g 1
2
Nov 1
2
Feb 1
3
Price Relative 90d Moving Avg
90d Moving Avg (+10%) 90d Moving Avg (-10%)
Source: Thomson Reuters. The discount here is shown vs on consensus numbers and is greater than the 11% discount on Credit Suisse forecasts.
Source: Thomson Reuters
In Figure 119 and Figure 120 we show this lagging organic growth and the margin
underperformance. This was more pronounced at Nexans than at Prysmian which has
resulted in the greater historical discount to the sector (22% at Nexans vs 18% at
Prysmian) and the more significant five year share price underperformance (63% at
Nexans vs 16% at Prysmian).
Figure 119: Prysmian vs. Nexans – Organic growth index Figure 120: Prysmian vs. Nexans’ margin progression
80%
90%
100%
110%
120%
2007 2008 2009 2010 2011
Prysmian Nexans Sector
4.0%
6.0%
8.0%
10.0%
12.0%
14.0%
2007 2008 2009 2010 2011
Prysmian Nexans Sector
Source: Company data, Credit Suisse research Source: Company data, Credit Suisse research
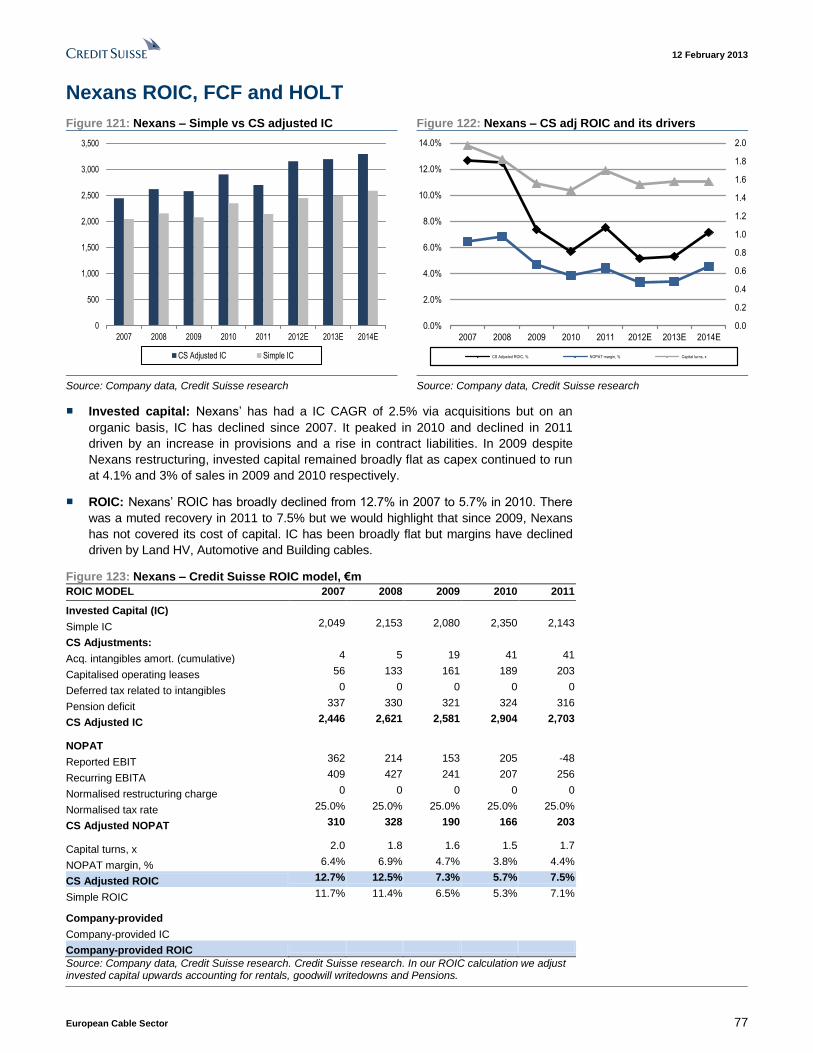
12 February 2013
European Cable Sector 77
Nexans ROIC, FCF and HOLT
Figure 121: Nexans – Simple vs CS adjusted IC Figure 122: Nexans – CS adj ROIC and its drivers
0
500
1,000
1,500
2,000
2,500
3,000
3,500
2007 2008 2009 2010 2011 2012E 2013E 2014E
CS Adjusted IC Simple IC
0.0
0.2
0.4
0.6
0.8
1.0
1.2
1.4
1.6
1.8
2.0
0.0%
2.0%
4.0%
6.0%
8.0%
10.0%
12.0%
14.0%
2007 2008 2009 2010 2011 2012E 2013E 2014E
CS Adjusted ROIC, % NOPAT margin, % Capital turns, x
Source: Company data, Credit Suisse research Source: Company data, Credit Suisse research
■ Invested capital: Nexans’ has had a IC CAGR of 2.5% via acquisitions but on an
organic basis, IC has declined since 2007. It peaked in 2010 and declined in 2011
driven by an increase in provisions and a rise in contract liabilities. In 2009 despite
Nexans restructuring, invested capital remained broadly flat as capex continued to run
at 4.1% and 3% of sales in 2009 and 2010 respectively.
■ ROIC: Nexans’ ROIC has broadly declined from 12.7% in 2007 to 5.7% in 2010. There
was a muted recovery in 2011 to 7.5% but we would highlight that since 2009, Nexans
has not covered its cost of capital. IC has been broadly flat but margins have declined
driven by Land HV, Automotive and Building cables.
Figure 123: Nexans – Credit Suisse ROIC model, €m
ROIC MODEL 2007 2008 2009 2010 2011
Invested Capital (IC)
Simple IC 2,049 2,153 2,080 2,350 2,143
CS Adjustments:
Acq. intangibles amort. (cumulative) 4 5 19 41 41
Capitalised operating leases 56 133 161 189 203
Deferred tax related to intangibles 0 0 0 0 0
Pension deficit 337 330 321 324 316
CS Adjusted IC 2,446 2,621 2,581 2,904 2,703
NOPAT
Reported EBIT 362 214 153 205 -48
Recurring EBITA 409 427 241 207 256
Normalised restructuring charge 0 0 0 0 0
Normalised tax rate 25.0% 25.0% 25.0% 25.0% 25.0%
CS Adjusted NOPAT 310 328 190 166 203
Capital turns, x 2.0 1.8 1.6 1.5 1.7
NOPAT margin, % 6.4% 6.9% 4.7% 3.8% 4.4%
CS Adjusted ROIC 12.7% 12.5% 7.3% 5.7% 7.5%
Simple ROIC 11.7% 11.4% 6.5% 5.3% 7.1%
Company-provided
Company-provided IC
Company-provided ROIC
Source: Company data, Credit Suisse research. Credit Suisse research. In our ROIC calculation we adjust invested capital upwards accounting for rentals, goodwill writedowns and Pensions.
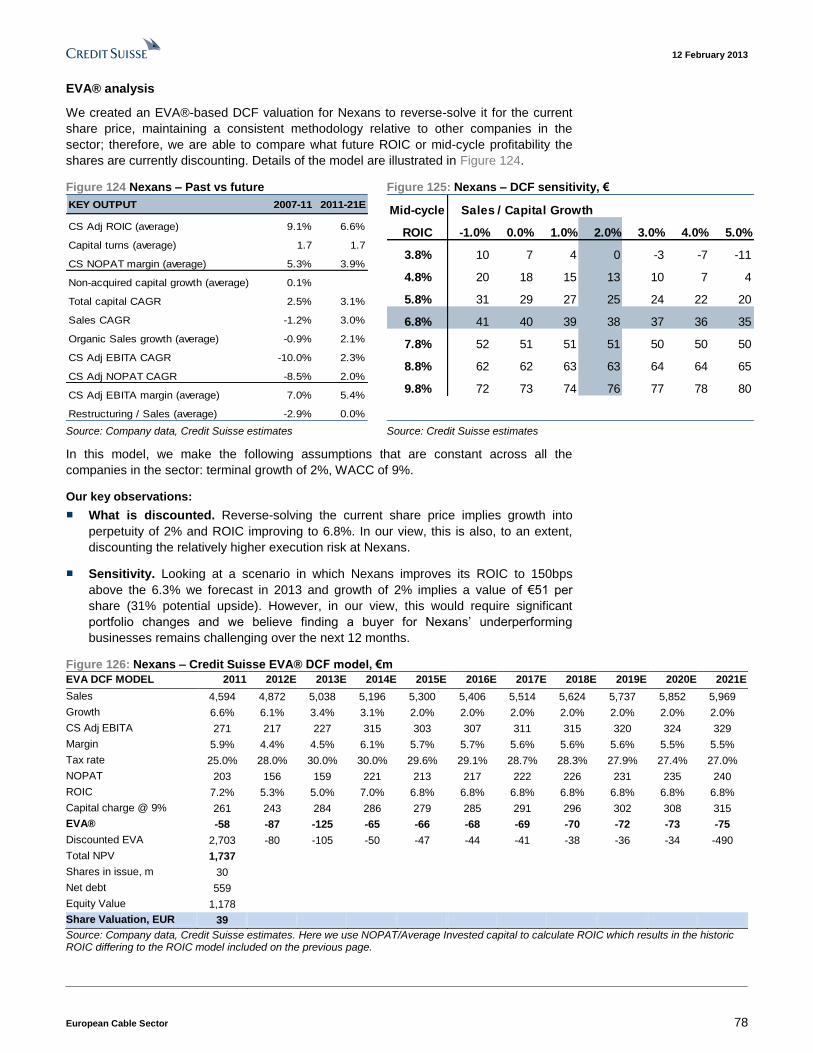
12 February 2013
European Cable Sector 78
EVA® analysis
We created an EVA®-based DCF valuation for Nexans to reverse-solve it for the current
share price, maintaining a consistent methodology relative to other companies in the
sector; therefore, we are able to compare what future ROIC or mid-cycle profitability the
shares are currently discounting. Details of the model are illustrated in Figure 124.
Figure 124 Nexans – Past vs future Figure 125: Nexans – DCF sensitivity, €
KEY OUTPUT 2007-11 2011-21E
CS Adj ROIC (average) 9.1% 6.6%
Capital turns (average) 1.7 1.7
CS NOPAT margin (average) 5.3% 3.9%
Non-acquired capital growth (average) 0.1%
Total capital CAGR 2.5% 3.1%
Sales CAGR -1.2% 3.0%
Organic Sales growth (average) -0.9% 2.1%
CS Adj EBITA CAGR -10.0% 2.3%
CS Adj NOPAT CAGR -8.5% 2.0%
CS Adj EBITA margin (average) 7.0% 5.4%
Restructuring / Sales (average) -2.9% 0.0%
Mid-cycle Sales / Capital Growth
ROIC -1.0% 0.0% 1.0% 2.0% 3.0% 4.0% 5.0%
3.8% 10 7 4 0 -3 -7 -11
4.8% 20 18 15 13 10 7 4
5.8% 31 29 27 25 24 22 20
6.8% 41 40 39 38 37 36 35
7.8% 52 51 51 51 50 50 50
8.8% 62 62 63 63 64 64 65
9.8% 72 73 74 76 77 78 80
Source: Company data, Credit Suisse estimates Source: Credit Suisse estimates
In this model, we make the following assumptions that are constant across all the
companies in the sector: terminal growth of 2%, WACC of 9%.
Our key observations:
■ What is discounted. Reverse-solving the current share price implies growth into
perpetuity of 2% and ROIC improving to 6.8%. In our view, this is also, to an extent,
discounting the relatively higher execution risk at Nexans.
■ Sensitivity. Looking at a scenario in which Nexans improves its ROIC to 150bps
above the 6.3% we forecast in 2013 and growth of 2% implies a value of €51 per
share (31% potential upside). However, in our view, this would require significant
portfolio changes and we believe finding a buyer for Nexans’ underperforming
businesses remains challenging over the next 12 months.
Figure 126: Nexans – Credit Suisse EVA® DCF model, €m
Source: Company data, Credit Suisse estimates. Here we use NOPAT/Average Invested capital to calculate ROIC which results in the historic ROIC differing to the ROIC model included on the previous page.
EVA DCF MODEL 2011 2012E 2013E 2014E 2015E 2016E 2017E 2018E 2019E 2020E 2021E
Sales 4,594 4,872 5,038 5,196 5,300 5,406 5,514 5,624 5,737 5,852 5,969
Growth 6.6% 6.1% 3.4% 3.1% 2.0% 2.0% 2.0% 2.0% 2.0% 2.0% 2.0%
CS Adj EBITA 271 217 227 315 303 307 311 315 320 324 329
Margin 5.9% 4.4% 4.5% 6.1% 5.7% 5.7% 5.6% 5.6% 5.6% 5.5% 5.5%
Tax rate 25.0% 28.0% 30.0% 30.0% 29.6% 29.1% 28.7% 28.3% 27.9% 27.4% 27.0%
NOPAT 203 156 159 221 213 217 222 226 231 235 240
ROIC 7.2% 5.3% 5.0% 7.0% 6.8% 6.8% 6.8% 6.8% 6.8% 6.8% 6.8%
Capital charge @ 9% 261 243 284 286 279 285 291 296 302 308 315
EVA® -58 -87 -125 -65 -66 -68 -69 -70 -72 -73 -75
Discounted EVA 2,703 -80 -105 -50 -47 -44 -41 -38 -36 -34 -490
Total NPV 1,737
Shares in issue, m 30
Net debt 559
Equity Value 1,178
Share Valuation, EUR 39
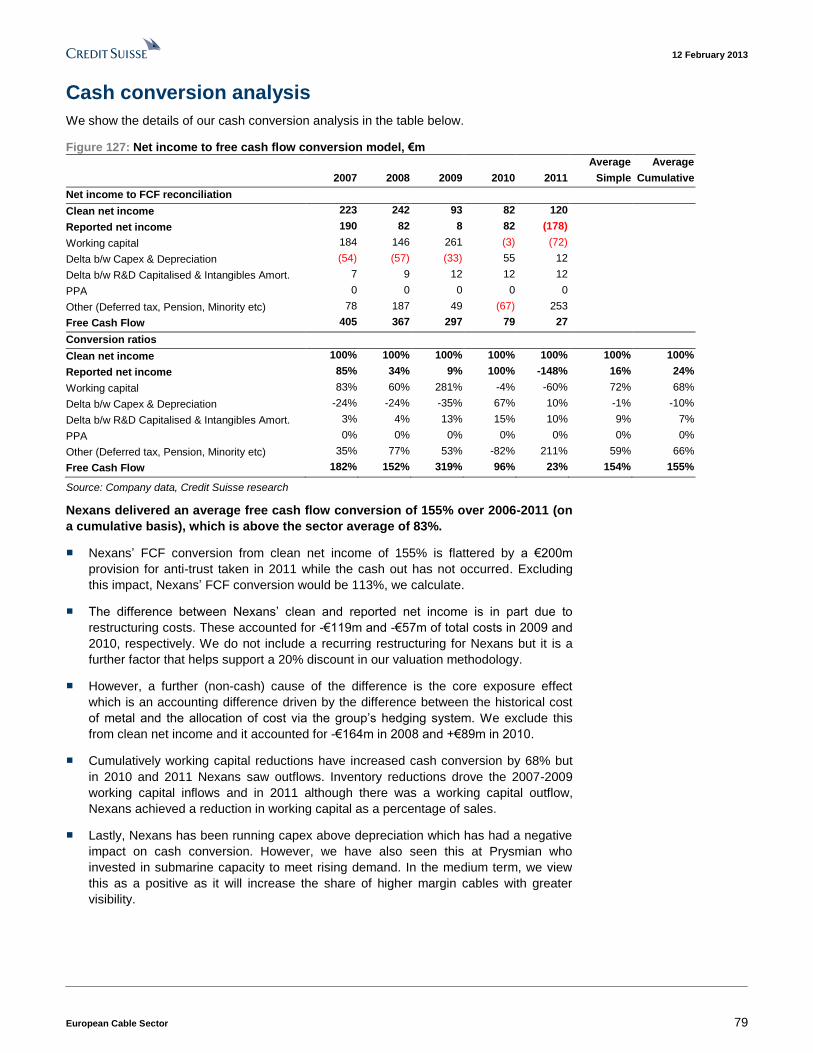
12 February 2013
European Cable Sector 79
Cash conversion analysis
We show the details of our cash conversion analysis in the table below.
Figure 127: Net income to free cash flow conversion model, €m
Average Average
2007 2008 2009 2010 2011 Simple Cumulative
Net income to FCF reconciliation
Clean net income 223 242 93 82 120
Reported net income 190 82 8 82 (178)
Working capital 184 146 261 (3) (72)
Delta b/w Capex & Depreciation (54) (57) (33) 55 12
Delta b/w R&D Capitalised & Intangibles Amort. 7 9 12 12 12
PPA 0 0 0 0 0
Other (Deferred tax, Pension, Minority etc) 78 187 49 (67) 253
Free Cash Flow 405 367 297 79 27
Conversion ratios
Clean net income 100% 100% 100% 100% 100% 100% 100%
Reported net income 85% 34% 9% 100% -148% 16% 24%
Working capital 83% 60% 281% -4% -60% 72% 68%
Delta b/w Capex & Depreciation -24% -24% -35% 67% 10% -1% -10%
Delta b/w R&D Capitalised & Intangibles Amort. 3% 4% 13% 15% 10% 9% 7%
PPA 0% 0% 0% 0% 0% 0% 0%
Other (Deferred tax, Pension, Minority etc) 35% 77% 53% -82% 211% 59% 66%
Free Cash Flow 182% 152% 319% 96% 23% 154% 155%
Source: Company data, Credit Suisse research
Nexans delivered an average free cash flow conversion of 155% over 2006-2011 (on
a cumulative basis), which is above the sector average of 83%.
■ Nexans’ FCF conversion from clean net income of 155% is flattered by a €200m
provision for anti-trust taken in 2011 while the cash out has not occurred. Excluding
this impact, Nexans’ FCF conversion would be 113%, we calculate.
■ The difference between Nexans’ clean and reported net income is in part due to
restructuring costs. These accounted for -€119m and -€57m of total costs in 2009 and
2010, respectively. We do not include a recurring restructuring for Nexans but it is a
further factor that helps support a 20% discount in our valuation methodology.
■ However, a further (non-cash) cause of the difference is the core exposure effect
which is an accounting difference driven by the difference between the historical cost
of metal and the allocation of cost via the group’s hedging system. We exclude this
from clean net income and it accounted for -€164m in 2008 and +€89m in 2010.
■ Cumulatively working capital reductions have increased cash conversion by 68% but
in 2010 and 2011 Nexans saw outflows. Inventory reductions drove the 2007-2009
working capital inflows and in 2011 although there was a working capital outflow,
Nexans achieved a reduction in working capital as a percentage of sales.
■ Lastly, Nexans has been running capex above depreciation which has had a negative
impact on cash conversion. However, we have also seen this at Prysmian who
invested in submarine capacity to meet rising demand. In the medium term, we view
this as a positive as it will increase the share of higher margin cables with greater
visibility.
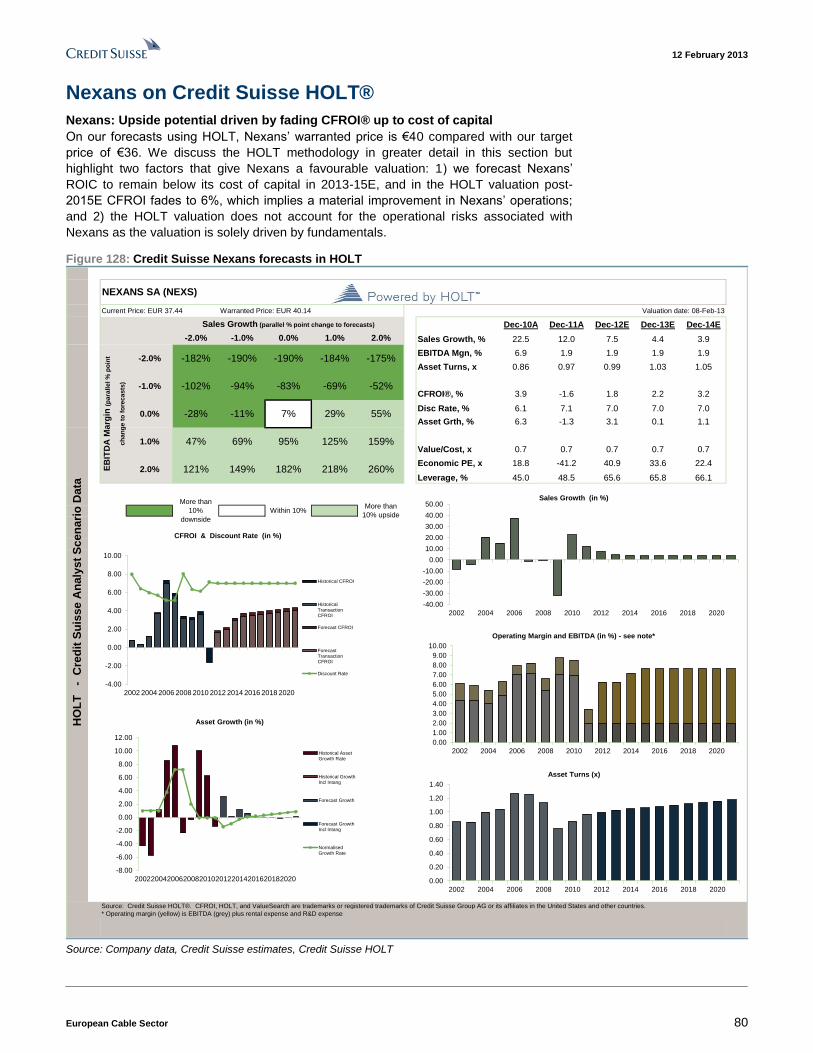
12 February 2013
European Cable Sector 80
Nexans on Credit Suisse HOLT®
Nexans: Upside potential driven by fading CFROI® up to cost of capital
On our forecasts using HOLT, Nexans’ warranted price is €40 compared with our target
price of €36. We discuss the HOLT methodology in greater detail in this section but
highlight two factors that give Nexans a favourable valuation: 1) we forecast Nexans’
ROIC to remain below its cost of capital in 2013-15E, and in the HOLT valuation post-
2015E CFROI fades to 6%, which implies a material improvement in Nexans’ operations;
and 2) the HOLT valuation does not account for the operational risks associated with
Nexans as the valuation is solely driven by fundamentals.
Figure 128: Credit Suisse Nexans forecasts in HOLT
Current Price: EUR 37.44 Warranted Price: EUR 40.14 Valuation date: 08-Feb-13
Sales Growth (parallel % point change to forecasts) Dec-10A Dec-11A Dec-12E Dec-13E Dec-14E
-2.0% -1.0% 0.0% 1.0% 2.0% Sales Growth, % 22.5 12.0 7.5 4.4 3.9
EBITDA Mgn, % 6.9 1.9 1.9 1.9 1.9
Asset Turns, x 0.86 0.97 0.99 1.03 1.05
CFROI®, % 3.9 -1.6 1.8 2.2 3.2
Disc Rate, % 6.1 7.1 7.0 7.0 7.0
Asset Grth, % 6.3 -1.3 3.1 0.1 1.1
Value/Cost, x 0.7 0.7 0.7 0.7 0.7
Economic PE, x 18.8 -41.2 40.9 33.6 22.4
Leverage, % 45.0 48.5 65.6 65.8 66.1
More than
10%
downside
Within 10%More than
10% upside
Source: Credit Suisse HOLT®. CFROI, HOLT, and ValueSearch are trademarks or registered trademarks of Credit Suisse Group AG or its affiliates in the United States and other countries.
* Operating margin (yellow) is EBITDA (grey) plus rental expense and R&D expense
2.0% 121% 149% 182% 218%
1.0% 47% 69% 95% 125%
-83% -69% -52%
260%
7% 29% 55%
159%
HO
LT
-
C
red
it S
uis
se
An
aly
st
Sc
en
ari
o D
ata
NEXANS SA (NEXS)
EB
ITD
A M
arg
in (
pa
rall
el
% p
oin
t
ch
an
ge
to
fo
rec
as
ts)
-2.0% -182% -190% -190%
0.0% -28% -11%
-184% -175%
-1.0% -102% -94%
-40.00
-30.00
-20.00
-10.00
0.00
10.00
20.00
30.00
40.00
50.00
2002 2004 2006 2008 2010 2012 2014 2016 2018 2020
Sales Growth (in %)
0.00
1.00
2.00
3.00
4.00
5.00
6.00
7.00
8.00
9.00
10.00
2002 2004 2006 2008 2010 2012 2014 2016 2018 2020
Operating Margin and EBITDA (in %) - see note*
0.00
0.20
0.40
0.60
0.80
1.00
1.20
1.40
2002 2004 2006 2008 2010 2012 2014 2016 2018 2020
Asset Turns (x)
-4.00
-2.00
0.00
2.00
4.00
6.00
8.00
10.00
2002 2004 2006 2008 2010 2012 2014 2016 2018 2020
Historical CFROI
HistoricalTransactionCFROI
Forecast CFROI
ForecastTransactionCFROI
Discount Rate
CFROI & Discount Rate (in %)
-8.00
-6.00
-4.00
-2.00
0.00
2.00
4.00
6.00
8.00
10.00
12.00
2002200420062008201020122014201620182020
Historical AssetGrowth Rate
Historical GrowthIncl Intang
Forecast Growth
Forecast GrowthIncl Intang
NormalisedGrowth Rate
Asset Growth (in %)
Source: Company data, Credit Suisse estimates, Credit Suisse HOLT
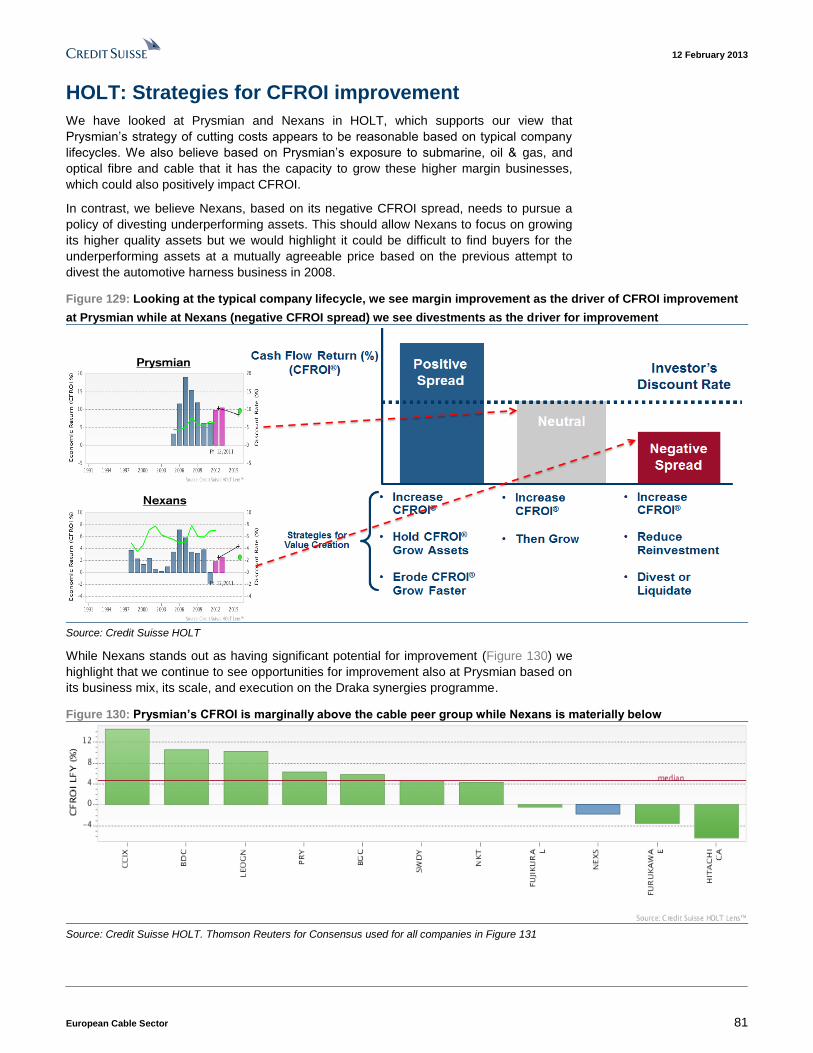
12 February 2013
European Cable Sector 81
HOLT: Strategies for CFROI improvement
We have looked at Prysmian and Nexans in HOLT, which supports our view that
Prysmian’s strategy of cutting costs appears to be reasonable based on typical company
lifecycles. We also believe based on Prysmian’s exposure to submarine, oil & gas, and
optical fibre and cable that it has the capacity to grow these higher margin businesses,
which could also positively impact CFROI.
In contrast, we believe Nexans, based on its negative CFROI spread, needs to pursue a
policy of divesting underperforming assets. This should allow Nexans to focus on growing
its higher quality assets but we would highlight it could be difficult to find buyers for the
underperforming assets at a mutually agreeable price based on the previous attempt to
divest the automotive harness business in 2008.
Figure 129: Looking at the typical company lifecycle, we see margin improvement as the driver of CFROI improvement
at Prysmian while at Nexans (negative CFROI spread) we see divestments as the driver for improvement
Prysmian
Nexans
Source: Credit Suisse HOLT
While Nexans stands out as having significant potential for improvement (Figure 130) we
highlight that we continue to see opportunities for improvement also at Prysmian based on
its business mix, its scale, and execution on the Draka synergies programme.
Figure 130: Prysmian’s CFROI is marginally above the cable peer group while Nexans is materially below
Source: Credit Suisse HOLT. Thomson Reuters for Consensus used for all companies in Figure 131
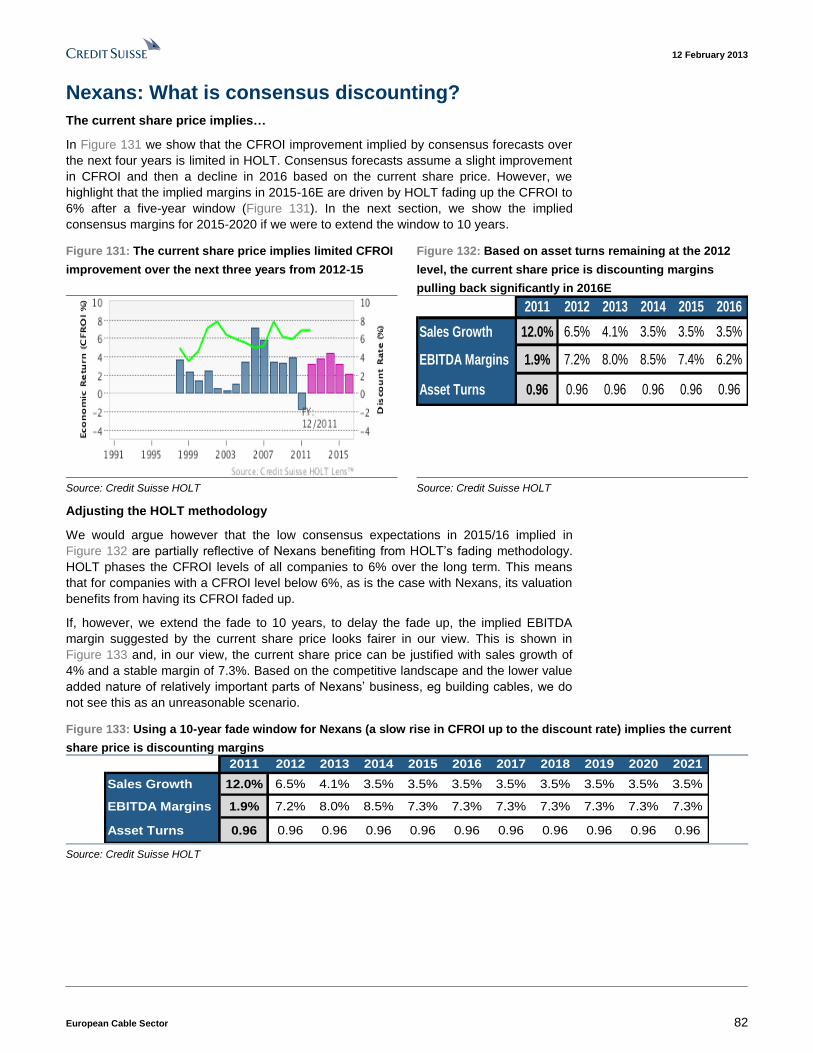
12 February 2013
European Cable Sector 82
Nexans: What is consensus discounting?
The current share price implies…
In Figure 131 we show that the CFROI improvement implied by consensus forecasts over
the next four years is limited in HOLT. Consensus forecasts assume a slight improvement
in CFROI and then a decline in 2016 based on the current share price. However, we
highlight that the implied margins in 2015-16E are driven by HOLT fading up the CFROI to
6% after a five-year window (Figure 131). In the next section, we show the implied
consensus margins for 2015-2020 if we were to extend the window to 10 years.
Figure 131: The current share price implies limited CFROI
improvement over the next three years from 2012-15
Figure 132: Based on asset turns remaining at the 2012
level, the current share price is discounting margins
pulling back significantly in 2016E
2011 2012 2013 2014 2015 2016
Sales Growth 12.0% 6.5% 4.1% 3.5% 3.5% 3.5%
EBITDA Margins 1.9% 7.2% 8.0% 8.5% 7.4% 6.2%
Asset Turns 0.96 0.96 0.96 0.96 0.96 0.96
Source: Credit Suisse HOLT Source: Credit Suisse HOLT
Adjusting the HOLT methodology
We would argue however that the low consensus expectations in 2015/16 implied in
Figure 132 are partially reflective of Nexans benefiting from HOLT’s fading methodology.
HOLT phases the CFROI levels of all companies to 6% over the long term. This means
that for companies with a CFROI level below 6%, as is the case with Nexans, its valuation
benefits from having its CFROI faded up.
If, however, we extend the fade to 10 years, to delay the fade up, the implied EBITDA
margin suggested by the current share price looks fairer in our view. This is shown in
Figure 133 and, in our view, the current share price can be justified with sales growth of
4% and a stable margin of 7.3%. Based on the competitive landscape and the lower value
added nature of relatively important parts of Nexans’ business, eg building cables, we do
not see this as an unreasonable scenario.
Figure 133: Using a 10-year fade window for Nexans (a slow rise in CFROI up to the discount rate) implies the current
share price is discounting margins
2011 2012 2013 2014 2015 2016 2017 2018 2019 2020 2021
Sales Growth 12.0% 6.5% 4.1% 3.5% 3.5% 3.5% 3.5% 3.5% 3.5% 3.5% 3.5%
EBITDA Margins 1.9% 7.2% 8.0% 8.5% 7.3% 7.3% 7.3% 7.3% 7.3% 7.3% 7.3%
Asset Turns 0.96 0.96 0.96 0.96 0.96 0.96 0.96 0.96 0.96 0.96 0.96
Source: Credit Suisse HOLT
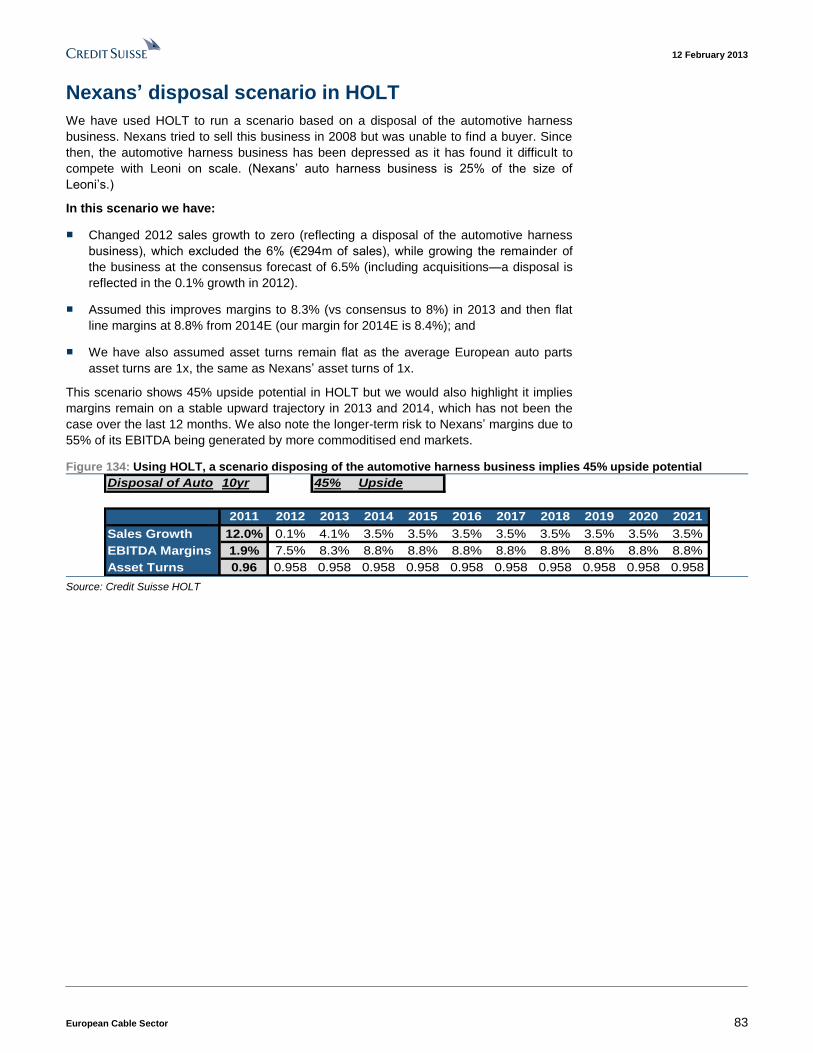
12 February 2013
European Cable Sector 83
Nexans’ disposal scenario in HOLT
We have used HOLT to run a scenario based on a disposal of the automotive harness
business. Nexans tried to sell this business in 2008 but was unable to find a buyer. Since
then, the automotive harness business has been depressed as it has found it difficult to
compete with Leoni on scale. (Nexans’ auto harness business is 25% of the size of
Leoni’s.)
In this scenario we have:
■ Changed 2012 sales growth to zero (reflecting a disposal of the automotive harness
business), which excluded the 6% (€294m of sales), while growing the remainder of
the business at the consensus forecast of 6.5% (including acquisitions—a disposal is
reflected in the 0.1% growth in 2012).
■ Assumed this improves margins to 8.3% (vs consensus to 8%) in 2013 and then flat
line margins at 8.8% from 2014E (our margin for 2014E is 8.4%); and
■ We have also assumed asset turns remain flat as the average European auto parts
asset turns are 1x, the same as Nexans’ asset turns of 1x.
This scenario shows 45% upside potential in HOLT but we would also highlight it implies
margins remain on a stable upward trajectory in 2013 and 2014, which has not been the
case over the last 12 months. We also note the longer-term risk to Nexans’ margins due to
55% of its EBITDA being generated by more commoditised end markets.
Figure 134: Using HOLT, a scenario disposing of the automotive harness business implies 45% upside potential
Disposal of Auto 10yr 45% Upside
2011 2012 2013 2014 2015 2016 2017 2018 2019 2020 2021
Sales Growth 12.0% 0.1% 4.1% 3.5% 3.5% 3.5% 3.5% 3.5% 3.5% 3.5% 3.5%
EBITDA Margins 1.9% 7.5% 8.3% 8.8% 8.8% 8.8% 8.8% 8.8% 8.8% 8.8% 8.8%
Asset Turns 0.96 0.958 0.958 0.958 0.958 0.958 0.958 0.958 0.958 0.958 0.958 Source: Credit Suisse HOLT
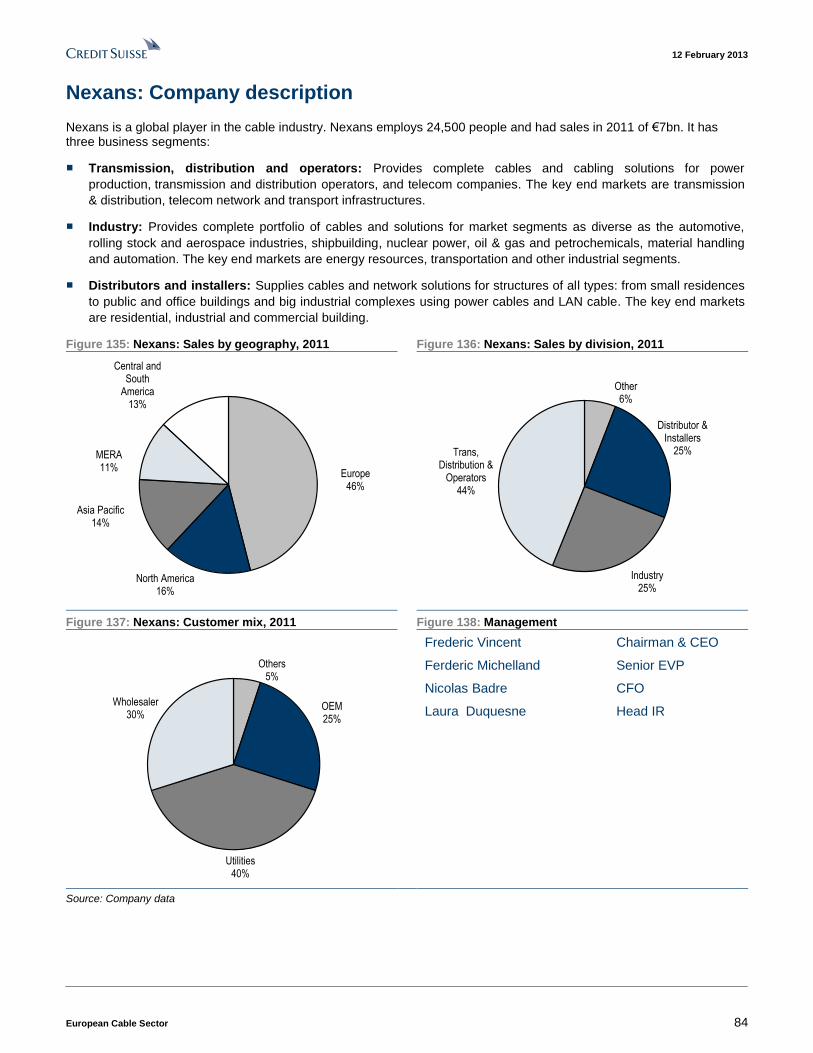
12 February 2013
European Cable Sector 84
Nexans: Company description
Nexans is a global player in the cable industry. Nexans employs 24,500 people and had sales in 2011 of €7bn. It has three business segments:
■ Transmission, distribution and operators: Provides complete cables and cabling solutions for power
production, transmission and distribution operators, and telecom companies. The key end markets are transmission
& distribution, telecom network and transport infrastructures.
■ Industry: Provides complete portfolio of cables and solutions for market segments as diverse as the automotive,
rolling stock and aerospace industries, shipbuilding, nuclear power, oil & gas and petrochemicals, material handling
and automation. The key end markets are energy resources, transportation and other industrial segments.
■ Distributors and installers: Supplies cables and network solutions for structures of all types: from small residences
to public and office buildings and big industrial complexes using power cables and LAN cable. The key end markets
are residential, industrial and commercial building.
Figure 135: Nexans: Sales by geography, 2011 Figure 136: Nexans: Sales by division, 2011
Europe46%
North America16%
Asia Pacific14%
MERA11%
Central and South
America13%
Other6%
Distributor & Installers
25%
Industry25%
Trans, Distribution &
Operators44%
Figure 137: Nexans: Customer mix, 2011 Figure 138: Management
Others5%
OEM25%
Utilities40%
Wholesaler30%
Frederic Vincent Chairman & CEO
Ferderic Michelland Senior EVP
Nicolas Badre CFO
Laura Duquesne Head IR
Source: Company data
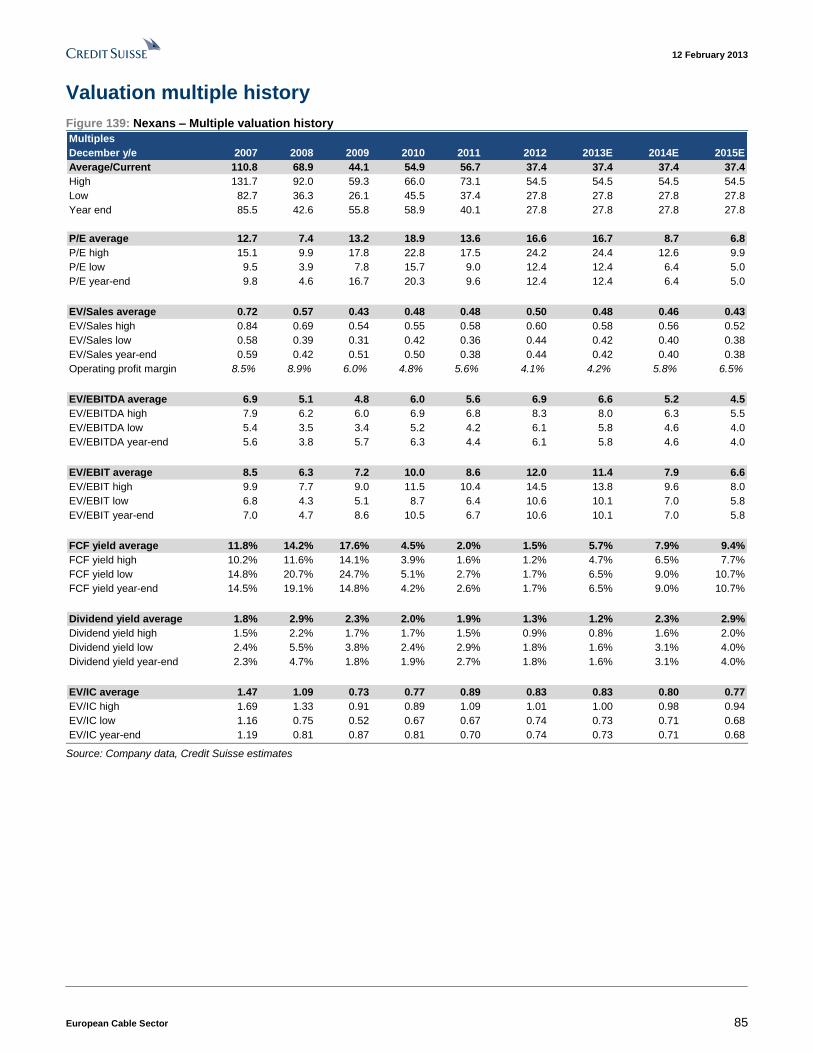
12 February 2013
European Cable Sector 85
Valuation multiple history
Figure 139: Nexans – Multiple valuation history
Multiples
December y/e 2007 2008 2009 2010 2011 2012 2013E 2014E 2015E
Average/Current 110.8 68.9 44.1 54.9 56.7 37.4 37.4 37.4 37.4
High 131.7 92.0 59.3 66.0 73.1 54.5 54.5 54.5 54.5
Low 82.7 36.3 26.1 45.5 37.4 27.8 27.8 27.8 27.8
Year end 85.5 42.6 55.8 58.9 40.1 27.8 27.8 27.8 27.8
P/E average 12.7 7.4 13.2 18.9 13.6 16.6 16.7 8.7 6.8
P/E high 15.1 9.9 17.8 22.8 17.5 24.2 24.4 12.6 9.9
P/E low 9.5 3.9 7.8 15.7 9.0 12.4 12.4 6.4 5.0
P/E year-end 9.8 4.6 16.7 20.3 9.6 12.4 12.4 6.4 5.0
EV/Sales average 0.72 0.57 0.43 0.48 0.48 0.50 0.48 0.46 0.43
EV/Sales high 0.84 0.69 0.54 0.55 0.58 0.60 0.58 0.56 0.52
EV/Sales low 0.58 0.39 0.31 0.42 0.36 0.44 0.42 0.40 0.38
EV/Sales year-end 0.59 0.42 0.51 0.50 0.38 0.44 0.42 0.40 0.38
Operating profit margin 8.5% 8.9% 6.0% 4.8% 5.6% 4.1% 4.2% 5.8% 6.5%
EV/EBITDA average 6.9 5.1 4.8 6.0 5.6 6.9 6.6 5.2 4.5
EV/EBITDA high 7.9 6.2 6.0 6.9 6.8 8.3 8.0 6.3 5.5
EV/EBITDA low 5.4 3.5 3.4 5.2 4.2 6.1 5.8 4.6 4.0
EV/EBITDA year-end 5.6 3.8 5.7 6.3 4.4 6.1 5.8 4.6 4.0
EV/EBIT average 8.5 6.3 7.2 10.0 8.6 12.0 11.4 7.9 6.6
EV/EBIT high 9.9 7.7 9.0 11.5 10.4 14.5 13.8 9.6 8.0
EV/EBIT low 6.8 4.3 5.1 8.7 6.4 10.6 10.1 7.0 5.8
EV/EBIT year-end 7.0 4.7 8.6 10.5 6.7 10.6 10.1 7.0 5.8
FCF yield average 11.8% 14.2% 17.6% 4.5% 2.0% 1.5% 5.7% 7.9% 9.4%
FCF yield high 10.2% 11.6% 14.1% 3.9% 1.6% 1.2% 4.7% 6.5% 7.7%
FCF yield low 14.8% 20.7% 24.7% 5.1% 2.7% 1.7% 6.5% 9.0% 10.7%
FCF yield year-end 14.5% 19.1% 14.8% 4.2% 2.6% 1.7% 6.5% 9.0% 10.7%
Dividend yield average 1.8% 2.9% 2.3% 2.0% 1.9% 1.3% 1.2% 2.3% 2.9%
Dividend yield high 1.5% 2.2% 1.7% 1.7% 1.5% 0.9% 0.8% 1.6% 2.0%
Dividend yield low 2.4% 5.5% 3.8% 2.4% 2.9% 1.8% 1.6% 3.1% 4.0%
Dividend yield year-end 2.3% 4.7% 1.8% 1.9% 2.7% 1.8% 1.6% 3.1% 4.0%
EV/IC average 1.47 1.09 0.73 0.77 0.89 0.83 0.83 0.80 0.77
EV/IC high 1.69 1.33 0.91 0.89 1.09 1.01 1.00 0.98 0.94
EV/IC low 1.16 0.75 0.52 0.67 0.67 0.74 0.73 0.71 0.68
EV/IC year-end 1.19 0.81 0.87 0.81 0.70 0.74 0.73 0.71 0.68 Source: Company data, Credit Suisse estimates
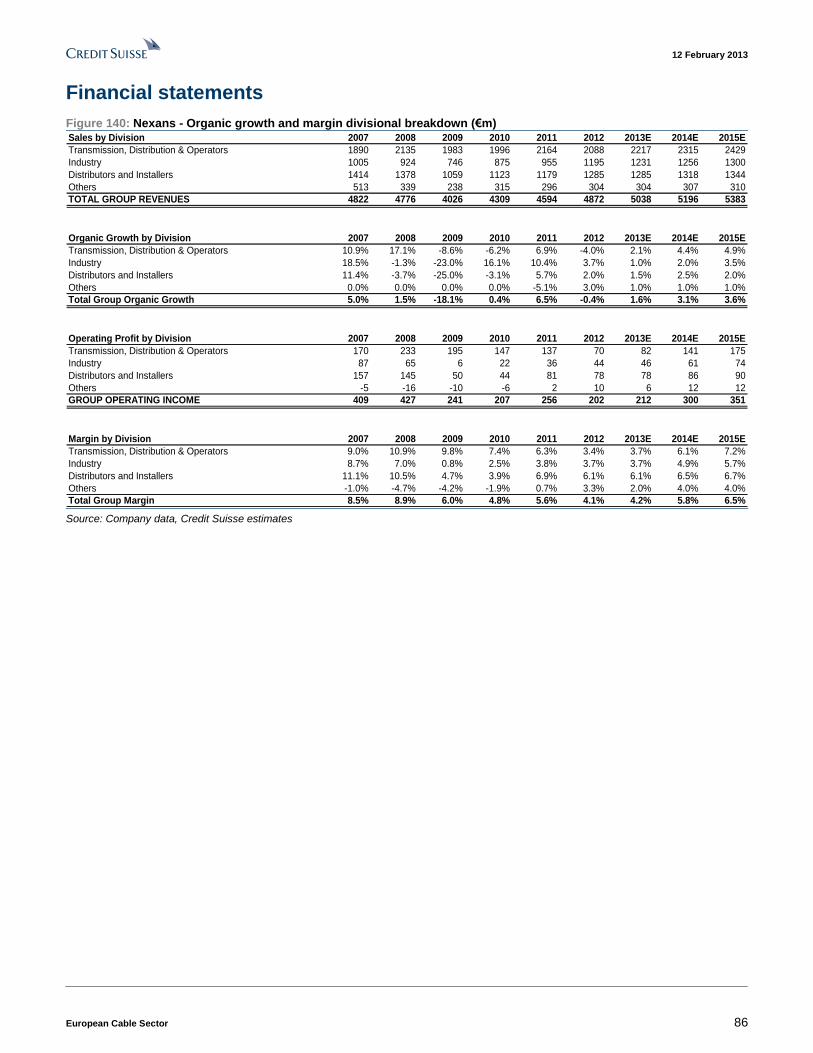
12 February 2013
European Cable Sector 86
Financial statements
Figure 140: Nexans - Organic growth and margin divisional breakdown (€m) Sales by Division 2007 2008 2009 2010 2011 2012 2013E 2014E 2015E
Transmission, Distribution & Operators 1890 2135 1983 1996 2164 2088 2217 2315 2429
Industry 1005 924 746 875 955 1195 1231 1256 1300
Distributors and Installers 1414 1378 1059 1123 1179 1285 1285 1318 1344
Others 513 339 238 315 296 304 304 307 310
TOTAL GROUP REVENUES 4822 4776 4026 4309 4594 4872 5038 5196 5383
Organic Growth by Division 2007 2008 2009 2010 2011 2012 2013E 2014E 2015E
Transmission, Distribution & Operators 10.9% 17.1% -8.6% -6.2% 6.9% -4.0% 2.1% 4.4% 4.9%
Industry 18.5% -1.3% -23.0% 16.1% 10.4% 3.7% 1.0% 2.0% 3.5%
Distributors and Installers 11.4% -3.7% -25.0% -3.1% 5.7% 2.0% 1.5% 2.5% 2.0%
Others 0.0% 0.0% 0.0% 0.0% -5.1% 3.0% 1.0% 1.0% 1.0%
Total Group Organic Growth 5.0% 1.5% -18.1% 0.4% 6.5% -0.4% 1.6% 3.1% 3.6%
Operating Profit by Division 2007 2008 2009 2010 2011 2012 2013E 2014E 2015E
Transmission, Distribution & Operators 170 233 195 147 137 70 82 141 175
Industry 87 65 6 22 36 44 46 61 74
Distributors and Installers 157 145 50 44 81 78 78 86 90
Others -5 -16 -10 -6 2 10 6 12 12
GROUP OPERATING INCOME 409 427 241 207 256 202 212 300 351
Margin by Division 2007 2008 2009 2010 2011 2012 2013E 2014E 2015E
Transmission, Distribution & Operators 9.0% 10.9% 9.8% 7.4% 6.3% 3.4% 3.7% 6.1% 7.2%
Industry 8.7% 7.0% 0.8% 2.5% 3.8% 3.7% 3.7% 4.9% 5.7%
Distributors and Installers 11.1% 10.5% 4.7% 3.9% 6.9% 6.1% 6.1% 6.5% 6.7%
Others -1.0% -4.7% -4.2% -1.9% 0.7% 3.3% 2.0% 4.0% 4.0%
Total Group Margin 8.5% 8.9% 6.0% 4.8% 5.6% 4.1% 4.2% 5.8% 6.5% Source: Company data, Credit Suisse estimates

12 February 2013
European Cable Sector 87
Figure 141: Nexans – Income statement (€m) P&L 2007 2008 2009 2010 2011 2012 2013E 2014E 2015E
GROUP REVENUE (at constant metals prices 4822 4776 4026 4309 4594 4872 5038 5196 5383
Cost of Sales (constant metal prices) -3930 -3819 -3274 -3569 -3767 -4046 -4156 -4271 -4419GROSS PROFIT 892 957 752 740 827 826 882 925 963
as a % of sales 18% 20% 19% 17% 18% 17% 18% 18% 18%
Sales General and Administration (includes D&A) -483 -530 -511 -533 -571 -624 -670 -625 -612
as a % of sales 10% 11% 13% 12% 12% 13% 13% 12% 11%UNDERLYING OPERATING PROFIT 409 427 241 207 256 202 212 300 351
Operating Margin 8% 9% 6% 5% 6% 4% 4% 6% 7%
Depreciation, Amortization and Impairment (ex Goodwill) -101 -106 -121 -138 -136 -151 -156 -156 -161UNDERLYING EBITDA 510 533 362 345 392 353 368 456 513
TOTAL ADJUSTMENTS -47 -213 -88 -2 -304 -60 -40 -42 -43
of which restructuring 14 22 119 57 22OPERATING PROFIT 362 214 153 205 -48 142 172 259 308
Financial Income / (Expense) -81 -79 -102 -95 -107 -112 -120 -120 -120
PROFIT BEFORE TAX 281 135 51 110 -155 30 52 139 188UNDERLYING PROFIT BEFORE TAX 328 348 139 112 149 90 92 180 231
Income tax expenses -84 -51 -39 -26 -31 -5 -16 -42 -57
effective tax rate -30% -38% -76% -24% 20% -17% -30% -30% -30%
Underlying Tax rate -30% -30% -30% -25% -25% -28% -30% -30% -30%PROFIT AFTER TAX 197 84 12 84 -186 25 36 97 132
UNDERLYING PROFIT AFTER TAX 230 244 97 84 112 65 64 126 162
Minority interest 7 2 4 2 -8 -2 -2 -2 -2NET INCOME 190 82 8 82 -178 27 38 99 134
UNDERLYING NET INCOME 223 242 93 82 120 67 66 128 164
Impact of Interest Exp. Net of Tax 9 11 16 10 0 0 0 0 0NET INCOME 199 93 24 92 -178 27 38 99 134
UNDELYING NET INCOME 232 253 109 92 120 67 66 128 164
Reported Basic EPS 7.4 3.1 0.3 2.9 -6.2 0.9 1.3 3.3 4.5
Reported Diluted EPS 6.7 3.1 0.7 2.6 -6.2 0.9 1.3 3.3 4.5
UNDERLYING EPS (basic) 8.7 9.3 3.3 2.9 4.2 2.2 2.2 4.3 5.5
UNDERLYING EPS (diluted) 7.7 8.4 3.2 2.6 4.2 2.2 2.2 4.3 5.5
DIVIDEND PER SHARE 2 2 1 1.10 1.10 0.50 0.45 0.86 1.10
Payout Ratio 0.23 0.22 0.30 0.38 0.26 0.22 0.20 0.20 0.20 Source: Company data, Credit Suisse estimates
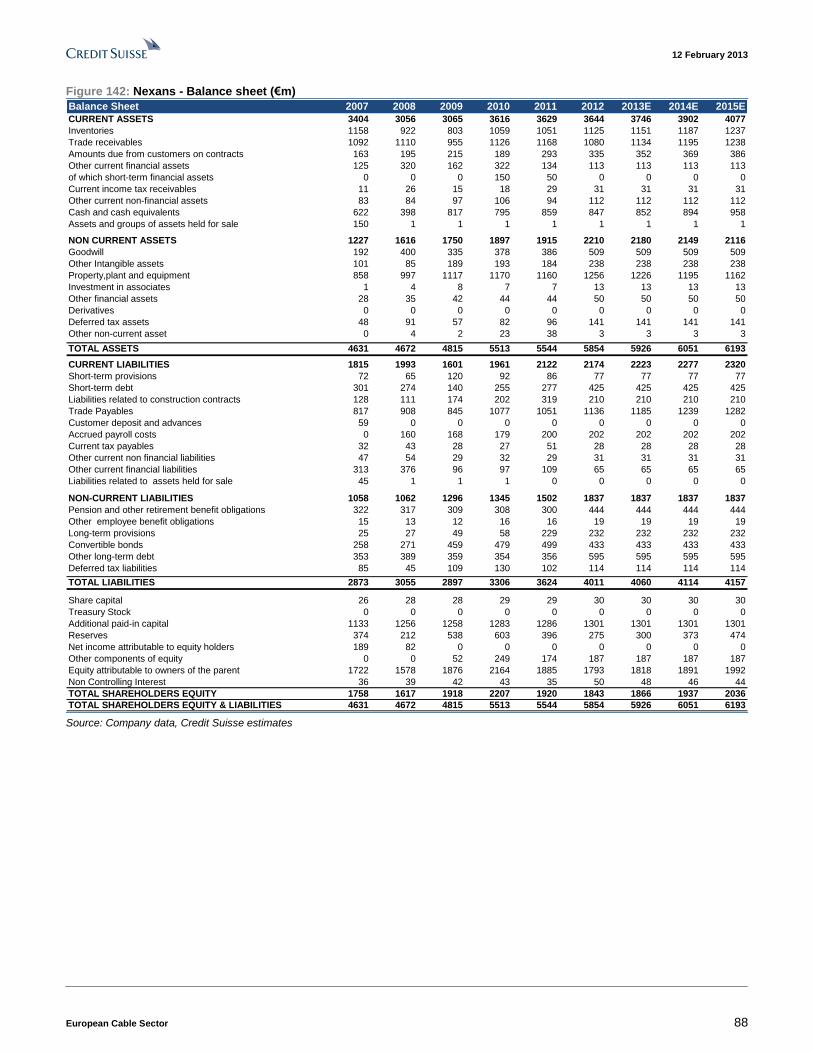
12 February 2013
European Cable Sector 88
Figure 142: Nexans - Balance sheet (€m)
Balance Sheet 2007 2008 2009 2010 2011 2012 2013E 2014E 2015E
CURRENT ASSETS 3404 3056 3065 3616 3629 3644 3746 3902 4077
Inventories 1158 922 803 1059 1051 1125 1151 1187 1237
Trade receivables 1092 1110 955 1126 1168 1080 1134 1195 1238
Amounts due from customers on contracts 163 195 215 189 293 335 352 369 386
Other current financial assets 125 320 162 322 134 113 113 113 113
of which short-term financial assets 0 0 0 150 50 0 0 0 0
Current income tax receivables 11 26 15 18 29 31 31 31 31
Other current non-financial assets 83 84 97 106 94 112 112 112 112
Cash and cash equivalents 622 398 817 795 859 847 852 894 958
Assets and groups of assets held for sale 150 1 1 1 1 1 1 1 1
NON CURRENT ASSETS 1227 1616 1750 1897 1915 2210 2180 2149 2116
Goodwill 192 400 335 378 386 509 509 509 509
Other Intangible assets 101 85 189 193 184 238 238 238 238
Property,plant and equipment 858 997 1117 1170 1160 1256 1226 1195 1162
Investment in associates 1 4 8 7 7 13 13 13 13
Other financial assets 28 35 42 44 44 50 50 50 50
Derivatives 0 0 0 0 0 0 0 0 0
Deferred tax assets 48 91 57 82 96 141 141 141 141
Other non-current asset 0 4 2 23 38 3 3 3 3
TOTAL ASSETS 4631 4672 4815 5513 5544 5854 5926 6051 6193
CURRENT LIABILITIES 1815 1993 1601 1961 2122 2174 2223 2277 2320
Short-term provisions 72 65 120 92 86 77 77 77 77
Short-term debt 301 274 140 255 277 425 425 425 425
Liabilities related to construction contracts 128 111 174 202 319 210 210 210 210
Trade Payables 817 908 845 1077 1051 1136 1185 1239 1282
Customer deposit and advances 59 0 0 0 0 0 0 0 0
Accrued payroll costs 0 160 168 179 200 202 202 202 202
Current tax payables 32 43 28 27 51 28 28 28 28
Other current non financial liabilities 47 54 29 32 29 31 31 31 31
Other current financial liabilities 313 376 96 97 109 65 65 65 65
Liabilities related to assets held for sale 45 1 1 1 0 0 0 0 0
NON-CURRENT LIABILITIES 1058 1062 1296 1345 1502 1837 1837 1837 1837
Pension and other retirement benefit obligations 322 317 309 308 300 444 444 444 444
Other employee benefit obligations 15 13 12 16 16 19 19 19 19
Long-term provisions 25 27 49 58 229 232 232 232 232
Convertible bonds 258 271 459 479 499 433 433 433 433
Other long-term debt 353 389 359 354 356 595 595 595 595
Deferred tax liabilities 85 45 109 130 102 114 114 114 114
TOTAL LIABILITIES 2873 3055 2897 3306 3624 4011 4060 4114 4157
Share capital 26 28 28 29 29 30 30 30 30
Treasury Stock 0 0 0 0 0 0 0 0 0
Additional paid-in capital 1133 1256 1258 1283 1286 1301 1301 1301 1301
Reserves 374 212 538 603 396 275 300 373 474
Net income attributable to equity holders 189 82 0 0 0 0 0 0 0
Other components of equity 0 0 52 249 174 187 187 187 187
Equity attributable to owners of the parent 1722 1578 1876 2164 1885 1793 1818 1891 1992
Non Controlling Interest 36 39 42 43 35 50 48 46 44
TOTAL SHAREHOLDERS EQUITY 1758 1617 1918 2207 1920 1843 1866 1937 2036
TOTAL SHAREHOLDERS EQUITY & LIABILITIES 4631 4672 4815 5513 5544 5854 5926 6051 6193 Source: Company data, Credit Suisse estimates
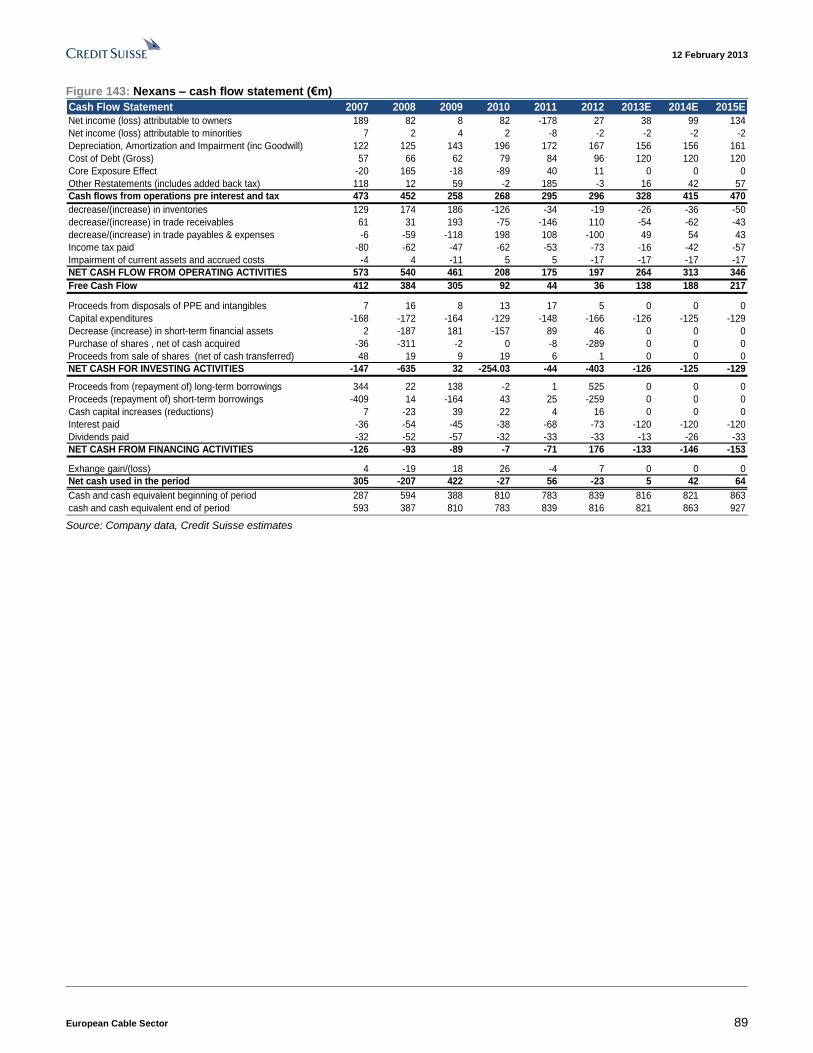
12 February 2013
European Cable Sector 89
Figure 143: Nexans – cash flow statement (€m)
Cash Flow Statement 2007 2008 2009 2010 2011 2012 2013E 2014E 2015E
Net income (loss) attributable to owners 189 82 8 82 -178 27 38 99 134
Net income (loss) attributable to minorities 7 2 4 2 -8 -2 -2 -2 -2
Depreciation, Amortization and Impairment (inc Goodwill) 122 125 143 196 172 167 156 156 161
Cost of Debt (Gross) 57 66 62 79 84 96 120 120 120
Core Exposure Effect -20 165 -18 -89 40 11 0 0 0
Other Restatements (includes added back tax) 118 12 59 -2 185 -3 16 42 57
Cash flows from operations pre interest and tax 473 452 258 268 295 296 328 415 470
decrease/(increase) in inventories 129 174 186 -126 -34 -19 -26 -36 -50
decrease/(increase) in trade receivables 61 31 193 -75 -146 110 -54 -62 -43
decrease/(increase) in trade payables & expenses -6 -59 -118 198 108 -100 49 54 43
Income tax paid -80 -62 -47 -62 -53 -73 -16 -42 -57
Impairment of current assets and accrued costs -4 4 -11 5 5 -17 -17 -17 -17
NET CASH FLOW FROM OPERATING ACTIVITIES 573 540 461 208 175 197 264 313 346
Free Cash Flow 412 384 305 92 44 36 138 188 217
Proceeds from disposals of PPE and intangibles 7 16 8 13 17 5 0 0 0
Capital expenditures -168 -172 -164 -129 -148 -166 -126 -125 -129
Decrease (increase) in short-term financial assets 2 -187 181 -157 89 46 0 0 0
Purchase of shares , net of cash acquired -36 -311 -2 0 -8 -289 0 0 0
Proceeds from sale of shares (net of cash transferred) 48 19 9 19 6 1 0 0 0
NET CASH FOR INVESTING ACTIVITIES -147 -635 32 -254.03 -44 -403 -126 -125 -129
Proceeds from (repayment of) long-term borrowings 344 22 138 -2 1 525 0 0 0
Proceeds (repayment of) short-term borrowings -409 14 -164 43 25 -259 0 0 0
Cash capital increases (reductions) 7 -23 39 22 4 16 0 0 0
Interest paid -36 -54 -45 -38 -68 -73 -120 -120 -120
Dividends paid -32 -52 -57 -32 -33 -33 -13 -26 -33
NET CASH FROM FINANCING ACTIVITIES -126 -93 -89 -7 -71 176 -133 -146 -153
Exhange gain/(loss) 4 -19 18 26 -4 7 0 0 0
Net cash used in the period 305 -207 422 -27 56 -23 5 42 64
Cash and cash equivalent beginning of period 287 594 388 810 783 839 816 821 863
cash and cash equivalent end of period 593 387 810 783 839 816 821 863 927 Source: Company data, Credit Suisse estimates
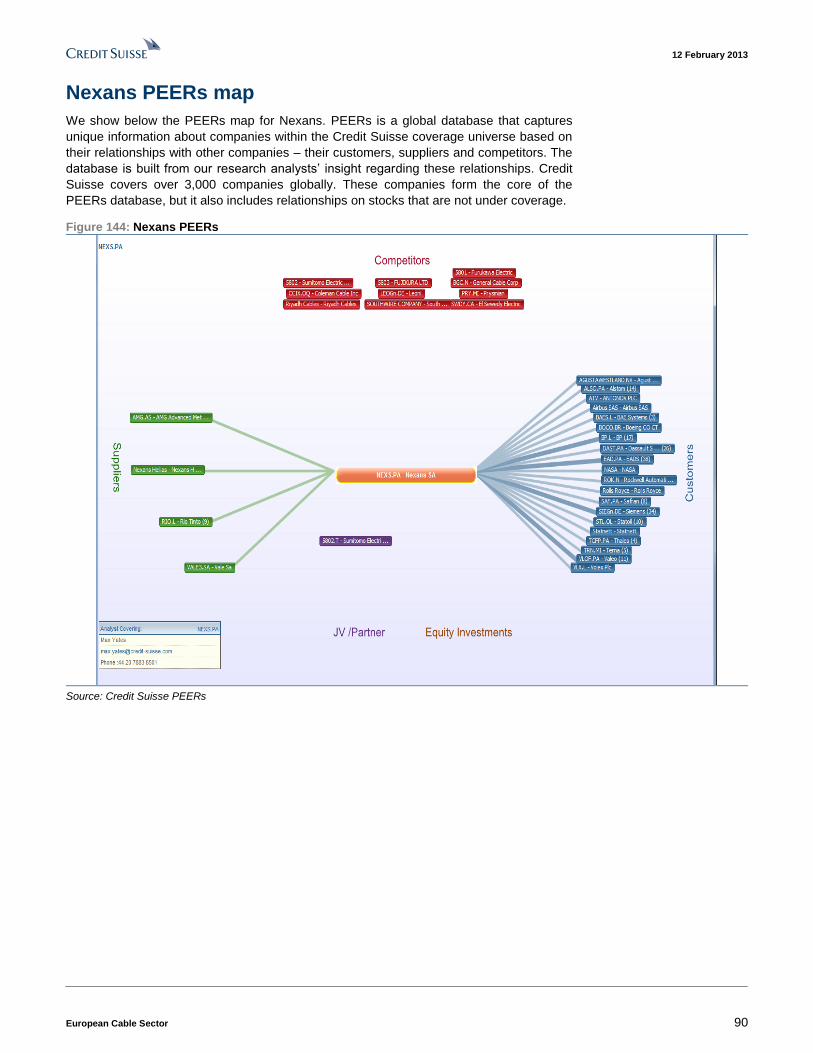
12 February 2013
European Cable Sector 90
Nexans PEERs map
We show below the PEERs map for Nexans. PEERs is a global database that captures
unique information about companies within the Credit Suisse coverage universe based on
their relationships with other companies – their customers, suppliers and competitors. The
database is built from our research analysts’ insight regarding these relationships. Credit
Suisse covers over 3,000 companies globally. These companies form the core of the
PEERs database, but it also includes relationships on stocks that are not under coverage.
Figure 144: Nexans PEERs
Source: Credit Suisse PEERs
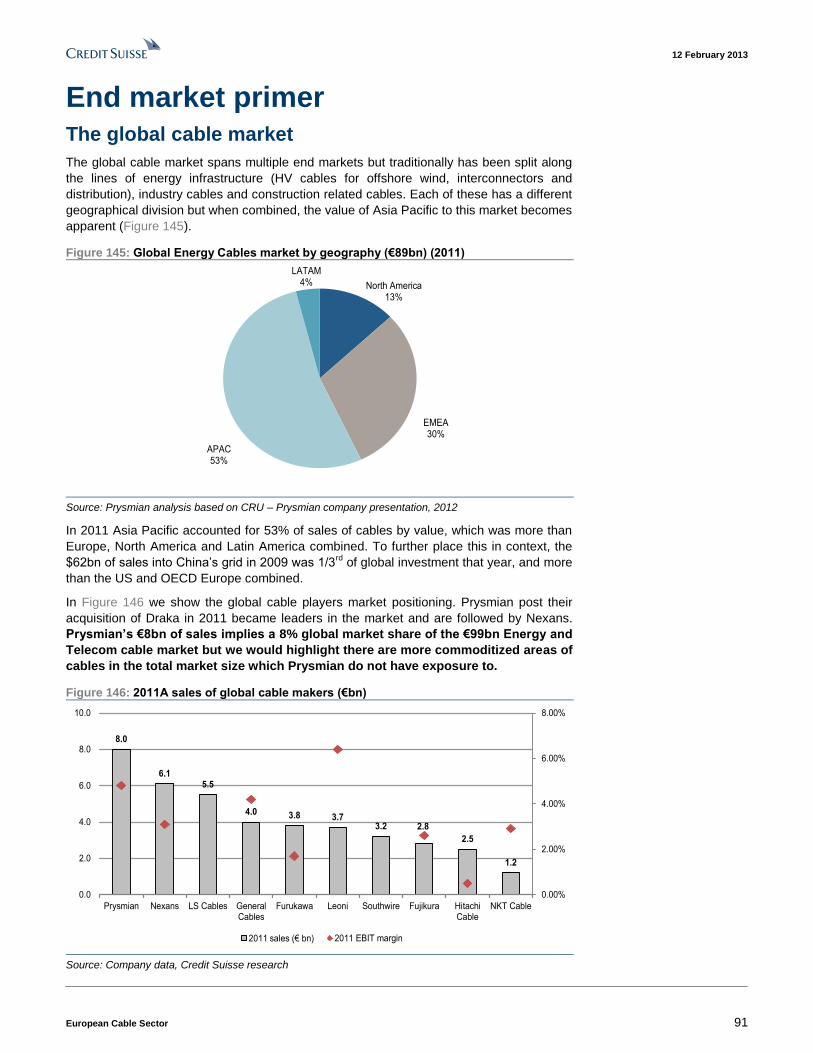
12 February 2013
European Cable Sector 91
End market primer The global cable market
The global cable market spans multiple end markets but traditionally has been split along
the lines of energy infrastructure (HV cables for offshore wind, interconnectors and
distribution), industry cables and construction related cables. Each of these has a different
geographical division but when combined, the value of Asia Pacific to this market becomes
apparent (Figure 145).
Figure 145: Global Energy Cables market by geography (€89bn) (2011)
North America13%
EMEA30%
APAC53%
LATAM4%
Source: Prysmian analysis based on CRU – Prysmian company presentation, 2012
In 2011 Asia Pacific accounted for 53% of sales of cables by value, which was more than
Europe, North America and Latin America combined. To further place this in context, the
$62bn of sales into China’s grid in 2009 was 1/3rd
of global investment that year, and more
than the US and OECD Europe combined.
In Figure 146 we show the global cable players market positioning. Prysmian post their
acquisition of Draka in 2011 became leaders in the market and are followed by Nexans.
Prysmian’s €8bn of sales implies a 8% global market share of the €99bn Energy and
Telecom cable market but we would highlight there are more commoditized areas of
cables in the total market size which Prysmian do not have exposure to.
Figure 146: 2011A sales of global cable makers (€bn)
8.0
6.15.5
4.0 3.8 3.73.2 2.8
2.5
1.2
0.00%
2.00%
4.00%
6.00%
8.00%
0.0
2.0
4.0
6.0
8.0
10.0
Prysmian Nexans LS Cables GeneralCables
Furukawa Leoni Southwire Fujikura HitachiCable
NKT Cable
2011 sales (€ bn) 2011 EBIT margin
Source: Company data, Credit Suisse research
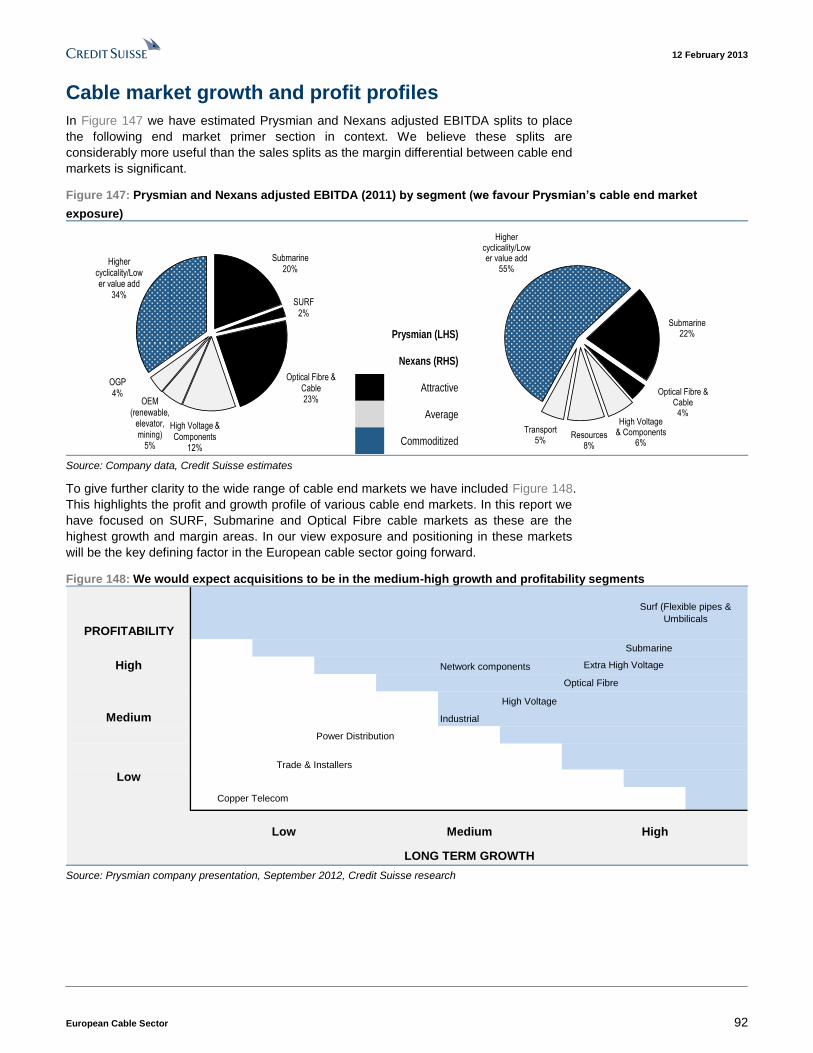
12 February 2013
European Cable Sector 92
Cable market growth and profit profiles
In Figure 147 we have estimated Prysmian and Nexans adjusted EBITDA splits to place
the following end market primer section in context. We believe these splits are
considerably more useful than the sales splits as the margin differential between cable end
markets is significant.
Figure 147: Prysmian and Nexans adjusted EBITDA (2011) by segment (we favour Prysmian’s cable end market
exposure)
Submarine20%
SURF2%
Optical Fibre & Cable23%
High Voltage & Components
12%
OEM (renewable,
elevator, mining)
5%
OGP4%
Higher cyclicality/Lower value add
34%
Prysmian (LHS)
Nexans (RHS)
Attractive
Average
Commoditized
Submarine22%
Optical Fibre & Cable
4%High Voltage
& Components6%
Resources8%
Transport5%
Higher cyclicality/Lower value add
55%
Source: Company data, Credit Suisse estimates
To give further clarity to the wide range of cable end markets we have included Figure 148.
This highlights the profit and growth profile of various cable end markets. In this report we
have focused on SURF, Submarine and Optical Fibre cable markets as these are the
highest growth and margin areas. In our view exposure and positioning in these markets
will be the key defining factor in the European cable sector going forward.
Figure 148: We would expect acquisitions to be in the medium-high growth and profitability segments
Submarine
Network components
Optical Fibre
High Voltage
Industrial
Power Distribution
LONG TERM GROWTH
Surf (Flexible pipes &
Umbilicals
Extra High Voltage
PROFITABILITY
Low Medium High
Copper Telecom
High
Medium
LowTrade & Installers
Source: Prysmian company presentation, September 2012, Credit Suisse research
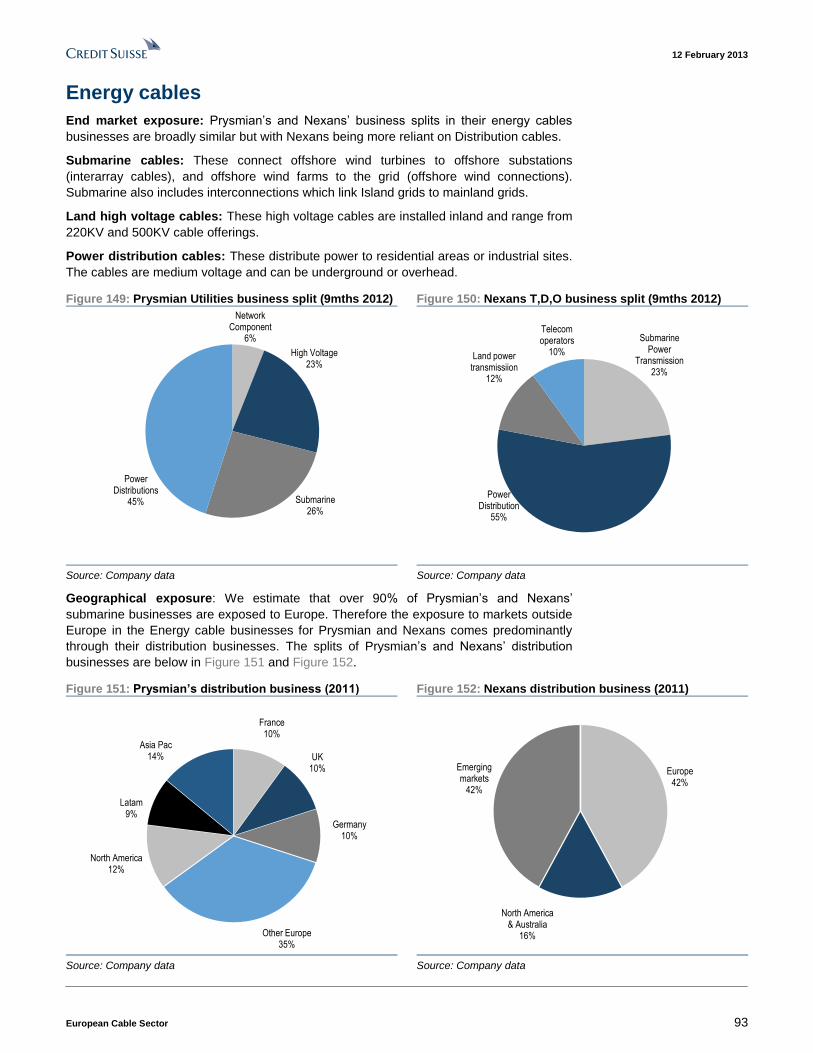
12 February 2013
European Cable Sector 93
Energy cables
End market exposure: Prysmian’s and Nexans’ business splits in their energy cables
businesses are broadly similar but with Nexans being more reliant on Distribution cables.
Submarine cables: These connect offshore wind turbines to offshore substations
(interarray cables), and offshore wind farms to the grid (offshore wind connections).
Submarine also includes interconnections which link Island grids to mainland grids.
Land high voltage cables: These high voltage cables are installed inland and range from
220KV and 500KV cable offerings.
Power distribution cables: These distribute power to residential areas or industrial sites.
The cables are medium voltage and can be underground or overhead.
Figure 149: Prysmian Utilities business split (9mths 2012) Figure 150: Nexans T,D,O business split (9mths 2012)
Network Component
6%
High Voltage23%
Submarine26%
Power Distributions
45%
Submarine Power
Transmission23%
Power Distribution
55%
Land power transmissiion
12%
Telecom operators
10%
Source: Company data Source: Company data
Geographical exposure: We estimate that over 90% of Prysmian’s and Nexans’
submarine businesses are exposed to Europe. Therefore the exposure to markets outside
Europe in the Energy cable businesses for Prysmian and Nexans comes predominantly
through their distribution businesses. The splits of Prysmian’s and Nexans’ distribution
businesses are below in Figure 151 and Figure 152.
Figure 151: Prysmian’s distribution business (2011) Figure 152: Nexans distribution business (2011)
France 10%
UK 10%
Germany10%
Other Europe35%
North America12%
Latam9%
Asia Pac14%
Europe42%
North America & Australia
16%
Emerging markets
42%
Source: Company data Source: Company data
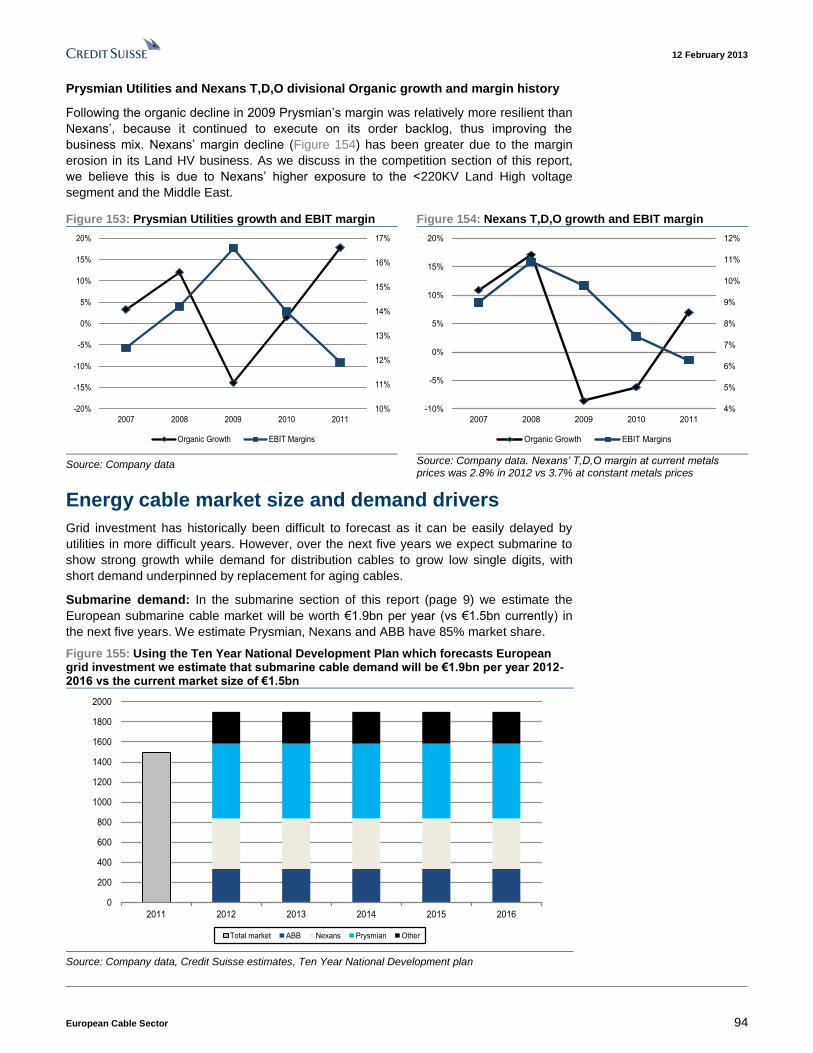
12 February 2013
European Cable Sector 94
Prysmian Utilities and Nexans T,D,O divisional Organic growth and margin history
Following the organic decline in 2009 Prysmian’s margin was relatively more resilient than
Nexans’, because it continued to execute on its order backlog, thus improving the
business mix. Nexans’ margin decline (Figure 154) has been greater due to the margin
erosion in its Land HV business. As we discuss in the competition section of this report,
we believe this is due to Nexans’ higher exposure to the <220KV Land High voltage
segment and the Middle East.
Figure 153: Prysmian Utilities growth and EBIT margin Figure 154: Nexans T,D,O growth and EBIT margin
10%
11%
12%
13%
14%
15%
16%
17%
-20%
-15%
-10%
-5%
0%
5%
10%
15%
20%
2007 2008 2009 2010 2011
Organic Growth EBIT Margins
4%
5%
6%
7%
8%
9%
10%
11%
12%
-10%
-5%
0%
5%
10%
15%
20%
2007 2008 2009 2010 2011
Organic Growth EBIT Margins
Source: Company data Source: Company data. Nexans’ T,D,O margin at current metals
prices was 2.8% in 2012 vs 3.7% at constant metals prices
Energy cable market size and demand drivers
Grid investment has historically been difficult to forecast as it can be easily delayed by
utilities in more difficult years. However, over the next five years we expect submarine to
show strong growth while demand for distribution cables to grow low single digits, with
short demand underpinned by replacement for aging cables.
Submarine demand: In the submarine section of this report (page 9) we estimate the
European submarine cable market will be worth €1.9bn per year (vs €1.5bn currently) in
the next five years. We estimate Prysmian, Nexans and ABB have 85% market share.
Figure 155: Using the Ten Year National Development Plan which forecasts European grid investment we estimate that submarine cable demand will be €1.9bn per year 2012-2016 vs the current market size of €1.5bn
0
200
400
600
800
1000
1200
1400
1600
1800
2000
2011 2012 2013 2014 2015 2016
Total market ABB Nexans Prysmian Other
Source: Company data, Credit Suisse estimates, Ten Year National Development plan

12 February 2013
European Cable Sector 95
In our view demand for submarine cables is driven by two factors:
1) Increasing share of renewables in the mix: Renewable additions are commonly
away from areas of high electricity demand, placing greater emphasis on an
efficient grid.
2) Security of supply: Transmitting electricity from areas with high generating
capacity to countries of high electricity demand.
In our view the planned offshore wind additions support the view that submarine cables
are a structurally growing market. Offshore wind is forecast a CAGR of 117% (source:
EWEA) from 2011-2020 and the Prysmian, Nexans and ABB will play a key role in
connecting this to the grid.
Figure 156: Installed offshore wind capacity and planned additions(MW)
Country 2011 Installations Cumulative Installations 2011-2020 CAGR Planned offshore capacity
China 108 258 39% 5000 total targeted by 2015 and 30000 by 2020
France 0 0 339% 6000 by 2020 (tender for 3000 launched in 2011)
Germany 108 200 54% 10000 by 2020 (2000 now under construction)
UK 752 2094 22% 13000 by 2020
EU 866 3813 117% 40000 total by 2020
Source: The 40,000MW in the EU by 2020 is a European Wind Energy association forecast.
Land high voltage and Power Distribution cable demand:
Investment in land high voltage and distribution is driven by electricity demand. We would
also highlight that an element of grid investment is driven by replacement demand, as
across the world c5% of the grid is greater than 40 years old (Figure 157). However,
electricity demand is likely to remain relatively weak in developed markets as it is driven
GDP growth. Credit Suisse forecasts 0.5% growth in 2013 in Europe, and 2% in the US.
In Europe the authorities have taken a proactive approach to grid management and
despite weak demand for electricity, grid investment has continued. In contrast, the US
market has been more reactionary in its approach to grid investment in the face of low
electricity demand. We would expect this trend to continue in 2013 but would highlight that
in the medium term, once electricity growth accelerates, significant investment will be
required to upgrade the US grid.
Figure 157: % of T&D infrastructure in place in 2009 reaching 40 years of age by 2015
0%
5%
10%
15%
20%
25%
OECD
Europe
US OECD
Asia Oc.
China India Middle
East
Latin
America
Africa
% of T&D >40 years old by 2015
Source: IEA World Energy Outlook 2011
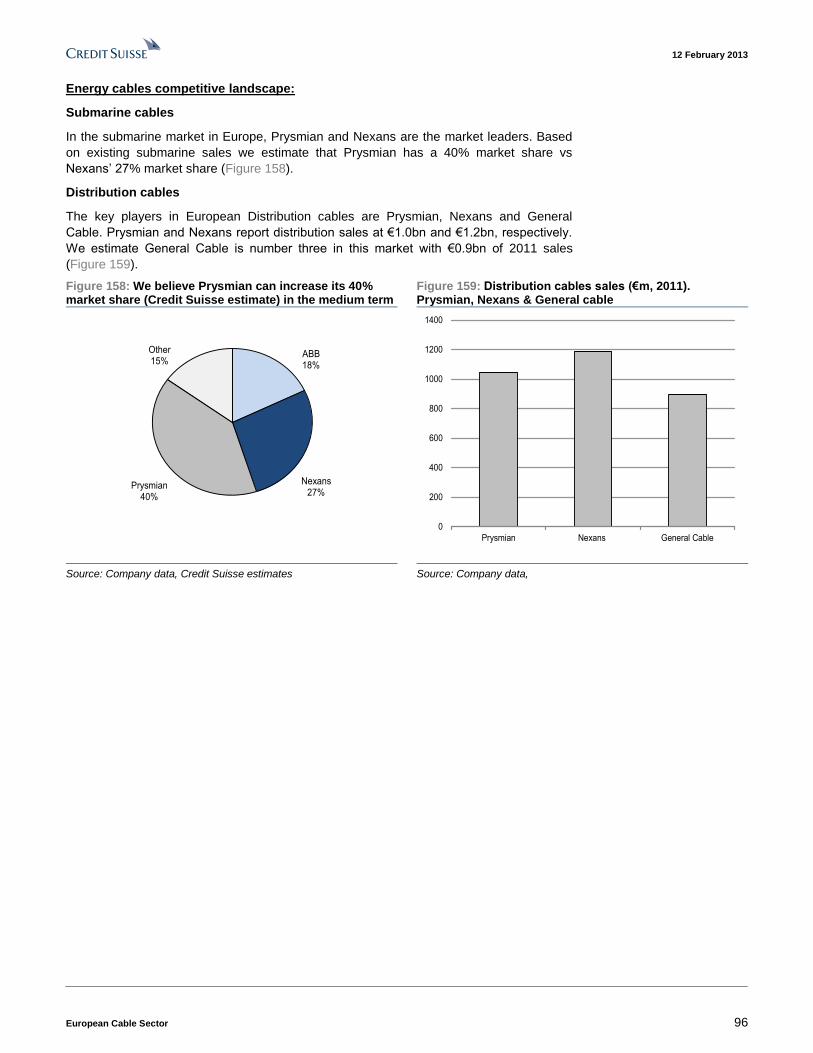
12 February 2013
European Cable Sector 96
Energy cables competitive landscape:
Submarine cables
In the submarine market in Europe, Prysmian and Nexans are the market leaders. Based
on existing submarine sales we estimate that Prysmian has a 40% market share vs
Nexans’ 27% market share (Figure 158).
Distribution cables
The key players in European Distribution cables are Prysmian, Nexans and General
Cable. Prysmian and Nexans report distribution sales at €1.0bn and €1.2bn, respectively.
We estimate General Cable is number three in this market with €0.9bn of 2011 sales
(Figure 159).
Figure 158: We believe Prysmian can increase its 40% market share (Credit Suisse estimate) in the medium term
Figure 159: Distribution cables sales (€m, 2011). Prysmian, Nexans & General cable
ABB18%
Nexans 27%
Prysmian40%
Other15%
0
200
400
600
800
1000
1200
1400
Prysmian Nexans General Cable
Source: Company data, Credit Suisse estimates Source: Company data,
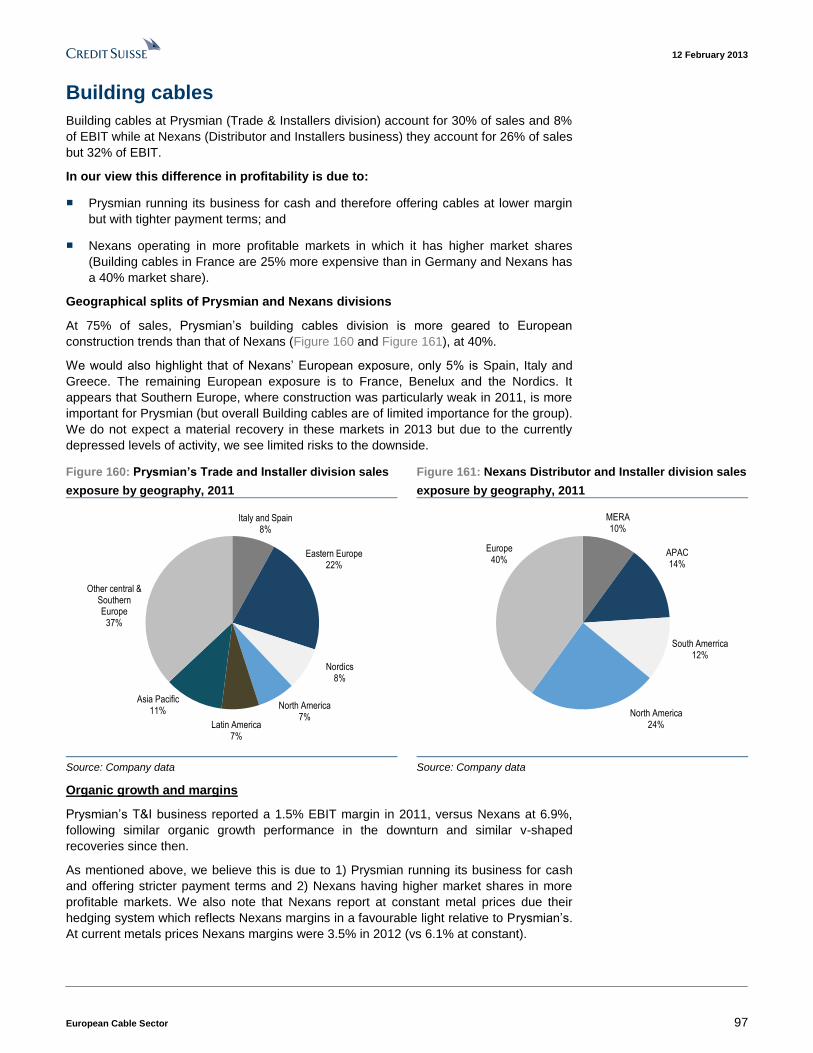
12 February 2013
European Cable Sector 97
Building cables
Building cables at Prysmian (Trade & Installers division) account for 30% of sales and 8%
of EBIT while at Nexans (Distributor and Installers business) they account for 26% of sales
but 32% of EBIT.
In our view this difference in profitability is due to:
■ Prysmian running its business for cash and therefore offering cables at lower margin
but with tighter payment terms; and
■ Nexans operating in more profitable markets in which it has higher market shares
(Building cables in France are 25% more expensive than in Germany and Nexans has
a 40% market share).
Geographical splits of Prysmian and Nexans divisions
At 75% of sales, Prysmian’s building cables division is more geared to European
construction trends than that of Nexans (Figure 160 and Figure 161), at 40%.
We would also highlight that of Nexans’ European exposure, only 5% is Spain, Italy and
Greece. The remaining European exposure is to France, Benelux and the Nordics. It
appears that Southern Europe, where construction was particularly weak in 2011, is more
important for Prysmian (but overall Building cables are of limited importance for the group).
We do not expect a material recovery in these markets in 2013 but due to the currently
depressed levels of activity, we see limited risks to the downside.
Figure 160: Prysmian’s Trade and Installer division sales
exposure by geography, 2011
Figure 161: Nexans Distributor and Installer division sales
exposure by geography, 2011
Italy and Spain8%
Eastern Europe22%
Nordics8%
North America7%
Latin America7%
Asia Pacific11%
Other central & Southern Europe
37%
MERA10%
APAC14%
South Amerrica12%
North America24%
Europe40%
Source: Company data Source: Company data
Organic growth and margins
Prysmian’s T&I business reported a 1.5% EBIT margin in 2011, versus Nexans at 6.9%,
following similar organic growth performance in the downturn and similar v-shaped
recoveries since then.
As mentioned above, we believe this is due to 1) Prysmian running its business for cash
and offering stricter payment terms and 2) Nexans having higher market shares in more
profitable markets. We also note that Nexans report at constant metal prices due their
hedging system which reflects Nexans margins in a favourable light relative to Prysmian’s.
At current metals prices Nexans margins were 3.5% in 2012 (vs 6.1% at constant).
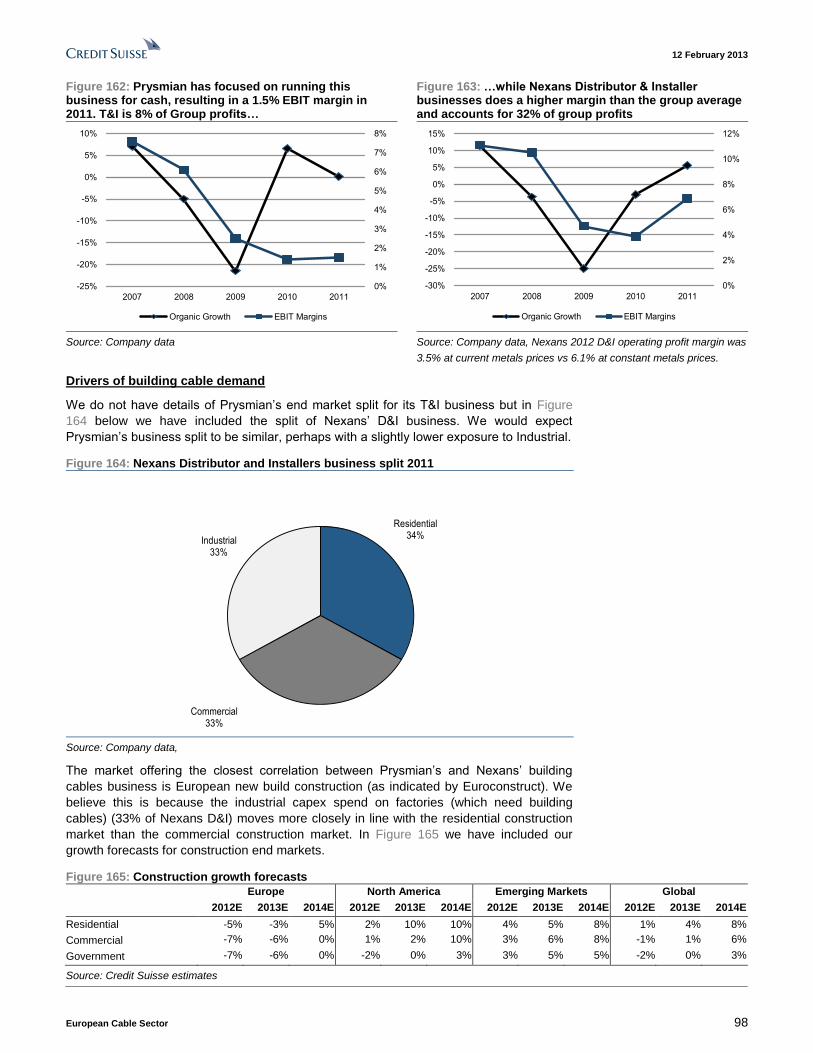
12 February 2013
European Cable Sector 98
Figure 162: Prysmian has focused on running this business for cash, resulting in a 1.5% EBIT margin in 2011. T&I is 8% of Group profits…
Figure 163: …while Nexans Distributor & Installer businesses does a higher margin than the group average and accounts for 32% of group profits
0%
1%
2%
3%
4%
5%
6%
7%
8%
-25%
-20%
-15%
-10%
-5%
0%
5%
10%
2007 2008 2009 2010 2011
Organic Growth EBIT Margins
0%
2%
4%
6%
8%
10%
12%
-30%
-25%
-20%
-15%
-10%
-5%
0%
5%
10%
15%
2007 2008 2009 2010 2011
Organic Growth EBIT Margins
Source: Company data Source: Company data, Nexans 2012 D&I operating profit margin was
3.5% at current metals prices vs 6.1% at constant metals prices.
Drivers of building cable demand
We do not have details of Prysmian’s end market split for its T&I business but in Figure
164 below we have included the split of Nexans’ D&I business. We would expect
Prysmian’s business split to be similar, perhaps with a slightly lower exposure to Industrial.
Figure 164: Nexans Distributor and Installers business split 2011
Residential34%
Commercial33%
Industrial33%
Source: Company data,
The market offering the closest correlation between Prysmian’s and Nexans’ building
cables business is European new build construction (as indicated by Euroconstruct). We
believe this is because the industrial capex spend on factories (which need building
cables) (33% of Nexans D&I) moves more closely in line with the residential construction
market than the commercial construction market. In Figure 165 we have included our
growth forecasts for construction end markets.
Figure 165: Construction growth forecasts
Europe North America Emerging Markets Global
2012E 2013E 2014E 2012E 2013E 2014E 2012E 2013E 2014E 2012E 2013E 2014E
Residential -5% -3% 5% 2% 10% 10% 4% 5% 8% 1% 4% 8%
Commercial -7% -6% 0% 1% 2% 10% 3% 6% 8% -1% 1% 6%
Government -7% -6% 0% -2% 0% 3% 3% 5% 5% -2% 0% 3%
Source: Credit Suisse estimates
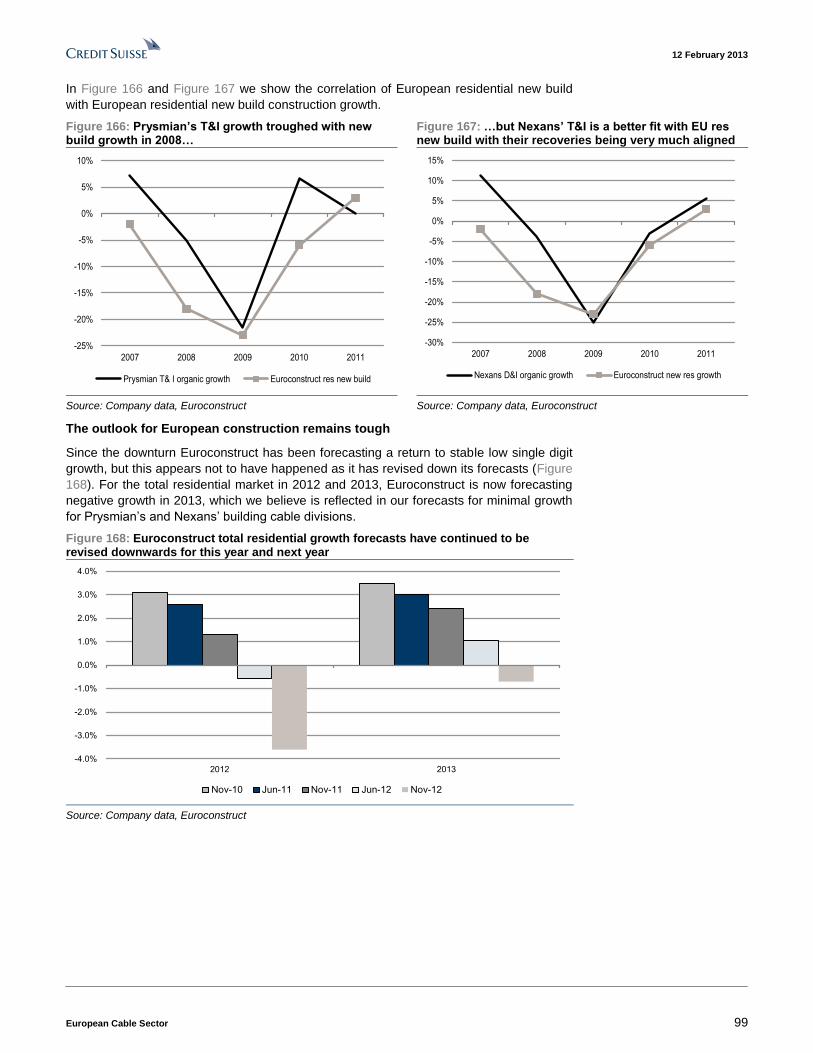
12 February 2013
European Cable Sector 99
In Figure 166 and Figure 167 we show the correlation of European residential new build
with European residential new build construction growth.
Figure 166: Prysmian’s T&I growth troughed with new build growth in 2008…
Figure 167: …but Nexans’ T&I is a better fit with EU res new build with their recoveries being very much aligned
-25%
-20%
-15%
-10%
-5%
0%
5%
10%
2007 2008 2009 2010 2011
Prysmian T& I organic growth Euroconstruct res new build
-30%
-25%
-20%
-15%
-10%
-5%
0%
5%
10%
15%
2007 2008 2009 2010 2011
Nexans D&I organic growth Euroconstruct new res growth
Source: Company data, Euroconstruct Source: Company data, Euroconstruct
The outlook for European construction remains tough
Since the downturn Euroconstruct has been forecasting a return to stable low single digit
growth, but this appears not to have happened as it has revised down its forecasts (Figure
168). For the total residential market in 2012 and 2013, Euroconstruct is now forecasting
negative growth in 2013, which we believe is reflected in our forecasts for minimal growth
for Prysmian’s and Nexans’ building cable divisions.
Figure 168: Euroconstruct total residential growth forecasts have continued to be revised downwards for this year and next year
-4.0%
-3.0%
-2.0%
-1.0%
0.0%
1.0%
2.0%
3.0%
4.0%
2012 2013
Nov-10 Jun-11 Nov-11 Jun-12 Nov-12
Source: Company data, Euroconstruct
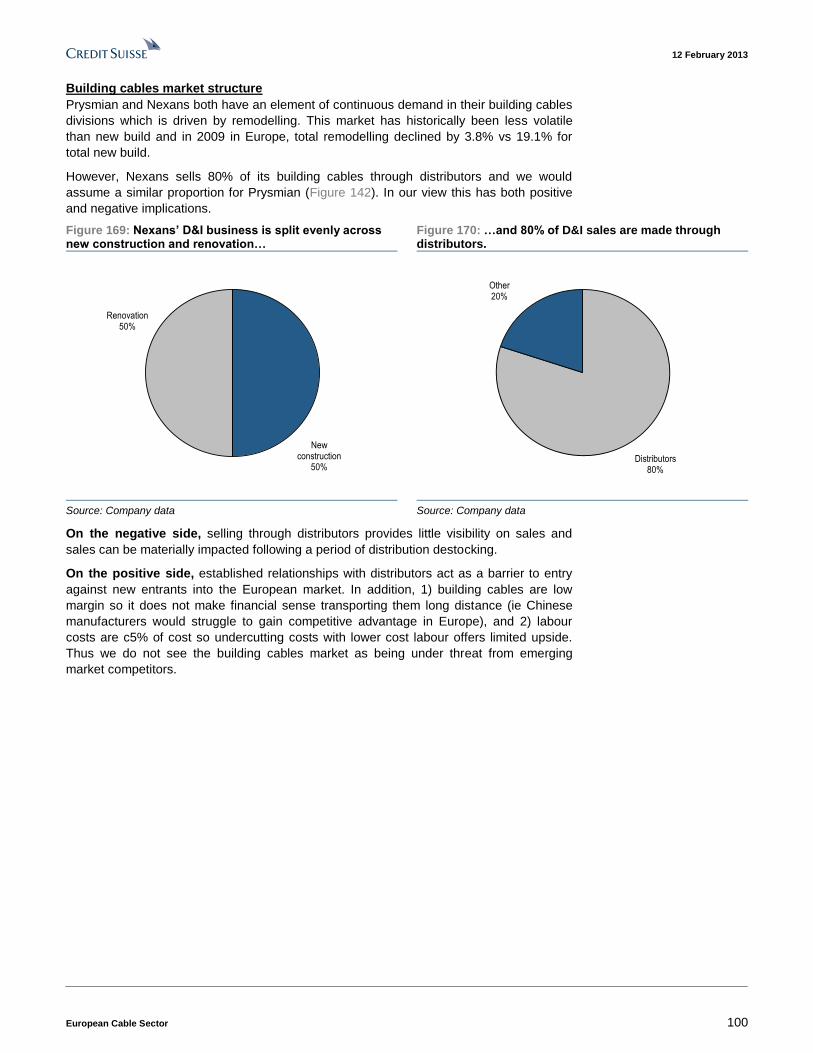
12 February 2013
European Cable Sector 100
Building cables market structure
Prysmian and Nexans both have an element of continuous demand in their building cables
divisions which is driven by remodelling. This market has historically been less volatile
than new build and in 2009 in Europe, total remodelling declined by 3.8% vs 19.1% for
total new build.
However, Nexans sells 80% of its building cables through distributors and we would
assume a similar proportion for Prysmian (Figure 142). In our view this has both positive
and negative implications.
Figure 169: Nexans’ D&I business is split evenly across new construction and renovation…
Figure 170: …and 80% of D&I sales are made through distributors.
New construction
50%
Renovation50%
Distributors 80%
Other20%
Source: Company data Source: Company data
On the negative side, selling through distributors provides little visibility on sales and
sales can be materially impacted following a period of distribution destocking.
On the positive side, established relationships with distributors act as a barrier to entry
against new entrants into the European market. In addition, 1) building cables are low
margin so it does not make financial sense transporting them long distance (ie Chinese
manufacturers would struggle to gain competitive advantage in Europe), and 2) labour
costs are c5% of cost so undercutting costs with lower cost labour offers limited upside.
Thus we do not see the building cables market as being under threat from emerging
market competitors.

12 February 2013
European Cable Sector 101
Industrial cables
Industrial cables are sold into a broad range of end markets, as highlighted in Figure 171
and Figure 172. These show splits for Nexans’ and Prysmian’s Industry divisions. The
largest end market for both Nexans and Prysmian is Automotive, accounting for 21% and
23% of 2011 divisional revenues, respectively. For Prysmian we would highlight SURF,
Aerospace, Renewables and Automation in Europe as key end markets. For Prysmian
other important end markets are SURF products into petro-chemicals, renewables and
Elevators.
Figure 171: Prysmian industry division end markets, 2011 Figure 172: Nexans industry divisions end markets, 2011
Specialties & OEM35%
Automotive23%
OGP & Surf20%
Renewables 14%
Elevator6%
Other2%
Resources27%
Transportation21%
Automotive31%
Other Industrial Segments
21%
Source: Company data Source: Company data
Market positioning
Nexans has a leading position in Aerospace cables, while Prysmian’s strength is its
leading presence in wind towers globally, North American Elevators and advanced
automotive cables. As we have laid out in the SURF section (page 19), Prysmian is also
increasing its market presence. Figure 173 shows a more detailed layout of Prysmian and
Nexans industrial cables businesses.
Figure 173: Industry division end markets and Credit Suisse (CS) growth forecasts
Prysmian Nexans CS growth f’cast 2012 CS growth f’cast 2013E
Transport
Aerospace ✓ ✓ 7% 7%
Rail ✓ ✓ 0% 2%
Ships ✓ ✓
Automotive ✓ ✓ 1% 6%
General Industrial 3% 4%
Automation ✓ ✓ 3% 6%
Machine Tools ✓ ✓
Resources
Nuclear ✓ ✓
Mining ✓ ✓ 8% 0%
Oil and Gas ✓ ✓ 9% 7%
Renewables ✓ ✓
Others
Medical ✓ ✓ 1% 5%
Elevator ✓
Cranes ✓ ✓
OGP and Surf ✓ ✓ 9% 7%
Source: Company data, Credit Suisse estimates. Automotive is a global forecast and Nexans and Prysmian
are more exposed to Europe here. We expect this market to decline in 2013.
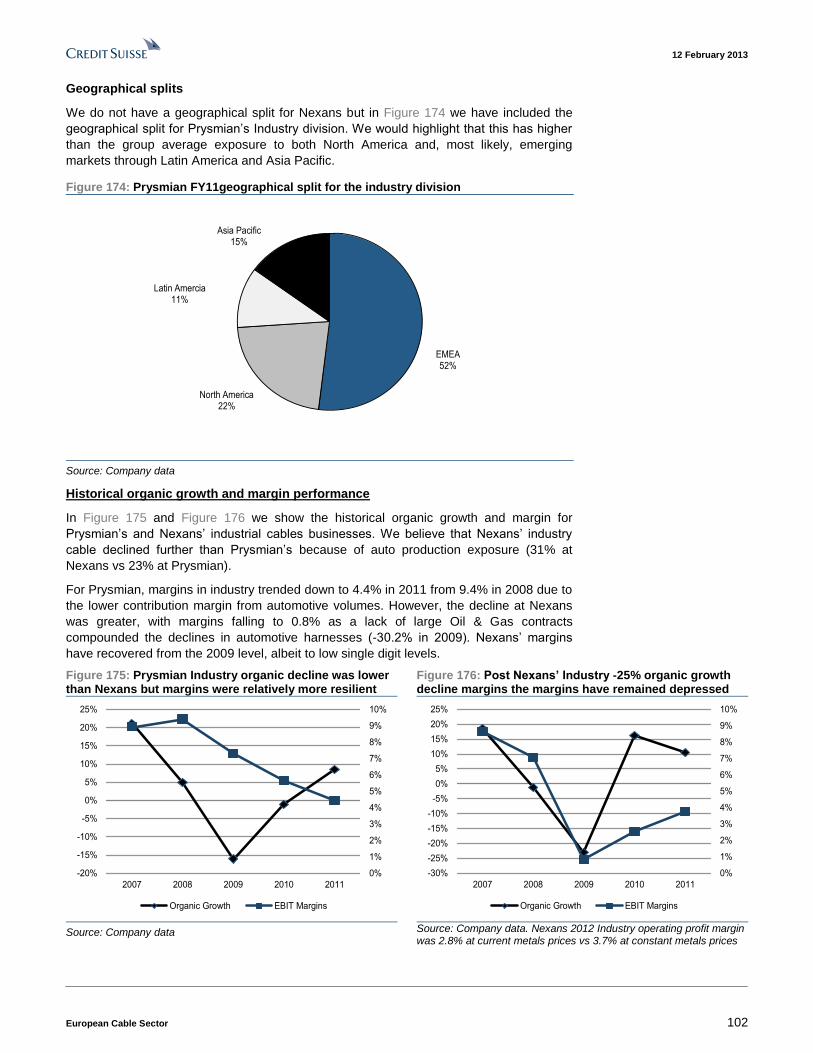
12 February 2013
European Cable Sector 102
Geographical splits
We do not have a geographical split for Nexans but in Figure 174 we have included the
geographical split for Prysmian’s Industry division. We would highlight that this has higher
than the group average exposure to both North America and, most likely, emerging
markets through Latin America and Asia Pacific.
Figure 174: Prysmian FY11geographical split for the industry division
EMEA52%
North America22%
Latin Amercia11%
Asia Pacific15%
Source: Company data
Historical organic growth and margin performance
In Figure 175 and Figure 176 we show the historical organic growth and margin for
Prysmian’s and Nexans’ industrial cables businesses. We believe that Nexans’ industry
cable declined further than Prysmian’s because of auto production exposure (31% at
Nexans vs 23% at Prysmian).
For Prysmian, margins in industry trended down to 4.4% in 2011 from 9.4% in 2008 due to
the lower contribution margin from automotive volumes. However, the decline at Nexans
was greater, with margins falling to 0.8% as a lack of large Oil & Gas contracts
compounded the declines in automotive harnesses (-30.2% in 2009). Nexans’ margins
have recovered from the 2009 level, albeit to low single digit levels.
Figure 175: Prysmian Industry organic decline was lower than Nexans but margins were relatively more resilient
Figure 176: Post Nexans’ Industry -25% organic growth decline margins the margins have remained depressed
0%
1%
2%
3%
4%
5%
6%
7%
8%
9%
10%
-20%
-15%
-10%
-5%
0%
5%
10%
15%
20%
25%
2007 2008 2009 2010 2011
Organic Growth EBIT Margins
0%
1%
2%
3%
4%
5%
6%
7%
8%
9%
10%
-30%
-25%
-20%
-15%
-10%
-5%
0%
5%
10%
15%
20%
25%
2007 2008 2009 2010 2011
Organic Growth EBIT Margins
Source: Company data Source: Company data. Nexans 2012 Industry operating profit margin
was 2.8% at current metals prices vs 3.7% at constant metals prices
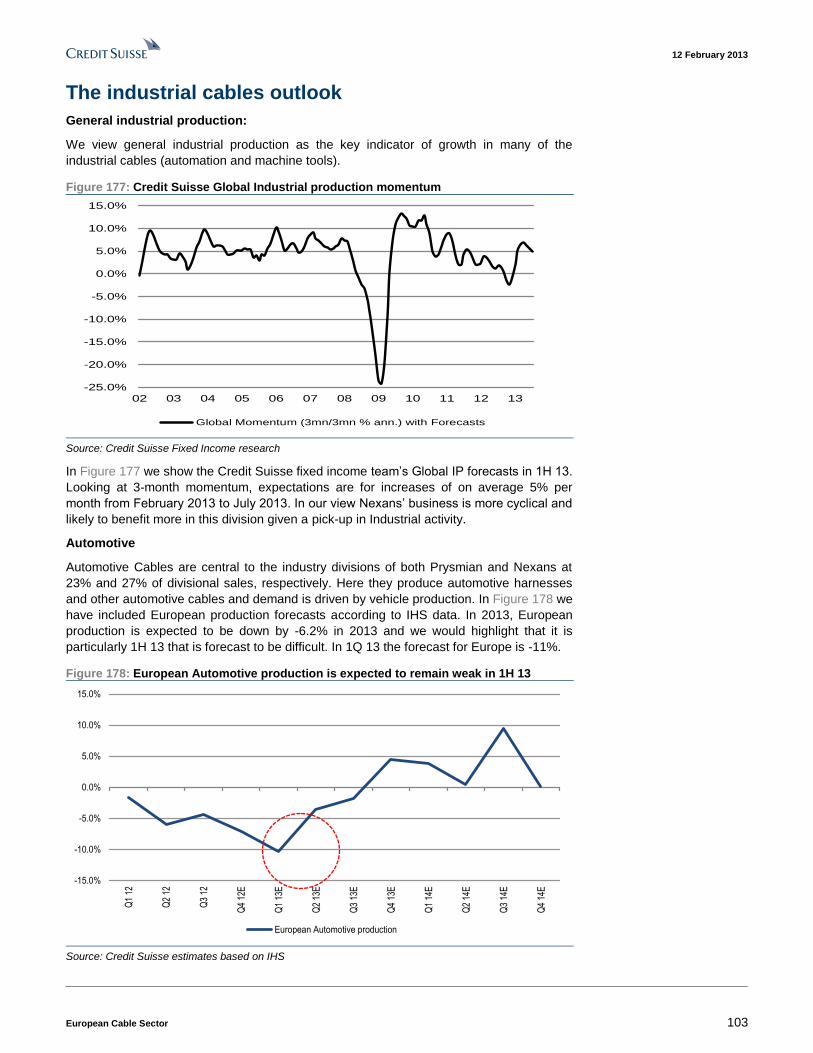
12 February 2013
European Cable Sector 103
The industrial cables outlook
General industrial production:
We view general industrial production as the key indicator of growth in many of the
industrial cables (automation and machine tools).
Figure 177: Credit Suisse Global Industrial production momentum
-25.0%
-20.0%
-15.0%
-10.0%
-5.0%
0.0%
5.0%
10.0%
15.0%
02 03 04 05 06 07 08 09 10 11 12 13
Global Momentum (3mn/3mn % ann.) with Forecasts
Source: Credit Suisse Fixed Income research
In Figure 177 we show the Credit Suisse fixed income team’s Global IP forecasts in 1H 13.
Looking at 3-month momentum, expectations are for increases of on average 5% per
month from February 2013 to July 2013. In our view Nexans’ business is more cyclical and
likely to benefit more in this division given a pick-up in Industrial activity.
Automotive
Automotive Cables are central to the industry divisions of both Prysmian and Nexans at
23% and 27% of divisional sales, respectively. Here they produce automotive harnesses
and other automotive cables and demand is driven by vehicle production. In Figure 178 we
have included European production forecasts according to IHS data. In 2013, European
production is expected to be down by -6.2% in 2013 and we would highlight that it is
particularly 1H 13 that is forecast to be difficult. In 1Q 13 the forecast for Europe is -11%.
Figure 178: European Automotive production is expected to remain weak in 1H 13
-15.0%
-10.0%
-5.0%
0.0%
5.0%
10.0%
15.0%
Q1
12
Q2
12
Q3
12
Q4
12E
Q1
13E
Q2
13E
Q3
13E
Q4
13E
Q1
14E
Q2
14E
Q3
14E
Q4
14E
European Automotive production
Source: Credit Suisse estimates based on IHS
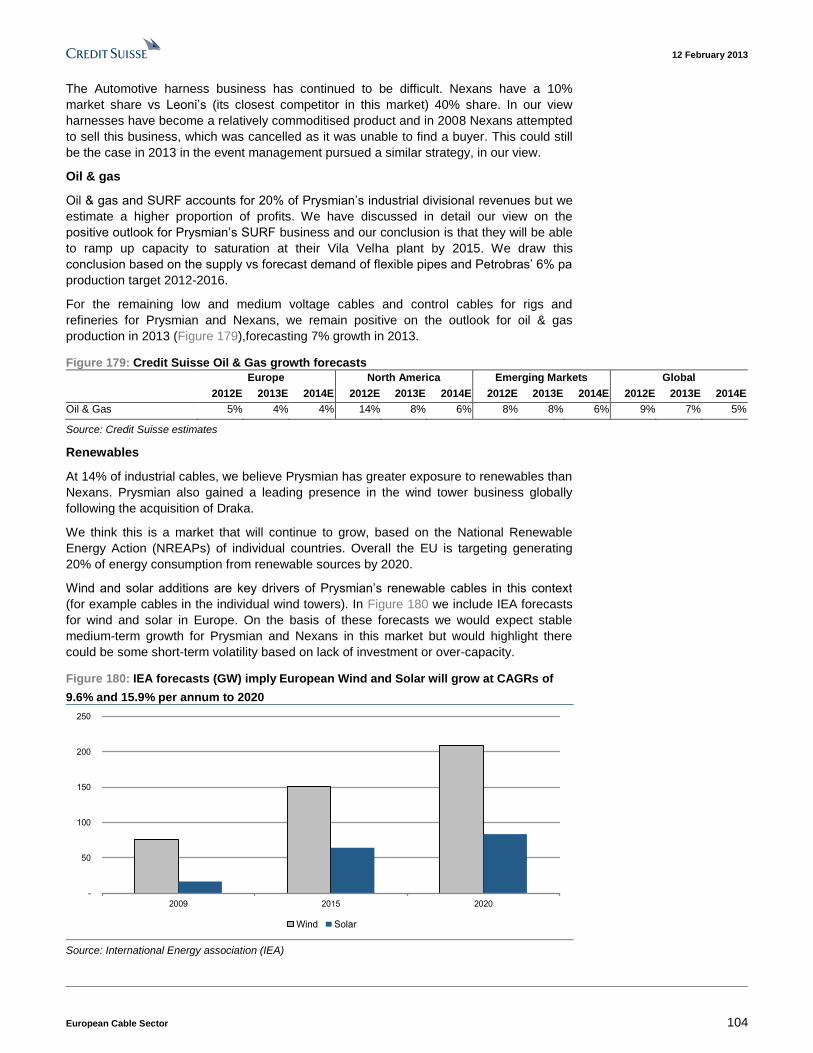
12 February 2013
European Cable Sector 104
The Automotive harness business has continued to be difficult. Nexans have a 10%
market share vs Leoni’s (its closest competitor in this market) 40% share. In our view
harnesses have become a relatively commoditised product and in 2008 Nexans attempted
to sell this business, which was cancelled as it was unable to find a buyer. This could still
be the case in 2013 in the event management pursued a similar strategy, in our view.
Oil & gas
Oil & gas and SURF accounts for 20% of Prysmian’s industrial divisional revenues but we
estimate a higher proportion of profits. We have discussed in detail our view on the
positive outlook for Prysmian’s SURF business and our conclusion is that they will be able
to ramp up capacity to saturation at their Vila Velha plant by 2015. We draw this
conclusion based on the supply vs forecast demand of flexible pipes and Petrobras’ 6% pa
production target 2012-2016.
For the remaining low and medium voltage cables and control cables for rigs and
refineries for Prysmian and Nexans, we remain positive on the outlook for oil & gas
production in 2013 (Figure 179),forecasting 7% growth in 2013.
Figure 179: Credit Suisse Oil & Gas growth forecasts
Europe North America Emerging Markets Global
2012E 2013E 2014E 2012E 2013E 2014E 2012E 2013E 2014E 2012E 2013E 2014E
Oil & Gas 5% 4% 4% 14% 8% 6% 8% 8% 6% 9% 7% 5%
Source: Credit Suisse estimates
Renewables
At 14% of industrial cables, we believe Prysmian has greater exposure to renewables than
Nexans. Prysmian also gained a leading presence in the wind tower business globally
following the acquisition of Draka.
We think this is a market that will continue to grow, based on the National Renewable
Energy Action (NREAPs) of individual countries. Overall the EU is targeting generating
20% of energy consumption from renewable sources by 2020.
Wind and solar additions are key drivers of Prysmian’s renewable cables in this context
(for example cables in the individual wind towers). In Figure 180 we include IEA forecasts
for wind and solar in Europe. On the basis of these forecasts we would expect stable
medium-term growth for Prysmian and Nexans in this market but would highlight there
could be some short-term volatility based on lack of investment or over-capacity.
Figure 180: IEA forecasts (GW) imply European Wind and Solar will grow at CAGRs of
9.6% and 15.9% per annum to 2020
-
50
100
150
200
250
2009 2015 2020
Wind Solar
Source: International Energy association (IEA)
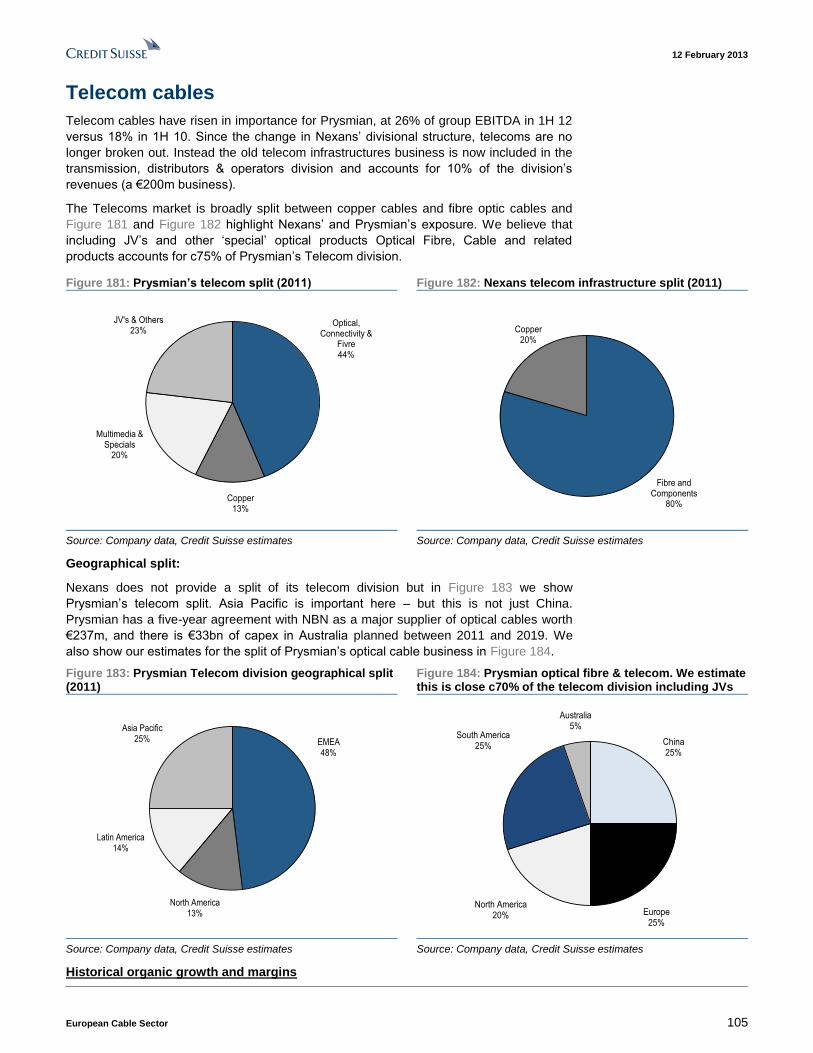
12 February 2013
European Cable Sector 105
Telecom cables
Telecom cables have risen in importance for Prysmian, at 26% of group EBITDA in 1H 12
versus 18% in 1H 10. Since the change in Nexans’ divisional structure, telecoms are no
longer broken out. Instead the old telecom infrastructures business is now included in the
transmission, distributors & operators division and accounts for 10% of the division’s
revenues (a €200m business).
The Telecoms market is broadly split between copper cables and fibre optic cables and
Figure 181 and Figure 182 highlight Nexans’ and Prysmian’s exposure. We believe that
including JV’s and other ‘special’ optical products Optical Fibre, Cable and related
products accounts for c75% of Prysmian’s Telecom division.
Figure 181: Prysmian’s telecom split (2011) Figure 182: Nexans telecom infrastructure split (2011)
Optical, Connectivity &
Fivre44%
Copper13%
Multimedia & Specials
20%
JV's & Others23%
Fibre and Components
80%
Copper20%
Source: Company data, Credit Suisse estimates Source: Company data, Credit Suisse estimates
Geographical split:
Nexans does not provide a split of its telecom division but in Figure 183 we show
Prysmian’s telecom split. Asia Pacific is important here – but this is not just China.
Prysmian has a five-year agreement with NBN as a major supplier of optical cables worth
€237m, and there is €33bn of capex in Australia planned between 2011 and 2019. We
also show our estimates for the split of Prysmian’s optical cable business in Figure 184.
Figure 183: Prysmian Telecom division geographical split (2011)
Figure 184: Prysmian optical fibre & telecom. We estimate this is close c70% of the telecom division including JVs
EMEA48%
North America13%
Latin America14%
Asia Pacific25%
China25%
Europe25%
North America20%
South America25%
Australia5%
Source: Company data, Credit Suisse estimates Source: Company data, Credit Suisse estimates
Historical organic growth and margins
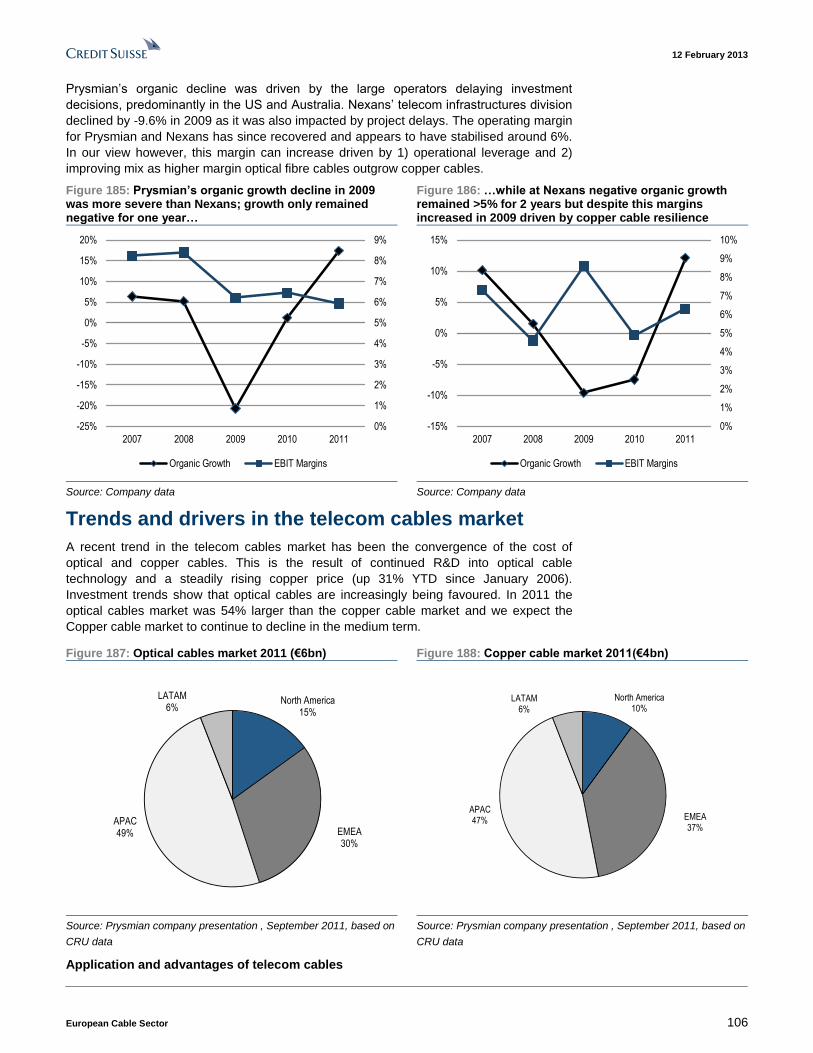
12 February 2013
European Cable Sector 106
Prysmian’s organic decline was driven by the large operators delaying investment
decisions, predominantly in the US and Australia. Nexans’ telecom infrastructures division
declined by -9.6% in 2009 as it was also impacted by project delays. The operating margin
for Prysmian and Nexans has since recovered and appears to have stabilised around 6%.
In our view however, this margin can increase driven by 1) operational leverage and 2)
improving mix as higher margin optical fibre cables outgrow copper cables.
Figure 185: Prysmian’s organic growth decline in 2009 was more severe than Nexans; growth only remained negative for one year…
Figure 186: …while at Nexans negative organic growth remained >5% for 2 years but despite this margins increased in 2009 driven by copper cable resilience
0%
1%
2%
3%
4%
5%
6%
7%
8%
9%
-25%
-20%
-15%
-10%
-5%
0%
5%
10%
15%
20%
2007 2008 2009 2010 2011
Organic Growth EBIT Margins
0%
1%
2%
3%
4%
5%
6%
7%
8%
9%
10%
-15%
-10%
-5%
0%
5%
10%
15%
2007 2008 2009 2010 2011
Organic Growth EBIT Margins
Source: Company data Source: Company data
Trends and drivers in the telecom cables market
A recent trend in the telecom cables market has been the convergence of the cost of
optical and copper cables. This is the result of continued R&D into optical cable
technology and a steadily rising copper price (up 31% YTD since January 2006).
Investment trends show that optical cables are increasingly being favoured. In 2011 the
optical cables market was 54% larger than the copper cable market and we expect the
Copper cable market to continue to decline in the medium term.
Figure 187: Optical cables market 2011 (€6bn) Figure 188: Copper cable market 2011(€4bn)
North America15%
EMEA30%
APAC49%
LATAM6%
North America10%
EMEA37%
APAC47%
LATAM6%
Source: Prysmian company presentation , September 2011, based on
CRU data
Source: Prysmian company presentation , September 2011, based on
CRU data
Application and advantages of telecom cables
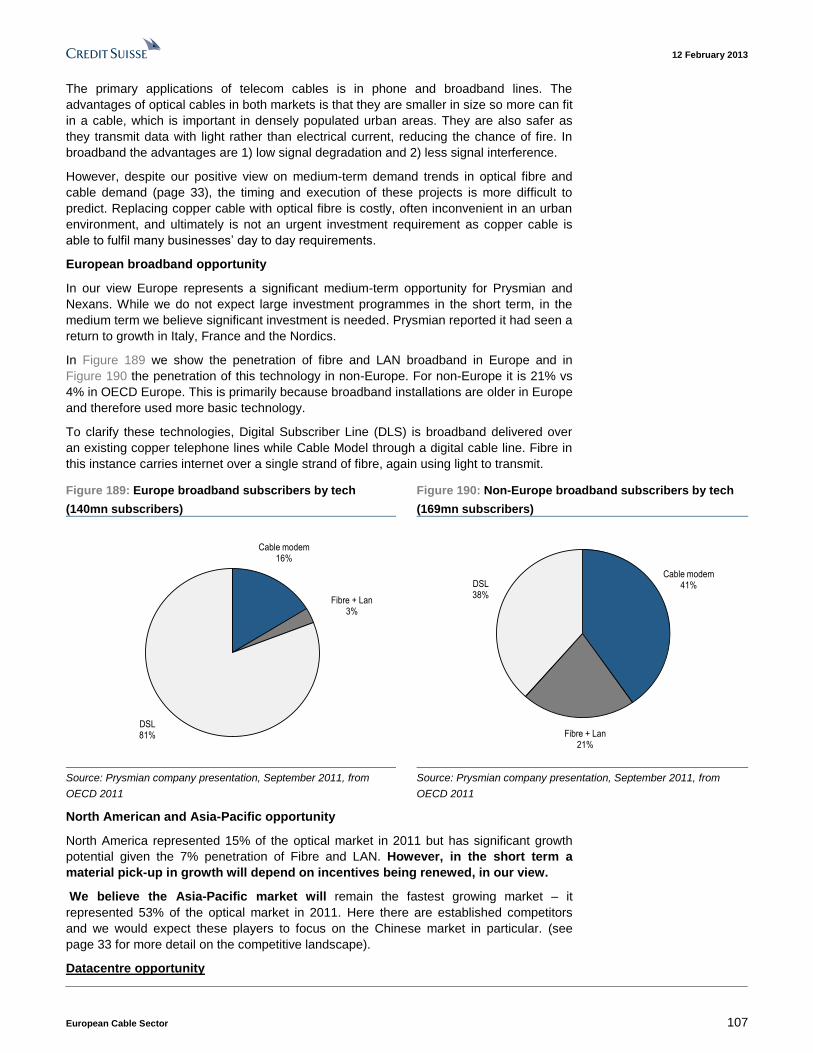
12 February 2013
European Cable Sector 107
The primary applications of telecom cables is in phone and broadband lines. The
advantages of optical cables in both markets is that they are smaller in size so more can fit
in a cable, which is important in densely populated urban areas. They are also safer as
they transmit data with light rather than electrical current, reducing the chance of fire. In
broadband the advantages are 1) low signal degradation and 2) less signal interference.
However, despite our positive view on medium-term demand trends in optical fibre and
cable demand (page 33), the timing and execution of these projects is more difficult to
predict. Replacing copper cable with optical fibre is costly, often inconvenient in an urban
environment, and ultimately is not an urgent investment requirement as copper cable is
able to fulfil many businesses’ day to day requirements.
European broadband opportunity
In our view Europe represents a significant medium-term opportunity for Prysmian and
Nexans. While we do not expect large investment programmes in the short term, in the
medium term we believe significant investment is needed. Prysmian reported it had seen a
return to growth in Italy, France and the Nordics.
In Figure 189 we show the penetration of fibre and LAN broadband in Europe and in
Figure 190 the penetration of this technology in non-Europe. For non-Europe it is 21% vs
4% in OECD Europe. This is primarily because broadband installations are older in Europe
and therefore used more basic technology.
To clarify these technologies, Digital Subscriber Line (DLS) is broadband delivered over
an existing copper telephone lines while Cable Model through a digital cable line. Fibre in
this instance carries internet over a single strand of fibre, again using light to transmit.
Figure 189: Europe broadband subscribers by tech
(140mn subscribers)
Figure 190: Non-Europe broadband subscribers by tech
(169mn subscribers)
Cable modem16%
Fibre + Lan3%
DSL81%
Cable modem41%
Fibre + Lan21%
DSL38%
Source: Prysmian company presentation, September 2011, from
OECD 2011
Source: Prysmian company presentation, September 2011, from
OECD 2011
North American and Asia-Pacific opportunity
North America represented 15% of the optical market in 2011 but has significant growth
potential given the 7% penetration of Fibre and LAN. However, in the short term a
material pick-up in growth will depend on incentives being renewed, in our view.
We believe the Asia-Pacific market will remain the fastest growing market – it
represented 53% of the optical market in 2011. Here there are established competitors
and we would expect these players to focus on the Chinese market in particular. (see
page 33 for more detail on the competitive landscape).
Datacentre opportunity
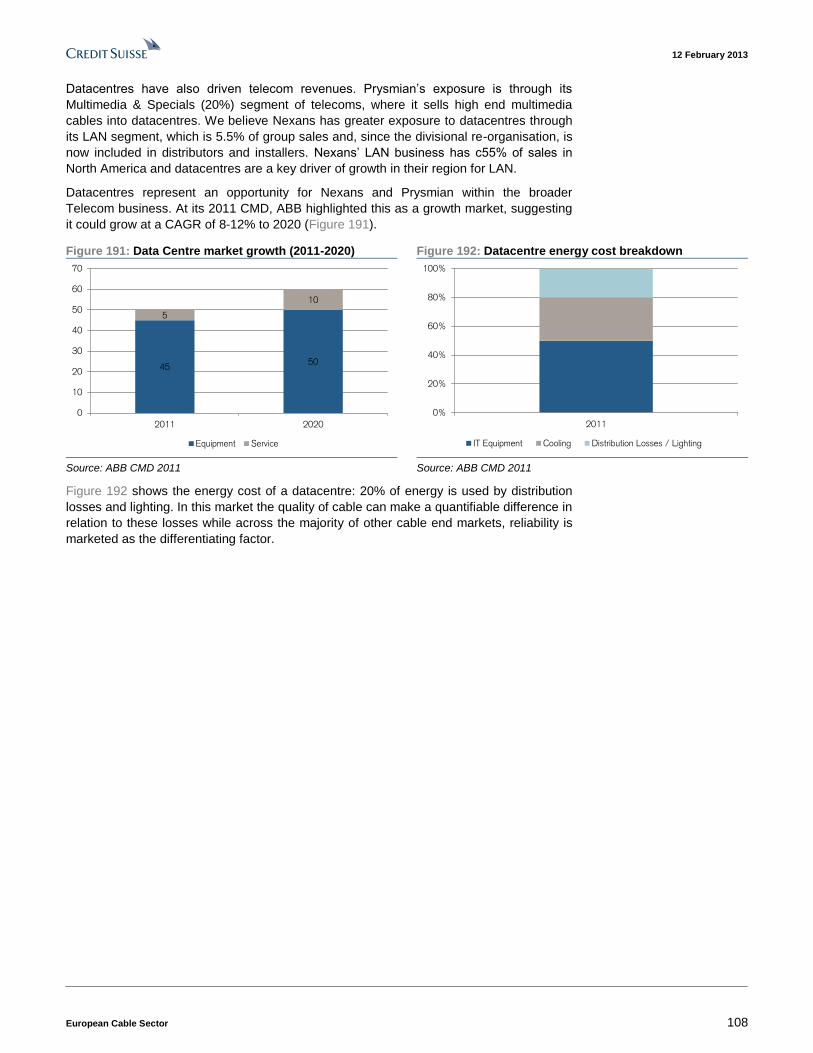
12 February 2013
European Cable Sector 108
Datacentres have also driven telecom revenues. Prysmian’s exposure is through its
Multimedia & Specials (20%) segment of telecoms, where it sells high end multimedia
cables into datacentres. We believe Nexans has greater exposure to datacentres through
its LAN segment, which is 5.5% of group sales and, since the divisional re-organisation, is
now included in distributors and installers. Nexans’ LAN business has c55% of sales in
North America and datacentres are a key driver of growth in their region for LAN.
Datacentres represent an opportunity for Nexans and Prysmian within the broader
Telecom business. At its 2011 CMD, ABB highlighted this as a growth market, suggesting
it could grow at a CAGR of 8-12% to 2020 (Figure 191).
Figure 191: Data Centre market growth (2011-2020) Figure 192: Datacentre energy cost breakdown
4550
5
10
0
10
20
30
40
50
60
70
2011 2020
Equipment Service
0%
20%
40%
60%
80%
100%
2011
IT Equipment Cooling Distribution Losses / Lighting
Source: ABB CMD 2011 Source: ABB CMD 2011
Figure 192 shows the energy cost of a datacentre: 20% of energy is used by distribution
losses and lighting. In this market the quality of cable can make a quantifiable difference in
relation to these losses while across the majority of other cable end markets, reliability is
marketed as the differentiating factor.
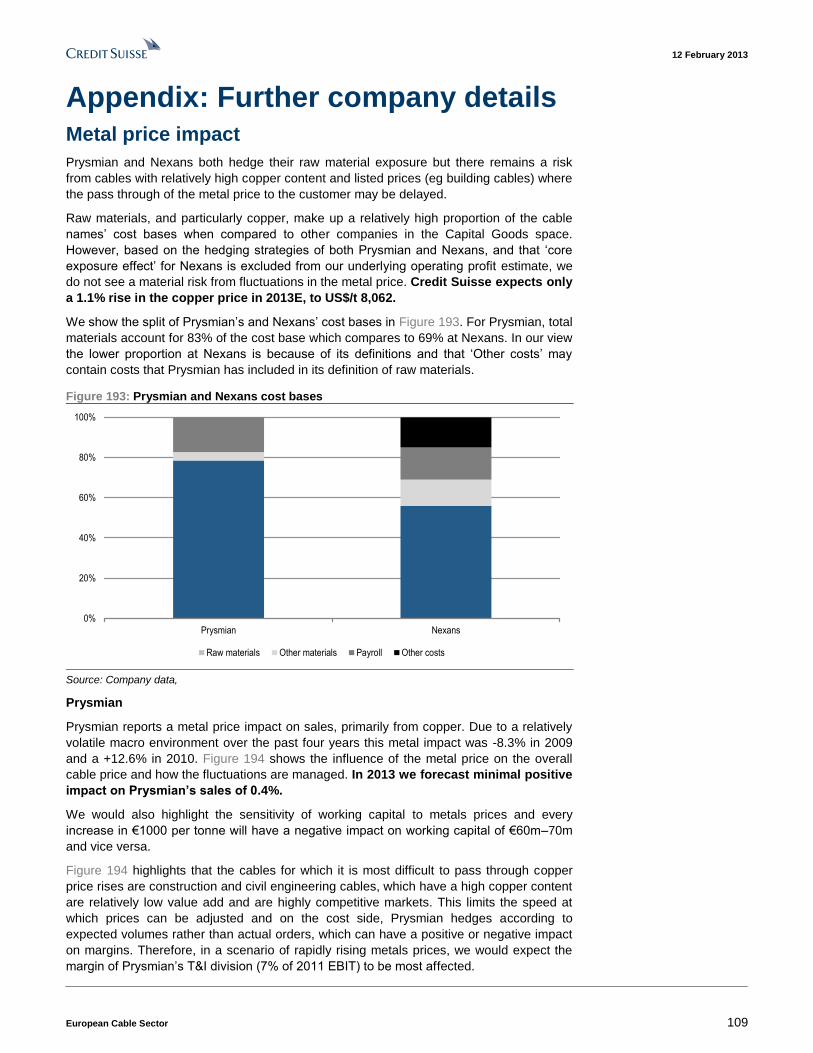
12 February 2013
European Cable Sector 109
Appendix: Further company details Metal price impact
Prysmian and Nexans both hedge their raw material exposure but there remains a risk
from cables with relatively high copper content and listed prices (eg building cables) where
the pass through of the metal price to the customer may be delayed.
Raw materials, and particularly copper, make up a relatively high proportion of the cable
names’ cost bases when compared to other companies in the Capital Goods space.
However, based on the hedging strategies of both Prysmian and Nexans, and that ‘core
exposure effect’ for Nexans is excluded from our underlying operating profit estimate, we
do not see a material risk from fluctuations in the metal price. Credit Suisse expects only
a 1.1% rise in the copper price in 2013E, to US$/t 8,062.
We show the split of Prysmian’s and Nexans’ cost bases in Figure 193. For Prysmian, total
materials account for 83% of the cost base which compares to 69% at Nexans. In our view
the lower proportion at Nexans is because of its definitions and that ‘Other costs’ may
contain costs that Prysmian has included in its definition of raw materials.
Figure 193: Prysmian and Nexans cost bases
0%
20%
40%
60%
80%
100%
Prysmian Nexans
Raw materials Other materials Payroll Other costs
Source: Company data,
Prysmian
Prysmian reports a metal price impact on sales, primarily from copper. Due to a relatively
volatile macro environment over the past four years this metal impact was -8.3% in 2009
and a +12.6% in 2010. Figure 194 shows the influence of the metal price on the overall
cable price and how the fluctuations are managed. In 2013 we forecast minimal positive
impact on Prysmian’s sales of 0.4%.
We would also highlight the sensitivity of working capital to metals prices and every
increase in €1000 per tonne will have a negative impact on working capital of €60m–70m
and vice versa.
Figure 194 highlights that the cables for which it is most difficult to pass through copper
price rises are construction and civil engineering cables, which have a high copper content
are relatively low value add and are highly competitive markets. This limits the speed at
which prices can be adjusted and on the cost side, Prysmian hedges according to
expected volumes rather than actual orders, which can have a positive or negative impact
on margins. Therefore, in a scenario of rapidly rising metals prices, we would expect the
margin of Prysmian’s T&I division (7% of 2011 EBIT) to be most affected.
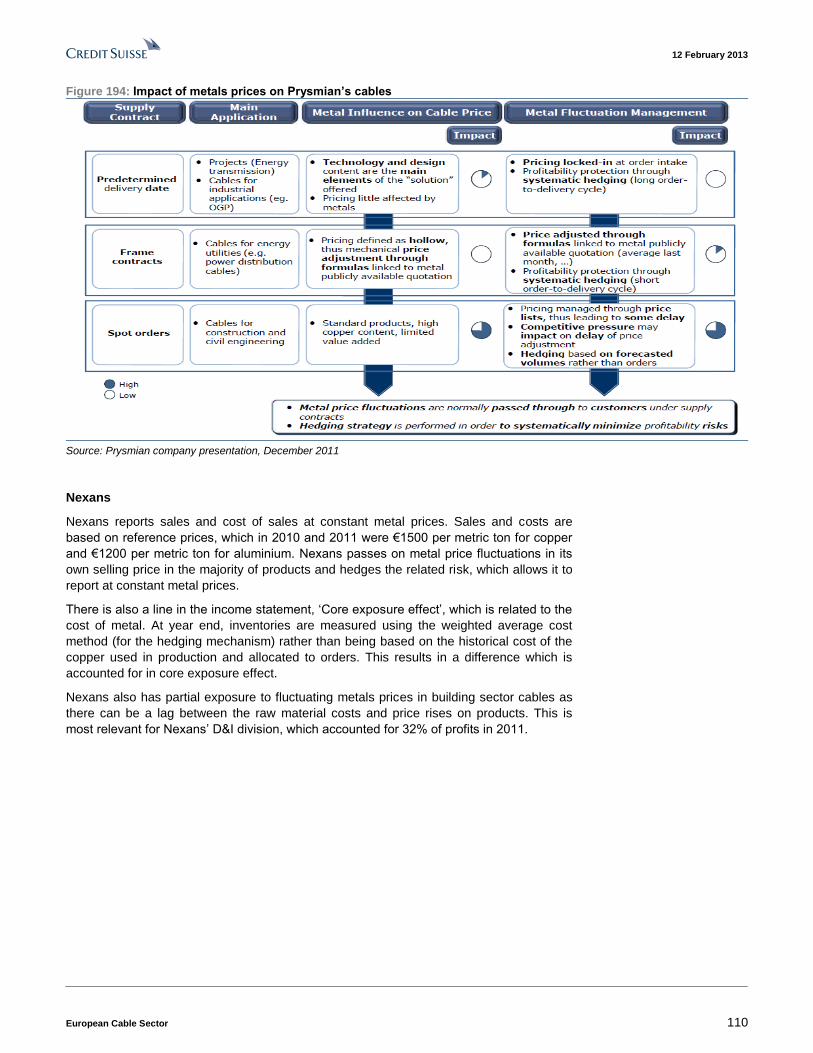
12 February 2013
European Cable Sector 110
Figure 194: Impact of metals prices on Prysmian’s cables
Source: Prysmian company presentation, December 2011
Nexans
Nexans reports sales and cost of sales at constant metal prices. Sales and costs are
based on reference prices, which in 2010 and 2011 were €1500 per metric ton for copper
and €1200 per metric ton for aluminium. Nexans passes on metal price fluctuations in its
own selling price in the majority of products and hedges the related risk, which allows it to
report at constant metal prices.
There is also a line in the income statement, ‘Core exposure effect’, which is related to the
cost of metal. At year end, inventories are measured using the weighted average cost
method (for the hedging mechanism) rather than being based on the historical cost of the
copper used in production and allocated to orders. This results in a difference which is
accounted for in core exposure effect.
Nexans also has partial exposure to fluctuating metals prices in building sector cables as
there can be a lag between the raw material costs and price rises on products. This is
most relevant for Nexans’ D&I division, which accounted for 32% of profits in 2011.
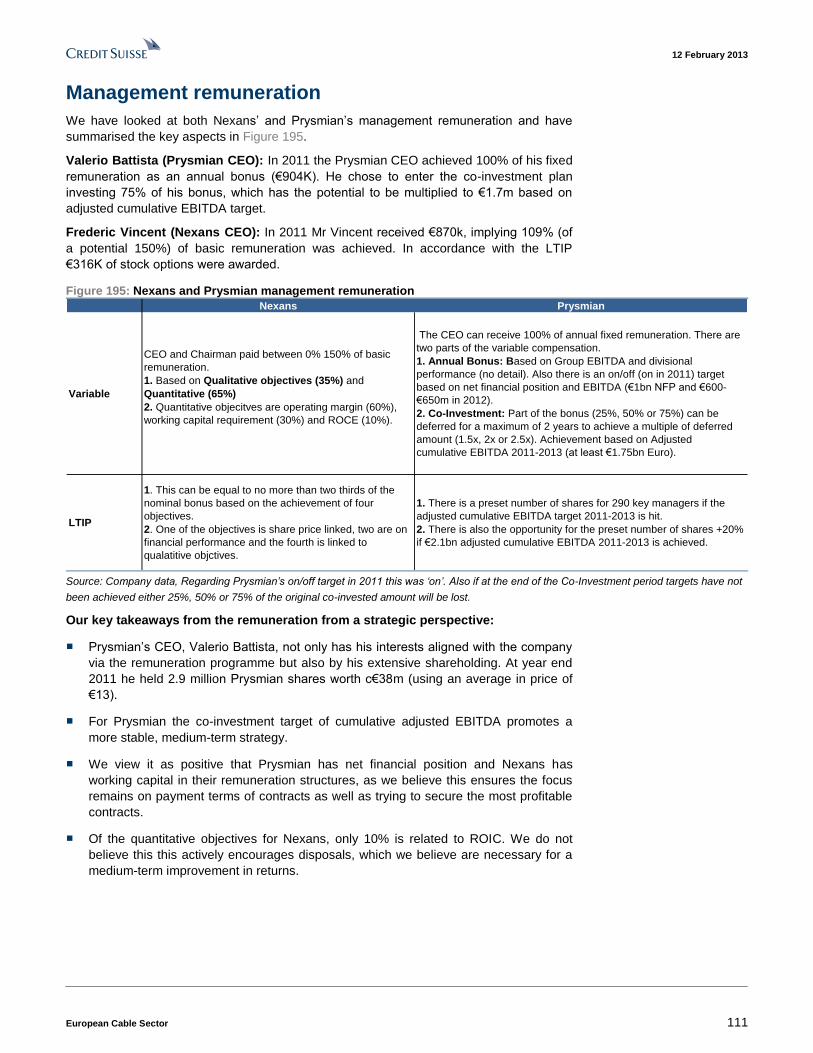
12 February 2013
European Cable Sector 111
Management remuneration
We have looked at both Nexans’ and Prysmian’s management remuneration and have
summarised the key aspects in Figure 195.
Valerio Battista (Prysmian CEO): In 2011 the Prysmian CEO achieved 100% of his fixed
remuneration as an annual bonus (€904K). He chose to enter the co-investment plan
investing 75% of his bonus, which has the potential to be multiplied to €1.7m based on
adjusted cumulative EBITDA target.
Frederic Vincent (Nexans CEO): In 2011 Mr Vincent received €870k, implying 109% (of
a potential 150%) of basic remuneration was achieved. In accordance with the LTIP
€316K of stock options were awarded.
Figure 195: Nexans and Prysmian management remuneration
Nexans Prysmian
Variable
CEO and Chairman paid between 0% 150% of basic
remuneration.
1. Based on Qualitative objectives (35%) and
Quantitative (65%)
2. Quantitative objecitves are operating margin (60%),
working capital requirement (30%) and ROCE (10%).
The CEO can receive 100% of annual fixed remuneration. There are
two parts of the variable compensation.
1. Annual Bonus: Based on Group EBITDA and divisional
performance (no detail). Also there is an on/off (on in 2011) target
based on net financial position and EBITDA (€1bn NFP and €600-
€650m in 2012).
2. Co-Investment: Part of the bonus (25%, 50% or 75%) can be
deferred for a maximum of 2 years to achieve a multiple of deferred
amount (1.5x, 2x or 2.5x). Achievement based on Adjusted
cumulative EBITDA 2011-2013 (at least €1.75bn Euro).
LTIP
1. This can be equal to no more than two thirds of the
nominal bonus based on the achievement of four
objectives.
2. One of the objectives is share price linked, two are on
financial performance and the fourth is linked to
qualatitive objctives.
1. There is a preset number of shares for 290 key managers if the
adjusted cumulative EBITDA target 2011-2013 is hit.
2. There is also the opportunity for the preset number of shares +20%
if €2.1bn adjusted cumulative EBITDA 2011-2013 is achieved.
Source: Company data, Regarding Prysmian’s on/off target in 2011 this was ‘on’. Also if at the end of the Co-Investment period targets have not
been achieved either 25%, 50% or 75% of the original co-invested amount will be lost.
Our key takeaways from the remuneration from a strategic perspective:
■ Prysmian’s CEO, Valerio Battista, not only has his interests aligned with the company
via the remuneration programme but also by his extensive shareholding. At year end
2011 he held 2.9 million Prysmian shares worth c€38m (using an average in price of
€13).
■ For Prysmian the co-investment target of cumulative adjusted EBITDA promotes a
more stable, medium-term strategy.
■ We view it as positive that Prysmian has net financial position and Nexans has
working capital in their remuneration structures, as we believe this ensures the focus
remains on payment terms of contracts as well as trying to secure the most profitable
contracts.
■ Of the quantitative objectives for Nexans, only 10% is related to ROIC. We do not
believe this this actively encourages disposals, which we believe are necessary for a
medium-term improvement in returns.
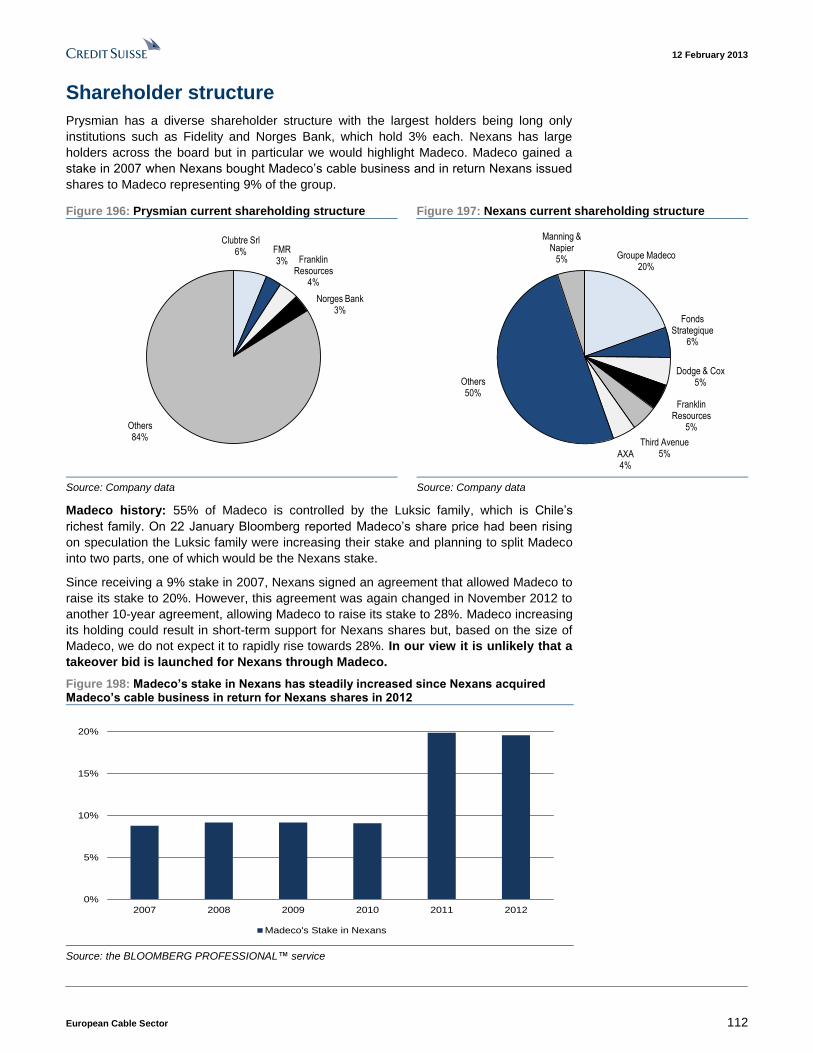
12 February 2013
European Cable Sector 112
Shareholder structure
Prysmian has a diverse shareholder structure with the largest holders being long only
institutions such as Fidelity and Norges Bank, which hold 3% each. Nexans has large
holders across the board but in particular we would highlight Madeco. Madeco gained a
stake in 2007 when Nexans bought Madeco’s cable business and in return Nexans issued
shares to Madeco representing 9% of the group.
Figure 196: Prysmian current shareholding structure Figure 197: Nexans current shareholding structure
Clubtre Srl6% FMR
3% Franklin Resources
4%
Norges Bank3%
Others84%
Groupe Madeco20%
Fonds Strategique
6%
Dodge & Cox5%
Franklin Resources
5%
Third Avenue 5%AXA
4%
Others50%
Manning & Napier
5%
Source: Company data Source: Company data
Madeco history: 55% of Madeco is controlled by the Luksic family, which is Chile’s
richest family. On 22 January Bloomberg reported Madeco’s share price had been rising
on speculation the Luksic family were increasing their stake and planning to split Madeco
into two parts, one of which would be the Nexans stake.
Since receiving a 9% stake in 2007, Nexans signed an agreement that allowed Madeco to
raise its stake to 20%. However, this agreement was again changed in November 2012 to
another 10-year agreement, allowing Madeco to raise its stake to 28%. Madeco increasing
its holding could result in short-term support for Nexans shares but, based on the size of
Madeco, we do not expect it to rapidly rise towards 28%. In our view it is unlikely that a
takeover bid is launched for Nexans through Madeco.
Figure 198: Madeco’s stake in Nexans has steadily increased since Nexans acquired Madeco’s cable business in return for Nexans shares in 2012
0%
5%
10%
15%
20%
2007 2008 2009 2010 2011 2012
Madeco's Stake in Nexans
Source: the BLOOMBERG PROFESSIONAL™ service
12 February 2013
European Cable Sector 113
Companies Mentioned (Price as of 07-Feb-2013)
Furukawa Electric (5801.T, ¥214) Sumitomo Heavy Industries, Ltd. (6302.T, ¥398) Hitachi Construction Machinery (6305.T, ¥2,181) ABB (ABBN.VX, SFr19.2) Alfa Laval (ALFA.ST, Skr143.0) Assa Abloy (ASSAb.ST, Skr239.3) Atlas Copco (ATCOa.ST, Skr180.4) Anixter International (AXE.N, $69.81) Belden (BDC.N, $49.03) General Cable Corp (BGC.N, $33.48) Electrolux (ELUXb.ST, Skr154.0) General Electric (GE.N, $22.48) Geberit (GEBN.VX, SFr216.3) Kone Corporation (KNEBV.HE, €62.2) Legrand SA (LEGD.PA, €32.4) Madeco (MAD.SN, CLP$20.8) Metso (MEO1V.HE, €33.58) Nexans (NEXS.PA, €37.44, NEUTRAL, TP €36.0) Philips (PHG.AS, €22.74) Prysmian (PRY.MI, €15.24, OUTPERFORM, TP €19.0) Sandvik (SAND.ST, Skr102.0) Schneider (SCHN.PA, €54.25) Schindler-Holding AG (SCHP.VX, SFr140.2) Siemens (SIEGn.DE, €77.0) SKF (SKFb.ST, Skr153.8) Saipem (SPMI.MI, €21.8) Subsea 7 S.A. (SUBC.OL, Nkr133.1) Terna (TRN.MI, €3.14)
Disclosure Appendix
Important Global Disclosures
The analysts identified in this report each certify, with respect to the companies or securities that the individual analyzes, that (1) the views expressed in this report accurately reflect his or her personal views about all of the subject companies and securities and (2) no part of his or her compensation was, is or will be directly or indirectly related to the specific recommendations or views expressed in this report.
The analyst(s) responsible for preparing this research report received Compensation that is based upon various factors including Credit Suisse's total revenues, a portion of which are generated by Credit Suisse's investment banking activities
As of December 10, 2012 Analysts’ stock rating are defined as follows:
Outperform (O) : The stock’s total return is expected to outperform the relevant benchmark*over the next 12 months.
Neutral (N) : The stock’s total return is expected to be in line with the relevant benchmark* over the next 12 months.
Underperform (U) : The stock’s total return is expected to underperform the relevant benchmark* over the next 12 months.
*Relevant benchmark by region: As of 10th December 2012, Japanese ratings are based on a stock’s total return relative to the analyst's coverage universe which consists of all companies covered by the analyst within the relevant sector, with Outperforms representing the most attractive, Neutrals the less attractive, and Underperforms the least attractive investment opportunities. As of 2nd October 2012, U.S. and Canadian as well as European ra tings are based on a stock’s total return relative to the analyst's coverage universe which consists of all companies covered by the analyst within the relevant sector, with Outperforms representing the most attractive, Neutrals the less attractive, and Underperforms the least attractive investment opportunities. For Latin American and non-Japan Asia stocks, ratings are based on a stock’s total return relative to the average total return of the relevant country or regional benchmark; Australia, New Zealand are, and prior to 2nd October 2012 U.S. and Canadian ratings were based on (1) a stock’s absolute total return potential to its current share price and (2) the relative attractiveness of a stock’s total return potential within an analyst’s coverage universe. For Australian and New Zealand stocks, 12-month rolling yield is incorporated in the absolute total return calculation and a 15% and a 7.5% threshold replace the 10-15% level in the Outperform and Underperform stock rating definitions, respectively. The 15% and 7.5% thresholds replace the +10-15% and -10-15% levels in the Neutral stock rating definition, respectively. Prior to 10th December 2012, Japanese ratings were based on a stock’s total return relative to the average total return of the relevant country or regional benchmark.
Restricted (R) : In certain circumstances, Credit Suisse policy and/or applicable law and regulations preclude certain types of communications, including an investment recommendation, during the course of Credit Suisse's engagement in an investment banking transaction and in certain other circumstances.
Volatility Indicator [V] : A stock is defined as volatile if the stock price has moved up or down by 20% or more in a month in at least 8 of the past 24 months or the analyst expects significant volatility going forward.
Analysts’ sector weightings are distinct from analysts’ stock ratings and are based on the analyst’s expectations for the fundamentals and/or valuation of the sector* relative to the group’s historic fundamentals and/or valuation:
Overweight : The analyst’s expectation for the sector’s fundamentals and/or valuation is favorable over the next 12 months.
Market Weight : The analyst’s expectation for the sector’s fundamentals and/or valuation is neutral over the next 12 months.
Underweight : The analyst’s expectation for the sector’s fundamentals and/or valuation is cautious over the next 12 months.

12 February 2013
European Cable Sector 114
*An analyst’s coverage sector consists of all companies covered by the analyst within the relevant sector. An analyst may cover multiple sectors.
Credit Suisse's distribution of stock ratings (and banking clients) is:
Global Ratings Distribution
Rating Versus universe (%) Of which banking clients (%)
Outperform/Buy* 42% (53% banking clients)
Neutral/Hold* 38% (47% banking clients)
Underperform/Sell* 16% (40% banking clients)
Restricted 3%
*For purposes of the NYSE and NASD ratings distribution disclosure requirements, our stock ratings of Outperform, Neutral, an d Underperform most closely correspond to Buy, Hold, and Sell, respectively; however, the meanings are not the same, as our stock ratings are determined on a relative basis. (Please refer to definitions above.) An investor's decision to buy or sell a security should be based on investment objectives, current holdin gs, and other individual factors.
Credit Suisse’s policy is to update research reports as it deems appropriate, based on developments with the subject company, the sector or the market that may have a material impact on the research views or opinions stated herein.
Credit Suisse's policy is only to publish investment research that is impartial, independent, clear, fair and not misleading. For more detail please refer to Credit Suisse's Policies for Managing Conflicts of Interest in connection with Investment Research: http://www.csfb.com/research and analytics/disclaimer/managing_conflicts_disclaimer.html
Credit Suisse does not provide any tax advice. Any statement herein regarding any US federal tax is not intended or written to be used, and cannot be used, by any taxpayer for the purposes of avoiding any penalties.
Price Target: (12 months) for Prysmian (PRY.MI)
Method: Our €19 target price is driven by using a 9.9x 2013 EV/EBITA multiple which is the 2013 adjusted Capital Goods sector multiple. We
adjust our sector multiple by excluding Kone, Schindler and Geberit from the European Electricals and Mechanicals.
Risk: For Prysmian we view the key risks as being 1) project delays on the installation of large contracts resulting in lower than expected margins on contracts, 2) a downturn which would impact the more cyclical parts of the business (automation, construction and distribution cables) and 3) slower than expected extraction of synergies from the Draka business integration and 4) more aggressive strategies by Japanese and emerging market competitors.
Price Target: (12 months) for Nexans (NEXS.PA)
Method: Our €36 target price is driven by using a 8.1x 2014E EV/EBITA multiple which is a 10% discount to the 2013 adjusted Capital Goods
sector multiple (broadly in-line with the five year history). We adjust our sector multiple by excluding Kone, Schindler and Geberit from the European Electricals and Mechanicals.
Risk: For Nexans we view the key risks as being 1) production issues in Submarine cables which impacted group profitability in 2012, 2) the potential for a slower than expected recovery in European construction, 3) a further worsening of the competitive pressure in Land High Voltage cables and 4) difficulties in finding a buyer for underperforming businesses in the company’s portfolio.
Please refer to the firm's disclosure website at www.credit-suisse.com/researchdisclosures for the definitions of abbreviations typically used in the target price method and risk sections.
See the Companies Mentioned section for full company names
The subject company (NEXS.PA, ABBN.VX, ALFA.ST, GE.N, GEBN.VX, MEO1V.HE, PHG.AS, SAND.ST, SCHN.PA, ATCOa.ST, SCHP.VX, SIEGn.DE, SKFb.ST, SPMI.MI, TRN.MI) currently is, or was during the 12-month period preceding the date of distribution of this report, a client of Credit Suisse.
Credit Suisse provided investment banking services to the subject company (ABBN.VX, GE.N, MEO1V.HE, PHG.AS, SAND.ST, SCHN.PA, SCHP.VX, SIEGn.DE, TRN.MI) within the past 12 months.
Credit Suisse provided non-investment banking services to the subject company (ABBN.VX, GE.N, GEBN.VX, ATCOa.ST, SCHP.VX, SIEGn.DE, SKFb.ST, TRN.MI) within the past 12 months
Credit Suisse has managed or co-managed a public offering of securities for the subject company (ABBN.VX, GE.N, PHG.AS, SCHP.VX, SIEGn.DE, TRN.MI) within the past 12 months.
Credit Suisse has received investment banking related compensation from the subject company (ABBN.VX, GE.N, MEO1V.HE, PHG.AS, SAND.ST, SCHN.PA, SCHP.VX, SIEGn.DE, TRN.MI) within the past 12 months
Credit Suisse expects to receive or intends to seek investment banking related compensation from the subject company (NEXS.PA, 5801.T, 6305.T, ABBN.VX, ALFA.ST, AXE.N, GE.N, MEO1V.HE, PHG.AS, SAND.ST, SCHN.PA, SCHP.VX, SIEGn.DE, SPMI.MI, TRN.MI) within the next 3 months.
12 February 2013
European Cable Sector 115
Credit Suisse has received compensation for products and services other than investment banking services from the subject company (ABBN.VX, GE.N, GEBN.VX, ATCOa.ST, SCHP.VX, SIEGn.DE, SKFb.ST, TRN.MI) within the past 12 months
As of the date of this report, Credit Suisse makes a market in the following subject companies (AXE.N, GE.N).
As of the end of the preceding month, Credit Suisse beneficially own 1% or more of a class of common equity securities of (PRY.MI, ABBN.VX, GEBN.VX, PHG.AS, SCHN.PA, SIEGn.DE).
Credit Suisse has a material conflict of interest with the subject company (PHG.AS). Credit Suisse is financial advisor to Philips Electronics NV in the sale of its Lifestyle Entertainment business to Funai Electric Co.
Important Regional Disclosures
Singapore recipients should contact Credit Suisse AG, Singapore Branch for any matters arising from this research report.
The analyst(s) involved in the preparation of this report have not visited the material operations of the subject company (PRY.MI, NEXS.PA, 5801.T, 6302.T, 6305.T, ABBN.VX, ALFA.ST, ASSAb.ST, AXE.N, ELUXb.ST, GE.N, GEBN.VX, KNEBV.HE, LEGD.PA, MEO1V.HE, PHG.AS, SAND.ST, SCHN.PA, ATCOa.ST, SCHP.VX, SIEGn.DE, SKFb.ST, SPMI.MI, SUBC.OL, TRN.MI) within the past 12 months
Restrictions on certain Canadian securities are indicated by the following abbreviations: NVS--Non-Voting shares; RVS--Restricted Voting Shares; SVS--Subordinate Voting Shares.
Individuals receiving this report from a Canadian investment dealer that is not affiliated with Credit Suisse should be advised that this report may not contain regulatory disclosures the non-affiliated Canadian investment dealer would be required to make if this were its own report.
For Credit Suisse Securities (Canada), Inc.'s policies and procedures regarding the dissemination of equity research, please visit http://www.csfb.com/legal_terms/canada_research_policy.shtml.
The following disclosed European company/ies have estimates that comply with IFRS: (ABBN.VX, ALFA.ST, ASSAb.ST, ELUXb.ST, GEBN.VX, LEGD.PA, MEO1V.HE, PHG.AS, SAND.ST, SCHN.PA, ATCOa.ST, SCHP.VX, SIEGn.DE, SKFb.ST, SPMI.MI, TRN.MI).
Credit Suisse has sent extracts of this research report to the subject company (PRY.MI, NEXS.PA) prior to publication for the purpose of verifying factual accuracy. Based on information provided by the subject company, factual changes have been made as a result.
As of the date of this report, Credit Suisse acts as a market maker or liquidity provider in the equities securities that are the subject of this report.
Principal is not guaranteed in the case of equities because equity prices are variable.
Commission is the commission rate or the amount agreed with a customer when setting up an account or at any time after that.
To the extent this is a report authored in whole or in part by a non-U.S. analyst and is made available in the U.S., the following are important disclosures regarding any non-U.S. analyst contributors: The non-U.S. research analysts listed below (if any) are not registered/qualified as research analysts with FINRA. The non-U.S. research analysts listed below may not be associated persons of CSSU and therefore may not be subject to the NASD Rule 2711 and NYSE Rule 472 restrictions on communications with a subject company, public appearances and trading securities held by a research analyst account.
Credit Suisse Securities (Europe) Limited...................................... Max Yates ; Andre Kukhnin CFA ; Simon Toennessen ; Jonathan Hurn, CFA
Important Credit Suisse HOLT Disclosures
With respect to the analysis in this report based on the Credit Suisse HOLT methodology, Credit Suisse certifies that (1) the views expressed in this report accurately reflect the Credit Suisse HOLT methodology and (2) no part of the Firm’s compensation was, is, or will be directly related to the specific views disclosed in this report
The Credit Suisse HOLT methodology does not assign ratings to a security. It is an analytical tool that involves use of a set of proprietary quantitative algorithms and warranted value calculations, collectively called the Credit Suisse HOLT valuation model, that are consistently applied to all the companies included in its database. Third-part data (including consensus earnings estimates) are systematically translated into a number of default algorithms available in the Credit Suisse HOLT valuation model. The source financial statement, pricing, and earnings data provided by outside data vendors are subject to quality control and may also be adjusted to more closely measure the underlying economics of firm performance. The adjustments provide consistency when analyzing a single company across time, or analyzing multiple companies across industries or national borders. The default scenario that is produced by the Credit Suisse HOLT valuation model establishes the baseline valuation for a security, and a user then may adjust the default variables to produce alternative scenarios, any of which could occur.
Additional information about the Credit Suisse HOLT methodology is available on request.
The Credit Suisse HOLT methodology does not assign a price target to a security. The default scenario that is produced by the Credit Suisse HOLT valuation model establishes a warranted price for a security, and as the third-party data are updated, the warranted price may also change. The default variable may also be adjusted to produce alternative warranted prices, any of which could occur.
CFROI®, HOLT, HOLTfolio, ValueSearch, AggreGator, Signal Flag and “Powered by HOLT” are trademarks or service marks or registered trademarks or registered service marks of Credit Suisse or its affiliates in the United States and other countries. HOLT is a corporate performance and valuation advisory service of Credit Suisse.
For Credit Suisse disclosure information on other companies mentioned in this report, please visit the website at www.credit-suisse.com/researchdisclosures or call +1 (877) 291-2683.

12 February 2013
European Cable Sector 116
References in this report to Credit Suisse include all of the subsidiaries and affiliates of Credit Suisse operating under its investment banking division. For more information on our structure, please use the following link: https://www.credit-suisse.com/who_we_are/en/.This report may contain material that is not directed to, or intended for distribution to or use by, any person or entity who is a citizen or resident of or located in any locality, state, country or other jurisdiction where such distribution, publication, availability or use would be contrary to law or regulation or which would subject Credit Suisse AG or its affiliates ("CS") to any registration or licensing requirement within such jurisdiction. All material presented in this report, unless specifically indicated otherwise, is under copyright to CS. None of the material, nor its content, nor any copy of it, may be altered in any way, transmitted to, copied or distributed to any other party, without the prior express written permission of CS. All trademarks, service marks and logos used in this report are trademarks or service marks or registered trademarks or service marks of CS or its affiliates. The information, tools and material presented in this report are provided to you for information purposes only and are not to be used or considered as an offer or the solicitation of an offer to sell or to buy or subscribe for securities or other financial instruments. CS may not have taken any steps to ensure that the securities referred to in this report are suitable for any particular investor. CS will not treat recipients of this report as its customers by virtue of their receiving this report. The investments and services contained or referred to in this report may not be suitable for you and it is recommended that you consult an independent investment advisor if you are in doubt about such investments or investment services. Nothing in this report constitutes investment, legal, accounting or tax advice, or a representation that any investment or strategy is suitable or appropriate to your individual circumstances, or otherwise constitutes a personal recommendation to you. CS does not advise on the tax consequences of investments and you are advised to contact an independent tax adviser. Please note in particular that the bases and levels of taxation may change. Information and opinions presented in this report have been obtained or derived from sources believed by CS to be reliable, but CS makes no representation as to their accuracy or completeness. CS accepts no liability for loss arising from the use of the material presented in this report, except that this exclusion of liability does not apply to the extent that such liability arises under specific statutes or regulations applicable to CS. This report is not to be relied upon in substitution for the exercise of independent judgment. CS may have issued, and may in the future issue, other communications that are inconsistent with, and reach different conclusions from, the information presented in this report. Those communications reflect the different assumptions, views and analytical methods of the analysts who prepared them and CS is under no obligation to ensure that such other communications are brought to the attention of any recipient of this report. CS may, to the extent permitted by law, participate or invest in financing transactions with the issuer(s) of the securities referred to in this report, perform services for or solicit business from such issuers, and/or have a position or holding, or other material interest, or effect transactions, in such securities or options thereon, or other investments related thereto. In addition, it may make markets in the securities mentioned in the material presented in this report. CS may have, within the last three years, served as manager or co-manager of a public offering of securities for, or currently may make a primary market in issues of, any or all of the entities mentioned in this report or may be providing, or have provided within the previous 12 months, significant advice or investment services in relation to the investment concerned or a related investment. Additional information is, subject to duties of confidentiality, available on request. Some investments referred to in this report will be offered solely by a single entity and in the case of some investments solely by CS, or an associate of CS or CS may be the only market maker in such investments. Past performance should not be taken as an indication or guarantee of future performance, and no representation or warranty, express or implied, is made regarding future performance. Information, opinions and estimates contained in this report reflect a judgment at its original date of publication by CS and are subject to change without notice. The price, value of and income from any of the securities or financial instruments mentioned in this report can fall as well as rise. The value of securities and financial instruments is subject to exchange rate fluctuation that may have a positive or adverse effect on the price or income of such securities or financial instruments. Investors in securities such as ADR's, the values of which are influenced by currency volatility, effectively assume this risk. Structured securities are complex instruments, typically involve a high degree of risk and are intended for sale only to sophisticated investors who are capable of understanding and assuming the risks involved. The market value of any structured security may be affected by changes in economic, financial and political factors (including, but not limited to, spot and forward interest and exchange rates), time to maturity, market conditions and volatility, and the credit quality of any issuer or reference issuer. Any investor interested in purchasing a structured product should conduct their own investigation and analysis of the product and consult with their own professional advisers as to the risks involved in making such a purchase. Some investments discussed in this report may have a high level of volatility. High volatility investments may experience sudden and large falls in their value causing losses when that investment is realised. Those losses may equal your original investment. Indeed, in the case of some investments the potential losses may exceed the amount of initial investment and, in such circumstances, you may be required to pay more money to support those losses. Income yields from investments may fluctuate and, in consequence, initial capital paid to make the investment may be used as part of that income yield. Some investments may not be readily realisable and it may be difficult to sell or realise those investments, similarly it may prove difficult for you to obtain reliable information about the value, or risks, to which such an investment is exposed. This report may provide the addresses of, or contain hyperlinks to, websites. Except to the extent to which the report refers to website material of CS, CS has not reviewed any such site and takes no responsibility for the content contained therein. Such address or hyperlink (including addresses or hyperlinks to CS's own website material) is provided solely for your convenience and information and the content of any such website does not in any way form part of this document. Accessing such website or following such link through this report or CS's website shall be at your own risk. This report is issued and distributed in Europe (except Switzerland) by Credit Suisse Securities (Europe) Limited, One Cabot Square, London E14 4QJ, England, which is regulated in the United Kingdom by The Financial Services Authority ("FSA"). This report is being distributed in Germany by Credit Suisse Securities (Europe) This report is being distributed in the United States and Canada by Credit Suisse Securities (USA) LLC; in Switzerland by Credit Suisse AG; in Brazil by Banco de Investimentos Credit Suisse (Brasil) S.A or its affiliates; in Mexico by Banco Credit Suisse (México), S.A. (transactions related to the securities mentioned in this report will only be effected in compliance with applicable regulation); in Japan by Credit Suisse Securities (Japan) Limited, Financial Instruments Firm, Director-General of Kanto Local Finance Bureau (Kinsho) No. 66, a member of Japan Securities Dealers Association, The Financial Futures Association of Japan, Japan Investment Advisers Association, Type II Financial Instruments Firms Association; elsewhere in Asia/ Pacific by whichever of the following is the appropriately authorised entity in the relevant jurisdiction: Credit Suisse (Hong Kong) Limited, Credit Suisse Equities (Australia) Limited, Credit Suisse Securities (Thailand) Limited, Credit Suisse Securities (Malaysia) Sdn Bhd, Credit Suisse AG, Singapore Branch, Credit Suisse Securities (India) Private Limited regulated by the Securities and Exchange Board of India (registration Nos. INB230970637; INF230970637; INB010970631; INF010970631), having registered address at 9th Floor, Ceejay House, Dr.A.B. Road, Worli, Mumbai - 18, India, T- +91-22 6777 3777, Credit Suisse Securities (Europe) Limited, Seoul Branch, Credit Suisse AG, Taipei Securities Branch, PT Credit Suisse Securities Indonesia, Credit Suisse Securities (Philippines ) Inc., and elsewhere in the world by the relevant authorised affiliate of the above. Research on Taiwanese securities produced by Credit Suisse AG, Taipei Securities Branch has been prepared by a registered Senior Business Person. Research provided to residents of Malaysia is authorised by the Head of Research for Credit Suisse Securities (Malaysia) Sdn Bhd, to whom they should direct any queries on +603 2723 2020. This research may not conform to Canadian disclosure requirements. In jurisdictions where CS is not already registered or licensed to trade in securities, transactions will only be effected in accordance with applicable securities legislation, which will vary from jurisdiction to jurisdiction and may require that the trade be made in accordance with applicable exemptions from registration or licensing requirements. Non-U.S. customers wishing to effect a transaction should contact a CS entity in their local jurisdiction unless governing law permits otherwise. U.S. customers wishing to effect a transaction should do so only by contacting a representative at Credit Suisse Securities (USA) LLC in the U.S. Please note that this research was originally prepared and issued by CS for distribution to their market professional and institutional investor customers. Recipients who are not market professional or institutional investor customers of CS should seek the advice of their independent financial advisor prior to taking any investment decision based on this report or for any necessary explanation of its contents. This research may relate to investments or services of a person outside of the UK or to other matters which are not regulated by the FSA or in respect of which the protections of the FSA for private customers and/or the UK compensation scheme may not be available, and further details as to where this may be the case are available upon request in respect of this report. CS may provide various services to US municipal entities or obligated persons ("municipalities"), including suggesting individual transactions or trades and entering into such transactions. Any services CS provides to municipalities are not viewed as "advice" within the meaning of Section 975 of the Dodd-Frank Wall Street Reform and Consumer Protection Act. CS is providing any such services and related information solely on an arm's length basis and not as an advisor or fiduciary to the municipality. In connection with the provision of the any such services, there is no agreement, direct or indirect, between any municipality (including the officials, management, employees or agents thereof) and CS for CS to provide advice to the municipality. Municipalities should consult with their financial, accounting and legal advisors regarding any such services provided by CS. In addition, CS is not acting for direct or indirect compensation to solicit the municipality on behalf of an unaffiliated broker, dealer, municipal securities dealer, municipal advisor, or investment adviser for the purpose of obtaining or retaining an engagement by the municipality for or in connection with Municipal Financial Products, the issuance of municipal securities, or of an investment adviser to provide investment advisory services to or on behalf of the municipality. If this report is being distributed by a financial institution other than Credit Suisse AG, or its affiliates, that financial institution is solely responsible for distribution. Clients of that institution should contact that institution to effect a transaction in the securities mentioned in this report or require further information. This report does not constitute investment advice by Credit Suisse to the clients of the distributing financial institution, and neither Credit Suisse AG, its affiliates, and their respective officers, directors and employees accept any liability whatsoever for any direct or consequential loss arising from their use of this report or its content. Principal is not guaranteed. Commission is the commission rate or the amount agreed with a customer when setting up an account or at any time after that.
Copyright © 2013 CREDIT SUISSE AG and/or its affiliates. All rights reserved.
Investment principal on bonds can be eroded depending on sale price or market price. In addition, there are bonds on which investment principal can be eroded due to changes in redemption amounts. Care is required when investing in such instruments.
When you purchase non-listed Japanese fixed income securities (Japanese government bonds, Japanese municipal bonds, Japanese government guaranteed bonds, Japanese corporate bonds) from CS as a seller, you will be requested to pay the purchase price only.
XX5670EU.doc