Embed Size (px)
Citation preview

European CFO Survey Confidence heads South
Q3 | November 2015
Contents
Foreword 3
Key findings 4
CFOs less optimistic around financial prospects 5
Uncertainty on the rise 6
Risk appetite drops 7
Revenue expectations remain confident 8
Restrained margin outlook 9
Mixed outlook on capex 10
Stability around hiring 11
External factors dominate business risks 12
Cost measures remain top strategy 13
Bank borrowing dominates choice of external financing 14
Internal financing important alternative to external sources 15
Greek crisis dents monetary union 16
Data summary 17
Authors and contributors Michael GramppDirector, European CFO Survey Lead, Deloitte AG+41 (0) 58 279 6817 [email protected]
Alex Cole Economic AnalystDeloitte LLP+44 (0) 207 7007 [email protected]
Kate McCarthyManager, EMEA Research Deloitte LLP+44 (0) 20 7303 3450 [email protected]
ContactsMichael GramppDirector, European CFO Survey Lead, Deloitte AG+41 (0) 58 279 6817 [email protected]
Alan FlanaganPartner, EMEA CFO Programme LeadDeloitte Ireland+353 (1) 417 2873 [email protected]
Sanford A. Cockrell IIIManaging Partner, Global Leader, CFO Programme Deloitte DTTL+1 (212) 492 3840 [email protected]
For more information please visit: www.deloitteresearchemea.com
About the dataThe findings discussed in this report are representative of the options of 1,298 CFOs based in 15 European countries: Austria, Belgium, Finland, France, Germany, Ireland, Italy, the Netherlands, Norway, Poland, Portugal, Russia, Spain, Switzerland and the United Kingdom. CFOs were all contacted between July and October 2015. Results from Poland represent preliminary data.
Some of the charts in the Survey show results as an index value (net balance). This is calculated by subtracting the percentage of respondents giving a negative response from the percentage giving a positive response; responses that are neither positive nor negative are deemed to be neutral. Due to rounding, not all percentages shown in the charts will add up to 100.
AcknowledgementsWe would like to thank all participating CFOs for their support in completing the survey.
Further informationFor further information and a more detailed analysis please visit www.deloitteresearchemea.com. If you would like to contact us please complete the form on our website or email us at [email protected]
2 | European CFO Survey Q3 2015 Confidence heads South
Foreword
Welcome to the second edition of the European CFO Survey, a major initiative of the EMEA CFO Programme. The Survey presents the opinions of nearly 1,300 CFOs on such critical issues as risk appetite, funding and the Greek crisis.
This Survey, conducted across 15 countries, is one of several global offerings provided by the Deloitte CFO Programme, an initiative that brings together multidisciplinary teams of senior Deloitte professionals to help CFOs effectively address the challenges and demands they experience in their role.
Other global CFO Programme offerings include the Next Generation CFO Academy, Finance Leadership Programme, CFO Transition Lab, CFO Forums, CFO Conference, CFO Survey, CFO Insights and CFO Journal.
We would like to thank all CFOs who took the time to participate in our Survey and welcome your feedback.
Alan FlanaganPartner, EMEA CFO Programme Lead
European CFO Survey Q3 2015 Confidence heads South | 3
Key findings
The mood of European Chief Financial Officers (CFOs) has deteriorated in the last six months. Deloitte’s European CFO Survey shows that optimism among nearly 1,300 CFOs in 15 countries declined in the third quarter. Overall financial optimism fell between Q1 and Q3 2015 from 15% to 2% when looking at the GDP weighted results. For euro area member countries the fall was slightly greater, dropping by a further 3%.
Over the course of the year, Europe has experienced the turmoil of another Greek debt crisis as well as growing concerns over the strength of the global economic recovery, in particular prospects for growth in key emerging markets such as China. The recent Syrian refugee crisis has further illustrated how external shocks can quickly impact internal affairs. These events have created a sense of heightened uncertainty among European CFOs. Perceptions of external financial and economic uncertainty rose 7 percentage points between the first and third quarter of 2015. Worries about external risks have weakened business sentiment and fed through to a reduction in CFO risk appetite in most countries. Revenue and margin expectations have softened too, albeit slightly.
Sentiment has fallen most in northern European economies including Belgium, Finland, France, Germany, the Netherlands, Norway and the United Kingdom. The fall in optimism in larger northern European economies is consistent with the weaker export outlook for these countries. Forecasts for global growth in 2015 and 2016 have been downgraded between Q1 and Q3, with many key emerging market economies – important destinations for exports for countries like Germany and the Netherlands – slowing sharply. The perception of CFOs in Germany of external economic and financial uncertainty remains the highest among the 15 European countries.
Such pessimism in central and northern Europe contrasts remarkably with a brighter outlook reported by CFOs in the south and on the edges of Europe. CFOs in Ireland, Italy, Poland, Portugal and Spain are now the most optimistic of our group. Capex intentions are in general higher and employment intentions stronger than among the CFOs based in central and northern European countries. The outlook for revenues and operating margins for Ireland, Italy and Spain are also well above the European average. This broadly mirrors the recent improved economic development and growth outlook in Europe’s periphery over the last quarters. Ireland, Italy, Portugal and Spain have all seen significant upgrades to growth forecasts in both 2015 and 2016 over the course of this year.
CFOs are, however, more united in their focus on cost control. When asked about strategic priorities, CFOs in 12 countries list cost reduction or cost control as one of their top three for the next year.
This quarter’s ‘special question’ related to last summer’s Greek crisis. We asked CFOs whether recent events in Greece had changed the prospects for achieving a stable and closely integrated European monetary union in the longer term. Almost half of the CFOs (48%) stated that it had damaged prospects, with just 18% believing prospects had improved.
European CFOs are clearly wary of further negative surprises and because of this confidence in Europe’s recovery remains fragile.
4 | European CFO Survey Q3 2015 Confidence heads South
2 5 -4 8 9 36-11 23 43 4-8 480 -9 -39 -3 -1129
Net balance %
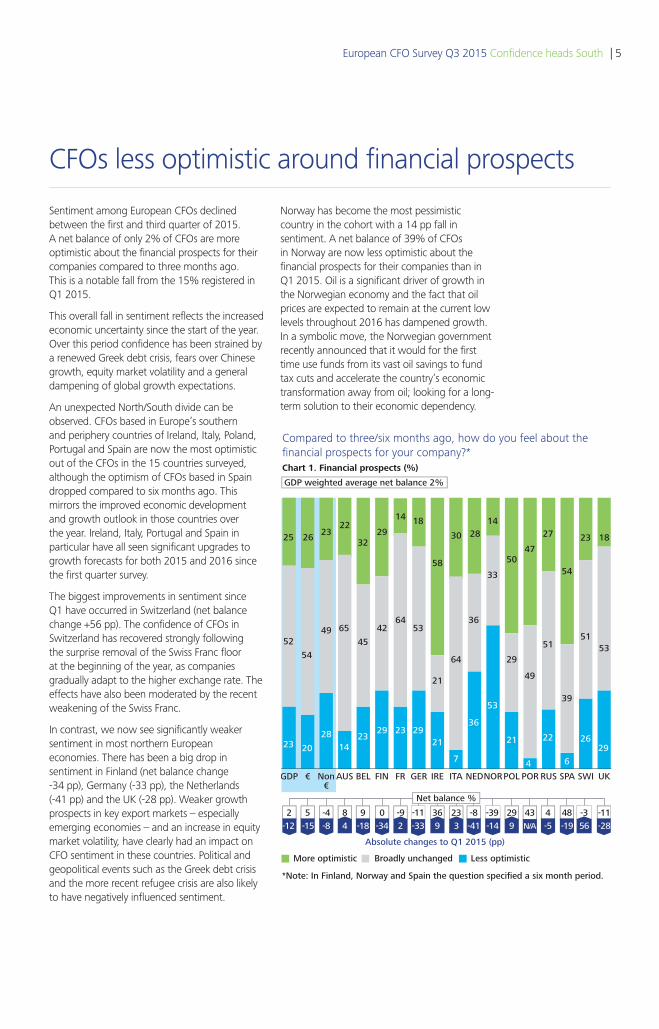
Compared to three/six months ago, how do you feel about the financial prospects for your company?*Chart 1. Financial prospects (%)
UKSWISPARUSPORPOLNORNEDITAIREGERFRFINBELAUSNon€
€GDP
Broadly unchangedMore optimistic
23
Less optimistic
-12
Absolute changes to Q1 2015 (pp)
*Note: In Finland, Norway and Spain the question specified a six month period.
-15 -8 4 -18 -34 2 -33 9 3 -14 N/A -19-5 56 -289-41
25
52
20
54
49
28
26 2322
3229
14 18
58
30 2814
47
27
54
29
23 18
65
45
4264
53
21
64
36
50
33
49
51
39
5153
1423
29 23 2921
7
36
53
21
4
22
6
2629
GDP weighted average net balance 2%
Sentiment among European CFOs declined between the first and third quarter of 2015. A net balance of only 2% of CFOs are more optimistic about the financial prospects for their companies compared to three months ago. This is a notable fall from the 15% registered in Q1 2015.
This overall fall in sentiment reflects the increased economic uncertainty since the start of the year. Over this period confidence has been strained by a renewed Greek debt crisis, fears over Chinese growth, equity market volatility and a general dampening of global growth expectations.
An unexpected North/South divide can be observed. CFOs based in Europe’s southern and periphery countries of Ireland, Italy, Poland, Portugal and Spain are now the most optimistic out of the CFOs in the 15 countries surveyed, although the optimism of CFOs based in Spain dropped compared to six months ago. This mirrors the improved economic development and growth outlook in those countries over the year. Ireland, Italy, Portugal and Spain in particular have all seen significant upgrades to growth forecasts for both 2015 and 2016 since the first quarter survey.
The biggest improvements in sentiment since Q1 have occurred in Switzerland (net balance change +56 pp). The confidence of CFOs in Switzerland has recovered strongly following the surprise removal of the Swiss Franc floor at the beginning of the year, as companies gradually adapt to the higher exchange rate. The effects have also been moderated by the recent weakening of the Swiss Franc.
In contrast, we now see significantly weaker sentiment in most northern European economies. There has been a big drop in sentiment in Finland (net balance change -34 pp), Germany (-33 pp), the Netherlands (-41 pp) and the UK (-28 pp). Weaker growth prospects in key export markets – especially emerging economies – and an increase in equity market volatility, have clearly had an impact on CFO sentiment in these countries. Political and geopolitical events such as the Greek debt crisis and the more recent refugee crisis are also likely to have negatively influenced sentiment.
CFOs less optimistic around financial prospects
Norway has become the most pessimistic country in the cohort with a 14 pp fall in sentiment. A net balance of 39% of CFOs in Norway are now less optimistic about the financial prospects for their companies than in Q1 2015. Oil is a significant driver of growth in the Norwegian economy and the fact that oil prices are expected to remain at the current low levels throughout 2016 has dampened growth. In a symbolic move, the Norwegian government recently announced that it would for the first time use funds from its vast oil savings to fund tax cuts and accelerate the country’s economic transformation away from oil; looking for a long-term solution to their economic dependency.
European CFO Survey Q3 2015 Confidence heads South | 5
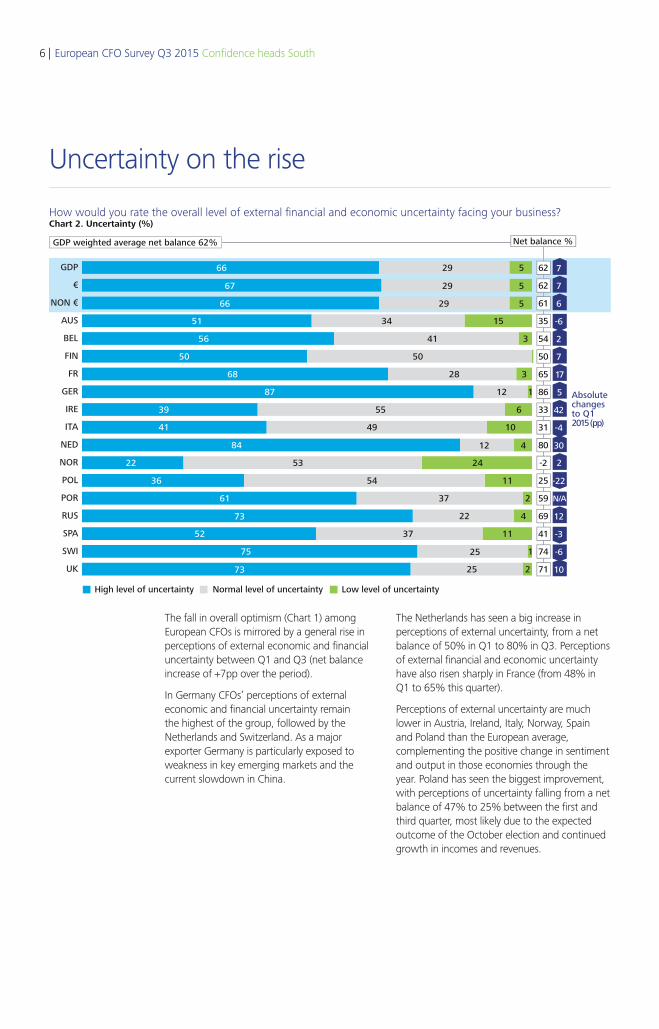
The fall in overall optimism (Chart 1) among European CFOs is mirrored by a general rise in perceptions of external economic and financial uncertainty between Q1 and Q3 (net balance increase of +7pp over the period).
In Germany CFOs’ perceptions of external economic and financial uncertainty remain the highest of the group, followed by the Netherlands and Switzerland. As a major exporter Germany is particularly exposed to weakness in key emerging markets and the current slowdown in China.
UK
SWI
SPA
RUS
POR
POL
NOR
NED
ITA
IRE
GER
FR
FIN
BEL
AUS
NON €
€
GDP
How would you rate the overall level of external financial and economic uncertainty facing your business?Chart 2. Uncertainty (%)
66 29 5
67 29 5
66 29 5
51 34 15
56
50
41 3
68 28 3
50
87 12 1
39 55 6
41 49 10
84
22
36
61 37 2
22573
422
54 11
53 24
12 4
73
52
75
37 11
25 1
62
62
61
35
54
50
65
86
33
31
80
-2
25
59
69
41
74
71
Normal level of uncertaintyHigh level of uncertainty Low level of uncertainty
7
7
6
-6
2
7
17
5
42
-4
30
2
-22
N/A
12
-3
-6
10
Absolutechangesto Q12015 (pp)
GDP weighted average net balance 62% Net balance %
Uncertainty on the rise
The Netherlands has seen a big increase in perceptions of external uncertainty, from a net balance of 50% in Q1 to 80% in Q3. Perceptions of external financial and economic uncertainty have also risen sharply in France (from 48% in Q1 to 65% this quarter).
Perceptions of external uncertainty are much lower in Austria, Ireland, Italy, Norway, Spain and Poland than the European average, complementing the positive change in sentiment and output in those economies through the year. Poland has seen the biggest improvement, with perceptions of uncertainty falling from a net balance of 47% to 25% between the first and third quarter, most likely due to the expected outcome of the October election and continued growth in incomes and revenues.
6 | European CFO Survey Q3 2015 Confidence heads South
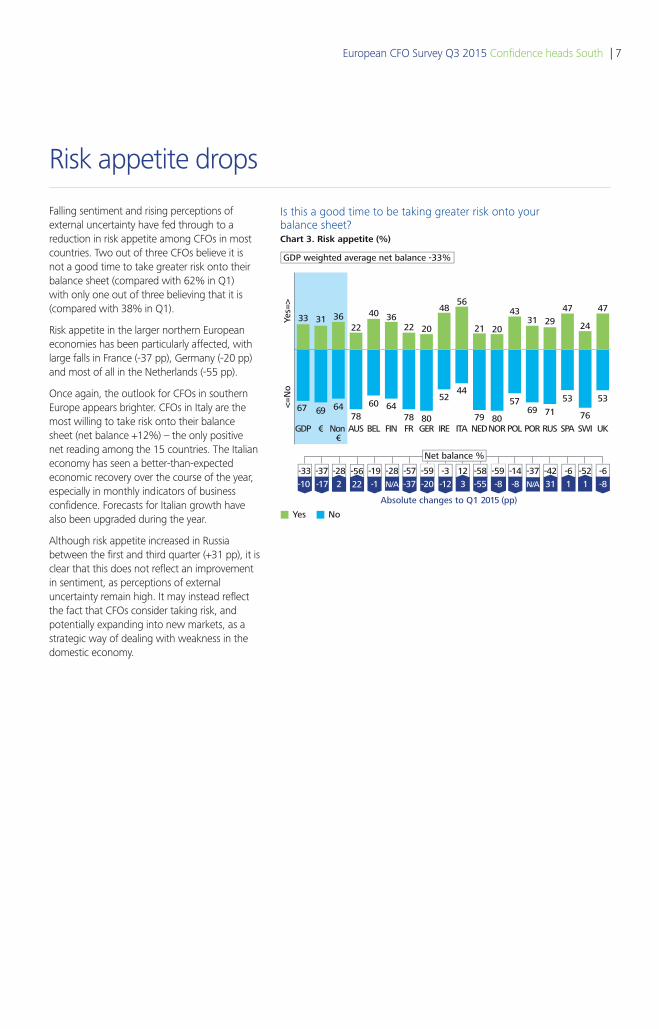
Falling sentiment and rising perceptions of external uncertainty have fed through to a reduction in risk appetite among CFOs in most countries. Two out of three CFOs believe it is not a good time to take greater risk onto their balance sheet (compared with 62% in Q1) with only one out of three believing that it is (compared with 38% in Q1).
Risk appetite in the larger northern European economies has been particularly affected, with large falls in France (-37 pp), Germany (-20 pp) and most of all in the Netherlands (-55 pp).
Once again, the outlook for CFOs in southern Europe appears brighter. CFOs in Italy are the most willing to take risk onto their balance sheet (net balance +12%) – the only positive net reading among the 15 countries. The Italian economy has seen a better-than-expected economic recovery over the course of the year, especially in monthly indicators of business confidence. Forecasts for Italian growth have also been upgraded during the year.
Although risk appetite increased in Russia between the first and third quarter (+31 pp), it is clear that this does not reflect an improvement in sentiment, as perceptions of external uncertainty remain high. It may instead reflect the fact that CFOs consider taking risk, and potentially expanding into new markets, as a strategic way of dealing with weakness in the domestic economy.
Is this a good time to be taking greater risk onto yourbalance sheet? Chart 3. Risk appetite (%)
UKSWISPARUSPORPOLNORNEDITAIREGERFRFINBELAUSNon €
€GDP
67
Yes
Yes=
><=
No
No
33
69
20
4331
5364
31 36
78
3622
56
21
40 48
20
60 6478 80
5244
79 8069 71
53
24
76
2947 47
57
22
GDP weighted average net balance -33%
-33 -37 -28 -56 -19 -3-59 12 -37 -6-58 -52-28 -57 -59 -6-14
Net balance %
Absolute changes to Q1 2015 (pp)
-42-10 -17 2 22 -1 N/A -37 -20 -12 3 -8 N/A 31 11 -8-8-55
Risk appetite drops
European CFO Survey Q3 2015 Confidence heads South | 7
In your view, how are revenues for your company likely to change over the next 12 months?* Chart 4.1. Revenues (%)
UKSWISPARUSPORPOLNORNEDITAIREGERFRFINBELAUSNon€
€GDP
14
Increase
Incr
ease
Dec
reas
e
Decrease
*Note: In the UK CFOs were asked, “how are revenues for UK corporates likely to change over the next 12 months?”
64
14
51
73 74
813
64 63
10
60
42
84
44
7182
70
19 18 19 13 9 928 34
16 116
56
25
53
75 72
15
42
GDP weighted average net balance 50%
50 50 50 32 52 7357 74 58 6916 3042 23 17 6458
Net balance %
-1
Absolute changes to Q1 2015 (pp)
-8 13 12 -8 5 -18 -8 13 3 -10 N/A
4231 79-3 -1258-34
Revenue expectations remain confident
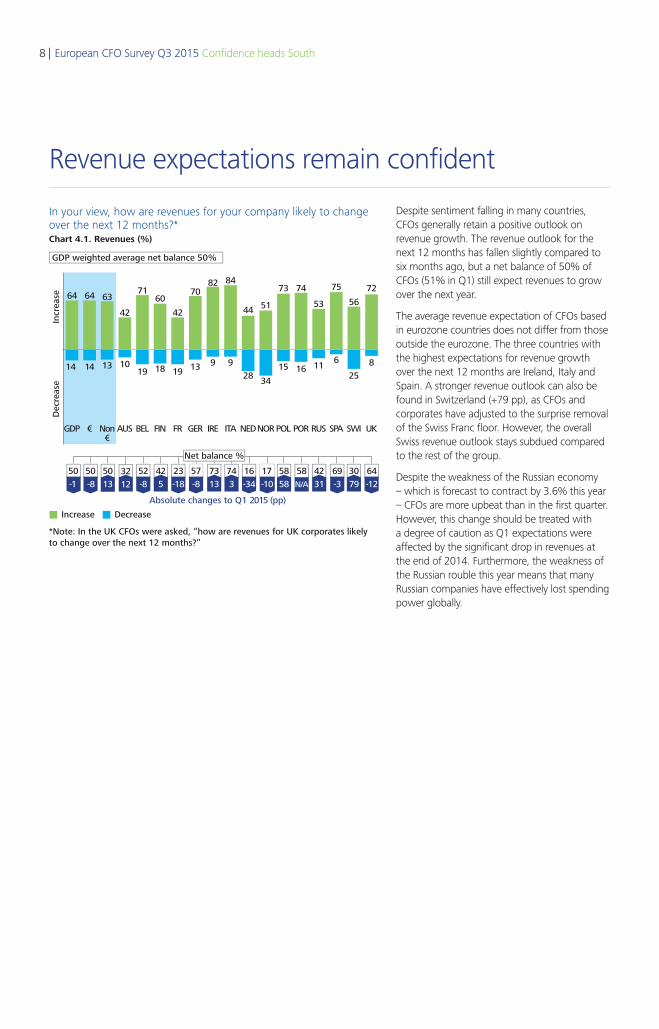
Despite sentiment falling in many countries, CFOs generally retain a positive outlook on revenue growth. The revenue outlook for the next 12 months has fallen slightly compared to six months ago, but a net balance of 50% of CFOs (51% in Q1) still expect revenues to grow over the next year.
The average revenue expectation of CFOs based in eurozone countries does not differ from those outside the eurozone. The three countries with the highest expectations for revenue growth over the next 12 months are Ireland, Italy and Spain. A stronger revenue outlook can also be found in Switzerland (+79 pp), as CFOs and corporates have adjusted to the surprise removal of the Swiss Franc floor. However, the overall Swiss revenue outlook stays subdued compared to the rest of the group.
Despite the weakness of the Russian economy – which is forecast to contract by 3.6% this year – CFOs are more upbeat than in the first quarter. However, this change should be treated with a degree of caution as Q1 expectations were affected by the significant drop in revenues at the end of 2014. Furthermore, the weakness of the Russian rouble this year means that many Russian companies have effectively lost spending power globally.
8 | European CFO Survey Q3 2015 Confidence heads South
In your view, how are operating margins for your company likely to change over the next 12 months?* Chart 4.2. Operating margins (%)
UKSWISPARUSPORPOLNORNEDITAIREGERFRFINBELAUSNon €
€GDP
23
Increase
Incr
ease
Dec
reas
e
Decrease
*Note: In the UK CFOs were asked, “how are operating margins for UK corporates likely to change over the next 12 months?”
42
22
3346 49
1925
4535
30
56
33
78
24
5245
38
19 1428 29
12 8
36 43
18 248
32
40
4257
31
23
19
GDP weighted average net balance 19%
19 23 11 -11 32 339 70 31 49-12 -842 5 -10 1223
Net balance %
-2
Absolute changes to Q1 2015 (pp)
-9 14 -4 -13 -13 -9 -19 -27 3 -7 N/A
1831 7211 -1023-24
Restrained margin outlook
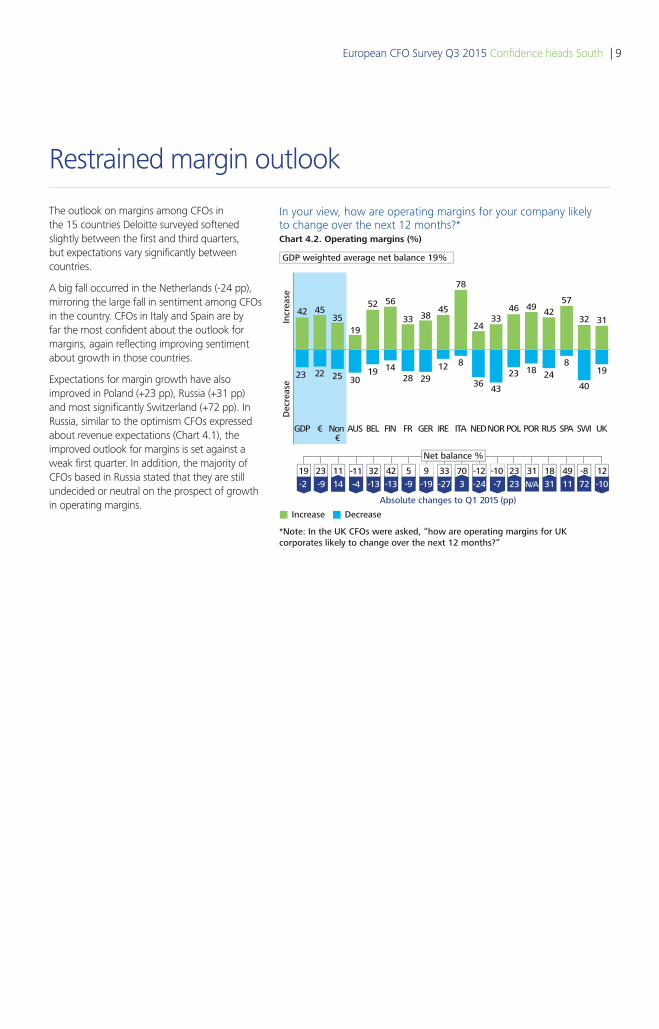
The outlook on margins among CFOs in the 15 countries Deloitte surveyed softened slightly between the first and third quarters, but expectations vary significantly between countries.
A big fall occurred in the Netherlands (-24 pp), mirroring the large fall in sentiment among CFOs in the country. CFOs in Italy and Spain are by far the most confident about the outlook for margins, again reflecting improving sentiment about growth in those countries.
Expectations for margin growth have also improved in Poland (+23 pp), Russia (+31 pp) and most significantly Switzerland (+72 pp). In Russia, similar to the optimism CFOs expressed about revenue expectations (Chart 4.1), the improved outlook for margins is set against a weak first quarter. In addition, the majority of CFOs based in Russia stated that they are still undecided or neutral on the prospect of growth in operating margins.
European CFO Survey Q3 2015 Confidence heads South | 9
In your view, how are capital expenditures for your company likely to change over the next 12 months?* Chart 4.3. Capital expenditure (%)
UKSWISPARUSPORPOLNORNEDITAIREGERFRFINBELNon €
€GDP
15
Incr
ease
Dec
reas
e
41
15
29
48 43
1416
43 38 34 30
58
4035
70
41
2214 16 19
9 720
2816
9 11
41
36
33
5441
16
GDP weighted average net balance 26%
26 28 22 13 6122 51 27 4320 520 14 1 2732
Net balance %
24
Increase Decrease
*Note: In the UK CFOs were asked, “how is capital expenditure for UK corporates likely to change over the next 12 months?”
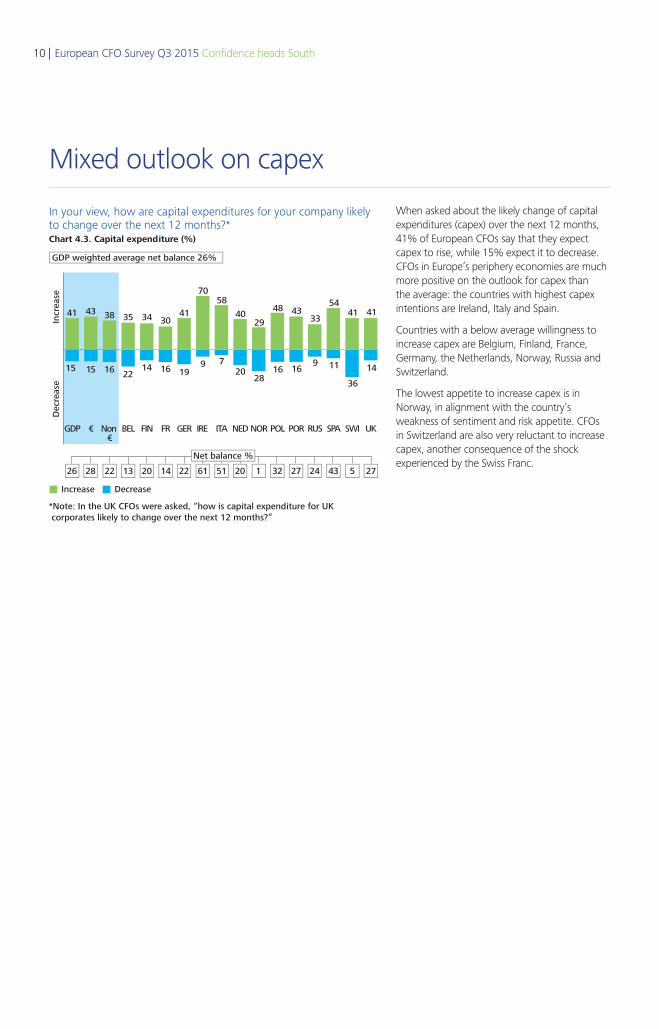
Mixed outlook on capex
When asked about the likely change of capital expenditures (capex) over the next 12 months, 41% of European CFOs say that they expect capex to rise, while 15% expect it to decrease. CFOs in Europe’s periphery economies are much more positive on the outlook for capex than the average: the countries with highest capex intentions are Ireland, Italy and Spain.
Countries with a below average willingness to increase capex are Belgium, Finland, France, Germany, the Netherlands, Norway, Russia and Switzerland.
The lowest appetite to increase capex is in Norway, in alignment with the country’s weakness of sentiment and risk appetite. CFOs in Switzerland are also very reluctant to increase capex, another consequence of the shock experienced by the Swiss Franc.
10 | European CFO Survey Q3 2015 Confidence heads South
In your view, how is the number of employees for your company likely to change over the next 12 months?* Chart 4.4. Number of employees (%)
UKSWISPARUSPORNORNEDITAIREGERFRFINBELAUSNon €
€GDP
22
Increase
Incr
ease
Dec
reas
e
Decrease
*Note: In the UK CFOs were asked, “how is the key metric hiring for UK corporates likely to change over the next 12 months?”
35
24
2639
1718
35 36
28
27 25
43
12
4455
39
27 29 26 2612
2340 42
35
7 6
27
34
24
46 47
17
GDP weighted average net balance 13%
13 3011 18 -11 17 -1 -1 14 42 21 -28 -16 4 40 -8
Net balance %
18
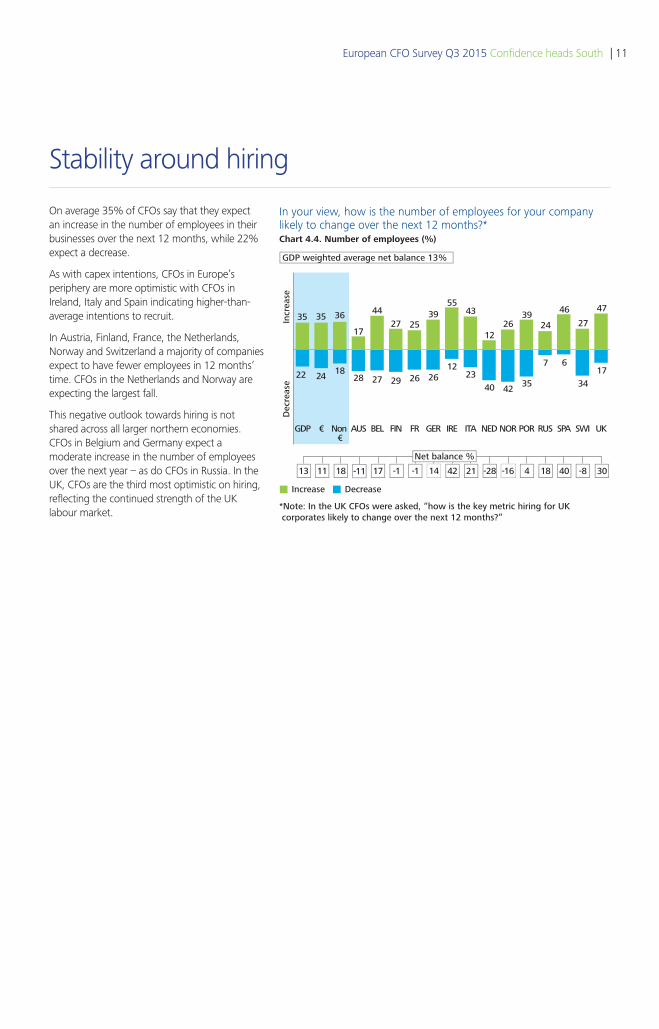
Stability around hiring
On average 35% of CFOs say that they expect an increase in the number of employees in their businesses over the next 12 months, while 22% expect a decrease.
As with capex intentions, CFOs in Europe’s periphery are more optimistic with CFOs in Ireland, Italy and Spain indicating higher-than-average intentions to recruit.
In Austria, Finland, France, the Netherlands, Norway and Switzerland a majority of companies expect to have fewer employees in 12 months’ time. CFOs in the Netherlands and Norway are expecting the largest fall.
This negative outlook towards hiring is not shared across all larger northern economies. CFOs in Belgium and Germany expect a moderate increase in the number of employees over the next year – as do CFOs in Russia. In the UK, CFOs are the third most optimistic on hiring, reflecting the continued strength of the UK labour market.
European CFO Survey Q3 2015 Confidence heads South | 11
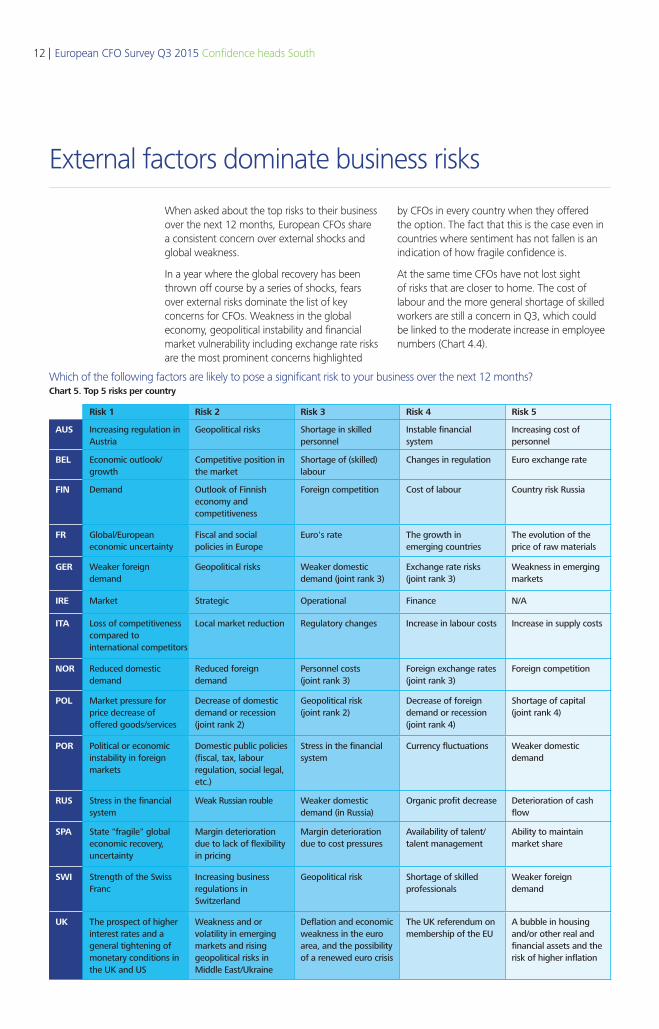
When asked about the top risks to their business over the next 12 months, European CFOs share a consistent concern over external shocks and global weakness.
In a year where the global recovery has been thrown off course by a series of shocks, fears over external risks dominate the list of key concerns for CFOs. Weakness in the global economy, geopolitical instability and financial market vulnerability including exchange rate risks are the most prominent concerns highlighted
by CFOs in every country when they offered the option. The fact that this is the case even in countries where sentiment has not fallen is an indication of how fragile confidence is.
At the same time CFOs have not lost sight of risks that are closer to home. The cost of labour and the more general shortage of skilled workers are still a concern in Q3, which could be linked to the moderate increase in employee numbers (Chart 4.4).
Which of the following factors are likely to pose a significant risk to your business over the next 12 months? Chart 5. Top 5 risks per country
Risk 1 Risk 2 Risk 3 Risk 4 Risk 5
AUS Increasing regulation in Austria
Geopolitical risks Shortage in skilled personnel
Instable financial system
Increasing cost of personnel
BEL Economic outlook/growth
Competitive position in the market
Shortage of (skilled) labour
Changes in regulation Euro exchange rate
FIN Demand Outlook of Finnish economy and competitiveness
Foreign competition Cost of labour Country risk Russia
FR Global/European economic uncertainty
Fiscal and social policies in Europe
Euro's rate The growth in emerging countries
The evolution of the price of raw materials
GER Weaker foreign demand
Geopolitical risks Weaker domestic demand (joint rank 3)
Exchange rate risks (joint rank 3)
Weakness in emerging markets
IRE Market Strategic Operational Finance N/A
ITA Loss of competitiveness compared to international competitors
Local market reduction Regulatory changes Increase in labour costs Increase in supply costs
NOR Reduced domestic demand
Reduced foreign demand
Personnel costs (joint rank 3)
Foreign exchange rates (joint rank 3)
Foreign competition
POL Market pressure for price decrease of offered goods/services
Decrease of domestic demand or recession (joint rank 2)
Geopolitical risk (joint rank 2)
Decrease of foreign demand or recession (joint rank 4)
Shortage of capital (joint rank 4)
POR Political or economic instability in foreign markets
Domestic public policies (fiscal, tax, labour regulation, social legal, etc.)
Stress in the financial system
Currency fluctuations Weaker domestic demand
RUS Stress in the financial system
Weak Russian rouble Weaker domestic demand (in Russia)
Organic profit decrease Deterioration of cash flow
SPA State "fragile" global economic recovery, uncertainty
Margin deterioration due to lack of flexibility in pricing
Margin deterioration due to cost pressures
Availability of talent/ talent management
Ability to maintain market share
SWI Strength of the Swiss Franc
Increasing business regulations in Switzerland
Geopolitical risk Shortage of skilled professionals
Weaker foreign demand
UK The prospect of higher interest rates and a general tightening of monetary conditions in the UK and US
Weakness and or volatility in emerging markets and rising geopolitical risks in Middle East/Ukraine
Deflation and economic weakness in the euro area, and the possibility of a renewed euro crisis
The UK referendum on membership of the EU
A bubble in housing and/or other real and financial assets and the risk of higher inflation
External factors dominate business risks
12 | European CFO Survey Q3 2015 Confidence heads South
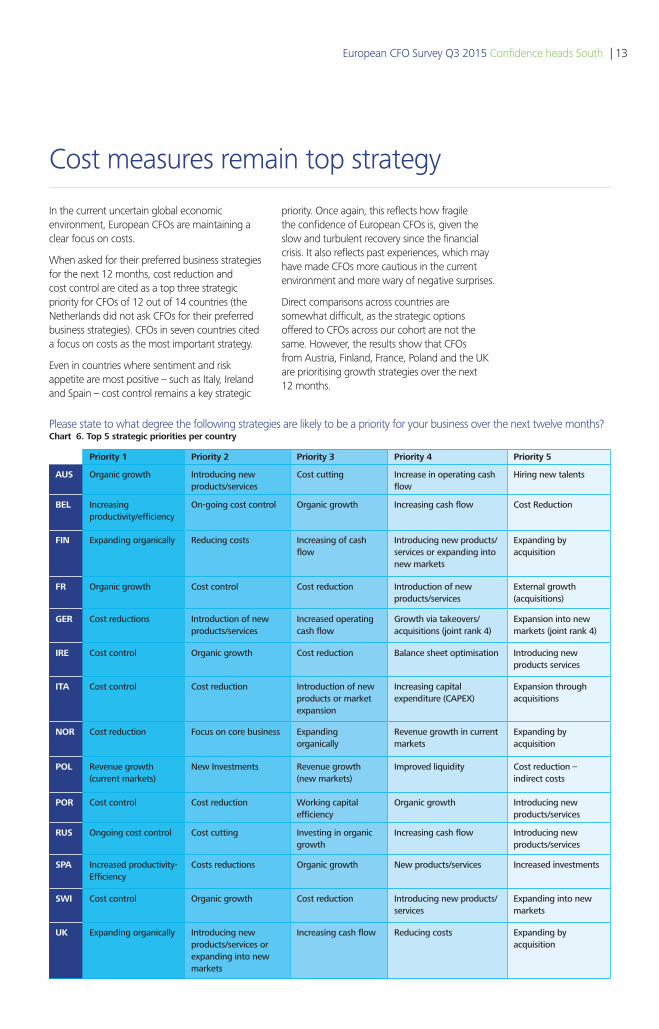
In the current uncertain global economic environment, European CFOs are maintaining a clear focus on costs.
When asked for their preferred business strategies for the next 12 months, cost reduction and cost control are cited as a top three strategic priority for CFOs of 12 out of 14 countries (the Netherlands did not ask CFOs for their preferred business strategies). CFOs in seven countries cited a focus on costs as the most important strategy.
Even in countries where sentiment and risk appetite are most positive – such as Italy, Ireland and Spain – cost control remains a key strategic
priority. Once again, this reflects how fragile the confidence of European CFOs is, given the slow and turbulent recovery since the financial crisis. It also reflects past experiences, which may have made CFOs more cautious in the current environment and more wary of negative surprises.
Direct comparisons across countries are somewhat difficult, as the strategic options offered to CFOs across our cohort are not the same. However, the results show that CFOs from Austria, Finland, France, Poland and the UK are prioritising growth strategies over the next 12 months.
Please state to what degree the following strategies are likely to be a priority for your business over the next twelve months?Chart 6. Top 5 strategic priorities per country
Priority 1 Priority 2 Priority 3 Priority 4 Priority 5
AUS Organic growth Introducing new products/services
Cost cutting Increase in operating cash flow
Hiring new talents
BEL Increasing productivity/efficiency
On-going cost control Organic growth Increasing cash flow Cost Reduction
FIN Expanding organically Reducing costs Increasing of cash flow
Introducing new products/services or expanding into new markets
Expanding by acquisition
FR Organic growth Cost control Cost reduction Introduction of new products/services
External growth (acquisitions)
GER Cost reductions Introduction of new products/services
Increased operating cash flow
Growth via takeovers/acquisitions (joint rank 4)
Expansion into new markets (joint rank 4)
IRE Cost control Organic growth Cost reduction Balance sheet optimisation Introducing new products services
ITA Cost control Cost reduction Introduction of new products or market expansion
Increasing capital expenditure (CAPEX)
Expansion through acquisitions
NOR Cost reduction Focus on core business Expanding organically
Revenue growth in current markets
Expanding by acquisition
POL Revenue growth (current markets)
New Investments Revenue growth (new markets)
Improved liquidity Cost reduction – indirect costs
POR Cost control Cost reduction Working capital efficiency
Organic growth Introducing new products/services
RUS Ongoing cost control Cost cutting Investing in organic growth
Increasing cash flow Introducing new products/services
SPA Increased productivity-Efficiency
Costs reductions Organic growth New products/services Increased investments
SWI Cost control Organic growth Cost reduction Introducing new products/services
Expanding into new markets
UK Expanding organically Introducing new products/services or expanding into new markets
Increasing cash flow Reducing costs Expanding by acquisition
Cost measures remain top strategy
European CFO Survey Q3 2015 Confidence heads South | 13
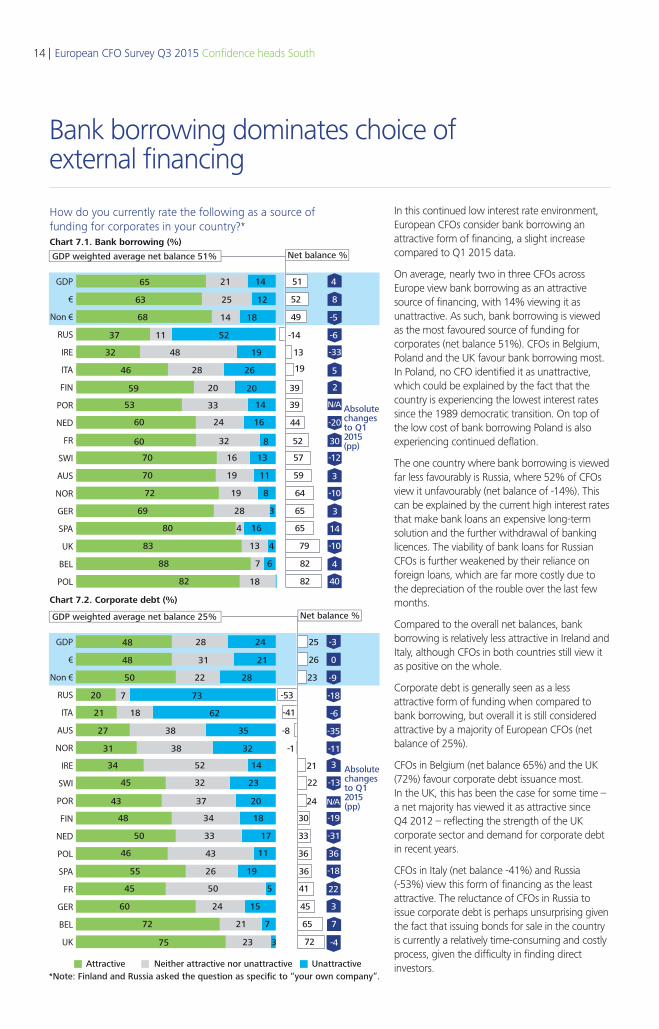
In this continued low interest rate environment, European CFOs consider bank borrowing an attractive form of financing, a slight increase compared to Q1 2015 data.
On average, nearly two in three CFOs across Europe view bank borrowing as an attractive source of financing, with 14% viewing it as unattractive. As such, bank borrowing is viewed as the most favoured source of funding for corporates (net balance 51%). CFOs in Belgium, Poland and the UK favour bank borrowing most. In Poland, no CFO identified it as unattractive, which could be explained by the fact that the country is experiencing the lowest interest rates since the 1989 democratic transition. On top of the low cost of bank borrowing Poland is also experiencing continued deflation.
The one country where bank borrowing is viewed far less favourably is Russia, where 52% of CFOs view it unfavourably (net balance of -14%). This can be explained by the current high interest rates that make bank loans an expensive long-term solution and the further withdrawal of banking licences. The viability of bank loans for Russian CFOs is further weakened by their reliance on foreign loans, which are far more costly due to the depreciation of the rouble over the last few months.
Compared to the overall net balances, bank borrowing is relatively less attractive in Ireland and Italy, although CFOs in both countries still view it as positive on the whole.
Corporate debt is generally seen as a less attractive form of funding when compared to bank borrowing, but overall it is still considered attractive by a majority of European CFOs (net balance of 25%).
CFOs in Belgium (net balance 65%) and the UK (72%) favour corporate debt issuance most. In the UK, this has been the case for some time – a net majority has viewed it as attractive since Q4 2012 – reflecting the strength of the UK corporate sector and demand for corporate debt in recent years.
CFOs in Italy (net balance -41%) and Russia (-53%) view this form of financing as the least attractive. The reluctance of CFOs in Russia to issue corporate debt is perhaps unsurprising given the fact that issuing bonds for sale in the country is currently a relatively time-consuming and costly process, given the difficulty in finding direct investors.
How do you currently rate the following as a source offunding for corporates in your country?*Chart 7.1. Bank borrowing (%)
Chart 7.2. Corporate debt (%)
POL
BEL
UK
SPA
GER
NOR
AUS
SWI
FR
NED
POR
FIN
ITA
IRE
RUS
Non €
€
GDP
UK
BEL
GER
FR
SPA
POL
NED
FIN
POR
SWI
IRE
NOR
AUS
ITA
RUS
Non €
€
GDP
65 21 14
2563 12
68 14 18
7
82
688
80 4
1316
18
72
16
19
70
8
1970 11
69
60
24
2059 20
521137
1433
60 16
832
28 3
53
28
19
46 26
32 48
51
52
49
82
82
79
65
65
64
59
57
52
44
39
39
19
-14
13
4
8
-5
-6
-33
5
2
N/A
-20
30
-12
3
-10
3
14
-10
4
40
Absolutechangesto Q1 2015(pp)
GDP weighted average net balance 51%
Neither attractive nor unattractiveAttractive *Note: Finland and Russia asked the question as specific to “your own company”.
Unattractive
Net balance %
83 13 4
48 28 24
3148 21
50 22 28
720 73
21
34 52
1834
18 62
45
14
32
48
23
3743 20
31
50
43
2655 19
32375
550
46 11
1733
38 32
45
24
7
60 15
72 21
25
26
23
-53
-41
-8
-1
21
22
24
30
33
36
36
41
45
72
65
-3
0
-9
-18
-6
-35
-11
3
-13
N/A
-19
-31
36
-18
22
3
7
-4
Absolutechangesto Q12015(pp)
GDP weighted average net balance 25% Net balance %
27 38 35
Bank borrowing dominates choice of external financing
14 | European CFO Survey Q3 2015 Confidence heads South
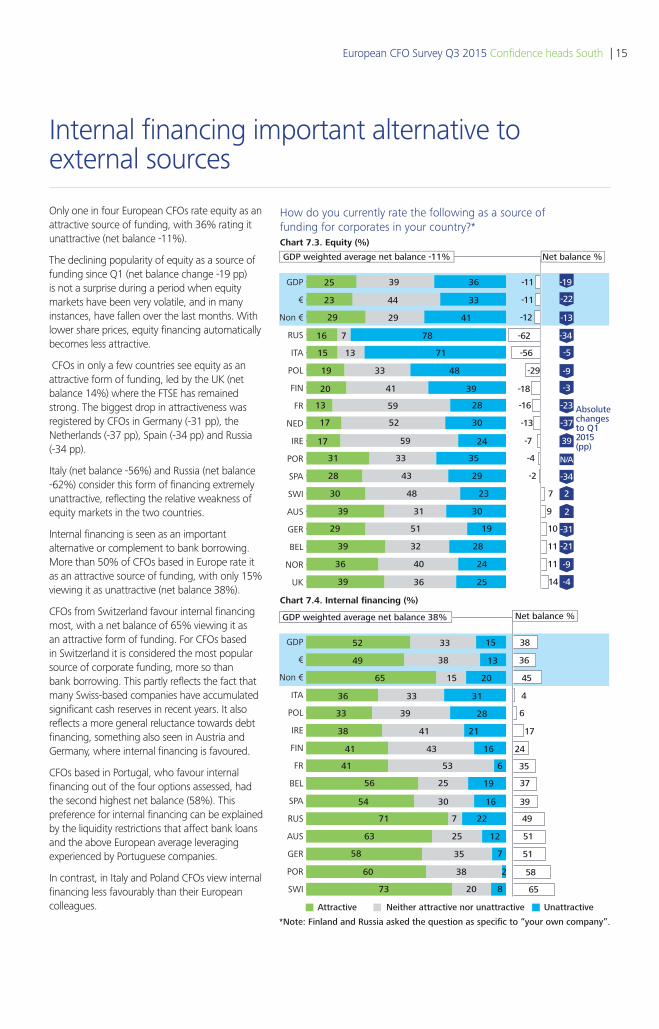
Only one in four European CFOs rate equity as an attractive source of funding, with 36% rating it unattractive (net balance -11%).
The declining popularity of equity as a source of funding since Q1 (net balance change -19 pp) is not a surprise during a period when equity markets have been very volatile, and in many instances, have fallen over the last months. With lower share prices, equity financing automatically becomes less attractive.
CFOs in only a few countries see equity as an attractive form of funding, led by the UK (net balance 14%) where the FTSE has remained strong. The biggest drop in attractiveness was registered by CFOs in Germany (-31 pp), the Netherlands (-37 pp), Spain (-34 pp) and Russia (-34 pp).
Italy (net balance -56%) and Russia (net balance -62%) consider this form of financing extremely unattractive, reflecting the relative weakness of equity markets in the two countries.
Internal financing is seen as an important alternative or complement to bank borrowing. More than 50% of CFOs based in Europe rate it as an attractive source of funding, with only 15% viewing it as unattractive (net balance 38%).
CFOs from Switzerland favour internal financing most, with a net balance of 65% viewing it as an attractive form of funding. For CFOs based in Switzerland it is considered the most popular source of corporate funding, more so than bank borrowing. This partly reflects the fact that many Swiss-based companies have accumulated significant cash reserves in recent years. It also reflects a more general reluctance towards debt financing, something also seen in Austria and Germany, where internal financing is favoured.
CFOs based in Portugal, who favour internal financing out of the four options assessed, had the second highest net balance (58%). This preference for internal financing can be explained by the liquidity restrictions that affect bank loans and the above European average leveraging experienced by Portuguese companies.
In contrast, in Italy and Poland CFOs view internal financing less favourably than their European colleagues.
How do you currently rate the following as a source offunding for corporates in your country?*Chart 7.3. Equity (%)
Chart 7.4. Internal financing (%)
UK
NOR
BEL
GER
AUS
SWI
SPA
POR
IRE
NED
FR
FIN
POL
ITA
RUS
Non €
€
GDP
SWI
POR
GER
AUS
RUS
SPA
BEL
FR
FIN
IRE
POL
ITA
Non €
€
GDP
25 39 36
4423 33
29 29 41
40
39
2436
29 51
3533
36 25
30
19
48
31
23
4328 29
39
17
52
4120 39
7816 7
2859
17 30
2459
31 30
13
33
71
19 48
15 13
-11
-11
-12
14
11
11
10
9
7
-2
-4
-7
-13
-16
-18
-29
-62
-56
-19
-22
-13
-34
-5
-9
-3
-23
-37
39
N/A
-34
2
2
-31
-21
-9
-4
Absolutechangesto Q12015(pp)
GDP weighted average net balance -11%
Neither attractive nor unattractiveAttractive
*Note: Finland and Russia asked the question as specific to “your own company”.
Unattractive
Net balance %
39 32 28
52 33 15
3849 13
65 15 20
3336 31
33
41 53
227
39 28
56
6
25
71
19
3054 16
41
63
35
3860 2
820
58 7
1225
43 16
73
38
36
45
4
6
17
24
35
37
39
49
51
51
58
65
GDP weighted average net balance 38% Net balance %
38 41 21
Internal financing important alternative to external sources
European CFO Survey Q3 2015 Confidence heads South | 15
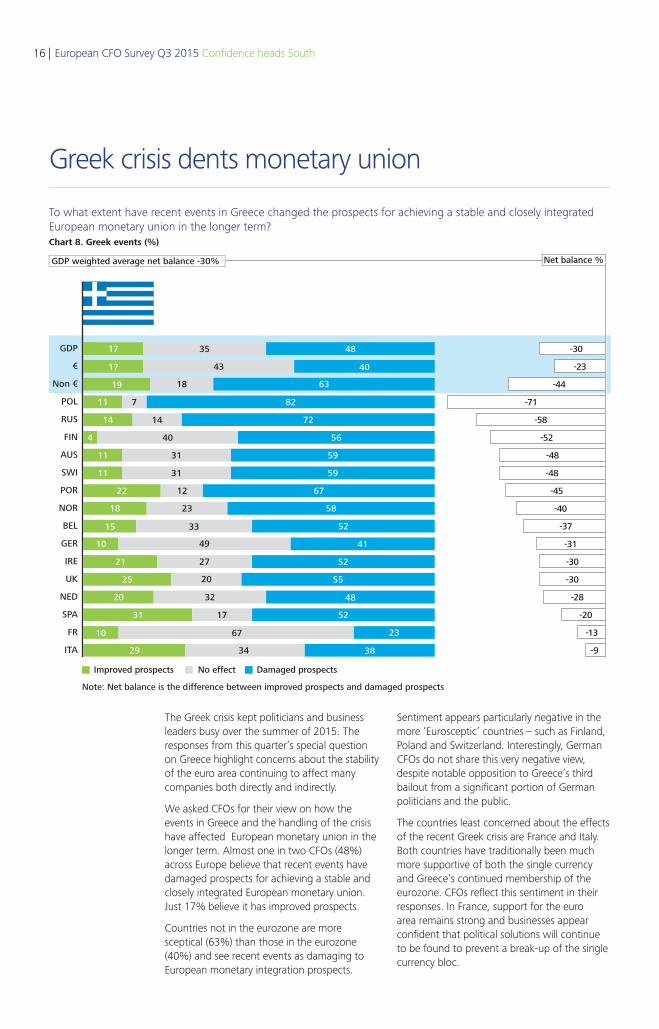
The Greek crisis kept politicians and business leaders busy over the summer of 2015. The responses from this quarter’s special question on Greece highlight concerns about the stability of the euro area continuing to affect many companies both directly and indirectly.
We asked CFOs for their view on how the events in Greece and the handling of the crisis have affected European monetary union in the longer term. Almost one in two CFOs (48%) across Europe believe that recent events have damaged prospects for achieving a stable and closely integrated European monetary union. Just 17% believe it has improved prospects.
Countries not in the eurozone are more sceptical (63%) than those in the eurozone (40%) and see recent events as damaging to European monetary integration prospects.
Greek crisis dents monetary union
ITA
FR
SPA
NED
UK
IRE
GER
BEL
NOR
POR
SWI
AUS
FIN
RUS
POL
Non €
€
GDP
To what extent have recent events in Greece changed the prospects for achieving a stable and closely integrated European monetary union in the longer term?Chart 8. Greek events (%)
4835
4043
6318
82
72
56
14
5931
40
5931
6712
5823
52
41
52
5520
34 38
32
27
49
33
48
52
23
17
67
No effect Damaged prospectsImproved prospects
GDP weighted average net balance -30% Net balance %
7
17
17
19
14
11
4
11
22
18
25
29
20
21
10
15
31
10
11
-30
-23
-44
-71
-58
-52
-48
-48
-45
-40
-37
-31
-30
-30
-28
-20
-13
-9
Note: Net balance is the difference between improved prospects and damaged prospects
Sentiment appears particularly negative in the more ‘Eurosceptic’ countries – such as Finland, Poland and Switzerland. Interestingly, German CFOs do not share this very negative view, despite notable opposition to Greece’s third bailout from a significant portion of German politicians and the public.
The countries least concerned about the effects of the recent Greek crisis are France and Italy. Both countries have traditionally been much more supportive of both the single currency and Greece’s continued membership of the eurozone. CFOs reflect this sentiment in their responses. In France, support for the euro area remains strong and businesses appear confident that political solutions will continue to be found to prevent a break-up of the single currency bloc.
16 | European CFO Survey Q3 2015 Confidence heads South

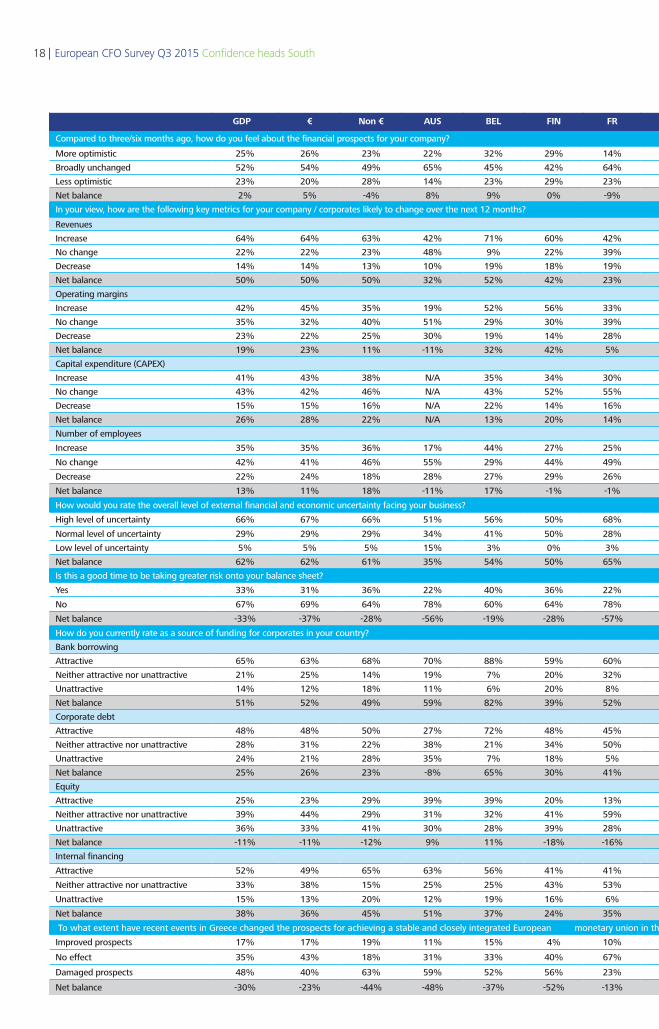
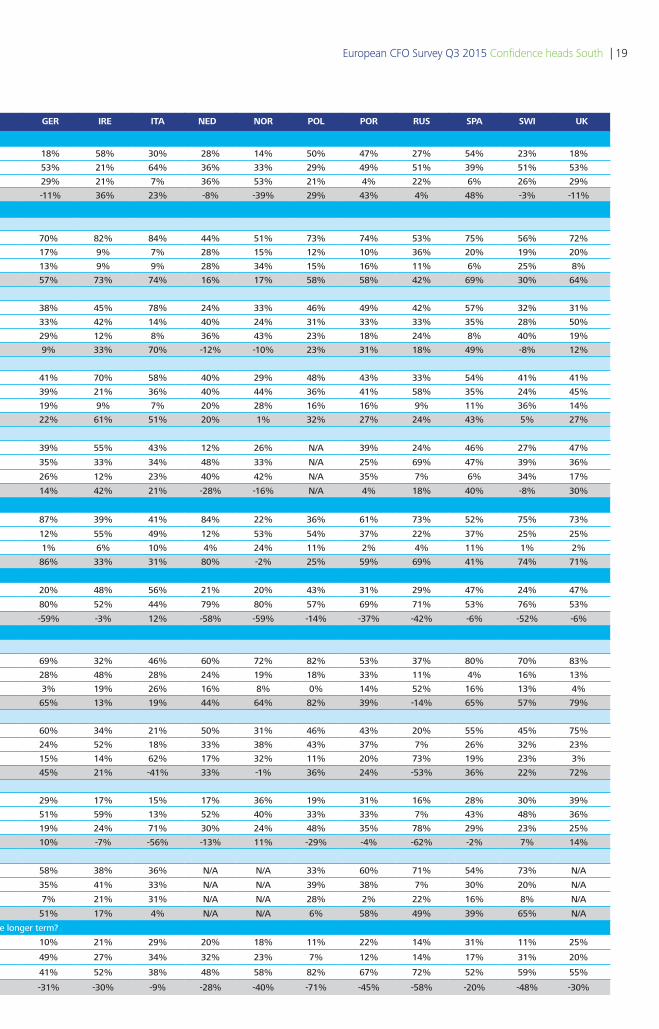
To facilitate interpretation, this table contains a full breakdown of net balances to each question. Because of rounding, percentages may not always add up to 100.
Data summary
European CFO Survey Q3 2015 Confidence heads South | 17
GDP € Non € AUS BEL FIN FR GER IRE ITA NED NOR POL POR RUS SPA SWI UK
Compared to three/six months ago, how do you feel about the financial prospects for your company?
More optimistic 25% 26% 23% 22% 32% 29% 14% 18% 58% 30% 28% 14% 50% 47% 27% 54% 23% 18%
Broadly unchanged 52% 54% 49% 65% 45% 42% 64% 53% 21% 64% 36% 33% 29% 49% 51% 39% 51% 53%
Less optimistic 23% 20% 28% 14% 23% 29% 23% 29% 21% 7% 36% 53% 21% 4% 22% 6% 26% 29%
Net balance 2% 5% -4% 8% 9% 0% -9% -11% 36% 23% -8% -39% 29% 43% 4% 48% -3% -11%
In your view, how are the following key metrics for your company / corporates likely to change over the next 12 months?
Revenues
Increase 64% 64% 63% 42% 71% 60% 42% 70% 82% 84% 44% 51% 73% 74% 53% 75% 56% 72%
No change 22% 22% 23% 48% 9% 22% 39% 17% 9% 7% 28% 15% 12% 10% 36% 20% 19% 20%
Decrease 14% 14% 13% 10% 19% 18% 19% 13% 9% 9% 28% 34% 15% 16% 11% 6% 25% 8%
Net balance 50% 50% 50% 32% 52% 42% 23% 57% 73% 74% 16% 17% 58% 58% 42% 69% 30% 64%
Operating margins
Increase 42% 45% 35% 19% 52% 56% 33% 38% 45% 78% 24% 33% 46% 49% 42% 57% 32% 31%
No change 35% 32% 40% 51% 29% 30% 39% 33% 42% 14% 40% 24% 31% 33% 33% 35% 28% 50%
Decrease 23% 22% 25% 30% 19% 14% 28% 29% 12% 8% 36% 43% 23% 18% 24% 8% 40% 19%
Net balance 19% 23% 11% -11% 32% 42% 5% 9% 33% 70% -12% -10% 23% 31% 18% 49% -8% 12%
Capital expenditure (CAPEX)
Increase 41% 43% 38% N/A 35% 34% 30% 41% 70% 58% 40% 29% 48% 43% 33% 54% 41% 41%
No change 43% 42% 46% N/A 43% 52% 55% 39% 21% 36% 40% 44% 36% 41% 58% 35% 24% 45%
Decrease 15% 15% 16% N/A 22% 14% 16% 19% 9% 7% 20% 28% 16% 16% 9% 11% 36% 14%
Net balance 26% 28% 22% N/A 13% 20% 14% 22% 61% 51% 20% 1% 32% 27% 24% 43% 5% 27%
Number of employees
Increase 35% 35% 36% 17% 44% 27% 25% 39% 55% 43% 12% 26% N/A 39% 24% 46% 27% 47%
No change 42% 41% 46% 55% 29% 44% 49% 35% 33% 34% 48% 33% N/A 25% 69% 47% 39% 36%
Decrease 22% 24% 18% 28% 27% 29% 26% 26% 12% 23% 40% 42% N/A 35% 7% 6% 34% 17%
Net balance 13% 11% 18% -11% 17% -1% -1% 14% 42% 21% -28% -16% N/A 4% 18% 40% -8% 30%
How would you rate the overall level of external financial and economic uncertainty facing your business?
High level of uncertainty 66% 67% 66% 51% 56% 50% 68% 87% 39% 41% 84% 22% 36% 61% 73% 52% 75% 73%
Normal level of uncertainty 29% 29% 29% 34% 41% 50% 28% 12% 55% 49% 12% 53% 54% 37% 22% 37% 25% 25%
Low level of uncertainty 5% 5% 5% 15% 3% 0% 3% 1% 6% 10% 4% 24% 11% 2% 4% 11% 1% 2%
Net balance 62% 62% 61% 35% 54% 50% 65% 86% 33% 31% 80% -2% 25% 59% 69% 41% 74% 71%
Is this a good time to be taking greater risk onto your balance sheet?
Yes 33% 31% 36% 22% 40% 36% 22% 20% 48% 56% 21% 20% 43% 31% 29% 47% 24% 47%
No 67% 69% 64% 78% 60% 64% 78% 80% 52% 44% 79% 80% 57% 69% 71% 53% 76% 53%
Net balance -33% -37% -28% -56% -19% -28% -57% -59% -3% 12% -58% -59% -14% -37% -42% -6% -52% -6%
How do you currently rate as a source of funding for corporates in your country?
Bank borrowing
Attractive 65% 63% 68% 70% 88% 59% 60% 69% 32% 46% 60% 72% 82% 53% 37% 80% 70% 83%
Neither attractive nor unattractive 21% 25% 14% 19% 7% 20% 32% 28% 48% 28% 24% 19% 18% 33% 11% 4% 16% 13%
Unattractive 14% 12% 18% 11% 6% 20% 8% 3% 19% 26% 16% 8% 0% 14% 52% 16% 13% 4%
Net balance 51% 52% 49% 59% 82% 39% 52% 65% 13% 19% 44% 64% 82% 39% -14% 65% 57% 79%
Corporate debt
Attractive 48% 48% 50% 27% 72% 48% 45% 60% 34% 21% 50% 31% 46% 43% 20% 55% 45% 75%
Neither attractive nor unattractive 28% 31% 22% 38% 21% 34% 50% 24% 52% 18% 33% 38% 43% 37% 7% 26% 32% 23%
Unattractive 24% 21% 28% 35% 7% 18% 5% 15% 14% 62% 17% 32% 11% 20% 73% 19% 23% 3%
Net balance 25% 26% 23% -8% 65% 30% 41% 45% 21% -41% 33% -1% 36% 24% -53% 36% 22% 72%
Equity
Attractive 25% 23% 29% 39% 39% 20% 13% 29% 17% 15% 17% 36% 19% 31% 16% 28% 30% 39%
Neither attractive nor unattractive 39% 44% 29% 31% 32% 41% 59% 51% 59% 13% 52% 40% 33% 33% 7% 43% 48% 36%
Unattractive 36% 33% 41% 30% 28% 39% 28% 19% 24% 71% 30% 24% 48% 35% 78% 29% 23% 25%
Net balance -11% -11% -12% 9% 11% -18% -16% 10% -7% -56% -13% 11% -29% -4% -62% -2% 7% 14%
Internal financing
Attractive 52% 49% 65% 63% 56% 41% 41% 58% 38% 36% N/A N/A 33% 60% 71% 54% 73% N/A
Neither attractive nor unattractive 33% 38% 15% 25% 25% 43% 53% 35% 41% 33% N/A N/A 39% 38% 7% 30% 20% N/A
Unattractive 15% 13% 20% 12% 19% 16% 6% 7% 21% 31% N/A N/A 28% 2% 22% 16% 8% N/A
Net balance 38% 36% 45% 51% 37% 24% 35% 51% 17% 4% N/A N/A 6% 58% 49% 39% 65% N/A
To what extent have recent events in Greece changed the prospects for achieving a stable and closely integrated European monetary union in the longer term?
Improved prospects 17% 17% 19% 11% 15% 4% 10% 10% 21% 29% 20% 18% 11% 22% 14% 31% 11% 25%
No effect 35% 43% 18% 31% 33% 40% 67% 49% 27% 34% 32% 23% 7% 12% 14% 17% 31% 20%
Damaged prospects 48% 40% 63% 59% 52% 56% 23% 41% 52% 38% 48% 58% 82% 67% 72% 52% 59% 55%
Net balance -30% -23% -44% -48% -37% -52% -13% -31% -30% -9% -28% -40% -71% -45% -58% -20% -48% -30%
18 | European CFO Survey Q3 2015 Confidence heads South
GDP € Non € AUS BEL FIN FR GER IRE ITA NED NOR POL POR RUS SPA SWI UK
Compared to three/six months ago, how do you feel about the financial prospects for your company?
More optimistic 25% 26% 23% 22% 32% 29% 14% 18% 58% 30% 28% 14% 50% 47% 27% 54% 23% 18%
Broadly unchanged 52% 54% 49% 65% 45% 42% 64% 53% 21% 64% 36% 33% 29% 49% 51% 39% 51% 53%
Less optimistic 23% 20% 28% 14% 23% 29% 23% 29% 21% 7% 36% 53% 21% 4% 22% 6% 26% 29%
Net balance 2% 5% -4% 8% 9% 0% -9% -11% 36% 23% -8% -39% 29% 43% 4% 48% -3% -11%
In your view, how are the following key metrics for your company / corporates likely to change over the next 12 months?
Revenues
Increase 64% 64% 63% 42% 71% 60% 42% 70% 82% 84% 44% 51% 73% 74% 53% 75% 56% 72%
No change 22% 22% 23% 48% 9% 22% 39% 17% 9% 7% 28% 15% 12% 10% 36% 20% 19% 20%
Decrease 14% 14% 13% 10% 19% 18% 19% 13% 9% 9% 28% 34% 15% 16% 11% 6% 25% 8%
Net balance 50% 50% 50% 32% 52% 42% 23% 57% 73% 74% 16% 17% 58% 58% 42% 69% 30% 64%
Operating margins
Increase 42% 45% 35% 19% 52% 56% 33% 38% 45% 78% 24% 33% 46% 49% 42% 57% 32% 31%
No change 35% 32% 40% 51% 29% 30% 39% 33% 42% 14% 40% 24% 31% 33% 33% 35% 28% 50%
Decrease 23% 22% 25% 30% 19% 14% 28% 29% 12% 8% 36% 43% 23% 18% 24% 8% 40% 19%
Net balance 19% 23% 11% -11% 32% 42% 5% 9% 33% 70% -12% -10% 23% 31% 18% 49% -8% 12%
Capital expenditure (CAPEX)
Increase 41% 43% 38% N/A 35% 34% 30% 41% 70% 58% 40% 29% 48% 43% 33% 54% 41% 41%
No change 43% 42% 46% N/A 43% 52% 55% 39% 21% 36% 40% 44% 36% 41% 58% 35% 24% 45%
Decrease 15% 15% 16% N/A 22% 14% 16% 19% 9% 7% 20% 28% 16% 16% 9% 11% 36% 14%
Net balance 26% 28% 22% N/A 13% 20% 14% 22% 61% 51% 20% 1% 32% 27% 24% 43% 5% 27%
Number of employees
Increase 35% 35% 36% 17% 44% 27% 25% 39% 55% 43% 12% 26% N/A 39% 24% 46% 27% 47%
No change 42% 41% 46% 55% 29% 44% 49% 35% 33% 34% 48% 33% N/A 25% 69% 47% 39% 36%
Decrease 22% 24% 18% 28% 27% 29% 26% 26% 12% 23% 40% 42% N/A 35% 7% 6% 34% 17%
Net balance 13% 11% 18% -11% 17% -1% -1% 14% 42% 21% -28% -16% N/A 4% 18% 40% -8% 30%
How would you rate the overall level of external financial and economic uncertainty facing your business?
High level of uncertainty 66% 67% 66% 51% 56% 50% 68% 87% 39% 41% 84% 22% 36% 61% 73% 52% 75% 73%
Normal level of uncertainty 29% 29% 29% 34% 41% 50% 28% 12% 55% 49% 12% 53% 54% 37% 22% 37% 25% 25%
Low level of uncertainty 5% 5% 5% 15% 3% 0% 3% 1% 6% 10% 4% 24% 11% 2% 4% 11% 1% 2%
Net balance 62% 62% 61% 35% 54% 50% 65% 86% 33% 31% 80% -2% 25% 59% 69% 41% 74% 71%
Is this a good time to be taking greater risk onto your balance sheet?
Yes 33% 31% 36% 22% 40% 36% 22% 20% 48% 56% 21% 20% 43% 31% 29% 47% 24% 47%
No 67% 69% 64% 78% 60% 64% 78% 80% 52% 44% 79% 80% 57% 69% 71% 53% 76% 53%
Net balance -33% -37% -28% -56% -19% -28% -57% -59% -3% 12% -58% -59% -14% -37% -42% -6% -52% -6%
How do you currently rate as a source of funding for corporates in your country?
Bank borrowing
Attractive 65% 63% 68% 70% 88% 59% 60% 69% 32% 46% 60% 72% 82% 53% 37% 80% 70% 83%
Neither attractive nor unattractive 21% 25% 14% 19% 7% 20% 32% 28% 48% 28% 24% 19% 18% 33% 11% 4% 16% 13%
Unattractive 14% 12% 18% 11% 6% 20% 8% 3% 19% 26% 16% 8% 0% 14% 52% 16% 13% 4%
Net balance 51% 52% 49% 59% 82% 39% 52% 65% 13% 19% 44% 64% 82% 39% -14% 65% 57% 79%
Corporate debt
Attractive 48% 48% 50% 27% 72% 48% 45% 60% 34% 21% 50% 31% 46% 43% 20% 55% 45% 75%
Neither attractive nor unattractive 28% 31% 22% 38% 21% 34% 50% 24% 52% 18% 33% 38% 43% 37% 7% 26% 32% 23%
Unattractive 24% 21% 28% 35% 7% 18% 5% 15% 14% 62% 17% 32% 11% 20% 73% 19% 23% 3%
Net balance 25% 26% 23% -8% 65% 30% 41% 45% 21% -41% 33% -1% 36% 24% -53% 36% 22% 72%
Equity
Attractive 25% 23% 29% 39% 39% 20% 13% 29% 17% 15% 17% 36% 19% 31% 16% 28% 30% 39%
Neither attractive nor unattractive 39% 44% 29% 31% 32% 41% 59% 51% 59% 13% 52% 40% 33% 33% 7% 43% 48% 36%
Unattractive 36% 33% 41% 30% 28% 39% 28% 19% 24% 71% 30% 24% 48% 35% 78% 29% 23% 25%
Net balance -11% -11% -12% 9% 11% -18% -16% 10% -7% -56% -13% 11% -29% -4% -62% -2% 7% 14%
Internal financing
Attractive 52% 49% 65% 63% 56% 41% 41% 58% 38% 36% N/A N/A 33% 60% 71% 54% 73% N/A
Neither attractive nor unattractive 33% 38% 15% 25% 25% 43% 53% 35% 41% 33% N/A N/A 39% 38% 7% 30% 20% N/A
Unattractive 15% 13% 20% 12% 19% 16% 6% 7% 21% 31% N/A N/A 28% 2% 22% 16% 8% N/A
Net balance 38% 36% 45% 51% 37% 24% 35% 51% 17% 4% N/A N/A 6% 58% 49% 39% 65% N/A
To what extent have recent events in Greece changed the prospects for achieving a stable and closely integrated European monetary union in the longer term?
Improved prospects 17% 17% 19% 11% 15% 4% 10% 10% 21% 29% 20% 18% 11% 22% 14% 31% 11% 25%
No effect 35% 43% 18% 31% 33% 40% 67% 49% 27% 34% 32% 23% 7% 12% 14% 17% 31% 20%
Damaged prospects 48% 40% 63% 59% 52% 56% 23% 41% 52% 38% 48% 58% 82% 67% 72% 52% 59% 55%
Net balance -30% -23% -44% -48% -37% -52% -13% -31% -30% -9% -28% -40% -71% -45% -58% -20% -48% -30%
European CFO Survey Q3 2015 Confidence heads South | 19
Deloitte refers to one or more of Deloitte Touche Tohmatsu Limited (“DTTL”), a UK private company limited by guarantee, and its network of member firms, each of which is a legally separate and independent entity. Please see www.deloitte.co.uk/about for a detailed description of the legal structure of DTTL and its member firms.
Deloitte LLP is the United Kingdom member firm of DTTL.
This publication has been written in general terms and therefore cannot be relied on to cover specific situations; application of the principles set out will depend upon the particular circumstances involved and we recommend that you obtain professional advice before acting or refraining from acting on any of the contents of this publication. Deloitte LLP would be pleased to advise readers on how to apply the principles set out in this publication to their specific circumstances. Deloitte LLP accepts no duty of care or liability for any loss occasioned to any person acting or refraining from action as a result of any material in this publication.
© 2015 Deloitte LLP. All rights reserved.
Deloitte LLP is a limited liability partnership registered in England and Wales with registered number OC303675 and its registered office at 2 New Street Square, London EC4A 3BZ, United Kingdom. Tel: +44 (0) 20 7936 3000 Fax: +44 (0) 20 7583 1198.
Designed and produced by The Creative Studio at Deloitte, London. J2697
www.deloitteresearchemea.comAustriaUlrike ErdélyiCFO Programme ManagerDeloitte Audit Wirtschaftsprüfungs GmbH+43 1 537 00 [email protected]
IrelandDaniel GaffneyDirector Finance Transformation Management ConsultingDeloitte Ireland +353 1417 [email protected]
PortugalNelson FontainhasCFO Survey LeaderDeloitte Portugal +351 2135 [email protected]
BelgiumSophie De MeyerMarketing & Communication ManagerDeloitte Belgium+ 32 260 060 [email protected]
ItalyMariangela CampalaniDirector, Clients and Markets Deloitte Italy+39 028 332 [email protected]
RussiaLora ZemlyanskayaSenior Specialist, Research CentreDeloitte, CIS+7 495 787 [email protected]
FinlandMarkus KaihoniemiPartner, Finance LeaderDeloitte Finland+358 207 555 [email protected]
NetherlandsFrank GeelenCFO Programme Lead PartnerDeloitte Netherlands+31 882 884 [email protected]
SpainNuria FernandezSenior Manager, CFO ProgrammeDeloitte Spain+34 9143 [email protected]
FranceValerie FlamentPartnerDeloitte France+33 140 882 [email protected]
NorwayAndreas Enger Head of Financial AdvisoryDeloitte Norway+47 2327 [email protected]
SwitzerlandMichael GramppEuropean CFO Survey Lead & Head of Research SwitzerlandDeloitte AG+41 582 796 [email protected]
GermanyAlexander BoerschDirector, Head of ResearchDeloitte GmbH+49 89 29036 [email protected]
PolandAnna NowakClients & MarketsDeloitte Poland +48 22 348 [email protected]
UKIan StewartChief EconomistDeloitte LLP+44 2070 079 [email protected]