Embed Size (px)
Citation preview
1
The following supplement accompanies the article
European drought regimes under mitigated and unmitigated
climate change: application of the Community Integrated
Assessment System (CIAS)
R. Warren1,*
, R. M. S. Yu1, T. J. Osborn
2, S. de la Nava Santos
1
1Tyndall Centre and
2Climatic Research Unit, School of Environmental Sciences, University of East Anglia, Norwich
NR4 7TJ, UK
*Email: [email protected]
Climate Research 51: 105–123 (2012)
Supplement. Additional data
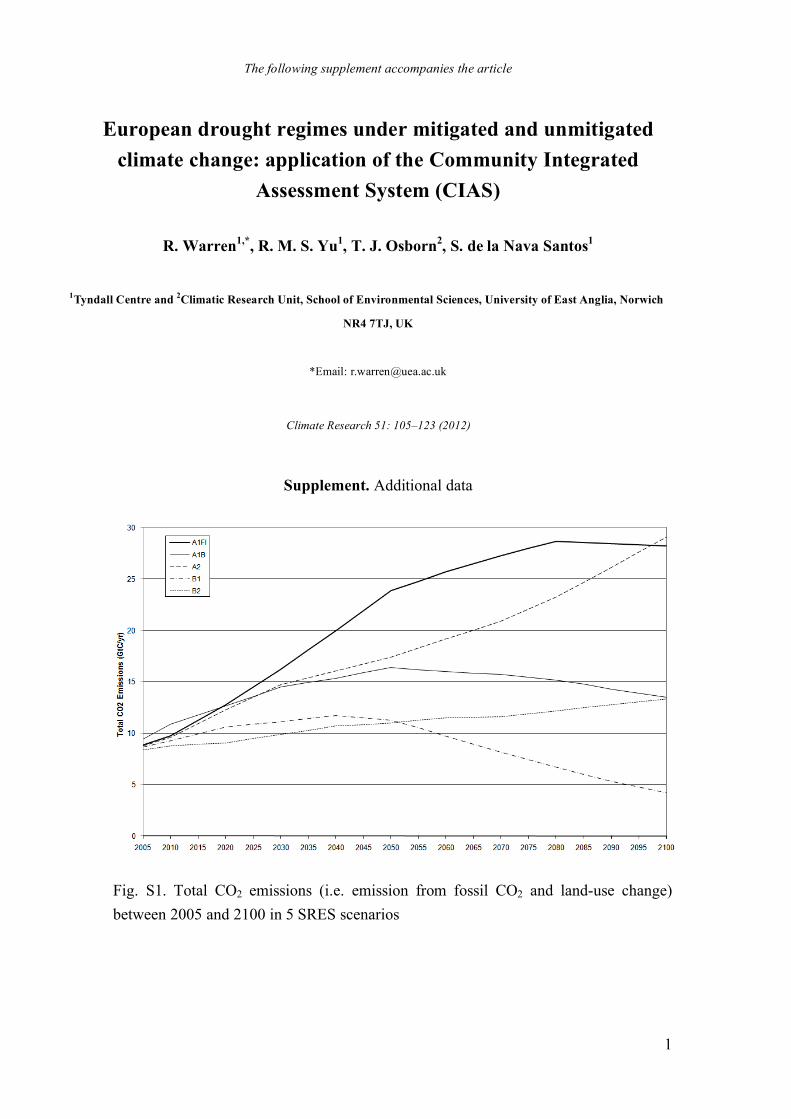
Fig. S1. Total CO2 emissions (i.e. emission from fossil CO2 and land-use change)
between 2005 and 2100 in 5 SRES scenarios
2
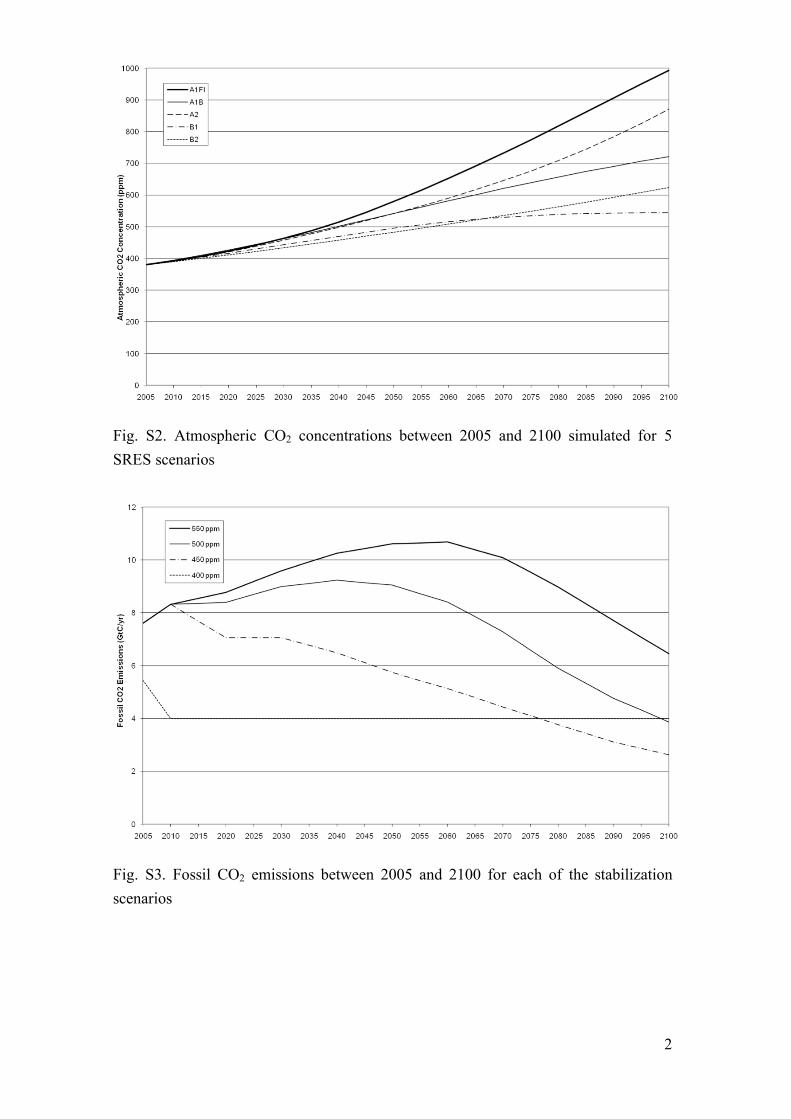
Fig. S2. Atmospheric CO2 concentrations between 2005 and 2100 simulated for 5
SRES scenarios
Fig. S3. Fossil CO2 emissions between 2005 and 2100 for each of the stabilization
scenarios
3
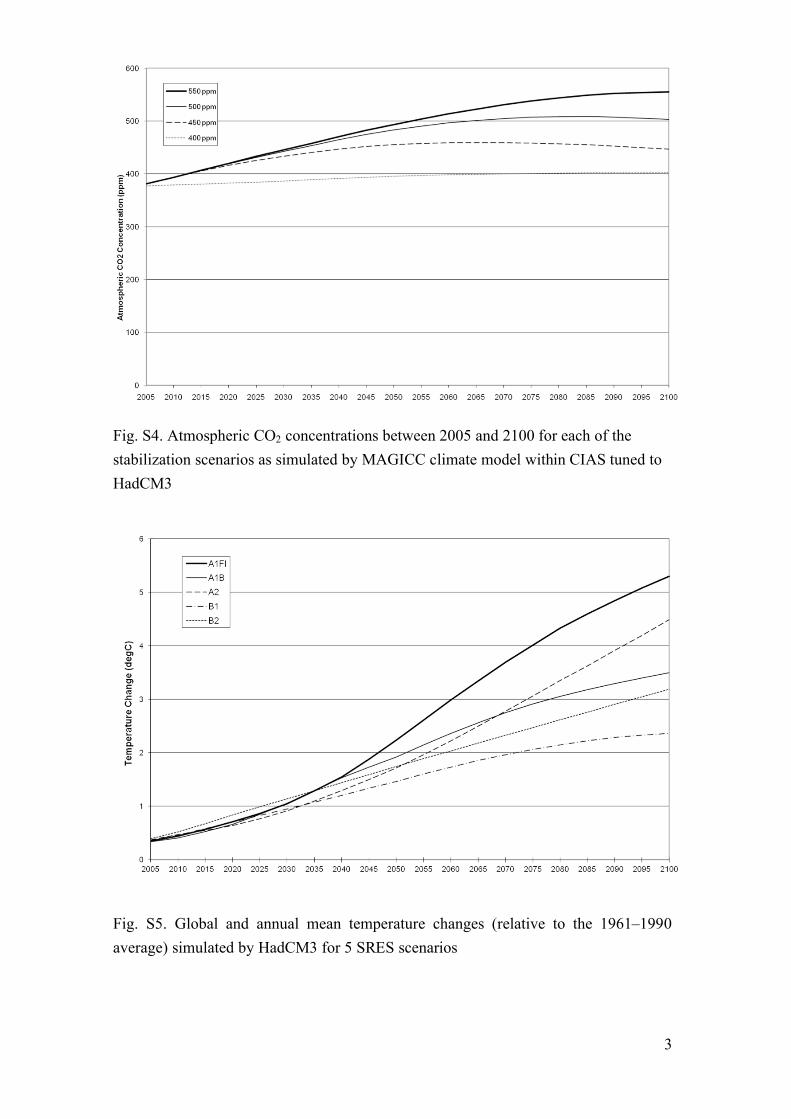
Fig. S4. Atmospheric CO2 concentrations between 2005 and 2100 for each of the
stabilization scenarios as simulated by MAGICC climate model within CIAS tuned to
HadCM3
Fig. S5. Global and annual mean temperature changes (relative to the 1961–1990
average) simulated by HadCM3 for 5 SRES scenarios
4
0
0.5
1
1.5
2
2.5
3
2005 2015 2025 2035 2045 2055 2065 2075 2085 2095
Te
mp
era
ture
ch
an
ge
(°C
)
550 ppm
500 ppm
450 ppm
400 ppm
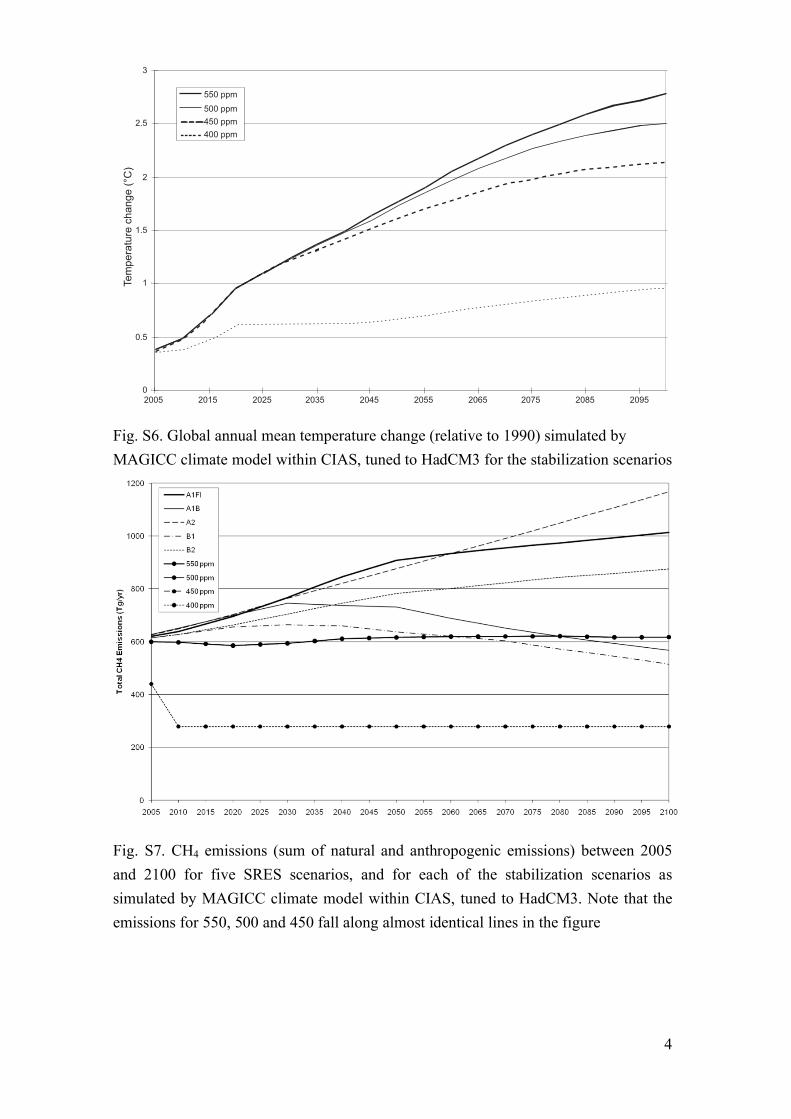
Fig. S6. Global annual mean temperature change (relative to 1990) simulated by
MAGICC climate model within CIAS, tuned to HadCM3 for the stabilization scenarios
Fig. S7. CH4 emissions (sum of natural and anthropogenic emissions) between 2005
and 2100 for five SRES scenarios, and for each of the stabilization scenarios as
simulated by MAGICC climate model within CIAS, tuned to HadCM3. Note that the
emissions for 550, 500 and 450 fall along almost identical lines in the figure
5
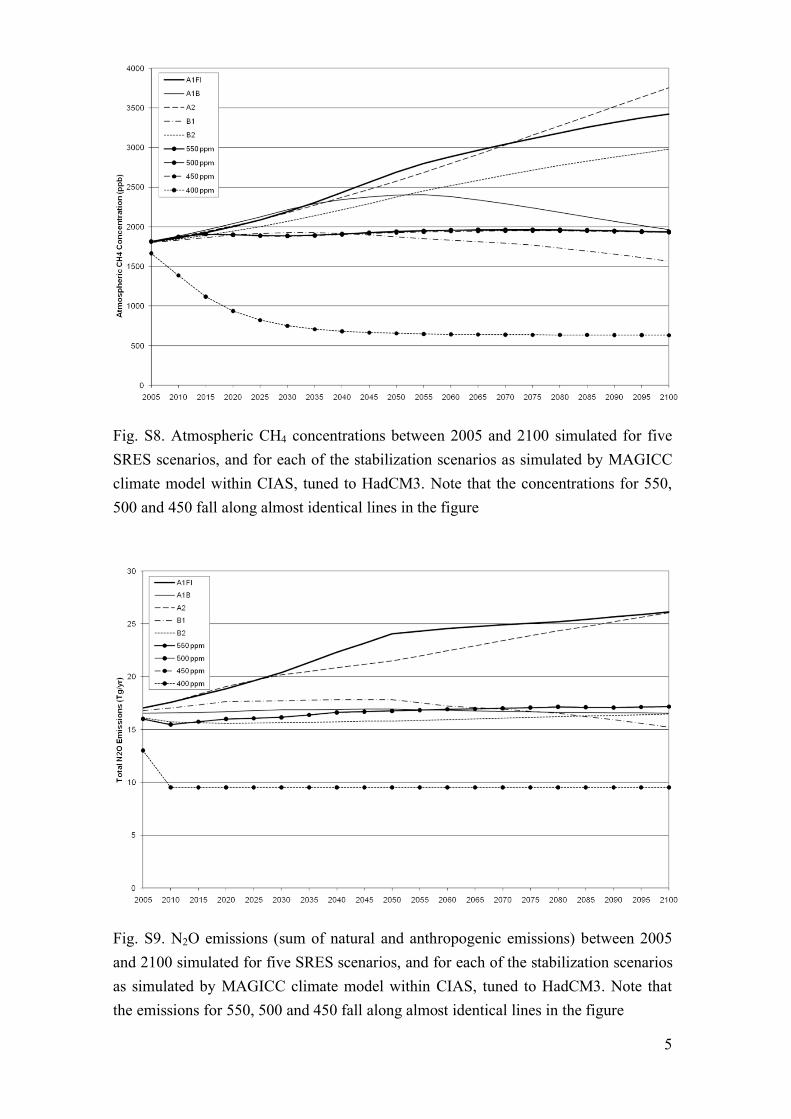
Fig. S8. Atmospheric CH4 concentrations between 2005 and 2100 simulated for five
SRES scenarios, and for each of the stabilization scenarios as simulated by MAGICC
climate model within CIAS, tuned to HadCM3. Note that the concentrations for 550,
500 and 450 fall along almost identical lines in the figure
Fig. S9. N2O emissions (sum of natural and anthropogenic emissions) between 2005
and 2100 simulated for five SRES scenarios, and for each of the stabilization scenarios
as simulated by MAGICC climate model within CIAS, tuned to HadCM3. Note that
the emissions for 550, 500 and 450 fall along almost identical lines in the figure
6
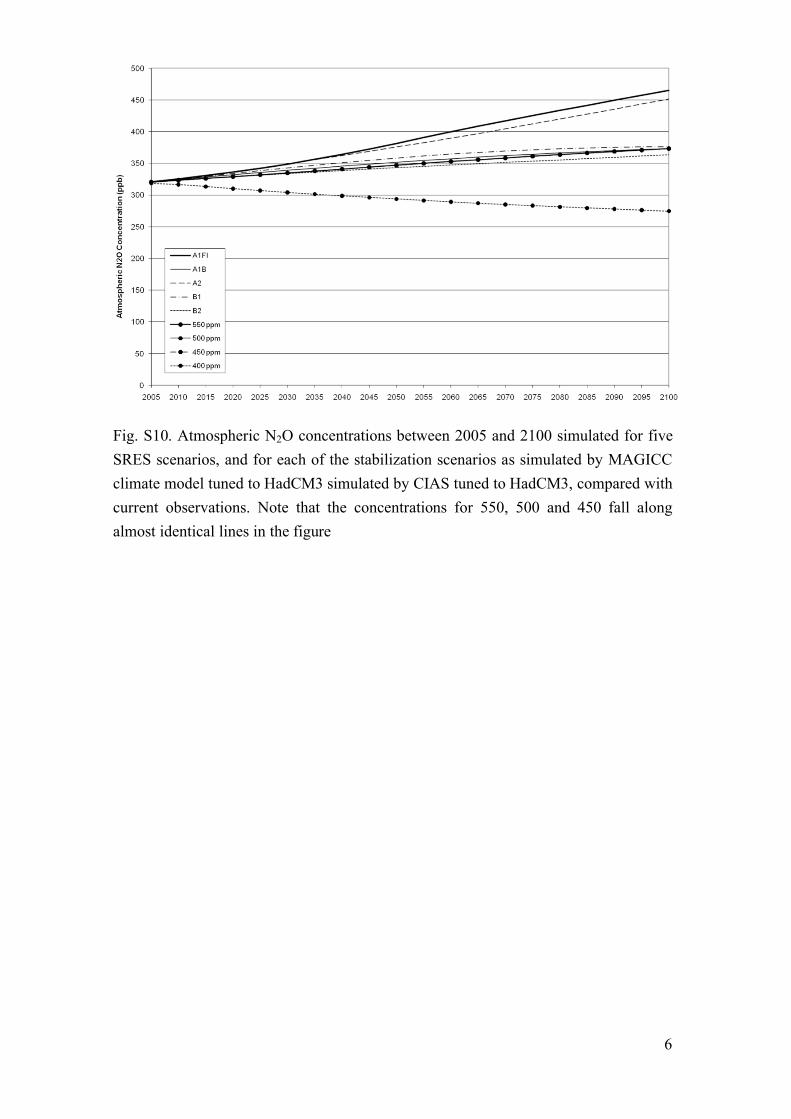
Fig. S10. Atmospheric N2O concentrations between 2005 and 2100 simulated for five
SRES scenarios, and for each of the stabilization scenarios as simulated by MAGICC
climate model tuned to HadCM3 simulated by CIAS tuned to HadCM3, compared with
current observations. Note that the concentrations for 550, 500 and 450 fall along
almost identical lines in the figure
7
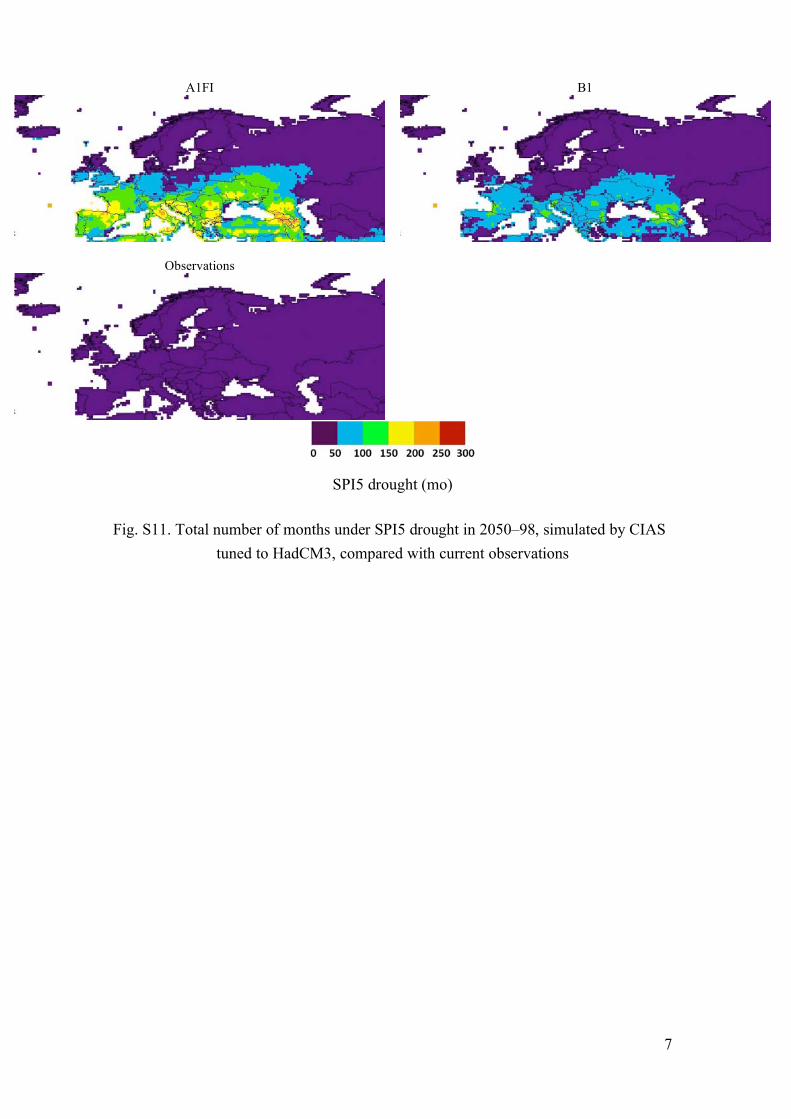
A1FI
B1
Observations
SPI5 drought (mo)
Fig. S11. Total number of months under SPI5 drought in 2050–98, simulated by CIAS
tuned to HadCM3, compared with current observations
8
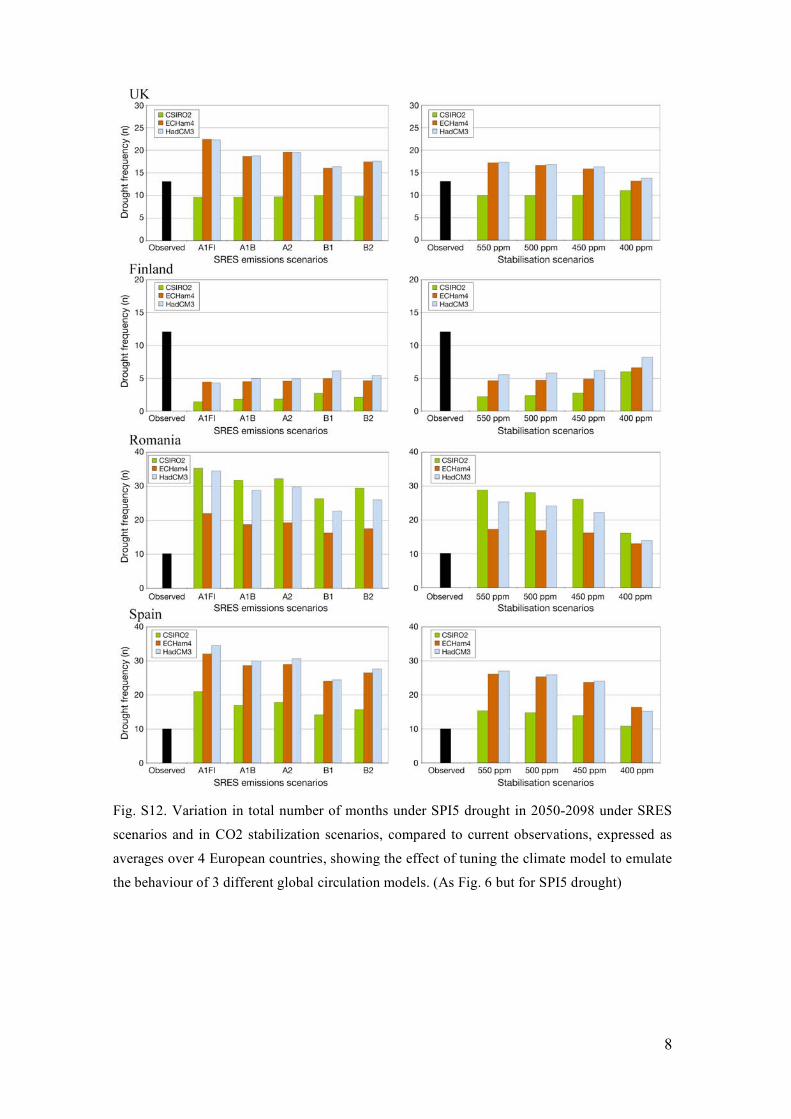
Fig. S12. Variation in total number of months under SPI5 drought in 2050-2098 under SRES
scenarios and in CO2 stabilization scenarios, compared to current observations, expressed as
averages over 4 European countries, showing the effect of tuning the climate model to emulate
the behaviour of 3 different global circulation models. (As Fig. 6 but for SPI5 drought)
9
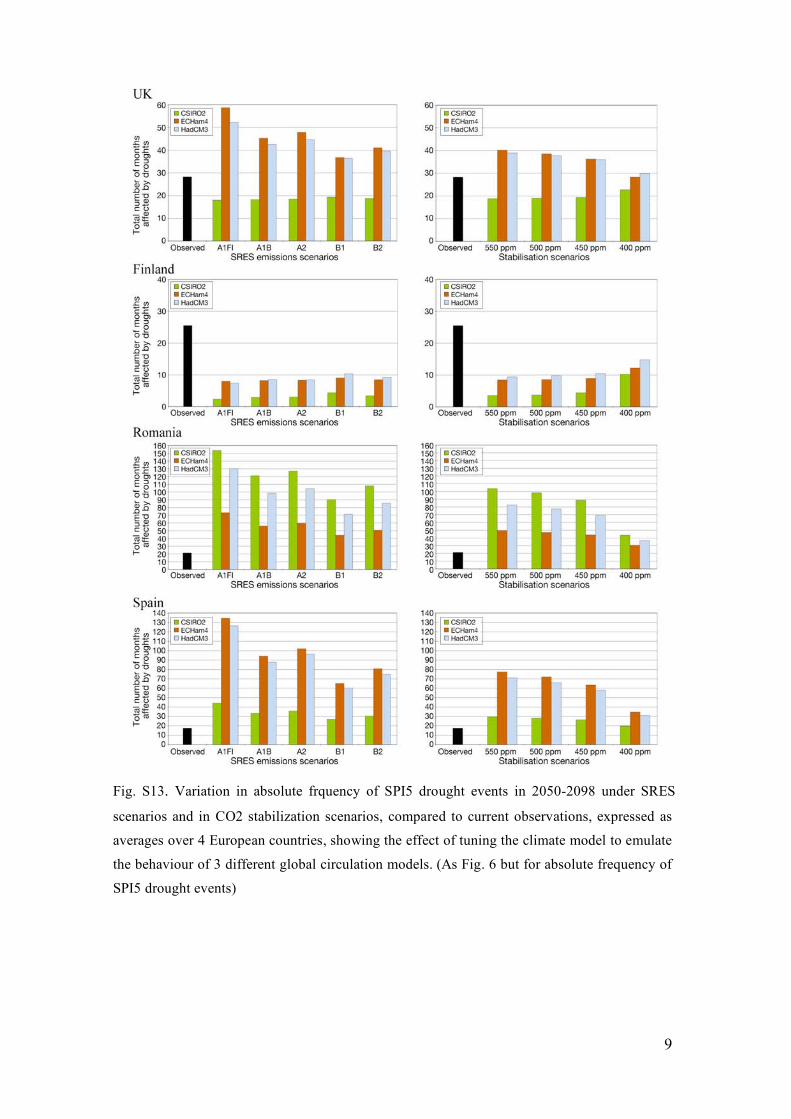
Fig. S13. Variation in absolute frquency of SPI5 drought events in 2050-2098 under SRES
scenarios and in CO2 stabilization scenarios, compared to current observations, expressed as
averages over 4 European countries, showing the effect of tuning the climate model to emulate
the behaviour of 3 different global circulation models. (As Fig. 6 but for absolute frequency of
SPI5 drought events)
10
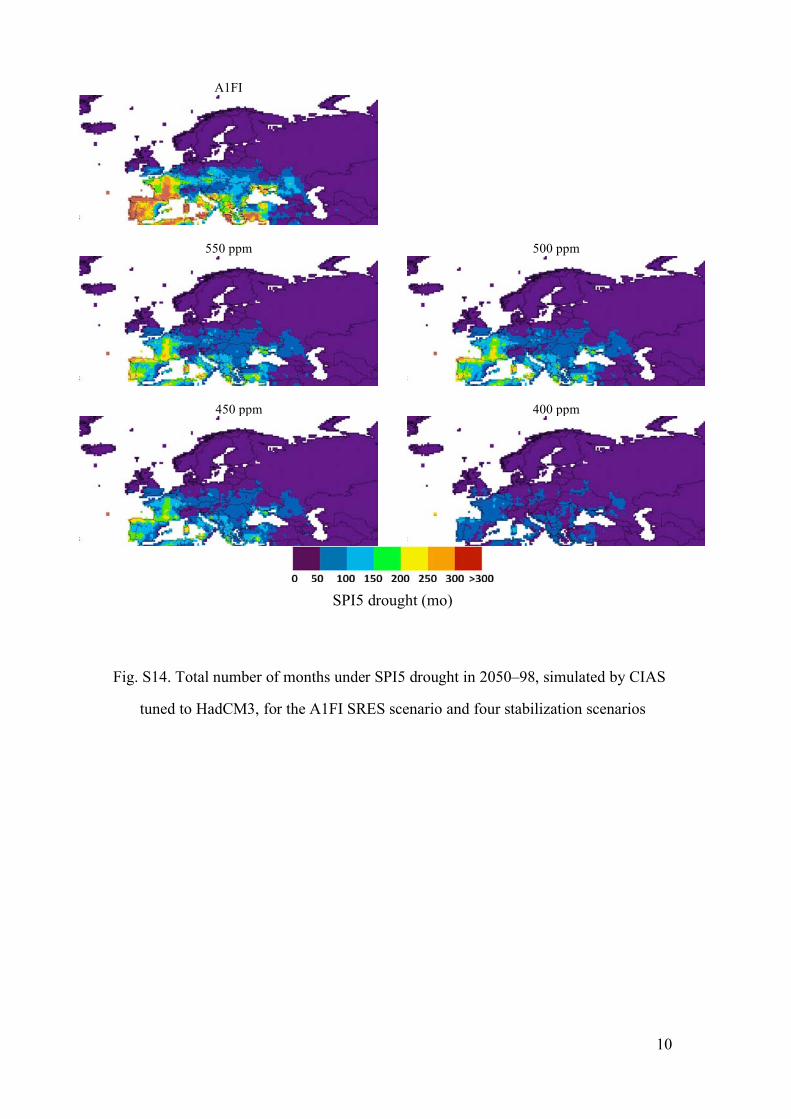
A1FI
550 ppm
500 ppm
450 ppm
400 ppm
SPI5 drought (mo)
Fig. S14. Total number of months under SPI5 drought in 2050–98, simulated by CIAS
tuned to HadCM3, for the A1FI SRES scenario and four stabilization scenarios
11
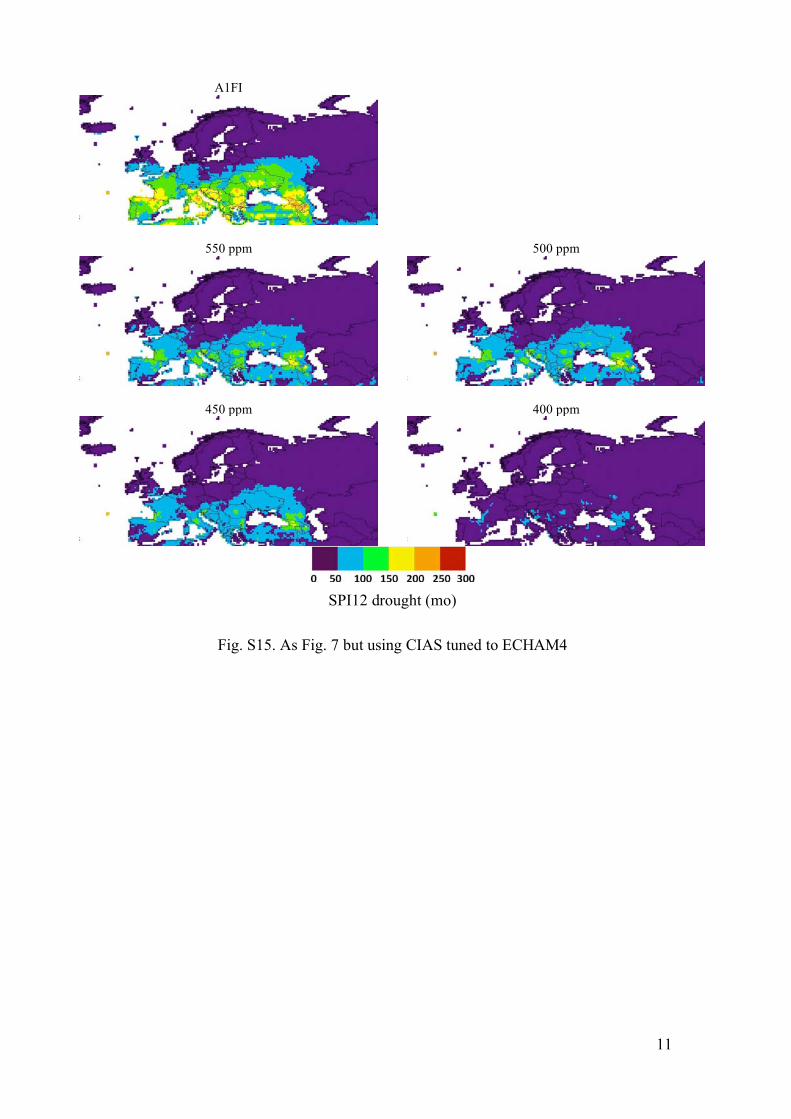
A1FI
550 ppm
500 ppm
450 ppm
400 ppm
SPI12 drought (mo)
Fig. S15. As Fig. 7 but using CIAS tuned to ECHAM4
12
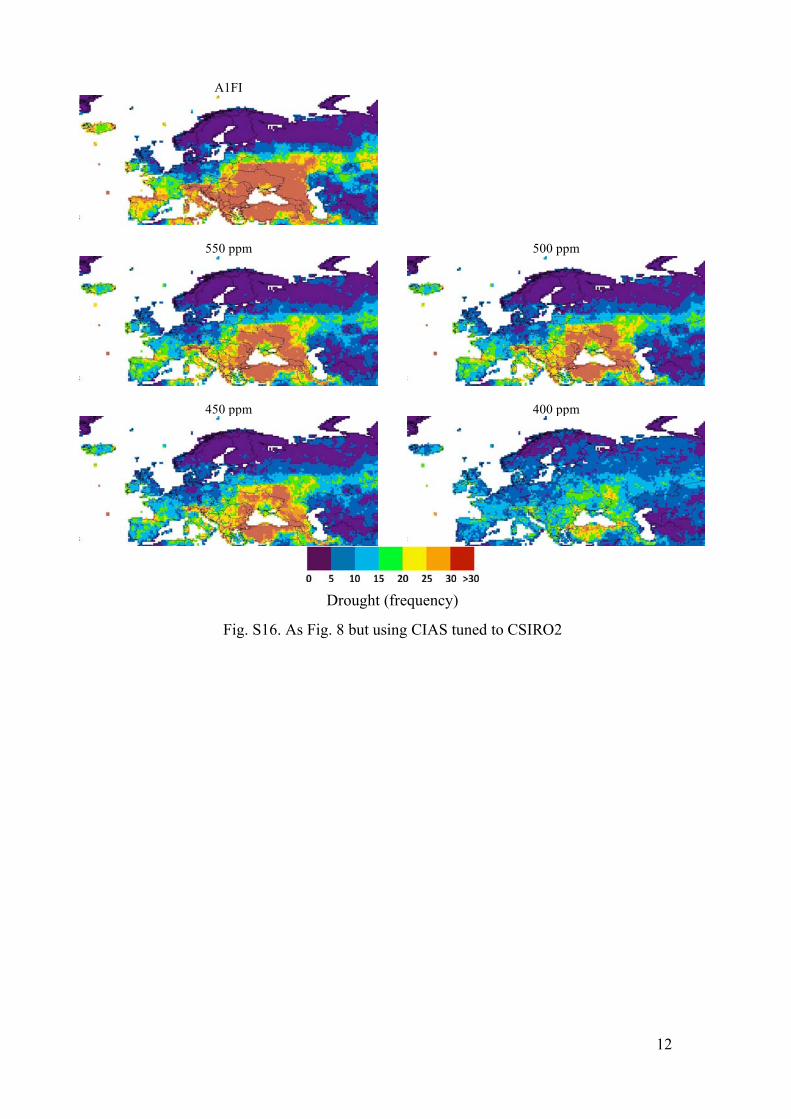
A1FI
550 ppm
500 ppm
450 ppm
400 ppm
Drought (frequency)
Fig. S16. As Fig. 8 but using CIAS tuned to CSIRO2
13
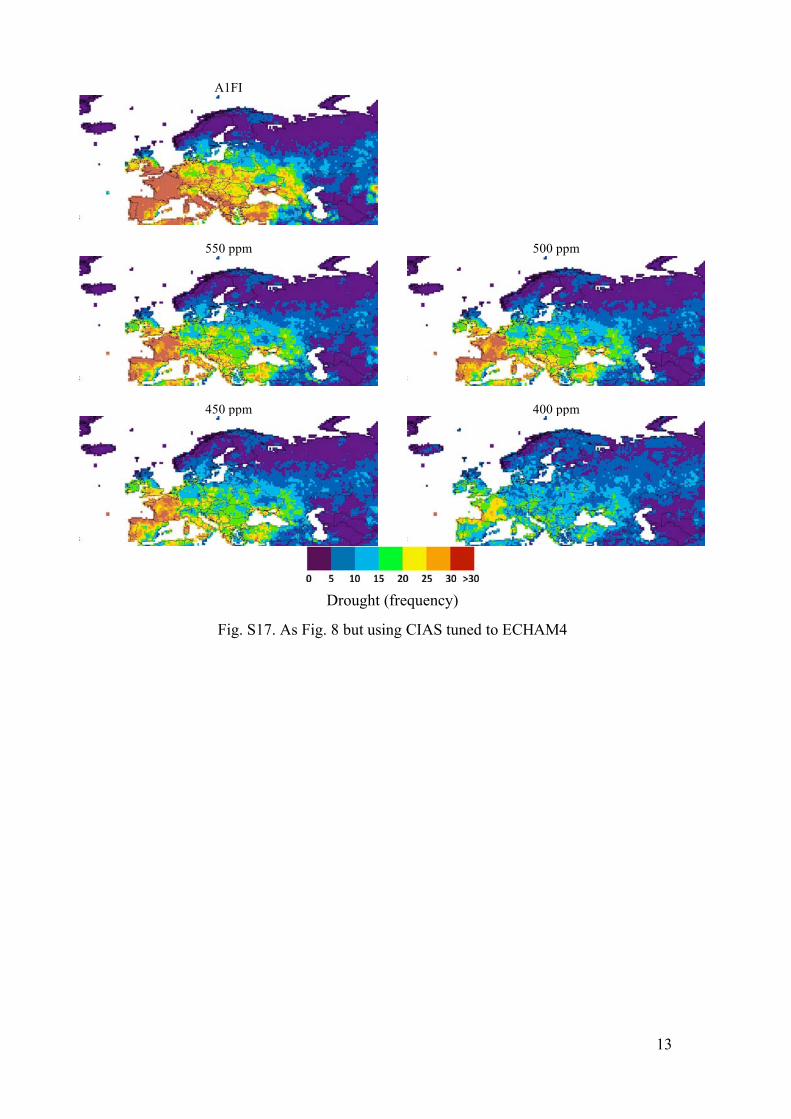
A1FI
550 ppm
500 ppm
450 ppm
400 ppm
Drought (frequency)
Fig. S17. As Fig. 8 but using CIAS tuned to ECHAM4
14
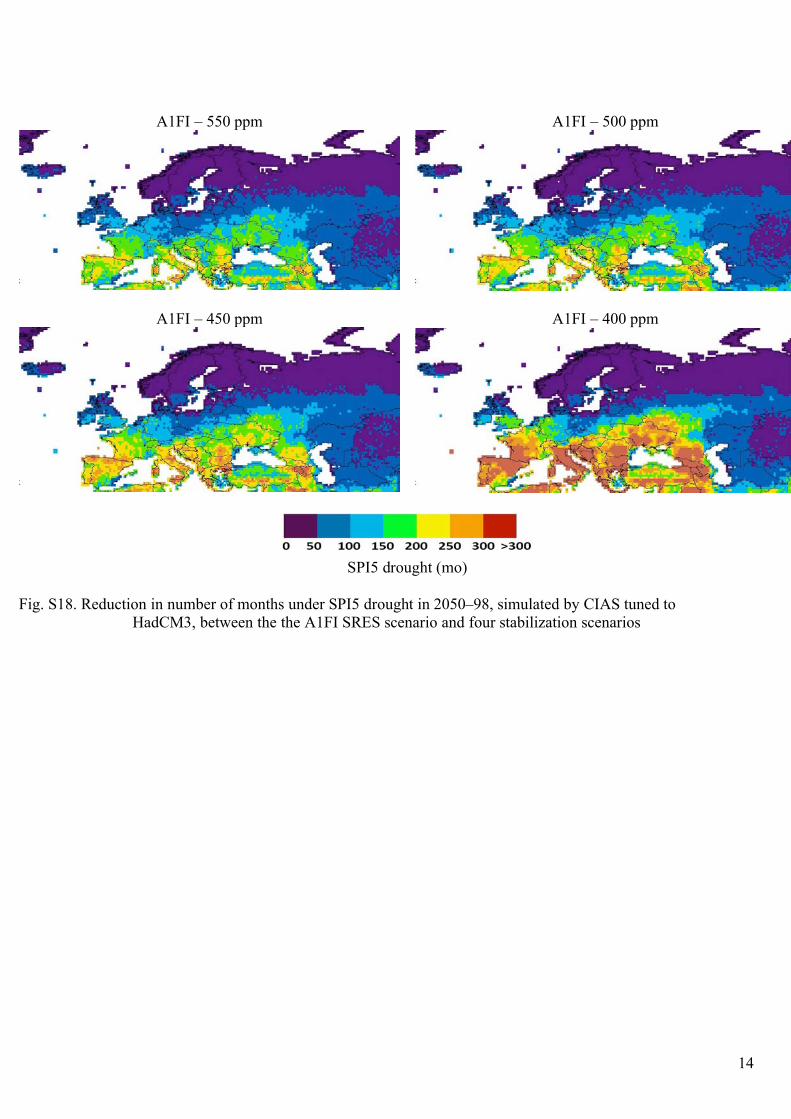
A1FI – 550 ppm
A1FI – 500 ppm
A1FI – 450 ppm
A1FI – 400 ppm
SPI5 drought (mo)
Fig. S18. Reduction in number of months under SPI5 drought in 2050–98, simulated by CIAS tuned to
HadCM3, between the the A1FI SRES scenario and four stabilization scenarios
15
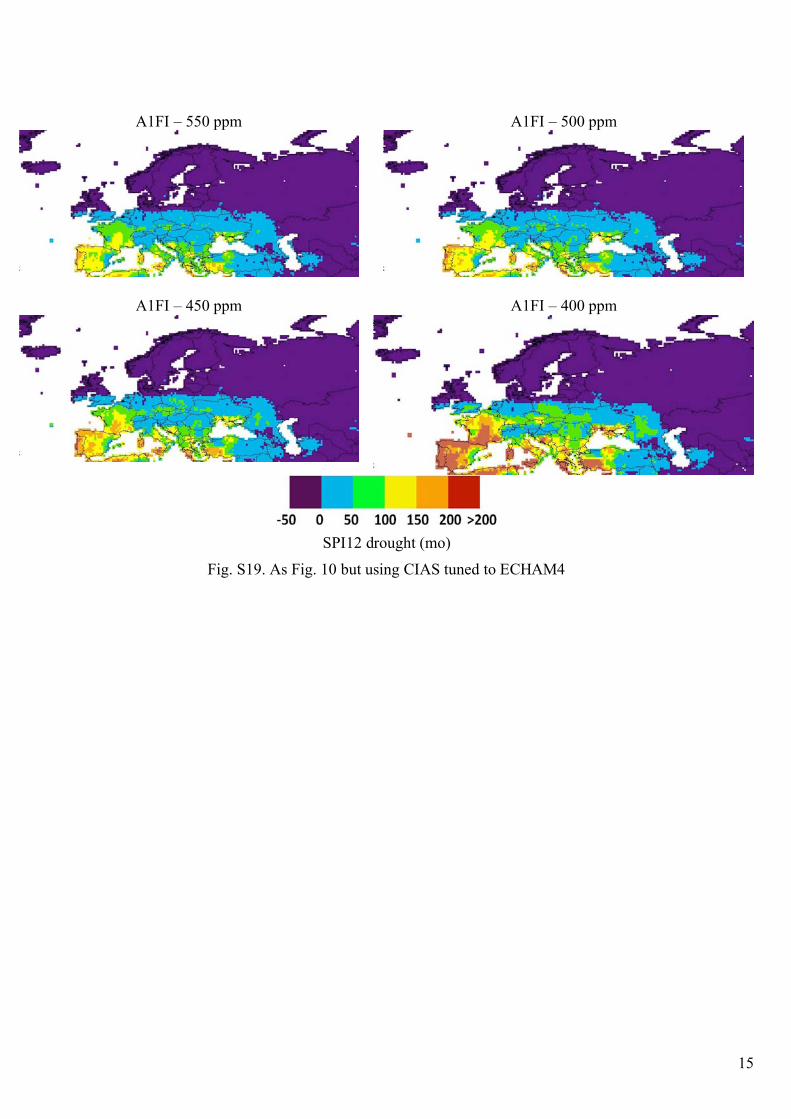
A1FI – 550 ppm
A1FI – 500 ppm
A1FI – 450 ppm
A1FI – 400 ppm
SPI12 drought (mo)
Fig. S19. As Fig. 10 but using CIAS tuned to ECHAM4
16
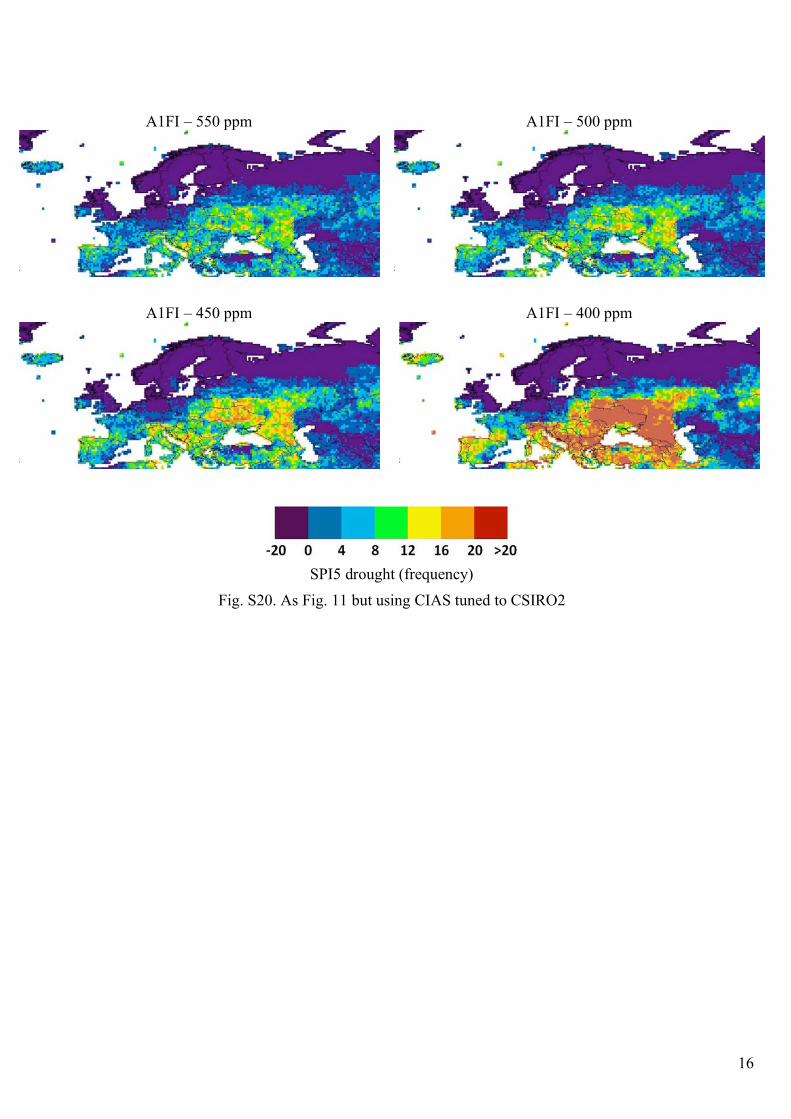
A1FI – 550 ppm
A1FI – 500 ppm
A1FI – 450 ppm
A1FI – 400 ppm
SPI5 drought (frequency)
Fig. S20. As Fig. 11 but using CIAS tuned to CSIRO2
17
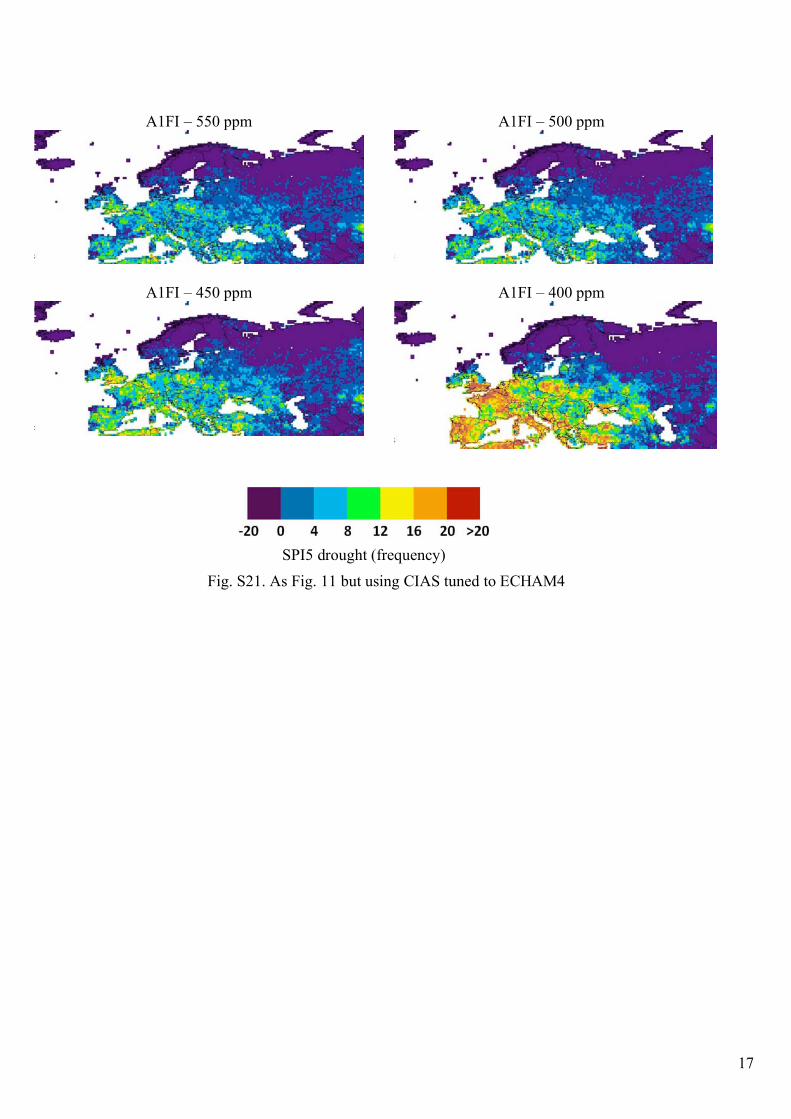
A1FI – 550 ppm
A1FI – 500 ppm
A1FI – 450 ppm
A1FI – 400 ppm
SPI5 drought (frequency)
Fig. S21. As Fig. 11 but using CIAS tuned to ECHAM4