Embed Size (px)
Citation preview
European Equities Market Microstructure SurveyAuthor: Richard Hills, Head of Client Engagement at big xyt
Q3 2021
2big xyt EU Equities Market Microstructure Survey | Q3 2021
Welcome to our latest quarterly survey of market volumes and fragmentation trends in European equities. If you are unfamiliar with the topic, you may want to first visit our website and read our Microbites series for an explanation of market microstructure.
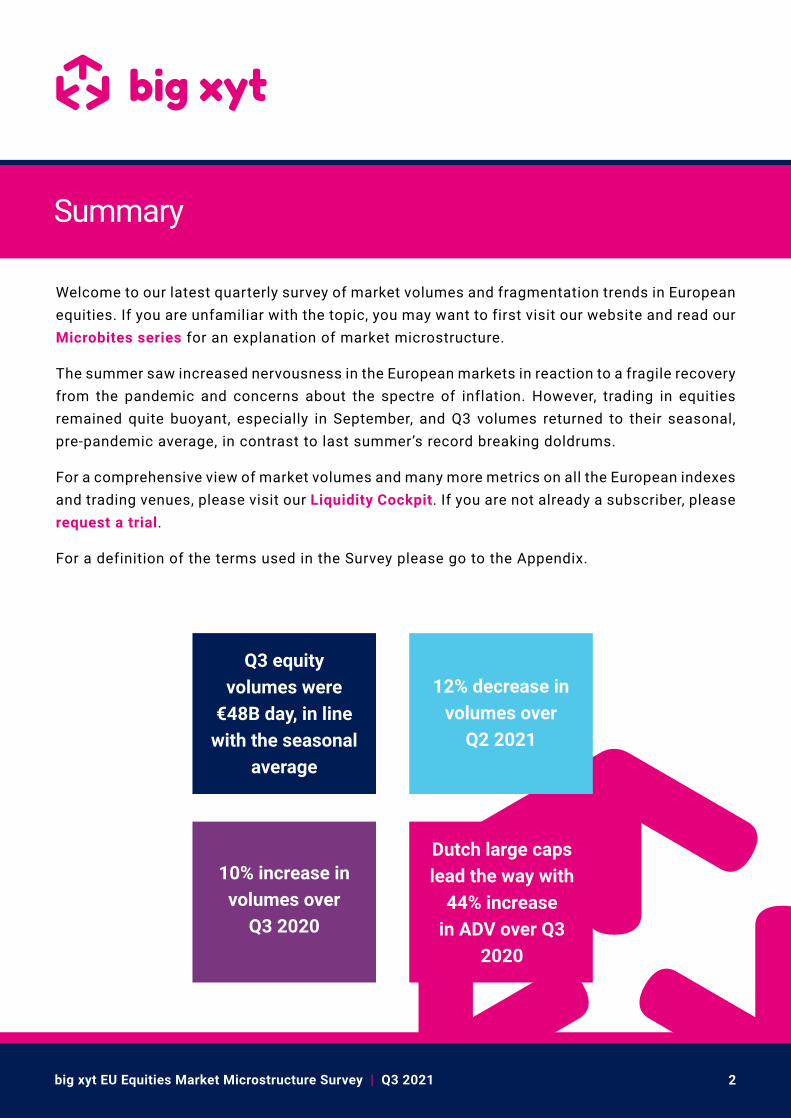
The summer saw increased nervousness in the European markets in reaction to a fragile recovery from the pandemic and concerns about the spectre of inflation. However, trading in equities remained quite buoyant, especially in September, and Q3 volumes returned to their seasonal, pre-pandemic average, in contrast to last summer’s record breaking doldrums.
For a comprehensive view of market volumes and many more metrics on all the European indexes and trading venues, please visit our Liquidity Cockpit. If you are not already a subscriber, please request a trial.
For a definition of the terms used in the Survey please go to the Appendix.
12% decrease in volumes over
Q2 2021
Q3 equity volumes were
€48B day, in line with the seasonal
average
10% increase in volumes over
Q3 2020
Dutch large caps lead the way with
44% increase in ADV over Q3
2020
Summary
3big xyt EU Equities Market Microstructure Survey | Q3 2021
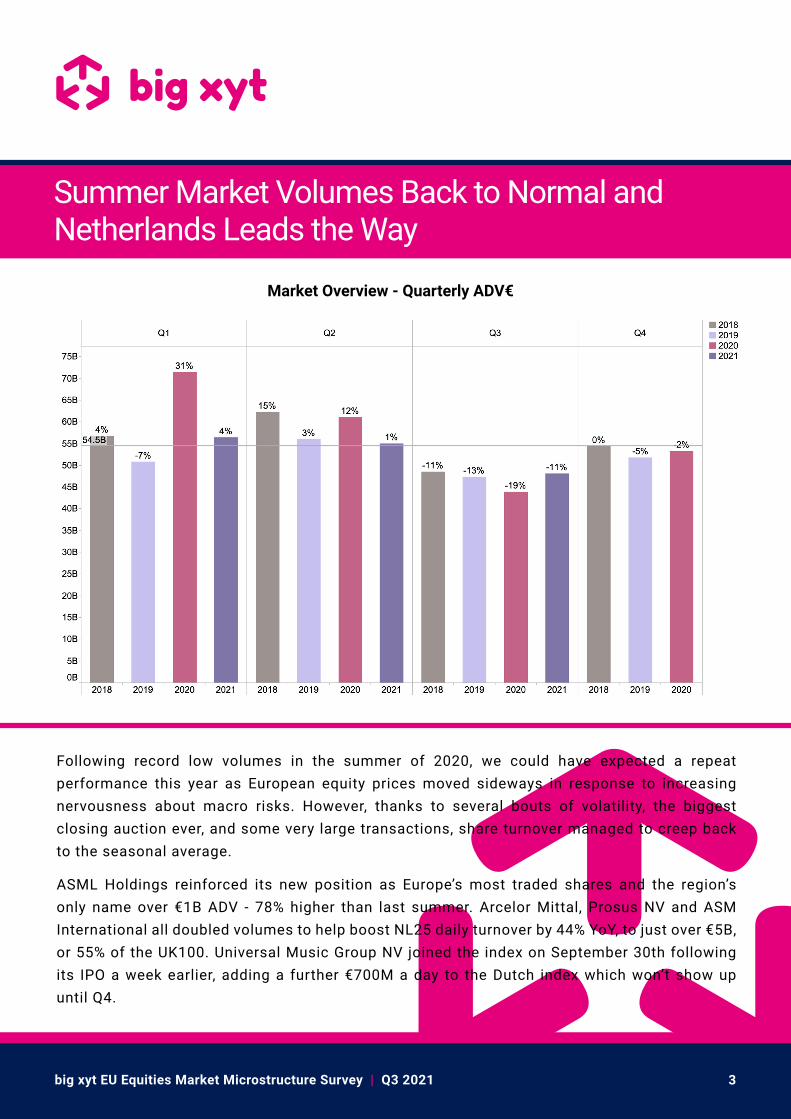
Following record low volumes in the summer of 2020, we could have expected a repeat performance this year as European equity prices moved sideways in response to increasing nervousness about macro risks. However, thanks to several bouts of volatility, the biggest closing auction ever, and some very large transactions, share turnover managed to creep back to the seasonal average. ASML Holdings reinforced its new position as Europe’s most traded shares and the region’s only name over €1B ADV - 78% higher than last summer. Arcelor Mittal, Prosus NV and ASM International all doubled volumes to help boost NL25 daily turnover by 44% YoY, to just over €5B, or 55% of the UK100. Universal Music Group NV joined the index on September 30th following its IPO a week earlier, adding a further €700M a day to the Dutch index which won’t show up until Q4.
Market Overview - Quarterly ADV€
Summer Market Volumes Back to Normal and Netherlands Leads the Way
4big xyt EU Equities Market Microstructure Survey | Q3 2021
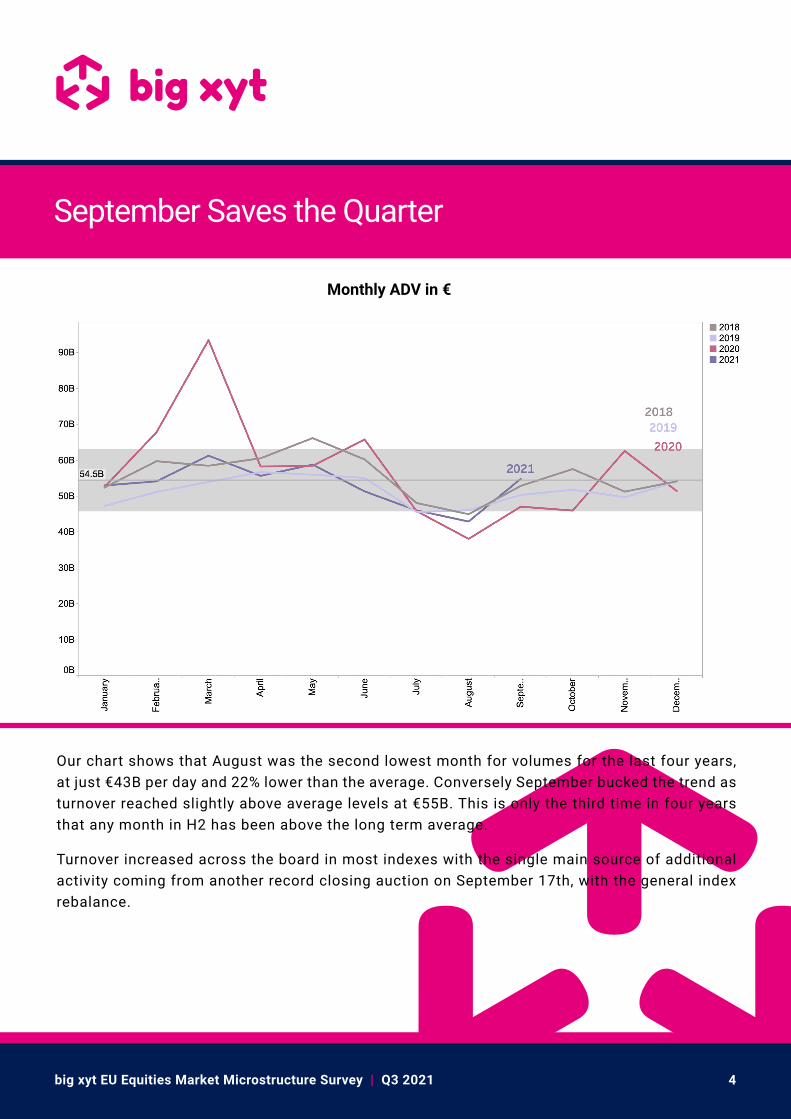
Monthly ADV in €
September Saves the Quarter
Our chart shows that August was the second lowest month for volumes for the last four years, at just €43B per day and 22% lower than the average. Conversely September bucked the trend as turnover reached slightly above average levels at €55B. This is only the third time in four years that any month in H2 has been above the long term average.
Turnover increased across the board in most indexes with the single main source of additional activity coming from another record closing auction on September 17th, with the general index rebalance.
5big xyt EU Equities Market Microstructure Survey | Q3 2021
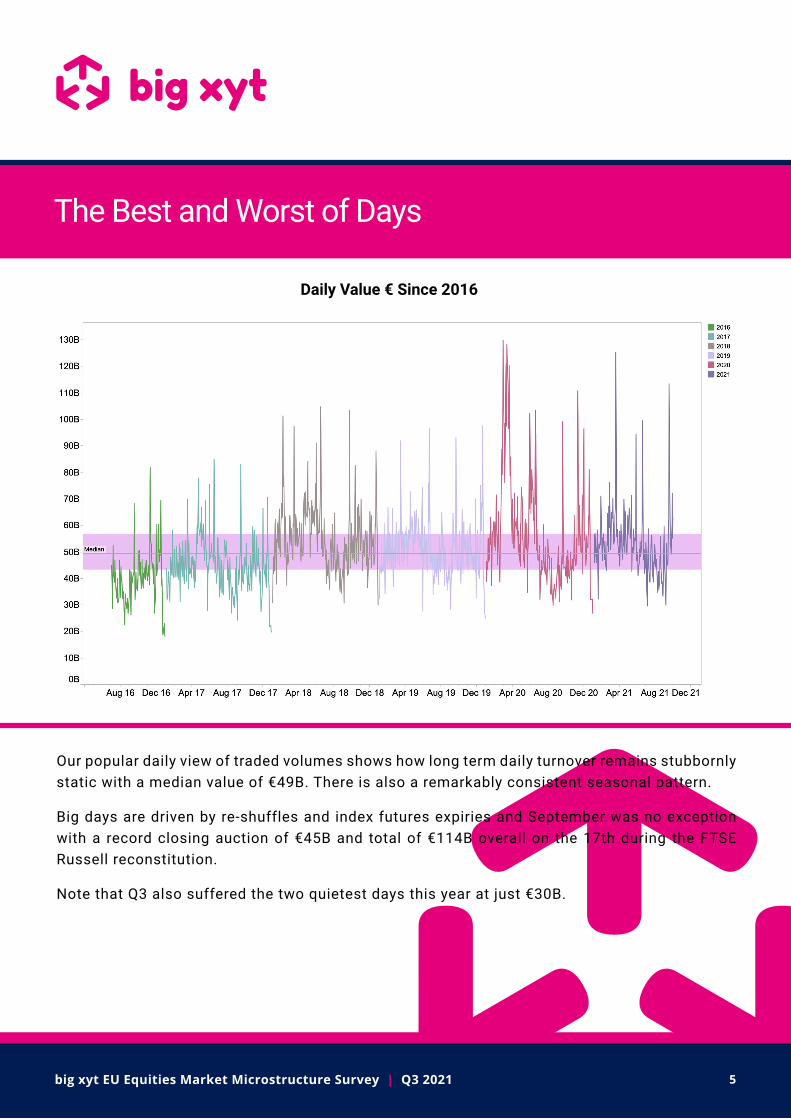
The Best and Worst of Days
Our popular daily view of traded volumes shows how long term daily turnover remains stubbornly static with a median value of €49B. There is also a remarkably consistent seasonal pattern.
Big days are driven by re-shuffles and index futures expiries and September was no exception with a record closing auction of €45B and total of €114B overall on the 17th during the FTSE Russell reconstitution.
Note that Q3 also suffered the two quietest days this year at just €30B.
Daily Value € Since 2016
6big xyt EU Equities Market Microstructure Survey | Q3 2021
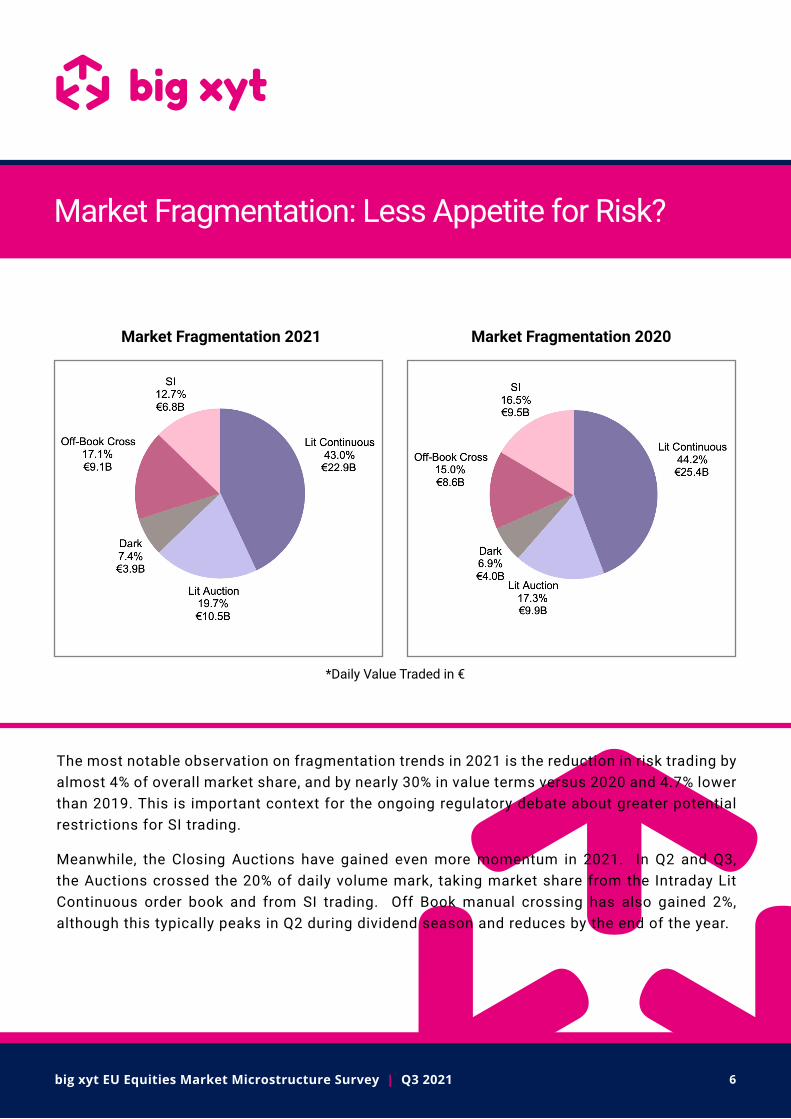
Market Fragmentation: Less Appetite for Risk?
The most notable observation on fragmentation trends in 2021 is the reduction in risk trading by almost 4% of overall market share, and by nearly 30% in value terms versus 2020 and 4.7% lower than 2019. This is important context for the ongoing regulatory debate about greater potential restrictions for SI trading.
Meanwhile, the Closing Auctions have gained even more momentum in 2021. In Q2 and Q3, the Auctions crossed the 20% of daily volume mark, taking market share from the Intraday Lit Continuous order book and from SI trading. Off Book manual crossing has also gained 2%, although this typically peaks in Q2 during dividend season and reduces by the end of the year.
Market Fragmentation 2021 Market Fragmentation 2020
*Daily Value Traded in €
7big xyt EU Equities Market Microstructure Survey | Q3 2021
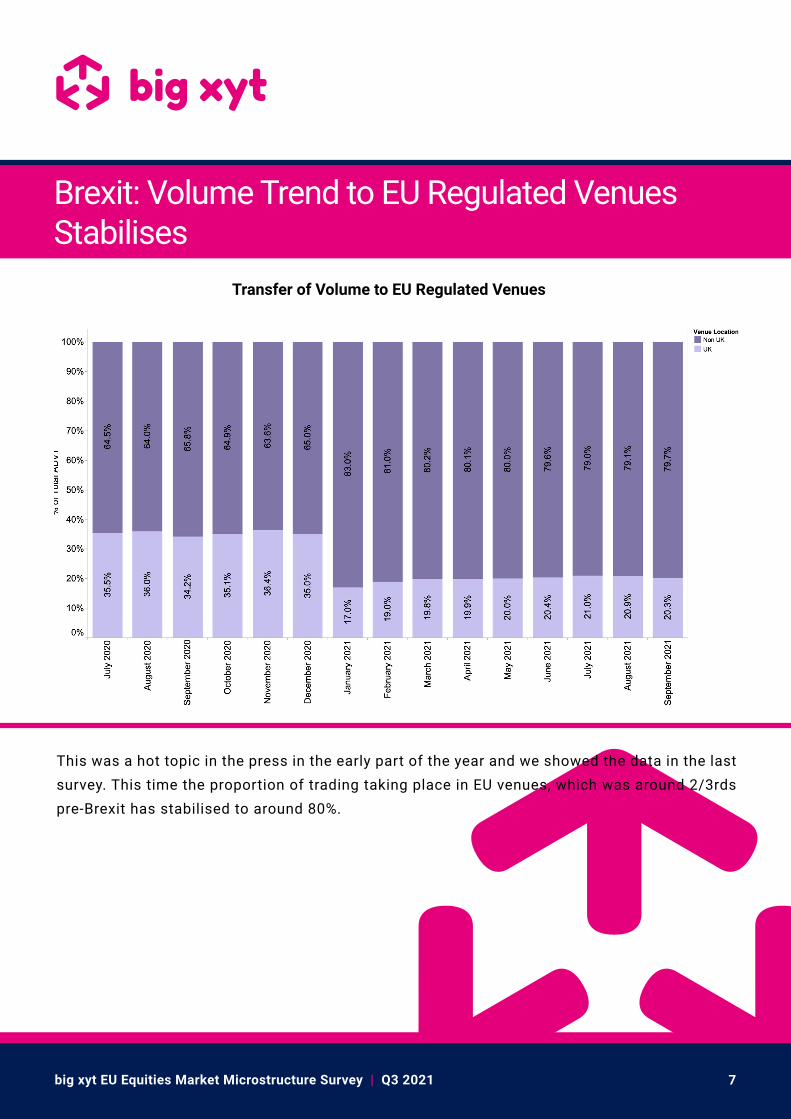
Transfer of Volume to EU Regulated Venues
Brexit: Volume Trend to EU Regulated Venues Stabilises
This was a hot topic in the press in the early part of the year and we showed the data in the last survey. This time the proportion of trading taking place in EU venues, which was around 2/3rds pre-Brexit has stabilised to around 80%.
8big xyt EU Equities Market Microstructure Survey | Q3 2021
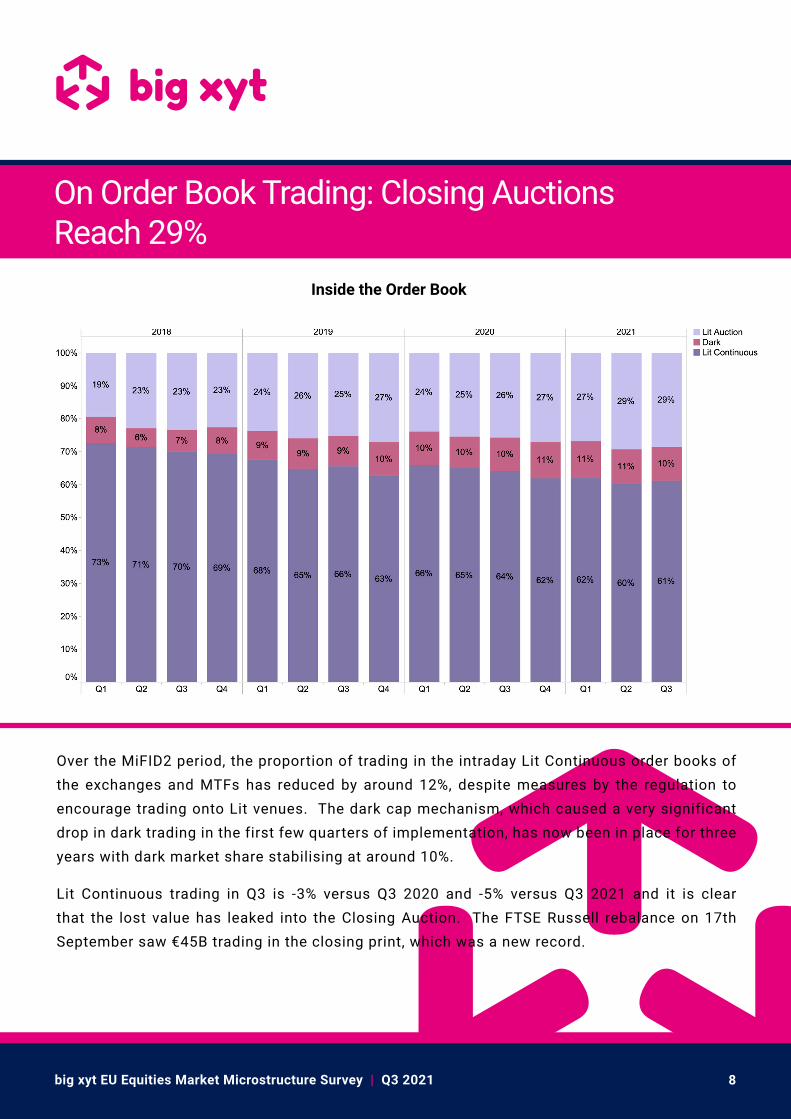
Inside the Order Book
On Order Book Trading: Closing Auctions Reach 29%
Over the MiFID2 period, the proportion of trading in the intraday Lit Continuous order books of the exchanges and MTFs has reduced by around 12%, despite measures by the regulation to encourage trading onto Lit venues. The dark cap mechanism, which caused a very significant drop in dark trading in the first few quarters of implementation, has now been in place for three years with dark market share stabilising at around 10%.
Lit Continuous trading in Q3 is -3% versus Q3 2020 and -5% versus Q3 2021 and it is clear that the lost value has leaked into the Closing Auction. The FTSE Russell rebalance on 17th September saw €45B trading in the closing print, which was a new record.
9big xyt EU Equities Market Microstructure Survey | Q3 2021
Off Order Book Trading
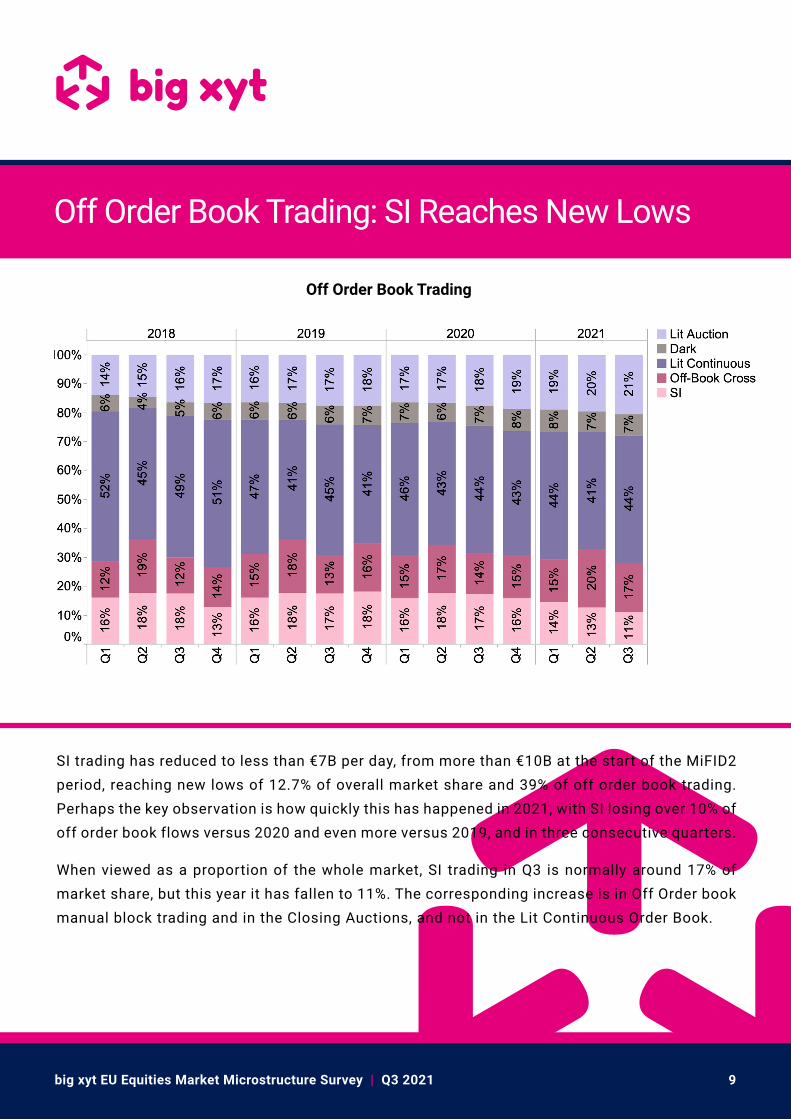
Off Order Book Trading: SI Reaches New Lows
SI trading has reduced to less than €7B per day, from more than €10B at the start of the MiFID2 period, reaching new lows of 12.7% of overall market share and 39% of off order book trading. Perhaps the key observation is how quickly this has happened in 2021, with SI losing over 10% of off order book flows versus 2020 and even more versus 2019, and in three consecutive quarters.
When viewed as a proportion of the whole market, SI trading in Q3 is normally around 17% of market share, but this year it has fallen to 11%. The corresponding increase is in Off Order book manual block trading and in the Closing Auctions, and not in the Lit Continuous Order Book.
10big xyt EU Equities Market Microstructure Survey | Q3 2021
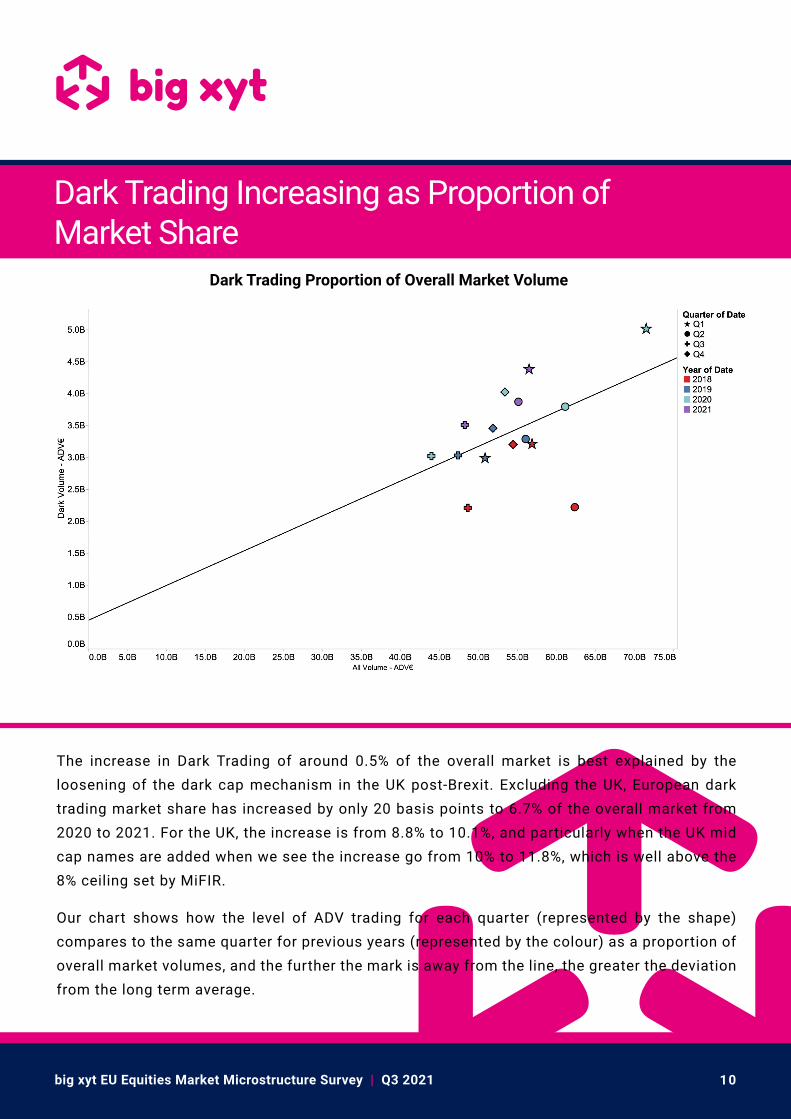
The increase in Dark Trading of around 0.5% of the overall market is best explained by the loosening of the dark cap mechanism in the UK post-Brexit. Excluding the UK, European dark trading market share has increased by only 20 basis points to 6.7% of the overall market from 2020 to 2021. For the UK, the increase is from 8.8% to 10.1%, and particularly when the UK mid cap names are added when we see the increase go from 10% to 11.8%, which is well above the 8% ceiling set by MiFIR. Our chart shows how the level of ADV trading for each quarter (represented by the shape) compares to the same quarter for previous years (represented by the colour) as a proportion of overall market volumes, and the further the mark is away from the line, the greater the deviation from the long term average.
Dark Trading Proportion of Overall Market Volume
Dark Trading Increasing as Proportion of Market Share
11big xyt EU Equities Market Microstructure Survey | Q3 2021
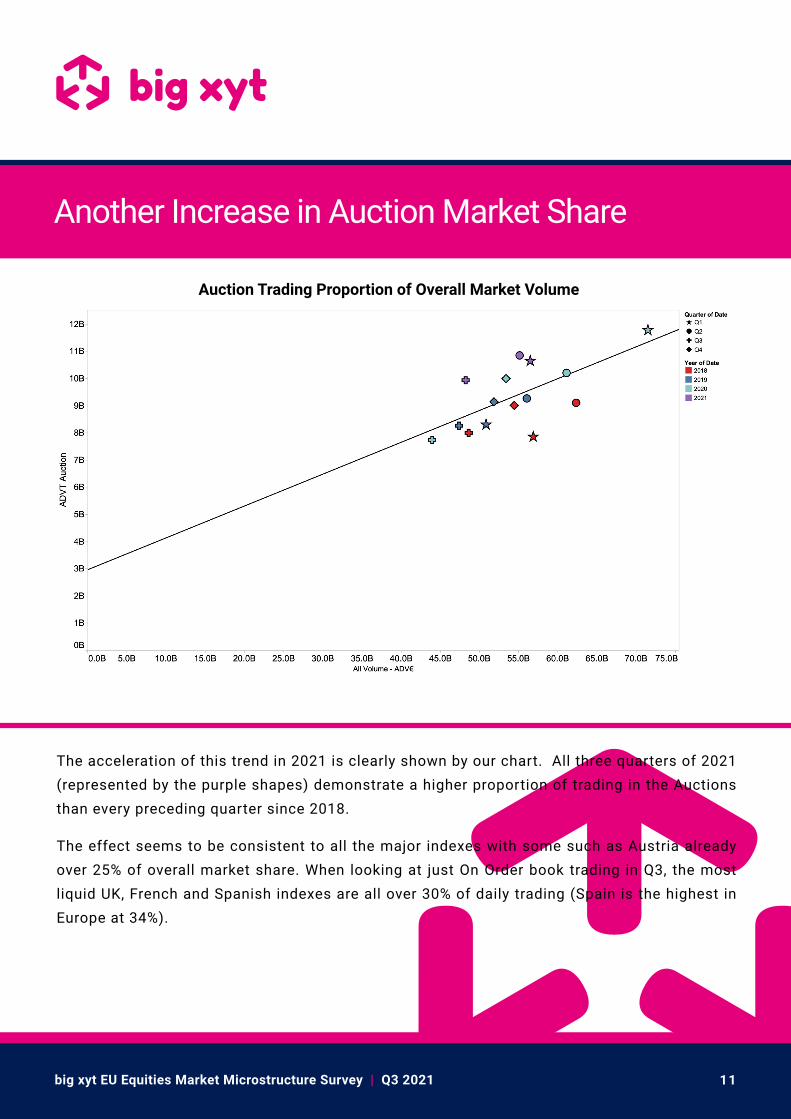
The acceleration of this trend in 2021 is clearly shown by our chart. All three quarters of 2021 (represented by the purple shapes) demonstrate a higher proportion of trading in the Auctions than every preceding quarter since 2018. The effect seems to be consistent to all the major indexes with some such as Austria already over 25% of overall market share. When looking at just On Order book trading in Q3, the most liquid UK, French and Spanish indexes are all over 30% of daily trading (Spain is the highest in Europe at 34%).
Auction Trading Proportion of Overall Market Volume
Another Increase in Auction Market Share
12big xyt EU Equities Market Microstructure Survey | Q3 2021
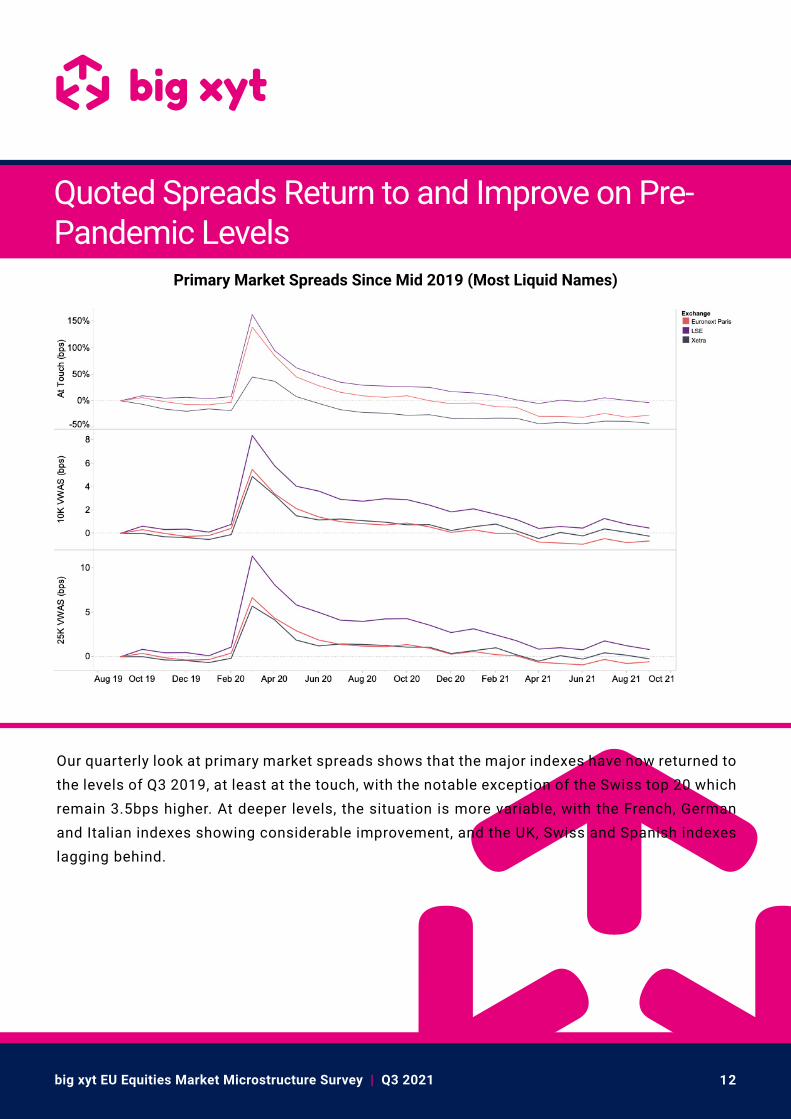
Our quarterly look at primary market spreads shows that the major indexes have now returned to the levels of Q3 2019, at least at the touch, with the notable exception of the Swiss top 20 which remain 3.5bps higher. At deeper levels, the situation is more variable, with the French, German and Italian indexes showing considerable improvement, and the UK, Swiss and Spanish indexes lagging behind.
Primary Market Spreads Since Mid 2019 (Most Liquid Names)
Quoted Spreads Return to and Improve on Pre-Pandemic Levels
13big xyt EU Equities Market Microstructure Survey | Q3 2021
Postscript: Market Quality
Quarterly and monthly trading patterns show a remarkable degree of seasonal consistency from year to year, except for during major macro events such as Covid and their aftermath, with rarely more than a few billion euros difference in monthly ADV.
But beneath this consistency lies the complex story of the impact of big deals such as Universal Music, or sectors which are in favour, such as the Semiconductors, both of which are driving the Netherlands to greater activity that in turn attracts more flows from the ETF and index investors. Volume changes reflect the collective behaviour of market participants as they evolve their trading strategies and of course the long term impact of regulatory change.
Q3 was an interesting quarter and in just a few pages it is possible only to hint at these events and trends and certainly not possible to spot them all. If you share our passion and want to follow the impact of market flows in greater detail, with easy to access tools and visualisations, then please get in touch.
For a comprehensive view of market volumes and many more metrics on all the European indexes and trading venues, please visit our Liquidity Cockpit. If you are not already a subscriber, please request a trial.
For a definition of the terms used in the Survey please go to the Appendix.
14big xyt EU Equities Market Microstructure Survey | Q3 2021
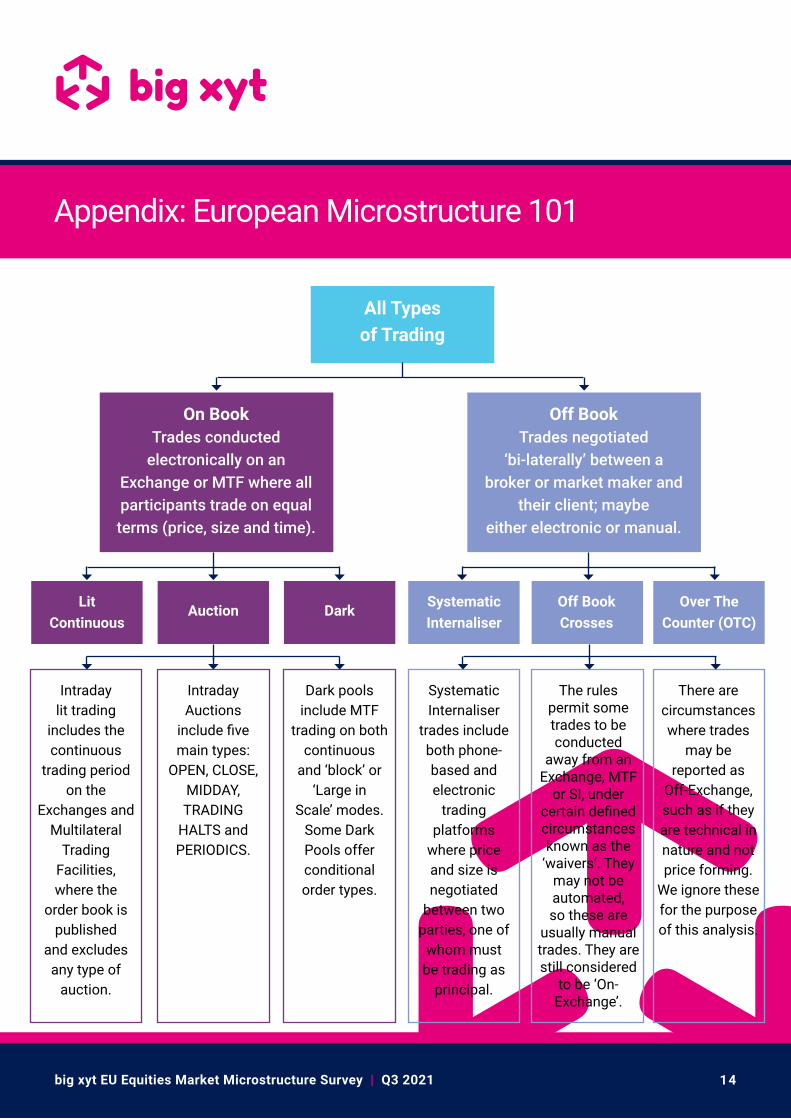
Appendix: European Microstructure 101
All Types of Trading
On BookTrades conducted
electronically on an Exchange or MTF where all participants trade on equalterms (price, size and time).
Off BookTrades negotiated
‘bi-laterally’ between a broker or market maker and
their client; maybeeither electronic or manual.
Lit Continuous
Auction Dark SystematicInternaliser
Off BookCrosses
Over TheCounter (OTC)
Intraday lit trading
includes the continuous
trading period on the
Exchanges and Multilateral
Trading Facilities, where the
order book ispublished
and excludes any type of
auction.
Intraday Auctions
include five main types:
OPEN, CLOSE, MIDDAY,TRADING
HALTS and PERIODICS.
Dark pools include MTF
trading on both continuous
and ‘block’ or‘Large in
Scale’ modes. Some Dark Pools offer conditional order types.
Systematic Internaliser
trades include both phone-based and electronic
trading platforms
where price and size is negotiated
between twoparties, one of
whom must be trading as
principal.
The rules permit some trades to be conducted
away from an Exchange, MTF
or SI, under certain defined circumstances known as the
‘waivers’. They may not be automated, so these are
usually manual trades. They are still considered
to be ‘On-Exchange’.
There are circumstances where trades
may be reported as
Off-Exchange, such as if they are technical in nature and not price forming.
We ignore these for the purpose of this analysis.
15big xyt EU Equities Market Microstructure Survey | Q3 2021
About big xyt
EuropeMark Montgomery / Strategy &
Business Development Richard Hills/ Client Management
Gilles Meyruey / Business Development (Continental Europe)+44 20 36 03 10 58
big xyt provides independent smart data and analytics solutions to the global trading and investment community, enabling firms to process and normalise large data sets on demand and in real time, in order to analyse execution performance, comply with regulatory standards, and reduce the complexity and costs of technology and operational requirements.
Our clients include major global investment banks, buy-side firms (asset managers, hedge funds, pension fund and indexers), leading exchanges, trading venues, and regulatory bodies.
Navigating fragmented markets remains a challenge for participants needing easily digestible information on trading analysis. The big xyt analytics platform responds to these market challenges, and provides clients access to transparent, accurate and normalised data.
big xyt has created a global ecosystem for tick data analytics covering more than 120 trading venues, across Equities, ETFs, FX, Futures and Options. Our unique technology normalises trade conditions of venues allowing consistent aggregations of trading volumes, comprehensive analysis, and delivery of results in a flexible and customisable format.
big xyt’s innovative analytics solutions are relevant for a broad range of use cases including strategy development, performancetrends and analysis, back testing, quantitative research, and regulatory changes. The platform delivers information through a convenient and interactive user interface, and can be easily connected to our cloud-based platform via APIs.
big xyt is wholly owned by its founders and employees, which means there is no conflict of interest when evaluating your execution needs or analysing broker performance.
Best TCA Tool at A-Team’s TradingTech Insight Awards 2021Shortlisted in The TRADE FinTech of the Year Awards 2020
Outstanding TCA Provider at The TRADE Leaders in Trading 2019 Awards
North AmericaJenny Chen
Head of Sales in the Americas+1 888 464 1254
Asia PacificPhilip Barnes
+65 3105 1520Head of Business Development Asia
Get in touch to find out more: