Embed Size (px)
Citation preview

EUROPEAN EXCHANGE REPORT
Published in August 2013
Federation of European Securities Exchanges (FESE) Economics and Statistics Committee (ESC)

FESE EUROPEAN EXCHANGE REPORT 2012 Page 2 of 29
FOREWORD BY FESE PRESIDENT The European Exchange Report represents a valuable source of integrated information on Europe’s exchange industry and is compiled by the Federation of European Securities Exchanges (FESE). FESE represents the operators of European Regulated Markets. FESE members have a distinct market structure that offers transparent price discovery and liquidity for assets admitted to trading on their markets, which is matched according to pre‐established rules. This is vetted by regulators and strictly enforced by market surveillance teams. The European Exchange Report includes key figures of each operator of Regulated Markets which are summarised on a one page statement allowing for easy and transparent comparison of their key financial figures. In particular, the report contains the following detailed information: 1. Company information – Contacts, products covered, employees, etc. 2. Trading statistics – The best source of comparable securities trading statistics across Europe in line with the FESE Statistics methodology as published on the FESE website http://fese.eu/en/?inc=art&id=51 3. Financial figures – Detailed information on earnings, revenues and costs including analysis breakdown of the service offered. As in previous years, this information was compiled on the basis of data gathered by the FESE’s Economics and Statistics Committee in cooperation with the financial departments of every member. The FESE Secretariat would like to thank all those that contributed to this study and especially the members of the FESE’s Economics and Statistics Committee. We hope that you will find this information useful.
Hans‐Ole Jochumsen President of the Federation of European Securities Exchanges
Federation of European Securities Exchanges AISBL (FESE) shall not be liable for any errors or omissions nor for the use of the information contained in this document.

FESE EUROPEAN EXCHANGE REPORT 2012 Page 3 of 29
Federation of European Securities Exchanges AISBL (FESE) shall not be liable for any errors or omissions nor for the use of the information contained in this document.
TABLE OF CONTENTS
Contents ATHENS EXCHANGE .................................................................................................................................. 4 BOLSAS Y MERCADOS ESPAÑOLES (BME) ............................................................................................ 5 BORSA ISTANBUL ....................................................................................................................................... 6 BÖRSE BERLIN AG ..................................................................................................................................... 7 BÖRSE STUTTGART ................................................................................................................................... 8 BRATISLAVA STOCK EXCHANGE ............................................................................................................. 9 BUCHAREST STOCK EXCHANGE ........................................................................................................... 10 BULGARIAN STOCK EXCHANGE – SOFIA .............................................................................................. 11 CEESEG – BUDAPEST STOCK EXCHANGE ........................................................................................... 12 CEESEG – LJUBLJANA STOCK EXCHANGE .......................................................................................... 13 CEESEG – PRAGUE STOCK EXCHANGE ............................................................................................... 14 CEESEG – VIENNA STOCK EXCHANGE ................................................................................................. 15 CYPRUS STOCK EXCHANGE .................................................................................................................. 16 DEUTSCHE BÖRSE GROUP .................................................................................................................... 17 ICE FUTURES EUROPE............................................................................................................................ 18 THE IRISH STOCK EXCHANGE ............................................................................................................... 19 LONDON METAL EXCHANGE .................................................................................................................. 20 LUXEMBOURG STOCK EXCHANGE ....................................................................................................... 21 MALTA STOCK EXCHANGE ..................................................................................................................... 22 NASDAQ OMX Group Inc. ......................................................................................................................... 23 NYSE EURONEXT ..................................................................................................................................... 24 OSLO BØRS ............................................................................................................................................... 25 SIX GROUP ................................................................................................................................................ 26 WARSAW STOCK EXCHANGE ................................................................................................................ 27 NOTES ON METHODOLOGY ................................................................................................................... 28 CONTACT ................................................................................................................................................ 29

FESE EUROPEAN EXCHANGE REPORT 2012 Page 4 of 29
ATHENS EXCHANGE
Name Athens Exchange Type of Company Joint-stock companyFor profit
Address 110 Athens Ave, Athens 104 42 Listed On Athens Exchange (Hellenic Exchanges S.A)Phone +30 210 3366 800 Sectors Cash EU regulated marketsFax +30 210 3366 607 Cash EU not regulated (exchange regulated) marketsEmail [email protected] Derivatives marketsWebsite www.athex.gr Retail bond markets
Clearing houses / CCP services providersYear established 1876 Central Securities Depositories / Settlement companiesYear of current legal status 2000 IT infrastructure and software providersCountry of Incorporation GreeceActive in Greece Number of employees 231 (end of the year)
Electronic Order Off Reporting Electronic Order Off Electronic Order Off Electronic Order OffBook Trades EOB Trades Book Trades EOB Book Trades EOB Book Trades EOB
Turnover (EUR m) 12.292 616 0 - - 11 1 29 44Trades 6.169.772 668 82 - - 1.787 11 28.409 9Market Cap. (EUR m)Listed companies
Electronic Order Off Bond Book Trades EOB Options & Futures Commodities
Turnover (EUR m) 8 0 Notional Turnover (EUR m) - -Trades 1.540 27 Contracts Traded - -Listings
Revenues 33.495Costs 23.745EBITDA 11.552EBIT 9.750Net Income 14.979
FootnotesFinancial figures are under IAS financial accounting protocolOn Revenue breakdown, other revenues include, Auxiliary Fund management revenues, OTC revenues, Xnet/DAC project subsidy revenues and Tax rebates On Cost breakdown, other cost include capital market commission fee
NotesFigures mentioned include subsidiaries.
31
Financial figures 2012
Main financial results 2012EUR '000
15.474.156
34.039 - - 327265 - 3 4
Bonds DerivativesStock/Index
Options and Futures4.525
Trading figures 2012Equity
Shares Sec. Derivatives ETFs UCITs
115
8062
483335 30 27 26 24
83
5337
2412
020406080
100120140
2008 2009 2010 2011 2012
EUR
mill
ions
Revenues, Costs and EBITDA2008 - 2012
Revenues Costs EBITDA
53%
6%
29%
8%4%
Cost Breakdown 2012
Personnel
ICT
Other operating
Depreciation and amortisation
Other costs
23%
11%
4%
30%
2%1%
12%
3%
14%
Revenue Breakdown 2012
Listing (admission + ongoing)Cash Trading
Derivatives Trading
Clearing / CCP
Settlement
Custody & Banking
Info products & services
ICT services
Other (advert., educat., properties)
Federation of European Securities Exchanges AISBL (FESE) shall not be liable for any errors or omissions nor for the use of the information contained in this document.

FESE EUROPEAN EXCHANGE REPORT 2012 Page 5 of 29
BOLSAS Y MERCADOS ESPAÑOLES (BME)
Name Bolsas y Mercados Españoles (BME) Type of Company Joint-stock companyFor profit
Address Plaza de la Lealtad 1, 28014 Madrid Listed On BME Spanish ExchangesPhone +34 91 709 50 00 Sectors Cash EU regulated marketFax +34 91 709 57 09 Cash EU not regulated (exchange regulated) marketsEmail [email protected] Derivatives marketsWebsite www.bolsasymercados.es Retail bond markets / Wholesale bond markets
Clearing houses / CCP services providersYear established 1831 Central Securities Depositories / SettlementYear of current legal status 2006 IT infrastructure and software providersCountry of Incorporation Spain Market data distribution / Consulting ServicesActive in Spain Number of employees 710 (average)
Electronic Order Off Reporting Electronic Order Off Electronic Orde Off Electronic Order OffBook Trades EOB Trades Book Trades EOB Book Trades EOB Book Trades EOB
Turnover (EUR m) 660.050 161.287 - 763 n/a 2.736 n/a n/a n/aTrades 40.474.068 176.037 - n/a n/a n/a n/a n/a n/aMarket Cap. (EUR m)Listed companies
Electronic Order Off Bond Book Trades EOB Options & FuturesCommodities
Turnover (EUR m) 41.536 7.328.619 Notional Turnover (EUR m) - -Trades 37.177 1.735.121 Contracts Traded - -Listings
Revenues 296.171 Costs 98.908EBITDA 197.263EBIT 189.403Net Income 135.548
FootnotesFinancial figures are under International Accounting StandardsOn Revenue breakdown, other revenues include corporate unit revenues, capitalization of development costs & consolidation adjustments between segments
NotesFigures mentioned include subsidiaries.
3.200 6.599-
Trading figures 2012Equity
Sec. Derivatives UCITsETFsShares
754.775 -73
Stock/Index
67.104.125
Options and Futures
24.6073.015
444.035
EUR '000Main financial results 2012
5.449
Derivatives
Financial figures 2012
Bonds
353317 326 321 296
103 107 103 98 99
250 210 223 223
197
050
100150200250300350400
2008 2009 2010 2011 2012
EUR
mill
ions
Revenues, Costs and EBITDA2008 - 2012
Revenues Costs EBITDA
58%
35%
7%
Cost Breakdown 2012
Personnel
Other operating
Depreciation and amortisation
7%
37%
3%9%
27%
11%
5% 1%
Revenue Breakdown 2012Listing (admission + ongoing)
Cash Trading-Equity
Cash Trading-Fixed Income
Derivatives Trading & Clearing
Settlement
Info products & services
ICT services
Other (advert., educat., properties)
Federation of European Securities Exchanges AISBL (FESE) shall not be liable for any errors or omissions nor for the use of the information contained in this document.

FESE EUROPEAN EXCHANGE REPORT 2012 Page 6 of 29
BORSA ISTANBUL*
Name Borsa Istanbul Type of Company Joint Stock CompanyFor profit
Address Reşitpaşa Mah. Tuncay Artun Cd. Emirgan 34467 – İSTANBUL Listed Not listedPhone +90 (212) 298 21 00 Sectors Cash EU not regulated (exchange regulated) marketsFax +90 (212) 298 25 00 Wholesale bond marketsEmail [email protected]; [email protected] Retail bond marketsWebsite www.borsaistanbul.com Clearing houses / CCP services providers
Central Securities Depositories Year established 1873 Companies managing settlementYear of current legal status 2013 Derivatives marketsCountry of Incorporation Turkey Commodity marketsActive in Turkey Number of employees 495 (end of the year)
Electronic Order Off Reporting Electronic Order Off Electronic Order Off Electronic Order OffBook Trades EOB Trades Book Trades EOB Book Trades EOB Book Trades EOB
Turnover (EUR m) 260.363 3.896 2 2.212 - 3.602 - 1.091 8Trades 77.124.576 24 249.317 1.201.076 - 250.839 - 1.833.537 2Market Cap. (EUR m)Listed companies
Electronic Order Off Bond Book Trades EOB Options & Futures Commodities
Turnover (EUR m) 155.792 233.976 Notional Turnover (EUR m) - -Trades 275.729 - Contracts Traded - -Listings
Revenues 112.922Costs 78.175EBITDA 21.512EBIT 19.735Net Income 34.747
FootnotesFinancial figures are under GAAP financial accounting protocol
NotesFigures mentioned do not include subsidiaries.
268
Financial figures 2012
Main financial results 2012EUR '000
-
240.029 - - 225271 327 16 18
Bonds DerivativesStock/Index
Options and Futures-
Trading figures 2012Equity
Shares Sec. Derivatives ETFs UCITs
97119
103 100113
87
6280 79 78
-7
45
14 14 22
-200
20406080
100120140
2008 2009 2010 2011 2012
EUR
Mill
ions
Revenues, Costs and EBITDA2008 - 2012
Revenues Costs EBITDA
63%
18%
2%
17%
Cost Breakdown 2012
Personnel
Other operating
Depreciation and amortisation
Other costs
11%
43%
0%6%4%
36%
Revenue Breakdown 2012
Listing (admission + ongoing)
Cash Trading
Derivatives Trading
Info products & services
ICT services
Other (advert., educat., properties)
* İstanbul Menkul Kıymetler Borsası (İMKB) has merged with İstanbul Gold Exchange and Turkish Derivatives Exchange and been transformed into a new legal entity: Borsa İstanbul in 2013.
Federation of European Securities Exchanges AISBL (FESE) shall not be liable for any errors or omissions nor for the use of the information contained in this document.

FESE EUROPEAN EXCHANGE REPORT 2012 Page 7 of 29
BÖRSE BERLIN AG
Name Börse Berlin AG Type of Company Joint-stock companyFor profit
Address Fasanenstraße 85; 10623 Berlin Listed NoPhone +49 (0)30 31 10 91 00 Sectors Cash EU regulated marketsFax +49 (0)30 31 10 91 78 Wholesale bond marketsEmail [email protected] Fund tradingWebsite www.boerse-berlin.de
Year established 1685 Year of current legal status 2000Country of Incorporation Germany Number of employees 13 (end of year)Active in Germany
Electronic Order Off Reporting Electronic Order Off Electronic Order Off Electronic Order OffBook Trades EOB Trades Book Trades EOB Book Trades EOB Book Trades EOB
Turnover (EUR m) - - - - - - - - -Trades - - - - - - - - -Market Cap. (EUR m)Listed companies
Electronic Order Off Bond Book Trades EOB Options & Futures Commodities
Turnover (EUR m) - - Notional Turnover (EUR m) - -Trades - - Contracts Traded - -Listings
Revenues 3.161Costs 3.493EBITDA 1.067EBIT 1.041Net Income 580
FootnoteFinancial figures are under Handelsgesetzbuch (HGB) financial accounting protocol
NotesFigures mentioned include subsidiaries.
Trading figures 2012
- -
DerivativesStock/Index
---
EquityShares Sec. Derivatives UCITsETFs
Bonds
-
EUR '000Main financial results 2012
-
-
Options and Futures
Financial figures 2012
-
-
-
3,0 3,33,6 3,6 3,2
9,4
5,6 4,5 4,8 3,5
12,1
-1,3
0,7 0,8 1,1
-10
-5
0
5
10
15
2008 2009 2010 2011 2012EUR
mill
ion
Revenues, Costs and EBITDA2008 - 2012
Revenues Costs EBITDA
56%
4%2%
38%
Cost Breakdown 2012
Personnel
ICT
Depreciation and amortisation
Other costs
25%
50%
7%
18%
Revenue Breakdown 2012 (Xontro)
Listing (admission + ongoing)
Cash Trading
Info products & services
Other (advert., educat., properties)
Federation of European Securities Exchanges AISBL (FESE) shall not be liable for any errors or omissions nor for the use of the information contained in this document.

FESE EUROPEAN EXCHANGE REPORT 2012 Page 8 of 29
BÖRSE STUTTGART
Name Boerse Stuttgart Holding GmbH Type of Company Corporation (Association)For profit
Address Börsenstraße 4, 70174 Stuttgart ListedPhone +49 (0)711 222 985 0 Sectors Cash EU regulated markets Fax +49 (0)711 222 985 555 Cash EU not regulated (exchange regulated) marketsEmail [email protected] Securitized derivatives marketsWebsite www.boerse-stuttgart.de Retail bond markets
Year established 1861Year of current legal status 2007Country of Incorporation Germany Number of employees 291 (end of year)Active in Germany, Sweden
Electronic Order Off Reporting Electronic Order Off Electronic Orde Off Electronic Order OffBook Trades EOB Trades Book Trades EOB Book Trades EOB Book Trades EOB
Turnover (EUR m) 11.322 - - 46.060 - 6.054 - 578 -Trades 727.864 - - 3.732.784 - 107.362 - 52.954 -Market Cap. (EUR m)Listed companies
Electronic Order Off Bond Book Trades EOB Options & FuturCommodities
Turnover (EUR m) 28.954 - Notional Turnover (EUR m) - -Trades 539.896 - Contracts Traded - -Listings
Revenues 116.767Costs 111.318EBITDA 5.981EBIT 2.423Net Income 85
FootnoteFinancial figures refer to the consolidated annual statement of the Boerse Stuttgart HoldingFinancial figures are under German HGB financial acconting standards
NotesFigures mentioned include subsidiaries.
Bonds
Equity
-Options and Futures
Shares
--
Stock/Index
-921.129
n/a
-
2.012-
1.410
EUR '000Main financial results 2012
n/a
Trading figures 2012
Financial figures 2012
Sec. Derivatives UCITsETFs
Derivatives
188
131 129145
117
151
116 120131
111
3819 13 13 6
020406080
100120140160180200
2008 2009 2010 2011 2012
EUR
mill
ions
Revenues, Costs and EBITDA2008 - 2012
Revenues Costs EBITDA
26%
13%
32%
3%
26%
Cost Breakdown 2012
Personnel
ICT - exchange
Other operating
Depreciation and amortisation
Other costs (incl. interests and other fin. expenses)
2%
82%
1%3%
5%3% 4%
Revenue Breakdown 2012
Listing (admission + ongoing)
Cash Trading
Clearing / CCP
Custody & Banking (financial revs.)Info products & services
ICT services
Other (advert., educat., properties)
Federation of European Securities Exchanges AISBL (FESE) shall not be liable for any errors or omissions nor for the use of the information contained in this document.

FESE EUROPEAN EXCHANGE REPORT 2012 Page 9 of 29
BRATISLAVA STOCK EXCHANGE
Name Bratislava Stock Exchange Type of Company Joint-stock companyFor profit
Address P.O.Box 151 Vysoká 17 814 99 Bratislava 1 Listed NoPhone +421 2 49 236 111 Sectors Cash EU regulated marketsFax +421 2 49 236 128 Wholesale bond marketsEmail [email protected] Clearing houses Website www.bsse.sk Central Securities Depositories / Companies
managing settlementYear established 1991Year of current legal status 1991Country of Incorporation Slovakia Number of employees 25 (end of year)Active in Slovakia
Electronic Order Off Reporting Electronic Order Off Electronic Orde Off Electronic Order OffBook Trades EOB Trades Book Trades EOB Book Trades EOB Book Trades EOB
Turnover (EUR m) 58 68 0 - - - - - -Trades 12.781 509 0 - - - - - -Market Cap. (EUR m)Listed companies
Electronic Order Off Bond Book Trades EOB Options & FutureCommodities
Turnover (EUR m) 98 8.235 Notional Turnover (EUR m) - -Trades 1.161 2.330 Contracts Traded - -Listings
Revenues 1.788Costs 1.555EBITDA 401EBIT 302Net Income 233
FootnoteFinancial figures are under the following financial accounting protocols:2008-2012: IFRS
Financial figures refer to the exchange and not to the parent company owning the exchangeNotesFigures mentioned not include subsidiaries.
Trading figures 2012
Financial figures 2012
Sec. Derivatives UCITsETFs
--
-
Equity
--
Options and FuturesStock/Index
Derivatives
---
EUR '000Main financial results 2012
154
Shares
4.094134
Bonds
1,6 1,6 1,4 1,6 1,81,5 1,6 1,5
4,2
1,60,3 0,2 0,0
-2,5
0,4
-3,0-2,0-1,00,01,02,03,04,05,0
2008 2009 2010 2011 2012
EUR
mill
ions
Revenues, Costs and EBITDA2008 - 2012
Revenues Costs EBITDA
55%
1%
37%
7% 0%
Cost Breakdown 2012
Personnel
ICT
Other operating
Depreciation and amortisation
Other costs
20%
51%
1%
28%
Revenue Breakdown 2012
Listing (admission + ongoing)
Cash Trading
Custody & Banking
Other (advert., educat., properties, members' fees)
Federation of European Securities Exchanges AISBL (FESE) shall not be liable for any errors or omissions nor for the use of the information contained in this document.
FESE EUROPEAN EXCHANGE REPORT 2012 Page 10 of 29
BUCHAREST STOCK EXCHANGE
Name Bucharest Stock Exchange Type of Company Joint-stock companyFor profit
Address Bd.Carol I, 34-36, etaj 14,020922, Bucuresti Listed On Bucharest Stock ExchangePhone (+40) (21) 307 95 00 Sectors Cash EU regulated marketsFax (+40) (21) 307 95 19 Cash EU not regulated (exchange regulated) marketsEmail [email protected] Derivatives marketsWebsite www.bvb.ro Clearing houses / CCP services providers
Central Securities Depositories / Companies managingYear established 1995 settlementYear of current legal status 2005 Corporate Governance Institute FoundationCountry of Incorporation Romania Number of employees 57 (end of year)Active in Romania
Electronic Order Off Reporting Electronic Order Off Electronic Orde Off Electronic Order OffBook Trades EOB Trades Book Trades EOB Book Trades EOB Book Trades EOB
Turnover (EUR m) 1.010 571 - 154 - 0 - 1 -Trades 637.391 590 - 217.512 - 456 - 2.191 -Market Cap. (EUR m)Listed companies
Electronic Order Off Bond Book Trades EOB Options & FuturesCommodities
Turnover (EUR m) 85 182 Notional Turnover (EUR m) - -Trades 295 73 Contracts Traded - -Listings
Revenues 5.705Costs 3.431EBITDA 1.046EBIT 916Net Income 2.021
FootnoteFinancial figures are under IV-th EEC Directive for financial accounting
NotesFigures mentioned include subsidiaries.
EUR '000Main financial results 2012
68
DerivativesBonds
20.423
Stock/Index
Trading figures 2012
Financial figures 2012
Sec. Derivatives UCITsETFs
9
67
Options and Futures
Shares
12.08879
Equity
-4
01
9
8
65
9
64
3 34
32
-0
0 2 1
-2
0
2
4
6
8
10
2008 2009 2010 2011 2012
EUR
mill
ions
Revenues and Costs2008 - 2012
Revenues Costs EBITDA
44%
2%
38%
4%
12%
Cost Breakdown 2012
Personnel
ICT (Materials & Services)
Other operating
Depreciation and amortisation
Other costs (financial)
5%
56%
5%
2%
32%
Revenue Breakdown 2012
Listing (admission + ongoing)
Cash Trading
Info products & services
ICT services
Other (financial & members' fees)
Federation of European Securities Exchanges AISBL (FESE) shall not be liable for any errors or omissions nor for the use of the information contained in this document.

FESE EUROPEAN EXCHANGE REPORT 2012 Page 11 of 29
BULGARIAN STOCK EXCHANGE – SOFIA
Name Bulgarian Stock Exchange - Sofia Type of Company Joint-stock companyFor profit
Address 6 Tri ushi St., 1301 Sofia Listed Regulated market managed by itselfPhone +359(0)2 937 09 34 Sectors Cash EU regulated marketsFax +359(0)2 937 09 46Email [email protected] http://www.bse-sofia.bg/
Year established 1991Year of current legal status 1991Country of Incorporation Bulgaria Number of employees 32 (end of year)Active in Bulgaria
Electronic Order Off Reporting Electronic Order Off Electronic Orde Off Electronic Order OffBook Trades EOB Trades Book Trades EOB Book Trades EOB Book Trades EOB
Turnover (EUR m) 275 0 291 - - - - 1 0Trades 59.257 0 1.807 - - - - 61 3Market Cap. (EUR m)Listed companies
Electronic Order Off Bond Book Trades EOB Options & FuturesCommodities
Turnover (EUR m) 49 23 Notional Turnover (EUR m) - -Trades 511 27 Contracts Traded - -Listings
Revenues 1.577Costs 1.400EBITDA 470EBIT 346Net Income 312
FootnotesFinancial figures are under IFRS financial accounting protocolOn Revenue breakdown, other revenues include membership fees and financial sanctions imposed on Exchange members
NotesFigures mentioned include subsidiaries.
Shares
5.025387
Equity
46n/a
EUR '000Main financial results 2012
55
-
DerivativesBonds
2
Options and FuturesStock/Index
Trading figures 2012
Financial figures 2012
Sec. Derivatives UCITsETFs
--
- -
2,4
1,3
1,11,4
1,6
2,3
1,5 1,4 1,4 1,4
0,5
0,2 0,00,3 0,5
0
1
1
2
2
3
2008 2009 2010 2011 2012
EUR
Mill
ion
Revenues, Costs and EBITDA2008- 2012
Revenues Costs EBITDA
41%
1%
43%
9%
6%
Cost Breakdown 2012
Personnel
ICT
Other operating
Depreciation and amortisationOther costs
21%
53%
13%
2%
11%
Revenue Breakdown 2012
Listing (admission + ongoing)Cash Trading
Info products & services
ICT services
Other (advert., educat., properties)
Federation of European Securities Exchanges AISBL (FESE) shall not be liable for any errors or omissions nor for the use of the information contained in this document.

FESE EUROPEAN EXCHANGE REPORT 2012 Page 12 of 29
CEESEG – BUDAPEST STOCK EXCHANGE
Name Budapest Stock Exchange Type of Company Joint-stock companyFor profit
Address H - 1063 Budapest, Andrássy, út 93. Listed Traded OTC regularlyPhone +36 1 429 6857 Sectors Cash EU regulated marketFax +36 1429 6800 Derivatives marketsEmail [email protected] Wholesale bond marketsWebsite www.bet.hu IT infrastructure and software providers
Year established 1990Year of current legal status 2002Country of Incorporation Hungary Number of employees 56Active in Hungary
Electronic Order Off Reporting Electronic Order Off Electronic Orde Off Electronic Order OffBook Trades EOB Trades Book Trades EOB Book Trades EOB Book Trades EOB
Turnover (EUR m) 8.400 9 30 251 - 1 0 18 0Trades 1.629.610 256 57 205.420 - 231 0 9.172 968Market Cap. (EUR m)Listed companies
Electronic Order Off Bond Book Trades EOB Options & Future Commodities
Turnover (EUR m) 13 7 Notional Turnover (EUR m) - 112Trades 880 129 Contracts Traded - 4.496Listings
Revenues 8.380Costs 6.088EBITDA 3.165EBIT 2.988Net Income 1.992
FootnoteFinancial figures are under GAAP financial accounting protocolFinancial figures refer to the exchange and not to the parent company owning the exchangeNotesFigures mentioned include subsidiaries.
-63
-
Derivatives
Shares
86815.74252 1
Trading figures 2012Sec. Derivatives UCITsETFs
Equity
EUR '000Main financial results 2012
186
Financial figures 2012
85
Options and Futures
1.409.7362.185
Stock/Index Bonds
1311
1211
87 7 7 7 66 6 7
5
3
02468
101214
2008 2009 2010 2011 2012
EUR
mill
ions
Revenues, Costs and EBITDA2008 - 2012
Revenues Costs EBITDA
44%
26%
7%
3%
20%
Cost Breakdown 2012
Personnel
Material
ICT
Depreciation and amortisation
Other costs
16%
36%
4%5%
34%
5%
Revenue Breakdown 2012
Listing (admission + ongoing)
Cash Trading
Derivatives Trading
Index Licence
Info products & services
ICT services
0.2%
Federation of European Securities Exchanges AISBL (FESE) shall not be liable for any errors or omissions nor for the use of the information contained in this document.

FESE EUROPEAN EXCHANGE REPORT 2012 Page 13 of 29
CEESEG – LJUBLJANA STOCK EXCHANGE
Name Ljubljana Stock Exchange Type of Company Joint-stock companyFor profit
Address Slovenska 56 1000 Ljubljana Listed Traded OTCPhone + 386 1 471 0211 Sectors Cash EU regulated marketFax + 386 1 471 0213 Retail bond marketsEmail [email protected] IT infrastructure and software providersWebsite www.ljse.si
Year established 1989Year of current legal status 1989Country of Incorporation Slovenia Number of employees 16 (end of year)Active in Slovenia
Electronic Order Off Reporting Electronic Order Off Electronic Order Off Electronic Order ReportingBook Trades EOB Trades Book Trades EOB Book Trades EOB Book Trades Trades
Turnover (EUR m) 304 - 37 - - - - 2 0Trades 53.142 - 56 - - - - 1.734 0Market Cap. (EUR m)Listed companies
Electronic Order Off Bond Book Trades EOB Options & Futures Commodities
Turnover (EUR m) 55 - Notional Turnover (EUR m) - -Trades 1.929 - Contracts Traded - -Listings
Revenues 1.773Costs 1.852EBITDA 195EBIT -79Net Income -66
FootnotesFinancial figures are under Slovenian Accounting Standards (SAS) protocol
NotesFigures mentioned include subsidiaries.
Trading figures 2012
Financial figures 2012
Sec. Derivatives UCITsETFsEquity
-171
Options and Futures-
EUR '000Main financial results 2012
60
Bonds
-
Shares
4.91161
Stock/Index Derivatives
--
-
3,1
2,2 2,1 2,11,8
2,72,5
2,02,3
1,9
0,5
-0,1
0,30,1 0,2
-101122334
2008 2009 2010 2011 2012
EUR
mill
ions
Revenues, Costs and EBITDA2008 - 2012
Revenues Costs EBITDA
39%
44%
2%
15%
Cost Breakdown 2012
Personnel
ICT
Other operating
Depreciation and amortisation
24%
26%
26%
21%
3%
Revenue Breakdown 2012
Listing (admission + ongoing)
Cash Trading
Info products & services
ICT services
Other (advert., educat., properties)
Federation of European Securities Exchanges AISBL (FESE) shall not be liable for any errors or omissions nor for the use of the information contained in this document.

FESE EUROPEAN EXCHANGE REPORT 2012 Page 14 of 29
CEESEG – PRAGUE STOCK EXCHANGE
Name Prague Stock Exchange Type of Company Joint-stock companyFor profit
Address Rybna 14 110 05 Prague 1 Listed NoPhone +420 221 831 111 Sectors Cash EU regulated marketsFax - Cash EU not regulated (exchange regulated) marketsEmail [email protected] Clearing houses / CCP services providersWebsite www.pse.cz Central Securities Depositories
Companies managing settlementYear established 1993Year of current legal status 1993Country of Incorporation Czech Republic Number of employees 84 (end of year)Active in Czech Republic
Electronic Order Off Reporting Electronic Order Off Electronic Orde Off Electronic Order OffBook Trades EOB Trades Book Trades EOB Book Trades EOB Book Trades EOB
Turnover (EUR m) 9.980 4 - 2 - - - - -
Trades 972.330 38 - 585 - - - - -
Market Cap. (EUR m)Listed companies
Electronic Order Off Bond Book Trades EOB Options & Futures Commodities
Turnover (EUR m) 34 23.580 Notional Turnover (EUR m) - -
Trades 1.057 6.208 Contracts Traded - -
Listings
Revenues 20.890Costs 15.339EBITDA 10.052EBIT 6.877Net Income 5.551
NotesFigures mentioned include subsidiaries.
EUR '000Main financial results 2012
98
Financial figures 2012
2643
Bonds
-30
Options and FuturesStock/Index
Shares
28.19328
ETFs
Derivatives
Trading figures 2012
-
-
-
-
EquitySec. Derivatives UCITs
18
14
1722 21
139
1315 15
96 7
11 10
0
5
10
15
20
25
2008 2009 2010 2011 2012
EUR
mill
ions
Revenues, Costs and EBITDA2008- 2012
Revenues Costs EBITDA
33%
19%0,4%
21%
27%
Cost Breakdown 2012
Personnel
ICT
Other operating
Depreciation and amortisationOther costs
2%16%
19%62%
1%
Revenue Breakdown 2012
Listing (admission + ongoing)
Cash Trading
Settlement
Info products & services
Other (advert., educat., properties)
Federation of European Securities Exchanges AISBL (FESE) shall not be liable for any errors or omissions nor for the use of the information contained in this document.

FESE EUROPEAN EXCHANGE REPORT 2012 Page 15 of 29
CEESEG – VIENNA STOCK EXCHANGE
Name Vienna Stock Exchange Type of Company Joint-stock companyFor profit
Address Wallnerstraße 8 Box 192, A-1014 Vienna Listed OTC traded regularlyPhone +43 1 531 65-0 Sectors Cash EU regulated marketFax +43 1 532 97 40 Cash EU not regulated (exchange regulated) marketsEmail [email protected] Derivatives marketsWebsite www.wienerboerse.at Wholesale bond markets
Retail bond marketsYear established 1771 Clearing houses / CCP services providers*Year of current legal status 1997Country of Incorporation Austria Number of employees 97 (end of year)Active in Austria
Electronic Order Off Reporting Electronic Order Off Electronic Orde Off Electronic Order OffBook Trades EOB Trades Book Trades EOB Book Trades EOB Book Trades EOB
Turnover (EUR m) 18.077 - - 201 - 4 - 0 -Trades 3.514.769 - - 17.151 - 430 - 0 -Market Cap. (EUR m)Listed companies
Electronic Order Off Bond Book Trades EOB Options & FuturCommodities
Turnover (EUR m) 118 - Notional Turnover (EUR m) - -Trades 9.295 - Contracts Traded - -Listings
Revenues 43.041Costs 28.108EBITDA 16.116EBIT 14.933Net Income 12.282
FootnoteFinancial figures refer to the exchange and not to the parent company owning the exchangeFinancial figures are under local GAAP financial acconting standards*The CEESEG Holding, parent company of the Wiener Börse AG, does control CCP services and CSD indirectly via the stock exchanges in Prague and Budapest; the Wiener Börse AG does control only 50% of the Austrian CCPNotesFigures mentioned include subsidiaries.
EUR '000Main financial results 2012
3.623
Bonds
Financial figures 2012
768.00416.050
Stock/Index Options and Futures
Trading figures 2012
-22
Shares
80.429
Sec. Derivatives UCITsETFsEquity
99-
5.279 1
Derivatives
-
70
54 5250
4327 27 27 27 28
44
28 27 2416
01020304050607080
2008 2009 2010 2011 2012
EUR
mill
ions
Revenues, Costs and EBITDA2008 - 2012
Revenues Costs EBITDA
34%
37%
22%
4% 3%
Cost Breakdown 2012
Personnel
ICT
Other operating
Depreciation and amortisationOther costs
10%
41%
1%2%
32%
14%
Revenue Breakdown 2012
Listing (admission + ongoing)
Cash Trading
Derivatives Trading
Clearing / CCP
Info products & services
Other (advert., educat., properties)
Federation of European Securities Exchanges AISBL (FESE) shall not be liable for any errors or omissions nor for the use of the information contained in this document.
FESE EUROPEAN EXCHANGE REPORT 2012 Page 16 of 29
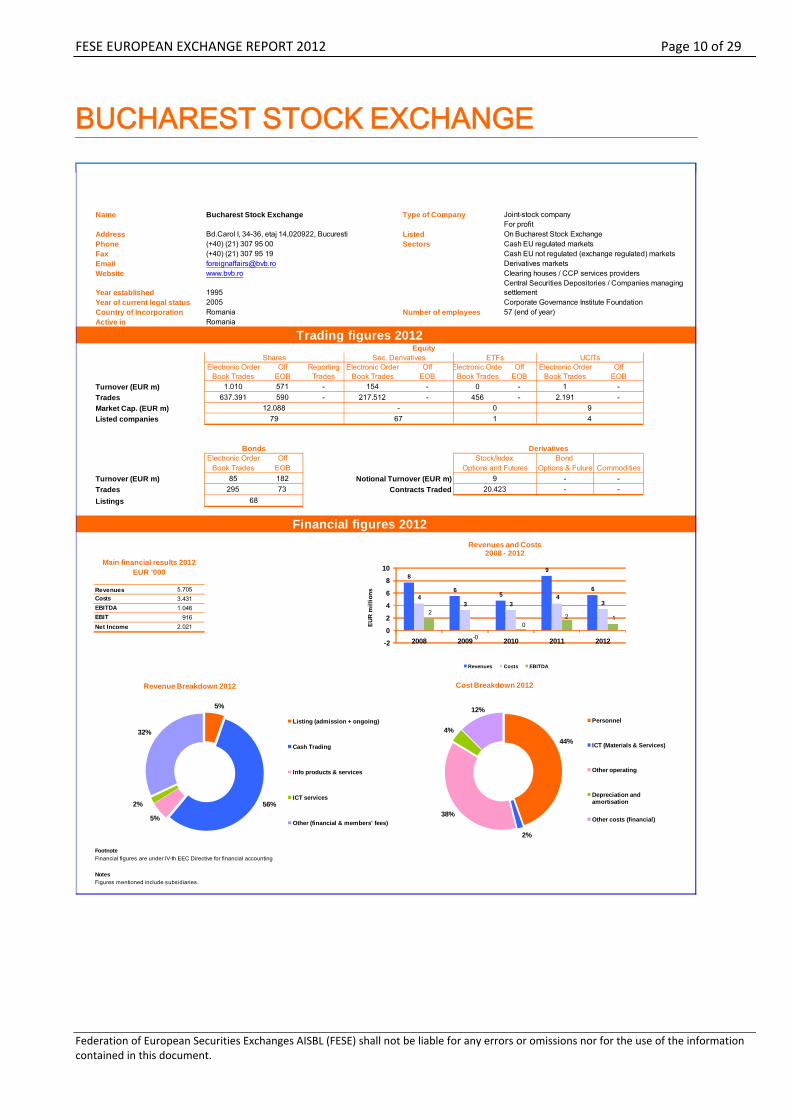
CYPRUS STOCK EXCHANGE
Name Cyprus Stock Exchange Type of Company Public sector (State) entityAddress 71-73 Lordou Vironos Avenue, 1096, Not for profit
Nicosia 1309 Listed NoPhone +357 22 712300 Sectors Cash EU regulated marketsFax +357 22 570308 Cash EU not regulated (exch. regulated) marketsEmail [email protected] Retail bond marketsWebsite www.cse.com.cy Central Securities Depositories / Companies
managing settlementYear established 1993 IT infrastructure and software providersYear of current legal status 1996Country of Incorporation Cyprus Number of employees 80 (end of year)Active in Cyprus
Electronic Order Off Reporting Electronic Order Off Electronic Order Off Electronic Order OffBook Trades EOB Trades Book Trades EOB Book Trades EOB Book Trades EOB
Turnover (EUR m) 224 5 3 - - - - 5 0Trades 160.951 14 202 - - - - 4.256 1Market Cap. (EUR m)Listed companies
Electronic Order Off Bond Book Trades EOB Options & Futures Commodities
Turnover (EUR m) 25 0 Notional Turnover (EUR m) - -Trades 5.802 1 Contracts Traded - -Listings
Revenues 4.396Costs 5.825EBITDA -1.666EBIT -2.073Net Income -1.433
FootnotesFinancial figures are under IFRS financial accounting protocolFinancial figures refer to the exchange and not to the parent company owning the exchangeFootnote on Revenue, Costs and EBITDA chartRevenue figures include interest income
NotesFigures mentioned include subsidiaries.
Stock/Index
--
Shares
1.514101
Derivatives
9
Options and Futures--
EUR '000Main financial results 2012
72
Trading figures 2012
Financial figures 2012
Sec. Derivatives UCITsETFs
Bonds
Equity
--
72
6,8 6,4
5,3 4,3 4,4
6,25,8 5,6 6,3
5,8
0,0
0,2
-0,7
0 0-4
-2
0
2
4
6
8
2008 2009 2010 2011 2012
EUR
mill
ions
Revenues, Costs and EBITDA2008 - 2012
Revenues Costs EBITDA
63,058%
29,478%
6,998% 0,466%
Cost Breakdown 2012
Personnel
ICT & Other Operating
Depreciation and amortisation
Other costs
44%
26%
3%
4%
23%
Revenue Breakdown 2012
Listing (admission + ongoing+central depository)
Cash Trading&clearing and settlement
Info products & services
ICT services
Other (advert., educat., properties,penalties,interest)
Federation of European Securities Exchanges AISBL (FESE) shall not be liable for any errors or omissions nor for the use of the information contained in this document.

FESE EUROPEAN EXCHANGE REPORT 2012 Page 17 of 29
DEUTSCHE BÖRSE GROUP
Name Deutsche Börse AG Type of Company Joint-stock companyFor profit
Address Mergenthalerallee 61, 65760 Eschborn - Germany Listed On Deutsche BörsePhone +49 (0) 69 2 11 0 Sectors Cash EU regulated marketFax +49 (0) 69 2 11 0 Cash EU not regulated (exchange regulated) marketsEmail [email protected] Derivatives marketsWebsite www.deutsche-boerse.com Retail bond market; Wholesale bond markets
Clearing houses / CCP services providersYear established 1585 Central Securities Depositories / Settlement companiesYear of current legal status 1992 IT infrastructure and software providersCountry of Incorporation Germany Info. Services, ICSD, Repo Market, Services for Markets managed Austria, Bulgaria, Finland, Germany, Ireland, investment fund industry(directly or indirectly) Switzerland & USA Number of employees 3,704 (end of year)
Electronic Order Off Reporting Electronic Order Off Electronic Order Off Electronic Order OffBook Trades EOB Trades Book Trades EOB Book Trades EOB Book Trades EOB
Turnover (EUR m) 987.032 20.802 69.806 20.687 29.917 130.577 5.178 948 3.736Trades 104.489.552 235.672 1.087.617 1.901.850 2.780.966 1.855.239 16.407 110.808 119.904Market Cap. (EUR m)Listed companies
Electronic Order Off Bond Book Trades EOB Options & Futures Commodities
Turnover (EUR m) 18.775 15.417 Notional Turnover (EUR m) 192.335.328 -Trades 674.110 97.085 Contracts Traded 326.042.504 -Listings
Revenues 1.932.300Costs 922.400EBITDA 1.108.200EBIT 1.005.600Net Income 660.900
FootnoteFinancial figures are under IFRS financial accounting protocol
NotesFigures mentioned include subsidiaries.
22.172
Financial figures 2012
Main financial results 2012EUR '000
Bonds DerivativesStock/Index
Options and Futures25.730.613
1.177.943.040
1.127.370 - - -747 1.152.372 1.015 2.836
Trading figures 2012Equity
Shares Sec. Derivatives ETFs UCITs
2.497
2.039 2.016 2.121
1.932
995 981 936 879 922
1.646 1.207
1.221 1.336
1.108
0500
10001500200025003000
2008 2009 2010 2011 2012
EUR
mill
ions
Revenues, Costs and EBITDA2008 - 2012
Revenues Costs EBITDA
33%
35%
9%
23%
Cost Breakdown 2012
Personnel
Other operating
Depreciation and amortisation
Volume related costs
5%
36%
2%5%29%
11%
12%
Revenue Breakdown 2012
Cash Trading
Derivatives Trading
Clearing / CCP
Settlement
Custody & Banking
Info products & services
Other (advert., educat., properties)
Federation of European Securities Exchanges AISBL (FESE) shall not be liable for any errors or omissions nor for the use of the information contained in this document.
FESE EUROPEAN EXCHANGE REPORT 2012 Page 18 of 29
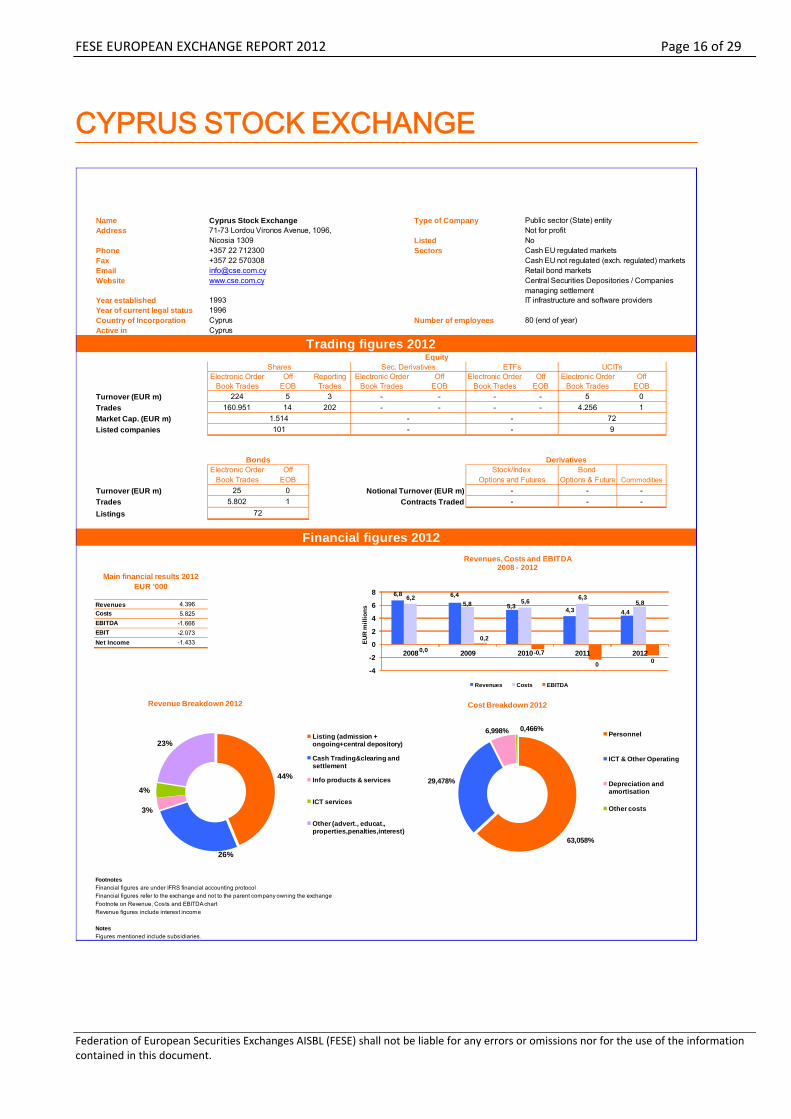
ICE FUTURES EUROPE
Name ICE Futures Europe Type of Company For profitListed Listed on a regulated market managed by other entities
Address Milton Gate, 60 Chiswell Street, London EC1Y4SA (IntercontinentalExchange Inc on NYSE)Phone +44 (0)20 7065 7700 Sectors Futures & Options Energy ExchangeFax +44 (0)20 7638 4964Email [email protected] www.theice.com
Year established 1980Year of current legal status 2005Country of Incorporation England & Wales Number of employees 79 (end of year)Active in United Kingdom
Electronic Order Off Reporting Electronic Order Off Electronic Order Off Electronic Order OffBook Trades EOB Trades Book Trades EOB Book Trades EOB Book Trades EOB
Turnover (EUR m) - - - - - - - - -Trades - - - - - - - - -Market Cap. (EUR m)Listed companies
Electronic Order Off Bond Book Trades EOB Options & Future Commodities
Turnover (EUR m) - - Notional Turnover (EUR m) - 20.640.457Trades - - Contracts Traded - 278.806.095Listings
Revenues 177.850Costs 62.508EBITDA 132.751EBIT 131.441Net Income 100.738
FootnotesFinancial figures are under UK GAAP financial accounting protocolMain financial results are based on UK Filed statutory accounts (functional currency changed from GBP to USD on 30 June 2006) converted at correspondent exchange rates.On Revenue Breakdown:
*Fees levied on clearing members for transacting on the exchange have been included in derivatives tradingNotesFigures mentioned include subsidiaries.
-
Financial figures 2012
Main financial results 2012EUR '000
-
- - - -- - - -
Bonds DerivativesStock/Index
Options & Futures-
Trading figures 2012Equity
Shares Sec. Derivatives ETFs UCITs
131150
199
240
178
35 42 5159
63105
132161
195
133
020406080
100120140160180200220240260
2008 2009 2010 2011 2012
EUR
mill
ions
Revenues, Costs and EBITDA2008 - 2012
Revenues Costs EBITDA
17%
81%
2%
Cost Breakdown 2012
Personnel
Other operating
Depreciation and amortisation
100%
Revenue Breakdown 2012
Derivatives Trading*
Federation of European Securities Exchanges AISBL (FESE) shall not be liable for any errors or omissions nor for the use of the information contained in this document.

FESE EUROPEAN EXCHANGE REPORT 2012 Page 19 of 29
THE IRISH STOCK EXCHANGE
Name The Irish Stock Exchange Type of Company Mutual company (co-operative principle)For profit
Address 28 Anglesea Street Dublin 2 Listed NoPhone +353 (1) 617 4200 Sectors Cash EU regulated marketFax +353 (1) 677 6045 Cash EU not regulated (exchange regulated) marketsEmail [email protected] Listing of Equity, Debt and Investment FundsWebsite www.ise.ie
Year established 1793Year of current legal status 1995Country of Incorporation Ireland Number of employees 82 (average)Active in Ireland, Malta
Electronic Order Off Reporting Electronic Order Off Electronic Orde Off Electronic Order OffBook Trades EOB Trades Book Trades EOB Book Trades EOB Book Trades EOB
Turnover (EUR m) 7.165 11.504 9 - - 5 0 - -Trades 1.121.139 90.610 11 - - 280 57 - -Market Cap. (EUR m)Listed companies
Electronic Order Off Bond Book Trades EOB Options & FutureCommodities
Turnover (EUR m) - 33.548 Notional Turnover (EUR m) - -Trades - 23.658 Contracts Traded - -Listings
Revenues 20.381Costs 15.289EBITDA 6.959EBIT 6.253Net Income 5.241
FootnotesFinancial figures are under IFRS financial accounting protocolNotesFigures mentioned include subsidiaries.
-20.270
1
Stock/Index Options and Futures
Trading figures 2012Equity
-
Derivatives
--
Sec. Derivatives UCITsETFsShares
EUR '000Main financial results 2012
-82.66850
Bonds
-
-
Financial figures 2012
24 20 20 21 20
17 16 1518 15
-15
76 5 7
-20-15-10-505
1015202530
2008 2009 2010 2011 2012
EUR
mill
ions
Revenues, Costs and EBIT2008 - 2012
Revenues Costs EBIT
55%
14%
26%
5%
Cost Breakdown 2012
Personnel
ICT
Other operating
Depreciation and amortisation
63%
7%
20%
10%
Revenues Breakdown 2012
Listing (admission + ongoing)
Cash Trading
Info products & services
Other (advert., educat., properties)
Federation of European Securities Exchanges AISBL (FESE) shall not be liable for any errors or omissions nor for the use of the information contained in this document.

FESE EUROPEAN EXCHANGE REPORT 2012 Page 20 of 29
LONDON METAL EXCHANGE
Name London Metal Exchange Type of Company Joint stock companyFor profit
Address 56 Leadenhall Street, London, EC3A 2DX, UKPhone +44 (0)20 7264 5555 Listed No listedFax +44 (0)20 7680 0505 Sectors Derivatives marketsEmailWebsite www.lme.com
Year established 1877Year of current legal status 1987Country of Incorporation England Number of employees 105 (end of year)Active in United Kingdom
Electronic Order Off Reporting Electronic Order Off Electronic Order Off Electronic Order OffBook Trades EOB Trades Book Trades EOB Book Trades EOB Book Trades EOB
Turnover (EUR m) - - - - - - - - -Trades - - - - - - - - -Market Cap. (EUR m)Listed companies
Electronic Order Off Bond Book Trades EOB Options & Futures Commodities
Turnover (EUR m) - - Notional Turnover (EUR m) - 10.663.587 Trades - - Contracts Traded - 159.719.876 Listings
Revenues 100.036Costs 94.994EBITDA 17.558EBIT 5.042Net Income 4.041
FootnotesFinancial figures under IFRS financial accounting protocol
NotesFigures mentioned include subsidiaries.
-
Financial figures 2012
Main financial results 2012EUR '000
Bonds DerivativesStock/Index
Options and Futures--
- - - -- - - -
Trading figures 2012Equity
Shares Sec. Derivatives ETFs UCITs
3948 51
73100
26 31 39
60
95
14 20 1827
18
020406080
100120
2008 2009 2010 2011 2012
EUR
Mill
ions
Revenues, Costs and EBITDA2008- 2012
Revenues Costs EBITDA
41%
26%
13%
20%
Cost Breakdown 2012
Personnel
ICT
Depreciation and amortisation
Other costs
65%
17%
18%
Revenue Breakdown 2012
Derivatives Trading
ICT services
Other (advert., educat., properties)
Federation of European Securities Exchanges AISBL (FESE) shall not be liable for any errors or omissions nor for the use of the information contained in this document.

FESE EUROPEAN EXCHANGE REPORT 2012 Page 21 of 29
LUXEMBOURG STOCK EXCHANGE
Name Luxembourg Stock Exchange Type of Company Joint-stock companyFor profit
Address 11, av de la Porte-Neuve L-2227 Luxembourg Listed NoPhone +352 47 79 36 1 Sectors Cash EU regulated marketFax +352 47 32 98 Cash EU not regulated (exchange regulated) marketsEmail [email protected] Wholesale bond marketsWebsite www.bourse.lu IT infrastructure and software providers
Year established 1927Year of current legal status 1928Country of Incorporation Luxembourg Number of employees 139 (end of year)Active in Luxembourg
Electronic Order Off Reporting Electronic Order Off Electronic Orde Off Electronic Order OffBook Trades EOB Trades Book Trades EOB Book Trades EOB Book Trades EOB
Turnover (EUR m) 102 - - - - 0 - 8 -Trades 10.987 - - - - 4 - 196 -Market Cap. (EUR m)Listed companies (shares) / listing
Electronic Order Off Bond Book Trades EOB Options & Future Commodities
Turnover (EUR m) 342 - Notional Turnover (EUR m) - -Trades 5.028 - Contracts Traded - -Listings
Revenues 41.642Costs 25.553EBITDA 16.089EBIT 8.465Net Income 6.644
FootnoteFinancial figures are under LUXGAAP financial accounting protocol
NotesFigures mentioned include subsidiaries.
Bonds
Trading figures 2012Equity
293
Shares
53.352 n/a6.342
-
UCITsETFs
-7.544 95
Sec. Derivatives
Derivatives
EUR '000Main financial results 2012
27.839
Options and Futures
Financial figures 2012
--
Stock/Index
42 43 41 41 42
2827 25 24
26
15 16 17 17 16
05
101520253035404550
2008 2009 2010 2011 2012
EUR
mill
ions
Revenues, Costs and EBITDA2008 - 2012
Revenues Costs EBITDA
42%
20%
17%
21%
Cost Breakdown 2012
Personnel
ICT
Other operating
Depreciation and amortisation
68%0.2%
30%
2%
Revenue Breakdown 2012
Listing (admission + ongoing)
Cash Trading
Info products & services
Other (advert., educat., properties)
Federation of European Securities Exchanges AISBL (FESE) shall not be liable for any errors or omissions nor for the use of the information contained in this document.

FESE EUROPEAN EXCHANGE REPORT 2012 Page 22 of 29
MALTA STOCK EXCHANGE
Name Malta Stock Exchange Type of Company Public sector (State) entity - MSE Plc is now a companyNot for profit
Address Garrison Chapel Castille Place Valetta CMR01 Listed NoPhone +356 21244051 Sectors Cash EU regulated marketFax +356 25696316 Cash EU not regulated (exchange regulated) marketsEmail [email protected] Wholesale bond marketsWebsite www.borzamalta.com.mt Retail bond market
Central Securities Depositories / Settlement companiesYear established 1990Year of current legal status 2007Country of Incorporation Malta Number of employees 55 (end of year)Active in Malta
Electronic Order Off Reporting Electronic Order Off Electronic Order Off Electronic Order OffBook Trades EOB Trades Book Trades EOB Book Trades EOB Book Trades EOB
Turnover (EUR m) 33 - - - - - - - -Trades 5.750 - - - - - - - -Market Cap. (EUR m)Listed companies
Electronic Order Off Bond Book Trades EOB Options & Future Commodities
Turnover (EUR m) 636 - Notional Turnover (EUR m) - -Trades 9.599 - Contracts Traded - -Listings
Revenues 4.793Costs 2.866EBITDA 1.927EBIT 1.927Net Income 1.402
FootnoteFinancial figures refer to the exchange and not to the parent company owning the exchangeFinancial figures are under IFRS financial accounting standards
NotesFigures mentioned include subsidiaries.
Trading figures 2012
Financial figures 2012
Sec. Derivatives UCITsETFs
--
--
Bonds
Equity
--
Shares
2.75422
Stock/Index
--
Options and Futures
Derivatives
EUR '000Main financial results 2012
123
4,2 3,94,4 4,5 4,8
2,8 2,7 2,7 2,6 2,9
1,4 1,21,7 1,8 1,9
0
1
2
3
4
5
2008 2009 2010 2011 2012
EUR
mill
ions
Revenues, Costs and EBITDA2008 - 2012
Revenues Costs EBITDA
50%
42%
8%
Cost Breakdown 2012
Personnel
Other operating
Depreciation and amortisation
86%
7%
7%
Revenue Breakdown 2012
Listing (admission + ongoing)Membership
Clearing / Settlement / CSD
Federation of European Securities Exchanges AISBL (FESE) shall not be liable for any errors or omissions nor for the use of the information contained in this document.
FESE EUROPEAN EXCHANGE REPORT 2012 Page 23 of 29
NASDAQ OMX GROUP INC.
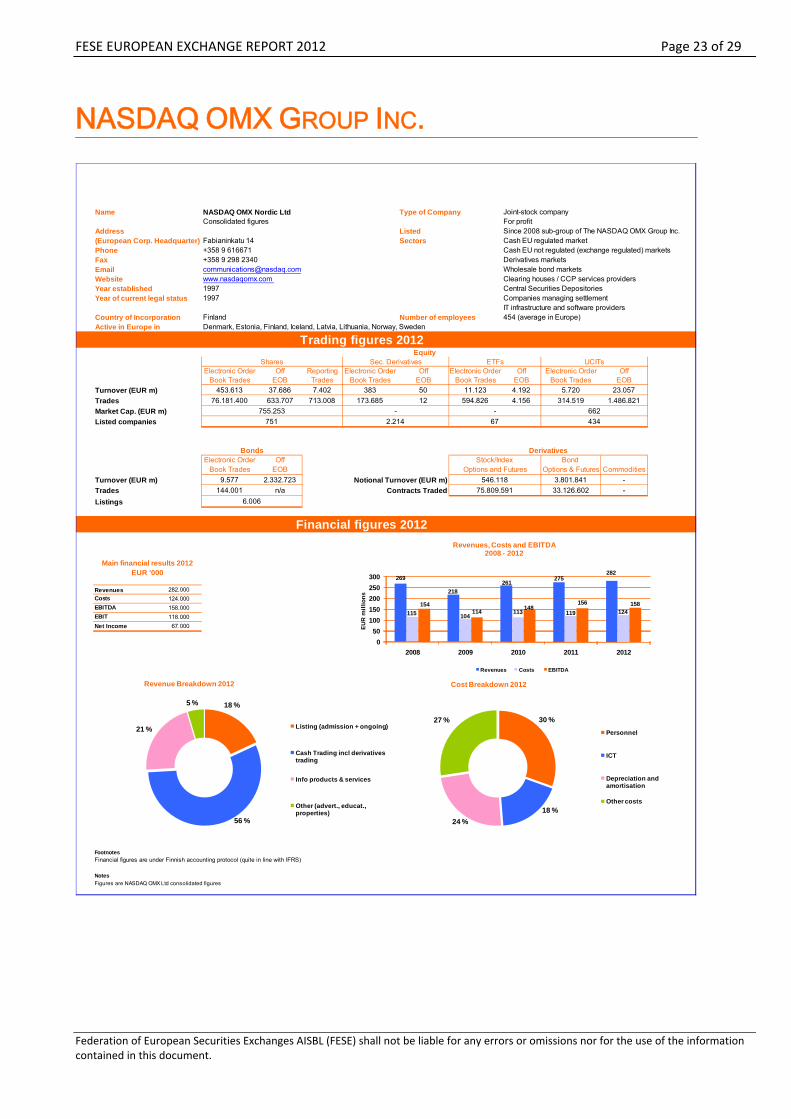
Name NASDAQ OMX Nordic Ltd Type of Company Joint-stock companyConsolidated figures For profit
Address Listed Since 2008 sub-group of The NASDAQ OMX Group Inc.(European Corp. Headquarter) Fabianinkatu 14 Sectors Cash EU regulated marketPhone +358 9 616671 Cash EU not regulated (exchange regulated) marketsFax +358 9 298 2340 Derivatives marketsEmail [email protected] Wholesale bond marketsWebsite www.nasdaqomx.com Clearing houses / CCP services providersYear established 1997 Central Securities Depositories Year of current legal status 1997 Companies managing settlement
IT infrastructure and software providersCountry of Incorporation Finland Number of employees 454 (average in Europe)Active in Europe in Denmark, Estonia, Finland, Iceland, Latvia, Lithuania, Norway, Sweden
Electronic Order Off Reporting Electronic Order Off Electronic Order Off Electronic Order OffBook Trades EOB Trades Book Trades EOB Book Trades EOB Book Trades EOB
Turnover (EUR m) 453.613 37.686 7.402 383 50 11.123 4.192 5.720 23.057Trades 76.181.400 633.707 713.008 173.685 12 594.826 4.156 314.519 1.486.821Market Cap. (EUR m)Listed companies
Electronic Order Off Bond Book Trades EOB Options & Futures Commodities
Turnover (EUR m) 9.577 2.332.723 Notional Turnover (EUR m) 3.801.841 -Trades 144.001 n/a Contracts Traded 33.126.602 -Listings
1452635,813450664
Revenues 282.000Costs 124.000EBITDA 158.000EBIT 118.000Net Income 67.000
FootnotesFinancial figures are under Finnish accounting protocol (quite in line with IFRS)
NotesFigures are NASDAQ OMX Ltd consolidated figures
EUR '000Main financial results 2012
6.006
Trading figures 2012
Financial figures 2012
Sec. Derivatives UCITsETFs
Bonds
Equity
546.118Options and Futures
75.809.591
DerivativesStock/Index
662434
-67
Shares
755.253751
-2.214
269
218261
275282
115 104113 119 124
154114 148
156 158
050
100150200250300
2008 2009 2010 2011 2012
EUR
mill
ions
Revenues, Costs and EBITDA2008 - 2012
Revenues Costs EBITDA
30 %
18 %24 %
27 %
Cost Breakdown 2012
Personnel
ICT
Depreciation and amortisation
Other costs
18 %
56 %
21 %
5 %
Revenue Breakdown 2012
Listing (admission + ongoing)
Cash Trading incl derivatives trading
Info products & services
Other (advert., educat., properties)
Federation of European Securities Exchanges AISBL (FESE) shall not be liable for any errors or omissions nor for the use of the information contained in this document.

FESE EUROPEAN EXCHANGE REPORT 2012 Page 24 of 29
NYSE EURONEXT
Name NYSE EURONEXT Type of Company Joint-stock companyFor profit
Address Listed On NYSE Euronext(European Corp. Headquarter) 39, rue Cambon - 75039 Paris cedex 01 Sectors Cash EU regulated marketsPhone +33 (0)1 49 27 10 00 Cash EU not regulated (exchange regulated) marketsFax +33 (0)1 49 27 11 71 Derivatives marketsEmail [email protected] IT infrastructure and software providersWebsite www.nyx.com
Year of Incorporation 2007Country of Incorporation USA Number of employees 3,079 (end of year)Active in Belgium, France, Netherlands, Portugal, United Kingdom and USA
Electronic Order Off Reporting Electronic Order Off Electronic Order Off Electronic Order OffBook Trades EOB Trades Book EOB Book EOB Book EOB
Turnover (EUR m) 1.220.596 52.778 1.101.331 18.551 39 61.558 10.465 5.720 23.057Trades 178.282.912 162.842 2.353.225 3.942.717 47 1.703.832 2.358 314.519 1.486.821Market Cap. (EUR m)Listed Domestic companies
Electronic Order Off Bond Book EOB Options & Futures Commodities
Turnover (EUR m) 12.263 16 Notional Turnover (EUR m) 364.281.056 317.358Trades 674.908 117 Contracts Traded 450.712.624 22.937.148Listings
Revenues 2.914.716Costs 2.238.860EBITDA 675.856EBIT 473.751Net Income 273.169
FootnotesAll the information refers to NYSE Euronext except for trading figures which only refer to the European trading.Main financial results are based on US GAAP since April 2007 converted at correspondent exchange rates.
NotesFigures mentioned include subsidiaries.
Shares
2.148.2151.073
Stock/Index Bonds
Options and Futures
24.569
Derivatives
198
EUR '000Main financial results 2012
4.165
-667
Trading figures 2012 - Only for European marketsEquity
Financial figures 2012
Sec. Derivatives UCITsETFs
-
7.063.345481.969.344
46.530
32143371 3344
4552
29152369
29812570
3422
2239
845390
7741130
676
0
1000
2000
3000
4000
5000
2008 2009 2010 2011 2012
EUR
mill
ions
Revenues, Costs and EBITDA2008 - 2012
Revenues Costs EBITDA
58%
17%
25%
Cost Breakdown 2012
Personnel
ICT
Depreciation and amortisation
12%
34%
22%
9%
9%
14%
Revenue Breakdown 2012
Listing (admission + ongoing)
Cash Trading
Derivatives Trading
Info products & services
ICT services
Other (Activity assessment, regulatory and others)
Federation of European Securities Exchanges AISBL (FESE) shall not be liable for any errors or omissions nor for the use of the information contained in this document.

FESE EUROPEAN EXCHANGE REPORT 2012 Page 25 of 29
OSLO BØRS
Name Oslo Børs VPS Holding ASA Type of Company Joint-stock companyFor profit
Address PO.Box. 460, Sentrum N-0105 Oslo Listed Traded OTC regularlyPhone +47 22 34 17 00 Sectors Cash EU regulated marketFax +47 22 34 19 25 Derivatives marketsEmail [email protected] Wholesale bond marketsWebsite www.osloborsvps.no Clearing houses / CCP services providers
Central Securities Depositories / Companies Year established 1819 managing settlementYear of current legal status 2001Country of Incorporation Norway Number of employees 244 (end of year)Active in Norway
Electronic Order Off Reporting Electronic Order Off Electronic Order Off Electronic Order OffBook Trades EOB Trades Book Trades EOB Book Trades EOB Book Trades EOB
Turnover (EUR m) 112.923 13.478 163 463 2 6.014 - - -Trades 21.057.684 40.222 10.893 50.577 9 332.539 - - -Market Cap. (EUR m)Listed companies
Electronic Order Off Bond Book Trades EOB Options & FuturCommodities
Turnover (EUR m) 19.604 369.311 Notional Turnover (EUR m) - -Trades 1.749 27.323 Contracts Traded - -Listings
Revenues 111.087Costs 78.065EBITDA 55.135EBIT 33.022Net Income 25.960
FootnoteFinancial figures refer to Oslo Børs VPS HoldingFinancial figures are under IFRS financial accounts standardsThe value for settlement in revenue breakdown refers to VPS (a CSD) as a whole – not only the settlement revenues in VPSNotesFigures mentioned include subsidiaries.
Shares
184.131228
Stock/Index Bonds
Options and Futures
140
Derivatives
-
EUR '000Main financial results 2012
1.384
-15
Trading figures year 2012Equity
Financial figures year 2012
Sec. Derivatives UCITsETFs
-
5.83810.826.940
-
140106 118 118 111120
205
71 80 787953 64 61 55
0
50
100
150
200
250
2008 2009 2010 2011 2012
EUR
mill
ions
Revenues, Costs and EBITDA2008- 2012
Revenues Costs EBITDA
39%
33%
28%
Cost Breakdown year 2012
Personnel
Other operating
Depreciation and amortisation
12%
15%
2.5%
6%48%
15%
1.5%
Revenue Breakdown year 2012
Listing (admission + ongoing)
Cash Trading
Derivatives Trading
Clearing / CCP
Settlement
Info products & services
Other (advert., educat., properties)
Federation of European Securities Exchanges AISBL (FESE) shall not be liable for any errors or omissions nor for the use of the information contained in this document.

FESE EUROPEAN EXCHANGE REPORT 2012 Page 26 of 29
SIX GROUP
SIX SWISS EXCHANGE
Name SIX Group Type of Company Joint-stock companySIX Swiss Exchange For profit
Listed NoAddress Selnaustrasse 30 8021 Zürich Sectors CH regulated cash markets/CH not regulated (exchange reg.) marketsPhone +41(0)58 854 54 54 Retail bond marketsFax +41(0)58 854 54 55 CCP, Central Securities Depository and Custodian ServicesEmail IT infrastructure and software providers (forWebsites www.six-swiss-exchange.com SIX Swiss Exchange and Scoach CH)Year established 1993 Data vending, credit card solutions, electronic payment processingYear of current legal status 2008Country of Incorporation Switzerland Number of employees 238 (end of year) Active in Switzerland
Electronic Order Off Reporting Electronic Order Off Electronic Order Off Electronic Order OffBook Trades EOB Trades Book Trades EOB Book Trades EOB Book Trades EOB
Turnover (EUR m) 452.209 3.964 32.578 21.698 4.753 44.866 18.241 4.223 834Trades 28.633.254 2.446 465.233 867.908 26.247 788.132 11.591 175.082 1.808Market Cap. (EUR m) (Swiss ExchangListed companies (shares) / listings
Electronic Order Off Bond Book Trades EOB Options & Futures
Turnover (EUR m) 32.571 122.641 Notional Turnover (EUR m) - -Trades 481.010 82.686 Contracts Traded - -Listings
Revenues 158.209Costs 114.226EBITDA 67.050EBIT 62.626Net Income n/a
FootnotesFinancial data for 2008-2012 according to Management Accounts (not IFRS and not approved by auditors).Figures 2008 – 2011 are including Eurex business, from 2012 without EUREX business
Trading figures 2012
n/a26
-749
EquitySec. DerivativesShares UCITsETFs
Bonds
-32.496
Options and FuturesStock/Index
933.132268
Derivatives
Commodities--
EUR '000Main financial results 2012
1.550
Financial figures 2012
337
253 271306
158176 159148 170
114173
82 105
170
67
0
100
200
300
400
2008 2009 2010 2011 2012
EUR
mill
ions
Revenues, Costs and EBITDA2008 - 2012
Revenues Costs (excl. Depreciation) EBITDA
35%
4%
61%
Cost Breakdown 2012
Personnel
Depreciation and amortisation
Other costs
18%
52%
17%
13%
Revenue Breakdown 2012
Listing (admission + ongoing)
Cash Trading
Info products & services
Other (advert., educat., properties)
Federation of European Securities Exchanges AISBL (FESE) shall not be liable for any errors or omissions nor for the use of the information contained in this document.
FESE EUROPEAN EXCHANGE REPORT 2012 Page 27 of 29
WARSAW STOCK EXCHANGE
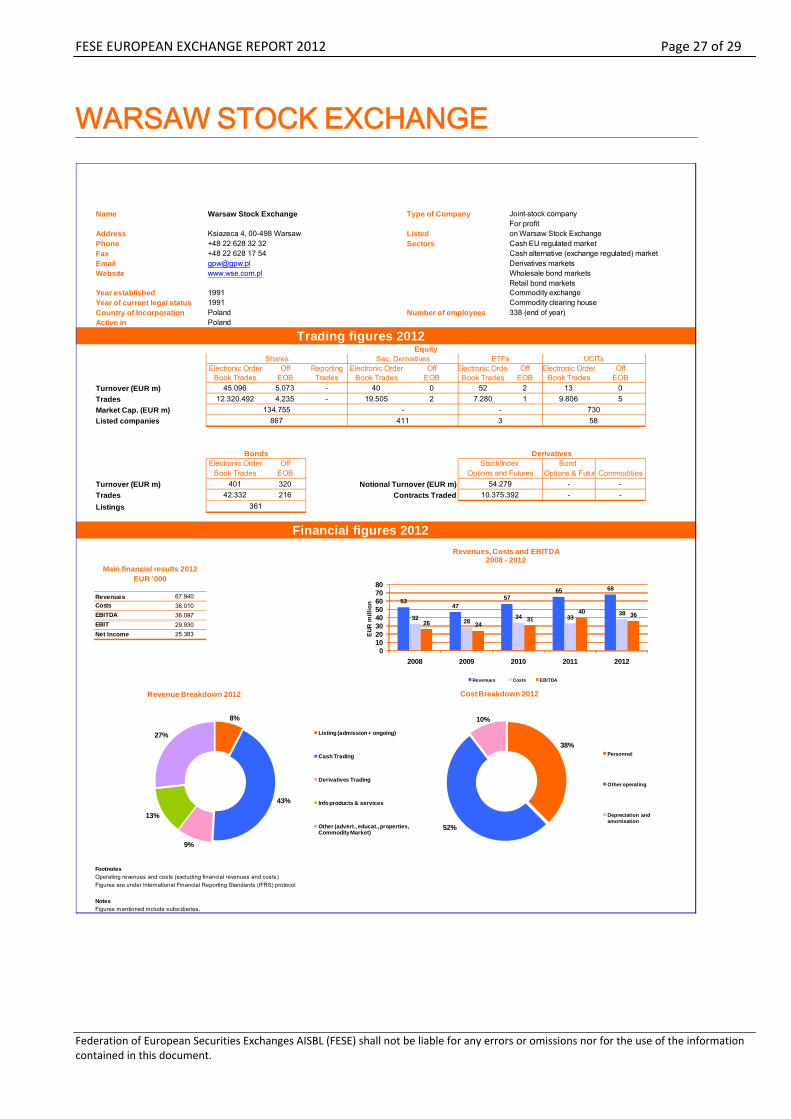
Name Warsaw Stock Exchange Type of Company Joint-stock companyFor profit
Address Ksiazeca 4, 00-498 Warsaw Listed on Warsaw Stock ExchangePhone +48 22 628 32 32 Sectors Cash EU regulated marketFax +48 22 628 17 54 Cash alternative (exchange regulated) marketEmail [email protected] Derivatives marketsWebsite www.wse.com.pl Wholesale bond markets
Retail bond marketsYear established 1991 Commodity exchangeYear of current legal status 1991 Commodity clearing houseCountry of Incorporation Poland Number of employees 338 (end of year)Active in Poland
Electronic Order Off Reporting Electronic Order Off Electronic Orde Off Electronic Order OffBook Trades EOB Trades Book Trades EOB Book Trades EOB Book Trades EOB
Turnover (EUR m) 45.096 5.073 - 40 0 52 2 13 0Trades 12.320.492 4.235 - 19.505 2 7.280 1 9.806 5Market Cap. (EUR m)Listed companies
Electronic Order Off Bond Book Trades EOB Options & Futur Commodities
Turnover (EUR m) 401 320 Notional Turnover (EUR m) - -Trades 42.332 216 Contracts Traded - -Listings
Revenues 67.940Costs 38.010EBITDA 36.097EBIT 29.930Net Income 25.383
FootnotesOperating revenues and costs (excluding financial revenues and costs)Figures are under International Financial Reporting Standards (IFRS) protocol
NotesFigures mentioned include subsidiaries.
Trading figures 2012Equity
Financial figures 2012
Sec. Derivatives UCITsETFs
-
54.27910.375.392
730
EUR '000Main financial results 2012
361
-3
Shares
134.755867
Stock/Index Bonds
Options and Futures
411
Derivatives
58
5347
5765 68
32 2834 33 38
26 2431
40 36
01020304050607080
2008 2009 2010 2011 2012
EUR
mill
ion
Revenues, Costs and EBITDA2008 - 2012
Revenues Costs EBITDA
38%
52%
10%
Cost Breakdown 2012
Personnel
Other operating
Depreciation and amortisation
8%
43%
9%
13%
27%
Revenue Breakdown 2012
Listing (admission + ongoing)
Cash Trading
Derivatives Trading
Info products & services
Other (advert., educat., properties, Commodity Market)
Federation of European Securities Exchanges AISBL (FESE) shall not be liable for any errors or omissions nor for the use of the information contained in this document.

FESE EUROPEAN EXCHANGE REPORT 2012 Page 28 of 29
Federation of European Securities Exchanges AISBL (FESE) shall not be liable for any errors or omissions nor for the use of the information contained in this document.
NOTES ON METHODOLOGY Trading figures:
• Trading statistics follow the FESE Statistics Methodology: http://www.fese.eu/en/?inc=art&id=51 • Electronic Order Book Trades contain all transfers of ownership by way of trades automatically
executed through the Exchanges' electronic order book. • Off Electronic Order Book Trades include all other transfers of ownership by way of trades
executed away from the electronic order book and involving at least one member / intermediary of an Exchange.
• Reporting Trades include trades reported through a Trade Reporting Facility (TRF) when only one counterparty provides information on the trade and offers dissemination services at the request of the reporting trader. Turnover methodology was reviewed in 2010 (FESE Statistics Methodology: http://www.fese.eu/en/?inc=art&id=51 ).
• Market Capitalisation (Market Cap.) is the total number of issued shares of the company (including their several classes) multiplied by the respective share price at a given time. The total is the sum of the total market capitalisation of each domestic company admitted to listing included in the Exchange. The market capitalisation figures include:
shares of domestic companies shares of foreign companies which are exclusively listed on an exchange, i.e. the foreign
company is not listed on any other exchange common and preferred shares shares without voting rights when available investment /participation certificates when available
The market capitalisation figures exclude: collective investment funds rights, warrants, convertible instruments options, futures foreign listed shares other than exclusively listed ones companies whose only business goal is to hold shares of other listed companies
• Turnover or share trading value is the total number of shares traded multiplied by their respective prices.
• Notional Turnover is an approximate measure of the value of the number of contracts traded expressed with reference to the underlying asset, enabling comparison between cash and derivatives trading and among different derivatives products. It is computed as the number of contracts traded multiplied by the assets underlying amount and value.
• All trading figures (value and number of transactions) are single counted in order to ensure data comparability.
General information and financial figures according to:
• Figures mentioned include subsidiaries. • EBIT ‐ Earnings Before Interest and Taxes. • EBITDA ‐ Earnings Before Interest, Taxes, Depreciation and Amortization. • ICT – Information and Communication Technologies
Information sources
• Trading figures 2012 taken from FESE Statistics Database: http://www.fese.eu/en/?inc=page&id=10
• General information and Financial figures 2012 provided by FESE members.
FESE EUROPEAN EXCHANGE REPORT 2012 Page 29 of 29
Federation of European Securities Exchanges AISBL (FESE) shall not be liable for any errors or omissions nor for the use of the information contained in this document.
CONTACT FESE Secretariat Rosa Armesto Head of Economics and Statistics & Fixed Income Tel: +32 2 551 01 85 Email: [email protected]
Sara BaldiJunior Policy Adviser Tel: +32 2 551 01 86 Email: [email protected]


![arXiv:1403.2612v1 [cond-mat.mtrl-sci] 7 Mar 2014 · the anti-PbO FeSe layers. In FeSe, the cations and an-ions occupy the opposite sites to Pb and O atoms of litharge, so that we](https://img.pdfslide.net/doc/110x75/5d20461488c993e9188bc1dd/arxiv14032612v1-cond-matmtrl-sci-7-mar-2014-the-anti-pbo-fese-layers-in.jpg)


![Theoretical study of impurity-induced magnetism in FeSe · The understanding of the electronic properties of the ma- ... [18]. Despite the fact that very high quality FeSe crystals](https://img.pdfslide.net/doc/110x75/60450e3f7021064c8538c8dc/theoretical-study-of-impurity-induced-magnetism-in-fese-the-understanding-of-the.jpg)


![Instructiva Para Fese 2008 Sis j Go[1]](https://img.pdfslide.net/doc/110x75/5571fc4e497959916996f5b3/instructiva-para-fese-2008-sis-j-go1.jpg)