Embed Size (px)
Citation preview

European Gas Market:
Current State and
Perspectives
ENERGETIKA XXI
Saint-Petersburg State University of Economics
St. Petersburg, November 11, 2015
Sergei Komlev Head of Contract Structuring and Price Formation
Gazprom Export

© ZMB 2
Short-Term Trends on the European “Far Abroad” Gas Market
2
3Q 2014 3Q 2015 Changes, bcm Changes, %
Consumption 340.7 360.3 19.6 5.8%
Indigenous production* 191.1 193.6 2.5 1.3%
Net gas UGS
withdrawals/injections** -21.0 -6.2 14.8
Imports*** 170.6 172.6 2.2 1.3%
Sources: IEA, Eurostat, National Statistical Agencies, Estimates by Gazprom Export LLC as of October 2015
Consumption, Indigenous Production, Imports, and Gas Withdrawals
* Indigenous production includes Norway ** Plus means that withdrawals exceed injections and vice versa *** Consumption = Domestic Production + Gas withdrawals/injections balance of UGS + Import requirements.
Bcm
Gas consumption in Europe increased by 19.6 bcm or by 6% in 3Q of 2015 compared with Q3 of 2014. On the supply side indigenous production increased by 2.5 bcm or by 1.3%.
European companies injected only 6.2 bcm more gas than withdraw out of UGS in response to increase in demand. In Q3 2014 withdrawn volumes were 21 bcm. According to preliminary data, Far Abroad countries imports increased on par with the indigenous production.

28 93 162
176 0 0
223 223 223
37 121 213
151 192 237
241 185 89
Major Factors Affecting Gas Consumption in Europe*
2014 3Q 2015
1.Favorable weather conditions
(cold and long winter, hot summer)
2. Economic recovery
3. Use of gas in power generation
Total consumption 3Q 2015 to 3Q 2014 -10.1% +5.8%
3 * Factors for 3Q of 2015 and 2014 are specified in comparison with 5-year averages

© ZMB 4
Sources: PIRA, Gazprom Export LLC Estimates
1-3Q 2014 1-3Q 2015 ∆, bcm ∆, %
Total gas consumption 227.8 243.2 15.3 6.7%
Gas consumption in power
generation 45.6 52.4 6.8 15.0%
Share of power generation in gas
consumption 20.0% 21.5% 1.5 p.p.
Gas consumption in other sectors
182.3 190.8 8.5 4.7%
*EU Countries:
• Germany,
• Italy,
• United Kingdom,
• Netherlands,
• France,
• Spain
In the three quarters of 2015 demand for gas in power generation in six EU countries grew up by 15%, significantly above total
consumption growth.
The share of power generation sector also increased – up to 21.5% in the three quarters of 2015.
(bcm)
Demand for Gas in Power Generation
Demand for Gas in Power Generation for Six EU Countries*
*Set of Countries:
• Germany,
• Italy,
• United Kingdom,
• Netherlands,
• France,
• Spain
© ZMB 5
0
50
100
150
200
250
300
350
400
Switching price Actual NBP day-ahead
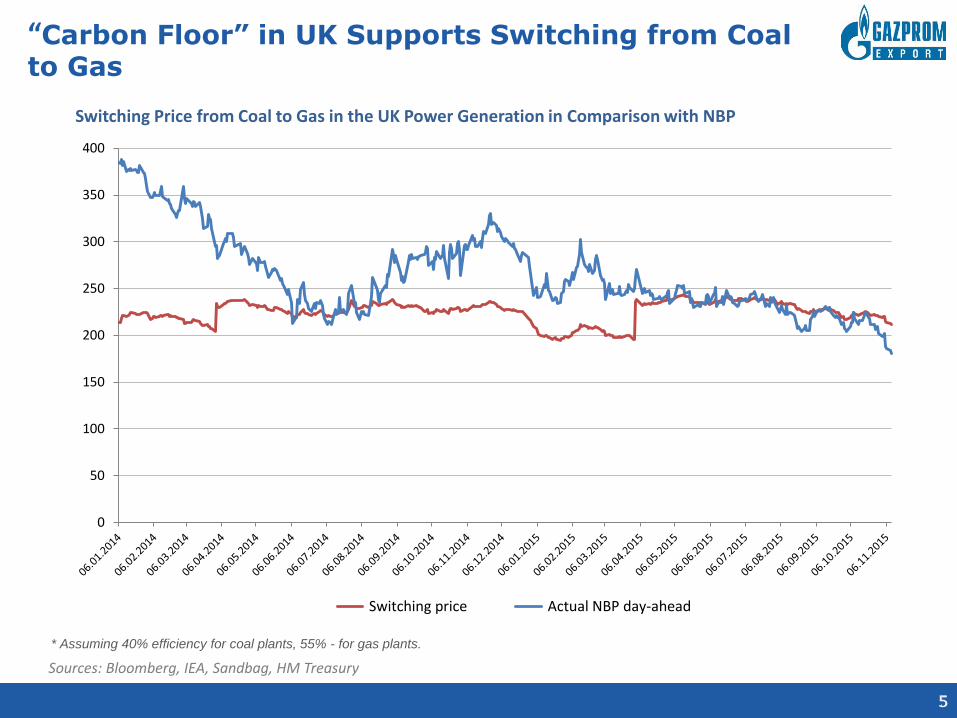
“Carbon Floor” in UK Supports Switching from Coal to Gas
Switching Price from Coal to Gas in the UK Power Generation in Comparison with NBP
5
Sources: Bloomberg, IEA, Sandbag, HM Treasury
* Assuming 40% efficiency for coal plants, 55% - for gas plants.

© ZMB 6
Deliveries by Major Countries 3Q of 2015
3Q 2014 3Q 2015 Changes, bcm Changes, %
Gazprom JSC 114.2 115.4 1.2 1.0%
Algeria (incl. LNG) 24.6 21.8 -2.8 -11.5%
Qatar 17.9 19.9 2.0 11.0%
Iran 6.8 6.5 -0.3 -4.5%
Lybia (incl. LNG) 4.8 5.7 0.9 19.2%
Deliveries by Major Exporters
2013 2014 Changes, bcm Changes,
%
Norway* 82.4 90.2 7.8 9.4%
Netherlands 43.3 37.2 -6.1 -14.1%
United Kingdom 30.6 32.2 1,6 5.2%
Bcm
Bcm Deliveries by Major Indigenous Producers
Sources: Bloomberg, IEA, Eurostat, National Statistical Agencies, Estimates by Gazprom Export LLC as of October 2015
* Including pipeline and LNG supply of Norway to the European market, but not supply to Asia and America
6

© ZMB
Mid-Term Gas Demand Forecasts
Gazprom Gas Deliveries to Europe*
7
* European countries including Turkey except for CIS and Baltics
Mid-Term Forecasts of Gas Consumption in Europe
~156-160
bcma
Largely driven by weather conditions Gazprom’s mid-term (2016-2018) estimate of gas deliveries to Europe is 156-160 bcma.
138.6 150.0
138.8
161.5 146.6
159-160
$303
$373 $397
$383
$345
$237-240
225
275
325
375
425
475
525
0
40
80
120
160
200
2010 2011 2012 2013 2014 2015
bcm
$/mcm
Source: Annual Reports of PJSC Gazprom
Source: CERA, PIRA, IEA
100.0
90.1
81.0
87.3 89.6 90.3 88.3
92.8 95.2
84.6
87.4 87.8
78
84
89
95
100
2006 2007 2008 2009 2010 2011 2012 2013 2014 2015 2016 2017
% 2006-2014 actual
CERA (Nov-2014)
CERA (Jul-2014)
PIRA (Oct-2014)
PIRA (Jul-2014)
IEA (May-2014)
IEA (May-2015)

28 93 162
176 0 0
223 223 223
37 121 213
151 192 237
241 185 89
Asian Price Premium
8
NBP «Month-Ahead» Prices versus Japanese LNG Prices
Sources: Bloomberg, METI, Platts, Customs Statistics of South Korea and Japan
Asian Premium dropped to $0.8 MMBTU compared to $5.7 MMBTU a year earlier. Oil-Indexed LNG Prices were $9.9 MMBTU in August 2015 compared to $16.9 MMBTU in August 2014.
*JKM

© ZMB 9 9
LNG Deliveries to Europe
LNG Deliveries to Europe by Country
3Q 2014 3Q 2015 Changes, bcm Changes, %
Qatar 17.9 19.9 2.0 11.0%
Algeria 10.7 9.6 -1.2 -11.4%
Nigeria 4.3 5.2 1.0 22.9%
Norway 1.7 2.2 0.5 28.0
Trinidad and Tobago 2.3 1.4 -0.9 -39.8%
Peru 0.9 1.1 0.2 -18.3%
Yemen 0.0 0.1 0.1
Oman 0.0 0.1 0.1
Equatorial Guinea 0.1 0.0 -0.1 -100.0%
Total 38.0 39.6 1.5 4.0%
Sources: Bloomberg, Estimates by Gazprom Export LLC

© ZMB 10
Hypothetical LNG Prices Based on Futures Prices: Full Costs of North American LNG are Higher than European Hub Prices
180
200
220
240
260
280
300
320
340
360
380
Sep
-15
Dec
-15
Mar
-16
Jun
-16
Sep
-16
Dec
-16
Mar
-17
Jun
-17
Sep
-17
Dec
-17
Mar
-18
Jun
-18
Sep
-18
Dec
-18
Mar
-19
Jun
-19
Sep
-19
Dec
-19
Mar
-20
Jun
-20
Sep
-20
Dec
-20
Mar
-21
Jun
-21
Sep
-21
Dec
-21
Mar
-22
Henry Hub-Based Cost-Plus Price Range NBP forward curve
$/mcm
Sources: Bloomberg, Wood McKenzie, Platts, PIRA * P = HH forwards * 115% + X, where X is cost of delivering to Europe
Full costs of US LNG delivered to Europe are higher than European hubs’ prices on a forward curve. Sales to Europe will not compensate full costs of the off-taker from the US LNG terminals.

28 93 162
176 0 0
223 223 223
37 121 213
151 192 237
241 185 89
Long Term European Natural Gas Consumption
According to consensus forecast for 2025 and 2035, demand could be 23% and 27% higher compared to 2014
11

28 93 162
176 0 0
223 223 223
37 121 213
151 192 237
241 185 89
Natural Gas European Demand and Production Gap
Due to falling indigenous production European demand for additional gas imports could be 149 bcm by 2025 and 195 bcm by 2035, according to consensus forecast 12

© ZMB 13
OECD Europe Power Generation Forecast by Type of Fuel
Source: IEA
0
100
200
300
400
500
600
700
800
2013 2020 2025 2030 2035
Other renewables
Bioenergy
Hydro
Nuclear
Gas
Oil
Coal
Mtoe
15,7% 17,9% 20,7%
21,9% 23,6%

© ZMB 14
OECD Europe Residential and Commercial Sector Energy Consumption Forecast by Type of Fuel
Source: IEA
0
100
200
300
400
500
600
2013 2020 2025 2030 2035
Other renewables
Bioenergy
Heat
Electricity
Gas
Oil
Coal
Mtoe
35,3% 35,5% 37,7%
35,7% 35,5%

© ZMB 15
OECD Europe Energy Consumption in Industry by
Type of Fuel
Source: IEA
0
50
100
150
200
250
300
350
2013 2020 2025 2030 2035
Other renewables
Bioenergy
Heat
Electricity
Gas
Oil
Coal
Mtoe
31,5% 28,5% 27,9%
27,3% 26,8%
© ZMB 16
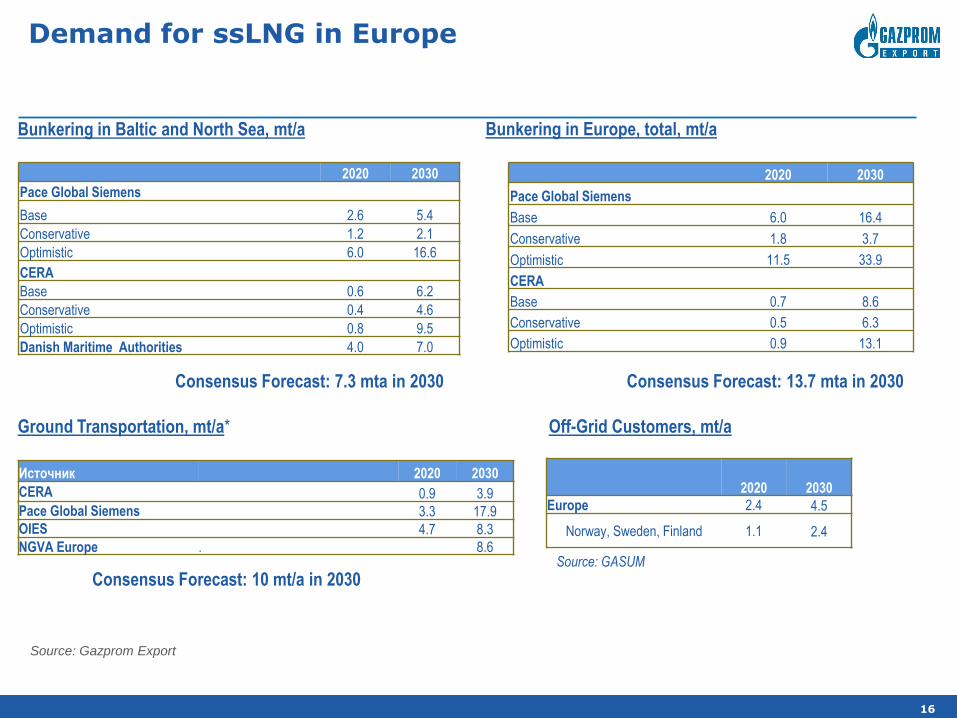
2020 2030
Pace Global Siemens
Base 2.6 5.4
Conservative 1.2 2.1
Optimistic 6.0 16.6
CERA
Base 0.6 6.2
Conservative 0.4 4.6
Optimistic 0.8 9.5
Danish Maritime Authorities 4.0 7.0
Bunkering in Baltic and North Sea, mt/a Bunkering in Europe, total, mt/a
2020 2030
Pace Global Siemens
Base 6.0 16.4
Conservative 1.8 3.7
Optimistic 11.5 33.9
CERA
Base 0.7 8.6
Conservative 0.5 6.3
Optimistic 0.9 13.1
Consensus Forecast: 7.3 mta in 2030 Consensus Forecast: 13.7 mta in 2030
Ground Transportation, mt/a*
Источник 2020 2030
CERA 0.9 3.9
Pace Global Siemens 3.3 17.9
OIES 4.7 8.3
NGVA Europe . 8.6
Demand for ssLNG in Europe
Consensus Forecast: 10 mt/a in 2030
2020 2030
Europe 2.4 4.5
Norway, Sweden, Finland 1.1 2.4
Off-Grid Customers, mt/a
Source: GASUM
Source: Gazprom Export

© ZMB 17
Schematic Hub-Price Behavior in Different Hybrid Pricing Models
100
150
200
250
300
350
400
Liquid Hubs
Oil-indexed LTC
Liquid Hubs
$/mcm
100
150
200
250
300
350
400
Illiquid Hubs
Oil-indexed LTC
Illiquid Hubs
$/mcm
The difference between the two hybrids is in liquidity of hubs measured by the
degree of financialization by the importers/intermediaries of their take-or-pay
obligations from the long-term oil-indexed contracts.
© ZMB 18
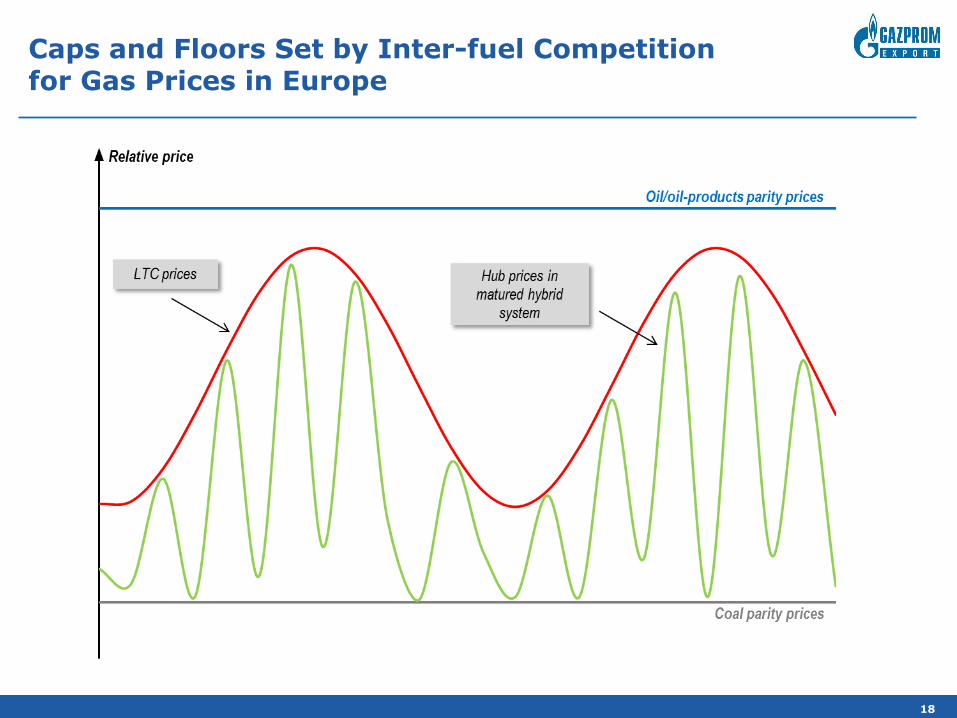
Caps and Floors Set by Inter-fuel Competition for Gas Prices in Europe

© ZMB 19
Caps and Floors Set by Inter-fuel Competition for Gas Prices (2)
© ZMB 20 20
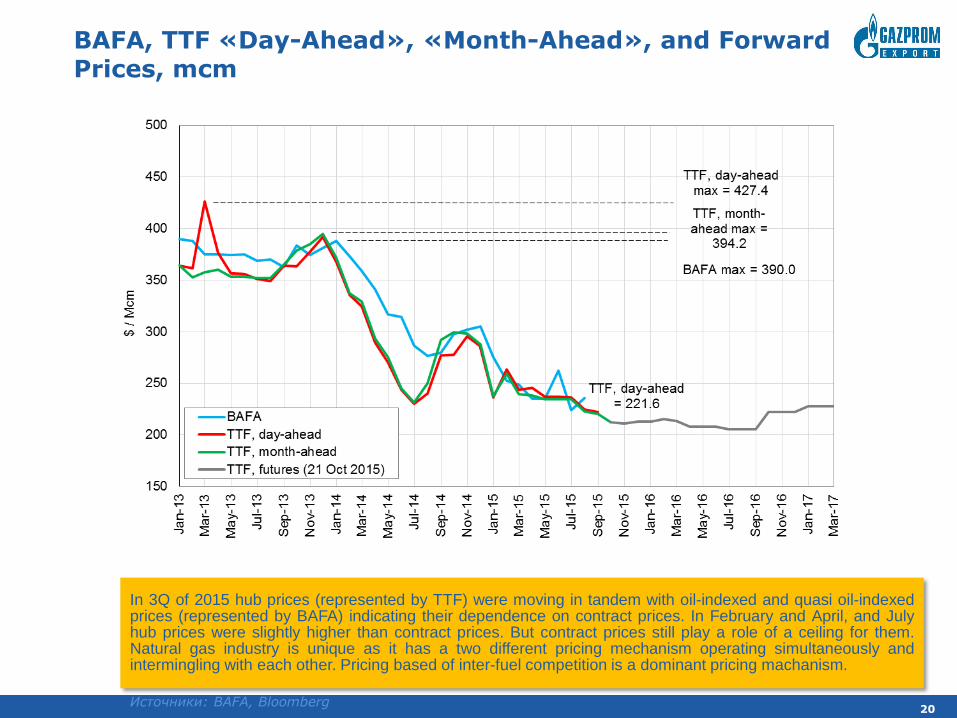
BAFA, TTF «Day-Ahead», «Month-Ahead», and Forward Prices, mcm
Источники: BAFA, Bloomberg
In 3Q of 2015 hub prices (represented by TTF) were moving in tandem with oil-indexed and quasi oil-indexed prices (represented by BAFA) indicating their dependence on contract prices. In February and April, and July hub prices were slightly higher than contract prices. But contract prices still play a role of a ceiling for them. Natural gas industry is unique as it has a two different pricing mechanism operating simultaneously and intermingling with each other. Pricing based of inter-fuel competition is a dominant pricing machanism.

© ZMB 21
Overblown Gas Demand Expectations in Europe in the Past Resulted in Market Overcontraction
Source: Purvin and Gerts 1998 Forecast for 2015, Gazprom Export calculations

© ZMB 22
There is Need to Rebalance Market by Eliminating Paper and Physical Gas Disconnect
Source: Gazprom Export
Midstreamers LTC Contracts
End-users
Hub
Year-ahead contract
Portfolio
optimization
Sell Q1 volume on
hubs under a
forward contract
that equals to
MAQ+
Buy back Q2
volume of paper
gas that equals to
physical demand
by the end-users
Under current market conditions:
Q1 > Q2

THANK YOU FOR YOUR ATTENTION!


![Energy Consumption and Greenhouse Gas Emissions 1998_ifa_marrakech_kongshaug[1]](https://img.pdfslide.net/doc/110x75/577d1e951a28ab4e1e8ecdc9/energy-consumption-and-greenhouse-gas-emissions-1998ifamarrakechkongshaug1.jpg)