Embed Size (px)
Citation preview
European Healthcare Sector
Post-summer prescription
September 2015
Generally smooth sailing through the recent market correction
Buying opportunities: Merck KGaA, Gerresheimer, Rhön Klinikum
DR. MARCUS WIEPRECHT
+49-69-78808 221 | [email protected] MARKUS GOLA
+49-69-78808-233 | [email protected]
For important disclosure information please see Appendix section at the end of this report.

2 / 44
This page is intentionally left blank.
11 SEPTEMBER 2015 3 / 44
For important disclosure information please see Appendix section at the end of this report
SECTOR REPORT
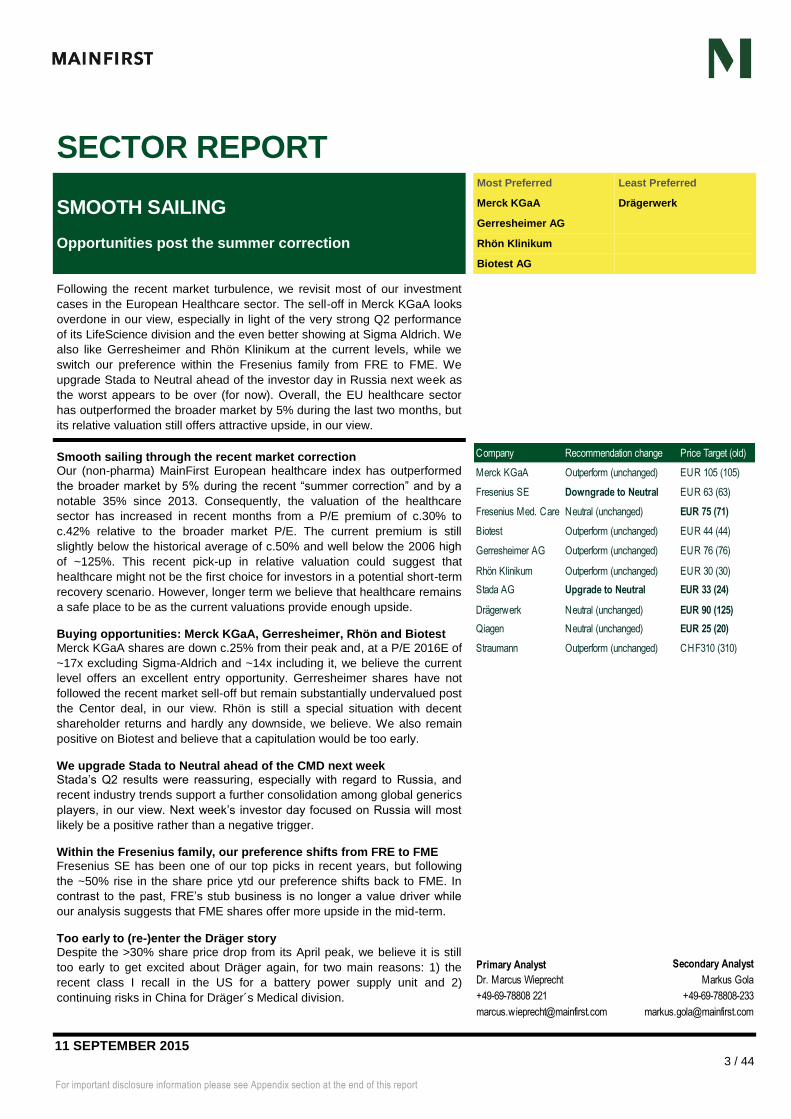
SMOOTH SAILING
Opportunities post the summer correction
Most Preferred Least Preferred
Merck KGaA Drägerwerk
Gerresheimer AG
Rhön Klinikum
Biotest AG
Following the recent market turbulence, we revisit most of our investment
cases in the European Healthcare sector. The sell-off in Merck KGaA looks
overdone in our view, especially in light of the very strong Q2 performance
of its LifeScience division and the even better showing at Sigma Aldrich. We
also like Gerresheimer and Rhön Klinikum at the current levels, while we
switch our preference within the Fresenius family from FRE to FME. We
upgrade Stada to Neutral ahead of the investor day in Russia next week as
the worst appears to be over (for now). Overall, the EU healthcare sector
has outperformed the broader market by 5% during the last two months, but
its relative valuation still offers attractive upside, in our view.
Smooth sailing through the recent market correction Our (non-pharma) MainFirst European healthcare index has outperformed
the broader market by 5% during the recent “summer correction” and by a
notable 35% since 2013. Consequently, the valuation of the healthcare
sector has increased in recent months from a P/E premium of c.30% to
c.42% relative to the broader market P/E. The current premium is still
slightly below the historical average of c.50% and well below the 2006 high
of ~125%. This recent pick-up in relative valuation could suggest that
healthcare might not be the first choice for investors in a potential short-term
recovery scenario. However, longer term we believe that healthcare remains
a safe place to be as the current valuations provide enough upside.
Buying opportunities: Merck KGaA, Gerresheimer, Rhön and Biotest
Merck KGaA shares are down c.25% from their peak and, at a P/E 2016E of
~17x excluding Sigma-Aldrich and ~14x including it, we believe the current
level offers an excellent entry opportunity. Gerresheimer shares have not
followed the recent market sell-off but remain substantially undervalued post
the Centor deal, in our view. Rhön is still a special situation with decent
shareholder returns and hardly any downside, we believe. We also remain
positive on Biotest and believe that a capitulation would be too early.
We upgrade Stada to Neutral ahead of the CMD next week Stada’s Q2 results were reassuring, especially with regard to Russia, and
recent industry trends support a further consolidation among global generics
players, in our view. Next week’s investor day focused on Russia will most
likely be a positive rather than a negative trigger.
Within the Fresenius family, our preference shifts from FRE to FME
Fresenius SE has been one of our top picks in recent years, but following
the ~50% rise in the share price ytd our preference shifts back to FME. In
contrast to the past, FRE’s stub business is no longer a value driver while
our analysis suggests that FME shares offer more upside in the mid-term.
Too early to (re-)enter the Dräger story Despite the >30% share price drop from its April peak, we believe it is still
too early to get excited about Dräger again, for two main reasons: 1) the
recent class I recall in the US for a battery power supply unit and 2)
continuing risks in China for Dräger´s Medical division.
Company Recommendation change Price Target (old)
Merck KGaA Outperform (unchanged) EUR 105 (105)
Fresenius SE Downgrade to Neutral EUR 63 (63)
Fresenius Med. Care Neutral (unchanged) EUR 75 (71)
Biotest Outperform (unchanged) EUR 44 (44)
Gerresheimer AG Outperform (unchanged) EUR 76 (76)
Rhön Klinikum Outperform (unchanged) EUR 30 (30)
Stada AG Upgrade to Neutral EUR 33 (24)
Drägerwerk Neutral (unchanged) EUR 90 (125)
Qiagen Neutral (unchanged) EUR 25 (20)
Straumann Outperform (unchanged) CHF310 (310)
Primary Analyst Secondary Analyst
Dr. Marcus Wieprecht Markus Gola
+49-69-78808 221 +49-69-78808-233
European Healthcare, 11 September 2015
4 / 44
Table of Contents
Bigger picture post the market correction.................................................................... 5 Healthcare outperformed during the recent market correction ..................................... 5 Relative sector valuation still below historical average ................................................. 5
Key takeaways for our universe .................................................................................... 7 Buying opportunities in Merck KGaA, Gerresheimer, Rhön and Biotest .................. 7
We upgrade Stada to Neutral ahead of the CMD next week ................................... 7
Within the Fresenius family, our preference shifts from FRE to FME ...................... 7
Too early to (re-)enter the Dräger story ................................................................... 7
Merck KGaA (MRK GY / MRCG.DE) ............................................................................... 9
Fresenius SE (FRE GY / FREG.DE) .............................................................................. 13
Fresenius Medical Care (FME GY / FMEG.DE) ............................................................ 15
Gerresheimer AG (GXI GY / GXIG.DE) ......................................................................... 17
Rhön Klinikum (RHK GY / RHKG.DE) .......................................................................... 19
Biotest AG (BIO3 GR / BIOG_p.DE) ............................................................................. 21
Stada AG (SAZ GY / STAGn.DE) .................................................................................. 23 This is why we turn less negative, but… .................................................................... 25 Q2 results painted a slightly better picture ................................................................. 25 Recent industry trends support further consolidation… .............................................. 25 …but major risks remain unchanged .......................................................................... 27 Balance sheet risks .................................................................................................... 27 Russian consumer and currency risks ....................................................................... 27 Valuation still attractive, even excluding FX adjustments ........................................... 28
Drägerwerk (DRW3 GR / DRW3.F) ............................................................................... 31
Qiagen (QIA GY / QGENF.DE) ...................................................................................... 33
Straumann (STMN SW / STMN.SW) ............................................................................. 35
Appendix: Regulatory Disclosures and Disclaimer ................................................... 37
European Healthcare, 11 September 2015
5 / 44
Bigger picture post the market correction
Healthcare outperformed during the recent market correction
The slowdown of emerging market economies and the unexpected currency moves in
China increased fears of a downturn in global GDP, leading to plummeting equities
around the world last month. Chinese equities in particular saw an extraordinary
meltdown. On 4th
September 2015, the Chinese central bank released a statement in
which Mr Zhou, the governor of the central bank, said that “the correction in the stock
market is almost done” and that the situation in China was back under control. Whether
this is in fact the case remains to be seen. In any event, we believe this is a good point in
time to take a closer look at our European healthcare universe and to identify investment
opportunities arising from the recent sell-off.
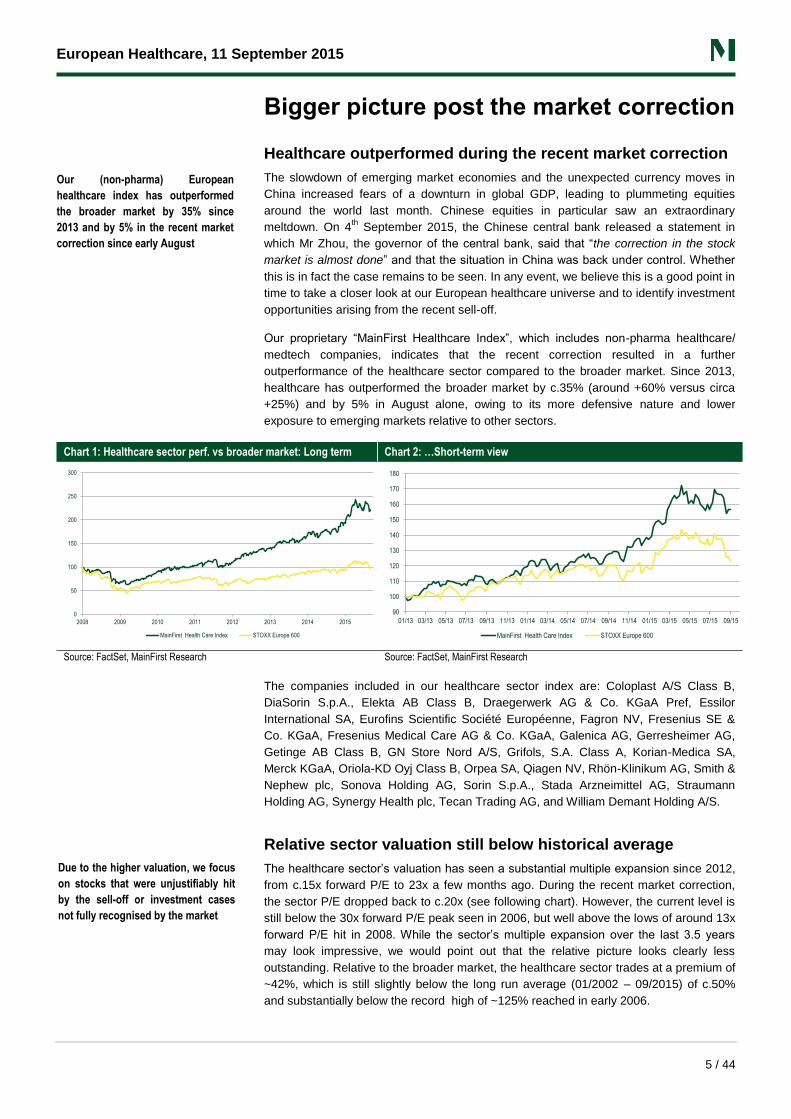
Our proprietary “MainFirst Healthcare Index”, which includes non-pharma healthcare/
medtech companies, indicates that the recent correction resulted in a further
outperformance of the healthcare sector compared to the broader market. Since 2013,
healthcare has outperformed the broader market by c.35% (around +60% versus circa
+25%) and by 5% in August alone, owing to its more defensive nature and lower
exposure to emerging markets relative to other sectors.
Chart 1: Healthcare sector perf. vs broader market: Long term Chart 2: …Short-term view
Source: FactSet, MainFirst Research Source: FactSet, MainFirst Research
The companies included in our healthcare sector index are: Coloplast A/S Class B,
DiaSorin S.p.A., Elekta AB Class B, Draegerwerk AG & Co. KGaA Pref, Essilor
International SA, Eurofins Scientific Société Européenne, Fagron NV, Fresenius SE &
Co. KGaA, Fresenius Medical Care AG & Co. KGaA, Galenica AG, Gerresheimer AG,
Getinge AB Class B, GN Store Nord A/S, Grifols, S.A. Class A, Korian-Medica SA,
Merck KGaA, Oriola-KD Oyj Class B, Orpea SA, Qiagen NV, Rhön-Klinikum AG, Smith &
Nephew plc, Sonova Holding AG, Sorin S.p.A., Stada Arzneimittel AG, Straumann
Holding AG, Synergy Health plc, Tecan Trading AG, and William Demant Holding A/S.
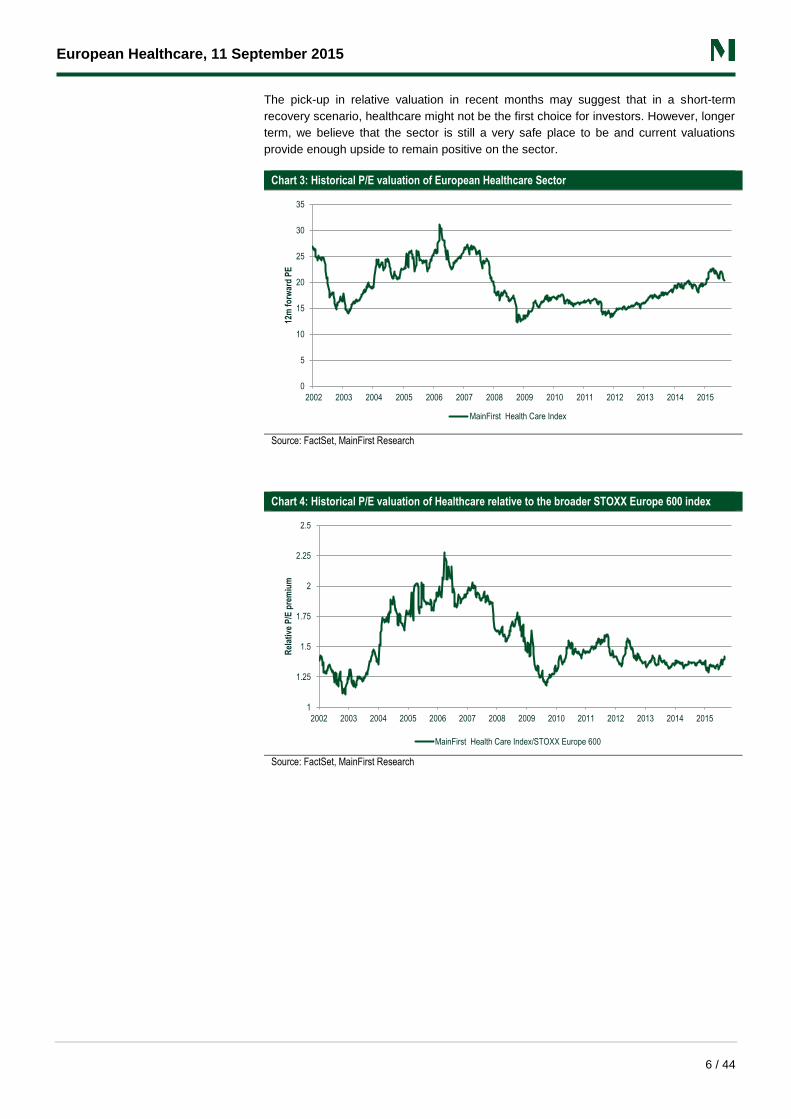
Relative sector valuation still below historical average
The healthcare sector’s valuation has seen a substantial multiple expansion since 2012,
from c.15x forward P/E to 23x a few months ago. During the recent market correction,
the sector P/E dropped back to c.20x (see following chart). However, the current level is
still below the 30x forward P/E peak seen in 2006, but well above the lows of around 13x
forward P/E hit in 2008. While the sector’s multiple expansion over the last 3.5 years
may look impressive, we would point out that the relative picture looks clearly less
outstanding. Relative to the broader market, the healthcare sector trades at a premium of
~42%, which is still slightly below the long run average (01/2002 – 09/2015) of c.50%
and substantially below the record high of ~125% reached in early 2006.
0
50
100
150
200
250
300
2008 2009 2010 2011 2012 2013 2014 2015
MainFirst Health Care Index STOXX Europe 600
90
100
110
120
130
140
150
160
170
180
01/13 03/13 05/13 07/13 09/13 11/13 01/14 03/14 05/14 07/14 09/14 11/14 01/15 03/15 05/15 07/15 09/15
MainFirst Health Care Index STOXX Europe 600
Our (non-pharma) European
healthcare index has outperformed
the broader market by 35% since
2013 and by 5% in the recent market
correction since early August
Due to the higher valuation, we focus
on stocks that were unjustifiably hit
by the sell-off or investment cases
not fully recognised by the market
European Healthcare, 11 September 2015
6 / 44
The pick-up in relative valuation in recent months may suggest that in a short-term
recovery scenario, healthcare might not be the first choice for investors. However, longer
term, we believe that the sector is still a very safe place to be and current valuations
provide enough upside to remain positive on the sector.
Chart 3: Historical P/E valuation of European Healthcare Sector
Source: FactSet, MainFirst Research
Chart 4: Historical P/E valuation of Healthcare relative to the broader STOXX Europe 600 index
Source: FactSet, MainFirst Research
0
5
10
15
20
25
30
35
2002 2003 2004 2005 2006 2007 2008 2009 2010 2011 2012 2013 2014 2015
12m
fo
rwar
d P
E
MainFirst Health Care Index
1
1.25
1.5
1.75
2
2.25
2.5
2002 2003 2004 2005 2006 2007 2008 2009 2010 2011 2012 2013 2014 2015
Rel
ativ
e P
/E p
rem
ium
MainFirst Health Care Index/STOXX Europe 600
European Healthcare, 11 September 2015
7 / 44
Key takeaways for our universe
Buying opportunities in Merck KGaA, Gerresheimer, Rhön and Biotest
Merck KGaA shares have dropped c.25% from their peak and at a P/E 2016E of ~17x
excluding Sigma Aldrich and ~14x including the latter, we believe the current level offers
an excellent entry opportunity. Gerresheimer shares have not followed the recent market
sell-off but remain substantially undervalued post the Centor deal, in our view. Rhön is
still a special situation with decent shareholder returns, where we see hardly any
downside. We remain positive on Biotest and believe that a capitulation would be too
early.
We upgrade Stada to Neutral ahead of the CMD next week
Stada’s Q2 results were reassuring, especially with regard to Russia, and recent industry
trends support further consolidation among global generics players. Next week’s investor
day focused on Russia will most likely be a positive rather than a negative trigger.
Within the Fresenius family, our preference shifts from FRE to FME
Fresenius SE has been one of our top picks for the last few years, but following the
~50% rise in the share price ytd our preference shifts back to Fresenius Medical Care. In
contrast to the past, FRE’s stub business is no longer a value driver while our analysis
suggests that FME shares offer more upside in the mid-term.
Too early to (re-)enter the Dräger story
Despite the >30% share price drop from its April peak, we believe it is still too early to
get excited about Dräger again for two main reasons: 1) the recent class I recall in the
US for a battery power supply unit and 2) continuing risks in China for Dräger´s Medical
division.
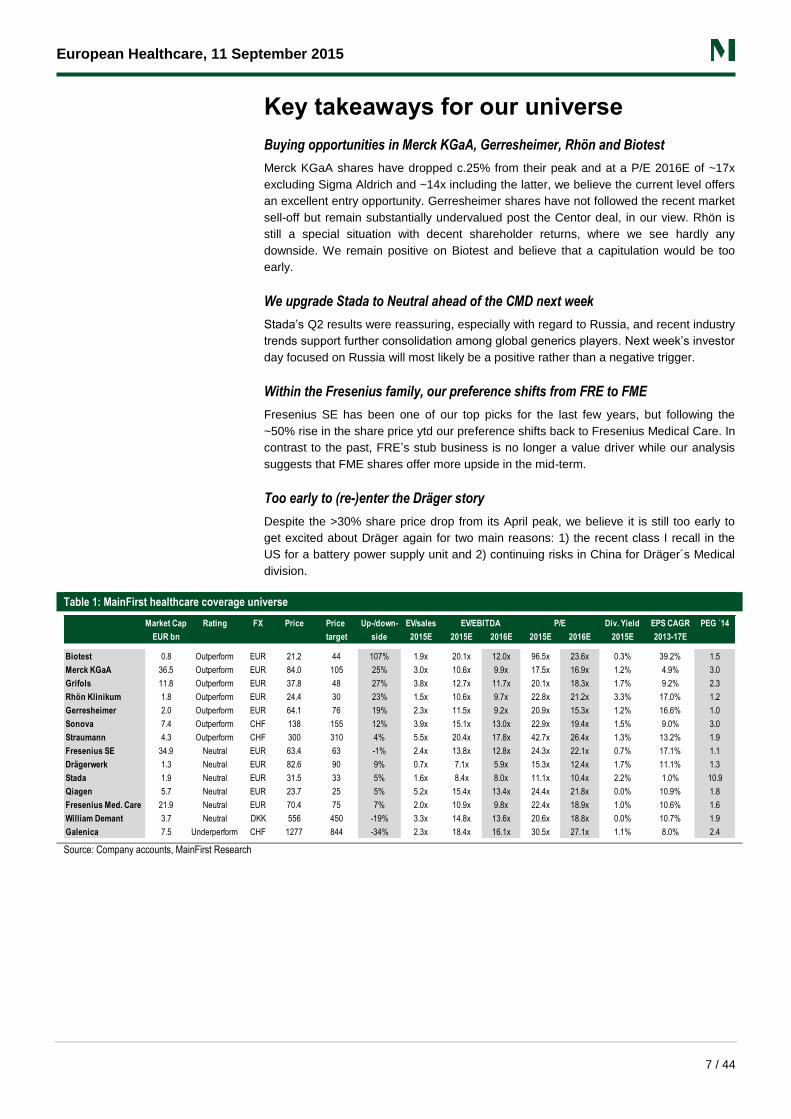
Table 1: MainFirst healthcare coverage universe
Source: Company accounts, MainFirst Research
Market Cap Rating FX Price Price Up-/down- EV/sales Div. Yield EPS CAGR PEG ´14
EUR bn target side 2015E 2015E 2016E 2015E 2016E 2015E 2013-17E
Biotest 0.8 Outperform EUR 21.2 44 107% 1.9x 20.1x 12.0x 96.5x 23.6x 0.3% 39.2% 1.5
Merck KGaA 36.5 Outperform EUR 84.0 105 25% 3.0x 10.6x 9.9x 17.5x 16.9x 1.2% 4.9% 3.0
Grifols 11.8 Outperform EUR 37.8 48 27% 3.8x 12.7x 11.7x 20.1x 18.3x 1.7% 9.2% 2.3
Rhön Klinikum 1.8 Outperform EUR 24.4 30 23% 1.5x 10.6x 9.7x 22.8x 21.2x 3.3% 17.0% 1.2
Gerresheimer 2.0 Outperform EUR 64.1 76 19% 2.3x 11.5x 9.2x 20.9x 15.3x 1.2% 16.6% 1.0
Sonova 7.4 Outperform CHF 138 155 12% 3.9x 15.1x 13.0x 22.9x 19.4x 1.5% 9.0% 3.0
Straumann 4.3 Outperform CHF 300 310 4% 5.5x 20.4x 17.8x 42.7x 26.4x 1.3% 13.2% 1.9
Fresenius SE 34.9 Neutral EUR 63.4 63 -1% 2.4x 13.8x 12.8x 24.3x 22.1x 0.7% 17.1% 1.1
Drägerwerk 1.3 Neutral EUR 82.6 90 9% 0.7x 7.1x 5.9x 15.3x 12.4x 1.7% 11.1% 1.3
Stada 1.9 Neutral EUR 31.5 33 5% 1.6x 8.4x 8.0x 11.1x 10.4x 2.2% 1.0% 10.9
Qiagen 5.7 Neutral EUR 23.7 25 5% 5.2x 15.4x 13.4x 24.4x 21.8x 0.0% 10.9% 1.8
Fresenius Med. Care 21.9 Neutral EUR 70.4 75 7% 2.0x 10.9x 9.8x 22.4x 18.9x 1.0% 10.6% 1.6
William Demant 3.7 Neutral DKK 556 450 -19% 3.3x 14.8x 13.6x 20.6x 18.8x 0.0% 10.7% 1.9
Galenica 7.5 Underperform CHF 1277 844 -34% 2.3x 18.4x 16.1x 30.5x 27.1x 1.1% 8.0% 2.4
EV/EBITDA P/E
European Healthcare, 11 September 2015
8 / 44
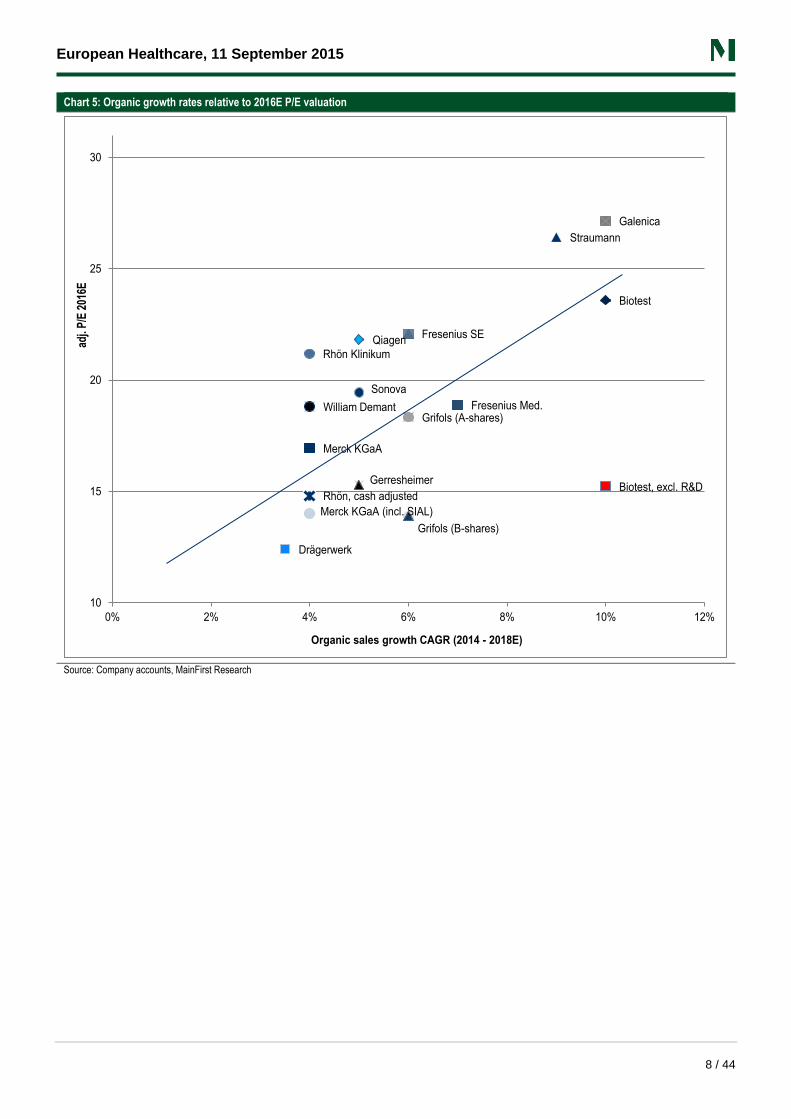
Chart 5: Organic growth rates relative to 2016E P/E valuation
Source: Company accounts, MainFirst Research
Biotest
Biotest, excl. R&D
Fresenius Med.
Fresenius SE
Galenica
Gerresheimer
Grifols (A-shares)
Grifols (B-shares)
Merck KGaA
Qiagen
Rhön Klinikum
Straumann
William Demant
Rhön, cash adjusted
Sonova
Drägerwerk
Merck KGaA (incl. SIAL)
10
15
20
25
30
0% 2% 4% 6% 8% 10% 12%
adj.
P/E
201
6E
Organic sales growth CAGR (2014 - 2018E)
European Healthcare, 11 September 2015
11 SEPTEMBER 2015 9 / 44
For important disclosure information please see Appendix section at the end of this report
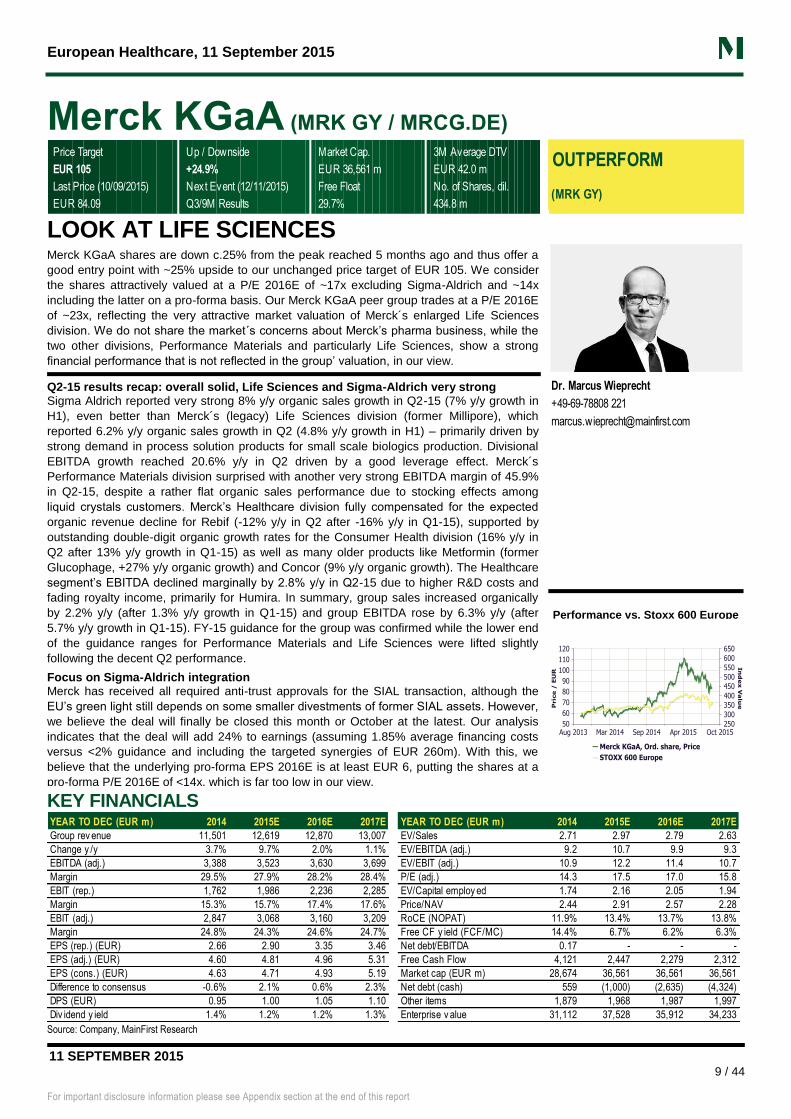
Merck KGaA (MRK GY / MRCG.DE)
Price Target Up / Downside Market Cap. 3M Average DTV
EUR 105 +24.9% EUR 36,561 m EUR 42.0 m
Last Price (10/09/2015) Next Event (12/11/2015) Free Float No. of Shares, dil.
EUR 84.09 Q3/9M Results 29.7% 434.8 m
OUTPERFORM
(MRK GY)
LOOK AT LIFE SCIENCES Merck KGaA shares are down c.25% from the peak reached 5 months ago and thus offer a
good entry point with ~25% upside to our unchanged price target of EUR 105. We consider
the shares attractively valued at a P/E 2016E of ~17x excluding Sigma-Aldrich and ~14x
including the latter on a pro-forma basis. Our Merck KGaA peer group trades at a P/E 2016E
of ~23x, reflecting the very attractive market valuation of Merck´s enlarged Life Sciences
division. We do not share the market´s concerns about Merck’s pharma business, while the
two other divisions, Performance Materials and particularly Life Sciences, show a strong
financial performance that is not reflected in the group’ valuation, in our view.
Q2-15 results recap: overall solid, Life Sciences and Sigma-Aldrich very strong Sigma Aldrich reported very strong 8% y/y organic sales growth in Q2-15 (7% y/y growth in
H1), even better than Merck´s (legacy) Life Sciences division (former Millipore), which
reported 6.2% y/y organic sales growth in Q2 (4.8% y/y growth in H1) – primarily driven by
strong demand in process solution products for small scale biologics production. Divisional
EBITDA growth reached 20.6% y/y in Q2 driven by a good leverage effect. Merck´s
Performance Materials division surprised with another very strong EBITDA margin of 45.9%
in Q2-15, despite a rather flat organic sales performance due to stocking effects among
liquid crystals customers. Merck’s Healthcare division fully compensated for the expected
organic revenue decline for Rebif (-12% y/y in Q2 after -16% y/y in Q1-15), supported by
outstanding double-digit organic growth rates for the Consumer Health division (16% y/y in
Q2 after 13% y/y growth in Q1-15) as well as many older products like Metformin (former
Glucophage, +27% y/y organic growth) and Concor (9% y/y organic growth). The Healthcare
segment’s EBITDA declined marginally by 2.8% y/y in Q2-15 due to higher R&D costs and
fading royalty income, primarily for Humira. In summary, group sales increased organically
by 2.2% y/y (after 1.3% y/y growth in Q1-15) and group EBITDA rose by 6.3% y/y (after
5.7% y/y growth in Q1-15). FY-15 guidance for the group was confirmed while the lower end
of the guidance ranges for Performance Materials and Life Sciences were lifted slightly
following the decent Q2 performance.
Focus on Sigma-Aldrich integration Merck has received all required anti-trust approvals for the SIAL transaction, although the
EU’s green light still depends on some smaller divestments of former SIAL assets. However,
we believe the deal will finally be closed this month or October at the latest. Our analysis
indicates that the deal will add 24% to earnings (assuming 1.85% average financing costs
versus <2% guidance and including the targeted synergies of EUR 260m). With this, we
believe that the underlying pro-forma EPS 2016E is at least EUR 6, putting the shares at a
pro-forma P/E 2016E of <14x, which is far too low in our view.
Dr. Marcus Wieprecht
+49-69-78808 221
Performance vs. Stoxx 600 Europe
KEY FINANCIALS
Source: Company, MainFirst Research
YEAR TO DEC (EUR m) 2014 2015E 2016E 2017E YEAR TO DEC (EUR m) 2014 2015E 2016E 2017E
Group rev enue 11,501 12,619 12,870 13,007 EV/Sales 2.71 2.97 2.79 2.63
Change y /y 3.7% 9.7% 2.0% 1.1% EV/EBITDA (adj.) 9.2 10.7 9.9 9.3
EBITDA (adj.) 3,388 3,523 3,630 3,699 EV/EBIT (adj.) 10.9 12.2 11.4 10.7
Margin 29.5% 27.9% 28.2% 28.4% P/E (adj.) 14.3 17.5 17.0 15.8
EBIT (rep.) 1,762 1,986 2,236 2,285 EV/Capital employ ed 1.74 2.16 2.05 1.94
Margin 15.3% 15.7% 17.4% 17.6% Price/NAV 2.44 2.91 2.57 2.28
EBIT (adj.) 2,847 3,068 3,160 3,209 RoCE (NOPAT) 11.9% 13.4% 13.7% 13.8%
Margin 24.8% 24.3% 24.6% 24.7% Free CF y ield (FCF/MC) 14.4% 6.7% 6.2% 6.3%
EPS (rep.) (EUR) 2.66 2.90 3.35 3.46 Net debt/EBITDA 0.17 - - -
EPS (adj.) (EUR) 4.60 4.81 4.96 5.31 Free Cash Flow 4,121 2,447 2,279 2,312
EPS (cons.) (EUR) 4.63 4.71 4.93 5.19 Market cap (EUR m) 28,674 36,561 36,561 36,561
Difference to consensus -0.6% 2.1% 0.6% 2.3% Net debt (cash) 559 (1,000) (2,635) (4,324)
DPS (EUR) 0.95 1.00 1.05 1.10 Other items 1,879 1,968 1,987 1,997
Div idend y ield 1.4% 1.2% 1.2% 1.3% Enterprise v alue 31,112 37,528 35,912 34,233
European Healthcare, 11 September 2015
11 SEPTEMBER 2015 10 / 44
For important disclosure information please see Appendix section at the end of this report
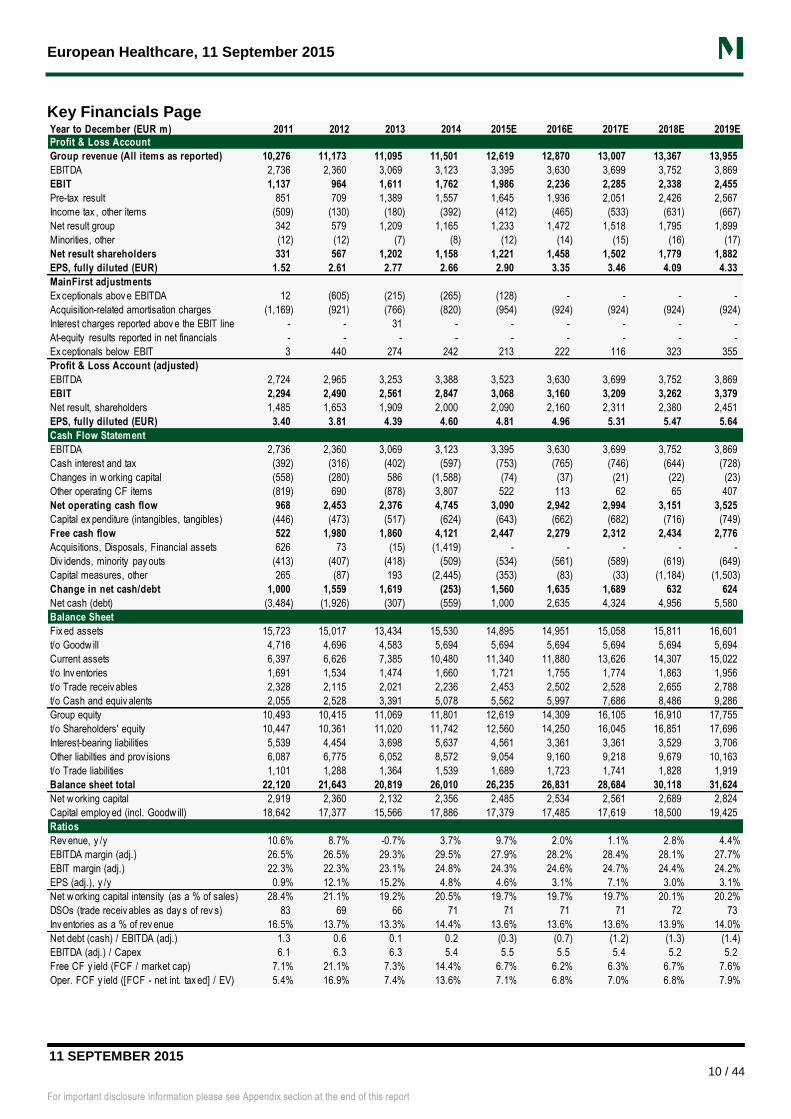
Key Financials Page
Year to December (EUR m) 2011 2012 2013 2014 2015E 2016E 2017E 2018E 2019E
Profit & Loss Account
Group revenue (All items as reported) 10,276 11,173 11,095 11,501 12,619 12,870 13,007 13,367 13,955
EBITDA 2,736 2,360 3,069 3,123 3,395 3,630 3,699 3,752 3,869
EBIT 1,137 964 1,611 1,762 1,986 2,236 2,285 2,338 2,455
Pre-tax result 851 709 1,389 1,557 1,645 1,936 2,051 2,426 2,567
Income tax , other items (509) (130) (180) (392) (412) (465) (533) (631) (667)
Net result group 342 579 1,209 1,165 1,233 1,472 1,518 1,795 1,899
Minorities, other (12) (12) (7) (8) (12) (14) (15) (16) (17)
Net result shareholders 331 567 1,202 1,158 1,221 1,458 1,502 1,779 1,882
EPS, fully diluted (EUR) 1.52 2.61 2.77 2.66 2.90 3.35 3.46 4.09 4.33
MainFirst adjustments
Ex ceptionals abov e EBITDA 12 (605) (215) (265) (128) - - - -
Acquisition-related amortisation charges (1,169) (921) (766) (820) (954) (924) (924) (924) (924)
Interest charges reported abov e the EBIT line - - 31 - - - - - -
At-equity results reported in net financials - - - - - - - - -
Ex ceptionals below EBIT 3 440 274 242 213 222 116 323 355
Profit & Loss Account (adjusted)
EBITDA 2,724 2,965 3,253 3,388 3,523 3,630 3,699 3,752 3,869
EBIT 2,294 2,490 2,561 2,847 3,068 3,160 3,209 3,262 3,379
Net result, shareholders 1,485 1,653 1,909 2,000 2,090 2,160 2,311 2,380 2,451
EPS, fully diluted (EUR) 3.40 3.81 4.39 4.60 4.81 4.96 5.31 5.47 5.64
Cash Flow Statement
EBITDA 2,736 2,360 3,069 3,123 3,395 3,630 3,699 3,752 3,869
Cash interest and tax (392) (316) (402) (597) (753) (765) (746) (644) (728)
Changes in w orking capital (558) (280) 586 (1,588) (74) (37) (21) (22) (23)
Other operating CF items (819) 690 (878) 3,807 522 113 62 65 407
Net operating cash flow 968 2,453 2,376 4,745 3,090 2,942 2,994 3,151 3,525
Capital ex penditure (intangibles, tangibles) (446) (473) (517) (624) (643) (662) (682) (716) (749)
Free cash flow 522 1,980 1,860 4,121 2,447 2,279 2,312 2,434 2,776
Acquisitions, Disposals, Financial assets 626 73 (15) (1,419) - - - - -
Div idends, minority pay outs (413) (407) (418) (509) (534) (561) (589) (619) (649)
Capital measures, other 265 (87) 193 (2,445) (353) (83) (33) (1,184) (1,503)
Change in net cash/debt 1,000 1,559 1,619 (253) 1,560 1,635 1,689 632 624
Net cash (debt) (3,484) (1,926) (307) (559) 1,000 2,635 4,324 4,956 5,580
Balance Sheet
Fix ed assets 15,723 15,017 13,434 15,530 14,895 14,951 15,058 15,811 16,601
t/o Goodw ill 4,716 4,696 4,583 5,694 5,694 5,694 5,694 5,694 5,694
Current assets 6,397 6,626 7,385 10,480 11,340 11,880 13,626 14,307 15,022
t/o Inv entories 1,691 1,534 1,474 1,660 1,721 1,755 1,774 1,863 1,956
t/o Trade receiv ables 2,328 2,115 2,021 2,236 2,453 2,502 2,528 2,655 2,788
t/o Cash and equiv alents 2,055 2,528 3,391 5,078 5,562 5,997 7,686 8,486 9,286
Group equity 10,493 10,415 11,069 11,801 12,619 14,309 16,105 16,910 17,755
t/o Shareholders' equity 10,447 10,361 11,020 11,742 12,560 14,250 16,045 16,851 17,696
Interest-bearing liabilities 5,539 4,454 3,698 5,637 4,561 3,361 3,361 3,529 3,706
Other liabilties and prov isions 6,087 6,775 6,052 8,572 9,054 9,160 9,218 9,679 10,163
t/o Trade liabilities 1,101 1,288 1,364 1,539 1,689 1,723 1,741 1,828 1,919
Balance sheet total 22,120 21,643 20,819 26,010 26,235 26,831 28,684 30,118 31,624
Net w orking capital 2,919 2,360 2,132 2,356 2,485 2,534 2,561 2,689 2,824
Capital employ ed (incl. Goodw ill) 18,642 17,377 15,566 17,886 17,379 17,485 17,619 18,500 19,425
Ratios
Rev enue, y /y 10.6% 8.7% -0.7% 3.7% 9.7% 2.0% 1.1% 2.8% 4.4%
EBITDA margin (adj.) 26.5% 26.5% 29.3% 29.5% 27.9% 28.2% 28.4% 28.1% 27.7%
EBIT margin (adj.) 22.3% 22.3% 23.1% 24.8% 24.3% 24.6% 24.7% 24.4% 24.2%
EPS (adj.), y /y 0.9% 12.1% 15.2% 4.8% 4.6% 3.1% 7.1% 3.0% 3.1%
Net w orking capital intensity (as a % of sales) 28.4% 21.1% 19.2% 20.5% 19.7% 19.7% 19.7% 20.1% 20.2%
DSOs (trade receiv ables as day s of rev s) 83 69 66 71 71 71 71 72 73
Inv entories as a % of rev enue 16.5% 13.7% 13.3% 14.4% 13.6% 13.6% 13.6% 13.9% 14.0%
Net debt (cash) / EBITDA (adj.) 1.3 0.6 0.1 0.2 (0.3) (0.7) (1.2) (1.3) (1.4)
EBITDA (adj.) / Capex 6.1 6.3 6.3 5.4 5.5 5.5 5.4 5.2 5.2
Free CF y ield (FCF / market cap) 7.1% 21.1% 7.3% 14.4% 6.7% 6.2% 6.3% 6.7% 7.6%
Oper. FCF y ield ([FCF - net int. tax ed] / EV) 5.4% 16.9% 7.4% 13.6% 7.1% 6.8% 7.0% 6.8% 7.9%
European Healthcare, 11 September 2015
11 / 44
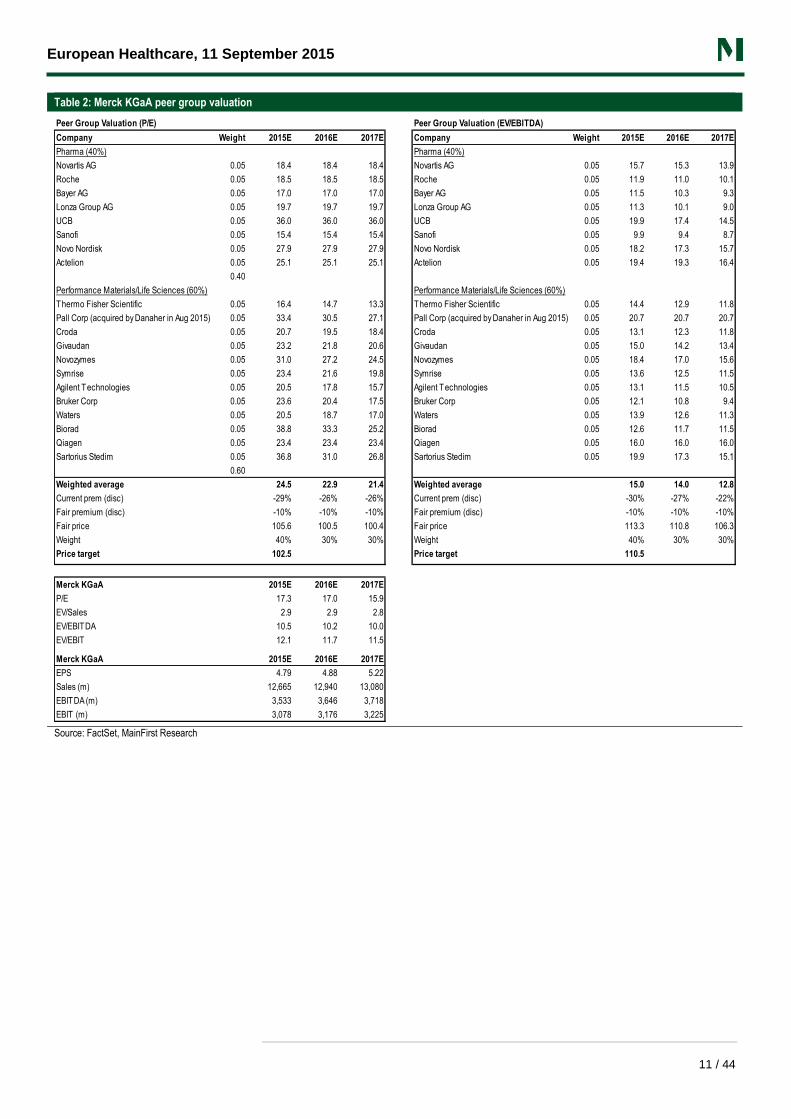
Table 2: Merck KGaA peer group valuation
Source: FactSet, MainFirst Research
Peer Group Valuation (P/E) Peer Group Valuation (EV/EBITDA)
Company Weight 2015E 2016E 2017E Company Weight 2015E 2016E 2017E
Pharma (40%) Pharma (40%)
Novartis AG 0.05 18.4 18.4 18.4 Novartis AG 0.05 15.7 15.3 13.9
Roche 0.05 18.5 18.5 18.5 Roche 0.05 11.9 11.0 10.1
Bayer AG 0.05 17.0 17.0 17.0 Bayer AG 0.05 11.5 10.3 9.3
Lonza Group AG 0.05 19.7 19.7 19.7 Lonza Group AG 0.05 11.3 10.1 9.0
UCB 0.05 36.0 36.0 36.0 UCB 0.05 19.9 17.4 14.5
Sanofi 0.05 15.4 15.4 15.4 Sanofi 0.05 9.9 9.4 8.7
Novo Nordisk 0.05 27.9 27.9 27.9 Novo Nordisk 0.05 18.2 17.3 15.7
Actelion 0.05 25.1 25.1 25.1 Actelion 0.05 19.4 19.3 16.4
0.40
Performance Materials/Life Sciences (60%) Performance Materials/Life Sciences (60%)
Thermo Fisher Scientific 0.05 16.4 14.7 13.3 Thermo Fisher Scientific 0.05 14.4 12.9 11.8
Pall Corp (acquired by Danaher in Aug 2015) 0.05 33.4 30.5 27.1 Pall Corp (acquired by Danaher in Aug 2015) 0.05 20.7 20.7 20.7
Croda 0.05 20.7 19.5 18.4 Croda 0.05 13.1 12.3 11.8
Givaudan 0.05 23.2 21.8 20.6 Givaudan 0.05 15.0 14.2 13.4
Novozymes 0.05 31.0 27.2 24.5 Novozymes 0.05 18.4 17.0 15.6
Symrise 0.05 23.4 21.6 19.8 Symrise 0.05 13.6 12.5 11.5
Agilent Technologies 0.05 20.5 17.8 15.7 Agilent Technologies 0.05 13.1 11.5 10.5
Bruker Corp 0.05 23.6 20.4 17.5 Bruker Corp 0.05 12.1 10.8 9.4
Waters 0.05 20.5 18.7 17.0 Waters 0.05 13.9 12.6 11.3
Biorad 0.05 38.8 33.3 25.2 Biorad 0.05 12.6 11.7 11.5
Qiagen 0.05 23.4 23.4 23.4 Qiagen 0.05 16.0 16.0 16.0
Sartorius Stedim 0.05 36.8 31.0 26.8 Sartorius Stedim 0.05 19.9 17.3 15.1
0.60
Weighted average 24.5 22.9 21.4 Weighted average 15.0 14.0 12.8
Current prem (disc) -29% -26% -26% Current prem (disc) -30% -27% -22%
Fair premium (disc) -10% -10% -10% Fair premium (disc) -10% -10% -10%
Fair price 105.6 100.5 100.4 Fair price 113.3 110.8 106.3
Weight 40% 30% 30% Weight 40% 30% 30%
Price target 102.5 Price target 110.5
Merck KGaA 2015E 2016E 2017E
P/E 17.3 17.0 15.9
EV/Sales 2.9 2.9 2.8
EV/EBITDA 10.5 10.2 10.0
EV/EBIT 12.1 11.7 11.5
Merck KGaA 2015E 2016E 2017E
EPS 4.79 4.88 5.22
Sales (m) 12,665 12,940 13,080
EBITDA (m) 3,533 3,646 3,718
EBIT (m) 3,078 3,176 3,225
European Healthcare, 11 September 2015
12 / 44
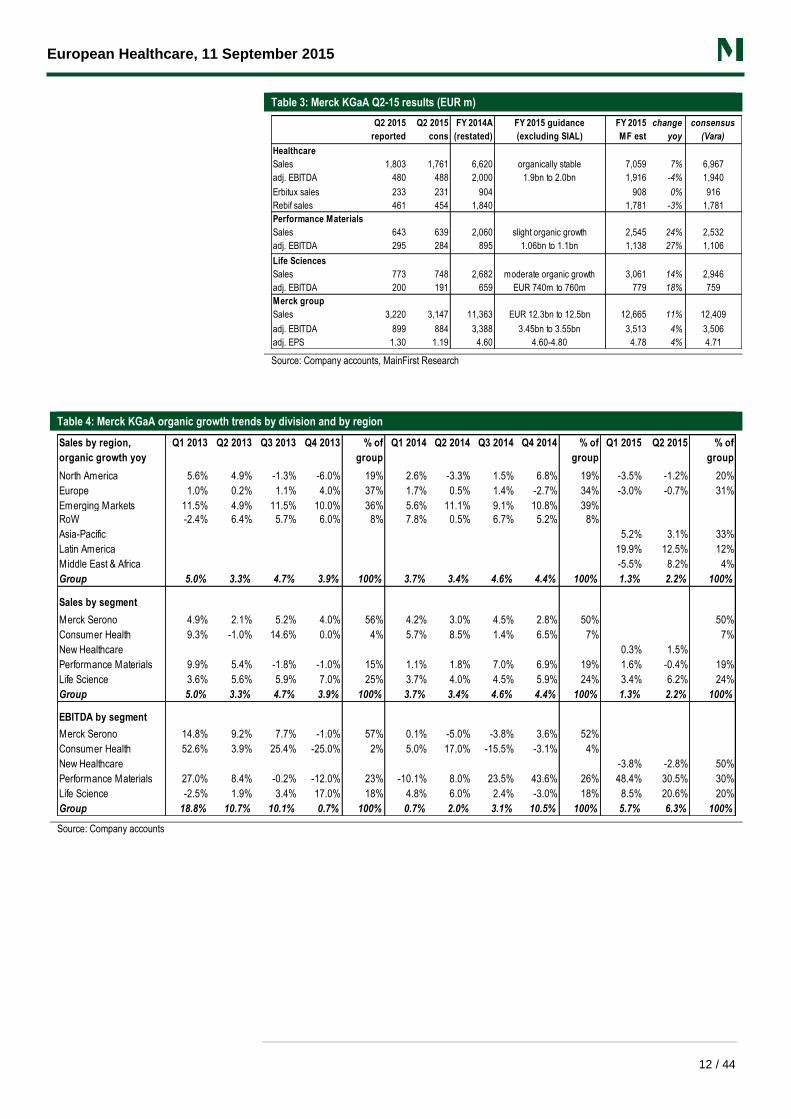
Table 3: Merck KGaA Q2-15 results (EUR m)
Source: Company accounts, MainFirst Research
Table 4: Merck KGaA organic growth trends by division and by region
Source: Company accounts
Q2 2015
reported
Q2 2015
cons
FY 2014A
(restated)
FY 2015 guidance
(excluding SIAL)
FY 2015
MF est
change
yoy
consensus
(Vara)
Healthcare
Sales 1,803 1,761 6,620 organically stable 7,059 7% 6,967
adj. EBITDA 480 488 2,000 1.9bn to 2.0bn 1,916 -4% 1,940
Erbitux sales 233 231 904 908 0% 916
Rebif sales 461 454 1,840 1,781 -3% 1,781
Performance Materials
Sales 643 639 2,060 slight organic growth 2,545 24% 2,532
adj. EBITDA 295 284 895 1.06bn to 1.1bn 1,138 27% 1,106
Life Sciences
Sales 773 748 2,682 moderate organic growth 3,061 14% 2,946
adj. EBITDA 200 191 659 EUR 740m to 760m 779 18% 759
Merck group
Sales 3,220 3,147 11,363 EUR 12.3bn to 12.5bn 12,665 11% 12,409
adj. EBITDA 899 884 3,388 3.45bn to 3.55bn 3,513 4% 3,506
adj. EPS 1.30 1.19 4.60 4.60-4.80 4.78 4% 4.71
Sales by region,
organic growth yoy
Q1 2013 Q2 2013 Q3 2013 Q4 2013 % of
group
Q1 2014 Q2 2014 Q3 2014 Q4 2014 % of
group
Q1 2015 Q2 2015 % of
group
North America 5.6% 4.9% -1.3% -6.0% 19% 2.6% -3.3% 1.5% 6.8% 19% -3.5% -1.2% 20%
Europe 1.0% 0.2% 1.1% 4.0% 37% 1.7% 0.5% 1.4% -2.7% 34% -3.0% -0.7% 31%
Emerging Markets 11.5% 4.9% 11.5% 10.0% 36% 5.6% 11.1% 9.1% 10.8% 39%
RoW -2.4% 6.4% 5.7% 6.0% 8% 7.8% 0.5% 6.7% 5.2% 8%
Asia-Pacific 5.2% 3.1% 33%
Latin America 19.9% 12.5% 12%
Middle East & Africa -5.5% 8.2% 4%
Group 5.0% 3.3% 4.7% 3.9% 100% 3.7% 3.4% 4.6% 4.4% 100% 1.3% 2.2% 100%
Sales by segment
Merck Serono 4.9% 2.1% 5.2% 4.0% 56% 4.2% 3.0% 4.5% 2.8% 50% 50%
Consumer Health 9.3% -1.0% 14.6% 0.0% 4% 5.7% 8.5% 1.4% 6.5% 7% 7%
New Healthcare 0.3% 1.5%
Performance Materials 9.9% 5.4% -1.8% -1.0% 15% 1.1% 1.8% 7.0% 6.9% 19% 1.6% -0.4% 19%
Life Science 3.6% 5.6% 5.9% 7.0% 25% 3.7% 4.0% 4.5% 5.9% 24% 3.4% 6.2% 24%
Group 5.0% 3.3% 4.7% 3.9% 100% 3.7% 3.4% 4.6% 4.4% 100% 1.3% 2.2% 100%
EBITDA by segment
Merck Serono 14.8% 9.2% 7.7% -1.0% 57% 0.1% -5.0% -3.8% 3.6% 52%
Consumer Health 52.6% 3.9% 25.4% -25.0% 2% 5.0% 17.0% -15.5% -3.1% 4%
New Healthcare -3.8% -2.8% 50%
Performance Materials 27.0% 8.4% -0.2% -12.0% 23% -10.1% 8.0% 23.5% 43.6% 26% 48.4% 30.5% 30%
Life Science -2.5% 1.9% 3.4% 17.0% 18% 4.8% 6.0% 2.4% -3.0% 18% 8.5% 20.6% 20%
Group 18.8% 10.7% 10.1% 0.7% 100% 0.7% 2.0% 3.1% 10.5% 100% 5.7% 6.3% 100%
European Healthcare, 11 September 2015
13 / 44
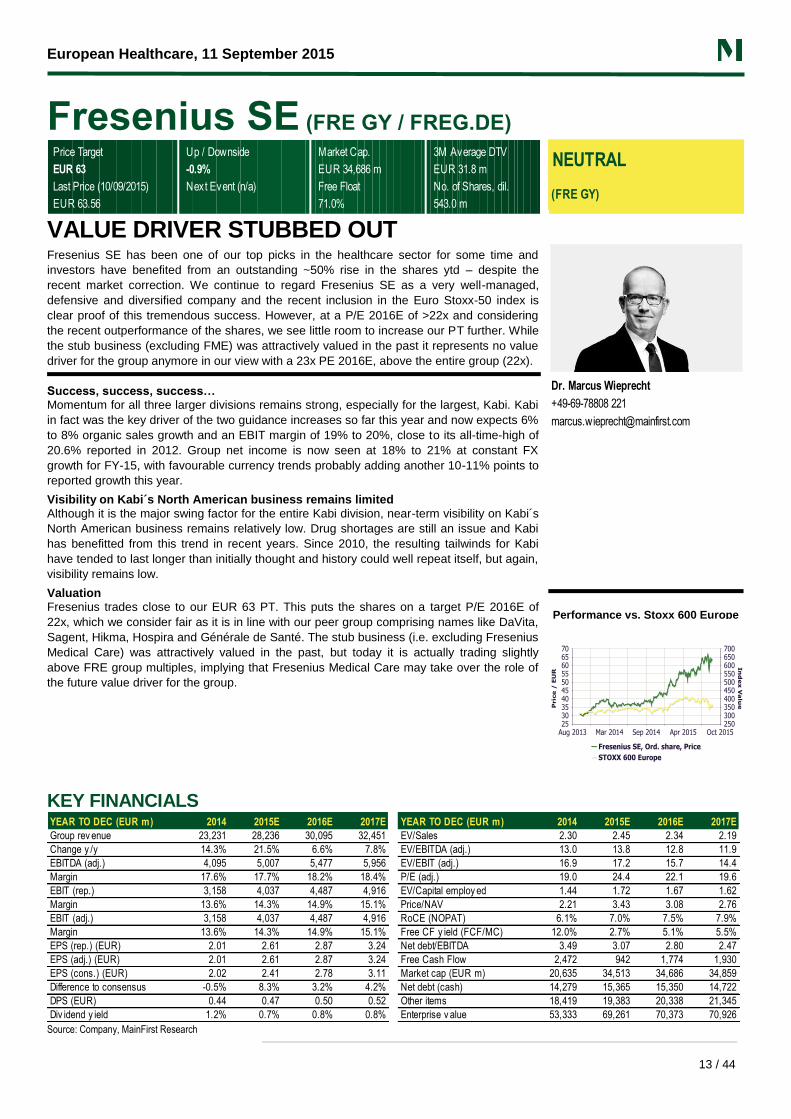
Fresenius SE (FRE GY / FREG.DE)
Price Target Up / Downside Market Cap. 3M Average DTV
EUR 63 -0.9% EUR 34,686 m EUR 31.8 m
Last Price (10/09/2015) Next Event (n/a) Free Float No. of Shares, dil.
EUR 63.56 71.0% 543.0 m
NEUTRAL
(FRE GY)
VALUE DRIVER STUBBED OUT Fresenius SE has been one of our top picks in the healthcare sector for some time and
investors have benefited from an outstanding ~50% rise in the shares ytd – despite the
recent market correction. We continue to regard Fresenius SE as a very well-managed,
defensive and diversified company and the recent inclusion in the Euro Stoxx-50 index is
clear proof of this tremendous success. However, at a P/E 2016E of >22x and considering
the recent outperformance of the shares, we see little room to increase our PT further. While
the stub business (excluding FME) was attractively valued in the past it represents no value
driver for the group anymore in our view with a 23x PE 2016E, above the entire group (22x).
Success, success, success… Momentum for all three larger divisions remains strong, especially for the largest, Kabi. Kabi
in fact was the key driver of the two guidance increases so far this year and now expects 6%
to 8% organic sales growth and an EBIT margin of 19% to 20%, close to its all-time-high of
20.6% reported in 2012. Group net income is now seen at 18% to 21% at constant FX
growth for FY-15, with favourable currency trends probably adding another 10-11% points to
reported growth this year.
Visibility on Kabi´s North American business remains limited
Although it is the major swing factor for the entire Kabi division, near-term visibility on Kabi´s
North American business remains relatively low. Drug shortages are still an issue and Kabi
has benefitted from this trend in recent years. Since 2010, the resulting tailwinds for Kabi
have tended to last longer than initially thought and history could well repeat itself, but again,
visibility remains low.
Valuation Fresenius trades close to our EUR 63 PT. This puts the shares on a target P/E 2016E of
22x, which we consider fair as it is in line with our peer group comprising names like DaVita,
Sagent, Hikma, Hospira and Générale de Santé. The stub business (i.e. excluding Fresenius
Medical Care) was attractively valued in the past, but today it is actually trading slightly
above FRE group multiples, implying that Fresenius Medical Care may take over the role of
the future value driver for the group.
Dr. Marcus Wieprecht
+49-69-78808 221
Performance vs. Stoxx 600 Europe
KEY FINANCIALS
Source: Company, MainFirst Research
YEAR TO DEC (EUR m) 2014 2015E 2016E 2017E YEAR TO DEC (EUR m) 2014 2015E 2016E 2017E
Group rev enue 23,231 28,236 30,095 32,451 EV/Sales 2.30 2.45 2.34 2.19
Change y /y 14.3% 21.5% 6.6% 7.8% EV/EBITDA (adj.) 13.0 13.8 12.8 11.9
EBITDA (adj.) 4,095 5,007 5,477 5,956 EV/EBIT (adj.) 16.9 17.2 15.7 14.4
Margin 17.6% 17.7% 18.2% 18.4% P/E (adj.) 19.0 24.4 22.1 19.6
EBIT (rep.) 3,158 4,037 4,487 4,916 EV/Capital employ ed 1.44 1.72 1.67 1.62
Margin 13.6% 14.3% 14.9% 15.1% Price/NAV 2.21 3.43 3.08 2.76
EBIT (adj.) 3,158 4,037 4,487 4,916 RoCE (NOPAT) 6.1% 7.0% 7.5% 7.9%
Margin 13.6% 14.3% 14.9% 15.1% Free CF y ield (FCF/MC) 12.0% 2.7% 5.1% 5.5%
EPS (rep.) (EUR) 2.01 2.61 2.87 3.24 Net debt/EBITDA 3.49 3.07 2.80 2.47
EPS (adj.) (EUR) 2.01 2.61 2.87 3.24 Free Cash Flow 2,472 942 1,774 1,930
EPS (cons.) (EUR) 2.02 2.41 2.78 3.11 Market cap (EUR m) 20,635 34,513 34,686 34,859
Difference to consensus -0.5% 8.3% 3.2% 4.2% Net debt (cash) 14,279 15,365 15,350 14,722
DPS (EUR) 0.44 0.47 0.50 0.52 Other items 18,419 19,383 20,338 21,345
Div idend y ield 1.2% 0.7% 0.8% 0.8% Enterprise v alue 53,333 69,261 70,373 70,926
European Healthcare, 11 September 2015
14 / 44
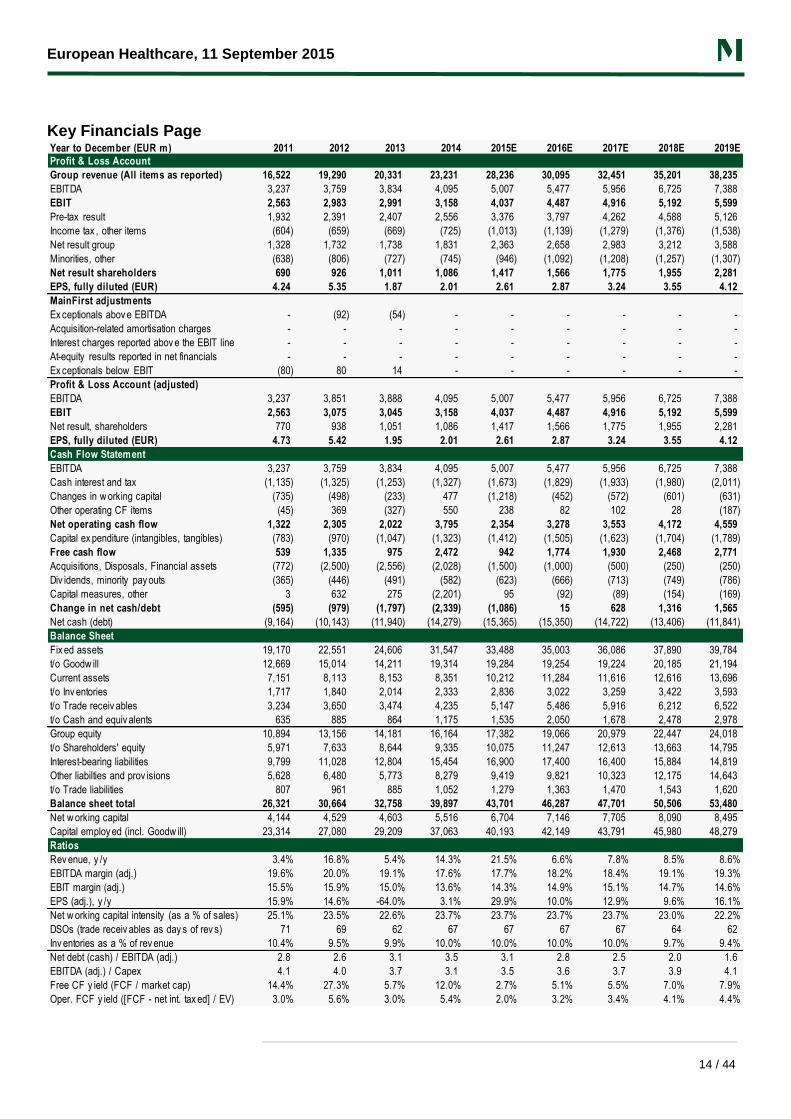
Key Financials Page
Year to December (EUR m) 2011 2012 2013 2014 2015E 2016E 2017E 2018E 2019E
Profit & Loss Account
Group revenue (All items as reported) 16,522 19,290 20,331 23,231 28,236 30,095 32,451 35,201 38,235
EBITDA 3,237 3,759 3,834 4,095 5,007 5,477 5,956 6,725 7,388
EBIT 2,563 2,983 2,991 3,158 4,037 4,487 4,916 5,192 5,599
Pre-tax result 1,932 2,391 2,407 2,556 3,376 3,797 4,262 4,588 5,126
Income tax , other items (604) (659) (669) (725) (1,013) (1,139) (1,279) (1,376) (1,538)
Net result group 1,328 1,732 1,738 1,831 2,363 2,658 2,983 3,212 3,588
Minorities, other (638) (806) (727) (745) (946) (1,092) (1,208) (1,257) (1,307)
Net result shareholders 690 926 1,011 1,086 1,417 1,566 1,775 1,955 2,281
EPS, fully diluted (EUR) 4.24 5.35 1.87 2.01 2.61 2.87 3.24 3.55 4.12
MainFirst adjustments
Ex ceptionals abov e EBITDA - (92) (54) - - - - - -
Acquisition-related amortisation charges - - - - - - - - -
Interest charges reported abov e the EBIT line - - - - - - - - -
At-equity results reported in net financials - - - - - - - - -
Ex ceptionals below EBIT (80) 80 14 - - - - - -
Profit & Loss Account (adjusted)
EBITDA 3,237 3,851 3,888 4,095 5,007 5,477 5,956 6,725 7,388
EBIT 2,563 3,075 3,045 3,158 4,037 4,487 4,916 5,192 5,599
Net result, shareholders 770 938 1,051 1,086 1,417 1,566 1,775 1,955 2,281
EPS, fully diluted (EUR) 4.73 5.42 1.95 2.01 2.61 2.87 3.24 3.55 4.12
Cash Flow Statement
EBITDA 3,237 3,759 3,834 4,095 5,007 5,477 5,956 6,725 7,388
Cash interest and tax (1,135) (1,325) (1,253) (1,327) (1,673) (1,829) (1,933) (1,980) (2,011)
Changes in w orking capital (735) (498) (233) 477 (1,218) (452) (572) (601) (631)
Other operating CF items (45) 369 (327) 550 238 82 102 28 (187)
Net operating cash flow 1,322 2,305 2,022 3,795 2,354 3,278 3,553 4,172 4,559
Capital ex penditure (intangibles, tangibles) (783) (970) (1,047) (1,323) (1,412) (1,505) (1,623) (1,704) (1,789)
Free cash flow 539 1,335 975 2,472 942 1,774 1,930 2,468 2,771
Acquisitions, Disposals, Financial assets (772) (2,500) (2,556) (2,028) (1,500) (1,000) (500) (250) (250)
Div idends, minority pay outs (365) (446) (491) (582) (623) (666) (713) (749) (786)
Capital measures, other 3 632 275 (2,201) 95 (92) (89) (154) (169)
Change in net cash/debt (595) (979) (1,797) (2,339) (1,086) 15 628 1,316 1,565
Net cash (debt) (9,164) (10,143) (11,940) (14,279) (15,365) (15,350) (14,722) (13,406) (11,841)
Balance Sheet
Fix ed assets 19,170 22,551 24,606 31,547 33,488 35,003 36,086 37,890 39,784
t/o Goodw ill 12,669 15,014 14,211 19,314 19,284 19,254 19,224 20,185 21,194
Current assets 7,151 8,113 8,153 8,351 10,212 11,284 11,616 12,616 13,696
t/o Inv entories 1,717 1,840 2,014 2,333 2,836 3,022 3,259 3,422 3,593
t/o Trade receiv ables 3,234 3,650 3,474 4,235 5,147 5,486 5,916 6,212 6,522
t/o Cash and equiv alents 635 885 864 1,175 1,535 2,050 1,678 2,478 2,978
Group equity 10,894 13,156 14,181 16,164 17,382 19,066 20,979 22,447 24,018
t/o Shareholders' equity 5,971 7,633 8,644 9,335 10,075 11,247 12,613 13,663 14,795
Interest-bearing liabilities 9,799 11,028 12,804 15,454 16,900 17,400 16,400 15,884 14,819
Other liabilties and prov isions 5,628 6,480 5,773 8,279 9,419 9,821 10,323 12,175 14,643
t/o Trade liabilities 807 961 885 1,052 1,279 1,363 1,470 1,543 1,620
Balance sheet total 26,321 30,664 32,758 39,897 43,701 46,287 47,701 50,506 53,480
Net w orking capital 4,144 4,529 4,603 5,516 6,704 7,146 7,705 8,090 8,495
Capital employ ed (incl. Goodw ill) 23,314 27,080 29,209 37,063 40,193 42,149 43,791 45,980 48,279
Ratios
Rev enue, y /y 3.4% 16.8% 5.4% 14.3% 21.5% 6.6% 7.8% 8.5% 8.6%
EBITDA margin (adj.) 19.6% 20.0% 19.1% 17.6% 17.7% 18.2% 18.4% 19.1% 19.3%
EBIT margin (adj.) 15.5% 15.9% 15.0% 13.6% 14.3% 14.9% 15.1% 14.7% 14.6%
EPS (adj.), y /y 15.9% 14.6% -64.0% 3.1% 29.9% 10.0% 12.9% 9.6% 16.1%
Net w orking capital intensity (as a % of sales) 25.1% 23.5% 22.6% 23.7% 23.7% 23.7% 23.7% 23.0% 22.2%
DSOs (trade receiv ables as day s of rev s) 71 69 62 67 67 67 67 64 62
Inv entories as a % of rev enue 10.4% 9.5% 9.9% 10.0% 10.0% 10.0% 10.0% 9.7% 9.4%
Net debt (cash) / EBITDA (adj.) 2.8 2.6 3.1 3.5 3.1 2.8 2.5 2.0 1.6
EBITDA (adj.) / Capex 4.1 4.0 3.7 3.1 3.5 3.6 3.7 3.9 4.1
Free CF y ield (FCF / market cap) 14.4% 27.3% 5.7% 12.0% 2.7% 5.1% 5.5% 7.0% 7.9%
Oper. FCF y ield ([FCF - net int. tax ed] / EV) 3.0% 5.6% 3.0% 5.4% 2.0% 3.2% 3.4% 4.1% 4.4%
European Healthcare, 11 September 2015
15 / 44
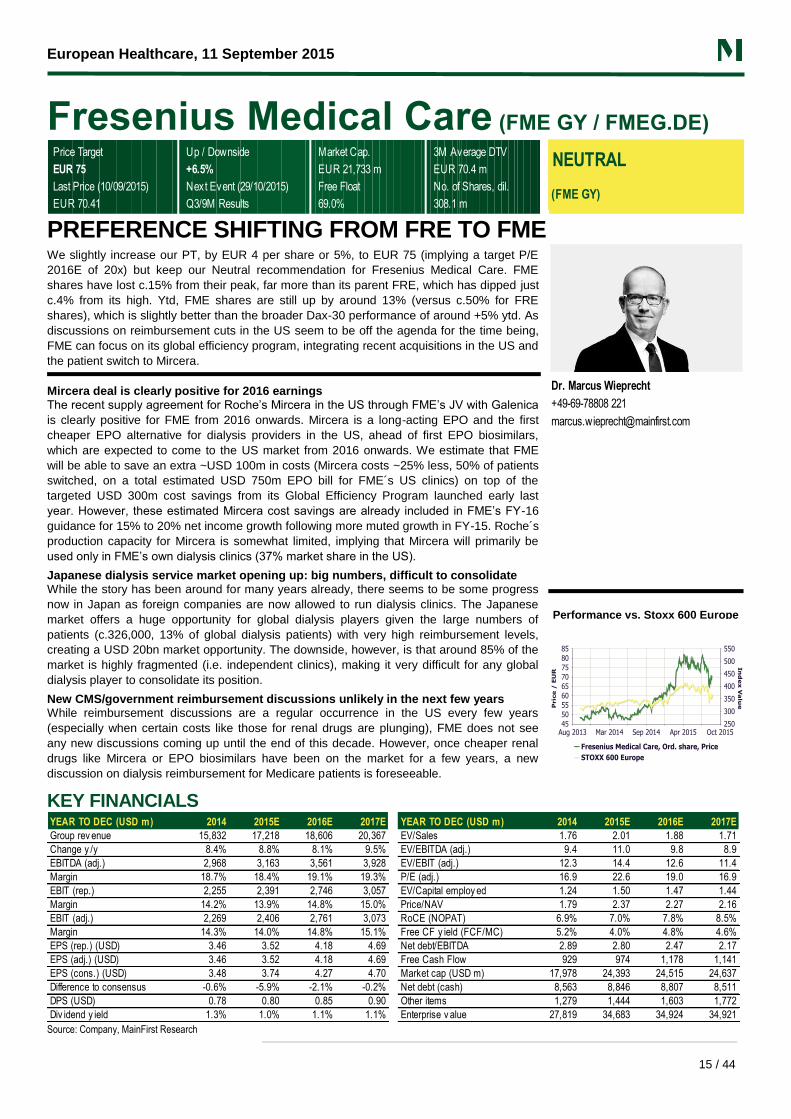
Fresenius Medical Care (FME GY / FMEG.DE)
Price Target Up / Downside Market Cap. 3M Average DTV
EUR 75 +6.5% EUR 21,733 m EUR 70.4 m
Last Price (10/09/2015) Next Event (29/10/2015) Free Float No. of Shares, dil.
EUR 70.41 Q3/9M Results 69.0% 308.1 m
NEUTRAL
(FME GY)
PREFERENCE SHIFTING FROM FRE TO FME We slightly increase our PT, by EUR 4 per share or 5%, to EUR 75 (implying a target P/E
2016E of 20x) but keep our Neutral recommendation for Fresenius Medical Care. FME
shares have lost c.15% from their peak, far more than its parent FRE, which has dipped just
c.4% from its high. Ytd, FME shares are still up by around 13% (versus c.50% for FRE
shares), which is slightly better than the broader Dax-30 performance of around +5% ytd. As
discussions on reimbursement cuts in the US seem to be off the agenda for the time being,
FME can focus on its global efficiency program, integrating recent acquisitions in the US and
the patient switch to Mircera.
Mircera deal is clearly positive for 2016 earnings The recent supply agreement for Roche’s Mircera in the US through FME’s JV with Galenica
is clearly positive for FME from 2016 onwards. Mircera is a long-acting EPO and the first
cheaper EPO alternative for dialysis providers in the US, ahead of first EPO biosimilars,
which are expected to come to the US market from 2016 onwards. We estimate that FME
will be able to save an extra ~USD 100m in costs (Mircera costs ~25% less, 50% of patients
switched, on a total estimated USD 750m EPO bill for FME´s US clinics) on top of the
targeted USD 300m cost savings from its Global Efficiency Program launched early last
year. However, these estimated Mircera cost savings are already included in FME’s FY-16
guidance for 15% to 20% net income growth following more muted growth in FY-15. Roche´s
production capacity for Mircera is somewhat limited, implying that Mircera will primarily be
used only in FME’s own dialysis clinics (37% market share in the US).
Japanese dialysis service market opening up: big numbers, difficult to consolidate While the story has been around for many years already, there seems to be some progress
now in Japan as foreign companies are now allowed to run dialysis clinics. The Japanese
market offers a huge opportunity for global dialysis players given the large numbers of
patients (c.326,000, 13% of global dialysis patients) with very high reimbursement levels,
creating a USD 20bn market opportunity. The downside, however, is that around 85% of the
market is highly fragmented (i.e. independent clinics), making it very difficult for any global
dialysis player to consolidate its position.
New CMS/government reimbursement discussions unlikely in the next few years While reimbursement discussions are a regular occurrence in the US every few years
(especially when certain costs like those for renal drugs are plunging), FME does not see
any new discussions coming up until the end of this decade. However, once cheaper renal
drugs like Mircera or EPO biosimilars have been on the market for a few years, a new
discussion on dialysis reimbursement for Medicare patients is foreseeable.
Dr. Marcus Wieprecht
+49-69-78808 221
Performance vs. Stoxx 600 Europe
KEY FINANCIALS
Source: Company, MainFirst Research
YEAR TO DEC (USD m) 2014 2015E 2016E 2017E YEAR TO DEC (USD m) 2014 2015E 2016E 2017E
Group rev enue 15,832 17,218 18,606 20,367 EV/Sales 1.76 2.01 1.88 1.71
Change y /y 8.4% 8.8% 8.1% 9.5% EV/EBITDA (adj.) 9.4 11.0 9.8 8.9
EBITDA (adj.) 2,968 3,163 3,561 3,928 EV/EBIT (adj.) 12.3 14.4 12.6 11.4
Margin 18.7% 18.4% 19.1% 19.3% P/E (adj.) 16.9 22.6 19.0 16.9
EBIT (rep.) 2,255 2,391 2,746 3,057 EV/Capital employ ed 1.24 1.50 1.47 1.44
Margin 14.2% 13.9% 14.8% 15.0% Price/NAV 1.79 2.37 2.27 2.16
EBIT (adj.) 2,269 2,406 2,761 3,073 RoCE (NOPAT) 6.9% 7.0% 7.8% 8.5%
Margin 14.3% 14.0% 14.8% 15.1% Free CF y ield (FCF/MC) 5.2% 4.0% 4.8% 4.6%
EPS (rep.) (USD) 3.46 3.52 4.18 4.69 Net debt/EBITDA 2.89 2.80 2.47 2.17
EPS (adj.) (USD) 3.46 3.52 4.18 4.69 Free Cash Flow 929 974 1,178 1,141
EPS (cons.) (USD) 3.48 3.74 4.27 4.70 Market cap (USD m) 17,978 24,393 24,515 24,637
Difference to consensus -0.6% -5.9% -2.1% -0.2% Net debt (cash) 8,563 8,846 8,807 8,511
DPS (USD) 0.78 0.80 0.85 0.90 Other items 1,279 1,444 1,603 1,772
Div idend y ield 1.3% 1.0% 1.1% 1.1% Enterprise v alue 27,819 34,683 34,924 34,921
European Healthcare, 11 September 2015
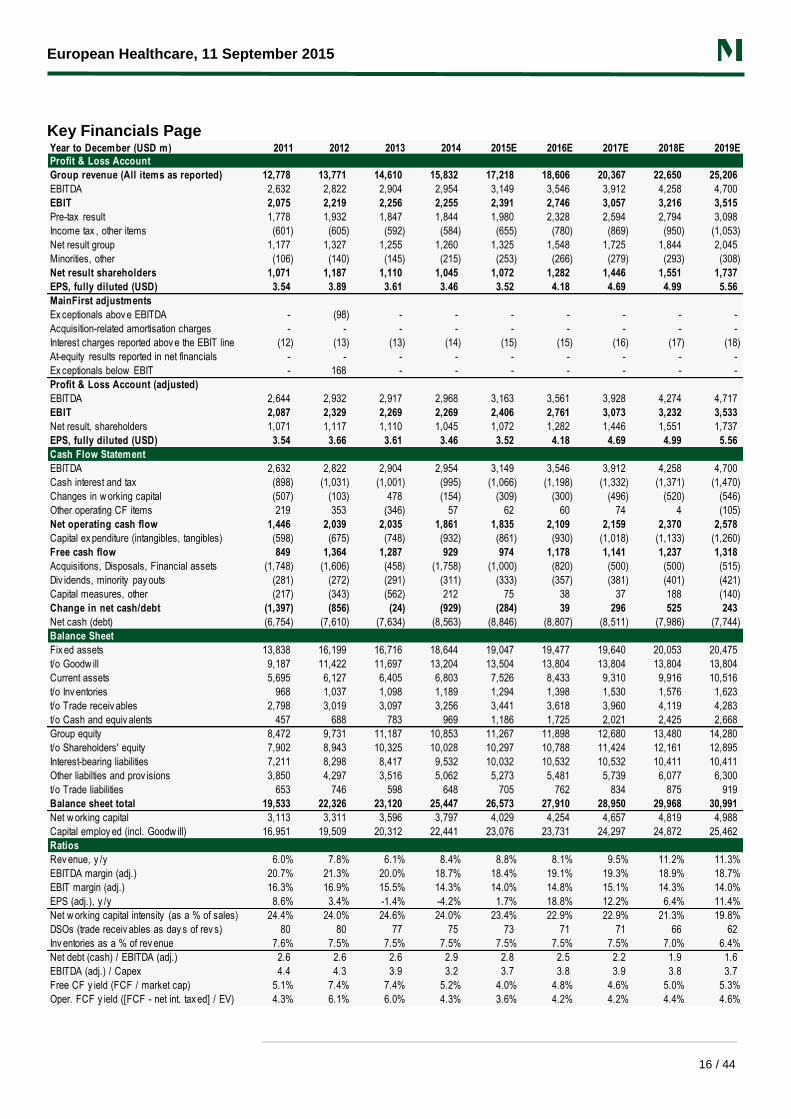
16 / 44
Key Financials Page
Year to December (USD m) 2011 2012 2013 2014 2015E 2016E 2017E 2018E 2019E
Profit & Loss Account
Group revenue (All items as reported) 12,778 13,771 14,610 15,832 17,218 18,606 20,367 22,650 25,206
EBITDA 2,632 2,822 2,904 2,954 3,149 3,546 3,912 4,258 4,700
EBIT 2,075 2,219 2,256 2,255 2,391 2,746 3,057 3,216 3,515
Pre-tax result 1,778 1,932 1,847 1,844 1,980 2,328 2,594 2,794 3,098
Income tax , other items (601) (605) (592) (584) (655) (780) (869) (950) (1,053)
Net result group 1,177 1,327 1,255 1,260 1,325 1,548 1,725 1,844 2,045
Minorities, other (106) (140) (145) (215) (253) (266) (279) (293) (308)
Net result shareholders 1,071 1,187 1,110 1,045 1,072 1,282 1,446 1,551 1,737
EPS, fully diluted (USD) 3.54 3.89 3.61 3.46 3.52 4.18 4.69 4.99 5.56
MainFirst adjustments
Ex ceptionals abov e EBITDA - (98) - - - - - - -
Acquisition-related amortisation charges - - - - - - - - -
Interest charges reported abov e the EBIT line (12) (13) (13) (14) (15) (15) (16) (17) (18)
At-equity results reported in net financials - - - - - - - - -
Ex ceptionals below EBIT - 168 - - - - - - -
Profit & Loss Account (adjusted)
EBITDA 2,644 2,932 2,917 2,968 3,163 3,561 3,928 4,274 4,717
EBIT 2,087 2,329 2,269 2,269 2,406 2,761 3,073 3,232 3,533
Net result, shareholders 1,071 1,117 1,110 1,045 1,072 1,282 1,446 1,551 1,737
EPS, fully diluted (USD) 3.54 3.66 3.61 3.46 3.52 4.18 4.69 4.99 5.56
Cash Flow Statement
EBITDA 2,632 2,822 2,904 2,954 3,149 3,546 3,912 4,258 4,700
Cash interest and tax (898) (1,031) (1,001) (995) (1,066) (1,198) (1,332) (1,371) (1,470)
Changes in w orking capital (507) (103) 478 (154) (309) (300) (496) (520) (546)
Other operating CF items 219 353 (346) 57 62 60 74 4 (105)
Net operating cash flow 1,446 2,039 2,035 1,861 1,835 2,109 2,159 2,370 2,578
Capital ex penditure (intangibles, tangibles) (598) (675) (748) (932) (861) (930) (1,018) (1,133) (1,260)
Free cash flow 849 1,364 1,287 929 974 1,178 1,141 1,237 1,318
Acquisitions, Disposals, Financial assets (1,748) (1,606) (458) (1,758) (1,000) (820) (500) (500) (515)
Div idends, minority pay outs (281) (272) (291) (311) (333) (357) (381) (401) (421)
Capital measures, other (217) (343) (562) 212 75 38 37 188 (140)
Change in net cash/debt (1,397) (856) (24) (929) (284) 39 296 525 243
Net cash (debt) (6,754) (7,610) (7,634) (8,563) (8,846) (8,807) (8,511) (7,986) (7,744)
Balance Sheet
Fix ed assets 13,838 16,199 16,716 18,644 19,047 19,477 19,640 20,053 20,475
t/o Goodw ill 9,187 11,422 11,697 13,204 13,504 13,804 13,804 13,804 13,804
Current assets 5,695 6,127 6,405 6,803 7,526 8,433 9,310 9,916 10,516
t/o Inv entories 968 1,037 1,098 1,189 1,294 1,398 1,530 1,576 1,623
t/o Trade receiv ables 2,798 3,019 3,097 3,256 3,441 3,618 3,960 4,119 4,283
t/o Cash and equiv alents 457 688 783 969 1,186 1,725 2,021 2,425 2,668
Group equity 8,472 9,731 11,187 10,853 11,267 11,898 12,680 13,480 14,280
t/o Shareholders' equity 7,902 8,943 10,325 10,028 10,297 10,788 11,424 12,161 12,895
Interest-bearing liabilities 7,211 8,298 8,417 9,532 10,032 10,532 10,532 10,411 10,411
Other liabilties and prov isions 3,850 4,297 3,516 5,062 5,273 5,481 5,739 6,077 6,300
t/o Trade liabilities 653 746 598 648 705 762 834 875 919
Balance sheet total 19,533 22,326 23,120 25,447 26,573 27,910 28,950 29,968 30,991
Net w orking capital 3,113 3,311 3,596 3,797 4,029 4,254 4,657 4,819 4,988
Capital employ ed (incl. Goodw ill) 16,951 19,509 20,312 22,441 23,076 23,731 24,297 24,872 25,462
Ratios
Rev enue, y /y 6.0% 7.8% 6.1% 8.4% 8.8% 8.1% 9.5% 11.2% 11.3%
EBITDA margin (adj.) 20.7% 21.3% 20.0% 18.7% 18.4% 19.1% 19.3% 18.9% 18.7%
EBIT margin (adj.) 16.3% 16.9% 15.5% 14.3% 14.0% 14.8% 15.1% 14.3% 14.0%
EPS (adj.), y /y 8.6% 3.4% -1.4% -4.2% 1.7% 18.8% 12.2% 6.4% 11.4%
Net w orking capital intensity (as a % of sales) 24.4% 24.0% 24.6% 24.0% 23.4% 22.9% 22.9% 21.3% 19.8%
DSOs (trade receiv ables as day s of rev s) 80 80 77 75 73 71 71 66 62
Inv entories as a % of rev enue 7.6% 7.5% 7.5% 7.5% 7.5% 7.5% 7.5% 7.0% 6.4%
Net debt (cash) / EBITDA (adj.) 2.6 2.6 2.6 2.9 2.8 2.5 2.2 1.9 1.6
EBITDA (adj.) / Capex 4.4 4.3 3.9 3.2 3.7 3.8 3.9 3.8 3.7
Free CF y ield (FCF / market cap) 5.1% 7.4% 7.4% 5.2% 4.0% 4.8% 4.6% 5.0% 5.3%
Oper. FCF y ield ([FCF - net int. tax ed] / EV) 4.3% 6.1% 6.0% 4.3% 3.6% 4.2% 4.2% 4.4% 4.6%
European Healthcare, 11 September 2015
17 / 44
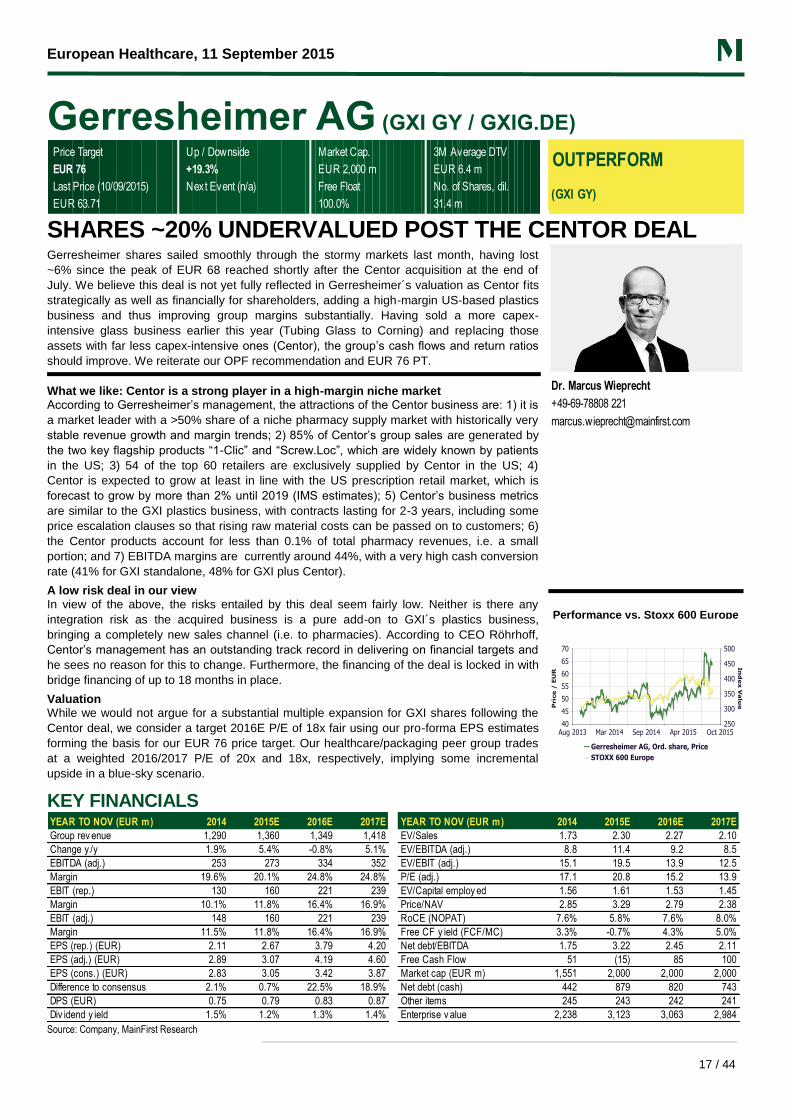
Gerresheimer AG (GXI GY / GXIG.DE)
Price Target Up / Downside Market Cap. 3M Average DTV
EUR 76 +19.3% EUR 2,000 m EUR 6.4 m
Last Price (10/09/2015) Next Event (n/a) Free Float No. of Shares, dil.
EUR 63.71 100.0% 31.4 m
OUTPERFORM
(GXI GY)
SHARES ~20% UNDERVALUED POST THE CENTOR DEAL Gerresheimer shares sailed smoothly through the stormy markets last month, having lost
~6% since the peak of EUR 68 reached shortly after the Centor acquisition at the end of
July. We believe this deal is not yet fully reflected in Gerresheimer´s valuation as Centor fits
strategically as well as financially for shareholders, adding a high-margin US-based plastics
business and thus improving group margins substantially. Having sold a more capex-
intensive glass business earlier this year (Tubing Glass to Corning) and replacing those
assets with far less capex-intensive ones (Centor), the group’s cash flows and return ratios
should improve. We reiterate our OPF recommendation and EUR 76 PT.
What we like: Centor is a strong player in a high-margin niche market According to Gerresheimer’s management, the attractions of the Centor business are: 1) it is
a market leader with a >50% share of a niche pharmacy supply market with historically very
stable revenue growth and margin trends; 2) 85% of Centor’s group sales are generated by
the two key flagship products “1-Clic” and “Screw.Loc”, which are widely known by patients
in the US; 3) 54 of the top 60 retailers are exclusively supplied by Centor in the US; 4)
Centor is expected to grow at least in line with the US prescription retail market, which is
forecast to grow by more than 2% until 2019 (IMS estimates); 5) Centor’s business metrics
are similar to the GXI plastics business, with contracts lasting for 2-3 years, including some
price escalation clauses so that rising raw material costs can be passed on to customers; 6)
the Centor products account for less than 0.1% of total pharmacy revenues, i.e. a small
portion; and 7) EBITDA margins are currently around 44%, with a very high cash conversion
rate (41% for GXI standalone, 48% for GXI plus Centor).
A low risk deal in our view In view of the above, the risks entailed by this deal seem fairly low. Neither is there any
integration risk as the acquired business is a pure add-on to GXI´s plastics business,
bringing a completely new sales channel (i.e. to pharmacies). According to CEO Röhrhoff,
Centor’s management has an outstanding track record in delivering on financial targets and
he sees no reason for this to change. Furthermore, the financing of the deal is locked in with
bridge financing of up to 18 months in place.
Valuation While we would not argue for a substantial multiple expansion for GXI shares following the
Centor deal, we consider a target 2016E P/E of 18x fair using our pro-forma EPS estimates
forming the basis for our EUR 76 price target. Our healthcare/packaging peer group trades
at a weighted 2016/2017 P/E of 20x and 18x, respectively, implying some incremental
upside in a blue-sky scenario.
Dr. Marcus Wieprecht
+49-69-78808 221
Performance vs. Stoxx 600 Europe
KEY FINANCIALS
Source: Company, MainFirst Research
YEAR TO NOV (EUR m) 2014 2015E 2016E 2017E YEAR TO NOV (EUR m) 2014 2015E 2016E 2017E
Group rev enue 1,290 1,360 1,349 1,418 EV/Sales 1.73 2.30 2.27 2.10
Change y /y 1.9% 5.4% -0.8% 5.1% EV/EBITDA (adj.) 8.8 11.4 9.2 8.5
EBITDA (adj.) 253 273 334 352 EV/EBIT (adj.) 15.1 19.5 13.9 12.5
Margin 19.6% 20.1% 24.8% 24.8% P/E (adj.) 17.1 20.8 15.2 13.9
EBIT (rep.) 130 160 221 239 EV/Capital employ ed 1.56 1.61 1.53 1.45
Margin 10.1% 11.8% 16.4% 16.9% Price/NAV 2.85 3.29 2.79 2.38
EBIT (adj.) 148 160 221 239 RoCE (NOPAT) 7.6% 5.8% 7.6% 8.0%
Margin 11.5% 11.8% 16.4% 16.9% Free CF y ield (FCF/MC) 3.3% -0.7% 4.3% 5.0%
EPS (rep.) (EUR) 2.11 2.67 3.79 4.20 Net debt/EBITDA 1.75 3.22 2.45 2.11
EPS (adj.) (EUR) 2.89 3.07 4.19 4.60 Free Cash Flow 51 (15) 85 100
EPS (cons.) (EUR) 2.83 3.05 3.42 3.87 Market cap (EUR m) 1,551 2,000 2,000 2,000
Difference to consensus 2.1% 0.7% 22.5% 18.9% Net debt (cash) 442 879 820 743
DPS (EUR) 0.75 0.79 0.83 0.87 Other items 245 243 242 241
Div idend y ield 1.5% 1.2% 1.3% 1.4% Enterprise v alue 2,238 3,123 3,063 2,984

European Healthcare, 11 September 2015
18 / 44
Key Financials Page
Year to November (EUR m) 2011 2012 2013 2014 2015E 2016E 2017E 2018E 2019E
Profit & Loss Account
Group revenue (All items as reported) 1,095 1,219 1,266 1,290 1,360 1,349 1,418 1,493 1,568
EBITDA 210 230 241 235 273 334 352 371 329
EBIT 109 129 133 130 160 221 239 253 198
Pre-tax result 73 99 99 99 130 183 192 210 169
Income tax , other items (18) (29) (30) (27) (39) (57) (63) (66) (51)
Net result group 54 69 68 73 91 126 129 144 118
Minorities, other (4) (6) (6) (7) (7) (7) (8) (8) (9)
Net result shareholders 51 63 62 66 84 119 122 136 109
EPS, fully diluted (EUR) 1.61 1.92 1.98 2.11 2.67 3.79 4.20 4.58 4.63
MainFirst adjustments
Ex ceptionals abov e EBITDA (7) (8) (1) (19) - - - - -
Acquisition-related amortisation charges (21) (19) (38) - - - - - -
Interest charges reported abov e the EBIT line - - - - - - - - -
At-equity results reported in net financials - - - - - - - - -
Ex ceptionals below EBIT (3) 9 4 (7) (13) (13) (23) (21) (10)
Profit & Loss Account (adjusted)
EBITDA 217 237 242 253 273 334 352 371 329
EBIT 137 155 172 148 160 221 239 253 198
Net result, shareholders 81 80 97 91 97 132 145 157 119
EPS, fully diluted (EUR) 2.44 2.55 2.92 2.89 3.07 4.19 4.60 4.99 3.80
Cash Flow Statement
EBITDA 210 230 241 235 273 334 352 371 329
Cash interest and tax (55) (62) (65) (57) (69) (95) (100) (99) (80)
Changes in w orking capital (5) 8 (30) (32) (88) (26) (13) (14) (14)
Other operating CF items (6) 11 17 30 (1) 4 (1) (1) (1)
Net operating cash flow 144 187 164 176 115 217 239 257 234
Capital ex penditure (intangibles, tangibles) (86) (119) (119) (126) (130) (132) (138) (139) (145)
Free cash flow 58 68 45 51 (15) 85 100 119 88
Acquisitions, Disposals, Financial assets (78) (32) (52) - (914) - - - -
Div idends, minority pay outs (16) (17) (19) (19) (20) (21) (23) (24) (25)
Capital measures, other (20) (22) (33) (39) 512 (5) (1) (15) 37
Change in net cash/debt (56) (3) (58) (7) (437) 59 77 80 100
Net cash (debt) (374) (377) (435) (442) (879) (820) (743) (663) (563)
Balance Sheet
Fix ed assets 1,036 1,073 1,129 1,154 1,567 1,590 1,621 1,653 1,686
t/o Goodw ill 419 428 456 455 655 655 655 655 655
Current assets 479 485 487 502 694 810 915 1,050 1,155
t/o Inv entories 160 189 195 194 254 281 295 301 307
t/o Trade receiv ables 163 179 193 209 250 277 290 296 302
t/o Cash and equiv alents 131 86 73 68 157 216 293 373 473
Group equity 552 580 563 604 673 786 912 1,060 1,180
t/o Shareholders' equity 512 535 506 543 609 717 839 985 1,100
Interest-bearing liabilities 505 463 508 510 1,036 1,036 1,036 1,036 1,036
Other liabilties and prov isions 458 515 544 541 551 578 588 607 626
t/o Trade liabilities 119 154 127 126 132 147 154 158 163
Balance sheet total 1,515 1,558 1,616 1,656 2,261 2,400 2,536 2,704 2,842
Net w orking capital 204 214 260 277 372 412 432 439 446
Capital employ ed (incl. Goodw ill) 1,240 1,287 1,389 1,430 1,938 2,001 2,053 2,092 2,132
Ratios
Rev enue, y /y 6.8% 11.4% 3.8% 1.9% 5.4% -0.8% 5.1% 5.3% 5.0%
EBITDA margin (adj.) 19.8% 19.5% 19.1% 19.6% 20.1% 24.8% 24.8% 24.9% 21.0%
EBIT margin (adj.) 12.5% 12.7% 13.6% 11.5% 11.8% 16.4% 16.9% 17.0% 12.7%
EPS (adj.), y /y 25.1% 4.5% 14.5% -1.0% 6.2% 36.5% 9.8% 8.5% -23.8%
Net w orking capital intensity (as a % of sales) 18.6% 17.6% 20.5% 21.4% 27.3% 30.5% 30.4% 29.4% 28.4%
DSOs (trade receiv ables as day s of rev s) 54 54 56 59 67 75 75 72 70
Inv entories as a % of rev enue 14.6% 15.5% 15.4% 15.0% 18.7% 20.9% 20.8% 20.2% 19.6%
Net debt (cash) / EBITDA (adj.) 1.7 1.6 1.8 1.7 3.2 2.5 2.1 1.8 1.7
EBITDA (adj.) / Capex 2.5 2.0 2.0 2.0 2.1 2.5 2.5 2.7 2.3
Free CF y ield (FCF / market cap) 5.8% 6.0% 3.3% 3.3% -0.7% 4.3% 5.0% 5.9% 4.4%
Oper. FCF y ield ([FCF - net int. tax ed] / EV) 5.5% 5.3% 3.4% 3.3% 0.2% 3.6% 4.5% 5.1% 3.9%
European Healthcare, 11 September 2015
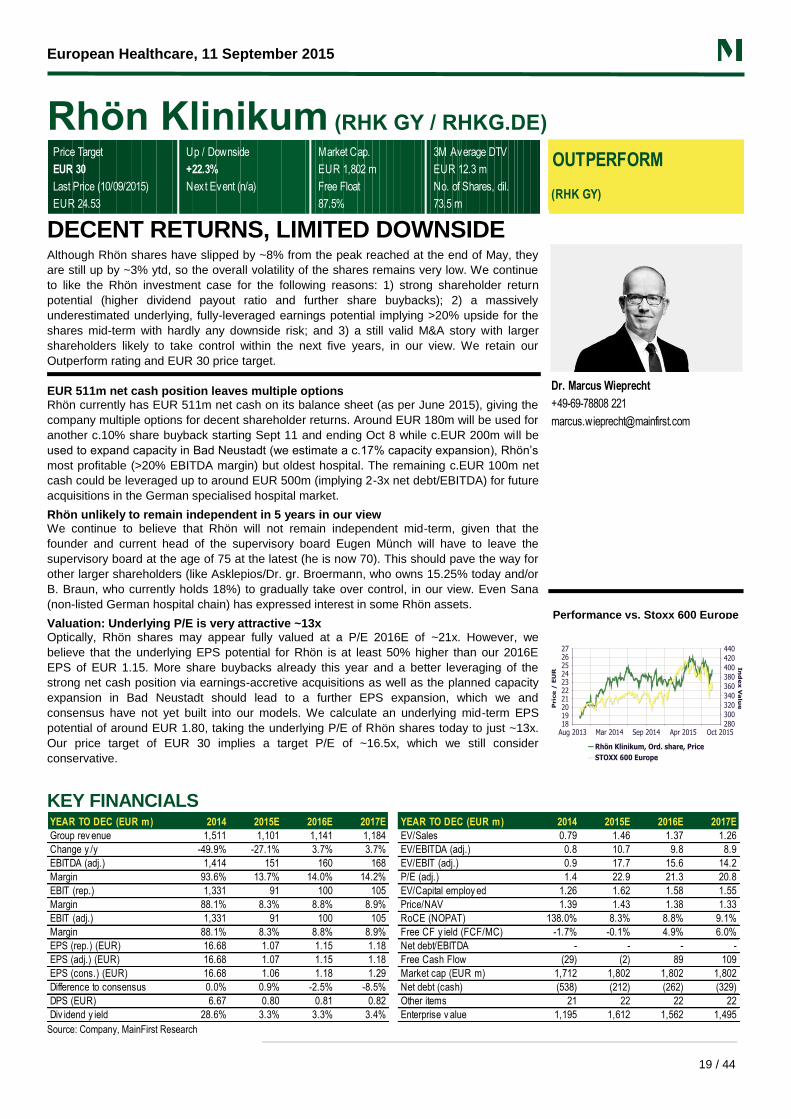
19 / 44
Rhön Klinikum (RHK GY / RHKG.DE)
Price Target Up / Downside Market Cap. 3M Average DTV
EUR 30 +22.3% EUR 1,802 m EUR 12.3 m
Last Price (10/09/2015) Next Event (n/a) Free Float No. of Shares, dil.
EUR 24.53 87.5% 73.5 m
OUTPERFORM
(RHK GY)
DECENT RETURNS, LIMITED DOWNSIDE
Although Rhön shares have slipped by ~8% from the peak reached at the end of May, they
are still up by ~3% ytd, so the overall volatility of the shares remains very low. We continue
to like the Rhön investment case for the following reasons: 1) strong shareholder return
potential (higher dividend payout ratio and further share buybacks); 2) a massively
underestimated underlying, fully-leveraged earnings potential implying >20% upside for the
shares mid-term with hardly any downside risk; and 3) a still valid M&A story with larger
shareholders likely to take control within the next five years, in our view. We retain our
Outperform rating and EUR 30 price target.
EUR 511m net cash position leaves multiple options Rhön currently has EUR 511m net cash on its balance sheet (as per June 2015), giving the
company multiple options for decent shareholder returns. Around EUR 180m will be used for
another c.10% share buyback starting Sept 11 and ending Oct 8 while c.EUR 200m will be
used to expand capacity in Bad Neustadt (we estimate a c.17% capacity expansion), Rhön’s
most profitable (>20% EBITDA margin) but oldest hospital. The remaining c.EUR 100m net
cash could be leveraged up to around EUR 500m (implying 2-3x net debt/EBITDA) for future
acquisitions in the German specialised hospital market.
Rhön unlikely to remain independent in 5 years in our view We continue to believe that Rhön will not remain independent mid-term, given that the
founder and current head of the supervisory board Eugen Münch will have to leave the
supervisory board at the age of 75 at the latest (he is now 70). This should pave the way for
other larger shareholders (like Asklepios/Dr. gr. Broermann, who owns 15.25% today and/or
B. Braun, who currently holds 18%) to gradually take over control, in our view. Even Sana
(non-listed German hospital chain) has expressed interest in some Rhön assets.
Valuation: Underlying P/E is very attractive ~13x Optically, Rhön shares may appear fully valued at a P/E 2016E of ~21x. However, we
believe that the underlying EPS potential for Rhön is at least 50% higher than our 2016E
EPS of EUR 1.15. More share buybacks already this year and a better leveraging of the
strong net cash position via earnings-accretive acquisitions as well as the planned capacity
expansion in Bad Neustadt should lead to a further EPS expansion, which we and
consensus have not yet built into our models. We calculate an underlying mid-term EPS
potential of around EUR 1.80, taking the underlying P/E of Rhön shares today to just ~13x.
Our price target of EUR 30 implies a target P/E of ~16.5x, which we still consider
conservative.
Dr. Marcus Wieprecht
+49-69-78808 221
Performance vs. Stoxx 600 Europe
KEY FINANCIALS
Source: Company, MainFirst Research
YEAR TO DEC (EUR m) 2014 2015E 2016E 2017E YEAR TO DEC (EUR m) 2014 2015E 2016E 2017E
Group rev enue 1,511 1,101 1,141 1,184 EV/Sales 0.79 1.46 1.37 1.26
Change y /y -49.9% -27.1% 3.7% 3.7% EV/EBITDA (adj.) 0.8 10.7 9.8 8.9
EBITDA (adj.) 1,414 151 160 168 EV/EBIT (adj.) 0.9 17.7 15.6 14.2
Margin 93.6% 13.7% 14.0% 14.2% P/E (adj.) 1.4 22.9 21.3 20.8
EBIT (rep.) 1,331 91 100 105 EV/Capital employ ed 1.26 1.62 1.58 1.55
Margin 88.1% 8.3% 8.8% 8.9% Price/NAV 1.39 1.43 1.38 1.33
EBIT (adj.) 1,331 91 100 105 RoCE (NOPAT) 138.0% 8.3% 8.8% 9.1%
Margin 88.1% 8.3% 8.8% 8.9% Free CF y ield (FCF/MC) -1.7% -0.1% 4.9% 6.0%
EPS (rep.) (EUR) 16.68 1.07 1.15 1.18 Net debt/EBITDA - - - -
EPS (adj.) (EUR) 16.68 1.07 1.15 1.18 Free Cash Flow (29) (2) 89 109
EPS (cons.) (EUR) 16.68 1.06 1.18 1.29 Market cap (EUR m) 1,712 1,802 1,802 1,802
Difference to consensus 0.0% 0.9% -2.5% -8.5% Net debt (cash) (538) (212) (262) (329)
DPS (EUR) 6.67 0.80 0.81 0.82 Other items 21 22 22 22
Div idend y ield 28.6% 3.3% 3.3% 3.4% Enterprise v alue 1,195 1,612 1,562 1,495

European Healthcare, 11 September 2015
20 / 44
Key Financials Page
Year to December (EUR m) 2011 2012 2013 2014 2015E 2016E 2017E 2018E 2019E
Profit & Loss Account
Group revenue (All items as reported) 2,628 2,864 3,014 1,511 1,101 1,141 1,184 1,219 1,256
EBITDA 354 292 275 1,414 151 160 168 174 180
EBIT 212 147 155 1,331 91 100 105 116 119
Pre-tax result 184 112 118 1,248 89 100 106 118 121
Income tax , other items (23) (20) (28) (21) (8) (13) (17) (20) (21)
Net result group 161 92 90 1,228 81 87 89 98 101
Minorities, other (5) (3) (3) (2) (3) - - - -
Net result shareholders 156 89 87 1,226 78 87 89 98 101
EPS, fully diluted (EUR) 1.13 0.72 0.63 16.68 1.07 1.15 1.18 1.29 1.33
MainFirst adjustments
Ex ceptionals abov e EBITDA - (12) - - - - - - -
Acquisition-related amortisation charges - - - - - - - - -
Interest charges reported abov e the EBIT line - - - - - - - - -
At-equity results reported in net financials - - - - - - - - -
Ex ceptionals below EBIT - 2 - - - 3 3 3 3
Profit & Loss Account (adjusted)
EBITDA 354 304 275 1,414 151 160 168 174 180
EBIT 212 159 155 1,331 91 100 105 116 119
Net result, shareholders 156 99 87 1,226 78 85 86 95 98
EPS, fully diluted (EUR) 1.13 0.72 0.63 16.68 1.07 1.15 1.18 1.29 1.33
Cash Flow Statement
EBITDA 354 292 275 1,414 151 160 168 174 180
Cash interest and tax (51) (55) (65) (103) (10) (13) (16) (18) (19)
Changes in w orking capital (43) (199) 27 (1,635) (13) (11) (11) (11) (12)
Other operating CF items (40) 12 (27) 374 (75) 8 9 6 9
Net operating cash flow 220 49 210 50 53 144 150 151 158
Capital ex penditure (intangibles, tangibles) (254) (172) (108) (79) (55) (56) (41) (42) (43)
Free cash flow (35) (123) 102 (29) (2) 89 109 109 115
Acquisitions, Disposals, Financial assets (21) (50) - - - - - - -
Div idends, minority pay outs (54) (56) (36) (36) (60) (60) (62) (65) (68)
Capital measures, other 98 - 1,919 (565) (264) 22 20 (9) (10)
Change in net cash/debt (11) (229) 1,985 (630) (326) 50 67 35 37
Net cash (debt) (588) (817) 1,168 538 212 262 329 364 401
Balance Sheet
Fix ed assets 2,246 2,393 887 847 870 859 831 873 916
t/o Goodw ill 299 324 100 100 100 100 100 105 110
Current assets 929 908 2,211 958 963 1,031 1,116 1,227 1,348
t/o Inv entories 50 55 21 22 20 21 21 22 23
t/o Trade receiv ables 352 424 161 170 184 191 198 204 210
t/o Cash and equiv alents 478 372 2,005 695 365 415 482 527 573
Group equity 1,599 1,726 1,667 1,249 1,285 1,331 1,377 1,501 1,636
t/o Shareholders' equity 1,555 1,699 1,645 1,229 1,264 1,310 1,356 1,479 1,613
Interest-bearing liabilities 1,065 1,189 837 157 153 153 153 162 172
Other liabilties and prov isions 511 385 595 398 395 406 417 436 456
t/o Trade liabilities 129 141 73 90 80 83 86 90 95
Balance sheet total 3,175 3,300 3,098 1,804 1,833 1,890 1,947 2,099 2,265
Net w orking capital 273 338 108 102 124 129 133 136 138
Capital employ ed (incl. Goodw ill) 2,519 2,730 995 948 994 988 965 1,008 1,054
Ratios
Rev enue, y /y 3.0% 9.0% 5.2% -49.9% -27.1% 3.7% 3.7% 3.0% 3.0%
EBITDA margin (adj.) 13.5% 10.6% 9.1% 93.6% 13.7% 14.0% 14.2% 14.3% 14.3%
EBIT margin (adj.) 8.1% 5.6% 5.2% 88.1% 8.3% 8.8% 8.9% 9.5% 9.5%
EPS (adj.), y /y 11.9% -36.3% -12.5% n/m -93.6% 7.5% 2.6% 9.3% 3.1%
Net w orking capital intensity (as a % of sales) 10.4% 11.8% 3.6% 6.7% 11.3% 11.3% 11.3% 11.1% 11.0%
DSOs (trade receiv ables as day s of rev s) 49 54 19 41 61 61 61 61 61
Inv entories as a % of rev enue 1.9% 1.9% 0.7% 1.4% 1.8% 1.8% 1.8% 1.8% 1.8%
Net debt (cash) / EBITDA (adj.) 1.7 2.7 (4.2) (0.4) (1.4) (1.6) (2.0) (2.1) (2.2)
EBITDA (adj.) / Capex 1.4 1.8 2.5 18.0 2.7 2.9 4.1 4.1 4.1
Free CF y ield (FCF / market cap) -1.6% -5.4% 4.2% -1.7% -0.1% 4.9% 6.0% 6.1% 6.4%
Oper. FCF y ield ([FCF - net int. tax ed] / EV) -0.3% -3.0% 10.1% 4.4% -0.0% 5.7% 7.2% 7.4% 7.9%
European Healthcare, 11 September 2015
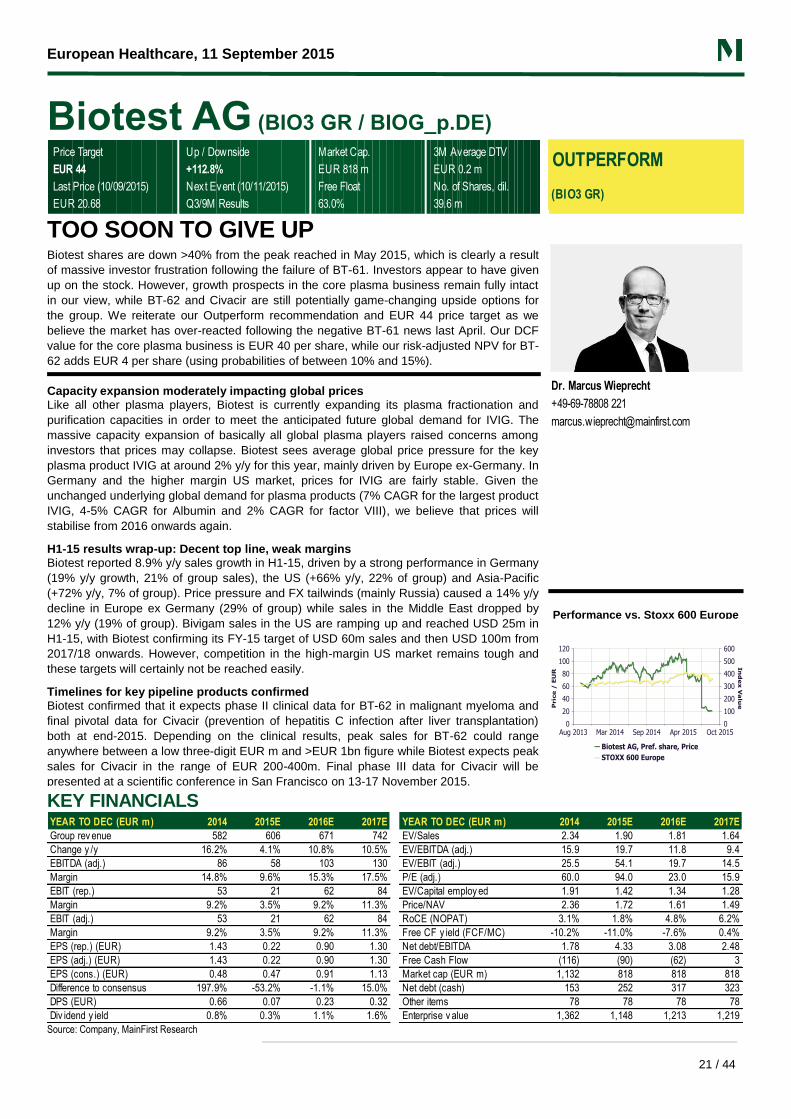
21 / 44
Biotest AG (BIO3 GR / BIOG_p.DE)
Price Target Up / Downside Market Cap. 3M Average DTV
EUR 44 +112.8% EUR 818 m EUR 0.2 m
Last Price (10/09/2015) Next Event (10/11/2015) Free Float No. of Shares, dil.
EUR 20.68 Q3/9M Results 63.0% 39.6 m
OUTPERFORM
(BIO3 GR)
TOO SOON TO GIVE UP Biotest shares are down >40% from the peak reached in May 2015, which is clearly a result
of massive investor frustration following the failure of BT-61. Investors appear to have given
up on the stock. However, growth prospects in the core plasma business remain fully intact
in our view, while BT-62 and Civacir are still potentially game-changing upside options for
the group. We reiterate our Outperform recommendation and EUR 44 price target as we
believe the market has over-reacted following the negative BT-61 news last April. Our DCF
value for the core plasma business is EUR 40 per share, while our risk-adjusted NPV for BT-
62 adds EUR 4 per share (using probabilities of between 10% and 15%).
Capacity expansion moderately impacting global prices Like all other plasma players, Biotest is currently expanding its plasma fractionation and
purification capacities in order to meet the anticipated future global demand for IVIG. The
massive capacity expansion of basically all global plasma players raised concerns among
investors that prices may collapse. Biotest sees average global price pressure for the key
plasma product IVIG at around 2% y/y for this year, mainly driven by Europe ex-Germany. In
Germany and the higher margin US market, prices for IVIG are fairly stable. Given the
unchanged underlying global demand for plasma products (7% CAGR for the largest product
IVIG, 4-5% CAGR for Albumin and 2% CAGR for factor VIII), we believe that prices will
stabilise from 2016 onwards again.
H1-15 results wrap-up: Decent top line, weak margins Biotest reported 8.9% y/y sales growth in H1-15, driven by a strong performance in Germany
(19% y/y growth, 21% of group sales), the US (+66% y/y, 22% of group) and Asia-Pacific
(+72% y/y, 7% of group). Price pressure and FX tailwinds (mainly Russia) caused a 14% y/y
decline in Europe ex Germany (29% of group) while sales in the Middle East dropped by
12% y/y (19% of group). Bivigam sales in the US are ramping up and reached USD 25m in
H1-15, with Biotest confirming its FY-15 target of USD 60m sales and then USD 100m from
2017/18 onwards. However, competition in the high-margin US market remains tough and
these targets will certainly not be reached easily.
Timelines for key pipeline products confirmed Biotest confirmed that it expects phase II clinical data for BT-62 in malignant myeloma and
final pivotal data for Civacir (prevention of hepatitis C infection after liver transplantation)
both at end-2015. Depending on the clinical results, peak sales for BT-62 could range
anywhere between a low three-digit EUR m and >EUR 1bn figure while Biotest expects peak
sales for Civacir in the range of EUR 200-400m. Final phase III data for Civacir will be
presented at a scientific conference in San Francisco on 13-17 November 2015.
Dr. Marcus Wieprecht
+49-69-78808 221
Performance vs. Stoxx 600 Europe
KEY FINANCIALS
Source: Company, MainFirst Research
YEAR TO DEC (EUR m) 2014 2015E 2016E 2017E YEAR TO DEC (EUR m) 2014 2015E 2016E 2017E
Group rev enue 582 606 671 742 EV/Sales 2.34 1.90 1.81 1.64
Change y /y 16.2% 4.1% 10.8% 10.5% EV/EBITDA (adj.) 15.9 19.7 11.8 9.4
EBITDA (adj.) 86 58 103 130 EV/EBIT (adj.) 25.5 54.1 19.7 14.5
Margin 14.8% 9.6% 15.3% 17.5% P/E (adj.) 60.0 94.0 23.0 15.9
EBIT (rep.) 53 21 62 84 EV/Capital employ ed 1.91 1.42 1.34 1.28
Margin 9.2% 3.5% 9.2% 11.3% Price/NAV 2.36 1.72 1.61 1.49
EBIT (adj.) 53 21 62 84 RoCE (NOPAT) 3.1% 1.8% 4.8% 6.2%
Margin 9.2% 3.5% 9.2% 11.3% Free CF y ield (FCF/MC) -10.2% -11.0% -7.6% 0.4%
EPS (rep.) (EUR) 1.43 0.22 0.90 1.30 Net debt/EBITDA 1.78 4.33 3.08 2.48
EPS (adj.) (EUR) 1.43 0.22 0.90 1.30 Free Cash Flow (116) (90) (62) 3
EPS (cons.) (EUR) 0.48 0.47 0.91 1.13 Market cap (EUR m) 1,132 818 818 818
Difference to consensus 197.9% -53.2% -1.1% 15.0% Net debt (cash) 153 252 317 323
DPS (EUR) 0.66 0.07 0.23 0.32 Other items 78 78 78 78
Div idend y ield 0.8% 0.3% 1.1% 1.6% Enterprise v alue 1,362 1,148 1,213 1,219
European Healthcare, 11 September 2015
22 / 44
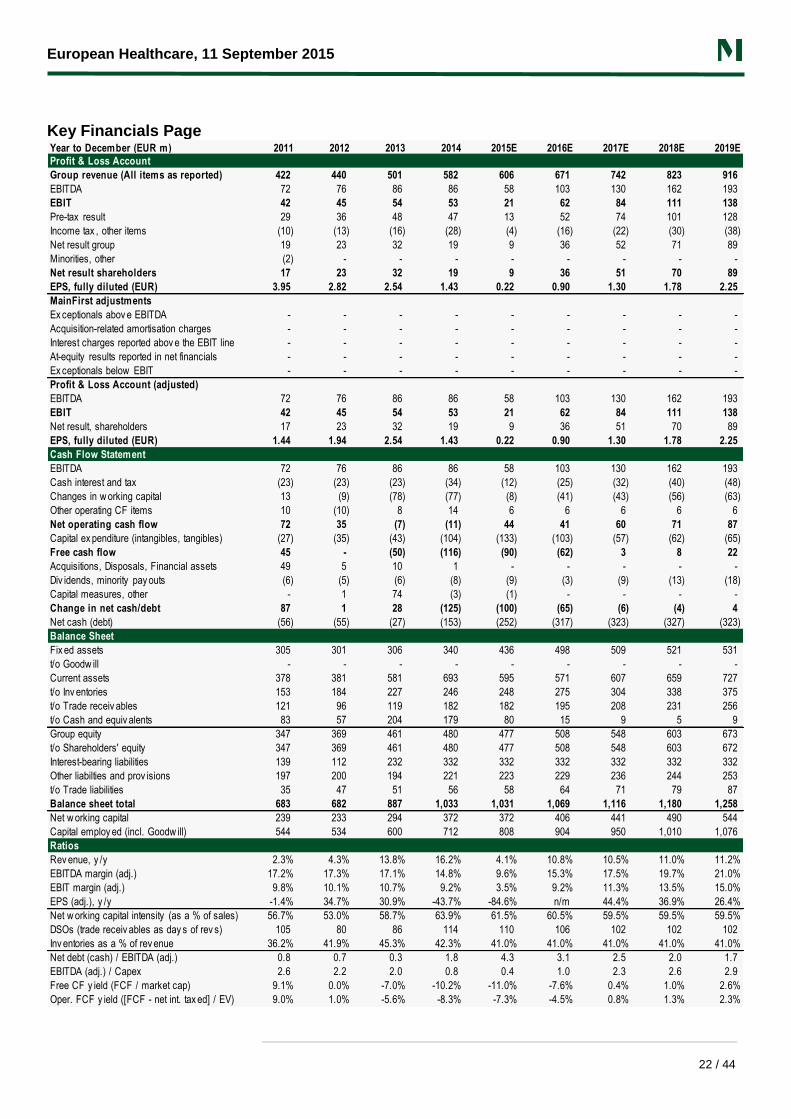
Key Financials Page
Year to December (EUR m) 2011 2012 2013 2014 2015E 2016E 2017E 2018E 2019E
Profit & Loss Account
Group revenue (All items as reported) 422 440 501 582 606 671 742 823 916
EBITDA 72 76 86 86 58 103 130 162 193
EBIT 42 45 54 53 21 62 84 111 138
Pre-tax result 29 36 48 47 13 52 74 101 128
Income tax , other items (10) (13) (16) (28) (4) (16) (22) (30) (38)
Net result group 19 23 32 19 9 36 52 71 89
Minorities, other (2) - - - - - - - -
Net result shareholders 17 23 32 19 9 36 51 70 89
EPS, fully diluted (EUR) 3.95 2.82 2.54 1.43 0.22 0.90 1.30 1.78 2.25
MainFirst adjustments
Ex ceptionals abov e EBITDA - - - - - - - - -
Acquisition-related amortisation charges - - - - - - - - -
Interest charges reported abov e the EBIT line - - - - - - - - -
At-equity results reported in net financials - - - - - - - - -
Ex ceptionals below EBIT - - - - - - - - -
Profit & Loss Account (adjusted)
EBITDA 72 76 86 86 58 103 130 162 193
EBIT 42 45 54 53 21 62 84 111 138
Net result, shareholders 17 23 32 19 9 36 51 70 89
EPS, fully diluted (EUR) 1.44 1.94 2.54 1.43 0.22 0.90 1.30 1.78 2.25
Cash Flow Statement
EBITDA 72 76 86 86 58 103 130 162 193
Cash interest and tax (23) (23) (23) (34) (12) (25) (32) (40) (48)
Changes in w orking capital 13 (9) (78) (77) (8) (41) (43) (56) (63)
Other operating CF items 10 (10) 8 14 6 6 6 6 6
Net operating cash flow 72 35 (7) (11) 44 41 60 71 87
Capital ex penditure (intangibles, tangibles) (27) (35) (43) (104) (133) (103) (57) (62) (65)
Free cash flow 45 - (50) (116) (90) (62) 3 8 22
Acquisitions, Disposals, Financial assets 49 5 10 1 - - - - -
Div idends, minority pay outs (6) (5) (6) (8) (9) (3) (9) (13) (18)
Capital measures, other - 1 74 (3) (1) - - - -
Change in net cash/debt 87 1 28 (125) (100) (65) (6) (4) 4
Net cash (debt) (56) (55) (27) (153) (252) (317) (323) (327) (323)
Balance Sheet
Fix ed assets 305 301 306 340 436 498 509 521 531
t/o Goodw ill - - - - - - - - -
Current assets 378 381 581 693 595 571 607 659 727
t/o Inv entories 153 184 227 246 248 275 304 338 375
t/o Trade receiv ables 121 96 119 182 182 195 208 231 256
t/o Cash and equiv alents 83 57 204 179 80 15 9 5 9
Group equity 347 369 461 480 477 508 548 603 673
t/o Shareholders' equity 347 369 461 480 477 508 548 603 672
Interest-bearing liabilities 139 112 232 332 332 332 332 332 332
Other liabilties and prov isions 197 200 194 221 223 229 236 244 253
t/o Trade liabilities 35 47 51 56 58 64 71 79 87
Balance sheet total 683 682 887 1,033 1,031 1,069 1,116 1,180 1,258
Net w orking capital 239 233 294 372 372 406 441 490 544
Capital employ ed (incl. Goodw ill) 544 534 600 712 808 904 950 1,010 1,076
Ratios
Rev enue, y /y 2.3% 4.3% 13.8% 16.2% 4.1% 10.8% 10.5% 11.0% 11.2%
EBITDA margin (adj.) 17.2% 17.3% 17.1% 14.8% 9.6% 15.3% 17.5% 19.7% 21.0%
EBIT margin (adj.) 9.8% 10.1% 10.7% 9.2% 3.5% 9.2% 11.3% 13.5% 15.0%
EPS (adj.), y /y -1.4% 34.7% 30.9% -43.7% -84.6% n/m 44.4% 36.9% 26.4%
Net w orking capital intensity (as a % of sales) 56.7% 53.0% 58.7% 63.9% 61.5% 60.5% 59.5% 59.5% 59.5%
DSOs (trade receiv ables as day s of rev s) 105 80 86 114 110 106 102 102 102
Inv entories as a % of rev enue 36.2% 41.9% 45.3% 42.3% 41.0% 41.0% 41.0% 41.0% 41.0%
Net debt (cash) / EBITDA (adj.) 0.8 0.7 0.3 1.8 4.3 3.1 2.5 2.0 1.7
EBITDA (adj.) / Capex 2.6 2.2 2.0 0.8 0.4 1.0 2.3 2.6 2.9
Free CF y ield (FCF / market cap) 9.1% 0.0% -7.0% -10.2% -11.0% -7.6% 0.4% 1.0% 2.6%
Oper. FCF y ield ([FCF - net int. tax ed] / EV) 9.0% 1.0% -5.6% -8.3% -7.3% -4.5% 0.8% 1.3% 2.3%
European Healthcare, 11 September 2015
23 / 44
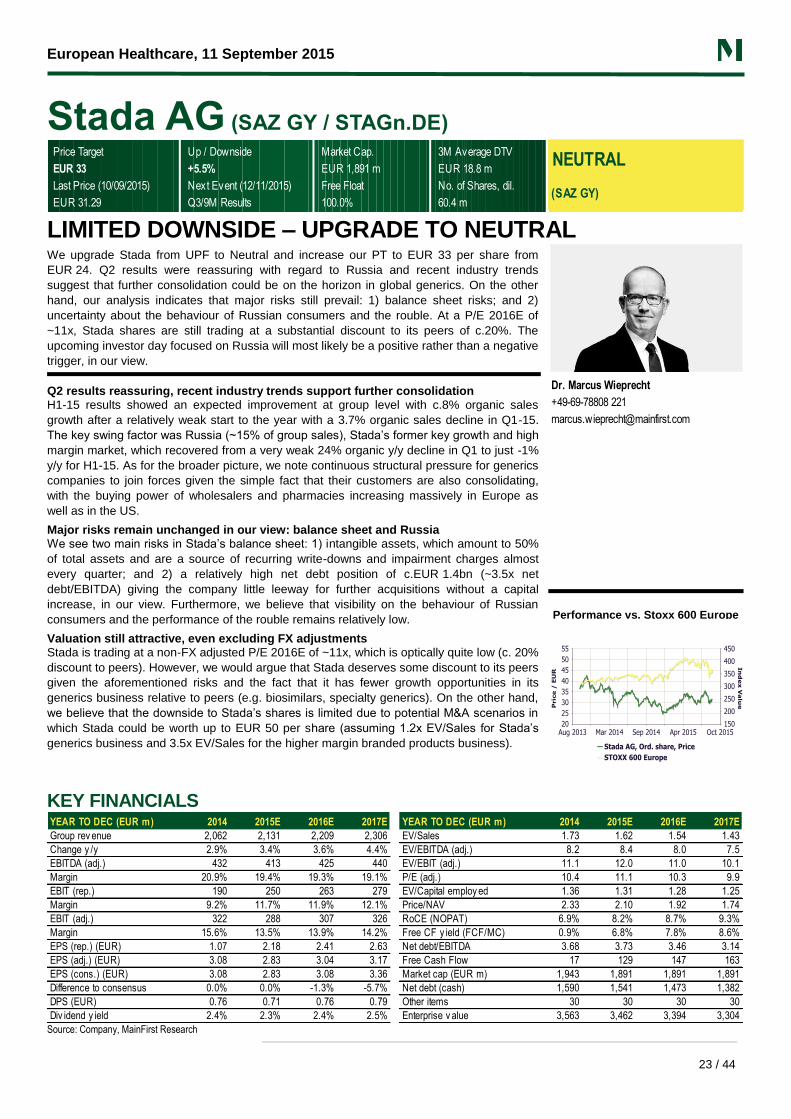
Stada AG (SAZ GY / STAGn.DE)
Price Target Up / Downside Market Cap. 3M Average DTV
EUR 33 +5.5% EUR 1,891 m EUR 18.8 m
Last Price (10/09/2015) Next Event (12/11/2015) Free Float No. of Shares, dil.
EUR 31.29 Q3/9M Results 100.0% 60.4 m
NEUTRAL
(SAZ GY)
LIMITED DOWNSIDE – UPGRADE TO NEUTRAL We upgrade Stada from UPF to Neutral and increase our PT to EUR 33 per share from
EUR 24. Q2 results were reassuring with regard to Russia and recent industry trends
suggest that further consolidation could be on the horizon in global generics. On the other
hand, our analysis indicates that major risks still prevail: 1) balance sheet risks; and 2)
uncertainty about the behaviour of Russian consumers and the rouble. At a P/E 2016E of
~11x, Stada shares are still trading at a substantial discount to its peers of c.20%. The
upcoming investor day focused on Russia will most likely be a positive rather than a negative
trigger, in our view.
Q2 results reassuring, recent industry trends support further consolidation H1-15 results showed an expected improvement at group level with c.8% organic sales
growth after a relatively weak start to the year with a 3.7% organic sales decline in Q1-15.
The key swing factor was Russia (~15% of group sales), Stada’s former key growth and high
margin market, which recovered from a very weak 24% organic y/y decline in Q1 to just -1%
y/y for H1-15. As for the broader picture, we note continuous structural pressure for generics
companies to join forces given the simple fact that their customers are also consolidating,
with the buying power of wholesalers and pharmacies increasing massively in Europe as
well as in the US.
Major risks remain unchanged in our view: balance sheet and Russia We see two main risks in Stada’s balance sheet: 1) intangible assets, which amount to 50%
of total assets and are a source of recurring write-downs and impairment charges almost
every quarter; and 2) a relatively high net debt position of c.EUR 1.4bn (~3.5x net
debt/EBITDA) giving the company little leeway for further acquisitions without a capital
increase, in our view. Furthermore, we believe that visibility on the behaviour of Russian
consumers and the performance of the rouble remains relatively low.
Valuation still attractive, even excluding FX adjustments Stada is trading at a non-FX adjusted P/E 2016E of ~11x, which is optically quite low (c. 20%
discount to peers). However, we would argue that Stada deserves some discount to its peers
given the aforementioned risks and the fact that it has fewer growth opportunities in its
generics business relative to peers (e.g. biosimilars, specialty generics). On the other hand,
we believe that the downside to Stada’s shares is limited due to potential M&A scenarios in
which Stada could be worth up to EUR 50 per share (assuming 1.2x EV/Sales for Stada’s
generics business and 3.5x EV/Sales for the higher margin branded products business).
Dr. Marcus Wieprecht
+49-69-78808 221
Performance vs. Stoxx 600 Europe
KEY FINANCIALS
Source: Company, MainFirst Research
YEAR TO DEC (EUR m) 2014 2015E 2016E 2017E YEAR TO DEC (EUR m) 2014 2015E 2016E 2017E
Group rev enue 2,062 2,131 2,209 2,306 EV/Sales 1.73 1.62 1.54 1.43
Change y /y 2.9% 3.4% 3.6% 4.4% EV/EBITDA (adj.) 8.2 8.4 8.0 7.5
EBITDA (adj.) 432 413 425 440 EV/EBIT (adj.) 11.1 12.0 11.0 10.1
Margin 20.9% 19.4% 19.3% 19.1% P/E (adj.) 10.4 11.1 10.3 9.9
EBIT (rep.) 190 250 263 279 EV/Capital employ ed 1.36 1.31 1.28 1.25
Margin 9.2% 11.7% 11.9% 12.1% Price/NAV 2.33 2.10 1.92 1.74
EBIT (adj.) 322 288 307 326 RoCE (NOPAT) 6.9% 8.2% 8.7% 9.3%
Margin 15.6% 13.5% 13.9% 14.2% Free CF y ield (FCF/MC) 0.9% 6.8% 7.8% 8.6%
EPS (rep.) (EUR) 1.07 2.18 2.41 2.63 Net debt/EBITDA 3.68 3.73 3.46 3.14
EPS (adj.) (EUR) 3.08 2.83 3.04 3.17 Free Cash Flow 17 129 147 163
EPS (cons.) (EUR) 3.08 2.83 3.08 3.36 Market cap (EUR m) 1,943 1,891 1,891 1,891
Difference to consensus 0.0% 0.0% -1.3% -5.7% Net debt (cash) 1,590 1,541 1,473 1,382
DPS (EUR) 0.76 0.71 0.76 0.79 Other items 30 30 30 30
Div idend y ield 2.4% 2.3% 2.4% 2.5% Enterprise v alue 3,563 3,462 3,394 3,304
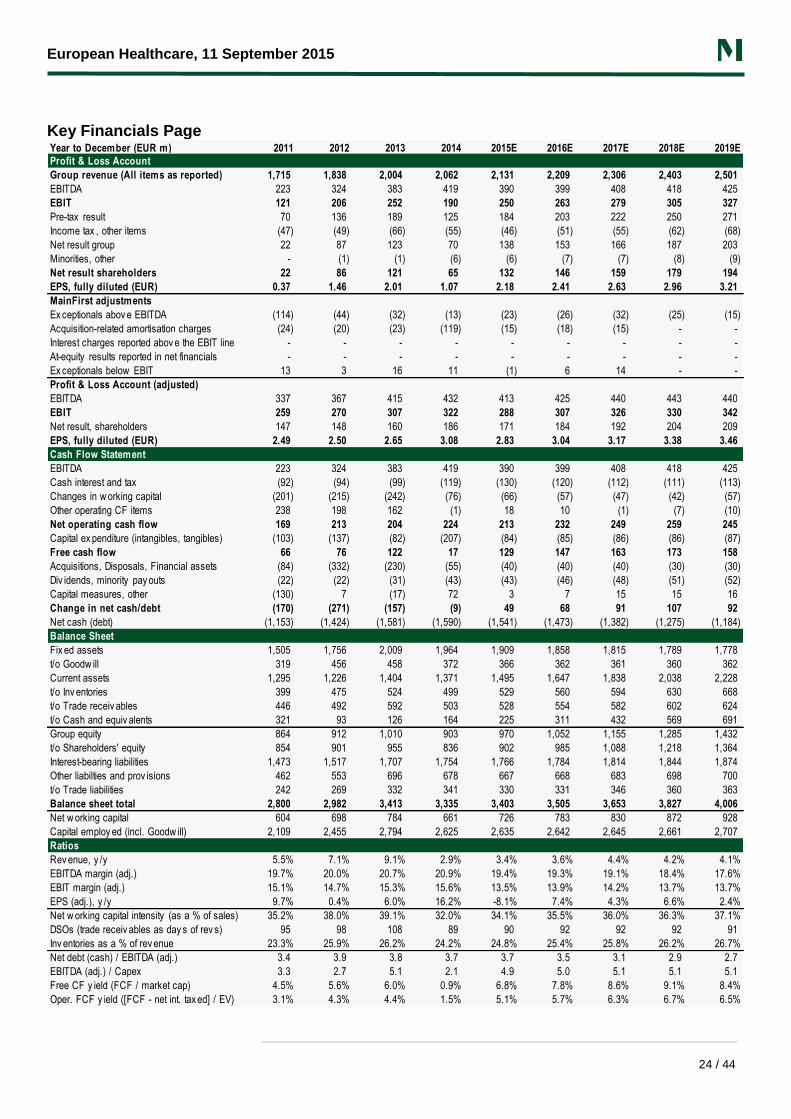
European Healthcare, 11 September 2015
24 / 44
Key Financials Page
Year to December (EUR m) 2011 2012 2013 2014 2015E 2016E 2017E 2018E 2019E
Profit & Loss Account
Group revenue (All items as reported) 1,715 1,838 2,004 2,062 2,131 2,209 2,306 2,403 2,501
EBITDA 223 324 383 419 390 399 408 418 425
EBIT 121 206 252 190 250 263 279 305 327
Pre-tax result 70 136 189 125 184 203 222 250 271
Income tax , other items (47) (49) (66) (55) (46) (51) (55) (62) (68)
Net result group 22 87 123 70 138 153 166 187 203
Minorities, other - (1) (1) (6) (6) (7) (7) (8) (9)
Net result shareholders 22 86 121 65 132 146 159 179 194
EPS, fully diluted (EUR) 0.37 1.46 2.01 1.07 2.18 2.41 2.63 2.96 3.21
MainFirst adjustments
Ex ceptionals abov e EBITDA (114) (44) (32) (13) (23) (26) (32) (25) (15)
Acquisition-related amortisation charges (24) (20) (23) (119) (15) (18) (15) - -
Interest charges reported abov e the EBIT line - - - - - - - - -
At-equity results reported in net financials - - - - - - - - -
Ex ceptionals below EBIT 13 3 16 11 (1) 6 14 - -
Profit & Loss Account (adjusted)
EBITDA 337 367 415 432 413 425 440 443 440
EBIT 259 270 307 322 288 307 326 330 342
Net result, shareholders 147 148 160 186 171 184 192 204 209
EPS, fully diluted (EUR) 2.49 2.50 2.65 3.08 2.83 3.04 3.17 3.38 3.46
Cash Flow Statement
EBITDA 223 324 383 419 390 399 408 418 425
Cash interest and tax (92) (94) (99) (119) (130) (120) (112) (111) (113)
Changes in w orking capital (201) (215) (242) (76) (66) (57) (47) (42) (57)
Other operating CF items 238 198 162 (1) 18 10 (1) (7) (10)
Net operating cash flow 169 213 204 224 213 232 249 259 245
Capital ex penditure (intangibles, tangibles) (103) (137) (82) (207) (84) (85) (86) (86) (87)
Free cash flow 66 76 122 17 129 147 163 173 158
Acquisitions, Disposals, Financial assets (84) (332) (230) (55) (40) (40) (40) (30) (30)
Div idends, minority pay outs (22) (22) (31) (43) (43) (46) (48) (51) (52)
Capital measures, other (130) 7 (17) 72 3 7 15 15 16
Change in net cash/debt (170) (271) (157) (9) 49 68 91 107 92
Net cash (debt) (1,153) (1,424) (1,581) (1,590) (1,541) (1,473) (1,382) (1,275) (1,184)
Balance Sheet
Fix ed assets 1,505 1,756 2,009 1,964 1,909 1,858 1,815 1,789 1,778
t/o Goodw ill 319 456 458 372 366 362 361 360 362
Current assets 1,295 1,226 1,404 1,371 1,495 1,647 1,838 2,038 2,228
t/o Inv entories 399 475 524 499 529 560 594 630 668
t/o Trade receiv ables 446 492 592 503 528 554 582 602 624
t/o Cash and equiv alents 321 93 126 164 225 311 432 569 691
Group equity 864 912 1,010 903 970 1,052 1,155 1,285 1,432
t/o Shareholders' equity 854 901 955 836 902 985 1,088 1,218 1,364
Interest-bearing liabilities 1,473 1,517 1,707 1,754 1,766 1,784 1,814 1,844 1,874
Other liabilties and prov isions 462 553 696 678 667 668 683 698 700
t/o Trade liabilities 242 269 332 341 330 331 346 360 363
Balance sheet total 2,800 2,982 3,413 3,335 3,403 3,505 3,653 3,827 4,006
Net w orking capital 604 698 784 661 726 783 830 872 928
Capital employ ed (incl. Goodw ill) 2,109 2,455 2,794 2,625 2,635 2,642 2,645 2,661 2,707
Ratios
Rev enue, y /y 5.5% 7.1% 9.1% 2.9% 3.4% 3.6% 4.4% 4.2% 4.1%
EBITDA margin (adj.) 19.7% 20.0% 20.7% 20.9% 19.4% 19.3% 19.1% 18.4% 17.6%
EBIT margin (adj.) 15.1% 14.7% 15.3% 15.6% 13.5% 13.9% 14.2% 13.7% 13.7%
EPS (adj.), y /y 9.7% 0.4% 6.0% 16.2% -8.1% 7.4% 4.3% 6.6% 2.4%
Net w orking capital intensity (as a % of sales) 35.2% 38.0% 39.1% 32.0% 34.1% 35.5% 36.0% 36.3% 37.1%
DSOs (trade receiv ables as day s of rev s) 95 98 108 89 90 92 92 92 91
Inv entories as a % of rev enue 23.3% 25.9% 26.2% 24.2% 24.8% 25.4% 25.8% 26.2% 26.7%
Net debt (cash) / EBITDA (adj.) 3.4 3.9 3.8 3.7 3.7 3.5 3.1 2.9 2.7
EBITDA (adj.) / Capex 3.3 2.7 5.1 2.1 4.9 5.0 5.1 5.1 5.1
Free CF y ield (FCF / market cap) 4.5% 5.6% 6.0% 0.9% 6.8% 7.8% 8.6% 9.1% 8.4%
Oper. FCF y ield ([FCF - net int. tax ed] / EV) 3.1% 4.3% 4.4% 1.5% 5.1% 5.7% 6.3% 6.7% 6.5%
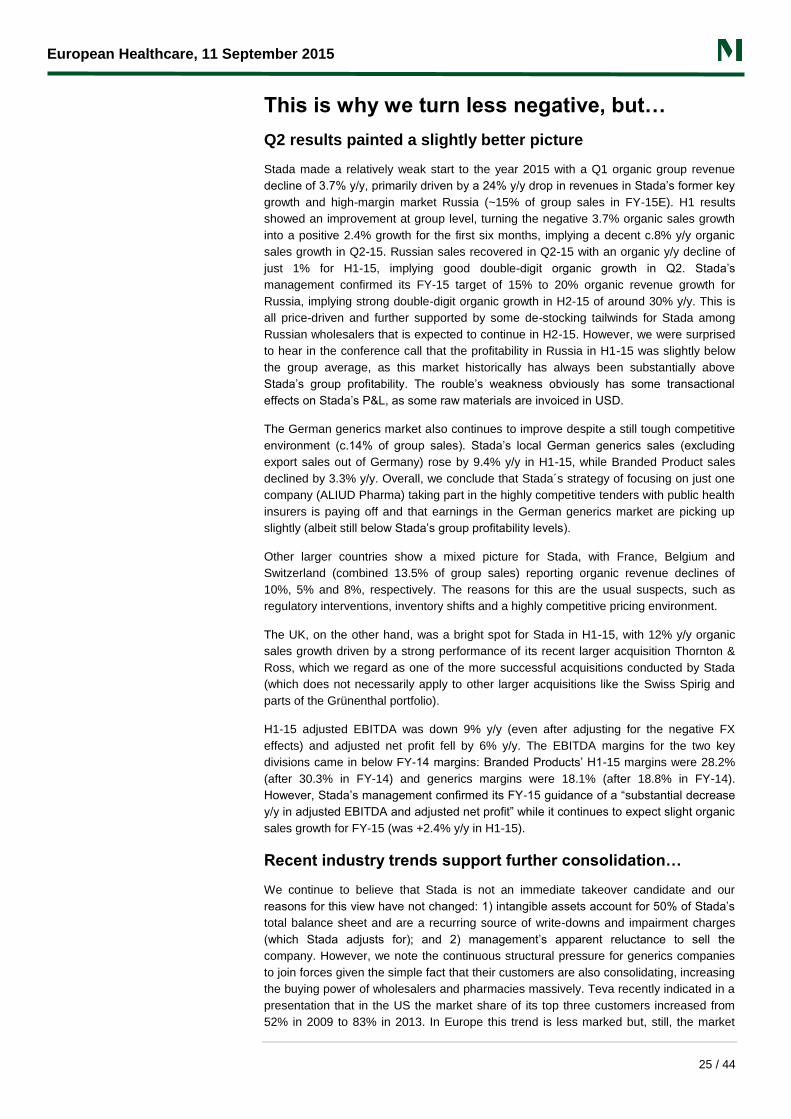
European Healthcare, 11 September 2015
25 / 44
This is why we turn less negative, but…
Q2 results painted a slightly better picture
Stada made a relatively weak start to the year 2015 with a Q1 organic group revenue
decline of 3.7% y/y, primarily driven by a 24% y/y drop in revenues in Stada’s former key
growth and high-margin market Russia (~15% of group sales in FY-15E). H1 results
showed an improvement at group level, turning the negative 3.7% organic sales growth
into a positive 2.4% growth for the first six months, implying a decent c.8% y/y organic
sales growth in Q2-15. Russian sales recovered in Q2-15 with an organic y/y decline of
just 1% for H1-15, implying good double-digit organic growth in Q2. Stada’s
management confirmed its FY-15 target of 15% to 20% organic revenue growth for
Russia, implying strong double-digit organic growth in H2-15 of around 30% y/y. This is
all price-driven and further supported by some de-stocking tailwinds for Stada among
Russian wholesalers that is expected to continue in H2-15. However, we were surprised
to hear in the conference call that the profitability in Russia in H1-15 was slightly below
the group average, as this market historically has always been substantially above
Stada’s group profitability. The rouble’s weakness obviously has some transactional
effects on Stada’s P&L, as some raw materials are invoiced in USD.
The German generics market also continues to improve despite a still tough competitive
environment (c.14% of group sales). Stada’s local German generics sales (excluding
export sales out of Germany) rose by 9.4% y/y in H1-15, while Branded Product sales
declined by 3.3% y/y. Overall, we conclude that Stada´s strategy of focusing on just one
company (ALIUD Pharma) taking part in the highly competitive tenders with public health
insurers is paying off and that earnings in the German generics market are picking up
slightly (albeit still below Stada’s group profitability levels).
Other larger countries show a mixed picture for Stada, with France, Belgium and
Switzerland (combined 13.5% of group sales) reporting organic revenue declines of
10%, 5% and 8%, respectively. The reasons for this are the usual suspects, such as
regulatory interventions, inventory shifts and a highly competitive pricing environment.
The UK, on the other hand, was a bright spot for Stada in H1-15, with 12% y/y organic
sales growth driven by a strong performance of its recent larger acquisition Thornton &
Ross, which we regard as one of the more successful acquisitions conducted by Stada
(which does not necessarily apply to other larger acquisitions like the Swiss Spirig and
parts of the Grünenthal portfolio).
H1-15 adjusted EBITDA was down 9% y/y (even after adjusting for the negative FX
effects) and adjusted net profit fell by 6% y/y. The EBITDA margins for the two key
divisions came in below FY-14 margins: Branded Products’ H1-15 margins were 28.2%
(after 30.3% in FY-14) and generics margins were 18.1% (after 18.8% in FY-14).
However, Stada’s management confirmed its FY-15 guidance of a “substantial decrease
y/y in adjusted EBITDA and adjusted net profit” while it continues to expect slight organic
sales growth for FY-15 (was +2.4% y/y in H1-15).
Recent industry trends support further consolidation…
We continue to believe that Stada is not an immediate takeover candidate and our
reasons for this view have not changed: 1) intangible assets account for 50% of Stada’s
total balance sheet and are a recurring source of write-downs and impairment charges
(which Stada adjusts for); and 2) management’s apparent reluctance to sell the
company. However, we note the continuous structural pressure for generics companies
to join forces given the simple fact that their customers are also consolidating, increasing
the buying power of wholesalers and pharmacies massively. Teva recently indicated in a
presentation that in the US the market share of its top three customers increased from
52% in 2009 to 83% in 2013. In Europe this trend is less marked but, still, the market
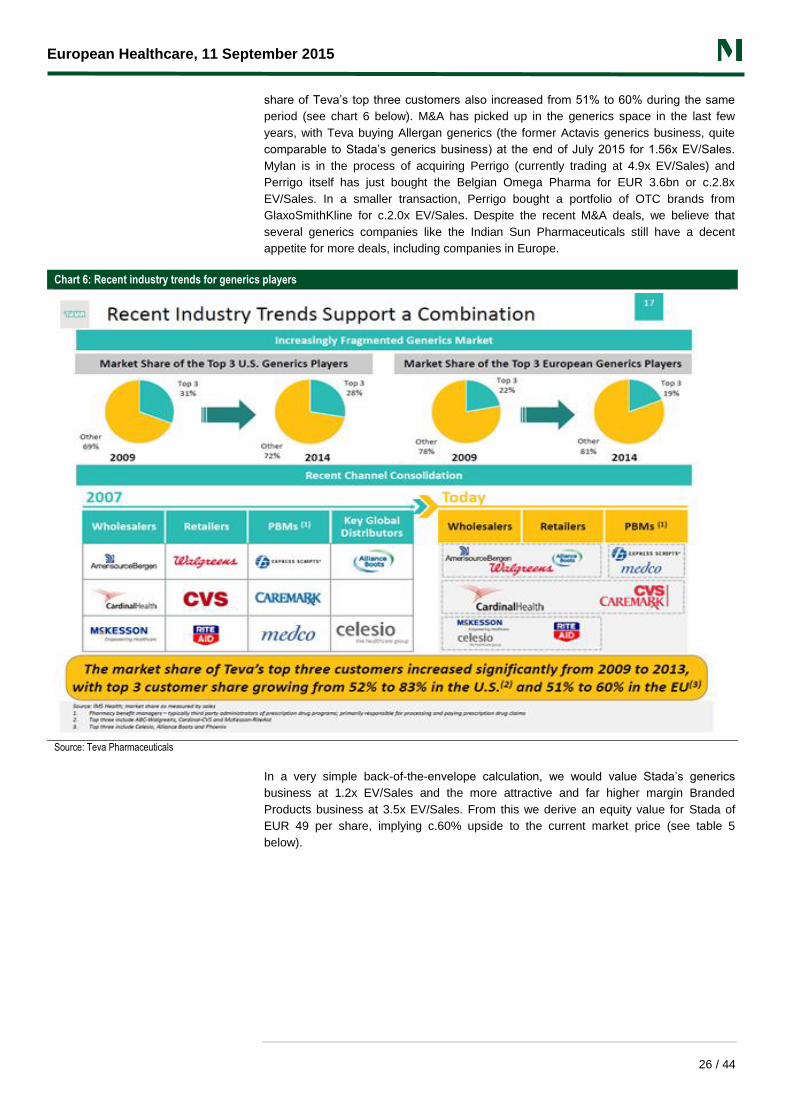
European Healthcare, 11 September 2015
26 / 44
share of Teva’s top three customers also increased from 51% to 60% during the same
period (see chart 6 below). M&A has picked up in the generics space in the last few
years, with Teva buying Allergan generics (the former Actavis generics business, quite
comparable to Stada’s generics business) at the end of July 2015 for 1.56x EV/Sales.
Mylan is in the process of acquiring Perrigo (currently trading at 4.9x EV/Sales) and
Perrigo itself has just bought the Belgian Omega Pharma for EUR 3.6bn or c.2.8x
EV/Sales. In a smaller transaction, Perrigo bought a portfolio of OTC brands from
GlaxoSmithKline for c.2.0x EV/Sales. Despite the recent M&A deals, we believe that
several generics companies like the Indian Sun Pharmaceuticals still have a decent
appetite for more deals, including companies in Europe.
Chart 6: Recent industry trends for generics players
Source: Teva Pharmaceuticals
In a very simple back-of-the-envelope calculation, we would value Stada’s generics
business at 1.2x EV/Sales and the more attractive and far higher margin Branded
Products business at 3.5x EV/Sales. From this we derive an equity value for Stada of
EUR 49 per share, implying c.60% upside to the current market price (see table 5
below).
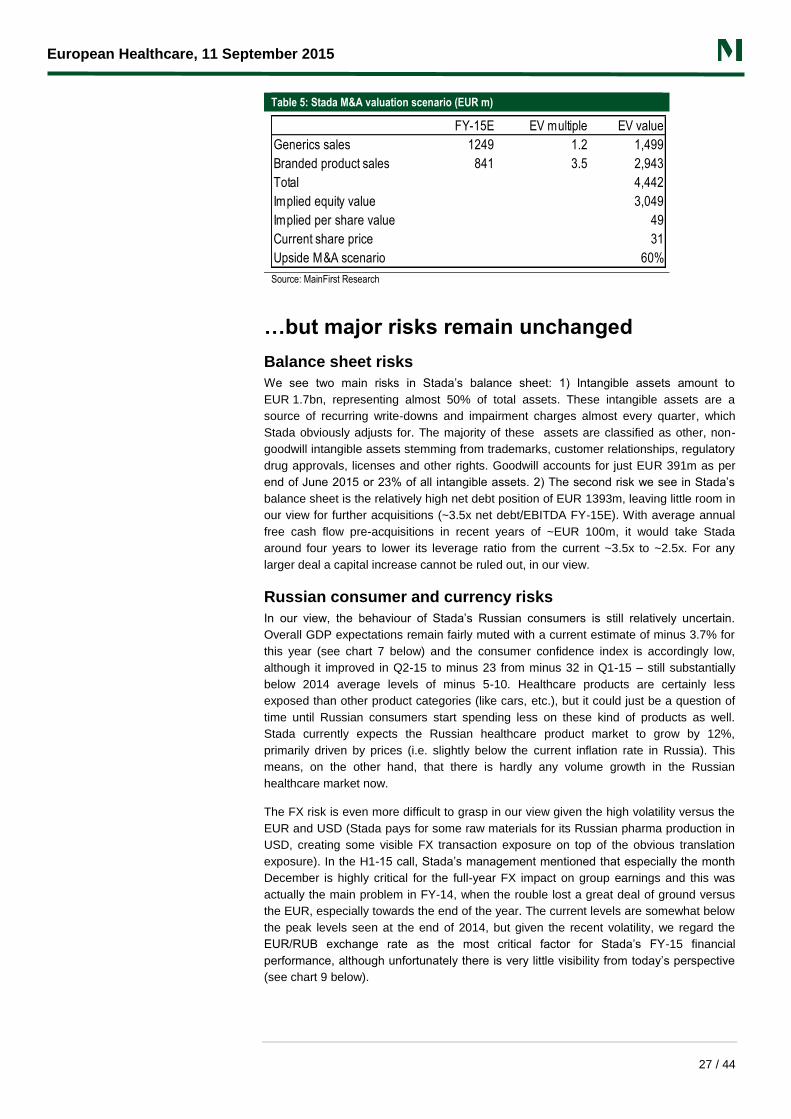
European Healthcare, 11 September 2015
27 / 44
Table 5: Stada M&A valuation scenario (EUR m)
Source: MainFirst Research
…but major risks remain unchanged
Balance sheet risks
We see two main risks in Stada’s balance sheet: 1) Intangible assets amount to
EUR 1.7bn, representing almost 50% of total assets. These intangible assets are a
source of recurring write-downs and impairment charges almost every quarter, which
Stada obviously adjusts for. The majority of these assets are classified as other, non-
goodwill intangible assets stemming from trademarks, customer relationships, regulatory
drug approvals, licenses and other rights. Goodwill accounts for just EUR 391m as per
end of June 2015 or 23% of all intangible assets. 2) The second risk we see in Stada’s
balance sheet is the relatively high net debt position of EUR 1393m, leaving little room in
our view for further acquisitions (~3.5x net debt/EBITDA FY-15E). With average annual
free cash flow pre-acquisitions in recent years of ~EUR 100m, it would take Stada
around four years to lower its leverage ratio from the current ~3.5x to ~2.5x. For any
larger deal a capital increase cannot be ruled out, in our view.
Russian consumer and currency risks
In our view, the behaviour of Stada’s Russian consumers is still relatively uncertain.
Overall GDP expectations remain fairly muted with a current estimate of minus 3.7% for
this year (see chart 7 below) and the consumer confidence index is accordingly low,
although it improved in Q2-15 to minus 23 from minus 32 in Q1-15 – still substantially
below 2014 average levels of minus 5-10. Healthcare products are certainly less
exposed than other product categories (like cars, etc.), but it could just be a question of
time until Russian consumers start spending less on these kind of products as well.
Stada currently expects the Russian healthcare product market to grow by 12%,
primarily driven by prices (i.e. slightly below the current inflation rate in Russia). This
means, on the other hand, that there is hardly any volume growth in the Russian
healthcare market now.
The FX risk is even more difficult to grasp in our view given the high volatility versus the
EUR and USD (Stada pays for some raw materials for its Russian pharma production in
USD, creating some visible FX transaction exposure on top of the obvious translation
exposure). In the H1-15 call, Stada’s management mentioned that especially the month
December is highly critical for the full-year FX impact on group earnings and this was
actually the main problem in FY-14, when the rouble lost a great deal of ground versus
the EUR, especially towards the end of the year. The current levels are somewhat below
the peak levels seen at the end of 2014, but given the recent volatility, we regard the
EUR/RUB exchange rate as the most critical factor for Stada’s FY-15 financial
performance, although unfortunately there is very little visibility from today’s perspective
(see chart 9 below).
FY-15E EV multiple EV value
Generics sales 1249 1.2 1,499
Branded product sales 841 3.5 2,943
Total 4,442
Implied equity value 3,049
Implied per share value 49
Current share price 31
Upside M&A scenario 60%
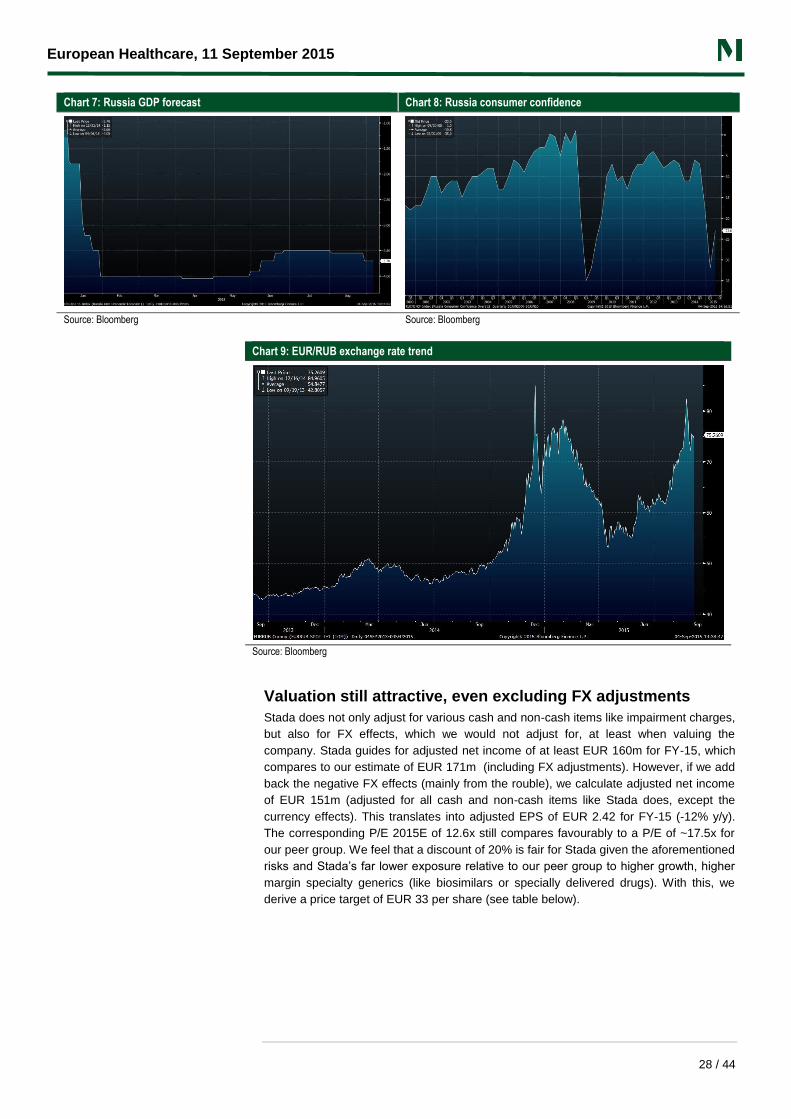
European Healthcare, 11 September 2015
28 / 44
Chart 7: Russia GDP forecast Chart 8: Russia consumer confidence
Source: Bloomberg Source: Bloomberg
Chart 9: EUR/RUB exchange rate trend
Source: Bloomberg
Valuation still attractive, even excluding FX adjustments
Stada does not only adjust for various cash and non-cash items like impairment charges,
but also for FX effects, which we would not adjust for, at least when valuing the
company. Stada guides for adjusted net income of at least EUR 160m for FY-15, which
compares to our estimate of EUR 171m (including FX adjustments). However, if we add
back the negative FX effects (mainly from the rouble), we calculate adjusted net income
of EUR 151m (adjusted for all cash and non-cash items like Stada does, except the
currency effects). This translates into adjusted EPS of EUR 2.42 for FY-15 (-12% y/y).
The corresponding P/E 2015E of 12.6x still compares favourably to a P/E of ~17.5x for
our peer group. We feel that a discount of 20% is fair for Stada given the aforementioned
risks and Stada’s far lower exposure relative to our peer group to higher growth, higher
margin specialty generics (like biosimilars or specially delivered drugs). With this, we
derive a price target of EUR 33 per share (see table below).
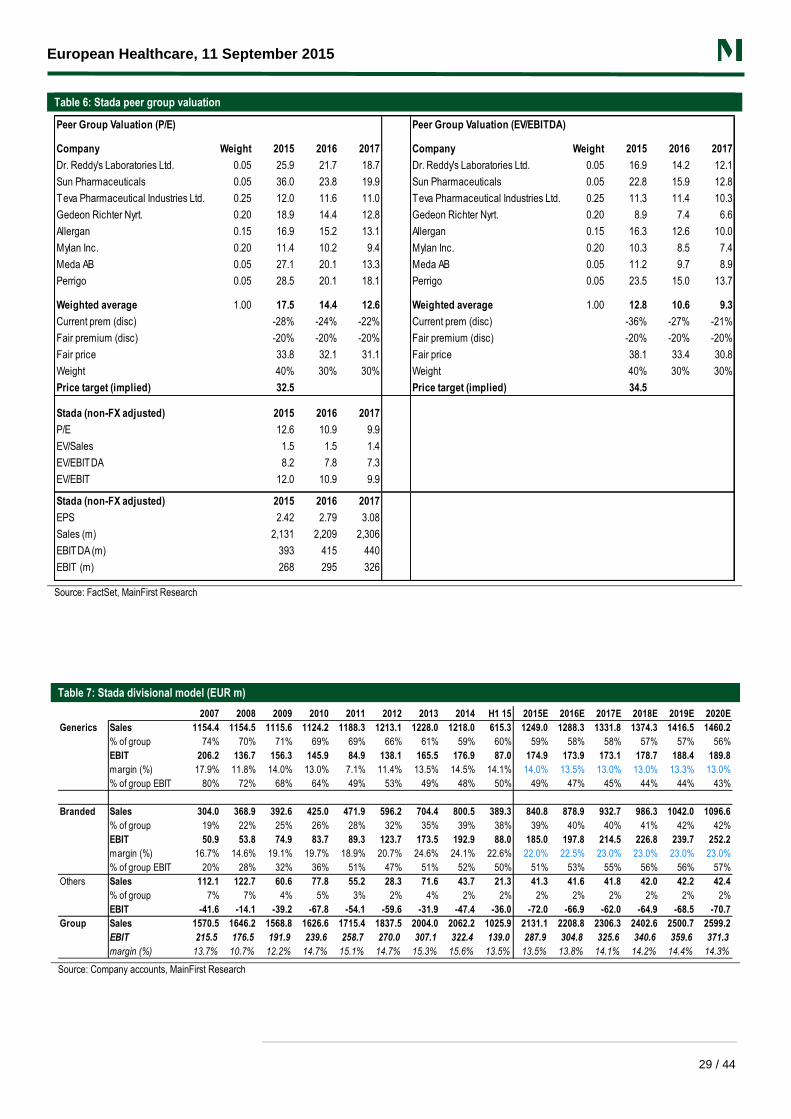
European Healthcare, 11 September 2015
29 / 44
Table 6: Stada peer group valuation
Source: FactSet, MainFirst Research
Peer Group Valuation (P/E) Peer Group Valuation (EV/EBITDA)
Company Weight 2015 2016 2017 Company Weight 2015 2016 2017
Dr. Reddy's Laboratories Ltd. 0.05 25.9 21.7 18.7 Dr. Reddy's Laboratories Ltd. 0.05 16.9 14.2 12.1
Sun Pharmaceuticals 0.05 36.0 23.8 19.9 Sun Pharmaceuticals 0.05 22.8 15.9 12.8
Teva Pharmaceutical Industries Ltd. 0.25 12.0 11.6 11.0 Teva Pharmaceutical Industries Ltd. 0.25 11.3 11.4 10.3
Gedeon Richter Nyrt. 0.20 18.9 14.4 12.8 Gedeon Richter Nyrt. 0.20 8.9 7.4 6.6
Allergan 0.15 16.9 15.2 13.1 Allergan 0.15 16.3 12.6 10.0
Mylan Inc. 0.20 11.4 10.2 9.4 Mylan Inc. 0.20 10.3 8.5 7.4
Meda AB 0.05 27.1 20.1 13.3 Meda AB 0.05 11.2 9.7 8.9
Perrigo 0.05 28.5 20.1 18.1 Perrigo 0.05 23.5 15.0 13.7
Weighted average 1.00 17.5 14.4 12.6 Weighted average 1.00 12.8 10.6 9.3
Current prem (disc) -28% -24% -22% Current prem (disc) -36% -27% -21%
Fair premium (disc) -20% -20% -20% Fair premium (disc) -20% -20% -20%
Fair price 33.8 32.1 31.1 Fair price 38.1 33.4 30.8
Weight 40% 30% 30% Weight 40% 30% 30%
Price target (implied) 32.5 Price target (implied) 34.5
Stada (non-FX adjusted) 2015 2016 2017
P/E 12.6 10.9 9.9
EV/Sales 1.5 1.5 1.4
EV/EBITDA 8.2 7.8 7.3
EV/EBIT 12.0 10.9 9.9
Stada (non-FX adjusted) 2015 2016 2017
EPS 2.42 2.79 3.08
Sales (m) 2,131 2,209 2,306
EBITDA (m) 393 415 440
EBIT (m) 268 295 326
Table 7: Stada divisional model (EUR m)
Source: Company accounts, MainFirst Research
2007 2008 2009 2010 2011 2012 2013 2014 H1 15 2015E 2016E 2017E 2018E 2019E 2020E
Generics Sales 1154.4 1154.5 1115.6 1124.2 1188.3 1213.1 1228.0 1218.0 615.3 1249.0 1288.3 1331.8 1374.3 1416.5 1460.2
% of group 74% 70% 71% 69% 69% 66% 61% 59% 60% 59% 58% 58% 57% 57% 56%
EBIT 206.2 136.7 156.3 145.9 84.9 138.1 165.5 176.9 87.0 174.9 173.9 173.1 178.7 188.4 189.8
margin (%) 17.9% 11.8% 14.0% 13.0% 7.1% 11.4% 13.5% 14.5% 14.1% 14.0% 13.5% 13.0% 13.0% 13.3% 13.0%
% of group EBIT 80% 72% 68% 64% 49% 53% 49% 48% 50% 49% 47% 45% 44% 44% 43%
Branded Sales 304.0 368.9 392.6 425.0 471.9 596.2 704.4 800.5 389.3 840.8 878.9 932.7 986.3 1042.0 1096.6
% of group 19% 22% 25% 26% 28% 32% 35% 39% 38% 39% 40% 40% 41% 42% 42%
EBIT 50.9 53.8 74.9 83.7 89.3 123.7 173.5 192.9 88.0 185.0 197.8 214.5 226.8 239.7 252.2
margin (%) 16.7% 14.6% 19.1% 19.7% 18.9% 20.7% 24.6% 24.1% 22.6% 22.0% 22.5% 23.0% 23.0% 23.0% 23.0%
% of group EBIT 20% 28% 32% 36% 51% 47% 51% 52% 50% 51% 53% 55% 56% 56% 57%
Others Sales 112.1 122.7 60.6 77.8 55.2 28.3 71.6 43.7 21.3 41.3 41.6 41.8 42.0 42.2 42.4
% of group 7% 7% 4% 5% 3% 2% 4% 2% 2% 2% 2% 2% 2% 2% 2%
EBIT -41.6 -14.1 -39.2 -67.8 -54.1 -59.6 -31.9 -47.4 -36.0 -72.0 -66.9 -62.0 -64.9 -68.5 -70.7
Group Sales 1570.5 1646.2 1568.8 1626.6 1715.4 1837.5 2004.0 2062.2 1025.9 2131.1 2208.8 2306.3 2402.6 2500.7 2599.2
EBIT 215.5 176.5 191.9 239.6 258.7 270.0 307.1 322.4 139.0 287.9 304.8 325.6 340.6 359.6 371.3
margin (%) 13.7% 10.7% 12.2% 14.7% 15.1% 14.7% 15.3% 15.6% 13.5% 13.5% 13.8% 14.1% 14.2% 14.4% 14.3%
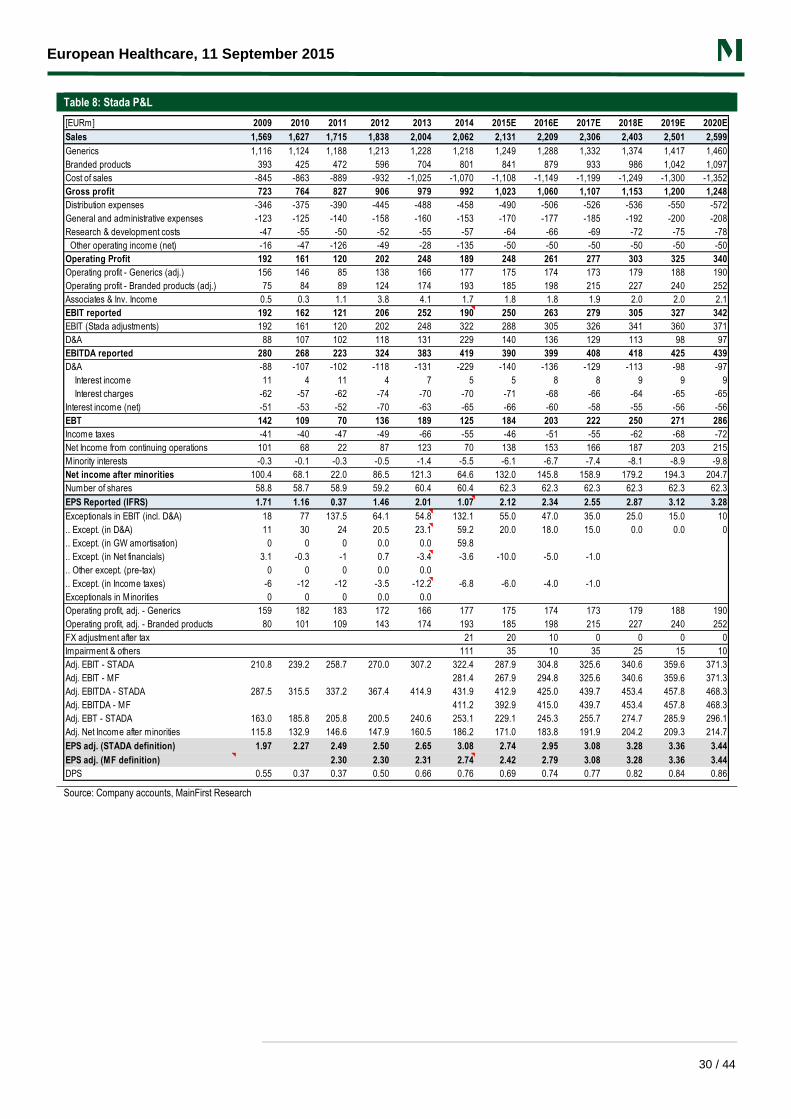
European Healthcare, 11 September 2015
30 / 44
Table 8: Stada P&L
Source: Company accounts, MainFirst Research
[EURm] 2009 2010 2011 2012 2013 2014 2015E 2016E 2017E 2018E 2019E 2020E
Sales 1,569 1,627 1,715 1,838 2,004 2,062 2,131 2,209 2,306 2,403 2,501 2,599
Generics 1,116 1,124 1,188 1,213 1,228 1,218 1,249 1,288 1,332 1,374 1,417 1,460
Branded products 393 425 472 596 704 801 841 879 933 986 1,042 1,097
Cost of sales -845 -863 -889 -932 -1,025 -1,070 -1,108 -1,149 -1,199 -1,249 -1,300 -1,352
Gross profit 723 764 827 906 979 992 1,023 1,060 1,107 1,153 1,200 1,248
Distribution expenses -346 -375 -390 -445 -488 -458 -490 -506 -526 -536 -550 -572
General and administrative expenses -123 -125 -140 -158 -160 -153 -170 -177 -185 -192 -200 -208
Research & development costs -47 -55 -50 -52 -55 -57 -64 -66 -69 -72 -75 -78
Other operating income (net) -16 -47 -126 -49 -28 -135 -50 -50 -50 -50 -50 -50
Operating Profit 192 161 120 202 248 189 248 261 277 303 325 340
Operating profit - Generics (adj.) 156 146 85 138 166 177 175 174 173 179 188 190
Operating profit - Branded products (adj.) 75 84 89 124 174 193 185 198 215 227 240 252
Associates & Inv. Income 0.5 0.3 1.1 3.8 4.1 1.7 1.8 1.8 1.9 2.0 2.0 2.1
EBIT reported 192 162 121 206 252 190 250 263 279 305 327 342
EBIT (Stada adjustments) 192 161 120 202 248 322 288 305 326 341 360 371
D&A 88 107 102 118 131 229 140 136 129 113 98 97
EBITDA reported 280 268 223 324 383 419 390 399 408 418 425 439
D&A -88 -107 -102 -118 -131 -229 -140 -136 -129 -113 -98 -97
Interest income 11 4 11 4 7 5 5 8 8 9 9 9
Interest charges -62 -57 -62 -74 -70 -70 -71 -68 -66 -64 -65 -65
Interest income (net) -51 -53 -52 -70 -63 -65 -66 -60 -58 -55 -56 -56
EBT 142 109 70 136 189 125 184 203 222 250 271 286
Income taxes -41 -40 -47 -49 -66 -55 -46 -51 -55 -62 -68 -72
Net Income from continuing operations 101 68 22 87 123 70 138 153 166 187 203 215
Minority interests -0.3 -0.1 -0.3 -0.5 -1.4 -5.5 -6.1 -6.7 -7.4 -8.1 -8.9 -9.8
Net income after minorities 100.4 68.1 22.0 86.5 121.3 64.6 132.0 145.8 158.9 179.2 194.3 204.7
Number of shares 58.8 58.7 58.9 59.2 60.4 60.4 62.3 62.3 62.3 62.3 62.3 62.3
EPS Reported (IFRS) 1.71 1.16 0.37 1.46 2.01 1.07 2.12 2.34 2.55 2.87 3.12 3.28
Exceptionals in EBIT (incl. D&A) 18 77 137.5 64.1 54.8 132.1 55.0 47.0 35.0 25.0 15.0 10
.. Except. (in D&A) 11 30 24 20.5 23.1 59.2 20.0 18.0 15.0 0.0 0.0 0
.. Except. (in GW amortisation) 0 0 0 0.0 0.0 59.8
.. Except. (in Net financials) 3.1 -0.3 -1 0.7 -3.4 -3.6 -10.0 -5.0 -1.0
.. Other except. (pre-tax) 0 0 0 0.0 0.0
.. Except. (in Income taxes) -6 -12 -12 -3.5 -12.2 -6.8 -6.0 -4.0 -1.0
Exceptionals in Minorities 0 0 0 0.0 0.0
Operating profit, adj. - Generics 159 182 183 172 166 177 175 174 173 179 188 190
Operating profit, adj. - Branded products 80 101 109 143 174 193 185 198 215 227 240 252
FX adjustment after tax 21 20 10 0 0 0 0
Impairment & others 111 35 10 35 25 15 10
Adj. EBIT - STADA 210.8 239.2 258.7 270.0 307.2 322.4 287.9 304.8 325.6 340.6 359.6 371.3
Adj. EBIT - MF 281.4 267.9 294.8 325.6 340.6 359.6 371.3
Adj. EBITDA - STADA 287.5 315.5 337.2 367.4 414.9 431.9 412.9 425.0 439.7 453.4 457.8 468.3
Adj. EBITDA - MF 411.2 392.9 415.0 439.7 453.4 457.8 468.3
Adj. EBT - STADA 163.0 185.8 205.8 200.5 240.6 253.1 229.1 245.3 255.7 274.7 285.9 296.1
Adj. Net Income after minorities 115.8 132.9 146.6 147.9 160.5 186.2 171.0 183.8 191.9 204.2 209.3 214.7
EPS adj. (STADA definition) 1.97 2.27 2.49 2.50 2.65 3.08 2.74 2.95 3.08 3.28 3.36 3.44
EPS adj. (MF definition) 2.30 2.30 2.31 2.74 2.42 2.79 3.08 3.28 3.36 3.44
DPS 0.55 0.37 0.37 0.50 0.66 0.76 0.69 0.74 0.77 0.82 0.84 0.86
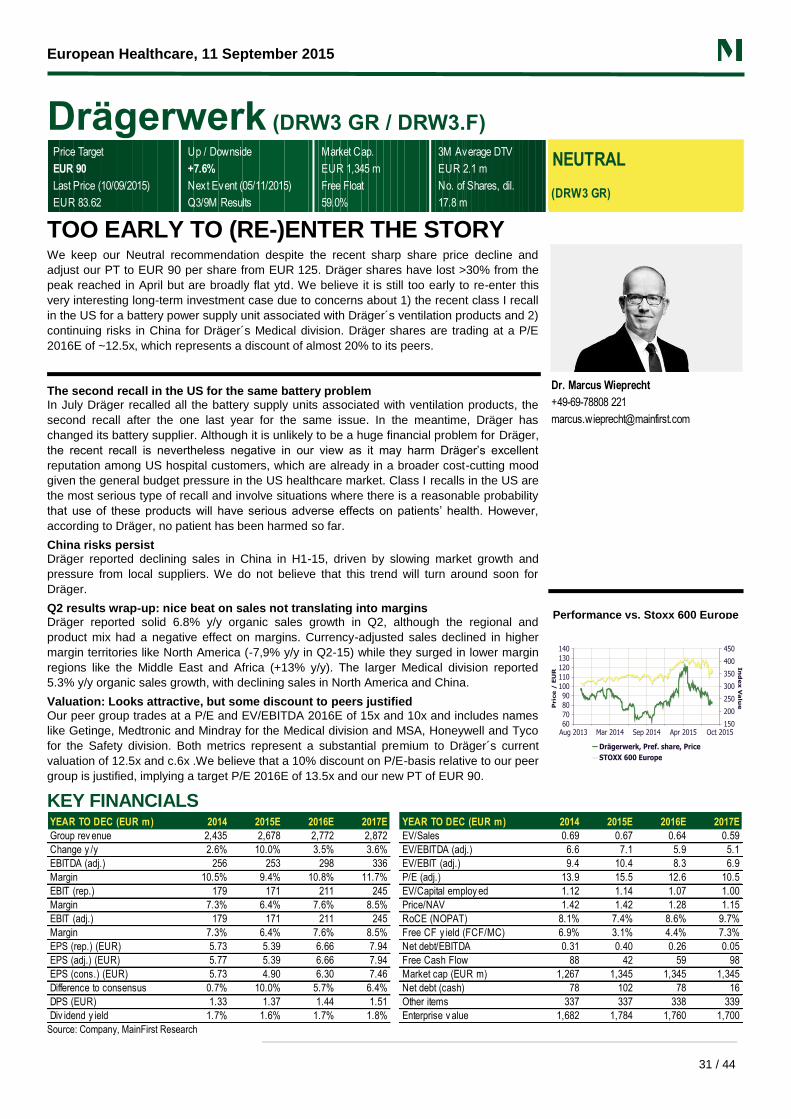
European Healthcare, 11 September 2015
31 / 44
Drägerwerk (DRW3 GR / DRW3.F)
Price Target Up / Downside Market Cap. 3M Average DTV
EUR 90 +7.6% EUR 1,345 m EUR 2.1 m
Last Price (10/09/2015) Next Event (05/11/2015) Free Float No. of Shares, dil.
EUR 83.62 Q3/9M Results 59.0% 17.8 m
NEUTRAL
(DRW3 GR)
TOO EARLY TO (RE-)ENTER THE STORY We keep our Neutral recommendation despite the recent sharp share price decline and
adjust our PT to EUR 90 per share from EUR 125. Dräger shares have lost >30% from the
peak reached in April but are broadly flat ytd. We believe it is still too early to re-enter this
very interesting long-term investment case due to concerns about 1) the recent class I recall
in the US for a battery power supply unit associated with Dräger´s ventilation products and 2)
continuing risks in China for Dräger´s Medical division. Dräger shares are trading at a P/E
2016E of ~12.5x, which represents a discount of almost 20% to its peers.
The second recall in the US for the same battery problem In July Dräger recalled all the battery supply units associated with ventilation products, the
second recall after the one last year for the same issue. In the meantime, Dräger has
changed its battery supplier. Although it is unlikely to be a huge financial problem for Dräger,
the recent recall is nevertheless negative in our view as it may harm Dräger’s excellent
reputation among US hospital customers, which are already in a broader cost-cutting mood
given the general budget pressure in the US healthcare market. Class I recalls in the US are
the most serious type of recall and involve situations where there is a reasonable probability
that use of these products will have serious adverse effects on patients’ health. However,
according to Dräger, no patient has been harmed so far.
China risks persist Dräger reported declining sales in China in H1-15, driven by slowing market growth and
pressure from local suppliers. We do not believe that this trend will turn around soon for
Dräger.
Q2 results wrap-up: nice beat on sales not translating into margins Dräger reported solid 6.8% y/y organic sales growth in Q2, although the regional and
product mix had a negative effect on margins. Currency-adjusted sales declined in higher
margin territories like North America (-7,9% y/y in Q2-15) while they surged in lower margin
regions like the Middle East and Africa (+13% y/y). The larger Medical division reported
5.3% y/y organic sales growth, with declining sales in North America and China.
Valuation: Looks attractive, but some discount to peers justified
Our peer group trades at a P/E and EV/EBITDA 2016E of 15x and 10x and includes names
like Getinge, Medtronic and Mindray for the Medical division and MSA, Honeywell and Tyco
for the Safety division. Both metrics represent a substantial premium to Dräger´s current
valuation of 12.5x and c.6x .We believe that a 10% discount on P/E-basis relative to our peer
group is justified, implying a target P/E 2016E of 13.5x and our new PT of EUR 90.
Dr. Marcus Wieprecht
+49-69-78808 221
Performance vs. Stoxx 600 Europe
KEY FINANCIALS
Source: Company, MainFirst Research
YEAR TO DEC (EUR m) 2014 2015E 2016E 2017E YEAR TO DEC (EUR m) 2014 2015E 2016E 2017E
Group rev enue 2,435 2,678 2,772 2,872 EV/Sales 0.69 0.67 0.64 0.59
Change y /y 2.6% 10.0% 3.5% 3.6% EV/EBITDA (adj.) 6.6 7.1 5.9 5.1
EBITDA (adj.) 256 253 298 336 EV/EBIT (adj.) 9.4 10.4 8.3 6.9
Margin 10.5% 9.4% 10.8% 11.7% P/E (adj.) 13.9 15.5 12.6 10.5
EBIT (rep.) 179 171 211 245 EV/Capital employ ed 1.12 1.14 1.07 1.00
Margin 7.3% 6.4% 7.6% 8.5% Price/NAV 1.42 1.42 1.28 1.15
EBIT (adj.) 179 171 211 245 RoCE (NOPAT) 8.1% 7.4% 8.6% 9.7%
Margin 7.3% 6.4% 7.6% 8.5% Free CF y ield (FCF/MC) 6.9% 3.1% 4.4% 7.3%
EPS (rep.) (EUR) 5.73 5.39 6.66 7.94 Net debt/EBITDA 0.31 0.40 0.26 0.05
EPS (adj.) (EUR) 5.77 5.39 6.66 7.94 Free Cash Flow 88 42 59 98
EPS (cons.) (EUR) 5.73 4.90 6.30 7.46 Market cap (EUR m) 1,267 1,345 1,345 1,345
Difference to consensus 0.7% 10.0% 5.7% 6.4% Net debt (cash) 78 102 78 16
DPS (EUR) 1.33 1.37 1.44 1.51 Other items 337 337 338 339
Div idend y ield 1.7% 1.6% 1.7% 1.8% Enterprise v alue 1,682 1,784 1,760 1,700
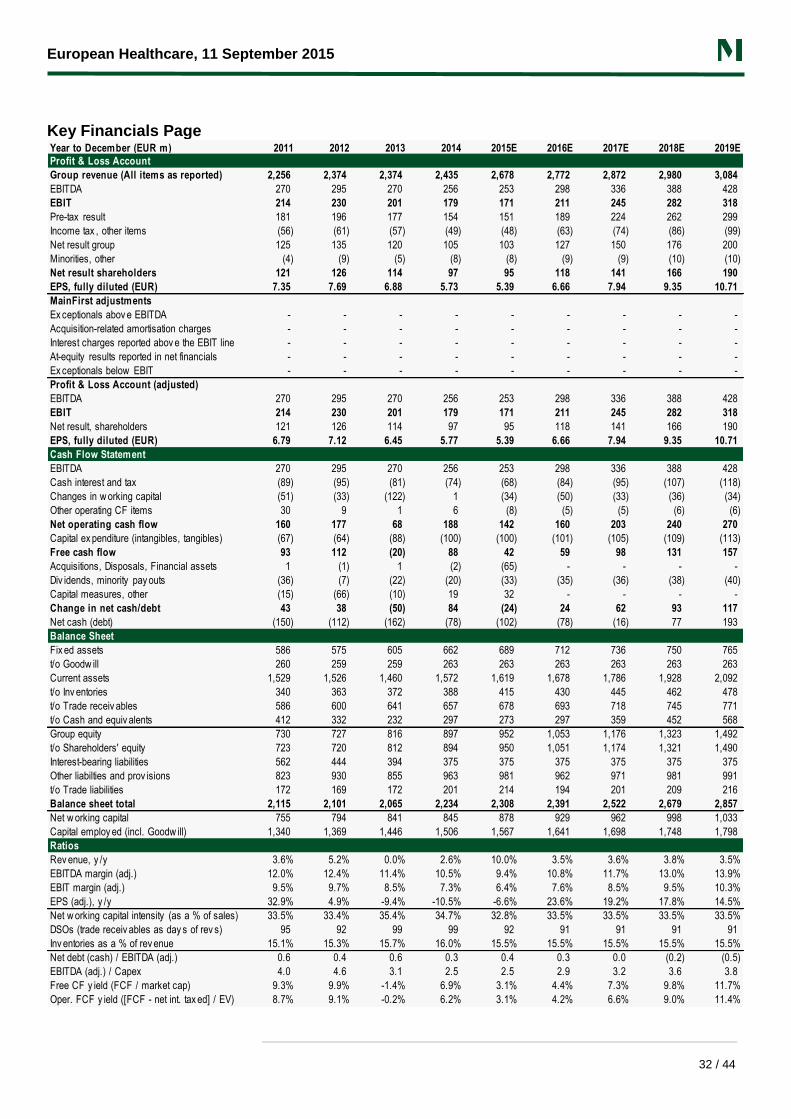
European Healthcare, 11 September 2015
32 / 44
Key Financials Page
Year to December (EUR m) 2011 2012 2013 2014 2015E 2016E 2017E 2018E 2019E
Profit & Loss Account
Group revenue (All items as reported) 2,256 2,374 2,374 2,435 2,678 2,772 2,872 2,980 3,084
EBITDA 270 295 270 256 253 298 336 388 428
EBIT 214 230 201 179 171 211 245 282 318
Pre-tax result 181 196 177 154 151 189 224 262 299
Income tax , other items (56) (61) (57) (49) (48) (63) (74) (86) (99)
Net result group 125 135 120 105 103 127 150 176 200
Minorities, other (4) (9) (5) (8) (8) (9) (9) (10) (10)
Net result shareholders 121 126 114 97 95 118 141 166 190
EPS, fully diluted (EUR) 7.35 7.69 6.88 5.73 5.39 6.66 7.94 9.35 10.71
MainFirst adjustments
Ex ceptionals abov e EBITDA - - - - - - - - -
Acquisition-related amortisation charges - - - - - - - - -
Interest charges reported abov e the EBIT line - - - - - - - - -
At-equity results reported in net financials - - - - - - - - -
Ex ceptionals below EBIT - - - - - - - - -
Profit & Loss Account (adjusted)
EBITDA 270 295 270 256 253 298 336 388 428
EBIT 214 230 201 179 171 211 245 282 318
Net result, shareholders 121 126 114 97 95 118 141 166 190
EPS, fully diluted (EUR) 6.79 7.12 6.45 5.77 5.39 6.66 7.94 9.35 10.71
Cash Flow Statement
EBITDA 270 295 270 256 253 298 336 388 428
Cash interest and tax (89) (95) (81) (74) (68) (84) (95) (107) (118)
Changes in w orking capital (51) (33) (122) 1 (34) (50) (33) (36) (34)
Other operating CF items 30 9 1 6 (8) (5) (5) (6) (6)
Net operating cash flow 160 177 68 188 142 160 203 240 270
Capital ex penditure (intangibles, tangibles) (67) (64) (88) (100) (100) (101) (105) (109) (113)
Free cash flow 93 112 (20) 88 42 59 98 131 157
Acquisitions, Disposals, Financial assets 1 (1) 1 (2) (65) - - - -
Div idends, minority pay outs (36) (7) (22) (20) (33) (35) (36) (38) (40)
Capital measures, other (15) (66) (10) 19 32 - - - -
Change in net cash/debt 43 38 (50) 84 (24) 24 62 93 117
Net cash (debt) (150) (112) (162) (78) (102) (78) (16) 77 193
Balance Sheet
Fix ed assets 586 575 605 662 689 712 736 750 765
t/o Goodw ill 260 259 259 263 263 263 263 263 263
Current assets 1,529 1,526 1,460 1,572 1,619 1,678 1,786 1,928 2,092
t/o Inv entories 340 363 372 388 415 430 445 462 478
t/o Trade receiv ables 586 600 641 657 678 693 718 745 771
t/o Cash and equiv alents 412 332 232 297 273 297 359 452 568
Group equity 730 727 816 897 952 1,053 1,176 1,323 1,492
t/o Shareholders' equity 723 720 812 894 950 1,051 1,174 1,321 1,490
Interest-bearing liabilities 562 444 394 375 375 375 375 375 375
Other liabilties and prov isions 823 930 855 963 981 962 971 981 991
t/o Trade liabilities 172 169 172 201 214 194 201 209 216
Balance sheet total 2,115 2,101 2,065 2,234 2,308 2,391 2,522 2,679 2,857
Net w orking capital 755 794 841 845 878 929 962 998 1,033
Capital employ ed (incl. Goodw ill) 1,340 1,369 1,446 1,506 1,567 1,641 1,698 1,748 1,798
Ratios
Rev enue, y /y 3.6% 5.2% 0.0% 2.6% 10.0% 3.5% 3.6% 3.8% 3.5%
EBITDA margin (adj.) 12.0% 12.4% 11.4% 10.5% 9.4% 10.8% 11.7% 13.0% 13.9%
EBIT margin (adj.) 9.5% 9.7% 8.5% 7.3% 6.4% 7.6% 8.5% 9.5% 10.3%
EPS (adj.), y /y 32.9% 4.9% -9.4% -10.5% -6.6% 23.6% 19.2% 17.8% 14.5%
Net w orking capital intensity (as a % of sales) 33.5% 33.4% 35.4% 34.7% 32.8% 33.5% 33.5% 33.5% 33.5%
DSOs (trade receiv ables as day s of rev s) 95 92 99 99 92 91 91 91 91
Inv entories as a % of rev enue 15.1% 15.3% 15.7% 16.0% 15.5% 15.5% 15.5% 15.5% 15.5%
Net debt (cash) / EBITDA (adj.) 0.6 0.4 0.6 0.3 0.4 0.3 0.0 (0.2) (0.5)
EBITDA (adj.) / Capex 4.0 4.6 3.1 2.5 2.5 2.9 3.2 3.6 3.8
Free CF y ield (FCF / market cap) 9.3% 9.9% -1.4% 6.9% 3.1% 4.4% 7.3% 9.8% 11.7%
Oper. FCF y ield ([FCF - net int. tax ed] / EV) 8.7% 9.1% -0.2% 6.2% 3.1% 4.2% 6.6% 9.0% 11.4%
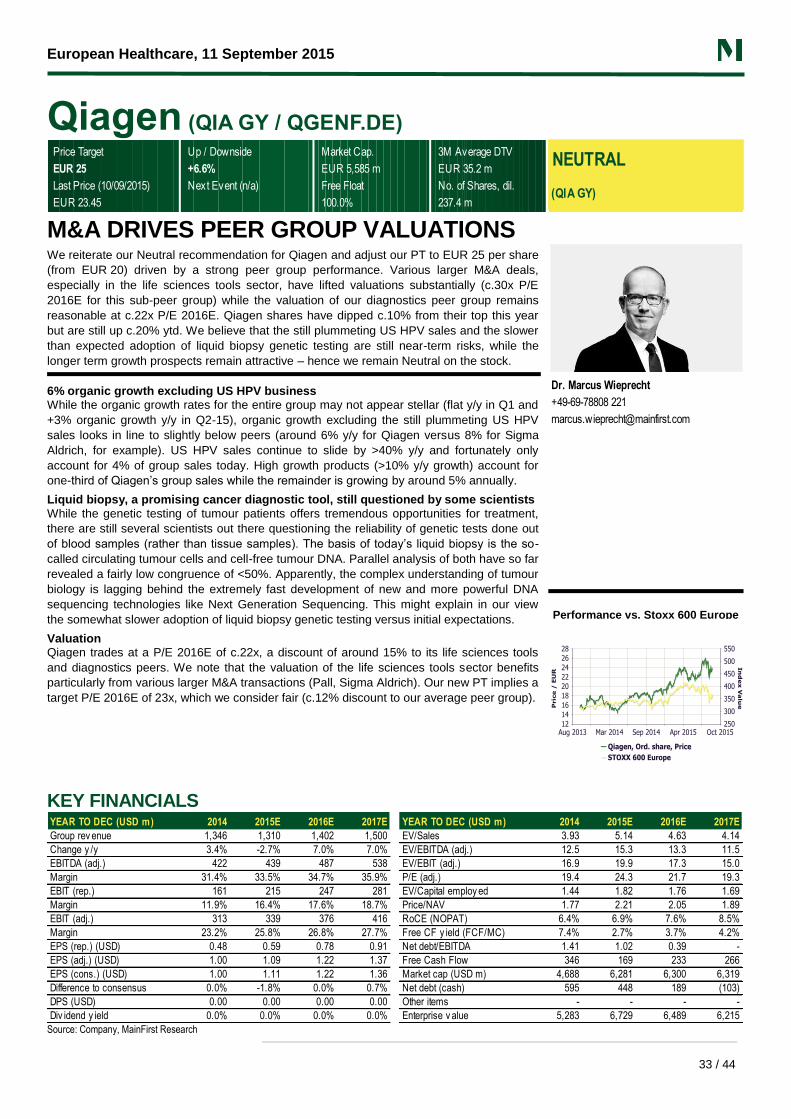
European Healthcare, 11 September 2015
33 / 44
Qiagen (QIA GY / QGENF.DE)
Price Target Up / Downside Market Cap. 3M Average DTV
EUR 25 +6.6% EUR 5,585 m EUR 35.2 m
Last Price (10/09/2015) Next Event (n/a) Free Float No. of Shares, dil.
EUR 23.45 100.0% 237.4 m
NEUTRAL
(QIA GY)
M&A DRIVES PEER GROUP VALUATIONS We reiterate our Neutral recommendation for Qiagen and adjust our PT to EUR 25 per share
(from EUR 20) driven by a strong peer group performance. Various larger M&A deals,
especially in the life sciences tools sector, have lifted valuations substantially (c.30x P/E
2016E for this sub-peer group) while the valuation of our diagnostics peer group remains
reasonable at c.22x P/E 2016E. Qiagen shares have dipped c.10% from their top this year
but are still up c.20% ytd. We believe that the still plummeting US HPV sales and the slower
than expected adoption of liquid biopsy genetic testing are still near-term risks, while the
longer term growth prospects remain attractive – hence we remain Neutral on the stock.
6% organic growth excluding US HPV business While the organic growth rates for the entire group may not appear stellar (flat y/y in Q1 and
+3% organic growth y/y in Q2-15), organic growth excluding the still plummeting US HPV
sales looks in line to slightly below peers (around 6% y/y for Qiagen versus 8% for Sigma
Aldrich, for example). US HPV sales continue to slide by >40% y/y and fortunately only
account for 4% of group sales today. High growth products (>10% y/y growth) account for
one-third of Qiagen’s group sales while the remainder is growing by around 5% annually.
Liquid biopsy, a promising cancer diagnostic tool, still questioned by some scientists
While the genetic testing of tumour patients offers tremendous opportunities for treatment,
there are still several scientists out there questioning the reliability of genetic tests done out
of blood samples (rather than tissue samples). The basis of today’s liquid biopsy is the so-
called circulating tumour cells and cell-free tumour DNA. Parallel analysis of both have so far
revealed a fairly low congruence of <50%. Apparently, the complex understanding of tumour
biology is lagging behind the extremely fast development of new and more powerful DNA
sequencing technologies like Next Generation Sequencing. This might explain in our view
the somewhat slower adoption of liquid biopsy genetic testing versus initial expectations.
Valuation Qiagen trades at a P/E 2016E of c.22x, a discount of around 15% to its life sciences tools
and diagnostics peers. We note that the valuation of the life sciences tools sector benefits
particularly from various larger M&A transactions (Pall, Sigma Aldrich). Our new PT implies a
target P/E 2016E of 23x, which we consider fair (c.12% discount to our average peer group).
Dr. Marcus Wieprecht
+49-69-78808 221
Performance vs. Stoxx 600 Europe
KEY FINANCIALS
Source: Company, MainFirst Research
YEAR TO DEC (USD m) 2014 2015E 2016E 2017E YEAR TO DEC (USD m) 2014 2015E 2016E 2017E
Group rev enue 1,346 1,310 1,402 1,500 EV/Sales 3.93 5.14 4.63 4.14
Change y /y 3.4% -2.7% 7.0% 7.0% EV/EBITDA (adj.) 12.5 15.3 13.3 11.5
EBITDA (adj.) 422 439 487 538 EV/EBIT (adj.) 16.9 19.9 17.3 15.0
Margin 31.4% 33.5% 34.7% 35.9% P/E (adj.) 19.4 24.3 21.7 19.3
EBIT (rep.) 161 215 247 281 EV/Capital employ ed 1.44 1.82 1.76 1.69
Margin 11.9% 16.4% 17.6% 18.7% Price/NAV 1.77 2.21 2.05 1.89
EBIT (adj.) 313 339 376 416 RoCE (NOPAT) 6.4% 6.9% 7.6% 8.5%
Margin 23.2% 25.8% 26.8% 27.7% Free CF y ield (FCF/MC) 7.4% 2.7% 3.7% 4.2%
EPS (rep.) (USD) 0.48 0.59 0.78 0.91 Net debt/EBITDA 1.41 1.02 0.39 -
EPS (adj.) (USD) 1.00 1.09 1.22 1.37 Free Cash Flow 346 169 233 266
EPS (cons.) (USD) 1.00 1.11 1.22 1.36 Market cap (USD m) 4,688 6,281 6,300 6,319
Difference to consensus 0.0% -1.8% 0.0% 0.7% Net debt (cash) 595 448 189 (103)
DPS (USD) 0.00 0.00 0.00 0.00 Other items - - - -
Div idend y ield 0.0% 0.0% 0.0% 0.0% Enterprise v alue 5,283 6,729 6,489 6,215

European Healthcare, 11 September 2015
34 / 44
Key Financials Page
Year to December (USD m) 2011 2012 2013 2014 2015E 2016E 2017E 2018E 2019E
Profit & Loss Account
Group revenue (All items as reported) 1,170 1,254 1,302 1,346 1,310 1,402 1,500 1,605 1,701
EBITDA 235 319 213 315 365 408 453 533 624
EBIT 100 175 63 161 215 247 281 369 476
Pre-tax result 96 150 37 119 166 218 254 373 483
Income tax , other items (1) (16) 32 (1) (25) (33) (38) (75) (126)
Net result group 95 135 69 117 141 185 216 299 358
Minorities, other 1 - - (1) - - - - -
Net result shareholders 96 135 69 117 141 185 216 299 358
EPS, fully diluted (USD) 0.40 0.54 0.29 0.48 0.59 0.78 0.91 1.25 1.49
MainFirst adjustments
Ex ceptionals abov e EBITDA (220) (181) (255) (107) (74) (79) (85) (35) 20
Acquisition-related amortisation charges - - - (45) (50) (50) (50) (50) (50)
Interest charges reported abov e the EBIT line - - - - - - - - -
At-equity results reported in net financials - - - - - - - - -
Ex ceptionals below EBIT 82 55 78 28 6 23 23 21 8
Profit & Loss Account (adjusted)
EBITDA 455 501 468 422 439 487 538 568 605
EBIT 320 356 318 313 339 376 416 454 506
Net result, shareholders 234 261 246 241 259 292 328 363 380
EPS, fully diluted (USD) 0.98 1.08 1.02 1.00 1.09 1.22 1.37 1.51 1.58
Cash Flow Statement
EBITDA 235 319 213 315 365 408 453 533 624
Cash interest and tax (20) (37) 6 (44) (73) (62) (64) (71) (119)
Changes in w orking capital (5) (81) (54) 111 5 (12) (13) (13) (12)
Other operating CF items 38 (41) 233 74 (10) 25 26 27 28
Net operating cash flow 247 161 398 457 287 359 402 477 522
Capital ex penditure (intangibles, tangibles) (88) (97) (103) (111) (118) (127) (135) (140) (144)
Free cash flow 159 64 295 346 169 233 266 338 378
Acquisitions, Disposals, Financial assets (474) (132) (105) - - - - - -
Div idends, minority pay outs - - - - - - - - -
Capital measures, other (61) 20 (293) (476) (22) 26 26 (38) (78)
Change in net cash/debt (376) (48) (103) (130) 147 259 292 300 300
Net cash (debt) (314) (363) (465) (595) (448) (189) 103 403 703
Balance Sheet
Fix ed assets 3,008 3,131 3,168 3,306 3,353 3,319 3,282 3,394 3,564
t/o Goodw ill 1,734 1,760 1,856 1,888 1,968 1,968 1,968 1,968 1,968
Current assets 748 995 921 1,149 1,102 1,396 1,726 2,114 2,495
t/o Inv entories 132 135 128 132 129 138 148 162 179
t/o Trade receiv ables 231 251 260 265 258 276 296 325 358
t/o Cash and equiv alents 276 484 380 577 543 802 1,094 1,394 1,694
Group equity 2,558 2,724 2,724 2,658 2,849 3,084 3,351 3,686 4,055
t/o Shareholders' equity 2,548 2,715 2,714 2,650 2,841 3,076 3,343 3,678 4,046
Interest-bearing liabilities 590 847 845 1,172 991 991 991 991 991
Other liabilties and prov isions 609 555 519 624 615 639 665 830 1,013
t/o Trade liabilities 60 51 51 46 45 48 51 57 62
Balance sheet total 3,756 4,126 4,088 4,454 4,455 4,715 5,007 5,508 6,059
Net w orking capital 303 335 337 351 342 366 392 431 474
Capital employ ed (incl. Goodw ill) 3,311 3,466 3,504 3,657 3,696 3,685 3,674 3,825 4,038
Ratios
Rev enue, y /y 7.6% 7.2% 3.8% 3.4% -2.7% 7.0% 7.0% 7.0% 6.0%
EBITDA margin (adj.) 38.9% 39.9% 35.9% 31.4% 33.5% 34.7% 35.9% 35.4% 35.6%
EBIT margin (adj.) 27.3% 28.4% 24.4% 23.2% 25.8% 26.8% 27.7% 28.3% 29.8%
EPS (adj.), y /y 5.4% 10.2% -5.6% -2.0% 9.0% 11.9% 12.3% 10.2% 4.6%
Net w orking capital intensity (as a % of sales) 25.9% 26.7% 25.9% 26.1% 26.1% 26.1% 26.1% 26.9% 27.9%
DSOs (trade receiv ables as day s of rev s) 72 73 73 72 72 72 72 74 77
Inv entories as a % of rev enue 11.3% 10.8% 9.8% 9.8% 9.8% 9.8% 9.8% 10.1% 10.5%
Net debt (cash) / EBITDA (adj.) 0.7 0.7 1.0 1.4 1.0 0.4 (0.2) (0.7) (1.2)
EBITDA (adj.) / Capex 5.2 5.2 4.5 3.8 3.7 3.8 4.0 4.1 4.2
Free CF y ield (FCF / market cap) 4.8% 1.8% 7.0% 7.4% 2.7% 3.7% 4.2% 5.3% 5.9%
Oper. FCF y ield ([FCF - net int. tax ed] / EV) 4.8% 2.1% 6.7% 7.1% 3.0% 3.9% 4.6% 5.6% 6.6%
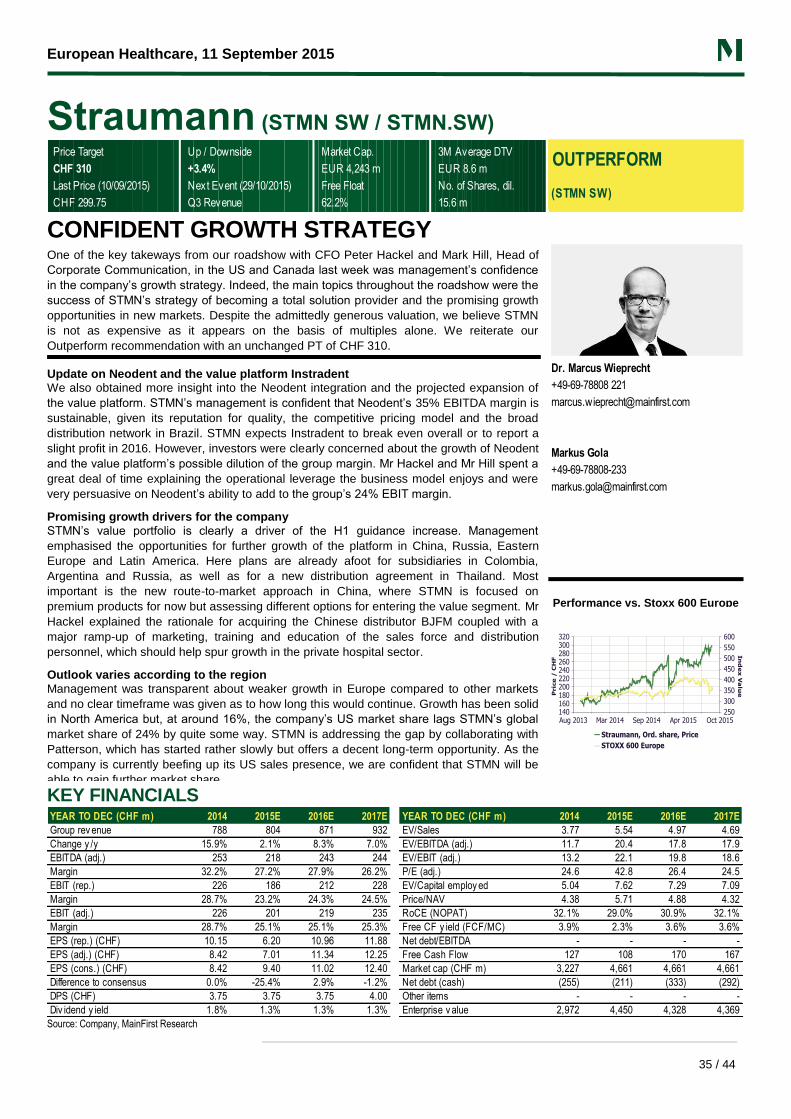
European Healthcare, 11 September 2015
35 / 44
Straumann (STMN SW / STMN.SW)
Price Target Up / Downside Market Cap. 3M Average DTV
CHF 310 +3.4% EUR 4,243 m EUR 8.6 m
Last Price (10/09/2015) Next Event (29/10/2015) Free Float No. of Shares, dil.
CHF 299.75 Q3 Revenue 62.2% 15.6 m
OUTPERFORM
(STMN SW)
CONFIDENT GROWTH STRATEGY One of the key takeways from our roadshow with CFO Peter Hackel and Mark Hill, Head of
Corporate Communication, in the US and Canada last week was management’s confidence
in the company’s growth strategy. Indeed, the main topics throughout the roadshow were the
success of STMN’s strategy of becoming a total solution provider and the promising growth
opportunities in new markets. Despite the admittedly generous valuation, we believe STMN
is not as expensive as it appears on the basis of multiples alone. We reiterate our
Outperform recommendation with an unchanged PT of CHF 310.
Update on Neodent and the value platform Instradent We also obtained more insight into the Neodent integration and the projected expansion of
the value platform. STMN’s management is confident that Neodent’s 35% EBITDA margin is
sustainable, given its reputation for quality, the competitive pricing model and the broad
distribution network in Brazil. STMN expects Instradent to break even overall or to report a
slight profit in 2016. However, investors were clearly concerned about the growth of Neodent
and the value platform’s possible dilution of the group margin. Mr Hackel and Mr Hill spent a
great deal of time explaining the operational leverage the business model enjoys and were
very persuasive on Neodent’s ability to add to the group’s 24% EBIT margin.
Promising growth drivers for the company
STMN’s value portfolio is clearly a driver of the H1 guidance increase. Management
emphasised the opportunities for further growth of the platform in China, Russia, Eastern
Europe and Latin America. Here plans are already afoot for subsidiaries in Colombia,
Argentina and Russia, as well as for a new distribution agreement in Thailand. Most
important is the new route-to-market approach in China, where STMN is focused on
premium products for now but assessing different options for entering the value segment. Mr
Hackel explained the rationale for acquiring the Chinese distributor BJFM coupled with a
major ramp-up of marketing, training and education of the sales force and distribution
personnel, which should help spur growth in the private hospital sector.
Outlook varies according to the region
Management was transparent about weaker growth in Europe compared to other markets
and no clear timeframe was given as to how long this would continue. Growth has been solid
in North America but, at around 16%, the company’s US market share lags STMN’s global
market share of 24% by quite some way. STMN is addressing the gap by collaborating with
Patterson, which has started rather slowly but offers a decent long-term opportunity. As the
company is currently beefing up its US sales presence, we are confident that STMN will be
able to gain further market share.
Dr. Marcus Wieprecht
+49-69-78808 221
Markus Gola
+49-69-78808-233
Performance vs. Stoxx 600 Europe
KEY FINANCIALS
Source: Company, MainFirst Research
YEAR TO DEC (CHF m) 2014 2015E 2016E 2017E YEAR TO DEC (CHF m) 2014 2015E 2016E 2017E
Group rev enue 788 804 871 932 EV/Sales 3.77 5.54 4.97 4.69
Change y /y 15.9% 2.1% 8.3% 7.0% EV/EBITDA (adj.) 11.7 20.4 17.8 17.9
EBITDA (adj.) 253 218 243 244 EV/EBIT (adj.) 13.2 22.1 19.8 18.6
Margin 32.2% 27.2% 27.9% 26.2% P/E (adj.) 24.6 42.8 26.4 24.5
EBIT (rep.) 226 186 212 228 EV/Capital employ ed 5.04 7.62 7.29 7.09
Margin 28.7% 23.2% 24.3% 24.5% Price/NAV 4.38 5.71 4.88 4.32
EBIT (adj.) 226 201 219 235 RoCE (NOPAT) 32.1% 29.0% 30.9% 32.1%
Margin 28.7% 25.1% 25.1% 25.3% Free CF y ield (FCF/MC) 3.9% 2.3% 3.6% 3.6%
EPS (rep.) (CHF) 10.15 6.20 10.96 11.88 Net debt/EBITDA - - - -
EPS (adj.) (CHF) 8.42 7.01 11.34 12.25 Free Cash Flow 127 108 170 167
EPS (cons.) (CHF) 8.42 9.40 11.02 12.40 Market cap (CHF m) 3,227 4,661 4,661 4,661
Difference to consensus 0.0% -25.4% 2.9% -1.2% Net debt (cash) (255) (211) (333) (292)
DPS (CHF) 3.75 3.75 3.75 4.00 Other items - - - -
Div idend y ield 1.8% 1.3% 1.3% 1.3% Enterprise v alue 2,972 4,450 4,328 4,369

European Healthcare, 11 September 2015
36 / 44
Key Financials Page
Year to December (CHF m) 2011 2012 2013 2014 2015E 2016E 2017E 2018E 2019E
Profit & Loss Account
Group revenue (All items as reported) 694 686 680 788 804 871 932 987 1,038
EBITDA 157 119 150 253 218 243 244 278 295
EBIT 80 63 116 226 186 212 228 245 260
Pre-tax result 78 57 120 255 182 208 225 243 260
Income tax , other items (7) (20) (19) (20) (19) (33) (36) (39) (42)
Net result group 71 37 101 235 163 175 189 204 219
Minorities, other - - - - (3) (4) (5) (5) (5)
Net result shareholders 71 37 101 235 161 170 185 199 213
EPS, fully diluted (CHF) 4.54 2.42 6.54 10.15 6.20 10.96 11.88 12.80 13.71
MainFirst adjustments
Ex ceptionals abov e EBITDA (6) (35) (9) - - - - - -
Acquisition-related amortisation charges (40) (5) - - (15) (7) (7) (7) (7)
Interest charges reported abov e the EBIT line - - - - - - - - -
At-equity results reported in net financials - - - - - - - - -
Ex ceptionals below EBIT 4 10 1 104 66 1 1 1 1
Profit & Loss Account (adjusted)
EBITDA 163 133 157 253 218 243 244 278 295
EBIT 126 103 124 226 201 219 235 252 267
Net result, shareholders 113 68 108 131 109 176 191 205 219
EPS, fully diluted (CHF) 7.24 4.37 7.01 8.42 7.01 11.34 12.25 13.18 14.09
Cash Flow Statement
EBITDA 157 119 150 253 218 243 244 278 295
Cash interest and tax (9) (20) (20) (27) (27) (40) (42) (44) (46)
Changes in w orking capital 4 11 (1) (41) (3) (9) (9) (7) (6)
Other operating CF items (12) 4 23 (40) (61) 3 3 4 4
Net operating cash flow 140 114 151 146 128 197 196 230 247
Capital ex penditure (intangibles, tangibles) (19) (20) (13) (19) (21) (27) (29) (30) (32)
Free cash flow 121 94 139 127 108 170 167 200 215
Acquisitions, Disposals, Financial assets (6) (265) (50) (7) (103) - (122) - -
Div idends, minority pay outs (59) (58) (58) (58) (58) (48) (85) (92) (100)
Capital measures, other (29) (6) 9 12 10 - - - -
Change in net cash/debt 27 (235) 40 74 (44) 122 (41) 108 115
Net cash (debt) 375 140 181 255 211 333 292 400 516
Balance Sheet
Fix ed assets 255 460 458 498 461 467 481 478 475
t/o Goodw ill 85 63 63 62 185 185 185 185 185
Current assets 556 317 562 663 823 948 1,032 1,150 1,274
t/o Inv entories 67 64 62 69 92 92 96 100 104
t/o Trade receiv ables 110 104 111 128 143 148 168 179 189
t/o Cash and equiv alents 377 140 384 459 416 537 497 604 720
Group equity 671 602 631 737 853 998 1,079 1,186 1,300
t/o Shareholders' equity 671 602 631 737 816 956 1,079 1,186 1,300
Interest-bearing liabilities 2 - 203 204 204 204 204 204 204
Other liabilties and prov isions 138 175 185 220 226 213 229 237 245
t/o Trade liabilities 90 94 104 105 112 113 129 137 145
Balance sheet total 811 777 1,020 1,161 1,284 1,415 1,513 1,628 1,749
Net w orking capital 87 74 70 92 123 127 136 142 148
Capital employ ed (incl. Goodw ill) 343 534 528 590 584 594 616 620 624
Ratios
Rev enue, y /y -6.0% -1.1% -0.9% 15.9% 2.1% 8.3% 7.0% 5.9% 5.2%
EBITDA margin (adj.) 23.5% 19.4% 23.1% 32.2% 27.2% 27.9% 26.2% 28.2% 28.4%
EBIT margin (adj.) 18.2% 15.0% 18.3% 28.7% 25.1% 25.1% 25.3% 25.5% 25.8%
EPS (adj.), y /y -13.2% -39.6% 60.4% 20.1% -16.7% 61.8% 8.0% 7.6% 6.9%
Net w orking capital intensity (as a % of sales) 12.6% 10.8% 10.3% 11.7% 15.3% 14.5% 14.5% 14.4% 14.3%
DSOs (trade receiv ables as day s of rev s) 58 56 60 60 65 62 66 66 66
Inv entories as a % of rev enue 9.7% 9.3% 9.2% 8.8% 11.4% 10.6% 10.3% 10.2% 10.0%
Net debt (cash) / EBITDA (adj.) (2.3) (1.1) (1.2) (1.0) (1.0) (1.4) (1.2) (1.4) (1.7)
EBITDA (adj.) / Capex 8.4 6.6 12.4 13.4 10.6 8.9 8.4 9.1 9.3
Free CF y ield (FCF / market cap) 4.0% 4.5% 6.2% 3.9% 2.3% 3.6% 3.6% 4.3% 4.6%
Oper. FCF y ield ([FCF - net int. tax ed] / EV) 4.7% 4.8% 6.9% 4.5% 2.6% 4.1% 3.9% 4.8% 5.3%
European Healthcare, 11 September 2015
37 / 44
Appendix: Regulatory Disclosures and Disclaimer
MainFirst Bank AG (here forth referred to as “MainFirst”) is an independent Bank and Investment Firm subject to supervision by the German Federal Financial Services Authority (Bundesanstalt für Finanzdienstleistungsaufsicht; BaFin). MainFirst produces and distributes financial analysis directly and through its affiliates to eligible counterparties, professional clients and other institutional (non-retail) investors as defined by applicable local laws (here forth referred to as “Qualified Institutional Investors”) in accordance with the European Commission Directive 2003/125/EC, the German Securities Trading Act (Wertpapierhandelsgesetz; WpHG), the Regulation governing the Analysis of Financial Instruments (Finanzanalyseverordnung; FinAnV) and any further applicable laws and regulations. The following regulatory disclosures and disclaimer provide necessary investor information on the applicable rules governing the production and distribution of financial analysis.
Company-Specific Disclosures Pursuant to European Commission Directive 2003/125/EC, Section 34b WpHG, Section 5 FinAnV and any further applicable rules in case of distribution through its affiliates, MainFirst has to disclose relationships and circumstances that may create conflicts of interest because they could impair the impartiality of the producer(s), MainFirst including its affiliates or any other persons or entities that are acting on their behalf and are involved in the production of this Publication.
Only if explicitly stated in this Publication, the author(s), MainFirst, its affiliates, any other persons or entities involved on their behalf in the preparation of this Publication:
(Key 1) hold shares exceeding 1% of the total issued share capital of the subject issuer or the subject securities or other financial instruments (the “Company” or the “Companies”) calculated under computational methods required by German law (data as of the last trading day of the past month)
(Key 2) act as a market maker or liquidity provider in the financial instruments of the Company
(Key 3) belong to a consortium as a lead manager or co-lead manager of any publicly disclosed offer of financial instruments of the Company over the previous twelve (12) months
(Key 4) form party to any other agreement with the Company relating to the provision of investment banking services that has been in effect over the previous twelve (12) months or has given rise during the same period to the payment of a compensation or expects to receive or intends to seek compensation for investment banking services from the Company in the next three (3) months.
(Key 5) form party to an agreement with the Company relating to the production of the Publication or any recommendation
(Key 6) act as a corporate broker to the Company
(Key 7) have a material conflict of interest at the time of distribution of the Publication or any other significant financial interest in relation to the Company
(Key 8) have received non-investment banking related compensation from the Company within the past year
(Key 9) the aforementioned person(s) or a member of his/her/their household(s) is an officer, director, or advisory board member of the Company.
Moreover, only if explicitly stated herein:
(Key 10) the Company holds shares exceeding 5% of the total issued share capital of MainFirst or any of its affiliates
(Key 11) a draft of this Publication was shown to the issuer (for fact checking purposes) and changes have been made to this report prior to its publication.
Company Key
Source: MainFirst
MainFirst does not update Publications regularly.
For information on the effective organizational and administrative arrangements set up within MainFirst for the prevention and avoidance of conflicts of interest with respect to recommendations, including information barriers, please see the MainFirst Conflicts of Interest Policy on http://www.mainfirst.com/en/downloads/legal-disclaimer-clauses.html. MainFirst discloses on a daily basis the proportion of all recommendations that are “outperform” and “underperform” as well as the proportion of issuers corresponding to each of these categories to which MainF irst has supplied material investment banking services over the previous 12 months on http://www.mainfirst.com/en/downloads/legal-disclaimer-clauses.html under "Equity Research Disclosure of Interests and Conflicts of Interest".
Recommendation Definition
The recommendations of MainFirst are defined as follows. If not stated otherwise on the title page of the Publication the presumed performance is calculated always over the next 12 months.
Recommendation Definition of Recommendation Structure
Outperform Expected to appreciate and outperform the STOXX Europe 600 by at least 5% Underperform Expected to underperform the STOXX Europe 600 by at least 5% Neutral Expected to perform broadly in line (+/- 5%) with the STOXX Europe 600
Source: MainFirst
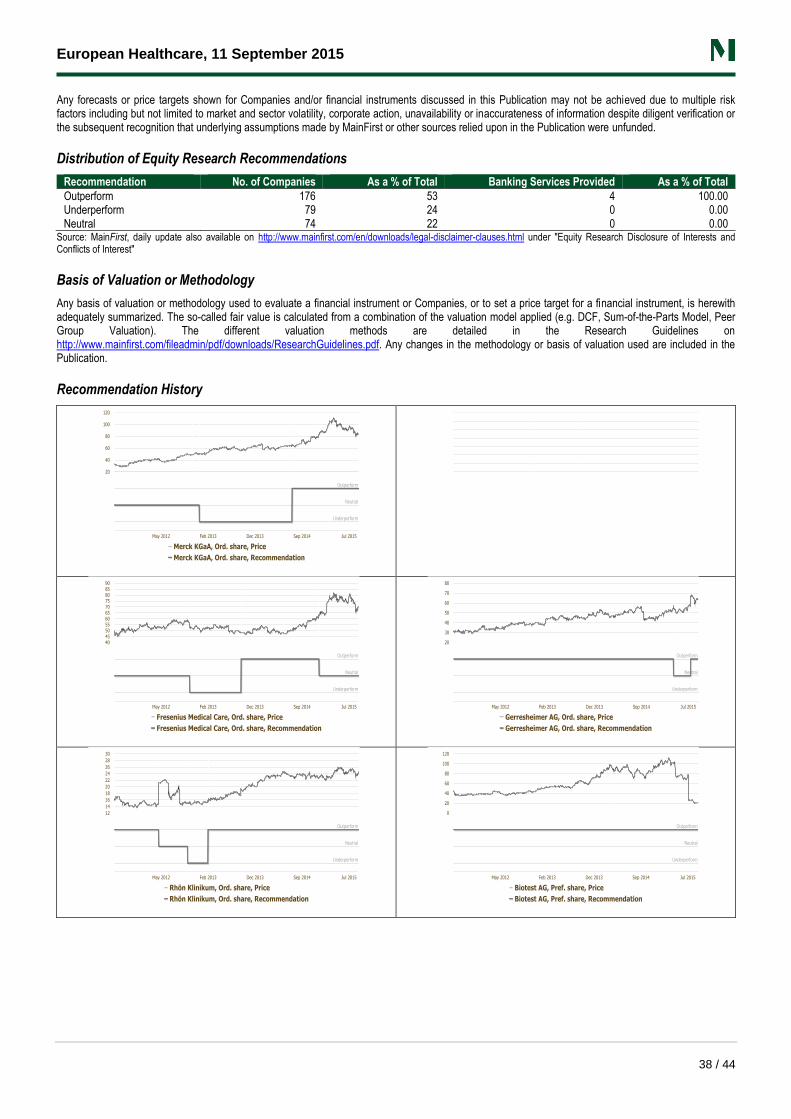
European Healthcare, 11 September 2015
38 / 44
Any forecasts or price targets shown for Companies and/or financial instruments discussed in this Publication may not be achieved due to multiple risk factors including but not limited to market and sector volatility, corporate action, unavailability or inaccurateness of information despite diligent verification or the subsequent recognition that underlying assumptions made by MainFirst or other sources relied upon in the Publication were unfunded.
Distribution of Equity Research Recommendations
Recommendation No. of Companies As a % of Total Banking Services Provided As a % of Total
Outperform 176 53 4 100.00 Underperform 79 24 0 0.00 Neutral 74 22 0 0.00
Source: MainFirst, daily update also available on http://www.mainfirst.com/en/downloads/legal-disclaimer-clauses.html under "Equity Research Disclosure of Interests and Conflicts of Interest"
Basis of Valuation or Methodology
Any basis of valuation or methodology used to evaluate a financial instrument or Companies, or to set a price target for a financial instrument, is herewith adequately summarized. The so-called fair value is calculated from a combination of the valuation model applied (e.g. DCF, Sum-of-the-Parts Model, Peer Group Valuation). The different valuation methods are detailed in the Research Guidelines on http://www.mainfirst.com/fileadmin/pdf/downloads/ResearchGuidelines.pdf. Any changes in the methodology or basis of valuation used are included in the Publication.
Recommendation History
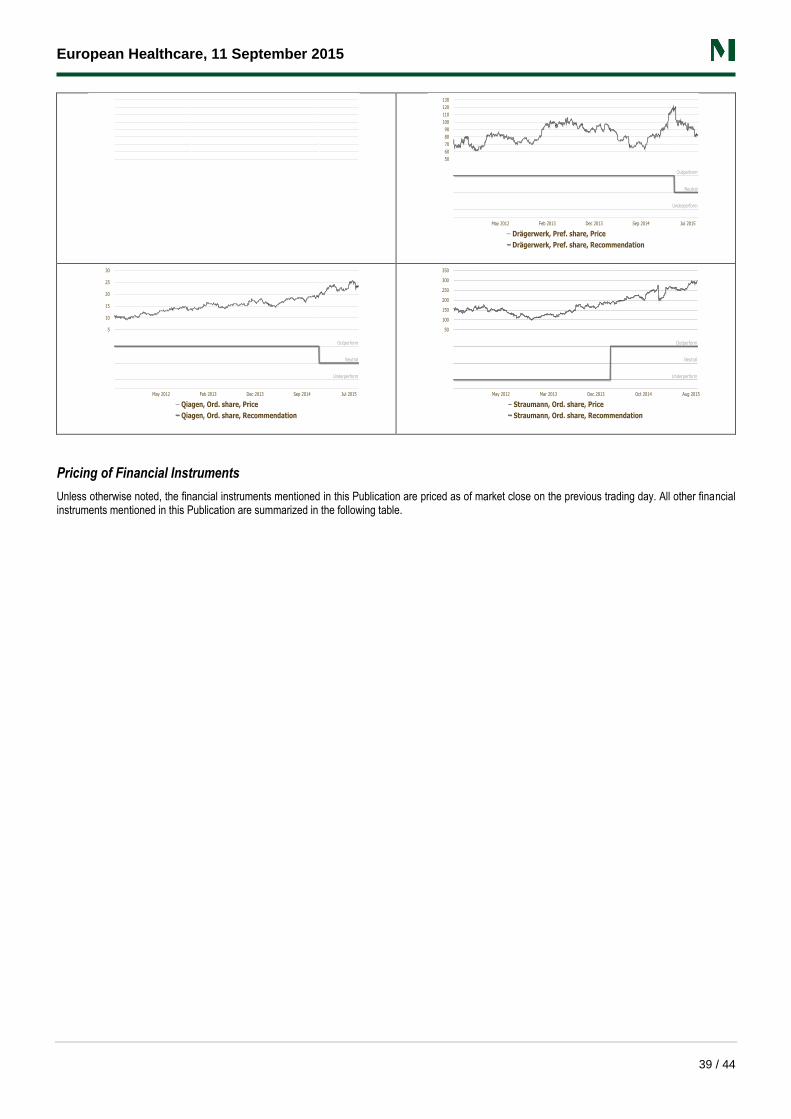
European Healthcare, 11 September 2015
39 / 44
Pricing of Financial Instruments
Unless otherwise noted, the financial instruments mentioned in this Publication are priced as of market close on the previous trading day. All other financial instruments mentioned in this Publication are summarized in the following table.
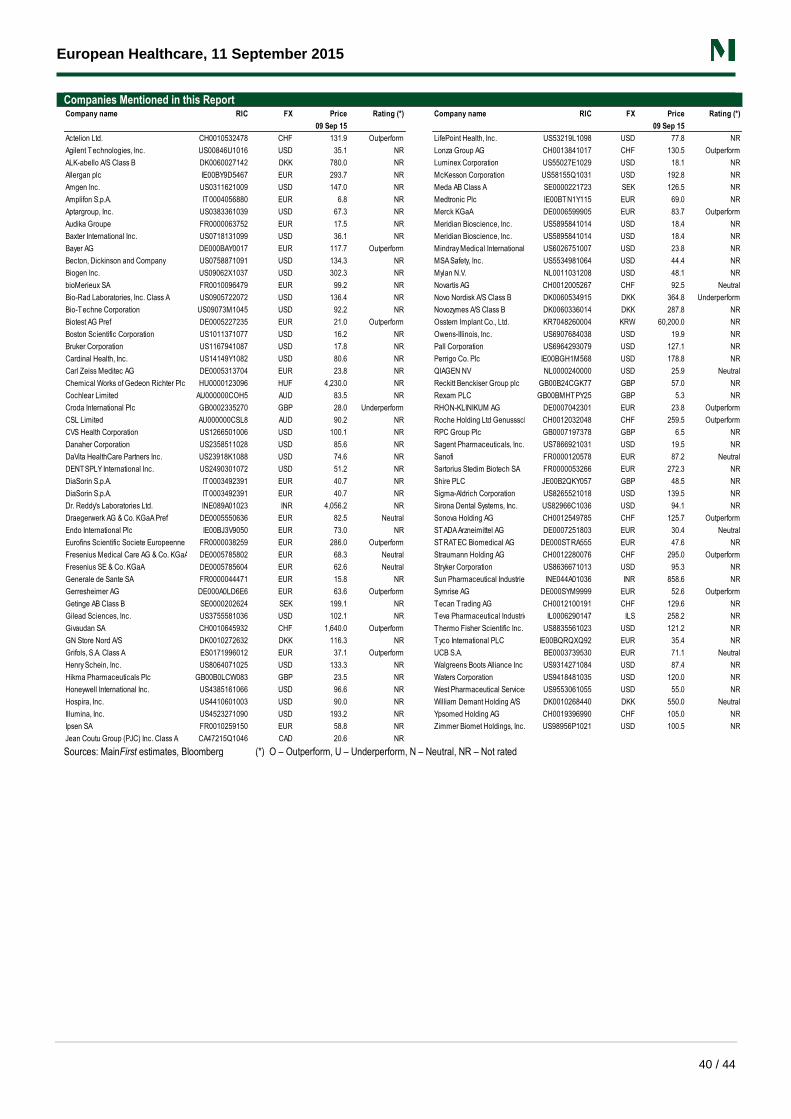
European Healthcare, 11 September 2015
40 / 44
Companies Mentioned in this Report
Sources: MainFirst estimates, Bloomberg (*) O – Outperform, U – Underperform, N – Neutral, NR – Not rated
Company name RIC FX Price Rating (*) Company name RIC FX Price Rating (*)
09 Sep 15 09 Sep 15
Actelion Ltd. CH0010532478 CHF 131.9 Outperform LifePoint Health, Inc. US53219L1098 USD 77.8 NR
Agilent Technologies, Inc. US00846U1016 USD 35.1 NR Lonza Group AG CH0013841017 CHF 130.5 Outperform
ALK-abello A/S Class B DK0060027142 DKK 780.0 NR Luminex Corporation US55027E1029 USD 18.1 NR
Allergan plc IE00BY9D5467 EUR 293.7 NR McKesson Corporation US58155Q1031 USD 192.8 NR
Amgen Inc. US0311621009 USD 147.0 NR Meda AB Class A SE0000221723 SEK 126.5 NR
Amplifon S.p.A. IT0004056880 EUR 6.8 NR Medtronic Plc IE00BTN1Y115 EUR 69.0 NR
Aptargroup, Inc. US0383361039 USD 67.3 NR Merck KGaA DE0006599905 EUR 83.7 Outperform
Audika Groupe FR0000063752 EUR 17.5 NR Meridian Bioscience, Inc. US5895841014 USD 18.4 NR
Baxter International Inc. US0718131099 USD 36.1 NR Meridian Bioscience, Inc. US5895841014 USD 18.4 NR
Bayer AG DE000BAY0017 EUR 117.7 Outperform Mindray Medical International Ltd. Sponsored ADR Class AUS6026751007 USD 23.8 NR
Becton, Dickinson and Company US0758871091 USD 134.3 NR MSA Safety, Inc. US5534981064 USD 44.4 NR
Biogen Inc. US09062X1037 USD 302.3 NR Mylan N.V. NL0011031208 USD 48.1 NR
bioMerieux SA FR0010096479 EUR 99.2 NR Novartis AG CH0012005267 CHF 92.5 Neutral
Bio-Rad Laboratories, Inc. Class A US0905722072 USD 136.4 NR Novo Nordisk A/S Class B DK0060534915 DKK 364.8 Underperform
Bio-Techne Corporation US09073M1045 USD 92.2 NR Novozymes A/S Class B DK0060336014 DKK 287.8 NR
Biotest AG Pref DE0005227235 EUR 21.0 Outperform Osstem Implant Co., Ltd. KR7048260004 KRW 60,200.0 NR
Boston Scientific Corporation US1011371077 USD 16.2 NR Owens-Illinois, Inc. US6907684038 USD 19.9 NR
Bruker Corporation US1167941087 USD 17.8 NR Pall Corporation US6964293079 USD 127.1 NR
Cardinal Health, Inc. US14149Y1082 USD 80.6 NR Perrigo Co. Plc IE00BGH1M568 USD 178.8 NR
Carl Zeiss Meditec AG DE0005313704 EUR 23.8 NR QIAGEN NV NL0000240000 USD 25.9 Neutral
Chemical Works of Gedeon Richter Plc HU0000123096 HUF 4,230.0 NR Reckitt Benckiser Group plc GB00B24CGK77 GBP 57.0 NR
Cochlear Limited AU000000COH5 AUD 83.5 NR Rexam PLC GB00BMHTPY25 GBP 5.3 NR
Croda International Plc GB0002335270 GBP 28.0 Underperform RHON-KLINIKUM AG DE0007042301 EUR 23.8 Outperform
CSL Limited AU000000CSL8 AUD 90.2 NR Roche Holding Ltd Genusssch. CH0012032048 CHF 259.5 Outperform
CVS Health Corporation US1266501006 USD 100.1 NR RPC Group Plc GB0007197378 GBP 6.5 NR
Danaher Corporation US2358511028 USD 85.6 NR Sagent Pharmaceuticals, Inc. US7866921031 USD 19.5 NR
DaVita HealthCare Partners Inc. US23918K1088 USD 74.6 NR Sanofi FR0000120578 EUR 87.2 Neutral
DENTSPLY International Inc. US2490301072 USD 51.2 NR Sartorius Stedim Biotech SA FR0000053266 EUR 272.3 NR
DiaSorin S.p.A. IT0003492391 EUR 40.7 NR Shire PLC JE00B2QKY057 GBP 48.5 NR
DiaSorin S.p.A. IT0003492391 EUR 40.7 NR Sigma-Aldrich Corporation US8265521018 USD 139.5 NR
Dr. Reddy's Laboratories Ltd. INE089A01023 INR 4,056.2 NR Sirona Dental Systems, Inc. US82966C1036 USD 94.1 NR
Draegerwerk AG & Co. KGaA Pref DE0005550636 EUR 82.5 Neutral Sonova Holding AG CH0012549785 CHF 125.7 Outperform
Endo International Plc IE00BJ3V9050 EUR 73.0 NR STADA Arzneimittel AG DE0007251803 EUR 30.4 Neutral
Eurofins Scientific Societe Europeenne FR0000038259 EUR 286.0 Outperform STRATEC Biomedical AG DE000STRA555 EUR 47.6 NR
Fresenius Medical Care AG & Co. KGaA DE0005785802 EUR 68.3 Neutral Straumann Holding AG CH0012280076 CHF 295.0 Outperform
Fresenius SE & Co. KGaA DE0005785604 EUR 62.6 Neutral Stryker Corporation US8636671013 USD 95.3 NR
Generale de Sante SA FR0000044471 EUR 15.8 NR Sun Pharmaceutical Industries LimitedINE044A01036 INR 858.6 NR
Gerresheimer AG DE000A0LD6E6 EUR 63.6 Outperform Symrise AG DE000SYM9999 EUR 52.6 Outperform
Getinge AB Class B SE0000202624 SEK 199.1 NR Tecan Trading AG CH0012100191 CHF 129.6 NR
Gilead Sciences, Inc. US3755581036 USD 102.1 NR Teva Pharmaceutical Industries LimitedIL0006290147 ILS 258.2 NR
Givaudan SA CH0010645932 CHF 1,640.0 Outperform Thermo Fisher Scientific Inc. US8835561023 USD 121.2 NR
GN Store Nord A/S DK0010272632 DKK 116.3 NR Tyco International PLC IE00BQRQXQ92 EUR 35.4 NR
Grifols, S.A. Class A ES0171996012 EUR 37.1 Outperform UCB S.A. BE0003739530 EUR 71.1 Neutral
Henry Schein, Inc. US8064071025 USD 133.3 NR Walgreens Boots Alliance Inc US9314271084 USD 87.4 NR
Hikma Pharmaceuticals Plc GB00B0LCW083 GBP 23.5 NR Waters Corporation US9418481035 USD 120.0 NR
Honeywell International Inc. US4385161066 USD 96.6 NR West Pharmaceutical Services, Inc. US9553061055 USD 55.0 NR
Hospira, Inc. US4410601003 USD 90.0 NR William Demant Holding A/S DK0010268440 DKK 550.0 Neutral
Illumina, Inc. US4523271090 USD 193.2 NR Ypsomed Holding AG CH0019396990 CHF 105.0 NR
Ipsen SA FR0010259150 EUR 58.8 NR Zimmer Biomet Holdings, Inc. US98956P1021 USD 100.5 NR
Jean Coutu Group (PJC) Inc. Class A CA47215Q1046 CAD 20.6 NR
European Healthcare, 11 September 2015
41 / 44
This page is intentionally left blank
European Healthcare, 11 September 2015
42 / 44
General Disclosures and Disclaimer Author(s): the financial analyst(s) as referred to on the front cover. This Publication was prepared by the legal entity named on the cover page. All rights reserved. When quoting please cite MainFirst as the source. This Publication is provided to Qualified Institutional Investors for their information. It may not be reproduced, redistributed, passed on, directly or indirectly, to any other person or published, in whole or in part, in any form or by any means for any purpose without MainFirst’s prior express consent.
The financial analyst(s) responsible for the production of this Publication certify that all of the views expressed in this report accurately reflect their personal views about any and all of the subject financial instruments or Companies. No part of any of the analyst(s)’ compensation was, is, or will be, directly or indirectly related to the specific recommendations or views expressed by the analyst in this Publication. In particular, the financial analyst(s) receive compensation based upon various factors, including the accuracy of research, client support and feedback, competitive factors and overall MainFirst revenues, which include revenues from Equity Brokerage, Asset Management, Fixed Income and independent Corporate Advisory services.
The information, tools and material presented in this Publication are provided to recipients for informational purposes only and are not to be used or considered as an offer or solicitation to sell or offer or solicitation to buy or subscribe for securities or other financial instruments. This Publication is for clients only and it is intended to provide information to assist Qualified Institutional Investors in making their own investment decisions. It is not intended to provide investment advice to any specific investor. In particular, it does not constitute a personal recommendation or take into account the particular investment objectives, financial situation, or individual investor needs. Investments discussed and recommendations made herein may not be suitable for all investors. Recipients must exercise their own independent judgement as to the suitability of such investments and recommendations in the light of their own investment objectives, experience, tax and financial position or individual needs.
This Publication has been prepared by its author(s) independently of the Company, and none of MainFirst, the Company or its shareholders have verified any of the information given in this document, unless otherwise stated herein. The Publication is based on information derived from selected public sources we believe to be reliable and in good faith but neither its fairness, accuracy, completeness or suitability for investors' purposes can be represented or warranted, expressly or impliedly. Opinions expressed herein reflect the current views of the author(s) and not necessarily the opinions of MainFirst or any of its subsidiaries or affiliates. Any opinions, forecasts, assumptions, estimates, derived valuations and target price(s) contained herein are as of the date of this Publication and subject to change at any time without prior notice. There can be thus no assurance that future results or events will be consistent with any such opinions, forecasts or estimates.
MainFirst salespeople or traders may provide market commentary or trading strategies to Qualified Institutional Investors, third parties or to MainFirst trading desks that reflect opinions that are contrary to the opinions expressed in this Publication. MainFirst may have issued other Publications that are inconsistent with, and reach different conclusions from, the information presented in this Publication. Those Publications may reflect different assumptions, views and analytical methods of the analysts who prepared them and MainFirst is under no obligation to ensure that such Publications are brought to your attention, unless Section 4 par. 4 No. 4 FinAnV applies.
MainFirst hereby expressly disclaims, to the extent permitted by applicable law and/or regulation (tort, contract, strict liability or otherwise), all warranties, express, statutory or implied, regarding this Publication and any results to be obtained from the use of this Publication, including but not limited to all warranties of merchantability, fitness for a particular purpose or use and all warranties arising from course of performance, course of dealing and/or usage of trade or their equivalents under the applicable laws and/or regulations of any jurisdiction. MainFirst does not warrant or guarantee the accuracy, timeliness, suitability, completeness or availability of this Publication or the information or results obtained from use of this Publication, or that this Publication or the information or results will be free from error.
Under no circumstances and under no theory of any applicable law and/or regulation, shall MainFirst or any of its affiliates be liable to anyone for any direct, indirect, special, incidental, consequential, punitive or exemplary damages arising in any way from the information contained in this Publication, including damages for trading losses or lost profits, or for any claim or demand by any third party, even if MainFirst knew or had reason to know of the possibility of such damages, claim or demand.
SELECTED COMPANIES DISCLOSURE
For selected companies, MainFirst financial analysts may identify shorter-term trading opportunities that are either consistent or inconsistent with MainFirst’s existing longer term recommendations. This information is made solely available to MainFirst clients. MainFirst may trade for its own account as a result of the short term trading opportunities seen by analysts and may also engage in securities transactions in a manner inconsistent with this Publication and with respect to subject financial instruments, will sell to or buy from customers on a principal basis. Disclosures of conflicts of interest, if any, are discussed in the company specific disclosures section or daily on the MainFirst website http://www.mainfirst.com/en/downloads/legal-disclaimer-clauses.html under "Equity Research Disclosure of Interests and Conflicts of Interest"
FURTHER DISCLOSURES AND CONDITIONS FOR EUROPEAN ECONOMIC AREA (EEA) QUALIFIED INSTITUTIONAL INVESTORS
In accordance with applicable EEA laws and regulations MainFirst has implemented internal organizational arrangements and rules that prevent or deal with conflicts of interest. Adherence is monitored by the Compliance Department. A general description of how MainFirst identifies and manages conflicts of interest and a general description of the prevention and management of conflicts of interest in the context of investment research in the EEA is available on the MainFirst website http://www.mainfirst.com/en/downloads/legal-disclaimer-clauses.html under “Conflicts of Interest Management Policy”.
ADDITIONAL DISCLOSURES AND CONDITIONS FOR UK QUALIFIED INSTITUTIONAL INVESTORS
This Publication is issued by MainFirst and is intended for distribution in the United Kingdom (U.K.) only to market counterparties, intermediate customers or other persons who (i) are persons falling within article 19(5) of the Financial Services and Markets Act 2000 (Financial Promotion) Order 2005 (the “Order”), namely persons having professional experience in matters relating to investments or (ii) are persons falling within article 49(2)(a) to (d) of the Order, namely high net worth companies, unincorporated associations etc. and (iii) to whom it may otherwise lawfully be communicated (all such persons together being referred to as “Relevant Persons”). This document must not be acted on or relied upon by persons who are not Relevant Persons. Any investment or
European Healthcare, 11 September 2015
43 / 44
investment activity to which this document relates is available only to Relevant Persons and will be engaged in only with Relevant Persons. UK residents are advised also to read all other disclosures made in this Publication carefully. MainFirst London Branch is authorised by BaFin and supervised by the Financial Conduct Authority (FCA) for the conduct of UK business.
ADDITIONAL DISCLOSURES AND CONDITIONS FOR U.S. QUALIFIED INSTITUTIONAL INVESTORS
This Publication is issued by MainFirst and is intended for distribution as Third Party Research in the United States of America (“U.S”.) through MainFirst Securities US Inc. ("MFSUS"), 747 Third Avenue, 35th Floor, New York, NY 10017, phone: +1 212 750 4202, only to institutional investors and major institutional investors as defined in Rule 15a-6 under the U.S. Exchange Act of 1934, as amended (the “Exchange Act”) and may not be furnished to any other person in the US. MainFirst is not a member of FINRA. Therefore MainFirst, its employees and the research analysts of MainFirst are not subject to Rule 2711. MFSUS is an affiliated broker-dealer registered with the U.S. Securities and Exchange Commission under the Exchange Act, and a member of the Securities Investor Protection Corporation (SIPC) and the Financial Industry Regulatory Authority (FINRA; CRD #150982). Rule 2711 applies only to MFSUS. MFSUS accepts responsibility under applicable laws for the content of this document when it distributes this document in the United States. Additional information is available about this document upon request. Recipients of this Publication represent and agree that that they shall not distribute or provide this Publication to any other person. Any US recipient of this Publication that wishes further information regarding, or to effect any transaction in, any of the securities discussed in this Publication should contact and place orders solely through a registered representative of MainFirst Securities Inc. This Publication contains research information to be distributed in any form including but not limited to through hard copy, electronic form, presentation, e-mail, SMS or WAP.
MainFirst’s policy prohibits its analysts, professionals reporting to analysts and members of their household(s) from owning securities of any company in the analyst's area of coverage and from serving as an officer, director, advisory board member or employee of any company in the analyst's area of coverage. Analysts may be paid in part based on the profitability of MainFirst, which includes investment banking revenues. Please see the company specific disclosures above for any of the following disclosures required as to Companies referred to in this Publication: (1) having 1% or other ownership; (2) for equity securities: market making and other roles; (3) managing or co-managing of public offerings in prior periods; (4) receiving compensation for certain services; (5 -11) stating different types of client relationships, acting as a financial or corporate advisor, acting as a manager or co-manager in a transaction.
Under the SEC Regulation Analyst Certification (“Regulation AC”), the research analyst(s) as named on the front cover of this Publication certify that (i) the views expressed in this research report accurately reflect their personal views about the subject securities and issuers and that (ii) no part of the research analyst(s)’s compensation was, is, or will be, directly or indirectly related to the specific recommendations or views expressed in this Publication.
European Healthcare, 11 September 2015
44 / 44
International Distribution and Research Locations MainFirst Bank AG MainFirst Bank AG Frankfurt, Headquarters London Branch Kennedyallee 76 151 Shaftesbury Avenue, First Floor 60596 Frankfurt am Main London WC2H 8AL Phone +49 (69) 78808 0 Phone +44 (20) 7478 8000 Fax +49 (69) 78808 198 Fax +44 (20) 7478 8099 Regulated by: Regulated by: Bundesanstalt für Finanzdienstleistungsaufsicht (BaFin), Financial Conduct Authority (FCA), Marie-Curie-Str. 24-28, 60439 Frankfurt/Main 25 The North Colonnade, London E14 5HS MainFirst Bank AG MainFirst Bank AG Milan Branch Paris Branch Via Ugo Foscolo 8 23-25 Rue de Berri 20121 Milan 75008 Paris Phone +39 (02) 854 6571 Phone +33 (1) 7098 3940 Regulated by: Regulated by: Commissione Nazionale per le Società e la Borsa (Consob) Autorité des Marchés Financiers (AMF) Via G.B. Martini, 3 - 00198 Roma 17 place de la Bourse 75082 Paris Cedex 02 MainFirst Schweiz AG MainFirst Bank AG Zurich Sucursal en España Gartenstrasse 32 Paseo de la Castellana 60 CH-8002 Zurich 28046 Madrid Phone +41 (43) 888 61 00 +34 (91) 793 67 00 Fax +41 (43) 888 6199 Regulated by: Regulated by: Eidgenössische Finanzmarktaufsicht (FINMA), Comisión Nacional del Mercado de Valores (CNMV), Einsteinstr. 2, CH-3003 Bern Calle Edison 4, 28006 Madrid
International Distribution Locations MainFirst Securities US Inc. MainFirst Bank AG New York Munich Branch 35th Floor Prannerstraße 15 747 Third Avenue 80333 Munich Phone +1 (212) 750 4200 Phone: +49 (89) 99292 820 Fax +1 (212) 750 4219 Fax +49 (89) 99292 8299 Regulated by: Regulated by: Financial Regulatory Authority (FINRA), Bundesanstalt für Finanzdienstleistungsaufsicht (BaFin), 99 High Street, Suite 900, Boston MA 02110 Marie-Curie-Str. 24-28, 60439 Frankfurt/Main