Embed Size (px)
Citation preview

Deutsche Bank Markets Research
Europe
Synthetic Equity & Index Strategy
European Monthly ETF Market Review
Date
8 July 2016
Increased Activity and Net Inflows Across All Asset Classes
Data in this report is as of 30th June 2016
________________________________________________________________________________________________________________
Deutsche Bank AG/London
Deutsche Bank does and seeks to do business with companies covered in its research reports. Thus, investors should be aware that the firm may have a conflict of interest that could affect the objectivity of this report. Investors should consider this report as only a single factor in making their investment decision. DISCLOSURES AND ANALYST CERTIFICATIONS ARE LOCATED IN APPENDIX 1.MCI (P) 057/04/2016.
Author
Ari Rajendra
Strategist
(+44) 20 754-52282
Team Contacts
Shan Lan
Strategist
(+852 ) 22036716
Sebastian Mercado, CFA
Strategist
(+1) 212 250-8690
European ETP Monthly Highlights (Assets & Flows)
Assets: European ETPs assets stood at $532bn (€479bn) at the end of Jun’16, up by 0.2% (MoM in € terms).
Flows: European domiciled ETPs registered net inflows of +€4.5bn across all major asset classes (equity, fixed income and commodity). Equity ETFs lead the rally with inflows of +€2bn followed by fixed income (+€1.3bn) and commodity ETPs (+€1.2bn).
New Product Launches – 12 new products European ETP market witnessed 12 new product launches in June which includes 8 Smart Beta ETFs in equity and 4 fixed income ETFs.
Investment Themes for the Month
US and UK focused ETFs attracted inflows of +€0.6bn and +€0.2bn respectively.
Financial Sector ETFs recorded inflows of +€531mn, primarily into banking sector ETFs (+€475mn).
Smart beta ETFs have registered +€1.2bn worth of new money in June with YTD flows went above +€4bn.
Broad European equities (e.g. MSCI Europe / STOXX 600) and Japan focused ETFs witnessed outflows of -€0.7bn, & -€0.4bn respectively.
Gold ETPs registered inflows of +€1.1bn (+€5.8bn so far this year).
Turnover: MoM turnover activity up by 54% The total turnover activity for European ETPs was up by 54% (€93.5bn) from the previous month’s total (€60.8bn), driven by increased activity post the UK referendum. On MoM basis, Equity ETFs witnessed turnover activity increased by 67% followed by Commodity (+60%) and fixed income ETFs (+27%).
Price premium/discount to NAV monitor The maximum premiums/discounts to NAV in June were observed in the following categories: Equities: Deepest discount (-1.09%) in Size ETFs and highest premium
(0.47%) occurred within Style ETFs.
Fixed Income: Deepest discount in Credit (CDS) ETFs (-0.99%) while highest premium in Corporate ETFs (0.60%).
US Market: European exposure ETFs witness outflows in June European equity exposure ETFs listed in US had outflows of -$2.2bn during June (-$12.3bn so far this year).
Distributed on: 07/08/2016 14:59:24GMT

8 July 2016
European Monthly ETF Market Review
Deutsche Bank AG/London Page 2
Table of Contents
European ETP Highlights ......................................................................................... 3 New Launch Activity: 12 Products launches in June ............................................... 3 Investment Themes for the Month .......................................................................... 4 Views from DB European Equity Strategy team ...................................................... 5 Turnover: MoM turnover activity up by 54% ........................................................... 5 Price discounts/premium to NAV Monitor ............................................................... 6 US Market: European Exposed ETFs witness outflows in June .............................. 6
1. Investment Trends ...................................................... 8 Cross-Asset Class ETPs ........................................................................................... 8
2. Market Metrics ............................................................ 9 ETF Industry Asset Evolution ................................................................................... 9 ETFs vs. Cash Equities ............................................................................................12 ETFs vs. Unlisted Mutual Funds .............................................................................13 European ETF Industry Replication Structure Composition (Synthetic vs. Physical)
................................................................................................................................15 Industry Growth Analysis ........................................................................................16
3. Cash Flow Analysis ................................................... 18 Regional Cash Flow Analysis ..................................................................................18 Asset Class Cash Flow Analysis .............................................................................18 Product Rankings ....................................................................................................24
4. Product Review ......................................................... 26 New Products Launched in the Month ...................................................................26 Average TERs .........................................................................................................28
5. Provider Rankings ..................................................... 31 Global Provider Rankings ........................................................................................31 European Provider Rankings – General ...................................................................33 European Provider Rankings – by Asset Class ........................................................37 European Provider Analysis by Replication Method ...............................................40
6. Trading Perspective .................................................. 41 ETP Monthly Turnover Analysis by Asset Class, by Instrument..............................41 Asset Class Analysis ...............................................................................................41 Product Rankings ....................................................................................................47
7. European ETF Exchanges ............................................ 52
8. Assets ......................................................................... 55 ETP Monthly AUM Analysis by Asset Class ...........................................................55 Asset Class Analysis ...............................................................................................55 Product Rankings ....................................................................................................61
9. ETF Broker rankings .................................................. 63 US ETP Broker Rankings .........................................................................................63 European ETP Broker Rankings ..............................................................................65
Appendix A: How we define ETPs ..................................... 67
Appendix B: The road from beta to alpha ......................... 68

8 July 2016
European Monthly ETF Market Review
Deutsche Bank AG/London Page 3
European ETP Highlights
Assets: European ETPs AUM increased by €1bn on a MoM basis and ended
the month at €479bn. Commodity ETPs assets surged the most with MoM
increase of 13% followed by Fixed Income (2%) while Equity ETFs declined by -
2%. For more details please refer to Assets section on page 55.
Flows: European domiciled ETPs registered net inflows of +€4.5bn across all
major asset classes (equity, fixed income and commodity). Equity ETFs lead
the rally with inflows of +€2bn followed by fixed income (+€1.3bn) and
commodity ETPs (+€1.2bn). For more details please refer to Cash Flow
Analysis section on page 18.
Global ETPs Highlights
Global ETPs assets increased by $25bn and reached $3.07 trillion at the end of
Jun’16, 0.8% up from last month-end levels. Global ETPs registered inflows of
+$25bn during June (+$12bn for May). US listed ETPs benefitted from inflows
of +$20bn while for Asia-Pac listed ETPs, we observed net inflows of +$0.6bn.
Figure 1: Global ETPs Snapshot | ETPs | Global |
Region Jun-16 May-16
MoM
Change
(%)
Jun-16 May-16 Jun-16 May-16
MoM
Change
(%)
AUMCash
Flows*Turnover
US 2237.77 2211.34 1.20% 19.62 1.75 1798.24 1384.17 29.91% 73% 0.9% 86%
Europe 532.00 531.91 0.02% 5.04 2.50 104.80 68.75 52.44% 17% 0.9% 5%
Asia-Pacific 297.38 299.21 -0.61% 0.57 7.31 194.21 172.78 12.40% 10% 0.2% 9%
Global 3067.15 3042.46 0.81% 25.24 11.57 2097.24 1625.70 29.01% 100% 0.8% 100%
AUM ($bn) Cash Flow ($bn) Turnover ($bn) Market Share (%)
Source: Deutsche Bank, Bloomberg Finance LP, Reuters. *Cash Flow Market Share corresponds to Jun-16 Monthly Cash Flow / End of May-16 AUM
New Launch Activity: 12 Products launches in June
European ETP market witnessed 12 new product launches in June. Within
equity, BNP Paribas listed 5 Smart beta ETFs based on Europe (Value, Growth,
Momentum & Low Vol) and US (Low Vol) indices. WisdomTree and
Powershares also listed 2 and 1 dividend based Smart beta ETFs respectively
during June. Deutsche AWM, Sun Global Investments, BlackRock and new
issuer Fullgoal Fund Management Co, each listed 1 fixed income product over
the period of last month.
8 July 2016
European Monthly ETF Market Review
Page 4 Deutsche Bank AG/London
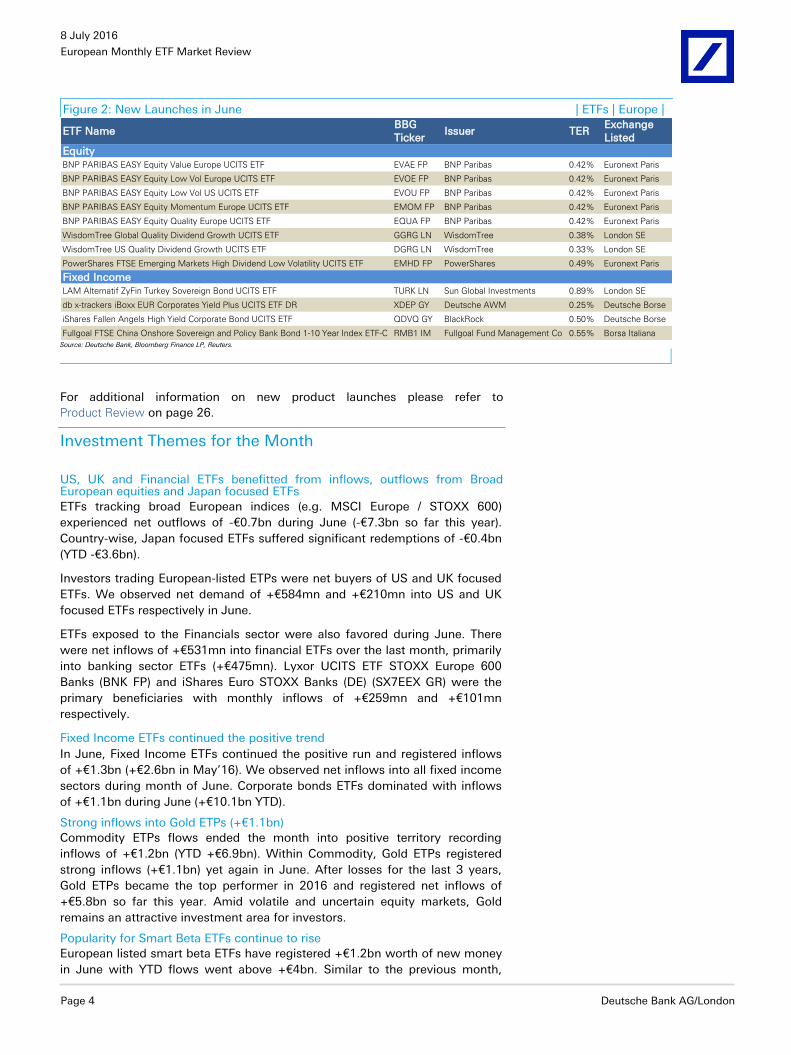
Figure 2: New Launches in June | ETFs | Europe |
ETF NameBBG Ticker
Issuer TERExchange Listed
EquityBNP PARIBAS EASY Equity Value Europe UCITS ETF EVAE FP BNP Paribas 0.42% Euronext Paris
BNP PARIBAS EASY Equity Low Vol Europe UCITS ETF EVOE FP BNP Paribas 0.42% Euronext Paris
BNP PARIBAS EASY Equity Low Vol US UCITS ETF EVOU FP BNP Paribas 0.42% Euronext Paris
BNP PARIBAS EASY Equity Momentum Europe UCITS ETF EMOM FP BNP Paribas 0.42% Euronext Paris
BNP PARIBAS EASY Equity Quality Europe UCITS ETF EQUA FP BNP Paribas 0.42% Euronext Paris
WisdomTree Global Quality Dividend Growth UCITS ETF GGRG LN WisdomTree 0.38% London SE
WisdomTree US Quality Dividend Growth UCITS ETF DGRG LN WisdomTree 0.33% London SE
PowerShares FTSE Emerging Markets High Dividend Low Volatility UCITS ETF EMHD FP PowerShares 0.49% Euronext Paris
Fixed IncomeLAM Alternatif ZyFin Turkey Sovereign Bond UCITS ETF TURK LN Sun Global Investments 0.89% London SE
db x-trackers iBoxx EUR Corporates Yield Plus UCITS ETF DR XDEP GY Deutsche AWM 0.25% Deutsche Borse
iShares Fallen Angels High Yield Corporate Bond UCITS ETF QDVQ GY BlackRock 0.50% Deutsche Borse
Fullgoal FTSE China Onshore Sovereign and Policy Bank Bond 1-10 Year Index ETF-C RMB1 IM Fullgoal Fund Management Co 0.55% Borsa Italiana Source: Deutsche Bank, Bloomberg Finance LP, Reuters.
For additional information on new product launches please refer to
Product Review on page 26.
Investment Themes for the Month
US, UK and Financial ETFs benefitted from inflows, outflows from Broad European equities and Japan focused ETFs
ETFs tracking broad European indices (e.g. MSCI Europe / STOXX 600)
experienced net outflows of -€0.7bn during June (-€7.3bn so far this year).
Country-wise, Japan focused ETFs suffered significant redemptions of -€0.4bn
(YTD -€3.6bn).
Investors trading European-listed ETPs were net buyers of US and UK focused
ETFs. We observed net demand of +€584mn and +€210mn into US and UK
focused ETFs respectively in June.
ETFs exposed to the Financials sector were also favored during June. There
were net inflows of +€531mn into financial ETFs over the last month, primarily
into banking sector ETFs (+€475mn). Lyxor UCITS ETF STOXX Europe 600
Banks (BNK FP) and iShares Euro STOXX Banks (DE) (SX7EEX GR) were the
primary beneficiaries with monthly inflows of +€259mn and +€101mn
respectively.
Fixed Income ETFs continued the positive trend
In June, Fixed Income ETFs continued the positive run and registered inflows
of +€1.3bn (+€2.6bn in May’16). We observed net inflows into all fixed income
sectors during month of June. Corporate bonds ETFs dominated with inflows
of +€1.1bn during June (+€10.1bn YTD).
Strong inflows into Gold ETPs (+€1.1bn)
Commodity ETPs flows ended the month into positive territory recording
inflows of +€1.2bn (YTD +€6.9bn). Within Commodity, Gold ETPs registered
strong inflows (+€1.1bn) yet again in June. After losses for the last 3 years,
Gold ETPs became the top performer in 2016 and registered net inflows of
+€5.8bn so far this year. Amid volatile and uncertain equity markets, Gold
remains an attractive investment area for investors.
Popularity for Smart Beta ETFs continue to rise
European listed smart beta ETFs have registered +€1.2bn worth of new money
in June with YTD flows went above +€4bn. Similar to the previous month,

8 July 2016
European Monthly ETF Market Review
Deutsche Bank AG/London Page 5
investors preferred Minimum volatility ETFs where Amundi ETF MSCI Europe
Minimum Volatility UCITS ETF (MIVO FP) and MS Scientific Beta Global Equity
Factors UCITS ETF (GEF LN) benefitted the most with inflows of +€193mn and
+€133mn in June respectively.
Views from DB European Equity Strategy team
DB European Equity Strategists are overweight pharma while underweight banking, mining and German equities1 amid uncertain global macroeconomic conditions. Investors who share the same long and short view may use the following ETFs respectively (Top 3 ETFs by AUM for healthcare and banking sector) to implement their view.
Figure 3: Top 3 Healthcare & Banking sector focused ETFs by AUM
Bloomberg Ticker
ETF Name TERAUM
(€mn)
YTD Flows (€mn)
Healthcare
SXDPEX GR iShares STOXX 600 Health Care (DE) 0.46% 557 10HLT FP Lyxor ETF STOXX 600 Healthcare 0.30% 206 -13 XDPS GR STOXX 600 Optimised Health Care Source ETF 0.30% 193 48
Banking
BNK FP Lyxor UCITS ETF STOXX Europe 600 Banks 0.30% 729 59SX7EEX GR iShares Euro STOXX Banks (DE) 0.51% 717 -80 SX7PEX GR iShares STOXX 600 Banks (DE) 0.46% 346 -77
Source: Deutsche Bank, Bloomberg Finance LP, Reuters.
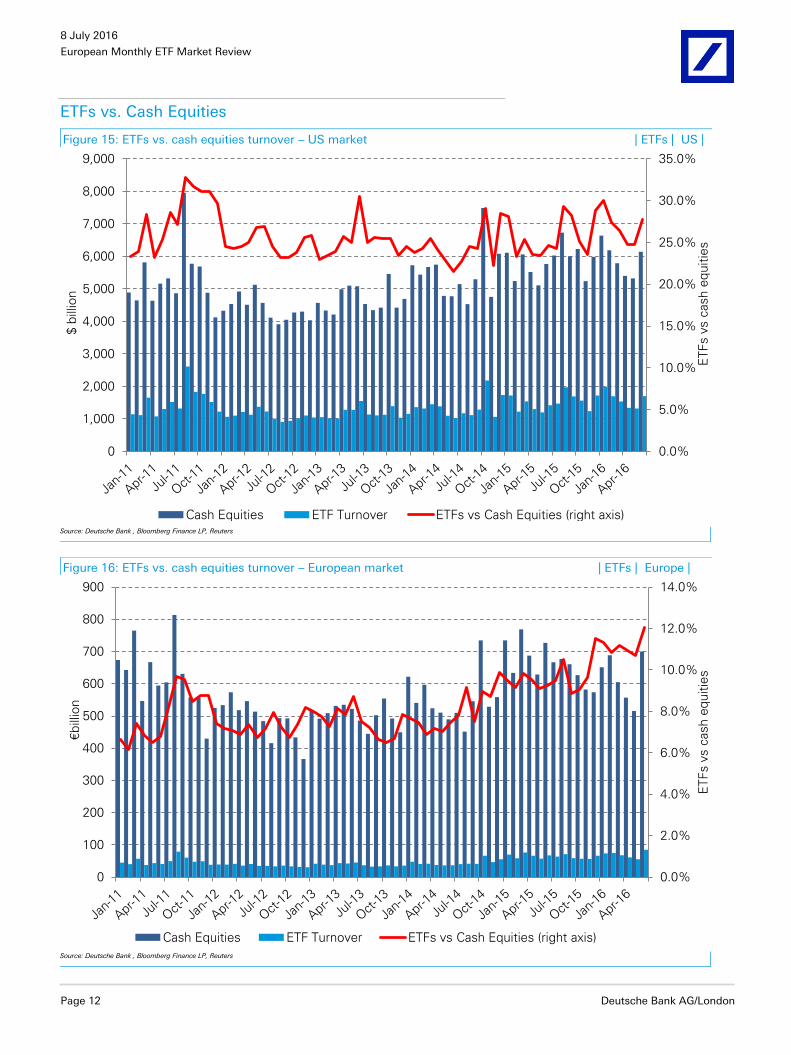
Turnover: MoM turnover activity up by 54%
The total turnover activity into European ETPs was up by 54% (€93.5bn) from
the previous month’s total (€60.8bn). This was primarily driven by elevated
volumes post the UK referendum on June 23rd. On MoM basis, Equity ETFs
witnessed turnover activity increased by 67% followed by Commodity (+60%)
and fixed income ETFs (+27%). Turnover as % of Avg. AUM increased
significantly for all the major asset classes since the start of 2016. For more
details please refer to Trading Perspective on page 41.
Figure 4: Monthly TO as % of Avg. AUM | ETPs | Europe |
0%
5%
10%
15%
20%
25%
30%
TO
as %
of
Avg
. A
UM
*
Equity Fixed Income Commodity
* Avg. AUM has been calculated using previous month end and current month end AUM. Source: Deutsche Bank, Bloomberg Finance LP, Reuters.
1 European Equity Strategy - UK Referendum: the cracks are starting to show – Sebastian Raedler, 29th
June 2016

8 July 2016
European Monthly ETF Market Review
Page 6 Deutsche Bank AG/London
Price discounts/premium to NAV Monitor
The price of ETFs may not trade in-line with its respective NAVs driven by
multiple factors such as supply/demand, market access, duty and varying
trading time zones of stocks within an index. In this section we highlight, for
ETFs with European equity exposure only, the median, maximum premium and
maximum discount observed in varying categories for this month. Figures
below illustrate the Price premium/discount to NAV for European ETFs. Equities: Deepest discount (-1.09%) in Size ETFs and highest premium
(0.47%) occurred within Style ETFs.
Fixed Income: Deepest discount in Credit (CDS) ETFs (-0.99%) while
highest premium in Corporate ETFs (0.60%).
Figure 5: Price premium/discount to NAV | ETFs | Europe |
Max
Discount
Max
PremiumMedian
Max
Discount
Max
PremiumMedian
Max
Discount
Max
PremiumMedian
Equity
Country -0.15% 0.40% 0.09% -0.27% 0.22% 0.07% -0.66% 0.59% 0.06%
Regional -0.51% 0.44% 0.06% -0.48% 0.23% -0.02% -0.82% 0.64% -0.01%
Size -1.09% 0.41% -0.01% -0.41% 0.21% -0.08% -1.09% 0.48% -0.07%
Style -0.60% 0.47% 0.03% -0.36% 0.15% -0.02% -0.66% 0.67% 0.00%
Sector -0.34% 0.47% 0.03% -0.31% 0.29% -0.01% -0.65% 0.66% 0.02%
Strategy -0.15% 0.36% 0.02% -0.04% 0.11% 0.03% -0.15% 0.36% 0.03%
Fixed Income
Sovereign -0.12% 0.07% -0.03% -0.08% 0.05% -0.04% -0.12% 0.07% -0.03%
Corporates -0.06% 0.60% 0.23% - 0.37% 0.22% -0.21% 1.62% 0.27%
Broad -0.38% 0.23% -0.03% -0.20% 0.11% -0.08% -0.67% 0.47% -0.03%
Money Market 0.00% 0.00% 0.00% 0.00% 0.00% 0.00% -0.02% 0.01% 0.00%
Credit exposure -0.99% - -0.29% -0.34% - -0.28% -0.99% 0.24% -0.31%
Covered Bonds -0.16% 0.49% 0.09% -0.27% 0.19% -0.02% -0.28% 0.49% 0.02%
*Universe: Europe Listed ETFs with European focus (DM only), AUM>€200mn.
*Calculation Methodolgy: We have calculated asset weighted daily avg. Price premium/discount to Nav of a category and then derived
max. discount/premium and median for a period.
Jun-16 May-16 YTD
Source: Deutsche Bank, Bloomberg Finance LP, Reuters.
US Market: European Exposed ETFs witness outflows in June
US domiciled ETPs recorded inflows of +$19.6bn in June (+$1.8bn in May’16)
taking YTD flows to +$65bn. Fixed Income continued the positive trend with
inflows of +$8.4 followed by Equity ETFs (+$6.7bn) and Commodity ETPs
(+$4bn) over the period of last month.
European exposed ETFs listed in US had outflows of -$2.2bn (-$2.8bn in
May’16) during June. European exposure ETFs remained weak so far this year
with net outflows of -$12.3bn (+$34bn total flows in 2015). Figures below
illustrates the monthly flows into European focused ETFs listed in US and
Europe for 2015 & 2016.

8 July 2016
European Monthly ETF Market Review
Deutsche Bank AG/London Page 7
Figure 6: Monthly flows in European focused ETFs listed in US
and Europe (2015 & 2016)
-4
-2
-
2
4
6
8
Jan
-15
Feb
-15
Mar-
15
Ap
r-15
May-1
5
Ju
n-1
5
Ju
l-15
Au
g-1
5
Sep
-15
Oct-
15
No
v-1
5
Dec-1
5
Jan
-16
Feb
-16
Mar-
16
Ap
r-16
May-1
6
Ju
n-1
6
Mo
nth
ly F
low
s $
bn
US Listed Europe Listed
Source: Deutsche Bank, Bloomberg Finance LP, Reuters.

8 July 2016
European Monthly ETF Market Review
Page 8 Deutsche Bank AG/London
1. Investment Trends2
Cross-Asset Class ETPs
Figure 7: Cash flows by asset class – YTD
| ETPs | Europe |
Figure 8: Cash flows by asset class – Month
| ETPs | Europe |
-8,000
-4,000
0
4,000
8,000
12,000
16,000
20,000
24,000
28,000
€m
illio
ns
Equity Fixed Income Commodity Others
-1,000
0
1,000
2,000
3,000
4,000
5,000
€m
illio
ns
Equity Fixed Income Commodity Others
Source: Deutsche Bank, Bloomberg Finance LP, Reuters.
Source: Deutsche Bank, Bloomberg Finance LP, Reuters.
2 Investment trends as expressed by cumulative monthly and YTD cash flows

8 July 2016
European Monthly ETF Market Review
Deutsche Bank AG/London Page 9
2. Market Metrics
ETF Industry Asset Evolution
Figure 9: Global ETP regional asset growth | ETPs | Global |
2003 2004 2005 2006 2007 2008 2009 2010 2011 2012 2013 2014 2015 2016**
Asia Pacific ($) 34.8 39.9 42.8 49.2 61.8 52.9 67.0 84.2 91.3 136.3 168.8 202.2 283.2 297.4
Europe ($) 20.5 33.0 51.3 91.4 131.7 144.9 243.8 309.3 297.5 368.3 415.7 458.8 506.6 532.0
US ($) 144.4 205.8 297.8 427.1 611.8 536.7 783.5 996.8 1,046.4 1,333.5 1,677.9 1,979.2 2,113.5 2,237.8
US, Europe & Asia Pacific ($) 199.8 278.7 391.9 567.6 805.3 734.5 1,094.3 1,390.3 1,435.3 1,838.0 2,262.4 2,640.2 2,903.2 3,067.1
Europe (€) 16.3 24.3 43.3 69.3 90.1 103.3 170.0 230.6 229.2 279.3 301.7 379.2 466.3 478.9
Number of ETPs* 269 324 432 737 1,213 1,666 2,041 2,580 3,124 3,491 3,711 4,022 4,427 4,576
0
500
1,000
1,500
2,000
2,500
3,000
3,500
4,000
4,500
5,000
0
500
1,000
1,500
2,000
2,500
3,000
3,500
Num
ber
of
ETP
s
$ b
illio
n
Source: Deutsche Bank, Bloomberg Finance LP, Reuters. *Number of ETPs at the end of the year is net of delistings for the period. ** As of last month
Figure 10: Global ETPs (ETF,ETV & ETC) asset growth | ETPs | Global |
2003 2004 2005 2006 2007 2008 2009 2010 2011 2012 2013 2014 2015 2016**
ETCs - 0.7 1.3 2.0 5.2 7.4 17.6 26.8 28.7 35.8 21.7 20.7 17.8 27.8
ETVs 1.2 2.7 6.3 15.8 29.9 37.7 76.8 103.5 107.1 119.3 63.5 56.7 48.2 74.7
ETFs 198.6 275.3 384.4 549.8 770.3 689.4 999.9 1,260.0 1,299.4 1,682.9 2,177.2 2,562.7 2,837.3 2,964.6
Total 199.8 278.7 391.9 567.6 805.3 734.5 1,094.3 1,390.3 1,435.3 1,838.0 2,262.4 2,640.2 2,903.2 3,067.1
Number of ETPs* 269 324 432 737 1,213 1,666 2,041 2,580 3,124 3,491 3,711 4,022 4,427 4,576
-
500
1,000
1,500
2,000
2,500
3,000
3,500
4,000
4,500
5,000
0
500
1,000
1,500
2,000
2,500
3,000
3,500
Nu
mb
er
of
ETP
s
$ b
illio
n
Source: Deutsche Bank, Bloomberg Finance LP, Reuters. *Number of ETPs at the end of the year is net of delistings for the period. ** As of last month

8 July 2016
European Monthly ETF Market Review
Page 10 Deutsche Bank AG/London
Figure 11: Global ETF regional asset growth | ETFs | Global |
2003 2004 2005 2006 2007 2008 2009 2010 2011 2012 2013 2014 2015 2016**
Asia Pacific ($) 34.8 39.9 42.8 49.2 61.3 52.6 66.4 83.5 90.7 135.5 168.3 201.8 282.9 297.0
Europe ($) 20.5 32.3 50.0 89.4 127.1 137.7 226.8 283.1 269.5 333.2 394.5 438.5 489.1 504.6
US ($) 143.2 203.1 291.5 411.2 581.9 499.1 706.7 893.3 939.3 1,214.2 1,614.4 1,922.5 2,065.3 2,163.1
US, Europe & Asia Pacific ($) 198.6 275.3 384.4 549.8 770.3 689.4 999.9 1,260.0 1,299.4 1,682.9 2,177.2 2,562.7 2,837.3 2,964.6
Europe (€) 16.3 23.8 42.2 67.8 86.9 98.2 158.1 211.1 207.6 252.7 286.3 362.4 450.3 454.2
Number of ETFs* 257 310 415 677 1,116 1,481 1,802 2,231 2,696 2,962 3,181 3,486 3,889 4,053
0
500
1,000
1,500
2,000
2,500
3,000
3,500
4,000
4,500
0
500
1,000
1,500
2,000
2,500
3,000
3,500
Num
ber
of
ETF
s
$ b
illio
n
Source: Deutsche Bank, Bloomberg Finance LP, Reuters. *Number of ETPs at the end of the year is net of delistings for the period. ** As of last month
Figure 12: European ETF asset growth by asset class | ETFs | Europe |
2003 2004 2005 2006 2007 2008 2009 2010 2011 2012 2013 2014 2015 2016**
Other - - - - 96 168 1,078 1,987 1,515 1,592 1,516 1,410 1,398 1,217
Commodity - - 340 1,402 2,314 3,591 10,570 19,312 23,057 26,152 14,512 13,412 12,298 16,334
Fixed Income 801 2,034 4,002 9,370 13,743 28,979 35,915 42,490 43,695 54,169 60,444 86,151 112,42 131,17
Equity 15,532 21,815 37,907 57,029 70,776 65,473 110,54 147,27 139,31 170,82 209,80 261,39 324,13 305,45
Total 16,332 23,849 42,249 67,801 86,930 98,211 158,10 211,05 207,57 252,74 286,27 362,37 450,26 454,17
Number of ETFs* 100 114 163 267 419 614 818 1,052 1,214 1,310 1,350 1,439 1,517 1,539
0
300
600
900
1,200
1,500
1,800
0
50,000
100,000
150,000
200,000
250,000
300,000
350,000
400,000
450,000
500,000
Num
ber
of
ETF
s
€m
illio
n
Source: Deutsche Bank, Bloomberg Finance LP, Reuters. *Number of ETPs at the end of the year is net of delistings for the period. ** As of last month

8 July 2016
European Monthly ETF Market Review
Deutsche Bank AG/London Page 11
Figure 13: European Commodity ETP (ETF & ETC) asset growth by segment | ETPs | Europe |
2004 2005 2006 2007 2008 2009 2010 2011 2012 2013 2014 2015 2016**
Livestock - - 1 21 63 49 67 59 40 17 19 14 10
Industrial Metals - - 4 44 99 413 828 734 1,063 713 777 467 494
Agriculture - - 58 799 507 1,553 1,825 1,356 1,093 895 826 787 717
Energy - 50 153 174 349 1,918 2,056 1,494 1,546 1,396 1,078 2,213 2,542
Overall - - 1,103 1,444 981 3,531 5,582 4,439 4,846 3,779 3,580 3,668 4,913
Precious Metals 520 886 1,595 2,993 6,713 14,930 28,256 36,334 43,887 22,813 23,555 20,859 32,023
Total 520 936 2,914 5,475 8,712 22,395 38,614 44,417 52,475 29,613 29,835 28,007 40,699
Number of ETPs* 1 3 40 76 144 185 249 326 423 416 391 398 391
-
90
180
270
360
450
0
10,000
20,000
30,000
40,000
50,000
60,000
Num
ber
of
ETP
s
€m
illio
n
Source: Deutsche Bank, Bloomberg Finance LP, Reuters. *Number of ETPs at the end of the year is net of delistings for the period. ** As of last month
Figure 14: European ETPs (ETF & ETC) asset growth | ETPs | Europe |
2003 2004 2005 2006 2007 2008 2009 2010 2011 2012 2013 2014 2015 2016**
ETCs - 491 1,077 1,512 3,161 5,121 11,847 19,514 21,587 26,581 15,415 16,813 16,057 24,694
ETFs 16,332 23,849 42,249 67,801 86,930 98,211 158,10 211,05 207,57 252,74 286,27 362,37 450,26 454,17
Total 16,332 24,340 43,326 69,313 90,091 103,33 169,95 230,57 229,16 279,32 301,69 379,18 466,31 478,86
Number of ETPs 100 115 165 299 476 738 994 1,331 1,564 1,748 1,794 1,890 1,972 1,989
-
400
800
1,200
1,600
2,000
0
100,000
200,000
300,000
400,000
500,000
600,000
Num
ber
of
ETP
s
€m
illio
n
Source: Deutsche Bank, Bloomberg Finance LP, Reuters. *Number of ETPs at the end of the year is net of delistings for the period. ** As of last month
8 July 2016
European Monthly ETF Market Review
Page 12 Deutsche Bank AG/London
ETFs vs. Cash Equities
Figure 15: ETFs vs. cash equities turnover – US market | ETFs | US |
0.0%
5.0%
10.0%
15.0%
20.0%
25.0%
30.0%
35.0%
0
1,000
2,000
3,000
4,000
5,000
6,000
7,000
8,000
9,000
ETF
s v
s c
ash e
quitie
s
$ b
illio
n
Cash Equities ETF Turnover ETFs vs Cash Equities (right axis) Source: Deutsche Bank , Bloomberg Finance LP, Reuters
Figure 16: ETFs vs. cash equities turnover – European market | ETFs | Europe |
0.0%
2.0%
4.0%
6.0%
8.0%
10.0%
12.0%
14.0%
0
100
200
300
400
500
600
700
800
900
ETF
s v
s c
ash e
quitie
s
€b
illio
n
Cash Equities ETF Turnover ETFs vs Cash Equities (right axis)
Source: Deutsche Bank , Bloomberg Finance LP, Reuters

8 July 2016
European Monthly ETF Market Review
Deutsche Bank AG/London Page 13
ETFs vs. Unlisted Mutual Funds
Figure 17: European ETP vs mutual fund assets | ETPs | Europe |
Q1-11 Q2-11 Q3-11 Q4-11 Q1-12 Q2-12 Q3-12 Q4-12 Q1-13 Q2-13 Q3-13 Q4-13 Q1-14 Q2-14 Q3-14 Q4-14 Q1-15 Q2-15 Q3-15 Q4-15 Q1-16 Q2-16*
ETCs 19 19 21 22 23 23 28 27 26 18 18 15 17 17 17 17 20 19 17 16 20 22
ETFs 217 222 201 208 228 222 242 254 268 256 271 287 299 326 344 363 439 429 414 451 438 445
ETPs vs mutual funds 2.9% 3.0% 2.9% 2.9% 3.0% 2.9% 3.1% 3.1% 3.1% 3.0% 3.1% 3.1% 3.1% 3.3% 3.3% 3.3% 3.7% 3.6% 3.6% 3.5% 3.5% 3.5%
ETFs vs mutual funds 2.7% 2.7% 2.6% 2.6% 2.7% 2.6% 2.8% 2.8% 2.8% 2.8% 2.9% 2.9% 3.0% 3.1% 3.1% 3.2% 3.5% 3.4% 3.4% 3.4% 3.4% 3.4%
1.7%
2.2%
2.7%
3.2%
3.7%
4.2%
0
50
100
150
200
250
300
350
400
450
500
ETP
vs m
utu
al fu
nd
s
ETP
AU
M (
€b
illio
n)
*Data as of 29-Apr-2016. Source: Deutsche Bank, European Fund Management Association (EFAMA), Reuters, Bloomberg Finance LP
Figure 18: European ETP vs mutual fund cash flows | ETPs | Europe |
Jul-13 Aug-13 Sep-13 Oct-13 Nov-13 Dec-13 Jan-14 Feb-14 Mar-14 Apr-14 May-14 Jun-14 Jul-14 Aug-14 Sep-14 Oct-14 Nov-14 Dec-14 Jan-15 Feb-15 Mar-15 Apr-15 May-15 Jun-15 Jul-15 Aug-15 Sep-15 Oct-15 Nov-15 Dec-15 Jan-16 Feb-16 Mar-16 Apr-16
ETCs -0.77 -0.03 -0.11 -0.13 -0.13 -0.68 -0.13 0.18 0.40 0.13 -0.16 -0.08 0.38 0.07 -0.46 -0.12 0.24 0.06 0.90 0.82 -0.48 0.07 0.00 -0.31 -0.51 0.43 -0.14 0.25 0.01 -0.02 0.68 2.29 0.51 0.47
ETFs 3.16 0.39 0.99 2.93 2.78 1.64 3.69 3.36 0.88 6.20 4.68 4.20 7.57 5.98 -1.78 5.68 4.13 0.06 11.26 10.26 7.18 4.18 0.28 1.68 7.94 9.73 1.91 5.95 3.56 8.57 2.26 -0.01 3.99 3.10
Mutual funds 52.00 24.10 2.20 39.50 30.00 28.80 84.10 59.70 51.60 76.50 51.20 29.80 74.70 48.70 7.20 60.00 43.30 3.60 105.00 108.80 87.80 98.40 56.70 2.10 71.00 15.30 -5.50 63.80 64.90 28.60 0.20 8.50 26.30 65.10
-20
0
20
40
60
80
100
120
140
Cash F
low
s (
€b
illio
n)
Source: Deutsche Bank, European Fund Management Association (EFAMA), Reuters, Bloomberg Finance LP

8 July 2016
European Monthly ETF Market Review
Page 14 Deutsche Bank AG/London
Figure 19: US ETP vs mutual fund assets | ETPs | US |
Q1-11 Q2-11 Q3-11 Q4-11 Q1-12 Q2-12 Q3-12 Q4-12 Q1-13 Q2-13 Q3-13 Q4-13 Q1-14 Q2-14 Q3-14 Q4-14 Q1-15 Q2-15 Q3-15 Q4-15 Q1-16 Q2-16*
ETVs 108 108 111 107 116 108 125 119 109 72 76 64 67 67 61 57 59 57 52 48 63 66
ETFs 954 976 848 939 1,077 1,054 1,158 1,214 1,340 1,348 1,467 1,614 1,645 1,767 1,776 1,922 2,011 2,034 1,912 2,065 2,100 2,146
ETPs vs mutual funds 11.2% 11.3% 11.4% 11.7% 12.1% 12.0% 12.6% 12.9% 13.1% 12.8% 13.3% 13.6% 13.6% 14.0% 14.2% 15.1% 15.3% 15.5% 15.6% 16.4% 16.7% 16.8%
ETFs vs mutual funds 10.1% 10.2% 10.1% 10.5% 10.9% 10.9% 11.4% 11.7% 12.1% 12.2% 12.6% 13.1% 13.0% 13.5% 13.7% 14.6% 14.9% 15.0% 15.2% 16.0% 16.2% 16.3%
1.7%
3.7%
5.7%
7.7%
9.7%
11.7%
13.7%
15.7%
17.7%
0
500
1,000
1,500
2,000
2,500
ETP
vs m
utu
al fu
nd
s
ETP
AU
M ($ b
illio
n)
*Data as of 31-May-2016. Source: Deutsche Bank, Bloomberg Finance LP, ICI
Figure 20: US ETP vs mutual fund cash flows | ETPs | US |
-100
-80
-60
-40
-20
0
20
40
60
80
Cash f
low
s (
$ b
illio
n)
Jul-13 Aug-13Sep-13 Oct-13 Nov-13Dec-13 Jan-14 Feb-14 Mar-14 Apr-14May-14Jun-14 Jul-14 Aug-14Sep-14 Oct-14 Nov-14Dec-14 Jan-15 Feb-15 Mar-15 Apr-15May-15Jun-15 Jul-15 Aug-15Sep-15 Oct-15 Nov-15Dec-15 Jan-16 Feb-16 Mar-16 Apr-16May-16
ETVs -1.18 -0.19 -0.41 -2.47 -1.37 -3.56 -0.93 0.70 0.33 -1.24 0.07 0.10 1.16 -0.10 -1.19 -0.46 -0.41 0.07 3.67 1.41 -0.96 -0.42 -1.30 -0.56 -0.76 0.67 -0.42 0.78 0.45 -0.98 2.11 5.40 2.35 -0.72 3.30
ETFs 41.32 -18.25 32.85 28.33 14.22 23.19 -14.27 18.19 10.54 20.70 12.56 25.20 16.43 14.92 17.65 26.76 42.45 51.51 -7.88 31.79 28.73 13.80 12.91 18.52 23.73 0.85 20.36 27.22 25.58 39.92 -3.10 -4.22 30.02 11.79 -1.55
Mutual funds 10.28 -17.17 -4.90 10.30 9.10 -20.05 27.88 32.65 26.88 16.94 14.94 13.02 3.37 7.42 22.76 -3.00 13.76 -47.08 25.20 29.05 14.54 5.39 2.96 5.27 -18.97 -39.13 -34.26 -7.85 -30.08 -76.28 -20.77 8.48 14.67 -4.48 -6.60
Source: Deutsche Bank, Bloomberg Finance LP, ICI

8 July 2016
European Monthly ETF Market Review
Deutsche Bank AG/London Page 15
European ETF Industry Replication Structure Composition (Synthetic vs. Physical)
Figure 21: Historical Composition by ETF Structure | ETFs | Europe |
0
100
200
300
400
500
600
700
800
900
-
50
100
150
200
250
300
350
400
450
500
Num
ber
of
ETF
s
AU
M (€
bill
ion)
Physical-AUM Synthetic-AUM Physical-funds Synthetic -funds
Source: Deutsche Bank, Bloomberg Finance LP, Reuters.
Figure 22: European AUM ETF market historical asset class analysis by replication
technique | ETFs | Europe |
Physical Synthetic Physical Synthetic Physical Synthetic
AUM (€ million)
Equity 239,101 85,286 223,048 82,404 223,048 82,404
Fixed Income 87,026 26,050 104,965 26,208 104,965 26,208
Commodity 8,718 3,580 11,679 4,654 11,679 4,654
Others 396 1,003 422 795 422 795
Total 335,241 115,920 340,115 114,061 340,115 114,061
Equity 557 531 581 512 581 512
Fixed Income 203 155 223 158 223 158
Commodity 22 28 22 26 22 26
Others 9 13 8 9 8 9
Total 791 727 834 705 834 705
Equity 36,258 9,398 -4,240 1,392 945 1,051
Fixed Income 19,936 6,800 15,766 311 1,819 -488
Commodity -815 958 927 742 162 27
Others 47 -89 37 -161 57 -36
Total 55,426 17,068 12,489 2,283 2,984 554
ETFs (number of products)
Cash Flows (€ million)
Jun-162015 2016*
*Year-to-date (upto 30-Jun-2016) numbers have been provided). Source: Deutsche Bank, Bloomberg Finance LP, Reuters.

8 July 2016
European Monthly ETF Market Review
Page 16 Deutsche Bank AG/London
Industry Growth Analysis
Figure 23: Global ETF Industry growth attribution | ETFs | Global |
-6.0%
-4.0%
-2.0%
0.0%
2.0%
4.0%
6.0%
8.0%
10.0%
-8.0%
-6.0%
-4.0%
-2.0%
0.0%
2.0%
4.0%
6.0%
8.0%
10.0%
ETF a
sset
price g
row
th c
ontr
ibutio
n (lin
e)
ETF c
ash f
low
gro
wth
co
ntr
ibutio
n (B
ars
)
Jan-14 Feb-14 Mar-14 Apr-14 May-14 Jun-14 Jul-14 Aug-14 Sep-14 Oct-14 Nov-14 Dec-14 Jan-15 Feb-15 Mar-15 Apr-15 May-15 Jun-15 Jul-15 Aug-15 Sep-15 Oct-15 Nov-15 Dec-15 Jan-16 Feb-16 Mar-16 Apr-16 May-16 Jun-16
Price growth -3.0% 3.8% -0.2% 0.4% 1.7% 1.6% -1.5% 2.1% -3.3% 1.1% 1.5% -1.4% -0.5% 3.6% -0.9% 2.2% -0.2% -2.4% 0.0% -5.6% -3.4% 6.3% -0.5% -2.2% -5.3% -0.4% 7.3% 1.4% 0.2% -0.2%
Flows growth -0.3% 1.4% 0.5% 1.5% 0.9% 1.5% 1.3% 1.0% 0.5% 1.5% 1.6% 2.3% 0.2% 1.8% 1.3% 0.4% 0.6% 0.9% 1.8% 0.7% 1.3% 1.3% 0.9% 1.9% 0.3% 0.0% 1.4% 0.3% 0.3% 0.7%
Avg. growth 0.8% 0.8% 0.8% 0.8% 0.8% 0.8% 0.8% 0.8% 0.8% 0.8% 0.8% 0.8% 0.8% 0.8% 0.8% 0.8% 0.8% 0.8% 0.8% 0.8% 0.8% 0.8% 0.8% 0.8% 0.8% 0.8% 0.8% 0.8% 0.8% 0.8%
Total growth -3.3% 5.2% 0.3% 1.9% 2.6% 3.1% -0.2% 3.1% -2.7% 2.5% 3.1% 0.9% -0.3% 5.4% 0.4% 2.6% 0.5% -1.5% 1.8% -4.9% -2.1% 7.6% 0.4% -0.2% -4.9% -0.4% 8.7% 1.7% 0.4% 0.5%
Source: Deutsche Bank, Bloomberg Finance LP, Reuters.
Figure 24: US ETF Industry growth attribution | ETFs | US |
-8.0%
-6.0%
-4.0%
-2.0%
0.0%
2.0%
4.0%
6.0%
8.0%
10.0%
-8.0%
-6.0%
-4.0%
-2.0%
0.0%
2.0%
4.0%
6.0%
8.0%
10.0%
ETF a
sset
price g
row
th c
ontr
ibutio
n (Lin
e)
ETF c
ash f
low
s g
row
th c
ontr
ibutio
n (B
ars
)
Jan-14 Feb-14 Mar-14 Apr-14 May-14 Jun-14 Jul-14 Aug-14 Sep-14 Oct-14 Nov-14 Dec-14 Jan-15 Feb-15 Mar-15 Apr-15 May-15 Jun-15 Jul-15 Aug-15 Sep-15 Oct-15 Nov-15 Dec-15 Jan-16 Feb-16 Mar-16 Apr-16 May-16 Jun-16
Price growth -2.7% 3.9% 0.0% 0.3% 1.8% 1.6% -1.6% 2.8% -3.3% 1.8% 1.4% -1.7% -1.0% 4.1% -1.1% 1.1% 0.4% -2.5% 0.5% -5.6% -3.2% 6.3% -0.2% -2.6% -4.8% -0.2% 5.9% 1.1% 0.6% 0.1%
Flows growth -0.9% 1.2% 0.6% 1.3% 0.8% 1.5% 0.9% 0.9% 1.0% 1.5% 2.3% 2.7% -0.4% 1.7% 1.4% 0.7% 0.6% 0.9% 1.2% 0.0% 1.0% 1.4% 1.2% 1.9% -0.1% -0.2% 1.5% 0.5% -0.1% 0.7%
Avg. growth 0.8% 0.8% 0.8% 0.8% 0.8% 0.8% 0.8% 0.8% 0.8% 0.8% 0.8% 0.8% 0.8% 0.8% 0.8% 0.8% 0.8% 0.8% 0.8% 0.8% 0.8% 0.8% 0.8% 0.8% 0.8% 0.8% 0.8% 0.8% 0.8% 0.8%
Total growth -3.6% 5.0% 0.6% 1.6% 2.6% 3.1% -0.7% 3.7% -2.4% 3.3% 3.7% 1.0% -1.4% 5.7% 0.3% 1.8% 1.0% -1.6% 1.7% -5.5% -2.2% 7.7% 1.1% -0.7% -4.9% -0.5% 7.4% 1.6% 0.5% 0.8%
Source: Deutsche Bank, Bloomberg Finance LP, Reuters.
Figure 25: European ETF Industry growth attribution | ETFs | Europe |
-6.0%
-4.0%
-2.0%
0.0%
2.0%
4.0%
6.0%
8.0%
10.0%
12.0%
14.0%
-6.0%
-4.0%
-2.0%
0.0%
2.0%
4.0%
6.0%
8.0%
10.0%
12.0%
ETF a
sset
price g
row
th c
ontr
ibutio
n (Lin
e)
ETF c
ash f
low
s g
row
th c
ontr
ibutio
n (B
ars
)
Jan-14 Feb-14 Mar-14 Apr-14 May-14 Jun-14 Jul-14 Aug-14 Sep-14 Oct-14 Nov-14 Dec-14 Jan-15 Feb-15 Mar-15 Apr-15 May-15 Jun-15 Jul-15 Aug-15 Sep-15 Oct-15 Nov-15 Dec-15 Jan-16 Feb-16 Mar-16 Apr-16 May-16 Jun-16
Price growth -1.2% 2.4% -0.3% 0.5% 2.5% 0.7% -0.4% 2.1% 0.3% 0.1% 2.1% 0.2% 8.2% 2.2% 2.3% -1.2% 0.9% -3.5% 1.3% -6.5% -2.8% 6.8% 2.3% -4.0% -4.5% -1.1% 1.5% 0.8% 1.5% -0.7%
Flows growth 1.3% 1.7% 0.3% 2.1% 1.5% 1.3% 2.4% 1.8% -0.5% 1.6% 1.2% 0.0% 3.1% 2.6% 1.7% 0.9% 0.1% 0.4% 1.9% 2.2% 0.5% 1.4% 0.8% 1.9% 0.3% 0.0% 1.1% 0.7% 0.4% 0.8%
Avg. growth 1.6% 1.6% 1.6% 1.6% 1.6% 1.6% 1.6% 1.6% 1.6% 1.6% 1.6% 1.6% 1.6% 1.6% 1.6% 1.6% 1.6% 1.6% 1.6% 1.6% 1.6% 1.6% 1.6% 1.6% 1.6% 1.6% 1.6% 1.6% 1.6% 1.6%
Total growth 0.1% 4.0% -0.1% 2.6% 4.0% 2.0% 1.9% 3.9% -0.2% 1.7% 3.3% 0.2% 11.3% 4.7% 4.0% -0.2% 1.0% -3.2% 3.2% -4.3% -2.4% 8.2% 3.1% -2.2% -4.2% -1.1% 2.6% 1.5% 2.0% 0.1%
Source: Deutsche Bank, Bloomberg Finance LP, Reuters.

8 July 2016
European Monthly ETF Market Review
Deutsche Bank AG/London Page 17
Figure 26: European ETC Industry growth attribution | ETCs | Europe |
-15.0%
-10.0%
-5.0%
0.0%
5.0%
10.0%
15.0%
20.0%
25.0%
-15.0%
-10.0%
-5.0%
0.0%
5.0%
10.0%
15.0%
20.0%
25.0%
ETC
asset
price g
row
th c
ontr
ibutio
n (lin
e)
ETC
cash f
low
s g
row
th c
ontr
ibutio
n (B
ars
)
Jan-14 Feb-14 Mar-14 Apr-14 May-14 Jun-14 Jul-14 Aug-14 Sep-14 Oct-14 Nov-14 Dec-14 Jan-15 Feb-15 Mar-15 Apr-15 May-15 Jun-15 Jul-15 Aug-15 Sep-15 Oct-15 Nov-15 Dec-15 Jan-16 Feb-16 Mar-16 Apr-16 May-16 Jun-16
Price growth 4.6% 3.6% -1.8% -0.6% -0.7% 3.5% 0.1% 1.0% -2.6% -3.0% 0.1% 1.6% 10.3% -1.4% 0.6% -1.9% 1.9% -3.3% -7.7% 0.6% -2.3% 3.3% -4.3% -4.9% 2.1% 7.2% -2.6% 6.0% -3.2% 7.9%
Flows growth -0.9% 1.1% 2.6% 0.8% -0.9% -0.6% 2.2% 0.5% -2.6% -0.7% 1.5% 0.3% 5.3% 4.2% -2.4% 0.3% 0.0% -1.6% -2.7% 2.6% -0.8% 1.5% 0.0% -0.2% 4.2% 13.5% 3.5% 2.3% 1.4% 4.4%
Avg. growth 1.3% 1.3% 1.3% 1.3% 1.3% 1.3% 1.3% 1.3% 1.3% 1.3% 1.3% 1.3% 1.3% 1.3% 1.3% 1.3% 1.3% 1.3% 1.3% 1.3% 1.3% 1.3% 1.3% 1.3% 1.3% 1.3% 1.3% 1.3% 1.3% 1.3%
Total growth 3.7% 4.7% 0.8% 0.2% -1.5% 3.0% 2.3% 1.6% -5.2% -3.7% 1.6% 2.0% 15.6% 2.8% -1.7% -1.6% 1.8% -4.9% -10.4% 3.2% -3.1% 4.8% -4.3% -5.1% 6.4% 20.7% 0.8% 8.3% -1.8% 12.3%
Source: Deutsche Bank, Bloomberg Finance LP, Reuters.

8 July 2016
European Monthly ETF Market Review
Page 18 Deutsche Bank AG/London
3. Cash Flow Analysis
Regional Cash Flow Analysis
Figure 27: Global ETP cash flows by region and asset class | ETPs | Global |
Asset Class US EU ($) EU (€) Asia Total US EU ($) EU (€) Asia Total US EU ($) EU (€) Asia Total
ETFs
Equity 6,702 2,220 1,996 7,013 15,934 -6,339 -1,413 -1,254 2,543 -5,209 -1,379 -3,268 -2,849 22,679 18,032
Fixed income 8,446 1,507 1,331 -6,512 3,441 4,479 2,974 2,634 4,725 12,178 49,677 18,023 16,077 -427 67,273
Commodity 35 210 189 63 308 182 622 549 -11 793 412 1,872 1,669 751 3,035
Currency 14 0 0 29 44 35 0 0 -13 22 -32 0 0 35 3
Multi Asset 345 4 4 0 349 116 7 7 0 124 -79 5 4 17 -58
Alternative -27 19 18 -33 -41 -19 -39 -34 67 9 -139 -145 -129 179 -105
Total 15,514 3,961 3,538 560 20,035 -1,546 2,151 1,902 7,312 7,916 48,460 16,487 14,773 23,235 88,181
ETCs/ETVs
Commodity 3,923 1,119 1,004 10 5,052 2,992 348 309 1 3,342 15,935 5,832 5,241 -3 21,765
Currency 213 -37 -33 0 176 65 4 3 0 69 -427 1 -1 0 -426
Alternative -27 0 0 0 -27 244 0 0 0 244 1,046 0 0 0 1,046
Total 4,109 1,082 970 10 5,201 3,301 353 312 1 3,655 16,554 5,834 5,241 -3 22,385
ETPs
Equity 6,702 2,220 1,996 7,013 15,934 -6,339 -1,413 -1,254 2,543 -5,209 -1,379 -3,268 -2,849 22,679 18,032
Fixed income 8,446 1,507 1,331 -6,512 3,441 4,479 2,974 2,634 4,725 12,178 49,677 18,023 16,077 -427 67,273
Commodity 3,958 1,329 1,193 73 5,360 3,174 970 858 -10 4,135 16,347 7,704 6,911 748 24,800
Currency 227 -37 -33 29 220 100 4 3 -13 91 -459 1 -1 35 -422
Multi Asset 345 4 4 0 349 116 7 7 0 124 -79 5 4 17 -58
Alternative -54 19 18 -33 -68 225 -39 -34 67 253 907 -145 -129 179 941
Total 19,623 5,043 4,508 570 25,236 1,755 2,504 2,214 7,313 11,571 65,014 22,320 20,013 23,232 110,566
All figures in $ million except where otherwise stated
Jun-16 May-16 YTD
Source: Deutsche Bank, Bloomberg Finance LP, Reuters.
Asset Class Cash Flow Analysis
Figure 28: European Equity ETF cash flow summary (€ million) | ETFs | Europe |
Equity Cash Flows
All figures in € million Net Flows % of AUM Net Flows % of AUM Net Flows % of AUM
Developed Markets 307 0.1% -2,361 -1.1% -9,476 -4.0%
Emerging Markets -179 -0.7% 366 1.5% 2,100 9.4%
Global Markets 65 1.4% -57 -1.2% 45 0.9%
Sector 551 3.0% 303 1.7% -13 -0.1%
Capitalization -214 -3.4% -143 -2.3% -907 -12.7%
Strategy 1,280 7.6% 584 3.7% 4,896 36.9%
Style 89 0.5% -52 -0.3% 204 1.2%
Thematic 97 2.2% 106 2.4% 302 7.8%
Total equities 1,996 0.6% -1,254 -0.4% -2,849 -0.9%
May-16 YTDJun-16
Source: Deutsche Bank, Bloomberg Finance LP, Reuters.

8 July 2016
European Monthly ETF Market Review
Deutsche Bank AG/London Page 19
Figure 28A: European Equity ETF cash flow summary - A (€ Million) | ETFs | Europe |
Equity Cash Flows
All figures in € million Net Flows % of AUM Net Flows % of AUM Net Flows % of AUM
Sector 551 3.0% 303 1.7% -13 -0.1%
Consumer discretionary 6 0.7% 17 2.0% 46 5.1%
Consumer staples -25 -2.9% -8 -1.0% -131 -13.2%
Energy -7 -0.4% 8 0.5% 7 0.4%
Financials 531 5.8% 149 1.7% 48 0.5%
Healthcare 80 4.1% 66 3.6% -26 -1.3%
Industrials 34 6.3% -38 -6.9% 34 6.4%
Information Technology -34 -2.5% 44 3.6% -59 -4.2%
Materials -5 -0.7% 76 10.0% 58 8.7%
Telecommunications -19 -2.4% -12 -1.6% 0 0.0%
Utilities -10 -2.1% 2 0.4% 11 2.4%
Capitalization -214 -3.4% -143 -2.3% -907 -12.7%
Large Cap 1 0.2% 0 0.0% -8 -2.2%
Mid Cap -135 -6.8% -52 -2.6% -499 -21.0%
Small Cap -80 -2.0% -91 -2.3% -399 -9.1%
Strategy 1,280 7.6% 584 3.7% 4,896 36.9%
Fundamental -10 -0.6% -23 -1.5% -17 -1.1%
Leveraged Long 43 2.3% -64 -3.4% -14 -0.6%
Leveraged Short 66 6.4% 66 6.6% 316 39.6%
Options Strategy 0 0.0% 0 0.0% 0 0.0%
Quantitative 1,137 10.6% 609 6.2% 4,222 57.6%
Short 43 2.5% -4 -0.3% 388 27.5%
Style 89 0.5% -52 -0.3% 204 1.2%
Dividend 98 0.6% -130 -0.9% 236 1.6%
Growth -9 -4.5% -5 -2.3% -87 -29.1%
Value 0 0.0% 83 6.7% 56 4.1%
Thematic 97 2.2% 106 2.4% 302 7.8%
Commodities -22 -2.1% -23 -2.0% -25 -3.7%
Faith 0 0.2% 5 2.6% 6 3.0%
Other Theme 5 0.5% 17 1.9% 44 5.0%
Sustainability 114 4.9% 108 5.0% 278 12.9%
Total 1,803 2.9% 798 1.31% 4,483 7.4%
Jun-16 May-16 YTD
Source: Deutsche Bank, Bloomberg Finance LP, Reuters.

8 July 2016
European Monthly ETF Market Review
Page 20 Deutsche Bank AG/London
Figure 28B: European Equity ETF cash flow summary – B (€ million) | ETFs | Europe |
Equity Cash Flows
All figures in € million Net Flows % of AUM Net Flows % of AUM Net Flows % of AUM
Developed Markets
Europe -474 -0.4% -1,963 -1.7% -8,813 -6.6%
Austria -10 -4.1% 8 3.6% -144 -36.3%
Belgium 5 12.1% 0 0.0% 5 10.8%
Finland 0 0.0% 0 0.0% -6 -3.1%
France -74 -1.5% -60 -1.3% -294 -5.8%
Germany 55 0.3% -316 -1.7% -1,488 -6.9%
Greece -7 -4.1% 1 0.3% -22 -11.1%
Ireland 0 0.0% 0 0.0% 0 0.0%
Italy -81 -3.9% -19 -0.9% -521 -17.6%
Netherlands 26 4.5% -31 -5.2% -50 -7.8%
Norway 0 0.0% 0 0.0% 20 9.2%
Portugal 0 0.0% 0 0.0% 0 0.0%
Spain -31 -2.3% -25 -1.8% -289 -17.1%
Sweden -11 -1.0% -34 -2.9% -232 -16.5%
Switzerland 123 1.3% -38 -0.4% -3 0.0%
UK 210 1.5% 8 0.1% 1,541 11.7%
Europe broad -680 -1.1% -1,458 -2.3% -7,330 -9.8%
Americas 768 1.2% 345 0.6% 1,708 2.8%
US 584 1.0% 457 0.8% 1,665 2.8%
Canada 14 1.4% 73 7.7% 140 18.1%
North America 169 0.0% -185 0.0% -97 0.0%
Asia -351 -2.0% -722 -4.1% -3,620 -15.8%
Australia -13 -1.8% -230 -24.9% -111 -14.0%
Hong Kong -2 -1.4% 0 0.1% -87 -33.4%
Japan -397 -2.6% -546 -3.6% -3,586 -17.6%
Singapore 2 5.8% -13 -25.6% -21 -32.8%
Asia Pacific broad 59 3.8% 68 4.6% 185 12.8%
Global 365 1.8% -21 -0.1% 1,245 6.4%
Broad indices 365 1.8% -21 -0.1% 1,245 6.4%
DM Total 307 0.1% -2,361 -1.1% -9,481 -4.0%
Jun-16 May-16 YTD
Source: Deutsche Bank, Bloomberg Finance LP, Reuters.

8 July 2016
European Monthly ETF Market Review
Deutsche Bank AG/London Page 21
Figure 28C: European Equity ETF cash flow summary – C (€ million) | ETFs | Europe |
Equity Cash Flows
All figures in € million Net Flows % of AUM Net Flows % of AUM Net Flows % of AUM
Emerging Markets
BRIC -266 -5.0% -140 -2.5% -598 -10.0%
Brazil -53 -8.9% -21 -3.1% -86 -16.5%
Russia -52 -6.8% -17 -2.1% -60 -8.8%
India -22 -1.3% -18 -1.1% -107 -5.9%
China -140 -6.0% -84 -3.5% -345 -11.7%
Latin America -36 -2.8% -21 -1.4% 87 8.2%
Chile 0 0.0% 0 0.0% 0 0.0%
Mexico -6 -4.1% -16 -9.5% -8 -5.2%
LATAM broad -30 -5.6% -5 -0.8% 95 24.9%
Asia -30 -0.4% 19 0.3% 32 0.4%
Bangladesh 1 2.8% 0 0.5% -1 -5.0%
Indonesia -1 -0.8% -2 -1.9% 2 1.4%
Malaysia -13 -22.0% 0 0.0% -1 -2.2%
Pakistan 2 7.7% 0 0.0% 1 3.2%
Philippines 7 13.7% 2 5.0% 15 38.4%
South Korea -13 -2.0% -16 -2.3% -139 -17.1%
Taiwan 0 -0.1% -29 -6.8% -138 -24.5%
Thailand 0 0.0% 0 0.0% 7 23.7%
Vietnam -3 -0.8% -10 -3.3% -24 -7.2%
Asia Pacific broad -9 -0.5% 74 4.7% 311 22.3%
EMEA -27 -3.0% -47 -4.7% -31 -3.6%
Kuwait 0 0.0% 0 0.0% -2 -23.9%
Poland 1 2.7% -4 -7.4% -12 -18.3%
South Africa 13 18.6% -1 -1.7% 16 23.3%
Turkey -10 -4.1% -20 -6.7% -68 -24.0%
Europe broad -42 -11.3% -29 -7.0% 11 3.5%
Middle East & Africa 11 7.3% 8 5.3% 23 17.3%
Global Markets 181 1.3% 555 4.1% 2,611 22.5%
Global 181 1.3% 555 4.1% 2,611 22.5%
EM Total -179 -0.7% 366 1.5% 2,100 9.4%
Total (EM + DM) 128 0.1% -1,995 -0.8% -7,381 -2.9%
Jun-16 May-16 YTD
Source: Deutsche Bank, Bloomberg Finance LP, Reuters.

8 July 2016
European Monthly ETF Market Review
Page 22 Deutsche Bank AG/London
Figure 29: European Fixed Income ETF cash flows (€ million) | ETFs | Europe |
Fixed Income Cash
Flows
All figures in € million Net Flows % of AUM Net Flows % of AUM Net Flows % of AUM
Overall 69 0.8% 408 4.8% 1,104 13.8%
Corporates 1,082 2.0% 1,305 2.5% 10,066 23.2%
Covered Bonds 1 0.0% -36 -1.0% 266 8.7%
Credit Exposure 122 37.1% 43 15.1% 171 60.9%
Sovereign 40 0.1% 742 1.3% 4,658 8.5%
Money Market 16 0.6% 171 6.8% -188 -6.4%
Total Fixed Income 1,331 1.0% 2,634 2.1% 16,077 14.3%
Jun-16 May-16 YTD
Source: Deutsche Bank, Bloomberg Finance LP, Reuters.
8 July 2016
European Monthly ETF Market Review
Deutsche Bank AG/London Page 23
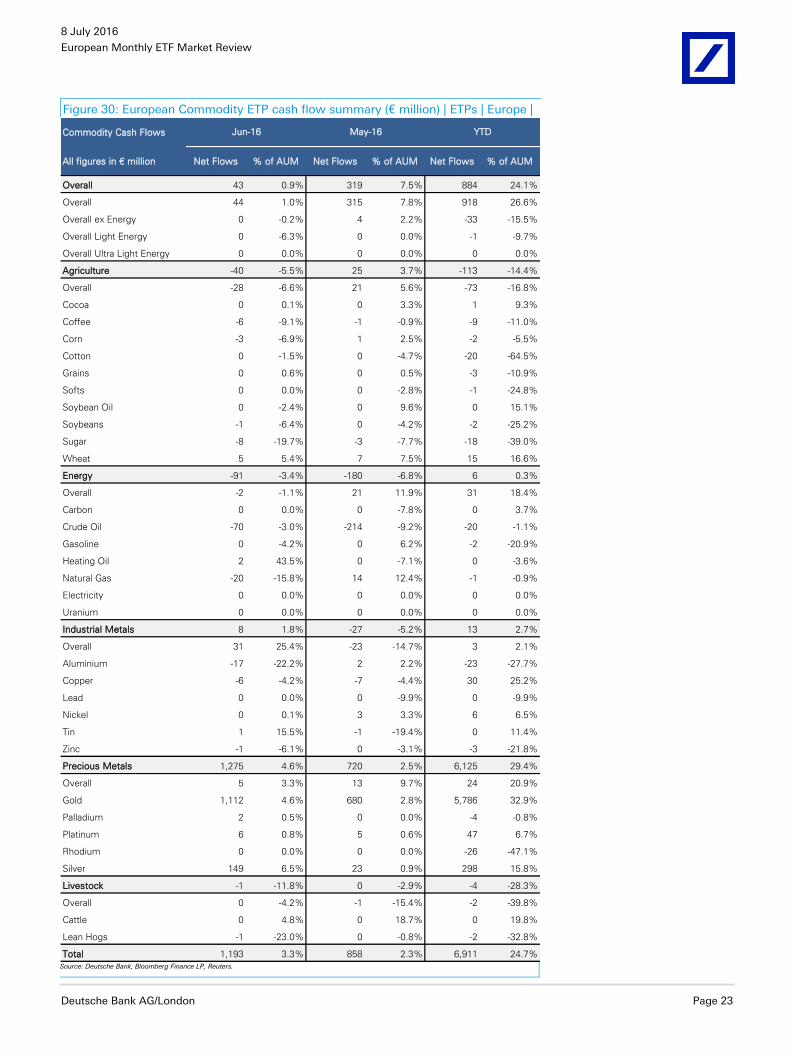
Figure 30: European Commodity ETP cash flow summary (€ million) | ETPs | Europe |
Commodity Cash Flows
All figures in € million Net Flows % of AUM Net Flows % of AUM Net Flows % of AUM
Overall 43 0.9% 319 7.5% 884 24.1%
Overall 44 1.0% 315 7.8% 918 26.6%
Overall ex Energy 0 -0.2% 4 2.2% -33 -15.5%
Overall Light Energy 0 -6.3% 0 0.0% -1 -9.7%
Overall Ultra Light Energy 0 0.0% 0 0.0% 0 0.0%
Agriculture -40 -5.5% 25 3.7% -113 -14.4%
Overall -28 -6.6% 21 5.6% -73 -16.8%
Cocoa 0 0.1% 0 3.3% 1 9.3%
Coffee -6 -9.1% -1 -0.9% -9 -11.0%
Corn -3 -6.9% 1 2.5% -2 -5.5%
Cotton 0 -1.5% 0 -4.7% -20 -64.5%
Grains 0 0.6% 0 0.5% -3 -10.9%
Softs 0 0.0% 0 -2.8% -1 -24.8%
Soybean Oil 0 -2.4% 0 9.6% 0 15.1%
Soybeans -1 -6.4% 0 -4.2% -2 -25.2%
Sugar -8 -19.7% -3 -7.7% -18 -39.0%
Wheat 5 5.4% 7 7.5% 15 16.6%
Energy -91 -3.4% -180 -6.8% 6 0.3%
Overall -2 -1.1% 21 11.9% 31 18.4%
Carbon 0 0.0% 0 -7.8% 0 3.7%
Crude Oil -70 -3.0% -214 -9.2% -20 -1.1%
Gasoline 0 -4.2% 0 6.2% -2 -20.9%
Heating Oil 2 43.5% 0 -7.1% 0 -3.6%
Natural Gas -20 -15.8% 14 12.4% -1 -0.9%
Electricity 0 0.0% 0 0.0% 0 0.0%
Uranium 0 0.0% 0 0.0% 0 0.0%
Industrial Metals 8 1.8% -27 -5.2% 13 2.7%
Overall 31 25.4% -23 -14.7% 3 2.1%
Aluminium -17 -22.2% 2 2.2% -23 -27.7%
Copper -6 -4.2% -7 -4.4% 30 25.2%
Lead 0 0.0% 0 -9.9% 0 -9.9%
Nickel 0 0.1% 3 3.3% 6 6.5%
Tin 1 15.5% -1 -19.4% 0 11.4%
Zinc -1 -6.1% 0 -3.1% -3 -21.8%
Precious Metals 1,275 4.6% 720 2.5% 6,125 29.4%
Overall 5 3.3% 13 9.7% 24 20.9%
Gold 1,112 4.6% 680 2.8% 5,786 32.9%
Palladium 2 0.5% 0 0.0% -4 -0.8%
Platinum 6 0.8% 5 0.6% 47 6.7%
Rhodium 0 0.0% 0 0.0% -26 -47.1%
Silver 149 6.5% 23 0.9% 298 15.8%
Livestock -1 -11.8% 0 -2.9% -4 -28.3%
Overall 0 -4.2% -1 -15.4% -2 -39.8%
Cattle 0 4.8% 0 18.7% 0 19.8%
Lean Hogs -1 -23.0% 0 -0.8% -2 -32.8%
Total 1,193 3.3% 858 2.3% 6,911 24.7%
Jun-16 May-16 YTD
Source: Deutsche Bank, Bloomberg Finance LP, Reuters.

8 July 2016
European Monthly ETF Market Review
Page 24 Deutsche Bank AG/London
Product Rankings
Figure 31: Top 10 monthly Equity ETF inflows (€ million) | ETFs | Europe |
ETF Name BBG Ticker Issuer Invest.
Strategy
Current
Month Flows
Prev. Month
Flows
YTD
Flows
iShares Core S&P 500 UCITS ETF CSSPX SW BlackRock Beta 460.5 -29.7 1,412.0
Vanguard S&P 500 ETF VUSA LN Vanguard Beta 452.2 183.7 486.3
Lyxor UCITS ETF STOXX Europe 600 Banks BNK FP Lyxor Beta 259.1 -61.3 59.1
ComStage ETF MSCI USA TRN CBNDDUUS GR ComStage Beta 198.3 0.0 198.3
Amundi ETF MSCI Europe Minimum Volatility UCITS ETF MIVO FP Amundi Beta 193.0 98.4 287.6
iShares MSCI Emerging Markets IMI UCITS ETF EMIM NA BlackRock Beta 169.8 43.2 980.2
iShares MSCI North America UCITS ETF INAA LN BlackRock Beta 169.3 -184.7 -94.7
MS Scientific Beta Global Equity Factors UCITS ETF GEF LN Fundlogic Global Solutions plc Semi Active 133.2 0.0 133.7
iShares Euro STOXX 50 (DE) SX5EEX GR BlackRock Beta 108.1 -97.2 -1,275.1
STOXX Europe 600 THEAM Easy UCITS ETF ETZ FP BNP Paribas Beta 102.9 7.8 128.8 Source: Deutsche Bank, Bloomberg Finance LP, Reuters.
Figure 32: Top 10 monthly Fixed Income ETF inflows (€ million) | ETFs | Europe |
ETF Name BBG Ticker Issuer Invest.
Strategy
Current
Month Flows
Prev. Month
Flows
YTD
Flows
iShares Euro Corporate Bond 1-5yr UCITS ETF SE15 LN BlackRock Beta 302.8 -77.8 491.2
iShares Euro Corporate Bond Large Cap UCITS ETF IBCS GR BlackRock Beta 243.9 283.7 1,409.9
iShares J.P. Morgan $ Emerging Markets Bond UCITS ETF SEMB LN BlackRock Beta 243.5 198.2 825.5
iShares $ TIPS UCITS ETF IDTP LN BlackRock Beta 214.4 30.6 754.7
iShares iBonds Sep 2018 USD Corporate UCITS ETF EI18 LN BlackRock Beta 208.8 5.4 294.8
Lyxor UCITS ETF EuroMTS 3-5Y IG (DR) MTB FP Lyxor Beta 190.4 71.9 353.1
Lyxor UCITS ETF EuroMTS 5-7Y IG (DR) MTC FP Lyxor Beta 189.7 19.3 193.1
iShares $ Short Duration Corporate Bond UCITS ETF SDIG LN BlackRock Beta 163.1 134.8 433.7
iShares $ Treasury Bond 1-3yr UCITS ETF IBTS LN BlackRock Beta 142.6 -73.5 694.6
iShares US Aggregate Bond UCITS ETF SUAG LN BlackRock Beta 114.4 207.3 474.0 Source: Deutsche Bank, Bloomberg Finance LP, Reuters.
Figure 33: Top 10 monthly Commodity ETP inflows (€ million) | ETPs | Europe |
ETP Name BBG Ticker Issuer Invest.
Strategy
Current
Month Flows
Prev. Month
Flows
YTD
Flows
iShares Physical Gold ETC SGLN LN Blackrock Beta 430.3 149.4 1,070.5
Source Physical Gold ETC (P-ETC) SGLD LN Source Beta 277.6 5.3 1,298.0
ETFS Physical Gold PHAU LN ETF Securities Beta 209.1 31.1 865.1
ZKB Gold ETF ZGLD SW Zuercher Kantonalbank Beta 95.0 55.8 351.4
ETFS Physical Silver PHAG LN ETF Securities Beta 57.7 -2.2 126.1
db Physical Gold ETC (EUR) XAD5 GR Deutsche AWM Beta 56.0 48.8 85.6
Julius Baer Physical Gold Fund - A (USD listing) JBGOUA SW Julius Baer Inv Beta 44.1 17.1 107.7
UBS ETFs plc – CMCI Composite SF UCITS ETF (USD) A-acc CCUSAS SW UBS Beta 40.5 10.6 118.5
ETFS EUR Daily Hedged Industrial Metals EIMT IM ETF Securities Beta 32.3 -20.1 49.6
ComStage ETF Commerzbank Commodity EW Index TR CBCOMM GR ComStage Beta 32.1 25.4 57.4 Source: Deutsche Bank, Bloomberg Finance LP, Reuters.
8 July 2016
European Monthly ETF Market Review
Deutsche Bank AG/London Page 25
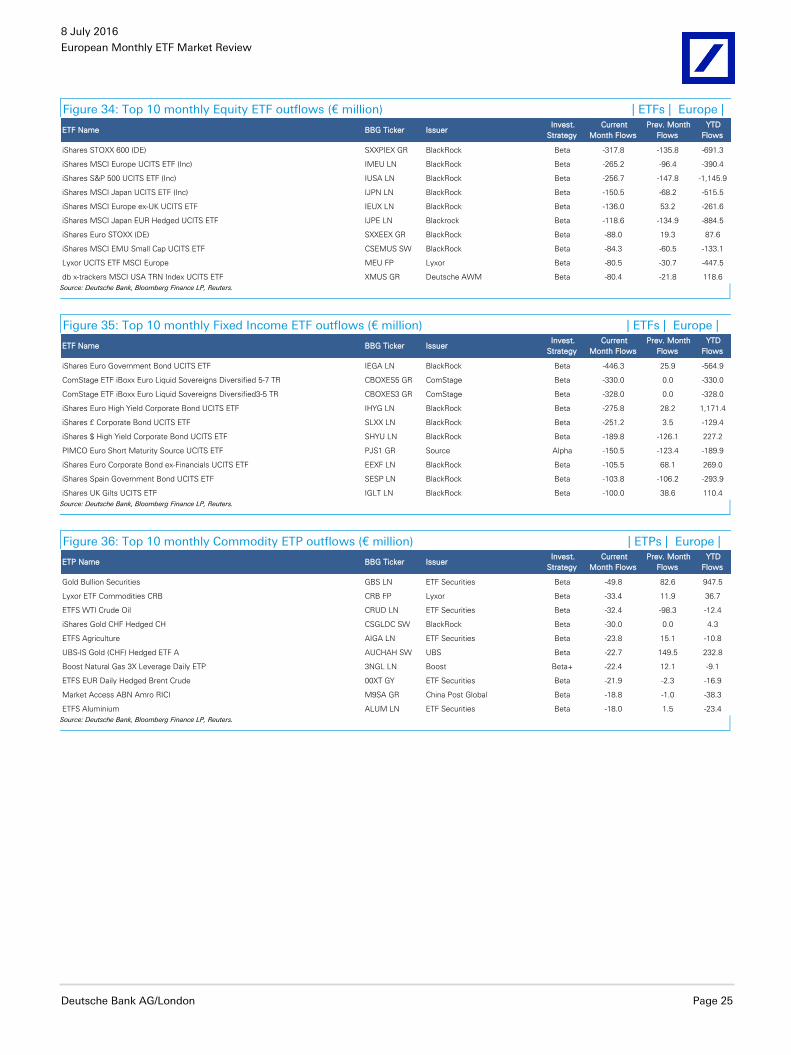
Figure 34: Top 10 monthly Equity ETF outflows (€ million) | ETFs | Europe |
ETF Name BBG Ticker Issuer Invest.
Strategy
Current
Month Flows
Prev. Month
Flows
YTD
Flows
iShares STOXX 600 (DE) SXXPIEX GR BlackRock Beta -317.8 -135.8 -691.3
iShares MSCI Europe UCITS ETF (Inc) IMEU LN BlackRock Beta -265.2 -96.4 -390.4
iShares S&P 500 UCITS ETF (Inc) IUSA LN BlackRock Beta -256.7 -147.8 -1,145.9
iShares MSCI Japan UCITS ETF (Inc) IJPN LN BlackRock Beta -150.5 -68.2 -515.5
iShares MSCI Europe ex-UK UCITS ETF IEUX LN BlackRock Beta -136.0 53.2 -261.6
iShares MSCI Japan EUR Hedged UCITS ETF IJPE LN Blackrock Beta -118.6 -134.9 -884.5
iShares Euro STOXX (DE) SXXEEX GR BlackRock Beta -88.0 19.3 87.6
iShares MSCI EMU Small Cap UCITS ETF CSEMUS SW BlackRock Beta -84.3 -60.5 -133.1
Lyxor UCITS ETF MSCI Europe MEU FP Lyxor Beta -80.5 -30.7 -447.5
db x-trackers MSCI USA TRN Index UCITS ETF XMUS GR Deutsche AWM Beta -80.4 -21.8 118.6 Source: Deutsche Bank, Bloomberg Finance LP, Reuters.
Figure 35: Top 10 monthly Fixed Income ETF outflows (€ million) | ETFs | Europe |
ETF Name BBG Ticker Issuer Invest.
Strategy
Current
Month Flows
Prev. Month
Flows
YTD
Flows
iShares Euro Government Bond UCITS ETF IEGA LN BlackRock Beta -446.3 25.9 -564.9
ComStage ETF iBoxx Euro Liquid Sovereigns Diversified 5-7 TR CBOXES5 GR ComStage Beta -330.0 0.0 -330.0
ComStage ETF iBoxx Euro Liquid Sovereigns Diversified3-5 TR CBOXES3 GR ComStage Beta -328.0 0.0 -328.0
iShares Euro High Yield Corporate Bond UCITS ETF IHYG LN BlackRock Beta -275.8 28.2 1,171.4
iShares £ Corporate Bond UCITS ETF SLXX LN BlackRock Beta -251.2 3.5 -129.4
iShares $ High Yield Corporate Bond UCITS ETF SHYU LN BlackRock Beta -189.8 -126.1 227.2
PIMCO Euro Short Maturity Source UCITS ETF PJS1 GR Source Alpha -150.5 -123.4 -189.9
iShares Euro Corporate Bond ex-Financials UCITS ETF EEXF LN BlackRock Beta -105.5 68.1 269.0
iShares Spain Government Bond UCITS ETF SESP LN BlackRock Beta -103.8 -106.2 -293.9
iShares UK Gilts UCITS ETF IGLT LN BlackRock Beta -100.0 38.6 110.4 Source: Deutsche Bank, Bloomberg Finance LP, Reuters.
Figure 36: Top 10 monthly Commodity ETP outflows (€ million) | ETPs | Europe |
ETP Name BBG Ticker Issuer Invest.
Strategy
Current
Month Flows
Prev. Month
Flows
YTD
Flows
Gold Bullion Securities GBS LN ETF Securities Beta -49.8 82.6 947.5
Lyxor ETF Commodities CRB CRB FP Lyxor Beta -33.4 11.9 36.7
ETFS WTI Crude Oil CRUD LN ETF Securities Beta -32.4 -98.3 -12.4
iShares Gold CHF Hedged CH CSGLDC SW BlackRock Beta -30.0 0.0 4.3
ETFS Agriculture AIGA LN ETF Securities Beta -23.8 15.1 -10.8
UBS-IS Gold (CHF) Hedged ETF A AUCHAH SW UBS Beta -22.7 149.5 232.8
Boost Natural Gas 3X Leverage Daily ETP 3NGL LN Boost Beta+ -22.4 12.1 -9.1
ETFS EUR Daily Hedged Brent Crude 00XT GY ETF Securities Beta -21.9 -2.3 -16.9
Market Access ABN Amro RICI M9SA GR China Post Global Beta -18.8 -1.0 -38.3
ETFS Aluminium ALUM LN ETF Securities Beta -18.0 1.5 -23.4 Source: Deutsche Bank, Bloomberg Finance LP, Reuters.

8 July 2016
European Monthly ETF Market Review
Page 26 Deutsche Bank AG/London
4. Product Review
New Products Launched in the Month
Figure 37: Number of ETPs by Asset Class | ETPs | Global |
Jun-16 May-16 End of 2015
Asset Class Nu.Mkt
Share %Nu. Nu. % Nu. Nu. %
ETFs
Equity 3,069 67.1% 3,032 37 66.9% 2,950 119 66.6%
Fixed income 759 16.6% 750 9 16.5% 718 41 16.2%
Commodity 112 2.4% 113 (1) 2.5% 110 2 2.5%
Currency 16 0.3% 16 - 0.4% 16 - 0.4%
Multi Asset 47 1.0% 47 - 1.0% 42 5 0.9%
Alternative 50 1.1% 50 - 1.1% 53 (3) 1.2%
Total 4,053 88.6% 4,008 45 88.4% 3,889 164 87.8%
ETC/Vs
Equity - 0.0% 0 - 0.0% 0 - 0.0%
Commodity 396 8.7% 396 - 8.7% 410 (14) 9.3%
Currency 124 2.7% 124 - 2.7% 124 - 2.8%
Alternative 4 0.1% 4 - 0.1% 4 - 0.1%
Total 524 11.4% 524 - 11.6% 538 (14) 12.2%
Total ETPs 4,577 100.0% 4,532 45 100.0% 4,427 150 100.0%
MoM Change YTD Change
Source: Deutsche Bank, Bloomberg Finance LP, Reuters.
Figure 38: Number of ETPs by Asset Class | ETPs | Europe |
Jun-16 May-16 End of 2015
Asset Class Nu.Mkt
Share %Nu. Nu. % Nu. Nu. %
ETFs
Equity 1,093 55.0% 1,092 1 0.1% 1,087 6 0.3%
Fixed income 381 19.2% 379 2 0.1% 358 23 1.2%
Commodity 48 2.4% 52 (4) -0.2% 50 (2) -0.1%
Currency - 0.0% 0 - 0.0% 0 - 0.0%
Multi Asset 9 0.5% 9 - 0.0% 8 1 0.1%
Alternative 8 0.4% 8 - 0.0% 14 (6) -0.3%
Total 1,539 77.4% 1,540 (1) -0.1% 1,517 22 1.1%
ETCs
Commodity 343 17.2% 343 - 0.0% 348 (5) -0.3%
Currency 107 5.4% 107 - 0.0% 107 - 0.0%
Total 450 22.6% 450 - 0.0% 455 (5) -0.3%
Total ETPs 1,989 100.0% 1,990 (1) -0.1% 1,972 17 0.9%
MoM Change YTD Change
Source: Deutsche Bank, Bloomberg Finance LP, Reuters.

Eu
rop
ean
Mon
thly
ETF M
ark
et R
evie
w
8 J
uly
201
6
Deu
tsch
e B
an
k A
G/L
on
do
n
Pag
e 2
7
Figure 39: New ETF launches | ETFs | Europe | Launch/
cross listing
date
BBG
Ticker
Reuters
CodeIssuer ETF Name Asset class
Invest.
StrategyFocus
Market
flagBenchmark
Long
/Short/
Leverage
TER Exchange Listed
New Launches
08-Jun-16 TURK LN TURK.L Sun Global Investments LAM Alternatif ZyFin Turkey Sovereign Bond UCITS ETF Fixed Income Beta Overall EM ZyFin Turkey Sovereign Bond Laddered Index 1L 0.89% London SE
08-Jun-16 GGRG LN GGRG.L WisdomTree WisdomTree Global Quality Dividend Growth UCITS ETF Equity Beta Dividend DM WisdomTree Global Developed Quality Dividend Growth Index 1L 0.38% London SE
08-Jun-16 DGRG LN DGRG.L WisdomTree WisdomTree US Quality Dividend Growth UCITS ETF Equity Beta Dividend DM WisdomTree US Developed Quality Dividend Growth Index 1L 0.33% London SE
13-Jun-16 EMHD FP EMHD.PA PowerShares PowerShares FTSE Emerging Markets High Dividend Low Volatility UCITS ETF Equity Beta Quantitative EM FTSE Emerging High Dividend Low Volatility Net TR Index 1L 0.49% Euronext Paris
13-Jun-16 EVAE FP EVAE.PA BNP Paribas BNP PARIBAS EASY Equity Value Europe UCITS ETF Equity Beta Quantitative DM BNP Paribas Equity Value Europe Index 1L 0.42% Euronext Paris
13-Jun-16 EVOE FP EVOE.PA BNP Paribas BNP PARIBAS EASY Equity Low Vol Europe UCITS ETF Equity Beta Quantitative DM BNP Paribas Equity Low Vol Europe Index 1L 0.42% Euronext Paris
13-Jun-16 EVOU FP EVOU.PA BNP Paribas BNP PARIBAS EASY Equity Low Vol US UCITS ETF Equity Beta Quantitative DM BNP Paribas Equity Low Vol US Index 1L 0.42% Euronext Paris
14-Jun-16 EMOM FP EMOM.PA BNP Paribas BNP PARIBAS EASY Equity Momentum Europe UCITS ETF Equity Beta Quantitative DM BNP Paribas Equity Momentum Europe Index 1L 0.42% Euronext Paris
14-Jun-16 EQUA FP EQUA.PA BNP Paribas BNP PARIBAS EASY Equity Quality Europe UCITS ETF Equity Beta Quantitative DM BNP Paribas Equity Quality Europe Index 1L 0.42% Euronext Paris
15-Jun-16 XDEP GY XDEP.DE Deutsche AWM db x-trackers iBoxx EUR Corporates Yield Plus UCITS ETF DR Fixed Income Beta Overall DM Markit iBoxx EUR Corporate Yield Plus Index 1L 0.25% Deutsche Borse
23-Jun-16 QDVQ GY QDVQ.DE BlackRock iShares Fallen Angels High Yield Corporate Bond UCITS ETF Fixed Income Beta Overall DM Barclays Global Corporate ex EM Fallen Angels 3% Issuer Capped Index 1L 0.50% Deutsche Borse
23-Jun-16 RMB1 IM RMB1.MI Fullgoal Fund Management Co Fullgoal FTSE China Onshore Sovereign and Policy Bank Bond 1-10 Year Index ETF-C Fixed Income Beta Overall EM FTSE China Onshore Sovereign & Policy Bank Bond 1-10 Year index 1L 0.55% Borsa Italiana Source: Deutsche Bank, Bloomberg Finance LP, Reuters.

8 July 2016
European Monthly ETF Market Review
Page 28 Deutsche Bank AG/London
Average TERs
Figure 40: ETF TERs using simple average | ETFs | Europe |
Asset class Strategy TER Nu. TER Nu. TER Nu.
Equity Alpha 0.40% 6 1.48% 3 0.76% 9
Beta 0.38% 561 0.41% 420 0.40% 981
Beta+ 0.60% 1 0.56% 73 0.56% 74
Semi Active 0.47% 13 0.55% 16 0.52% 29
0.39% 581 0.44% 512 0.41% 1,093
Fixed Income Alpha 0.59% 8 0.41% 2 0.54% 10
Beta 0.25% 215 0.20% 134 0.23% 349
Beta+ NA NA 0.24% 22 0.24% 22
0.26% 223 0.21% 158 0.24% 381
Alternative Alpha NA NA 0.71% 3 0.71% 3
Beta 0.75% 2 0.70% 2 0.73% 4
Beta+ NA NA NA NA NA NA
Semi Active NA NA 0.70% 1 0.70% 1
0.0075 2 0.71% 6 0.71% 8
Commodity Beta 0.48% 22 0.51% 25 0.49% 47
Beta+ NA NA NA NA NA NA
Semi Active NA NA 0.45% 1 0.45% 1
0.48% 22 0.50% 26 0.49% 48
Currency Beta NA NA NA NA NA NA
NA NA NA NA NA NA
Multi Asset Beta NA 1 NA 1 NA 2
Alpha 0.52% 5 0.64% 2 0.57% 7
0.52% 6 0.64% 3 0.57% 9
Total 0.36% 834 0.40% 705 0.38% 1,539
Physical Synthetic Total
Source: Deutsche Bank, Bloomberg Finance LP, Reuters.

8 July 2016
European Monthly ETF Market Review
Deutsche Bank AG/London Page 29
Figure 41: ETC TERs using simple average | ETCs | Europe |
Asset Class Segment Strategy TER Nu. TER Nu. TER Nu.
Commodity Agriculture Beta NA NA 0.49% 37 0.48% 37
Beta+ NA NA 0.92% 35 0.92% 35
Energy Beta NA NA 0.47% 49 0.45% 49
Beta+ NA NA 0.80% 53 0.73% 53
Industrial Metals Beta NA NA 0.49% 23 0.47% 23
Beta+ NA NA 0.90% 27 0.90% 27
Livestock Beta NA NA 0.49% 6 0.49% 6
Beta+ NA NA 0.98% 6 0.98% 6
Overall Beta NA NA 0.49% 9 0.44% 9
Beta+ NA NA 0.98% 4 0.98% 4
Precious Metals Beta 0.45% 31 0.44% 20 0.43% 51
Beta+ NA NA 0.76% 43 0.76% 43
Commodity 0.45% 31 0.67% 312 0.63% 343
Currency Currency Beta NA NA 0.41% 40 0.41% 40
Beta+ NA NA 0.82% 67 0.82% 67
Currency NA NA 0.67% 107 0.67% 107
Physical Synthetic Total
Source: Deutsche Bank, Bloomberg Finance LP, Reuters.

8 July 2016
European Monthly ETF Market Review
Page 30 Deutsche Bank AG/London
Figure 42: ETF TERs using AUM weighted average | ETFs | Europe |
Asset class Strategy TER Nu. TER Nu. TER Nu.
Equity Alpha 0.56% 6 0.95% 3 0.59% 9
Beta 0.30% 561 0.34% 420 0.31% 981
Beta+ 0.60% 1 0.49% 73 0.49% 74
Semi Active 0.53% 13 0.53% 16 0.53% 29
0.30% 581 0.35% 512 0.32% 1,093
Fixed Income Alpha 0.37% 8 0.39% 2 0.37% 10
Beta 0.26% 215 0.19% 134 0.25% 349
Beta+ NA NA 0.23% 22 0.23% 22
0.27% 223 0.20% 158 0.25% 381
Alternative Alpha NA NA 0.87% 3 0.87% 3
Beta 0.75% 2 0.70% 2 0.73% 4
Beta+ NA NA NA NA NA NA
Semi Active NA NA 0.70% 1 0.70% 1
0.75% 2 0.80% 6 0.78% 8
Commodity Beta 0.41% 22 0.45% 25 0.42% 47
Beta+ NA NA NA NA NA NA
Semi Active NA NA 0.45% 1 0.45% 1
0.41% 22 0.45% 26 0.42% 48
Currency Beta NA NA NA NA NA NA
NA NA NA - NA -
Multi Asset Beta 0.40% 1 0.25% 1 0.37% 2
Alpha 0.57% 5 0.70% 2 0.69% 7
0.57% 6 0.70% 3 0.69% 7
Total 0.30% 834 0.32% 705 0.30% 1,539
Synthetic TotalPhysical
Source: Deutsche Bank, Bloomberg Finance LP, Reuters.
Figure 43: ETC TERs using AUM weighted average | ETCs | Europe |
Asset Class Segment Strategy TER Nu. TER Nu. TER Nu.
Commodity Agriculture Beta NA NA 0.49% 37 0.49% 37
Beta+ NA NA 0.98% 35 0.98% 35
Energy Beta NA NA 0.48% 49 0.48% 49
Beta+ NA NA 0.95% 53 0.95% 53
Industrial Metals Beta NA NA 0.49% 23 0.49% 23
Beta+ NA NA 0.97% 27 0.97% 27
Livestock Beta NA NA 0.49% 6 0.49% 6
Beta+ NA NA 0.98% 6 0.98% 6
Overall Beta NA NA 0.49% 9 0.49% 9
Beta+ NA NA 0.98% 4 0.98% 4
Precious Metals Beta 0.37% 31 0.37% 20 0.37% 51
Beta+ NA NA 0.96% 43 0.96% 43
Commodity 0.37% 31 0.51% 312 0.41% 343
Currency Currency Beta NA NA 0.39% 40 0.39% 40
Beta+ NA NA 0.87% 67 0.87% 67
Currency NA NA 0.74% 107 0.74% 107
TotalPhysical Synthetic
Source: Deutsche Bank, Bloomberg Finance LP, Reuters.

8 July 2016
European Monthly ETF Market Review
Deutsche Bank AG/London Page 31
5. Provider Rankings
Global Provider Rankings
Figure 44: Global Top 10 ETF Providers ($ million) | ETFs | Global |
Rank Issuer Current AUM Mkt. Share 2015 AUM 2015 Mkt. Share Nu.
Current
Month CF
Current Month
TO YTD CF
1 BlackRock 1,110,526 37.5% 1,060,878 37.4% 659 12,311 559,969 35,557
2 Vanguard 563,102 19.0% 504,808 17.8% 111 11,501 102,247 41,337
3 State Street 425,719 14.4% 421,286 14.8% 281 -6,341 782,091 -8,960
4 PowerShares 92,370 3.1% 94,984 3.3% 147 -161 73,619 -2,416
5 Deutsche AWM 75,706 2.6% 81,274 2.9% 256 -592 14,286 -3,078
6 Nomura Asset Management 67,999 2.3% 63,783 2.2% 50 2,088 47,130 6,981
7 Lyxor 50,868 1.7% 51,862 1.8% 219 653 16,386 298
8 Charles Schwab 47,946 1.6% 39,712 1.4% 21 1,806 7,021 6,797
9 WisdomTree 38,120 1.3% 52,160 1.8% 122 -2,387 18,018 -10,207
10 First Trust 37,509 1.3% 42,877 1.5% 112 -258 7,930 -4,591
Total Top 10 2,509,863 84.7% 2,413,624 85.1% 1,978 18,621 1,628,695 61,718
Others 454,742 15.3% 423,643 14.9% 2,075 1,415 363,469 26,474
Global Total 2,964,605 100.0% 2,837,267 100.0% 4,053 20,035 1,992,165 88,181 Blackrock’s acquisition of Credit Suisse’s ETF business completed on 1-Jul-2013. We have added historical AUM of Credit Suisse ETFs to Blackrock ETFs.
Source: Deutsche Bank, Bloomberg Finance LP, Reuters.
Figure 45: Global Top 10 ETC/V Providers ($ million) | ETCs/Vs | Global |
Rank Issuer Current AUM Mkt. Share 2015 AUM
2015 Mkt.
Share Nu.
Current
Month CF
Current Month
TO YTD CF
1 State Street 40,330 39.3% 21,931 33.2% 1 3,381 37,907 12,281
2 ETF Securities 18,574 18.1% 13,113 19.9% 332 172 5,797 2,574
3 BlackRock 17,729 17.3% 10,702 16.2% 8 926 7,658 3,864
4 PowerShares 5,645 5.5% 4,792 7.3% 11 168 2,741 408
5 United States Commodity Funds 5,011 4.9% 4,416 6.7% 11 -2 7,788 28
6 ProShares 3,959 3.9% 3,498 5.3% 19 -66 36,680 1,082
7 Source 3,836 3.7% 1,798 2.7% 4 318 1,363 1,478
8 Deutsche AWM 3,083 3.0% 1,799 2.7% 18 102 481 808
9 Deutsche Borse Commodities GmbH 2,133 2.1% 1,715 2.6% 1 0 299 0
10 Guggenheim Investments 1,224 1.2% 1,192 1.8% 9 180 2,741 -24
Total Top 10 101,524 99.0% 64,957 98.5% 414 5,177 103,455 22,499
Others 1,020 1.0% 1,002 1.5% 109 23 1,620 -114
Global Total 102,544 100.0% 65,960 100.0% 523 5,201 105,075 22,385
Source: Deutsche Bank, Bloomberg Finance LP, Reuters.

8 July 2016
European Monthly ETF Market Review
Page 32 Deutsche Bank AG/London
Figure 46: Global Top 10 ETP Providers ($ million) | ETPs | Global |
Rank Issuer Current AUM Mkt. Share 2015 AUM
2015 Mkt.
Share Nu.
Current
Month CF
Current Month
TO YTD CF
1 BlackRock 1,128,255 36.8% 1,071,580 36.9% 667 13,237 567,626 39,421
2 Vanguard 563,102 18.4% 504,808 17.4% 111 11,501 102,247 41,337
3 State Street 466,049 15.2% 443,216 15.3% 282 -2,961 819,998 3,321
4 PowerShares 98,014 3.2% 99,777 3.4% 158 7 76,360 -2,008
5 Deutsche AWM 78,789 2.6% 83,073 2.9% 274 -490 14,767 -2,270
6 Nomura Asset Management 67,999 2.2% 63,783 2.2% 50 2,088 47,130 6,981
7 Lyxor 50,868 1.7% 51,862 1.8% 219 653 16,386 298
8 Charles Schwab 47,946 1.6% 39,712 1.4% 21 1,806 7,021 6,797
9 WisdomTree 38,348 1.3% 52,385 1.8% 124 -2,394 18,048 -10,226
10 First Trust 37,509 1.2% 42,877 1.5% 112 -258 7,930 -4,591
Total Top 10 2,576,878 84.0% 2,453,074 84.5% 2,018 23,190 1,677,513 79,061
Others 490,271 16.0% 450,153 15.5% 2,558 2,046 419,727 31,516
Global Total 3,067,149 100.0% 2,903,227 100.0% 4,576 25,236 2,097,240 110,577
Blackrock’s acquisition of Credit Suisse’s ETF business completed on 1-Jul-2013. We have added historical AUM of Credit Suisse ETFs to Blackrock ETFs.
Source: Deutsche Bank, Bloomberg Finance LP, Reuters.

8 July 2016
European Monthly ETF Market Review
Deutsche Bank AG/London Page 33
European Provider Rankings – General
Figure 47: European ETF Providers (All) – Assets, Flows, Products, Turnover | ETFs | Europe | All figures in € million except
products
Issuer Current
Month
End of
2015 Diff.
Current
Month
Prev.
Month YTD
Current
Month
Prev.
Month Diff.
Current
Month
End of
2015 Diff.
BlackRock 218,952 214,014 2% 1,503 1,096 10,428 40,429 23,147 75% 277 271 2%
Deutsche AWM 53,925 56,512 -5% -113 233 -746 7,516 4,988 51% 219 216 1%
Lyxor 45,788 47,742 -4% 583 70 281 14,613 12,714 15% 219 244 -10%
UBS 24,727 24,949 -1% 177 28 485 2,850 1,974 44% 129 130 -1%
Amundi 19,789 19,739 0% 202 -109 643 4,320 3,112 39% 102 100 2%
Vanguard 18,400 17,691 4% 634 129 1,033 3,270 1,582 107% 21 17 24%
Source 15,038 16,286 -8% -237 -182 -747 1,861 1,459 28% 78 77 1%
State Street 13,620 11,863 15% 214 509 1,598 2,204 1,235 79% 99 78 27%
ComStage 7,036 6,925 2% -317 28 219 837 483 73% 112 111 1%
Zuercher Kantonalbank 6,994 5,400 30% 108 63 349 484 292 66% 4 4 0%
Deka Investment GmbH 6,958 7,027 -1% 45 -144 322 1,307 842 55% 42 46 -9%
HSBC 4,747 4,978 -5% -23 -5 -171 674 402 68% 27 28 -4%
BNP Paribas 4,168 4,466 -7% 108 40 13 294 191 54% 33 29 14%
Xact Fonder AB 2,484 2,522 -2% -17 -26 127 1,410 969 46% 13 10 30%
Julius Baer Inv 2,121 1,640 29% 50 20 116 134 71 88% 4 4 0%
Ossiam 1,890 1,707 11% 100 -39 61 76 57 34% 10 9 11%
ThinkCapital ETFs N.V. 1,754 1,623 8% 179 179 151 134 76 77% 14 13 8%
PowerShares 1,754 1,766 -1% 48 -3 63 294 279 6% 19 21 -10%
ETF Securities 1,275 790 61% 55 153 447 945 962 -2% 28 30 -7%
WisdomTree 387 477 -19% 12 -97 -39 74 32 132% 25 19 32%
Fundlogic Global Solutions plc 386 169 129% 210 0 213 154 0 40522% 2 2 0%
China Post Global 329 331 -1% -32 -24 -94 41 13 207% 10 10 0%
BBVA Gestion SA SGIIC 323 483 -33% 5 -14 -103 61 20 208% 2 2 0%
Raiffeisen Schweiz Genossenschaft 195 152 28% 0 3 8 9 7 23% 3 3 0%
Van Eck Funds 173 76 127% 17 4 21 108 44 146% 3 3 0%
Seligson & Co Fund Man 171 178 -4% 0 0 -6 7 2 196% 1 1 0%
BMO Global Asset Management 160 72 121% 45 33 99 38 53 -28% 9 9 0%
Nomura Asset Management 137 251 -45% -35 -49 -66 78 60 30% 3 3 0%
First Trust 129 119 8% 3 0 13 34 9 268% 9 7 29%
DnB Kapitalforvaltning 115 103 12% 0 0 7 55 13 322% 1 1 0%
UniCredit Bank 83 61 37% 0 5 27 3 3 15% 1 1 0%
Commerzbank AG 46 47 -3% 1 0 1 1 1 -4% 3 3 0%
SEB Investment Management AB 41 45 -9% 0 0 0 3 3 -3% 3 3 0%
FinEx Fund Plc 33 33 -1% -3 0 -3 6 0 7012% 2 2 0%
Sun Global Investments 14 5 205% 9 0 9 0 0 216% 2 1 100%
Boost 12 5 152% 5 0 12 40 19 106% 3 3 0%
Fullgoal Fund Management Co 9 0 NA 9 0 9 0 0 NA 1 0 NA
Alpha Asset Management 9 11 -22% -8 0 -8 6 1 310% 1 1 0%
NBG Asset Management MFMC 4 4 -5% 0 0 0 0 0 555% 2 2 0%
Landsbankinn 0 0 NA 0 0 0 4 6 -41% 1 1 0%
Nordea Investment Funds 0 0 NA 0 0 0 0 0 -100% 2 2 0%
PDR Services LLC 0 0 NA 0 0 0 0 1 -100% 0 0 NA
Total 454,176 450,266 1% 3,538 1,902 14,773 84,373 55,125 53% 1539 1,517 1%
AUM Cash Flow Turnover Products
*China Post Global acquired ETF arm of Royal Bank of Scotland (RBS). *Blackrock’s acquisition of Credit Suisse’s ETF business completed on 1-Jul-2013. We have added historical AUM of Credit Suisse ETFs to Blackrock ETFs. Source: Deutsche Bank, Bloomberg Finance LP, Reuters.
8 July 2016
European Monthly ETF Market Review
Page 34 Deutsche Bank AG/London
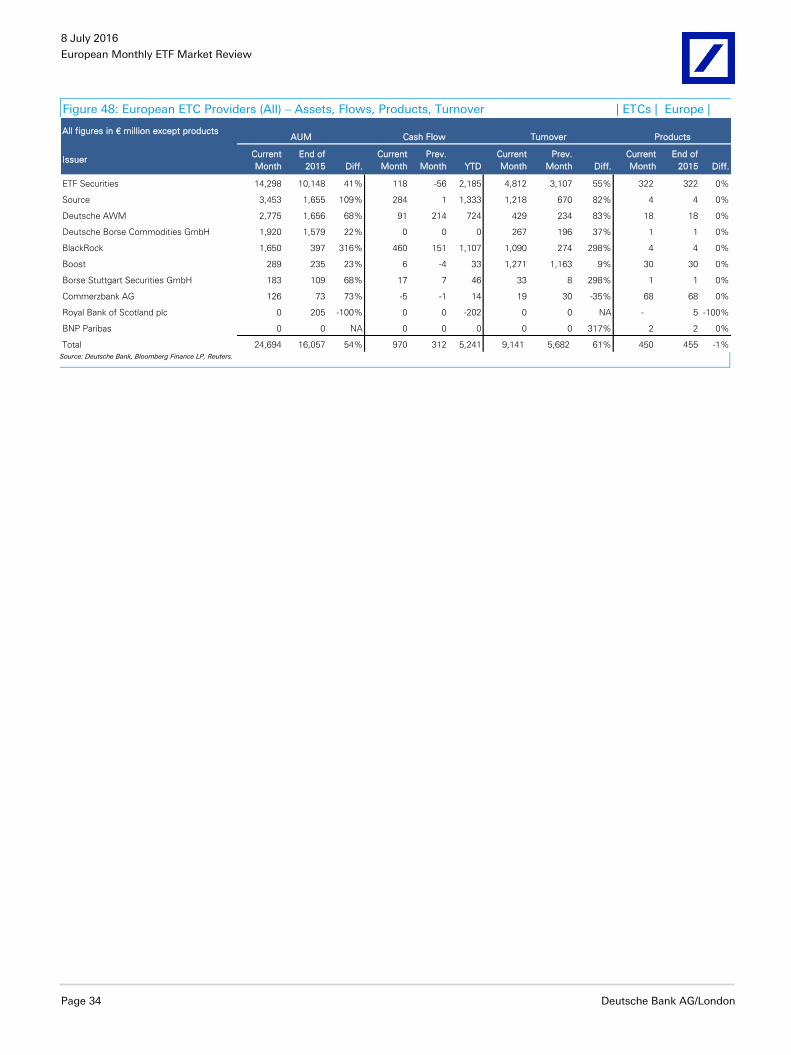
Figure 48: European ETC Providers (All) – Assets, Flows, Products, Turnover | ETCs | Europe |
All figures in € million except products
Issuer Current
Month
End of
2015 Diff.
Current
Month
Prev.
Month YTD
Current
Month
Prev.
Month Diff.
Current
Month
End of
2015 Diff.
ETF Securities 14,298 10,148 41% 118 -56 2,185 4,812 3,107 55% 322 322 0%
Source 3,453 1,655 109% 284 1 1,333 1,218 670 82% 4 4 0%
Deutsche AWM 2,775 1,656 68% 91 214 724 429 234 83% 18 18 0%
Deutsche Borse Commodities GmbH 1,920 1,579 22% 0 0 0 267 196 37% 1 1 0%
BlackRock 1,650 397 316% 460 151 1,107 1,090 274 298% 4 4 0%
Boost 289 235 23% 6 -4 33 1,271 1,163 9% 30 30 0%
Borse Stuttgart Securities GmbH 183 109 68% 17 7 46 33 8 298% 1 1 0%
Commerzbank AG 126 73 73% -5 -1 14 19 30 -35% 68 68 0%
Royal Bank of Scotland plc 0 205 -100% 0 0 -202 0 0 NA - 5 -100%
BNP Paribas 0 0 NA 0 0 0 0 0 317% 2 2 0%
Total 24,694 16,057 54% 970 312 5,241 9,141 5,682 61% 450 455 -1%
AUM Cash Flow Turnover Products
Source: Deutsche Bank, Bloomberg Finance LP, Reuters.

8 July 2016
European Monthly ETF Market Review
Deutsche Bank AG/London Page 35
Figure 49: European ETP Providers (All) – Assets, Flows, Products, Turnover | ETPs | Europe |
All figures in € million except products
Issuer Current
Month
End of
2015 Diff.
Current
Month
Prev.
Month YTD
Current
Month
Prev.
Month Diff.
Current
Month
End of
2015 Diff.
BlackRock 220,602 214,411 3% 1,963 1,247 11,535 41,519 23,421 77% 281 275 2%
Deutsche AWM 56,700 58,168 -3% -22 447 -22 7,946 5,223 52% 237 234 1%
Lyxor 45,788 47,742 -4% 583 70 281 14,613 12,714 15% 219 244 -10%
UBS 24,727 24,949 -1% 177 28 485 2,850 1,974 44% 129 130 -1%
Amundi 19,789 19,739 0% 202 -109 643 4,320 3,112 39% 102 100 2%
Source 18,490 17,941 3% 47 -181 587 3,079 2,129 45% 82 81 1%
Vanguard 18,400 17,691 4% 634 129 1,033 3,270 1,582 107% 21 17 24%
ETF Securities 15,573 10,938 42% 173 97 2,632 5,757 4,069 41% 350 352 -1%
State Street 13,620 11,863 15% 214 509 1,598 2,204 1,235 79% 99 78 27%
ComStage 7,036 6,925 2% -317 28 219 837 483 73% 112 111 1%
Zuercher Kantonalbank 6,994 5,400 30% 108 63 349 484 292 66% 4 4 0%
Deka Investment GmbH 6,958 7,027 -1% 45 -144 322 1,307 842 55% 42 46 -9%
HSBC 4,747 4,978 -5% -23 -5 -171 674 402 68% 27 28 -4%
BNP Paribas 4,168 4,466 -7% 108 40 13 294 191 54% 35 31 13%
Xact Fonder AB 2,484 2,522 -2% -17 -26 127 1,410 969 46% 13 10 30%
Julius Baer Inv 2,121 1,640 29% 50 20 116 134 71 88% 4 4 0%
Deutsche Borse Commodities GmbH 1,920 1,579 22% 0 0 0 267 196 37% 1 1 0%
Ossiam 1,890 1,707 11% 100 -39 61 76 57 34% 10 9 11%
ThinkCapital ETFs N.V. 1,754 1,623 8% 179 179 151 134 76 77% 14 13 8%
PowerShares 1,754 1,766 -1% 48 -3 63 294 279 6% 19 21 -10%
WisdomTree 387 477 -19% 12 -97 -39 74 32 132% 25 19 32%
Fundlogic Global Solutions plc 386 169 129% 210 0 213 154 0 40522% 2 2 0%
China Post Global 329 331 -1% -32 -24 -94 41 13 207% 10 10 0%
BBVA Gestion SA SGIIC 323 483 -33% 5 -14 -103 61 20 208% 2 2 0%
Boost 301 240 25% 11 -4 44 1,310 1,182 11% 33 33 0%
Raiffeisen Schweiz Genossenschaft 195 152 28% 0 3 8 9 7 23% 3 3 0%
Borse Stuttgart Securities GmbH 183 109 68% 17 7 46 33 8 298% 1 1 0%
Van Eck Funds 173 76 127% 17 4 21 108 44 146% 3 3 0%
Seligson & Co Fund Man 171 178 -4% 0 0 -6 7 2 196% 1 1 0%
Commerzbank AG 171 120 43% -4 -1 15 21 31 -34% 71 71 0%
BMO Global Asset Management 160 72 121% 45 33 99 38 53 -28% 9 9 0%
Nomura Asset Management 137 251 -45% -35 -49 -66 78 60 30% 3 3 0%
First Trust 129 119 8% 3 0 13 34 9 268% 9 7 29%
DnB Kapitalforvaltning 115 103 12% 0 0 7 55 13 322% 1 1 0%
UniCredit Bank 83 61 37% 0 5 27 3 3 15% 1 1 0%
SEB Investment Management AB 41 45 -9% 0 0 0 3 3 -3% 3 3 0%
FinEx Fund Plc 33 33 -1% -3 0 -3 6 0 7012% 2 2 0%
Sun Global Investments 14 5 205% 9 0 9 0 0 216% 2 1 100%
Fullgoal Fund Management Co 9 0 NA 9 0 9 0 0 NA 1 0 NA
Alpha Asset Management 9 11 -22% -8 0 -8 6 1 310% 1 1 0%
NBG Asset Management MFMC 4 4 -5% 0 0 0 0 0 555% 2 2 0%
Royal Bank of Scotland plc 0 205 -100% 0 0 -202 0 0 NA 0 5 -100%
Nordea Investment Funds 0 0 NA 0 0 0 0 0 -100% 2 2 0%
Landsbankinn 0 0 NA 0 0 0 4 6 -41% 1 1 0%
PDR Services LLC 0 0 NA 0 0 0 0 1 -100% 0 0 NA
Total 478,869 466,322 3% 4,508 2,214 20,013 93,514 60,807 54% 1,989 1,972 1%
ProductsAUM Cash Flow Turnover
* China Post Global acquired ETF arm of Royal Bank of Scotland (RBS). *Blackrock’s acquisition of Credit Suisse’s ETF business completed on 1-Jul-2013. We have added historical AUM of Credit Suisse ETFs to Blackrock ETFs. Source: Deutsche Bank, Bloomberg Finance LP, Reuters.

8 July 2016
European Monthly ETF Market Review
Page 36 Deutsche Bank AG/London
Figure 50: European ETP Providers tier market share | ETPs | Europe |
60% 65% 70% 75% 80% 85% 90% 95% 100%
Q2 15
Q3 15
Q4 15
Q1 16
Jun-16
Q2 15 Q3 15 Q4 15 Q1 16 Jun-16
Tier 1 68.3% 68.1% 73.9% 73.1% 72.6%
Tier 2 27.6% 27.7% 23.1% 23.8% 23.3%
Tier 3 4.1% 4.2% 3.2% 3.1% 4.1%
Source: Deutsche Bank, Bloomberg Finance LP, Reuters.

8 July 2016
European Monthly ETF Market Review
Deutsche Bank AG/London Page 37
European Provider Rankings – by Asset Class
Figure 51: European ETF Providers (All) – Assets, Flows, Products, Turnover | ETFs | Europe |
Issuer Equity
Fixed
Income
Comm-
odity Others
Total
AUM
Mkt Share
% Nu.
Current
TO
Current
CF YTD CF
BlackRock 133,805 83,235 1,595 316 218,952 48.2% 277 40,429 1,503 10,428
Deutsche AWM 39,168 13,648 424 685 53,925 11.9% 219 7,516 -113 -746
Lyxor 33,884 10,840 1,001 63 45,788 10.1% 219 14,613 583 281
UBS 20,124 2,178 2,355 70 24,727 5.4% 129 2,850 177 485
Amundi 14,848 4,942 0 0 19,789 4.4% 102 4,320 202 643
Vanguard 18,137 263 0 0 18,400 4.1% 21 3,270 634 1,033
Source 9,433 5,298 307 0 15,038 3.3% 78 1,861 -237 -747
State Street 8,403 5,166 0 51 13,620 3.0% 99 2,204 214 1,598
ComStage 5,049 1,646 331 10 7,036 1.5% 112 837 -317 219
Zuercher Kantonalbank 0 0 6,994 0 6,994 1.5% 4 484 108 349
Deka Investment GmbH 4,659 2,299 0 0 6,958 1.5% 42 1,307 45 322
HSBC 4,747 0 0 0 4,747 1.0% 27 674 -23 -171
BNP Paribas 3,823 146 199 0 4,168 0.9% 33 294 108 13
Xact Fonder AB 2,325 44 116 0 2,484 0.5% 13 1,410 -17 127
Julius Baer Inv 0 0 2,121 0 2,121 0.5% 4 134 50 116
Ossiam 1,832 0 58 0 1,890 0.4% 10 76 100 61
ThinkCapital ETFs N.V. 834 901 0 19 1,754 0.4% 14 134 179 151
PowerShares 1,723 28 0 3 1,754 0.4% 19 294 48 63
ETF Securities 518 297 460 0 1,275 0.3% 28 945 55 447
WisdomTree 378 0 9 0 387 0.1% 25 74 12 -39
Fundlogic Global Solutions plc 386 0 0 0 386 0.1% 2 154 210 213
China Post Global 166 0 163 0 329 0.1% 10 41 -32 -94
BBVA Gestion SA SGIIC 323 0 0 0 323 0.1% 2 61 5 -103
Raiffeisen Schweiz Genossenschaft 0 0 195 0 195 0.0% 3 9 0 8
Van Eck Funds 173 0 0 0 173 0.0% 3 108 17 21
Seligson & Co Fund Man 171 0 0 0 171 0.0% 1 7 0 -6
BMO Global Asset Management 87 74 0 0 160 0.0% 9 38 45 99
Nomura Asset Management 137 0 0 0 137 0.0% 3 78 -35 -66
First Trust 129 0 0 0 129 0.0% 9 34 3 13
DnB Kapitalforvaltning 115 0 0 0 115 0.0% 1 55 0 7
UniCredit Bank 0 83 0 0 83 0.0% 1 3 0 27
Commerzbank AG 11 34 0 0 46 0.0% 3 1 1 1
SEB Investment Management AB 41 0 0 0 41 0.0% 3 3 0 0
FinEx Fund Plc 0 29 4 0 33 0.0% 2 6 -3 -3
Sun Global Investments 0 14 0 0 14 0.0% 2 0 9 9
Boost 11 1 0 0 12 0.0% 3 40 5 12
Fullgoal Fund Management Co 0 9 0 0 9 0.0% 1 0 9 9
Alpha Asset Management 9 0 0 0 9 0.0% 1 6 -8 -8
NBG Asset Management MFMC 4 0 0 0 4 0.0% 2 0 0 0
Nordea Investment Funds 0 0 0 0 0 0.0% 2 0 0 0
Landsbankinn 0 0 0 0 0 0.0% 1 4 0 0
Alpcot Capital Management 0 0 0 0 0 0.0% 0 0 0 0
Swedbank Robur 0 0 0 0 0 0.0% 0 0 0 0
NCB Stockbrokers 0 0 0 0 0 0.0% 0 0 0 0
PDR Services LLC 0 0 0 0 0 0.0% 0 0 0 0
Total 305,452 131,173 16,334 1,217 454,176 100.0% 1,539 84,373 3,538 14,773
All figures in € million except products
* China Post Global acquired ETF arm of Royal Bank of Scotland (RBS). *Blackrock’s acquisition of Credit Suisse’s ETF business completed on 1-Jul-2013. We have added historical AUM of Credit Suisse ETFs to Blackrock ETFs. Source: Deutsche Bank, Bloomberg Finance LP, Reuters.

8 July 2016
European Monthly ETF Market Review
Page 38 Deutsche Bank AG/London
Figure 52: European ETC Providers (All) – Assets, Flows, Products, Turnover | ETCs | Europe |
Issuer Commodity Currency Total AUM
Mkt
Share % Nu. Current TO Current CF YTD CF
ETF Securities 13,974 323 14,298 57.9% 322 4,812 118 2185
Source 3,453 0 3,453 14.0% 4 1,218 284 1333
Deutsche AWM 2,775 0 2,775 11.2% 18 429 91 724
Deutsche Borse Commodities GmbH 1,920 0 1,920 7.8% 1 267 0 0
BlackRock 1,650 0 1,650 6.7% 4 1,090 460 1107
Boost 285 5 289 1.2% 30 1,271 6 33
Borse Stuttgart Securities GmbH 183 0 183 0.7% 1 33 17 46
Commerzbank AG 126 0 126 0.5% 68 19 -5 14
Royal Bank of Scotland plc 0 0 0 0.0% - - 0 -202
BNP Paribas 0 0 0 0.0% 2 0 0 0
Total 24,366 328 24,694 100.0% 450 9,141 970 5,241
All figures in € million except products
Source: Deutsche Bank, Bloomberg Finance LP, Reuters.

8 July 2016
European Monthly ETF Market Review
Deutsche Bank AG/London Page 39
Figure 53: European ETP Providers (All) – Assets, Flows, Products, Turnover | ETPs | Europe |
Issuer Equity
Fixed
Income Commodity Others
Total
AUM
Mkt Share
% Nu.
Current
TO
Current
CF YTD CF
BlackRock 133,805 83,235 3,245 316 220,602 46.1% 281 41,519 1,963 11,535
Deutsche AWM 39,168 13,648 3,199 685 56,700 11.8% 237 7,946 -22 -22
Lyxor 33,884 10,840 1,001 63 45,788 9.6% 219 14,613 583 281
UBS 20,124 2,178 2,355 70 24,727 5.2% 129 2,850 177 485
Amundi 14,848 4,942 0 0 19,789 4.1% 102 4,320 202 643
Source 9,433 5,298 3,759 0 18,490 3.9% 82 3,079 47 587
Vanguard 18,137 263 0 0 18,400 3.8% 21 3,270 634 1,033
ETF Securities 518 297 14,434 323 15,573 3.3% 350 5,757 173 2,632
State Street 8,403 5,166 0 51 13,620 2.8% 99 2,204 214 1,598
ComStage 5,049 1,646 331 10 7,036 1.5% 112 837 -317 219
Zuercher Kantonalbank 0 0 6,994 0 6,994 1.5% 4 484 108 349
Deka Investment GmbH 4,659 2,299 0 0 6,958 1.5% 42 1,307 45 322
HSBC 4,747 0 0 0 4,747 1.0% 27 674 -23 -171
BNP Paribas 3,823 146 199 0 4,168 0.9% 35 294 108 13
Xact Fonder AB 2,325 44 116 0 2,484 0.5% 13 1,410 -17 127
Julius Baer Inv 0 0 2,121 0 2,121 0.4% 4 134 50 116
Deutsche Borse Commodities GmbH 0 0 1,920 0 1,920 0.4% 1 267 0 0
Ossiam 1,832 0 58 0 1,890 0.4% 10 76 100 61
ThinkCapital ETFs N.V. 834 901 0 19 1,754 0.4% 14 134 179 151
PowerShares 1,723 28 0 3 1,754 0.4% 19 294 48 63
WisdomTree 378 0 9 0 387 0.1% 25 74 12 -39
Fundlogic Global Solutions plc 386 0 0 0 386 0.1% 2 154 210 213
China Post Global 166 0 163 0 329 0.1% 10 41 -32 -94
BBVA Gestion SA SGIIC 323 0 0 0 323 0.1% 2 61 5 -103
Boost 11 1 285 5 301 0.1% 33 1,310 11 44
Raiffeisen Schweiz Genossenschaft 0 0 195 0 195 0.0% 3 9 0 8
Borse Stuttgart Securities GmbH 0 0 183 0 183 0.0% 1 33 17 46
Van Eck Funds 173 0 0 0 173 0.0% 3 108 17 21
Seligson & Co Fund Man 171 0 0 0 171 0.0% 1 7 0 -6
Commerzbank AG 11 34 126 0 171 0.0% 71 21 -4 15
BMO Global Asset Management 87 74 0 0 160 0.0% 9 38 45 99
Nomura Asset Management 137 0 0 0 137 0.0% 3 78 -35 -66
First Trust 129 0 0 0 129 0.0% 9 34 3 13
DnB Kapitalforvaltning 115 0 0 0 115 0.0% 1 55 0 7
UniCredit Bank 0 83 0 0 83 0.0% 1 3 0 27
SEB Investment Management AB 41 0 0 0 41 0.0% 3 3 0 0
FinEx Fund Plc 0 29 4 0 33 0.0% 2 6 -3 -3
Sun Global Investments 0 14 0 0 14 0.0% 2 0 9 9
Fullgoal Fund Management Co 0 9 0 0 9 0.0% 1 0 9 9
Alpha Asset Management 9 0 0 0 9 0.0% 1 6 -8 -8
NBG Asset Management MFMC 4 0 0 0 4 0.0% 2 0 0 0
Royal Bank of Scotland plc 0 0 0 0 0 0.0% 0 0 0 -202
Nordea Investment Funds 0 0 0 0 0 0.0% 2 0 0 0
Landsbankinn 0 0 0 0 0 0.0% 1 4 0 0
Alpcot Capital Management 0 0 0 0 0 0.0% 0 0 0 0
Swedbank Robur 0 0 0 0 0 0.0% 0 0 0 0
NCB Stockbrokers 0 0 0 0 0 0.0% 0 0 0 0
PDR Services LLC 0 0 0 0 0 0.0% 0 0 0 0
Total 305,452 131,173 40,699 1,545 478,869 100.0% 1,989 93,514 4,508 20,013
All figures in € million except products
*China Post Global acquired ETF arm of Royal Bank of Scotland (RBS). *Blackrock’s acquisition of Credit Suisse’s ETF business completed on 1-Jul-2013. We have added historical AUM of Credit Suisse ETFs to Blackrock ETFs. Source: Deutsche Bank, Bloomberg Finance LP, Reuters.

8 July 2016
European Monthly ETF Market Review
Page 40 Deutsche Bank AG/London
European Provider Analysis by Replication Method
Figure 54: European ETF Providers list by replication | ETFs | Europe|
AUM (€) ETFs AUM (€) ETFs AUM (€) ETFs AUM (€) ETFs AUM (€) AUM (%) ETFs
European Providers
BlackRock Physical 133,655 182 83,235 89 757 3 316 1 217,964 100% 275
Synthetic 150 1 - - 839 1 - - 989 0% 2
Deutsche AWM Physical 25,123 63 473 5 - - 33 2 25,629 48% 70
Synthetic 14,046 73 13,175 70 424 3 651 3 28,296 52% 149
Lyxor Physical 883 14 5,056 21 - - - - 5,939 13% 35
Synthetic 33,001 154 5,784 25 1,001 2 63 3 39,849 87% 184
UBS Physical 17,101 69 2,100 23 1,504 6 - - 20,705 84% 98
Synthetic 3,023 19 78 1 851 9 70 2 4,022 16% 31
Amundi Physical 978 6 - - - - - - 978 5% 6
Synthetic 13,869 69 4,942 27 - - - - 18,811 95% 96
Vanguard Physical 18,137 16 263 5 - - - - 18,400 100% 21
Source Physical 1,864 15 5,016 12 - - - - 6,880 46% 27
Synthetic 7,569 48 282 2 307 1 - - 8,158 54% 51
State Street Physical 8,403 62 5,166 36 - - 51 1 13,620 100% 99
ComStage Physical 229 6 - - - - - - 229 3% 6
Synthetic 4,820 75 1,646 28 331 2 10 1 6,807 97% 106
Zuercher Kantonalbank Physical - - - - 6,994 4 - - 6,994 100% 4
Deka Investment GmbH Physical 4,644 25 2,299 16 - - - - 6,943 100% 41
Synthetic 15 1 - - - - - - 15 0% 1
HSBC Physical 4,747 27 - - - - - - 4,747 100% 27
BNP Paribas Physical 1,492 17 - - 103 1 - - 1,595 38% 18
Synthetic 2,331 13 146 1 96 1 - - 2,573 62% 15
Xact Fonder AB Physical 1,825 4 - - - - - - 1,825 73% 4
Synthetic 499 7 44 1 116 1 - - 659 27% 9
Julius Baer Inv Physical - - - - 2,121 4 - - 2,121 100% 4
Ossiam Physical 62 1 - - - - - - 62 3% 1
Synthetic 1,770 8 - - 58 1 - - 1,828 97% 9
ThinkCapital ETFs N.V. Physical 834 8 901 3 - - 19 3 1,754 100% 14
PowerShares Physical 1,459 13 28 1 - - 3 1 1,490 85% 15
Synthetic 264 4 - - - - - - 264 15% 4
ETF Securities Synthetic 426 20 - - 460 1 - - 886 100% 21
Physical 92 3 297 4 - - - - 389 100% 7
WisdomTree Physical 373 22 - - - - - - 373 100% 22
Synthetic 5 2 - - 9 1 - - 15 100% 3
Fundlogic Global Solutions plc Synthetic 386 2 - - - - - - 386 100% 2
China Post Global Synthetic 166 7 - - 163 3 - - 329 100% 10
BBVA Gestion SA Physical 323 2 - - - - - - 323 100% 2
Raiffeisen Schweiz
Genossenschaft
Physical - - - - 195 3 - - 195 100% 3
Van Eck Funds Physical 173 3 - - - - - - 173 100% 3
Seligson & Co Fund Mgmt. Physical 171 1 - - - - - - 171 100% 1
BMO Global Asset Management Physical 87 5 74 4 - - - - 160 100% 9
Nomura Asset Management Physical 137 3 - - - - - - 137 100% 3
First Trust Physical 129 9 - - - - - - 129 100% 9
DnB Kapitalforvaltning Physical 115 1 - - - - - - 115 100% 1
UniCredit Bank Synthetic - - 83 1 - - - - 83 100% 1
Commerzbank AG Synthetic 9 1 - - - - - - 9 20% 1
Physical 2 1 34 1 - - - - 37 80% 2
SEB Investment Management AB Synthetic 41 3 - - - - - - 41 100% 3
FinEx Fund Plc Physical - - - - 4 1 - - 4 12% 1
Synthetic - - 29 1 - - - - 29 88% 1
Sun Global Investments Physical - - 14 2 - - - - 14 100% 2
Boost Synthetic 11 2 1 1 - - - - 12 100% 3
Fullgoal Fund Management Co Physical - - 9 1 - - - - 9 100% 1
Alpha Asset Mgmt. Physical 9 1 - - - - - - 9 100% 1
NBG Asset Mgmt. Physical 2 1 - - - - - - 2 47% 1
Synthetic 2 1 - - - - - - 2 53% 1
Landsbankinn Physical - 1 - - - - - - - NA 1
Nordea Investment Funds Synthetic - 2 - - - - - - - NA 2
Total 305,452 1,093 131,173 381 16,334 48 1,217 17 454,176 1,539
Total
All figures in € million except products
Replication
Method Equity Fixed Income Commodity Other
*China Post Global acquired ETF arm of Royal Bank of Scotland (RBS). *Blackrock’s acquisition of Credit Suisse’s ETF business completed on 1-Jul-2013. We have added historical AUM of Credit Suisse ETFs to Blackrock ETFs. Source: Deutsche Bank, Bloomberg Finance LP, Reuters.

8 July 2016
European Monthly ETF Market Review
Deutsche Bank AG/London Page 41
6. Trading Perspective
ETP Monthly Turnover Analysis by Asset Class, by Instrument
Figure 55: Turnover by asset class and instrument (€ million) | ETPs | Europe |
May-162015 (Monthly
Avg.)
Asset Class Turnover Market
Share %
MoM
%Change
2015 (Monthly
Avg.) %Change Turnover Turnover
ETFs
Equity 59,143 63.2% 67.0% 20.5% 35,409 49,094
Fixed income 23,424 25.0% 27.1% 68.2% 18,431 13,929
Commodity 1,456 1.6% 28.7% 98.1% 1,131 735
Currency 0 0.0% 0.0% -100.0% 0 1
Multi Asset 24 0.0% 54.9% -13.2% 15 27
Alternative 327 0.3% 134.8% 201.7% 139 108
Total 84,373 90.2% 53.1% 32.1% 55,125 63,894
ETCs
Commodity 8,866 9.5% 60.3% 143.2% 5,530 3,646
Currency 275 0.3% 80.0% 15.3% 153 238
Total 9,141 9.8% 60.9% 135.4% 5,682 3,884
Total ETPs 93,514 100.0% 53.8% 38.0% 60,807 67,777
Jun-16
Source: Deutsche Bank, Bloomberg Finance LP, Reuters.
Asset Class Analysis
Figure 56: European Equity ETF Turnover Summary (€ million) | ETFs | Europe |
May-162015 (Monthly
Avg.)
Equity Turnover Turnover Market
Share %
MoM
%Change
2015 (Monthly
Avg.) %Change Turnover Turnover
Developed Markets 38,178 64.6% 76.0% 119.0% 21,691 32,083
Emerging Markets 4,248 7.2% 37.2% 92.1% 3,096 4,610
Global Markets 558 0.9% 20.0% 72.6% 465 768
Sector 4,144 7.0% 60.1% 139.6% 2,588 2,968
Capitalization 800 1.4% 18.2% 112.8% 677 709
Strategy 8,560 14.5% 65.7% 143.0% 5,165 5,988
Style 1,910 3.2% 68.8% 124.8% 1,132 1,530
Thematic 746 1.3% 25.3% 169.6% 595 440
Total Equities 59,143 100% 67% 120.5% 35,409 49,094
Jun-16
Source: Deutsche Bank, Bloomberg Finance LP, Reuters.

8 July 2016
European Monthly ETF Market Review
Page 42 Deutsche Bank AG/London
Figure 56A: European Equity ETF Turnover Summary – A (€ million) | ETFs | Europe |
May-162015 (Monthly
Avg.)
Equity Turnover Turnover Market
Share %
MoM
%Change
2015 (Monthly
Avg.) %Change Turnover Turnover
Sector 4,144 25.6% 60.1% 39.6% 2,588 2,968
Consumer discretionary 119 0.7% -29.5% -28.5% 169 166
Consumer staples 134 0.8% -5.5% -10.6% 141 150
Energy 293 1.8% 17.4% -19.3% 250 363
Financials 2705 16.7% 104.5% 98.9% 1323 1,360
Healthcare 223 1.4% 17.2% -8.1% 190 243
Industrials 92 0.6% 24.4% -37.0% 74 146
Information Technology 157 1.0% 61.6% -5.1% 97 165
Materials 193 1.2% 10.8% 1.2% 174 191
Telecommunications 112 0.7% 16.5% 18.7% 96 95
Utilities 117 0.7% 58.0% 30.5% 74 90
Capitalization 800 5.0% 18.2% 12.8% 677 709
Large Cap 32 0.2% 203.8% -14.9% 11 38
Mid Cap 357 2.2% 136.3% 26.6% 151 282
Small Cap 411 2.5% -20.2% 5.6% 515 389
Strategy 8,560 53.0% 65.7% 43.0% 5,165 5,988
Fundamental 57 0.4% -2.5% -44.1% 58 101
Leveraged Long 2479 15.3% 42.7% -11.5% 1737 2801
Leveraged Short 2951 18.3% 89.1% 62.6% 1561 1815
Options Strategy 0 0.0% 0.0% 0.0% 0 0
Quantitative 1660 10.3% 63.6% 164.2% 1014 628
Short 1413 8.7% 77.7% 120.2% 795 642
Style 1,910 11.8% 68.8% 24.8% 1,132 1,530
Dividend 1,806 11.2% 76.7% 30.8% 1,022 1,380
Growth 18 0.1% 1.5% -72.7% 18 66
Value 86 0.5% -6.4% 2.8% 92 84
Thematic 746 4.6% 25.3% 69.6% 595 440
Commodities 416 2.6% 44.3% 241.4% 288 122
Cyclical 0 0.0% 0.0% 0.0% 0 -
Faith 26 0.2% 69.7% 45.8% 16 18
Other Theme 78 0.5% -14.3% -32.8% 91 116
Sustainability 225 1.4% 12.6% 22.9% 200 183
Total 16,160 100.0% 59.1% 38.9% 10,157 11,634
Jun-16
Source: Deutsche Bank, Bloomberg Finance LP, Reuters.

8 July 2016
European Monthly ETF Market Review
Deutsche Bank AG/London Page 43
Figure 56B: European Equity ETF Turnover Summary – B (€ million) | ETFs | Europe |
May-162015 (Monthly
Avg.)
Equity Turnover Turnover Market
Share %
MoM
%Change
2015 (Monthly
Avg.) %Change Turnover Turnover
Developed Markets
Europe 25,660 67.2% 90.1% 26.0% 13,496 20,373
Austria 18 0.0% 395.7% 39.8% 4 13
Belgium 2 0.0% 191.6% -33.7% 1 4
Finland 7 0.0% 196.2% -37.9% 2 11
France 493 1.3% 96.2% -18.3% 251 603
Germany 4,769 12.5% 78.8% 1.3% 2,667 4,709
Greece 37 0.1% 33.6% -39.1% 28 61
Ireland 2 0.0% 356.0% -42.3% 0 3
Italy 817 2.1% 33.7% -12.5% 611 934
Netherlands 242 0.6% 10.0% 2.0% 220 237
Norway 58 0.2% 234.4% 115.7% 17 27
Portugal 9 0.0% 96.8% -53.0% 5 20
Iceland 4 0.0% -41.0% 901.9% 6 0
Spain 214 0.6% 130.9% -34.6% 93 327
Sweden 338 0.9% 22.3% -1.8% 277 344
Switzerland 1,203 3.2% 42.6% -3.0% 844 1,240
UK 5,656 14.8% 170.2% 127.0% 2,093 2,491
Europe broad 11,793 30.9% 84.9% 26.1% 6,378 9,349
Americas 7,371 19.3% 54.1% 22.1% 4,784 6,037
US 6,972 18.3% 56.3% 21.1% 4,460 5,759
Canada 84 0.2% -61.3% 1.7% 216 82
North America 315 0.8% 193.2% 60.4% 108 196
Asia 2,999 7.9% 51.6% -6.6% 1,978 3,211
Australia 74 0.2% -34.3% -29.3% 112 105
Hong Kong 12 0.0% 7.5% -78.0% 11 54
Japan 2,709 7.1% 68.7% -6.4% 1,606 2,895
Singapore 1 0.0% -8.0% -49.5% 2 3
Asia Pacific broad 202 0.5% -18.4% 31.1% 248 154
EMEA 9 0.0% 760.1% 0.0% 1 0
Israel 9 0.0% 760.1% 0.0% 1 0
Global 2,138 5.6% 49.3% -13.1% 1,432 2,461
Broad indices 2,138 5.6% 49.3% -13.1% 1,432 2,461
DM Total 38,178 100.0% 76.0% 19.0% 21,690 32,083
Jun-16
Source: Deutsche Bank, Bloomberg Finance LP, Reuters.

8 July 2016
European Monthly ETF Market Review
Page 44 Deutsche Bank AG/London
Figure 56C: European Equity ETF Turnover Summary – C (€ million) | ETFs | Europe |
May-162015 (Monthly
Avg.)
Equity Turnover Turnover Market
Share %
MoM
%Change
2015 (Monthly
Avg.) %Change Turnover Turnover
Emerging Markets
BRIC 731 17.2% 20.0% -56.1% 609 1,664
Brazil 129 3.0% -2.1% -22.0% 132 165
Russia 119 2.8% 11.0% -49.8% 108 238
India 192 4.5% 62.8% -46.4% 118 358
China 290 6.8% 15.5% -67.9% 251 903
Latin America 105 2.5% 9.7% -8.3% 96 115
Chile 0 0.0% 0.0% -100.0% 0 6
Mexico 20 0.5% -16.5% -40.9% 23 33
LATAM broad 86 2.0% 18.1% 13.3% 73 76
Asia 380 9.0% 20.1% -42.8% 317 665
Bangladesh 1 0.0% -52.3% -4.4% 2 1
Indonesia 24 0.6% 98.8% -30.4% 12 34
Malaysia 17 0.4% 162.1% -18.3% 7 21
Pakistan 3 0.1% 6.9% 32.8% 3 2
Philippines 13 0.3% 33.9% 15.6% 10 12
South Korea 106 2.5% 33.1% -38.5% 80 173
Taiwan 69 1.6% 27.8% -34.1% 54 105
Thailand 4 0.1% 115.7% -75.2% 2 14
Vietnam 23 0.5% 39.7% -31.4% 16 33
Asia Pacific broad 120 2.8% -8.6% -55.6% 131 270
EMEA 140 3.3% -15.1% -41.6% 165 240
Kuwait 0 0.0% -98.6% -97.9% 2 2
Poland 5 0.1% 54.2% -61.5% 3 12
South Africa 28 0.6% 89.3% 14.6% 15 24
Turkey 19 0.5% -56.0% -82.1% 44 108
Europe broad 83 1.9% -15.4% -0.2% 98 83
Middle East & Africa 6 0.1% 55.5% -47.8% 4 12
Global Markets 2,891 68.1% 51.4% 50.2% 1,909 1,925
Global 2,891 68.1% 51.4% 50.2% 1,909 1,925
EM Total 4,248 100.0% 37.2% -7.9% 3,096 4,610
Total (EM + DM) 42,426 100.0% 71.2% 15.6% 24,786 36,692
Jun-16
Source: Deutsche Bank, Bloomberg Finance LP, Reuters.

8 July 2016
European Monthly ETF Market Review
Deutsche Bank AG/London Page 45
Figure 57: European Fixed Income ETF Turnover (€ million) | ETFs | Europe |
May-162015 (Monthly
Avg.)
Fixed Income Turnover Turnover Market
Share %
MoM
%Change
2015 (Monthly
Avg.) %Change Turnover Turnover
Overall 511 2.2% 13.2% 22.5% 451 417
Corporates 9,697 41.4% 60.7% 95.6% 6,035 4,957
Covered Bonds 139 0.6% 29.7% -29.8% 107 198
Credit Exposure 55 0.2% 524.3% 59.2% 9 34
Sovereign 12,131 51.8% 6.3% 57.8% 11,408 7,688
Money Market 892 3.8% 112.5% 40.6% 419 634
Total Fixed Income 23,424 100.0% 27.1% 68.2% 18,431 13,929
Jun-16
Source: Deutsche Bank, Bloomberg Finance LP, Reuters.

8 July 2016
European Monthly ETF Market Review
Page 46 Deutsche Bank AG/London
Figure 58: European Commodity ETP Turnover summary (€ million) | ETPs | Europe |
May-162015 (Monthly
Avg.)
Commodity Turnover Turnover Market
Share %
MoM
%Change
2015 (Monthly
Avg.) %Change Turnover Turnover
Overall 538 5.2% -25.5% 59.3% 721 337
Overall 519 5.0% -26.7% 64.8% 709 315
Overall ex Energy 18 0.2% 48.1% -17.4% 12 22
Overall Light Energy 0 0.0% -76.3% -26.0% 0 0
Overall Ultra Light Energy 0 0.0% 0.0% 0.0% 0 0
Agriculture 286 2.8% 80.2% 34.0% 159 214
Overall 55 0.5% 94.8% 30.8% 28 42
Cocoa 5 0.1% 59.5% 14.8% 3 5
Coffee 60 0.6% 45.9% 17.6% 41 51
Corn 16 0.2% 77.9% 30.9% 9 12
Cotton 3 0.0% 138.4% -49.3% 1 6
Grains 3 0.0% 123.4% -45.5% 1 5
Softs 1 0.0% 219.1% -14.1% 0 1
Soybean Oil 14 0.1% 351.2% 177.7% 3 5
Soybeans 20 0.2% 331.7% 283.9% 5 5
Sugar 48 0.5% 92.4% 82.9% 25 26
Wheat 63 0.6% 48.3% 11.5% 42 56
Energy 2,239 21.7% -15.9% 36.2% 2,662 1,644
Overall 18 0.2% -0.5% -65.9% 18 53
Carbon 0 0.0% 19851.9% 96.6% 0 0
Crude Oil 1956 18.9% -15.8% 47.4% 2323 1327
Gasoline 3 0.0% -18.8% -67.5% 4 9
Heating Oil 2 0.0% -37.5% -34.5% 4 3
Natural Gas 259 2.5% -17.4% 3.0% 314 252
Electricity 0 0.0% 0.0% 0.0% 0 0
Uranium 0 0.0% 0.0% 0.0% 0 0
Industrial Metals 152 1.5% 58.8% -12.1% 95 172
Overall 31 0.3% 75.0% -23.2% 17 40
Aluminium 5 0.1% 52.4% -78.2% 3 24
Copper 97 0.9% 63.5% 24.4% 59 78
Lead 0 0.0% -26.0% -75.1% 0 1
Nickel 10 0.1% -19.8% -57.7% 12 23
Tin 1 0.0% 75.9% -51.5% 1 2
Zinc 8 0.1% 246.7% 65.8% 2 5
Precious Metals 7,105 68.8% 135.4% 253.9% 3,018 2,007
Overall 16 0.2% -26.8% -57.0% 22 37
Gold 6428 62.3% 140.8% 286.1% 2670 1665
Palladium 54 0.5% 50.4% 7.2% 36 51
Platinum 57 0.6% 7.8% -18.9% 53 71
Rhodium 0 0.0% -57.9% -96.4% 0 2
Silver 550 5.3% 131.7% 201.6% 237 182
Livestock 3 0.0% -46.6% -55.5% 5 6
Overall 0 0.0% -81.9% -61.9% 1 1
Cattle 2 0.0% -39.2% 28.8% 3 1
Lean Hogs 1 0.0% -21.4% -80.2% 1 4
Total 10,322 100.0% 55.0% 135.6% 6,661 4,381
Jun-16
Source: Deutsche Bank, Bloomberg Finance LP, Reuters.

8 July 2016
European Monthly ETF Market Review
Deutsche Bank AG/London Page 47
Product Rankings
Figure 59: Top 20 Equity ETFs by Turnover (€ million) | ETFs | Europe |
ETF Name BBG Ticker Issuer Invest.
Strategy
Current
Month TO
Prev.
Month TO YTD TO
iShares FTSE 100 UCITS ETF (Inc) ISF LN BlackRock Beta 2,669.8 989.2 8,883.0
iShares Core DAX UCITS ETF DE DAXEX GR BlackRock Beta 1,904.4 1,059.9 9,710.3
Lyxor UCITS ETF Euro STOXX 50 MSE FP Lyxor Beta 1,705.8 849.9 6,929.7
iShares Core S&P 500 UCITS ETF CSSPX SW BlackRock Beta 1,675.5 989.2 7,644.2
Vanguard S&P 500 ETF VUSA LN Vanguard Beta 1,663.2 773.9 6,937.7
iShares EURO STOXX 50 UCITS ETF (Inc) EUNE SW BlackRock Beta 1,157.7 410.3 4,638.6
iShares MSCI Emerging Markets UCITS ETF (Inc) IEEM LN BlackRock Beta 1,109.4 625.9 5,696.1
iShares FTSE 250 UCITS ETF MIDD LN BlackRock Beta 982.6 136.4 1,866.2
iShares S&P 500 UCITS ETF (Inc) IUSA LN BlackRock Beta 973.0 589.9 4,700.7
iShares Euro STOXX 50 (DE) SX5EEX GR BlackRock Beta 962.8 678.1 5,256.6
iShares STOXX 600 (DE) SXXPIEX GR BlackRock Beta 917.1 463.0 4,326.2
db x-trackers DAX® UCITS ETF (DR) 1C XDAX GR Deutsche AWM Beta 906.8 372.2 4,090.4
db x-trackers Euro Stoxx 50® UCITS ETF (DR) - 1D XESX GR Deutsche AWM Beta 880.9 648.8 3,932.9
Vanguard FTSE 100 ETF VUKE LN Vanguard Beta 861.2 367.3 2,965.5
Lyxor UCITS ETF STOXX Europe 600 Banks BNK FP Lyxor Beta 808.6 270.2 2,003.7
iShares MSCI Europe UCITS ETF (Inc) IMEU LN BlackRock Beta 651.1 346.3 3,155.3
Deka DAX UCITS ETF ETFDAX GR Deka Investment GmbH Beta 604.0 475.9 3,309.3
iShares Core MSCI World UCITS ETF (Acc) SWDA LN BlackRock Beta 600.0 324.7 5,716.2
Lyxor ETF Leverage CAC 40 LVC FP Lyxor Beta+ 543.8 375.8 3,228.6
iShares MSCI World UCITS ETF (Inc) IWRD LN BlackRock Beta 530.7 453.3 3,465.9 Source: Deutsche Bank, Bloomberg Finance LP, Reuters.
Figure 60: Top 20 Fixed Income ETFs by Turnover (€ million) | ETFs | Europe |
ETF Name BBG Code Issuer Invest.
Strategy
Current
Month TO
Prev.
Month TO YTD TO
iShares Euro Corporate Bond UCITS ETF IEBC LN BlackRock Beta 1,248.9 806.5 5,369.4
iShares Euro High Yield Corporate Bond UCITS ETF IHYG LN BlackRock Beta 1,149.7 520.9 6,452.5
iShares J.P. Morgan $ Emerging Markets Bond UCITS ETF SEMB LN BlackRock Beta 874.7 630.8 4,154.8
iShares $ High Yield Corporate Bond UCITS ETF SHYU LN BlackRock Beta 812.9 485.2 4,428.6
iShares $ Treasury Bond 1-3yr UCITS ETF IBTS LN BlackRock Beta 716.6 230.2 2,616.8
iShares UK Gilts UCITS ETF IGLT LN BlackRock Beta 696.7 258.5 2,049.4
iShares Euro Corporate Bond Large Cap UCITS ETF IBCS GR BlackRock Beta 626.0 232.0 2,704.8
iShares Emerging Markets Local Government Bond UCITS ETF SEML LN Blackrock Beta 621.3 494.7 3,038.7
iShares US Mortgage Backed Securities UCITS ETF IMBS LN BlackRock Beta 585.6 5.0 590.6
iShares £ Corporate Bond UCITS ETF SLXX LN BlackRock Beta 574.8 129.0 1,508.4
Lyxor ETF Daily Double Short BTP BTPS FP Lyxor Beta+ 565.6 183.6 1,148.3
iShares $ TIPS UCITS ETF IDTP LN BlackRock Beta 558.8 376.8 2,424.2
Lyxor UCITS ETF EuroMTS 3-5Y IG (DR) MTB FP Lyxor Beta 543.7 226.4 1,739.9
iShares Euro Corporate Bond ex-Financials UCITS ETF EEXF LN BlackRock Beta 506.1 146.9 1,058.5
Lyxor UCITS ETF EuroMTS 5-7Y IG (DR) MTC FP Lyxor Beta 474.8 69.1 713.8
iShares $ Corporate Bond UCITS ETF LQDE LN BlackRock Beta 414.0 608.6 3,344.3
iShares Global High Yield Corp Bond UCITS ETF HYLD LN BlackRock Beta 396.6 91.7 664.4
Lyxor UCITS ETF Euro Cash CSH FP Lyxor Beta 379.2 156.7 1,942.3
iShares $ Short Duration Corporate Bond UCITS ETF SDIG LN BlackRock Beta 343.7 165.5 949.4
iShares Euro Corporate Bond 1-5yr UCITS ETF SE15 LN BlackRock Beta 323.5 209.5 1,092.2
Source: Deutsche Bank, Bloomberg Finance LP, Reuters.

8 July 2016
European Monthly ETF Market Review
Page 48 Deutsche Bank AG/London
Figure 61: Top 20 Commodity ETPs by Turnover (€ million) | ETPs | Europe |
ETP Name BBG Code Issuer Invest.
Strategy
Current
Month TO
Prev.
Month TO YTD TO
Gold Bullion Securities GBS LN ETF Securities Beta 1,312.3 434.9 4,211.9
ETFS Physical Gold PHAU LN ETF Securities Beta 1,217.6 530.6 4,384.0
Source Physical Gold ETC (P-ETC) SGLD LN Source Beta 1,173.6 634.0 6,198.7
iShares Physical Gold ETC SGLN LN Blackrock Beta 1,019.4 264.2 2,079.4
Boost Wti Oil 3X Leverage Daily ETP 3OIL LN Boost Beta+ 695.7 649.6 3,259.9
ZKB Gold ETF ZGLD SW Zuercher Kantonalbank Beta 404.8 225.1 1,848.9
ETFS WTI Crude Oil CRUD LN ETF Securities Beta 320.5 377.4 2,514.9
ETFS Physical Silver PHAG LN ETF Securities Beta 280.3 76.0 940.0
XETRA-Gold XAUEUR Deutsche Borse Commodities GmbH Beta 267.4 195.9 1,323.5
Boost Wti Oil 3X Short Daily ETP 3OIS LN Boost Beta+ 226.2 251.0 1,308.9
ETFS Daily Leveraged Crude Oil LOIL LN ETF Securities Beta+ 199.2 548.8 1,543.3
ETFS Longer Dated All Commodities GO UCITS ETF COMF LN ETF Securities Beta 156.4 451.8 731.2
Boost Natural Gas 3X Leverage Daily ETP 3NGL LN Boost Beta+ 131.3 114.6 602.7
db Physical Gold Euro Hedged ETC XAD1 GR Deutsche AWM Beta 131.2 93.3 585.7
Julius Baer Physical Gold Fund - A (USD listing) JBGOUA SW Julius Baer Inv Beta 116.3 55.5 431.2
ETFS Brent 1mnth Oil OILB LN ETF Securities Beta 112.2 144.1 888.3
ETFS Daily Leveraged Gold LBUL LN ETF Securities Beta+ 111.8 30.8 252.9
UBS-IS Gold (CHF) Hedged ETF A AUCHAH SW UBS Beta 104.7 31.6 243.7
db Physical Gold ETC (EUR) XAD5 GR Deutsche AWM Beta 96.4 21.5 264.2
db WTI Crude Oil Booster USD Index XCT9 LN Deutsche AWM Beta 90.6 51.3 267.5 Source: Deutsche Bank, Bloomberg Finance LP, Reuters.
Figure 62: Top 10 ETPs by Turnover (€ million) – Deutsche Borse | ETPs | Europe |
Equity ETFs BBG Ticker Turnover Fixed Income ETFs BBG Ticker Turnover
1 iShares Core DAX UCITS ETF DE DAXEX GR 1,881.50 1 iShares Markit iBoxx Euro High Yield EUNW GR 69.96
2 iShares Euro STOXX 50 (DE) SX5EEX GR 943.03 2 iShares Barclays Euro Corporate Bond EUN5 GR 55.03
3 db x-trackers DAX® UCITS ETF (DR) 1C XDAX GR 857.06 3 db x-trackers II EONIA TR Index UCITS ETF XEON GR 45.28
4 iShares STOXX 600 (DE) SXXPIEX GR 824.14 4 iShares Markit iBoxx $ High Yield Capped Bond IS0R GY 35.87
5 Deka DAX UCITS ETF ETFDAX GR 603.98 5 db x-trackers II iBoxx Euro Sovereigns Eurozone Yield Plus Index UCITS ETF XY4P GR 35.49
6 iShares EURO STOXX 50 UCITS ETF (Inc) EUN2 GR 598.57 6 iShares eb.rexx Government Germany 10.5+ (DE) RXPXEX GR 31.49
7 iShares Euro STOXX Banks (DE) SX7EEX GR 396.54 7 iShares JPMorgan USD Emerging Markets Bond IUS7 GR 31.39
8 db x-trackers ShortDAX UCITS ETF XSDX GR 369.20 8 db x-trackers II iBoxx Euro Sovereigns Eurozone UCITS ETF XGLE GR 30.72
9 db x-trackers Euro Stoxx 50® UCITS ETF (DR) - 1C XESC GR 336.95 9 Deka Deutsche Borse EUROGOV Germany 10+ UCITS ETF ETFGS10 GR 30.26
10 db x-trackers Euro Stoxx 50® UCITS ETF (DR) - 1D XESX GR 269.26 10 db x-trackers II - iBoxx Global Inflation-Linked UCITS ETF 1C EUR - Hedged XGIN GR 27.17
Commodity ETPs BBG Ticker Turnover Other BBG Ticker Turnover
1 XETRA-Gold XAUEUR 267.45 1 db x-trackers - db Hedge Fund Index UCITS ETF 1C EUR - Hedged XHFI GR 9.26
2 db Physical Gold Euro Hedged ETC XAD1 GR 72.37 2 db x-trackers Portfolio TR Index UCITS ETF XQUI GR 7.82
3 ETFS Physical Gold VZLD GR 54.03 3 Lyxor ETF S&P 500 VIX Futures Enhanced Roll D-EUR VOOL GY 2.74
4 db Physical Gold ETC (EUR) XAD5 GR 48.96 4 db x-trackers LPX Major Market Private Equity UCITS ETF XLPE GR 2.72
5 ETFS Physical Silver VZLC GR 29.67 5 db-x trackers Portfolio Income UCITS ETF XS7W GR 1.30
6 Source Physical Gold ETC (P-ETC) 8PSG GY 25.50 6 ComStage Vermogensstrategie UCITS ETF F701 GY 1.29
7 ComStage ETF Commerzbank Commodity EW Index TR CBCOMM GR 24.80 7 ETFS 5X Long USD Short EUR 5CH5 GY 1.14
8 db x-trackers DBLCI - OY Balanced UCITS ETF 1C EUR - Hedged XDBC GR 19.95 8 ETFS Long USD Short EUR XBJP GR 0.69
9 Lyxor ETF Commodities CRB LYXCRB GR 17.15 9 ETFS Long NOK Short EUR LNOE GR 0.64
10 ETFS Brent Oil OESA GR 16.00 10 iShares S&P Listed Private Equity Fund IQQL GR 0.51
Source: Deutsche Bank, Bloomberg Finance LP, Reuters.

8 July 2016
European Monthly ETF Market Review
Deutsche Bank AG/London Page 49
Figure 63: Top 10 ETPs by Turnover (€ million) – London SE | ETPs | Europe | Equity ETFs BBG Ticker Turnover Fixed Income ETFs BBG Ticker Turnover
1 iShares FTSE 100 UCITS ETF (Inc) ISF LN 2,600.19 1 iShares Euro Corporate Bond UCITS ETF IEAC LN 1,016.43
2 Vanguard S&P 500 ETF VUSD LN 1,215.53 2 iShares Euro High Yield Corporate Bond UCITS ETF IHYG LN 952.31
3 iShares FTSE 250 UCITS ETF MIDD LN 982.27 3 iShares UK Gilts UCITS ETF IGLT LN 687.20
4 Vanguard FTSE 100 ETF VUKE LN 861.19 4 iShares $ High Yield Corporate Bond UCITS ETF IHYU LN 686.28
5 iShares Core S&P 500 UCITS ETF CSPX LN 724.68 5 iShares J.P. Morgan $ Emerging Markets Bond UCITS ETF IEMB LN 679.04
6 iShares MSCI Emerging Markets UCITS ETF (Inc) IEEM LN 444.24 6 iShares US Mortgage Backed Securities UCITS ETF SMBS LN 582.26
7 iShares Core S&P 500 UCITS ETF CSP1 LN 411.27 7 iShares £ Corporate Bond UCITS ETF SLXX LN 573.28
8 iShares MSCI Europe ex-UK UCITS ETF IEUX LN 373.85 8 iShares $ Treasury Bond 1-3yr UCITS ETF IBTS LN 571.89
9 iShares MSCI Emerging Markets UCITS ETF (Inc) IDEM LN 314.48 9 iShares Euro Corporate Bond Large Cap UCITS ETF IBCX LN 544.03
10 iShares UK Property UCITS ETF IUKP LN 267.72 10 iShares Euro Corporate Bond ex-Financials UCITS ETF IEXF LN 465.52
Commodity ETPs BBG Ticker Turnover Other BBG Ticker Turnover
1 Gold Bullion Securities GBS LN 1,032.19 1 iShares Listed Private Equity UCITS ETF IPRV LN 251.86
2 Source Physical Gold ETC (P-ETC) SGLD LN 1,000.26 2 ETFS 3x Long USD Short GBP USP3 LN 26.10
3 iShares Physical Gold ETC IGLN LN 880.63 3 ETFS Short USD Long GBP USGB LN 20.16
4 ETFS Physical Gold PHAU LN 769.16 4 ETFS 5x Long USD Short GBP USP5 LN 16.31
5 ETFS Physical Silver PHAG LN 193.02 5 ETFS 3x Short GBP Long USD SGB3 LN 12.59
6 ETFS Physical Gold GBP PHGP LN 170.31 6 ETFS Short GBP Long USD SGBP LN 12.48
7 ETFS WTI Crude Oil CRUD LN 159.29 7 db x-trackers - db Hedge Fund Index UCITS ETF 3C GBP - Hedged XHFG LN 8.54
8 ETFS Longer Dated All Commodities GO UCITS ETF COMF LN 145.85 8 ETFS Short GBP Long USDGBP USD2 LN 8.10
9 iShares Physical Gold ETC SGLN LN 138.79 9 ETFS 3x Short EUR Long USD SEU3 LN 6.51
10 db WTI Crude Oil Booster USD Index XCT9 LN 89.54 10 ETFS 3x Short EUR Long GBP SUP3 LN 5.86 Source: Deutsche Bank, Bloomberg Finance LP, Reuters.
Figure 64: Top 10 ETPs by Turnover (€ million) – Swiss SE | ETPs | Europe | Equity ETFs BBG Ticker Turnover Fixed Income ETFs BBG Ticker Turnover
1 iShares SMI CH CSSMI SW 326.41 1 Amundi Govt Bond Lowest Rated EuroMTS Investment Grade UCITS ETF X1G SW 130.18
2 iShares S&P 500 UCITS ETF (Inc) IUSA SW 299.26 2 iShares $ Treasury Bond 20+yr UCITS ETF IDTL SW 89.25
3 iShares Core S&P 500 UCITS ETF CSSPX SW 292.30 3 iShares CHF Corporate Bond (CH) CHCORP SW 87.74
4 UBS ETF - MSCI EMU 100% hedged to USD UCITS ETF A-acc EUUSBH SW 253.53 4 iShares $ TIPS UCITS ETF ITPS SW 46.85
5 UBS ETF (CH) - SMI (CHF) A-dis SMICHA SW 165.11 5 PIMCO EM Advantage Local Bond Index Source ETF EMLB SW 37.81
6 iShares SPI (CH) CHSPI SW 151.45 6 iShares Euro Inflation Linked Government Bond UCITS ETF IBCI SW 37.57
7 iShares MSCI EMU UCITS ETF CSEMU SW 125.28 7 iShares J.P. Morgan $ Emerging Markets Bond UCITS ETF IEMB SW 29.18
8 iShares SMIM CH CSSMIM SW 119.11 8 UBS ETF - Barclays US Liquid Corporates UCITS ETF (hedged to EUR) A-acc CBUSE SW 26.50
9 UBS ETF - MSCI United Kingdom UCITS ETF A-acc UKGBPB SW 101.66 9 iShares $ Corporate Bond UCITS ETF LQDE SW 26.01
10 UBS-ETF MSCI EMU EMUEUA SW 100.95 10 iShares $ Treasury Bond 7-10yr UCITS ETF IBTM SW 23.88
Commodity ETPs BBG Ticker Turnover Other BBG Ticker Turnover
1 ZKB Gold ETF-A USD ZGLDUS SW 130.96 1 db x-trackers - db Hedge Fund Index UCITS ETF 5C CHF - Hedged XHFC SW 0.80
2 UBS-IS Gold (CHF) Hedged ETF A AUCHAH SW 104.68 2 iShares Listed Private Equity UCITS ETF IPRV SW 0.67
3 ZKB Gold ETF-H (CHF) ZGLDHC SW 91.88 3 db x-trackers - db Hedge Fund Index UCITS ETF 2C USD - Hedged XHFD SW 0.40
4 ZKB Gold ETF ZGLD SW 89.87 4 UBS ETFs plc - HFRX Global Hedge Fund Index SF (EUR) A-acc HFCHAS SW 0.13
5 UBS ETF (CH) – Gold (USD) I-dis AUUSI SW 81.05 5 db x-trackers - db Hedge Fund Index UCITS ETF 1C EUR - Hedged XHFI SW 0.12
6 Julius Baer Physical Gold Fund - A (USD listing) JBGOUA SW 56.87 6 UBS ETFs plc - MAP Balanced 7 UCITS ETF SF (USD) A-acc M7USAS SW 0.11
7 ZKB Gold ETF-A EUR ZGLDEU SW 45.45 7 UBS ETFs plc - HFRX Global Hedge Fund Index SF (CHF) A-acc HFEUAS SW 0.01
8 ZKB Gold ETF-H (EUR) ZGLDHE SW 44.50 8 UBS ETFs plc - HFRX Global Hedge Fund Index SF (USD) A-acc HFUSAS SW 0.01
9 Source Physical Gold ETC (P-ETC) SGLD SW 33.54 9 SPDR Morningstar Multi-Asset Global Infrastructure UCITS ETF MAGI SW 0.00
10 ZKB Silver ETF ZSIL SW 29.33 Source: Deutsche Bank, Bloomberg Finance LP, Reuters.
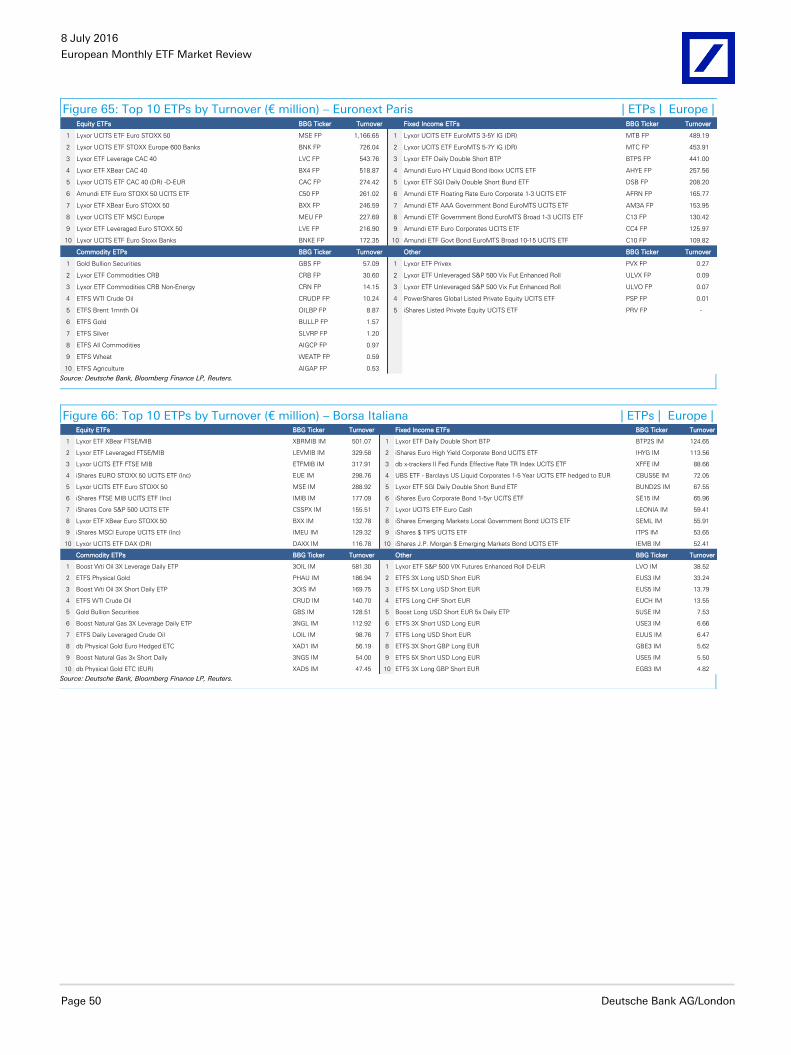
8 July 2016
European Monthly ETF Market Review
Page 50 Deutsche Bank AG/London
Figure 65: Top 10 ETPs by Turnover (€ million) – Euronext Paris | ETPs | Europe | Equity ETFs BBG Ticker Turnover Fixed Income ETFs BBG Ticker Turnover
1 Lyxor UCITS ETF Euro STOXX 50 MSE FP 1,166.65 1 Lyxor UCITS ETF EuroMTS 3-5Y IG (DR) MTB FP 489.19
2 Lyxor UCITS ETF STOXX Europe 600 Banks BNK FP 726.04 2 Lyxor UCITS ETF EuroMTS 5-7Y IG (DR) MTC FP 453.91
3 Lyxor ETF Leverage CAC 40 LVC FP 543.76 3 Lyxor ETF Daily Double Short BTP BTPS FP 441.00
4 Lyxor ETF XBear CAC 40 BX4 FP 518.87 4 Amundi Euro HY Liquid Bond iboxx UCITS ETF AHYE FP 257.56
5 Lyxor UCITS ETF CAC 40 (DR) -D-EUR CAC FP 274.42 5 Lyxor ETF SGI Daily Double Short Bund ETF DSB FP 208.20
6 Amundi ETF Euro STOXX 50 UCITS ETF C50 FP 261.02 6 Amundi ETF Floating Rate Euro Corporate 1-3 UCITS ETF AFRN FP 165.77
7 Lyxor ETF XBear Euro STOXX 50 BXX FP 246.59 7 Amundi ETF AAA Government Bond EuroMTS UCITS ETF AM3A FP 153.95
8 Lyxor UCITS ETF MSCI Europe MEU FP 227.69 8 Amundi ETF Government Bond EuroMTS Broad 1-3 UCITS ETF C13 FP 130.42
9 Lyxor ETF Leveraged Euro STOXX 50 LVE FP 216.90 9 Amundi ETF Euro Corporates UCITS ETF CC4 FP 125.97
10 Lyxor UCITS ETF Euro Stoxx Banks BNKE FP 172.35 10 Amundi ETF Govt Bond EuroMTS Broad 10-15 UCITS ETF C10 FP 109.82
Commodity ETPs BBG Ticker Turnover Other BBG Ticker Turnover
1 Gold Bullion Securities GBS FP 57.09 1 Lyxor ETF Privex PVX FP 0.27
2 Lyxor ETF Commodities CRB CRB FP 30.60 2 Lyxor ETF Unleveraged S&P 500 Vix Fut Enhanced Roll ULVX FP 0.09
3 Lyxor ETF Commodities CRB Non-Energy CRN FP 14.15 3 Lyxor ETF Unleveraged S&P 500 Vix Fut Enhanced Roll ULVO FP 0.07
4 ETFS WTI Crude Oil CRUDP FP 10.24 4 PowerShares Global Listed Private Equity UCITS ETF PSP FP 0.01
5 ETFS Brent 1mnth Oil OILBP FP 8.87 5 iShares Listed Private Equity UCITS ETF PRV FP -
6 ETFS Gold BULLP FP 1.57
7 ETFS Silver SLVRP FP 1.20
8 ETFS All Commodities AIGCP FP 0.97
9 ETFS Wheat WEATP FP 0.59
10 ETFS Agriculture AIGAP FP 0.53 Source: Deutsche Bank, Bloomberg Finance LP, Reuters.
Figure 66: Top 10 ETPs by Turnover (€ million) – Borsa Italiana | ETPs | Europe | Equity ETFs BBG Ticker Turnover Fixed Income ETFs BBG Ticker Turnover
1 Lyxor ETF XBear FTSE/MIB XBRMIB IM 501.07 1 Lyxor ETF Daily Double Short BTP BTP2S IM 124.65
2 Lyxor ETF Leveraged FTSE/MIB LEVMIB IM 329.58 2 iShares Euro High Yield Corporate Bond UCITS ETF IHYG IM 113.56
3 Lyxor UCITS ETF FTSE MIB ETFMIB IM 317.91 3 db x-trackers II Fed Funds Effective Rate TR Index UCITS ETF XFFE IM 88.66
4 iShares EURO STOXX 50 UCITS ETF (Inc) EUE IM 298.76 4 UBS ETF - Barclays US Liquid Corporates 1-5 Year UCITS ETF hedged to EUR CBUS5E IM 72.05
5 Lyxor UCITS ETF Euro STOXX 50 MSE IM 288.92 5 Lyxor ETF SGI Daily Double Short Bund ETF BUND2S IM 67.55
6 iShares FTSE MIB UCITS ETF (Inc) IMIB IM 177.09 6 iShares Euro Corporate Bond 1-5yr UCITS ETF SE15 IM 65.96
7 iShares Core S&P 500 UCITS ETF CSSPX IM 155.51 7 Lyxor UCITS ETF Euro Cash LEONIA IM 59.41
8 Lyxor ETF XBear Euro STOXX 50 BXX IM 132.78 8 iShares Emerging Markets Local Government Bond UCITS ETF SEML IM 55.91
9 iShares MSCI Europe UCITS ETF (Inc) IMEU IM 129.32 9 iShares $ TIPS UCITS ETF ITPS IM 53.65
10 Lyxor UCITS ETF DAX (DR) DAXX IM 116.78 10 iShares J.P. Morgan $ Emerging Markets Bond UCITS ETF IEMB IM 52.41
Commodity ETPs BBG Ticker Turnover Other BBG Ticker Turnover
1 Boost Wti Oil 3X Leverage Daily ETP 3OIL IM 581.30 1 Lyxor ETF S&P 500 VIX Futures Enhanced Roll D-EUR LVO IM 38.52
2 ETFS Physical Gold PHAU IM 186.94 2 ETFS 3X Long USD Short EUR EUS3 IM 33.24
3 Boost Wti Oil 3X Short Daily ETP 3OIS IM 169.75 3 ETFS 5X Long USD Short EUR EUS5 IM 13.79
4 ETFS WTI Crude Oil CRUD IM 140.70 4 ETFS Long CHF Short EUR EUCH IM 13.55
5 Gold Bullion Securities GBS IM 128.51 5 Boost Long USD Short EUR 5x Daily ETP 5USE IM 7.53
6 Boost Natural Gas 3X Leverage Daily ETP 3NGL IM 112.92 6 ETFS 3X Short USD Long EUR USE3 IM 6.66
7 ETFS Daily Leveraged Crude Oil LOIL IM 98.76 7 ETFS Long USD Short EUR EUUS IM 6.47
8 db Physical Gold Euro Hedged ETC XAD1 IM 56.19 8 ETFS 3X Short GBP Long EUR GBE3 IM 5.62
9 Boost Natural Gas 3x Short Daily 3NGS IM 54.00 9 ETFS 5X Short USD Long EUR USE5 IM 5.50
10 db Physical Gold ETC (EUR) XAD5 IM 47.45 10 ETFS 3X Long GBP Short EUR EGB3 IM 4.82 Source: Deutsche Bank, Bloomberg Finance LP, Reuters.

8 July 2016
European Monthly ETF Market Review
Deutsche Bank AG/London Page 51
Figure 67: Top 10 ETPs by Turnover (€ million) – Stockholmborsen & Euronext Amsterdam | ETPs | Europe | Stockholmborsen
Equity ETFs BBG Ticker Turnover Fixed Income ETFs BBG Ticker Turnover
1 XACT Bear 2 XABEAR2 SS 311.31 1 XACT Obligation UCITS ETF XACTBOND SS 0.04
2 XACT OMXS30 XACTOMX SS 295.77
3 XACT Bull 2 XABULL2 SS 184.04
4 XACT Bear XACBEAR SS 84.90
5 XACT Bull XACBULL SS 53.61
6 XACT OMXSB XACTSBX SS 40.23
7 XACT Svenska Smabolag UCITS ETF XACTSMAC SS 15.40
8 XACT Nordic 30 XACTVINX SS 9.58
9 db x-trackers MSCI Europe Index UCITS ETF (DR) XMEU SS 3.75
10 SpotR OMXS30 SPOTROMX SS 2.14
Euronext Amsterdam
Equity ETFs BBG Ticker Turnover Fixed Income ETFs BBG Ticker Turnover
1 iShares MSCI Europe UCITS ETF (Inc) IMEU NA 279.14 1 iShares Euro Corporate Bond UCITS ETF IEAC NA 112.37
2 Vanguard S&P 500 ETF VUSA NA 150.49 2 iShares Euro Aggregate Bond UCITS ETF IEAG NA 30.72
3 iShares S&P 500 UCITS ETF (Inc) IUSA NA 147.00 3 iShares Euro Corporate Bond Large Cap UCITS ETF IBCX NA 25.99
4 iShares AEX UCITS ETF IAEX NA 137.21 4 iShares Euro Inflation Linked Government Bond UCITS ETF IBCI NA 22.24
5 iShares Core MSCI World UCITS ETF (Acc) IWDA NA 125.51 5 iShares Euro Government Bond 7-10yr UCITS ETF IBGM NA 21.05
6 iShares MSCI World UCITS ETF (Inc) IWRD NA 98.92 6 iShares Euro Government Bond 3-5yr UCITS ETF IBGX NA 19.91
7 Think AEX Tracker TDT NA 83.58 7 iShares Euro Government Bond 5-7yr UCITS ETF IEGY NA 15.50
8 iShares MSCI Japan EUR Hedged UCITS ETF IJPE NA 76.64 8 iShares Euro Government Bond 3-7 UCITS ETF CBE7 NA 13.32
9 iShares European Property Yield UCITS ETF IPRP NA 60.01 9 iShares $ Treasury Bond 1-3yr UCITS ETF IBTS NA 10.79
10 Vanguard FTSE Developed Europe UCITS ETF VEUR NA 53.69 10 iShares Euro Government Bond 15-30yr UCITS ETF IBGL NA 10.45 Source: Deutsche Bank, Bloomberg Finance LP, Reuters.

8 July 2016
European Monthly ETF Market Review
Page 52 Deutsche Bank AG/London
7. European ETF Exchanges
Figure 68: European on-exchange ETF trading ranking by exchange (€ million) | ETFs | Europe |
Summary Feb-16Market
Share %Mar-16
Market
Share %Apr-16
Market
Share %May-16
Market
Share %Jun-16
Market
Share %
Deutche Boerse
Deutsche Borse 15,728 21.1% 13,722 20.3% 12,183 20.0% 10,603 19.2% 17,343 20.6%
LSE
London SE 27,904 37.4% 27,035 40.0% 25,127 41.2% 23,430 42.5% 35,949 42.6%
Borsa Italiana 8,507 11.4% 6,726 10.0% 5,693 9.3% 5,672 10.3% 7,708 9.1%
36,411 48.8% 33,761 50.0% 30,820 50.5% 29,102 52.8% 43,657 51.7%
Euronext
Paris 11,325 15.2% 10,552 15.6% 9,250 15.2% 8,042 14.6% 12,186 14.4%
Amsterdam 2,481 3.3% 2,168 3.2% 2,039 3.3% 1,594 2.9% 2,213 2.6%
Lisbon 4 0.0% 4 0.0% 5 0.0% 2 0.0% 5 0.0%
Brussels 3 0.0% 1 0.0% 1 0.0% 1 0.0% 2 0.0%
13,812 18.5% 12,726 18.8% 11,296 18.5% 9,639 17.5% 14,406 17.1%
Swiss SE 6,004 8.0% 5,405 8.0% 5,043 8.3% 4,473 8.1% 6,999 8.3%
Stockholmborsen 1,512 2.0% 1,174 1.7% 938 1.5% 787 1.4% 1,019 1.2%
Oslo Bors 620 0.8% 341 0.5% 339 0.6% 219 0.4% 460 0.5%
BME 499 0.7% 414 0.6% 387 0.6% 291 0.5% 471 0.6%
Others 15 0.0% 10 0.0% 24 0.0% 11 0.0% 17 0.0%
Total 74,601 100.0% 67,553 100.0% 61,029 100.0% 55,125 100.0% 84,373 100.0%
Source: Deutsche Bank, Bloomberg Finance LP, Reuters.

8 July 2016
European Monthly ETF Market Review
Deutsche Bank AG/London Page 53
Figure 69: European on-exchange ETC trading ranking by exchange (€ million) | ETCs | Europe |
Summary Feb-16Market
Share %Mar-16
Market
Share %Apr-16
Market
Share %May-16
Market
Share %Jun-16
Market
Share %
LSE
London SE 5,453 7.3% 3,894 5.8% 3,426 5.6% 2,827 5.1% 5,976 7.1%
Borsa Italiana 1,651 2.2% 1,729 2.6% 1,723 2.8% 1,911 3.5% 2,296 2.7%
7,104 9.5% 5,623 8.3% 5,149 8.4% 4,738 8.6% 8,272 9.8%
Deutche Boerse
Deutsche Borse 758 1.0% 612 0.9% 507 0.8% 845 1.5% 662 0.8%
Euronext
Amsterdam 31 0.0% 27 0.0% 33 0.1% 19 0.0% 48 0.1%
Brussels 0 0.0% 0 0.0% 0 0.0% 0 0.0% 0 0.0%
102 0.1% 86 0.1% 75 0.1% 60 0.1% 131 0.2%
Others 59 0.1% 45 0.1% 61 0.1% 40 0.1% 76 0.1%
Total 8,023 10.8% 6,366 9.4% 5,792 9.5% 5,682 10.3% 9,141 10.8% Source: Deutsche Bank, Bloomberg Finance LP, Reuters.

8 July 2016
European Monthly ETF Market Review
Page 54 Deutsche Bank AG/London
Figure 70: Total ETP on-exchange Turnover by asset class and by exchange | ETPs | Europe |
Deutsche
BorseLondon SE
Euronext
Paris
Borsa
Italiana
Euronext
AmsterdamSwiss SE
Stockholm
Borsen
Turnover* Mkt Share %
Equity
Developed Markets 52,638.5 62,960.0 21,983.1 18,383.2 8,648.7 20,188.3 2,222.2 187,023.8 41.6%
Emerging Markets 4,476.2 11,055.6 4,610.9 2,269.9 1,060.7 1,979.1 28.8 25,481.1 5.7%
Global Markets 403.1 2,014.2 435.5 101.0 258.0 402.0 0.8 3,614.7 0.8%
Sector 7,692.2 4,192.8 4,702.6 1,228.9 388.7 784.1 3.5 18,992.8 4.2%
Capitalization 1,078.7 1,569.3 476.4 175.6 145.0 666.7 127.6 4,239.3 0.9%
Style 1,966.2 4,037.7 549.0 543.5 413.5 575.9 0.0 8,085.7 1.8%
Strategy 6,920.3 8,231.1 9,890.1 9,212.5 8.4 539.5 4,285.6 39,087.6 8.7%
Thematic 1,028.8 1,422.6 293.4 241.1 153.8 517.3 0.0 3,657.0 0.8%
Total 76,204 95,483 42,941 32,156 11,077 25,653 6,669 290,182.0 64.5%
Fixed Income
Overall 471.7 1,694.0 12.2 132.3 246.7 206.6 29.5 2,793.1 0.6%
Corporates 2,781.7 31,065.4 5,869.5 3,357.2 1,215.2 1,244.0 0.0 45,532.9 10.1%
Covered Bonds 366.2 287.2 70.9 76.9 23.2 16.6 0.0 841.0 0.2%
Credit Exposure 196.0 0.0 0.0 39.6 0.0 1.5 0.0 237.1 0.1%
Sovereign 5,592.2 31,672.0 14,611.2 5,189.9 964.3 2,554.5 0.0 60,584.1 13.5%
Money Market 716.3 1,644.3 653.2 1,017.2 0.0 20.1 0.0 4,051.1 0.9%
Total 10,124 66,363 21,217 9,813 2,449 4,043 30 114,039.3 25.3%
Commodity 0.0%
Overall 383.3 1,194.4 150.0 182.2 25.1 461.3 66.8 2,463.2 0.5%
Agriculture 86.2 391.4 4.3 441.9 0.3 14.9 0.0 938.9 0.2%
Energy 976.4 4,997.2 157.5 7,083.8 0.0 103.4 0.0 13,318.3 3.0%
Industrial Metals 43.0 574.4 12.0 152.9 0.0 3.5 0.0 785.7 0.2%
Precious Metals 2,633.0 16,942.4 167.3 2,272.5 165.9 3,835.0 0.0 26,016.0 5.8%
Livestock 2.5 10.4 0.0 4.6 0.0 0.0 0.0 17.5 0.0%
Total 4,124 24,110 491 10,138 191 4,418 67 43,539.6 9.7%
Other 0.0%
Alternative 123.6 493.5 3.8 96.6 24.9 48.4 0.0 790.8 0.2%
Currency 36.9 597.6 0.0 668.7 4.5 0.0 0.0 1,307.6 0.3%
Multi Asset 52.7 29.0 0.0 23.7 15.8 1.1 0.0 122.3 0.0%
Total 213 1,120 4 789 45 50 - 2,220.8 0.5%
Grand Total 90,665 187,076 64,653 52,896 13,762 34,164 6,765 449,982 100%
* Total turnover year to date (not daily average)
Total
Total Turnover (€ million)
Source: Deutsche Bank, Bloomberg Finance LP, Reuters.
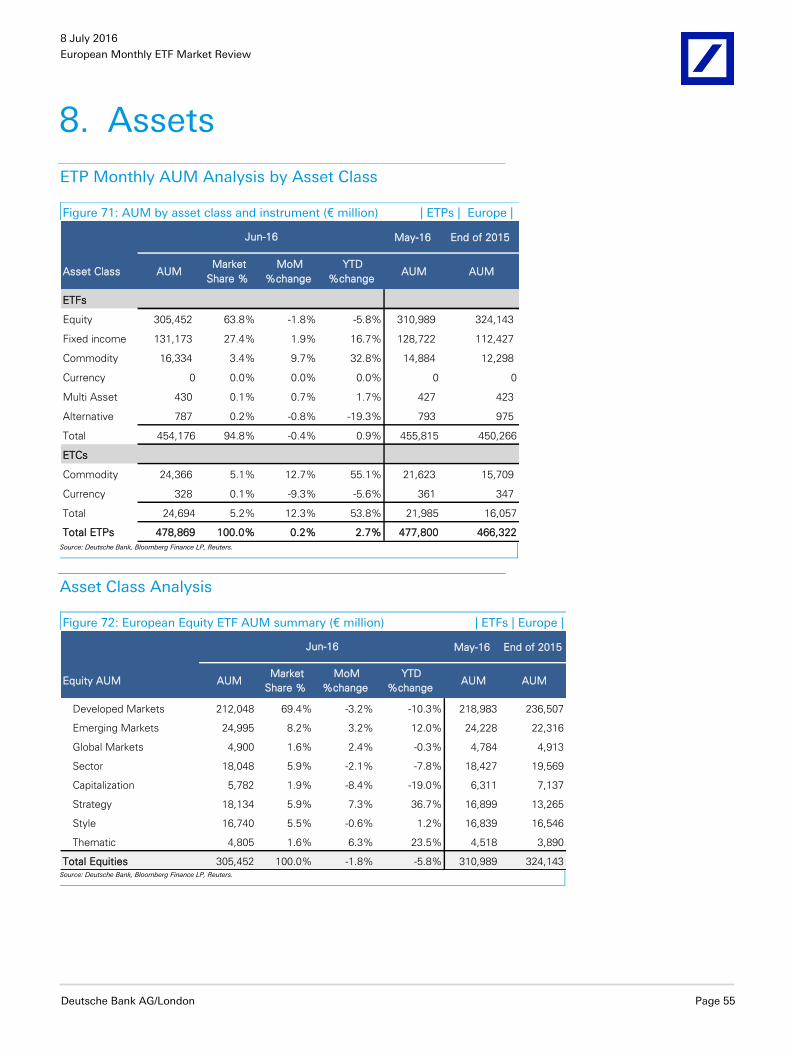
8 July 2016
European Monthly ETF Market Review
Deutsche Bank AG/London Page 55
8. Assets
ETP Monthly AUM Analysis by Asset Class
Figure 71: AUM by asset class and instrument (€ million) | ETPs | Europe |
May-16 End of 2015
Asset Class AUM Market
Share %
MoM
%change
YTD
%change AUM AUM
ETFs
Equity 305,452 63.8% -1.8% -5.8% 310,989 324,143
Fixed income 131,173 27.4% 1.9% 16.7% 128,722 112,427
Commodity 16,334 3.4% 9.7% 32.8% 14,884 12,298
Currency 0 0.0% 0.0% 0.0% 0 0
Multi Asset 430 0.1% 0.7% 1.7% 427 423
Alternative 787 0.2% -0.8% -19.3% 793 975
Total 454,176 94.8% -0.4% 0.9% 455,815 450,266
ETCs
Commodity 24,366 5.1% 12.7% 55.1% 21,623 15,709
Currency 328 0.1% -9.3% -5.6% 361 347
Total 24,694 5.2% 12.3% 53.8% 21,985 16,057
Total ETPs 478,869 100.0% 0.2% 2.7% 477,800 466,322
Jun-16
Source: Deutsche Bank, Bloomberg Finance LP, Reuters.
Asset Class Analysis
Figure 72: European Equity ETF AUM summary (€ million) | ETFs | Europe |
May-16 End of 2015
Equity AUM AUM Market
Share %
MoM
%change
YTD
%change AUM AUM
Developed Markets 212,048 69.4% -3.2% -10.3% 218,983 236,507
Emerging Markets 24,995 8.2% 3.2% 12.0% 24,228 22,316
Global Markets 4,900 1.6% 2.4% -0.3% 4,784 4,913
Sector 18,048 5.9% -2.1% -7.8% 18,427 19,569
Capitalization 5,782 1.9% -8.4% -19.0% 6,311 7,137
Strategy 18,134 5.9% 7.3% 36.7% 16,899 13,265
Style 16,740 5.5% -0.6% 1.2% 16,839 16,546
Thematic 4,805 1.6% 6.3% 23.5% 4,518 3,890
Total Equities 305,452 100.0% -1.8% -5.8% 310,989 324,143
Jun-16
Source: Deutsche Bank, Bloomberg Finance LP, Reuters.

8 July 2016
European Monthly ETF Market Review
Page 56 Deutsche Bank AG/London
Figure 72A: European Equity ETF AUM summary - A (€ million) | ETFs | Europe |
May-16 End of 2015
Equity AUM AUM Market
Share %
MoM
%change
YTD
%change AUM AUM
Sector 18,048 28.4% -2.1% -7.8% 18,427 19,569
Consumer discretionary 832 1.3% -6.0% -6.5% 885 890
Consumer staples 856 1.3% -2.1% -13.2% 874 986
Energy 1,720 2.7% 4.0% 13.0% 1,654 1,522
Financials 8,795 13.8% -3.8% -14.6% 9,141 10,303
Healthcare 2,051 3.2% 4.6% 1.5% 1,961 2,020
Industrials 541 0.9% 1.1% 1.4% 535 534
Information Technology 1,278 2.0% -5.0% -9.4% 1,344 1,410
Materials 800 1.3% 0.5% 19.7% 796 669
Telecommunications 708 1.1% -8.2% -10.0% 771 787
Utilities 466 0.7% 0.3% 4.1% 465 448
Capitalization 5,782 9.1% -8.4% -19.0% 6,311 7,137
Large Cap 343 0.5% -4.3% -9.6% 358 379
Mid Cap 1,745 2.7% -11.4% -26.6% 1,970 2,376
Small Cap 3,695 5.8% -7.2% -15.7% 3,983 4,381
Strategy 18,134 28.6% 7.3% 36.7% 16,899 13,265
Fundamental 1,499 2.4% -1.4% -2.7% 1,520 1,541
Leveraged Long 1,699 2.7% -10.0% -22.2% 1,887 2,183
Leveraged Short 1,148 1.8% 11.9% 43.7% 1,026 799
Options Strategy 0 0.0% 0.0% 0.0% 0 0
Quantitative 12,000 18.9% 11.5% 63.7% 10,764 7,330
Short 1,788 2.8% 5.1% 26.6% 1,701 1,412
Style 16,740 26.4% -0.6% 1.2% 16,839 16,546
Dividend 15,248 24.0% -0.1% 2.4% 15,265 14,893
Growth 191 0.3% -9.7% -36.5% 211 300
Value 1,301 2.0% -4.6% -3.9% 1,363 1,353
Thematic 4,805 7.6% 6.3% 23.5% 4,518 3,890
Commodities 1,240 2.0% 16.4% 83.6% 1,065 675
Cyclical 0 0.0% 0.0% 0.0% 0 0
Faith 197 0.3% 1.6% 4.6% 194 189
Other Theme 942 1.5% 2.2% 8.6% 921 867
Sustainability 2,426 3.8% 3.8% 12.4% 2,337 2,159
Total 63,508 100.0% 0.8% 5.1% 62,995 60,406
Jun-16
Source: Deutsche Bank, Bloomberg Finance LP, Reuters.

8 July 2016
European Monthly ETF Market Review
Deutsche Bank AG/London Page 57
Figure 72B: European Equity ETF AUM summary - B (€ million) | ETFs | Europe |
May-16 End of 2015
Equity AUM AUM Market
Share %
MoM
%change
YTD
%change AUM AUM
Developed Markets
Europe 111,710 52.7% -5.7% -15.9% 118,408 132,765
Austria 214 0.1% -11.5% -46.2% 241 397
Belgium 44 0.0% 6.7% 2.1% 42 43
Finland 171 0.1% -1.3% -4.0% 174 178
France 4,471 2.1% -6.9% -11.2% 4,801 5,037
Germany 17,948 8.5% -5.2% -16.8% 18,939 21,561
Greece 143 0.1% -17.4% -27.4% 173 197
Ireland 26 0.0% -13.7% -17.3% 30 31
Italy 1,818 0.9% -13.2% -38.7% 2,096 2,964
Netherlands 590 0.3% 0.3% -9.1% 588 649
Norway 252 0.1% -2.1% 13.6% 258 222
Portugal 65 0.0% -10.1% -14.7% 72 76
Spain 1,205 0.6% -11.3% -28.9% 1,359 1,696
Sweden 1,058 0.5% -6.3% -24.7% 1,129 1,405
Switzerland 9,627 4.5% 0.2% -6.5% 9,609 10,297
UK 13,648 6.4% -3.4% 4.0% 14,132 13,129
Europe broad 60,429 28.5% -6.7% -19.3% 64,767 74,881
Americas 63,462 29.9% 1.4% 3.3% 62,614 61,445
US 60,516 28.5% 1.1% 3.2% 59,859 58,657
Canada 1,034 0.5% 2.0% 33.9% 1,014 772
North America 1,913 0.9% 9.9% -5.1% 1,741 2,016
Asia 16,671 7.9% -6.8% -27.4% 17,878 22,962
Australia 680 0.3% -1.9% -14.4% 694 795
Hong Kong 155 0.1% 0.0% -41.0% 155 262
Japan 14,178 6.7% -8.2% -30.5% 15,449 20,400
Singapore 41 0.0% 10.4% -34.1% 38 63
Asia Pacific broad 1,617 0.8% 4.7% 12.1% 1,544 1,442
EMEA 4 0.0% -3.1% 0.0% 5 0
Israel 4 0.0% -3.1% 0.0% 5 0
Global 20,200 9.5% 0.6% 4.5% 20,078 19,335
Broad indices 20,200 9.5% 0.6% 4.5% 20,078 19,335
DM Total 212,048 100.0% -3.2% -10.3% 218,979 236,507
Jun-16
Source: Deutsche Bank, Bloomberg Finance LP, Reuters.

8 July 2016
European Monthly ETF Market Review
Page 58 Deutsche Bank AG/London
Figure 72C: European Equity ETF AUM summary - C (€ million) | ETFs | Europe |
May-16 End of 2015
Equity AUM AUM Market
Share %
MoM
%change
YTD
%change AUM AUM
Emerging Markets
BRIC 5,271 2.2% -1.4% -11.5% 5,347 5,953
Brazil 651 0.3% 9.6% 24.2% 594 524
Russia 728 0.3% -4.6% 7.0% 763 680
India 1,652 0.7% 0.1% -8.6% 1,650 1,807
China 2,240 0.9% -4.2% -23.9% 2,339 2,941
Latin America 709 0.3% 3.4% 33.4% 686 532
Chile 0 0.0% 0.0% 0.0% 0 0
Mexico 141 0.1% -3.1% -6.9% 145 151
LATAM broad 569 0.2% 5.2% 49.4% 541 381
Asia 3,457 1.5% 2.7% 2.5% 3,365 3,373
Bangladesh 19 0.0% 4.9% -5.1% 18 20
Indonesia 136 0.1% 8.7% 14.8% 125 119
Malaysia 49 0.0% -18.5% -0.3% 61 50
Pakistan 23 0.0% 12.6% 10.5% 20 21
Philippines 61 0.0% 19.2% 54.4% 51 39
South Korea 678 0.3% 2.1% -16.8% 664 815
Taiwan 436 0.2% 4.6% -22.6% 417 563
Thailand 41 0.0% 2.0% 41.7% 40 29
Vietnam 307 0.1% 1.3% -5.8% 303 325
Asia Pacific broad 1,706 0.7% 2.4% 22.6% 1,665 1,392
EMEA 871 0.4% -2.4% -0.5% 892 875
Kuwait 5 0.0% -1.9% -30.0% 5 7
Poland 48 0.0% 0.3% -24.0% 48 64
South Africa 89 0.0% 24.1% 29.7% 72 69
Turkey 240 0.1% -2.0% -15.5% 245 284
Europe broad 325 0.1% -13.2% 1.7% 374 319
Middle East & Africa 163 0.1% 10.6% 23.4% 148 133
Global Markets 14,687 6.2% 5.4% 26.8% 13,938 11,583
Global 14,687 6.2% 5.4% 26.8% 13,938 11,583
EM Total 24,995 10.5% 3.2% 12.0% 24,228 22,316
Total (EM + DM) 237,043 100.0% -2.5% -8.4% 243,206 258,823
Jun-16
Source: Deutsche Bank, Bloomberg Finance LP, Reuters.

8 July 2016
European Monthly ETF Market Review
Deutsche Bank AG/London Page 59
Figure 73: European Fixed Income ETF AUM summary (€ million) | ETFs | Europe |
May-16 End of 2015
Fixed Income AUM AUM Market
Share %
MoM
%change
YTD
%change AUM AUM
Overall 9,231 7.0% 1.6% 15.6% 9,083 7,984
Corporates 54,284 41.4% 2.3% 25.3% 53,054 43,316
Covered Bonds 3,384 2.6% 0.6% 11.0% 3,364 3,050
Credit Exposure 448 0.3% 35.8% 59.2% 330 282
Sovereign 61,105 46.6% 1.5% 11.4% 60,177 54,854
Money Market 2,721 2.1% 0.3% -7.5% 2,713 2,941
Total Fixed Income 131,173 100.0% 1.9% 16.7% 128,722 112,427
Jun-16
Source: Deutsche Bank, Bloomberg Finance LP, Reuters.

8 July 2016
European Monthly ETF Market Review
Page 60 Deutsche Bank AG/London
Figure 74:European Commodity ETP AUM summary (€ million)| ETPs | Europe |
May-16 End of 2015
Commodity AUM AUM Market
Share %
MoM
%change
YTD
%change AUM AUM
Overall 4,913 12.1% 5.2% 33.9% 4,668 3,668
Overall 4712 11.6% 5.3% 36.7% 4476 3446
Overall ex Energy 195 0.5% 5.0% -9.5% 185 215
Overall Light Energy 6 0.0% -4.6% -3.8% 7 6
Overall Ultra Light Energy 0 0.0% 0.0% 0.0% 0 0
Agriculture 717 1.8% -2.1% -8.8% 733 787
Overall 401 1.0% -4.0% -8.3% 417 437
Cocoa 13 0.0% -2.2% 0.4% 13 13
Coffee 81 0.2% 15.0% -2.2% 71 83
Corn 33 0.1% -17.9% -8.5% 40 36
Cotton 10 0.0% -1.3% -67.3% 10 31
Grains 29 0.1% -2.1% -6.9% 30 32
Softs 4 0.0% 14.3% -13.5% 4 5
Soybean Oil 3 0.0% -4.1% 10.3% 4 3
Soybeans 10 0.0% 1.7% 1.0% 10 10
Sugar 40 0.1% -1.2% -14.1% 41 47
Wheat 92 0.2% -1.6% 1.8% 94 91
Energy 2,542 6.2% -4.2% 14.9% 2,654 2,213
Overall 205 0.5% 0.8% 23.0% 203 166
Carbon 1 0.0% -26.8% -44.5% 1 1
Crude Oil 2183 5.4% -5.6% 15.9% 2314 1883
Gasoline 7 0.0% -11.1% -35.4% 8 11
Heating Oil 5 0.0% 41.9% 6.4% 4 5
Natural Gas 141 0.3% 13.5% -3.0% 124 145
Electricity 0 0.0% 0.0% 0.0% 0 0
Uranium 0 0.0% 0.0% 0.0% 0 0
Industrial Metals 494 1.2% 9.3% 5.7% 452 467
Overall 164 0.4% 33.3% 5.5% 123 156
Aluminium 63 0.2% -17.9% -23.8% 77 83
Copper 144 0.4% 0.9% 22.8% 143 118
Lead 2 0.0% 5.8% -17.1% 2 2
Nickel 100 0.2% 13.5% 11.2% 88 90
Tin 4 0.0% 21.6% 29.7% 4 3
Zinc 15 0.0% 3.9% 3.0% 15 15
Precious Metals 32,023 78.7% 14.4% 53.5% 27,989 20,859
Overall 163 0.4% 13.4% 42.7% 143 114
Gold 27650 67.9% 14.0% 57.1% 24254 17603
Palladium 500 1.2% 10.0% 2.3% 454 489
Platinum 839 2.1% 4.4% 18.9% 803 705
Rhodium 33 0.1% -2.0% -41.8% 33 56
Silver 2840 7.0% 23.4% 50.1% 2301 1892
Livestock 10 0.0% -11.5% -28.6% 11 14
Overall 3 0.0% -5.1% -43.5% 4 6
Cattle 2 0.0% 2.8% 11.9% 2 2
Lean Hogs 4 0.0% -21.0% -27.4% 6 6
Total 40,699 100.0% 11.5% 45.3% 36,507 28,007
Jun-16
Source: Deutsche Bank, Bloomberg Finance LP, Reuters.

8 July 2016
European Monthly ETF Market Review
Deutsche Bank AG/London Page 61
Product Rankings
Figure 75: Top 20 Products by AUM – Equity ETFs (€ million) | ETFs | Europe |
ETF Name BBG Ticker Issuer
Invest.
Strategy
Current Month
AUM
Prev. Month
AUM 2015 AUM
iShares Core S&P 500 UCITS ETF CSSPX SW BlackRock Beta 13,515.9 12,989.7 11,936.4
Vanguard S&P 500 ETF VUSA LN Vanguard Beta 12,033.2 11,571.2 11,503.5
iShares Core DAX UCITS ETF DE DAXEX GR BlackRock Beta 7,702.0 8,081.1 9,433.1
iShares S&P 500 UCITS ETF (Inc) IUSA LN BlackRock Beta 7,520.8 7,779.9 8,688.2
Lyxor UCITS ETF Euro STOXX 50 MSE FP Lyxor Beta 6,790.1 7,312.9 7,522.2
iShares Core MSCI World UCITS ETF (Acc) SWDA LN BlackRock Beta 5,826.8 5,843.8 4,832.1
iShares Euro STOXX 50 (DE) SX5EEX GR BlackRock Beta 5,770.0 6,079.4 7,872.2
iShares EURO STOXX 50 UCITS ETF (Inc) EUNE SW BlackRock Beta 5,124.5 5,424.7 6,258.4
iShares MSCI Europe UCITS ETF (Inc) IMEU LN BlackRock Beta 5,059.0 5,560.4 5,957.6
iShares MSCI World UCITS ETF (Inc) IWRD LN BlackRock Beta 5,019.1 5,123.6 5,517.9
iShares STOXX 600 (DE) SXXPIEX GR BlackRock Beta 4,930.4 5,578.5 6,193.4
db x-trackers Euro Stoxx 50® UCITS ETF (DR) - 1D XESX GR Deutsche AWM Beta 4,830.9 5,108.6 5,536.2
iShares FTSE 100 UCITS ETF (Inc) ISF LN BlackRock Beta 4,722.5 4,933.7 4,986.1
db x-trackers DAX® UCITS ETF (DR) 1C XDAX GR Deutsche AWM Beta 3,896.7 4,180.0 5,275.4
iShares MSCI Emerging Markets UCITS ETF (Inc) IEEM LN BlackRock Beta 3,610.7 3,532.4 3,324.6
Lyxor UCITS ETF CAC 40 (DR) -D-EUR CAC FP Lyxor Beta 3,494.6 3,711.0 4,009.1
db x-trackers S&P 500 UCITS ETF 1C D5BM GR Deutsche AWM Beta 2,793.6 2,769.4 2,046.7
db x-trackers MSCI Europe Index UCITS ETF (DR) XMEU GR Deutsche AWM Beta 2,791.4 2,924.9 3,017.9
iShares Developed Markets Property Yield UCITS ETF IWDP LN BlackRock Beta 2,693.8 2,597.1 2,837.9
Vanguard FTSE 100 ETF VUKE LN Vanguard Beta 2,599.8 2,706.4 2,463.2 Source: Deutsche Bank, Bloomberg Finance LP, Reuters.
Figure 76: Top 20 Products by AUM – Fixed Income ETFs (€ million) | ETFs | Europe |
ETF Name BBG Ticker Issuer
Invest.
Strategy
Current Month
AUM
Prev. Month
AUM 2015 AUM
iShares Euro Corporate Bond UCITS ETF IEBC LN BlackRock Beta 7,129.2 6,969.9 6,385.3
iShares Euro Corporate Bond Large Cap UCITS ETF IBCS GR BlackRock Beta 5,561.7 5,277.6 4,002.7
iShares Euro High Yield Corporate Bond UCITS ETF IHYG LN BlackRock Beta 5,237.3 5,533.9 4,026.4
iShares J.P. Morgan $ Emerging Markets Bond UCITS ETF SEMB LN BlackRock Beta 4,801.0 4,398.0 3,758.0
iShares $ Corporate Bond UCITS ETF LQDE LN BlackRock Beta 4,763.9 4,589.6 3,449.8
iShares $ High Yield Corporate Bond UCITS ETF SHYU LN BlackRock Beta 3,010.8 3,163.6 2,689.8
iShares Euro Corporate Bond 1-5yr UCITS ETF SE15 LN BlackRock Beta 2,853.3 2,543.9 2,329.8
iShares Emerging Markets Local Government Bond UCITS ETF SEML LN Blackrock Beta 2,598.3 2,439.4 1,701.7
iShares $ TIPS UCITS ETF IDTP LN BlackRock Beta 2,482.5 2,210.7 1,630.5
iShares $ Treasury Bond 1-3yr UCITS ETF IBTS LN BlackRock Beta 2,315.9 2,154.4 1,627.2
PIMCO Euro Short Maturity Source UCITS ETF PJS1 GR Source Alpha 2,269.3 2,420.1 2,456.8
iShares Euro Aggregate Bond UCITS ETF SEAG LN BlackRock Beta 2,107.8 1,992.1 1,952.5
iShares Euro Corporate Bond ex-Financials UCITS ETF EEXF LN BlackRock Beta 2,082.7 2,156.5 1,734.9
iShares $ Treasury Bond 7-10yr UCITS ETF IDTM LN BlackRock Beta 2,036.6 1,966.5 1,725.7
iShares UK Gilts UCITS ETF IGLT LN BlackRock Beta 1,849.6 2,002.4 1,779.5
iShares £ Corporate Bond UCITS ETF SLXX LN BlackRock Beta 1,765.8 2,129.1 1,982.0
db x-trackers II iBoxx Euro Sovereigns Eurozone Yield Plus Index UCITS ETF XY4P GR Deutsche AWM Beta 1,728.0 1,793.7 2,308.4
iShares Euro Government Bond 3-5yr UCITS ETF IEGX LN BlackRock Beta 1,708.6 1,710.6 1,371.1
iShares Euro Corporate Bond ex-Financials 1-5yr UCITS ETF EEX5 LN BlackRock Beta 1,690.0 1,601.4 1,391.6
db x-trackers II iBoxx Euro Sovereigns Eurozone UCITS ETF XGLE GR Deutsche AWM Beta 1,651.0 1,633.9 1,407.8 Source: Deutsche Bank, Bloomberg Finance LP, Reuters.

8 July 2016
European Monthly ETF Market Review
Page 62 Deutsche Bank AG/London
Figure 77: Top 20 Products by AUM – Commodity ETPs (€ million) | ETPs | Europe |
ETP Name BBG Ticker Issuer
Invest.
Strategy
Current Month
AUM
Prev. Month
AUM 2015 AUM
ZKB Gold ETF ZGLD SW Zuercher Kantonalbank Beta 5,428.1 4,869.5 4,148.5
ETFS Physical Gold PHAU LN ETF Securities Beta 4,849.7 4,244.3 3,232.5
Gold Bullion Securities GBS LN ETF Securities Beta 3,641.7 3,389.3 2,150.5
Source Physical Gold ETC (P-ETC) SGLD LN Source Beta 3,247.8 2,711.5 1,508.2
XETRA-Gold XAUEUR Deutsche Borse Commodities GmbH Beta 1,920.2 1,761.0 1,578.8
Julius Baer Physical Gold Fund - A (USD listing) JBGOUA SW Julius Baer Inv Beta 1,761.7 1,566.1 1,347.2
iShares Physical Gold ETC SGLN LN Blackrock Beta 1,581.8 1,046.7 374.4
ZKB Silver ETF ZSIL SW Zuercher Kantonalbank Beta 1,201.6 1,015.3 913.9
db Physical Gold Euro Hedged ETC XAD1 GR Deutsche AWM Beta 889.3 807.4 388.4
UBS-IS Gold (CHF) Hedged ETF A AUCHAH SW UBS Beta 859.2 798.7 491.0
iShares Diversified Commodity Swap UCITS ETF DE DJCOMEX GR BlackRock Beta 838.7 809.9 622.8
Lyxor ETF Commodities CRB CRB FP Lyxor Beta 807.5 811.7 713.2
ETFS Physical Silver PHAG LN ETF Securities Beta 806.0 651.1 505.9
ETFS WTI Crude Oil CRUD LN ETF Securities Beta 640.3 687.4 594.8
db Physical Gold ETC XGLD LN Deutsche AWM Beta 610.8 559.5 431.0
UBS ETFs plc – CMCI Composite SF UCITS ETF (USD) A-acc CCUSAS SW UBS Beta 598.8 535.9 423.7
db Physical Gold ETC (EUR) XAD5 GR Deutsche AWM Beta 523.5 426.1 357.1
ETFS Longer Dated All Commodities GO UCITS ETF COMF LN ETF Securities Beta 459.5 407.7 219.7
ETFS Physical Swiss Gold SGBS LN ETF Securities Beta 415.4 378.4 245.2
UBS ETF (CH) – Gold (USD) I-dis AUUSI SW UBS Beta 412.7 386.1 262.5 Source: Deutsche Bank, Bloomberg Finance LP, Reuters.
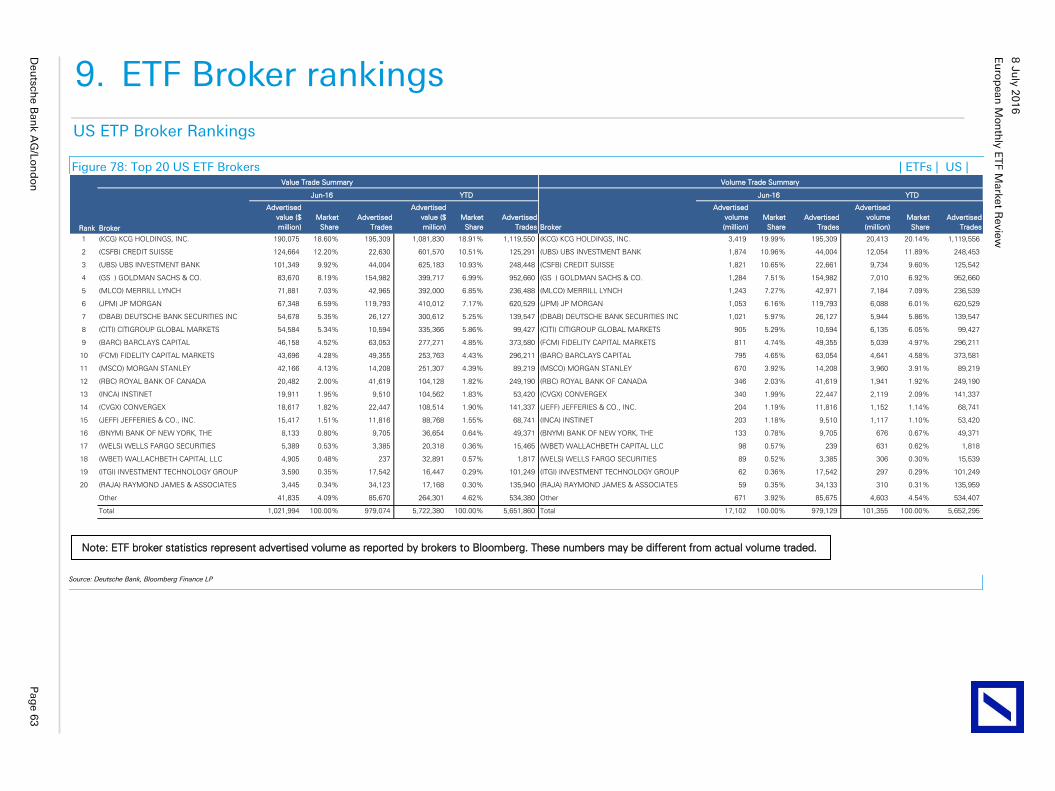
Eu
rop
ean
Mon
thly
ETF M
ark
et R
evie
w
8 J
uly
201
6
Deu
tsch
e B
an
k A
G/L
on
do
n
Pag
e 6
3
9. ETF Broker rankings
US ETP Broker Rankings
Figure 78: Top 20 US ETF Brokers | ETFs | US |
Rank Broker
Advertised
value ($
million)
Market
Share
Advertised
Trades
Advertised
value ($
million)
Market
Share
Advertised
Trades Broker
Advertised
volume
(million)
Market
Share
Advertised
Trades
Advertised
volume
(million)
Market
Share
Advertised
Trades
1 (KCG) KCG HOLDINGS, INC. 190,075 18.60% 195,309 1,081,830 18.91% 1,119,550 (KCG) KCG HOLDINGS, INC. 3,419 19.99% 195,309 20,413 20.14% 1,119,556
2 (CSFB) CREDIT SUISSE 124,664 12.20% 22,630 601,570 10.51% 125,291 (UBS) UBS INVESTMENT BANK 1,874 10.96% 44,004 12,054 11.89% 248,453
3 (UBS) UBS INVESTMENT BANK 101,349 9.92% 44,004 625,183 10.93% 248,448 (CSFB) CREDIT SUISSE 1,821 10.65% 22,661 9,734 9.60% 125,542
4 (GS ) GOLDMAN SACHS & CO. 83,670 8.19% 154,982 399,717 6.99% 952,660 (GS ) GOLDMAN SACHS & CO. 1,284 7.51% 154,982 7,010 6.92% 952,660
5 (MLCO) MERRILL LYNCH 71,881 7.03% 42,965 392,000 6.85% 236,488 (MLCO) MERRILL LYNCH 1,243 7.27% 42,971 7,184 7.09% 236,539
6 (JPM) JP MORGAN 67,348 6.59% 119,793 410,012 7.17% 620,529 (JPM) JP MORGAN 1,053 6.16% 119,793 6,088 6.01% 620,529
7 (DBAB) DEUTSCHE BANK SECURITIES INC 54,678 5.35% 26,127 300,612 5.25% 139,547 (DBAB) DEUTSCHE BANK SECURITIES INC 1,021 5.97% 26,127 5,944 5.86% 139,547
8 (CITI) CITIGROUP GLOBAL MARKETS 54,584 5.34% 10,594 335,366 5.86% 99,427 (CITI) CITIGROUP GLOBAL MARKETS 905 5.29% 10,594 6,135 6.05% 99,427
9 (BARC) BARCLAYS CAPITAL 46,158 4.52% 63,053 277,271 4.85% 373,580 (FCM) FIDELITY CAPITAL MARKETS 811 4.74% 49,355 5,039 4.97% 296,211
10 (FCM) FIDELITY CAPITAL MARKETS 43,696 4.28% 49,355 253,763 4.43% 296,211 (BARC) BARCLAYS CAPITAL 795 4.65% 63,054 4,641 4.58% 373,581
11 (MSCO) MORGAN STANLEY 42,166 4.13% 14,208 251,307 4.39% 89,219 (MSCO) MORGAN STANLEY 670 3.92% 14,208 3,960 3.91% 89,219
12 (RBC) ROYAL BANK OF CANADA 20,482 2.00% 41,619 104,128 1.82% 249,190 (RBC) ROYAL BANK OF CANADA 346 2.03% 41,619 1,941 1.92% 249,190
13 (INCA) INSTINET 19,911 1.95% 9,510 104,562 1.83% 53,420 (CVGX) CONVERGEX 340 1.99% 22,447 2,119 2.09% 141,337
14 (CVGX) CONVERGEX 18,617 1.82% 22,447 108,514 1.90% 141,337 (JEFF) JEFFERIES & CO., INC. 204 1.19% 11,816 1,152 1.14% 68,741
15 (JEFF) JEFFERIES & CO., INC. 15,417 1.51% 11,816 88,768 1.55% 68,741 (INCA) INSTINET 203 1.18% 9,510 1,117 1.10% 53,420
16 (BNYM) BANK OF NEW YORK, THE 8,133 0.80% 9,705 36,654 0.64% 49,371 (BNYM) BANK OF NEW YORK, THE 133 0.78% 9,705 676 0.67% 49,371
17 (WELS) WELLS FARGO SECURITIES 5,389 0.53% 3,385 20,318 0.36% 15,465 (WBET) WALLACHBETH CAPITAL LLC 98 0.57% 239 631 0.62% 1,818
18 (WBET) WALLACHBETH CAPITAL LLC 4,905 0.48% 237 32,891 0.57% 1,817 (WELS) WELLS FARGO SECURITIES 89 0.52% 3,385 306 0.30% 15,539
19 (ITGI) INVESTMENT TECHNOLOGY GROUP 3,590 0.35% 17,542 16,447 0.29% 101,249 (ITGI) INVESTMENT TECHNOLOGY GROUP 62 0.36% 17,542 297 0.29% 101,249
20 (RAJA) RAYMOND JAMES & ASSOCIATES 3,445 0.34% 34,123 17,168 0.30% 135,940 (RAJA) RAYMOND JAMES & ASSOCIATES 59 0.35% 34,133 310 0.31% 135,959
Other 41,835 4.09% 85,670 264,301 4.62% 534,380 Other 671 3.92% 85,675 4,603 4.54% 534,407
Total 1,021,994 100.00% 979,074 5,722,380 100.00% 5,651,860 Total 17,102 100.00% 979,129 101,355 100.00% 5,652,295
Value Trade Summary Volume Trade Summary
Jun-16 YTD Jun-16 YTD
Source: Deutsche Bank, Bloomberg Finance LP
Note: ETF broker statistics represent advertised volume as reported by brokers to Bloomberg. These numbers may be different from actual volume traded.

Eu
rop
ean
Mon
thly
ETF M
ark
et R
evie
w
8 J
uly
201
6
Pag
e 6
4
Deu
tsch
e B
an
k A
G/L
on
do
n
Figure 79: Top 20 US ETV Brokers | ETVs | US |
Rank Broker
Advertised
value ($
million)
Market
Share
Advertised
Trades
Advertised
value ($
million)
Market
Share
Advertised
Trades Broker
Advertised
volume
(million)
Market
Share
Advertised
Trades
Advertised
volume
(million)
Market
Share
Advertised
Trades
1 (KCG) KCG HOLDINGS, INC. 14,412 28.12% 18,346 69,143 26.14% 99,046 (KCG) KCG HOLDINGS, INC. 627 32.81% 18,346 2,868 26.89% 99,046
2 (UBS) UBS INVESTMENT BANK 8,067 15.74% 2,405 42,463 16.05% 13,438 (UBS) UBS INVESTMENT BANK 287 15.04% 2,405 1,866 17.50% 13,438
3 (CSFB) CREDIT SUISSE 5,478 10.69% 1,133 23,674 8.95% 6,500 (FCM) FIDELITY CAPITAL MARKETS 202 10.60% 5,617 849 7.96% 31,865
4 (FCM) FIDELITY CAPITAL MARKETS 3,605 7.03% 5,617 17,293 6.54% 31,865 (CSFB) CREDIT SUISSE 164 8.59% 1,135 797 7.47% 6,508
5 (CITI) CITIGROUP GLOBAL MARKETS 2,743 5.35% 894 23,238 8.79% 5,823 (CITI) CITIGROUP GLOBAL MARKETS 90 4.69% 894 796 7.47% 5,823
6 (JPM) JP MORGAN 2,673 5.21% 7,527 14,133 5.34% 38,363 (MLCO) MERRILL LYNCH 74 3.87% 2,001 477 4.48% 10,890
7 (GS ) GOLDMAN SACHS & CO. 2,122 4.14% 12,459 12,001 4.54% 71,139 (BARC) BARCLAYS CAPITAL 60 3.14% 5,424 361 3.38% 29,994
8 (MLCO) MERRILL LYNCH 2,006 3.91% 2,001 11,647 4.40% 10,888 (DBAB) DEUTSCHE BANK SECURITIES INC 59 3.09% 1,263 344 3.22% 6,472
9 (BARC) BARCLAYS CAPITAL 1,835 3.58% 5,424 8,256 3.12% 29,994 (JPM) JP MORGAN 58 3.05% 7,527 441 4.14% 38,363
10 (DBAB) DEUTSCHE BANK SECURITIES INC 1,589 3.10% 1,263 8,956 3.39% 6,472 (GS ) GOLDMAN SACHS & CO. 55 2.88% 12,459 403 3.78% 71,139
11 (RBC) ROYAL BANK OF CANADA 1,046 2.04% 3,144 4,685 1.77% 16,370 (RBC) ROYAL BANK OF CANADA 44 2.29% 3,144 264 2.48% 16,370
12 (CVGX) CONVERGEX 963 1.88% 1,296 5,595 2.12% 8,029 (MSCO) MORGAN STANLEY 43 2.23% 666 311 2.92% 4,559
13 (MSCO) MORGAN STANLEY 914 1.78% 666 6,347 2.40% 4,559 (CVGX) CONVERGEX 38 2.00% 1,296 237 2.22% 8,029
14 (JEFF) JEFFERIES & CO., INC. 679 1.32% 504 1,652 0.62% 2,161 (ITGI) INVESTMENT TECHNOLOGY GROUP 21 1.11% 1,690 99 0.93% 9,174
15 (INCA) INSTINET 480 0.94% 402 1,922 0.73% 2,484 (INCA) INSTINET 14 0.71% 402 77 0.73% 2,484
16 (BTIG) BTIG LLC 379 0.74% 79 1,073 0.41% 456 (JEFF) JEFFERIES & CO., INC. 9 0.47% 504 39 0.36% 2,161
17 (ITGI) INVESTMENT TECHNOLOGY GROUP 303 0.59% 1,690 2,540 0.96% 9,174 (BMOC) BMO CAPITAL MARKETS 9 0.45% 248 40 0.37% 1,247
18 (RAJA) RAYMOND JAMES & ASSOCIATES 186 0.36% 1,661 604 0.23% 5,595 (RAJA) RAYMOND JAMES & ASSOCIATES 6 0.31% 1,661 21 0.20% 5,595
19 (BMOC) BMO CAPITAL MARKETS 185 0.36% 248 797 0.30% 1,247 (BNYM) BANK OF NEW YORK, THE 6 0.31% 376 108 1.01% 2,617
20 (WELS) WELLS FARGO SECURITIES 138 0.27% 113 397 0.15% 509 (HSBC) HSBC GROUP PLC 4 0.22% 337 25 0.23% 1,714
Other 1,452 2.83% 5,598 8,069 3.05% 28,799 Other 41 2.14% 5,080 242 2.27% 25,436
Total 51,256 100.00% 72,470 264,486 100.00% 392,911 Total 1,910 100.00% 72,475 10,666 100.00% 392,924
Value Trade Summary Volume Trade Summary
Jun-16 YTD Jun-16 YTD
Source: Deutsche Bank, Bloomberg Finance LP
Note: ETV broker statistics represent advertised volume as reported by brokers to Bloomberg. These numbers may be different from actual volume traded.

Eu
rop
ean
Mon
thly
ETF M
ark
et R
evie
w
8 J
uly
201
6
Deu
tsch
e B
an
k A
G/L
on
do
n
Pag
e 6
5
European ETP Broker Rankings
Figure 80: Top 20 European ETF brokers | ETFs | Europe |
Rank Broker
Advertised
value (€
million)
Market
Share
Advertised
Trades
Advertised
value (€
million)
Market
Share
Advertised
Trades Broker
Advertised
volume
(million)
Market
Share
Advertised
Trades
Advertised
volume
(million)
Market
Share
Advertised
Trades
1 (CBK) COMMERZBANK 12,456 10.53% 20,850 57,708 10.66% 110,443 (SIS) SUSQUEHANNA INTERNATIONAL GRP 447 10.61% 4,705 1,849 10.40% 22,697
2 (BNPP) BNP PARIBAS 12,096 10.22% 11,843 58,771 10.85% 58,870 (BNPP) BNP PARIBAS 343 8.13% 11,882 1,759 9.90% 59,092
3 (SIS) SUSQUEHANNA INTERNATIONAL GRP 10,994 9.29% 4,687 48,235 8.91% 22,646 (CBK) COMMERZBANK 342 8.10% 20,851 1,573 8.85% 110,728
4 (CSFB) CREDIT SUISSE 8,046 6.80% 3,318 28,915 5.34% 19,077 (CSFB) CREDIT SUISSE 341 8.08% 3,373 994 5.59% 19,351
5 (OPTV) OPTIVER VOF 7,814 6.61% 4,786 7,814 1.44% 4,786 (OPTV) OPTIVER VOF 340 8.06% 4,807 340 1.91% 4,807
6 (FLOW) FLOW TRADERS 7,054 5.96% 4,589 40,605 7.50% 25,349 (FLOW) FLOW TRADERS 255 6.04% 4,785 1,364 7.68% 26,439
7 (CITI) CITIGROUP GLOBAL MARKETS 6,200 5.24% 4,153 39,723 7.34% 20,530 (CITI) CITIGROUP GLOBAL MARKETS 186 4.41% 4,153 871 4.90% 20,532
8 (HSBC) HSBC GROUP PLC 4,964 4.20% 2,611 12,769 2.36% 12,582 (HSBC) HSBC GROUP PLC 167 3.96% 2,614 442 2.48% 12,591
9 (DBK ) DEUTSCHE BANK AG 4,739 4.01% 4,837 25,065 4.63% 26,377 (SG ) SG SECURITIES 156 3.70% 4,569 738 4.15% 25,396
10 (SG ) SG SECURITIES 4,296 3.63% 4,569 21,509 3.97% 25,394 (DBK ) DEUTSCHE BANK AG 152 3.61% 4,848 734 4.13% 26,439
11 (JPMS) JP MORGAN 3,931 3.32% 2,922 18,345 3.39% 15,215 (WINS) WINTERFLOOD SECURITIES 144 3.41% 7,518 624 3.51% 40,767
12 (KEPL) KEPLER CAPITAL MARKETS 3,700 3.13% 2,943 14,525 2.68% 15,460 (KCG) KCG HOLDINGS, INC. 139 3.30% 6,772 781 4.39% 37,855
13 (BARC) BARCLAYS CAPITAL 3,486 2.95% 3,013 19,034 3.52% 19,788 (MLCO) MERRILL LYNCH 107 2.54% 2,954 554 3.12% 18,091
14 (UNIC) UNICREDIT 2,854 2.41% 800 12,881 2.38% 3,828 (BARC) BARCLAYS CAPITAL 106 2.51% 3,013 593 3.33% 19,794
15 (WINS) WINTERFLOOD SECURITIES 2,725 2.30% 7,491 13,056 2.41% 40,616 (KEPL) KEPLER CAPITAL MARKETS 104 2.46% 2,943 413 2.32% 15,471
16 (MSCO) MORGAN STANLEY 2,605 2.20% 1,777 12,782 2.36% 9,660 (UNIC) UNICREDIT 86 2.05% 802 372 2.09% 3,834
17 (KCG) KCG HOLDINGS, INC. 2,316 1.96% 6,771 13,896 2.57% 37,853 (JPMS) JP MORGAN 86 2.03% 2,922 402 2.26% 15,248
18 (MLCO) MERRILL LYNCH 2,278 1.93% 2,954 11,463 2.12% 18,030 (MSCO) MORGAN STANLEY 70 1.66% 1,777 371 2.09% 9,663
19 (BFIN) BLUEFIN EUROPE LLP 2,239 1.89% 305 12,045 2.22% 1,864 (UBS) UBS INVESTMENT BANK 69 1.64% 551 487 2.74% 2,397
20 (UBS) UBS INVESTMENT BANK 1,851 1.57% 551 12,712 2.35% 2,397 (GS ) GOLDMAN SACHS & CO. 52 1.23% 5,209 272 1.53% 28,634
Other 11,658 9.85% 29,894 59,596 11.01% 145,144 Other 525 12.46% 25,002 2,240 12.61% 118,996
Total 118,303 100.00% 125,664 541,449 100.00% 635,909 Total 4,218 100.00% 126,050 17,772 100.00% 638,822
Value Trade Summary Volume Trade Summary
Jun-16 YTD Jun-16 YTD
Source: Deutsche Bank, Bloomberg Finance LP
Note: ETF broker statistics represent advertised volume as reported by brokers to Bloomberg. These numbers may be different from actual volume traded.

Eu
rop
ean
Mon
thly
ETF M
ark
et R
evie
w
8 J
uly
201
6
Pag
e 6
6
Deu
tsch
e B
an
k A
G/L
on
do
n
Figure 81: Top 20 European ETC brokers | ETCs | Europe |
Rank Broker
Advertised
value (€
million)
Market
Share
Advertised
Trades
Advertised
value (€
million)
Market
Share
Advertised
Trades Broker
Advertised
volume
(million)
Market
Share
Advertised
Trades
Advertised
volume
(million)
Market
Share
Advertised
Trades
1 (OPTV) OPTIVER VOF 719 10.94% 749 719 2.68% 749 (OPTV) OPTIVER VOF 116 19.51% 749 116 2.24% 749
2 (WINS) WINTERFLOOD SECURITIES 661 10.06% 2,526 2,326 8.68% 12,581 (WINS) WINTERFLOOD SECURITIES 101 17.06% 2,526 1,495 29.04% 12,581
3 (HSBC) HSBC GROUP PLC 597 9.08% 170 1,854 6.92% 730 (BNPP) BNP PARIBAS 90 15.16% 223 634 12.31% 1,251
4 (CSFB) CREDIT SUISSE 516 7.84% 222 1,645 6.14% 1,033 (BFIN) BLUEFIN EUROPE LLP 43 7.28% 60 126 2.46% 308
5 (FLOW) FLOW TRADERS 408 6.21% 367 1,735 6.48% 1,760 (FLOW) FLOW TRADERS 34 5.78% 385 197 3.83% 1,836
6 (MACQ) MACQUARIE SECURITIES 384 5.83% 100 1,445 5.39% 472 (CITI) CITIGROUP GLOBAL MARKETS 31 5.22% 605 261 5.07% 2,655
7 (CITI) CITIGROUP GLOBAL MARKETS 333 5.06% 605 1,914 7.14% 2,655 (CSFB) CREDIT SUISSE 25 4.14% 222 68 1.33% 1,037
8 (CBK) COMMERZBANK 308 4.69% 588 1,636 6.11% 3,550 (CANT) CANTOR FITZGERALD L.P. 18 3.09% 52 74 1.44% 281
9 (SIS) SUSQUEHANNA INTERNATIONAL GRP 249 3.79% 54 849 3.17% 205 (HSBC) HSBC GROUP PLC 12 2.05% 170 48 0.92% 730
10 (BNPP) BNP PARIBAS 233 3.54% 220 1,325 4.95% 1,218 (SIS) SUSQUEHANNA INTERNATIONAL GRP 12 1.99% 54 109 2.12% 205
11 (SG ) SG SECURITIES 204 3.10% 147 801 2.99% 826 (KCG) KCG HOLDINGS, INC. 11 1.81% 570 309 6.00% 3,379
12 (KEPL) KEPLER CAPITAL MARKETS 178 2.71% 267 1,114 4.16% 1,525 (DBK ) DEUTSCHE BANK AG 9 1.50% 548 320 6.22% 2,818
13 (UBS) UBS INVESTMENT BANK 165 2.51% 75 438 1.64% 348 (MACQ) MACQUARIE SECURITIES 8 1.32% 100 47 0.91% 472
14 (DNB) DNB NOR BANK ASA 164 2.49% 7 263 0.98% 23 (DNB) DNB NOR BANK ASA 8 1.30% 7 13 0.25% 23
15 (MSCO) MORGAN STANLEY 159 2.41% 225 901 3.36% 1,434 (SG ) SG SECURITIES 7 1.22% 147 58 1.14% 827
16 (MAKO) MAKO FINANICAL MARKETS 141 2.14% 45 399 1.49% 285 (KEPL) KEPLER CAPITAL MARKETS 7 1.20% 267 80 1.56% 1,526
17 (BFIN) BLUEFIN EUROPE LLP 140 2.13% 60 595 2.22% 308 (INCA) INSTINET 6 1.02% 133 207 4.02% 762
18 (KCG) KCG HOLDINGS, INC. 123 1.88% 570 824 3.07% 3,379 (MED) MEDIOBANCA SPA 6 1.00% 1,173 42 0.82% 6,401
19 (PEEL) PEEL HUNT LLP 118 1.79% 610 424 1.58% 2,805 (UBS) UBS INVESTMENT BANK 6 0.95% 75 61 1.18% 348
20 (DBK ) DEUTSCHE BANK AG 102 1.55% 548 710 2.65% 2,817 (PEEL) PEEL HUNT LLP 5 0.87% 610 316 6.13% 2,805
Other 674 10.25% 3,314 4,879 18.21% 18,936 Other 39 6.56% 2,815 567 11.01% 16,828
Total 6,575 100.00% 11,469 26,799 100.00% 57,639 Total 592 100.00% 11,491 5,148 100.00% 57,822
Value Trade Summary Volume Trade Summary
Jun-16 YTD Jun-16 YTD
Source: Deutsche Bank, Bloomberg Finance LP
Note: ETC broker statistics represent advertised volume as reported by brokers to Bloomberg. These numbers may be different from actual volume traded.
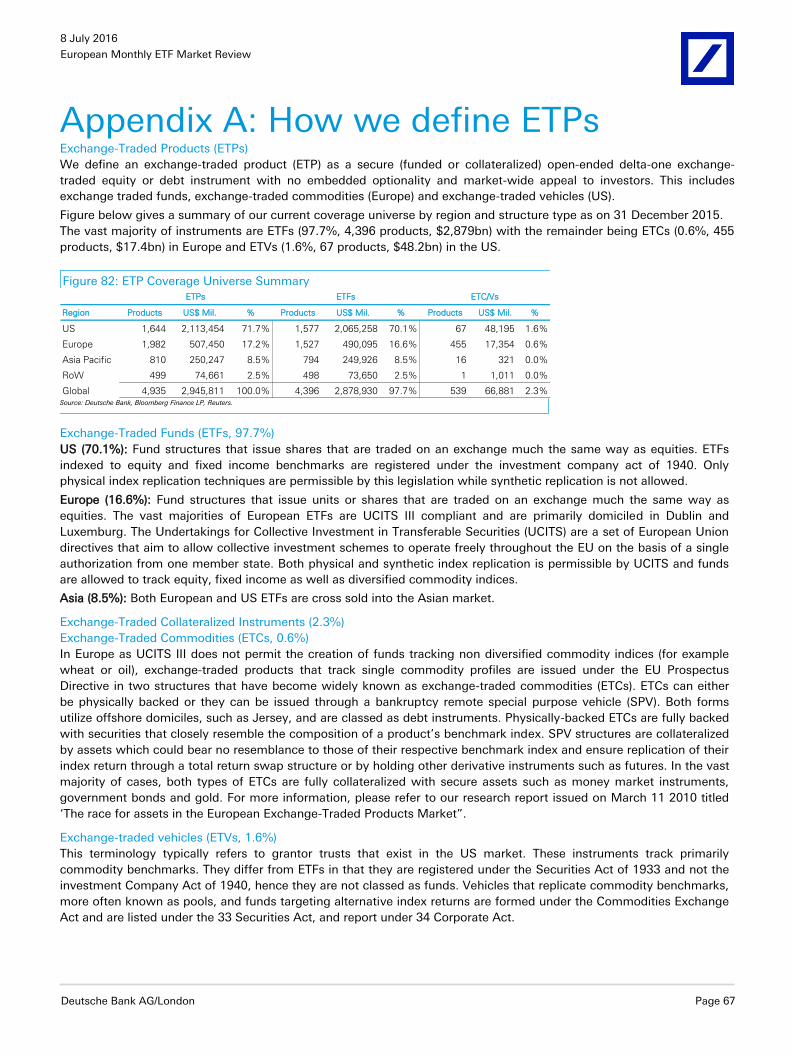
8 July 2016
European Monthly ETF Market Review
Deutsche Bank AG/London Page 67
Appendix A: How we define ETPs Exchange-Traded Products (ETPs)
We define an exchange-traded product (ETP) as a secure (funded or collateralized) open-ended delta-one exchange-
traded equity or debt instrument with no embedded optionality and market-wide appeal to investors. This includes
exchange traded funds, exchange-traded commodities (Europe) and exchange-traded vehicles (US).
Figure below gives a summary of our current coverage universe by region and structure type as on 31 December 2015.
The vast majority of instruments are ETFs (97.7%, 4,396 products, $2,879bn) with the remainder being ETCs (0.6%, 455
products, $17.4bn) in Europe and ETVs (1.6%, 67 products, $48.2bn) in the US.
Figure 82: ETP Coverage Universe Summary
Region Products US$ Mil. % Products US$ Mil. % Products US$ Mil. %
US 1,644 2,113,454 71.7% 1,577 2,065,258 70.1% 67 48,195 1.6%
Europe 1,982 507,450 17.2% 1,527 490,095 16.6% 455 17,354 0.6%
Asia Pacific 810 250,247 8.5% 794 249,926 8.5% 16 321 0.0%
RoW 499 74,661 2.5% 498 73,650 2.5% 1 1,011 0.0%
Global 4,935 2,945,811 100.0% 4,396 2,878,930 97.7% 539 66,881 2.3%
ETPs ETFs ETC/Vs
Source: Deutsche Bank, Bloomberg Finance LP, Reuters.
Exchange-Traded Funds (ETFs, 97.7%)
US (70.1%): Fund structures that issue shares that are traded on an exchange much the same way as equities. ETFs
indexed to equity and fixed income benchmarks are registered under the investment company act of 1940. Only
physical index replication techniques are permissible by this legislation while synthetic replication is not allowed.
Europe (16.6%): Fund structures that issue units or shares that are traded on an exchange much the same way as
equities. The vast majorities of European ETFs are UCITS III compliant and are primarily domiciled in Dublin and
Luxemburg. The Undertakings for Collective Investment in Transferable Securities (UCITS) are a set of European Union
directives that aim to allow collective investment schemes to operate freely throughout the EU on the basis of a single
authorization from one member state. Both physical and synthetic index replication is permissible by UCITS and funds
are allowed to track equity, fixed income as well as diversified commodity indices.
Asia (8.5%): Both European and US ETFs are cross sold into the Asian market.
Exchange-Traded Collateralized Instruments (2.3%)
Exchange-Traded Commodities (ETCs, 0.6%)
In Europe as UCITS III does not permit the creation of funds tracking non diversified commodity indices (for example
wheat or oil), exchange-traded products that track single commodity profiles are issued under the EU Prospectus
Directive in two structures that have become widely known as exchange-traded commodities (ETCs). ETCs can either
be physically backed or they can be issued through a bankruptcy remote special purpose vehicle (SPV). Both forms
utilize offshore domiciles, such as Jersey, and are classed as debt instruments. Physically-backed ETCs are fully backed
with securities that closely resemble the composition of a product’s benchmark index. SPV structures are collateralized
by assets which could bear no resemblance to those of their respective benchmark index and ensure replication of their
index return through a total return swap structure or by holding other derivative instruments such as futures. In the vast
majority of cases, both types of ETCs are fully collateralized with secure assets such as money market instruments,
government bonds and gold. For more information, please refer to our research report issued on March 11 2010 titled
‘The race for assets in the European Exchange-Traded Products Market”.
Exchange-traded vehicles (ETVs, 1.6%)
This terminology typically refers to grantor trusts that exist in the US market. These instruments track primarily
commodity benchmarks. They differ from ETFs in that they are registered under the Securities Act of 1933 and not the
investment Company Act of 1940, hence they are not classed as funds. Vehicles that replicate commodity benchmarks,
more often known as pools, and funds targeting alternative index returns are formed under the Commodities Exchange
Act and are listed under the 33 Securities Act, and report under 34 Corporate Act.

8 July 2016
European Monthly ETF Market Review
Page 68 Deutsche Bank AG/London
Appendix B: The road from beta to alpha
The figure below illustrates the road from beta (diversified rule based market access) to alpha (discretionary market
access). Moving counter-clockwise from beta, the potential for return increases, together with the potential risk.
Figure 83: The Roadmap From Beta (β) to Alpha (α)
Beta Alpha
Beta Multiplied Beta Adjusted
Beta Alpha
BetaKey Characteristics:- Diversification rules apply- Long only exposure- Weighting based on market capitalization- Composition based on pre-determined rules- Representative of a pre-defined market segmentReturn profile: Match very closely index return profileRisk profile: Match very closely index risk profile
Semi-active:Key Characteristics:- Diversification rules might apply- Long only exposure- Weighting not based on market capitalization- Composition based on pre-determined rules- Representative of a market segment per seReturn profile: Aims to generate superior returnsRisk profile: Not consistent with a diversified index risk profile
Beta+ (leveraged, long/short)Key Characteristics:- Diversification rules apply- Long, short and/or leveraged exposure- Weighting based on market capitalization- Composition based on pre-determined rules- Representative of a pre-defined market segmentReturn profile: Aims to generate superior returnsRisk profile: Not consistent with a diversified index risk profile
AlphaKey Characteristics:- Diversification rules do not typically apply- Long, short and/or leveraged exposure- Weighting not based on market capitalization- Composition not based on pre-determined rules- Not Representative of a pre-defined market segmentReturn profile: Aims to generate positive returnsRisk profile: Dependent on investment decisions
Source: Deutsche Bank
The performance of beta products is measured against an index; a manager is most successful when they manage to
match the return of a product to its stated benchmark. The performance of alpha products, or rather the performance of
an alpha product’s manager, is measured by the risk adjusted return it generates. The highest the return and the lowest
the risk [typically measured by the standard deviation of a product’s returns] the more successful a product is deemed
to be.
There is however a whole host of products that fall between beta and alpha, we have sought to create a classification
system that classifies these products, taking into consideration a number of variables, ranging from diversification to
what constitutes a market segment.

8 July 2016
European Monthly ETF Market Review
Deutsche Bank AG/London Page 69
The authors of this report wish to acknowledge the contribution made by Vibhor
Mahalwala and Varun Sachdeva, employees of Evalueserve, a third party
provider to Deutsche Bank of offshore research support services.
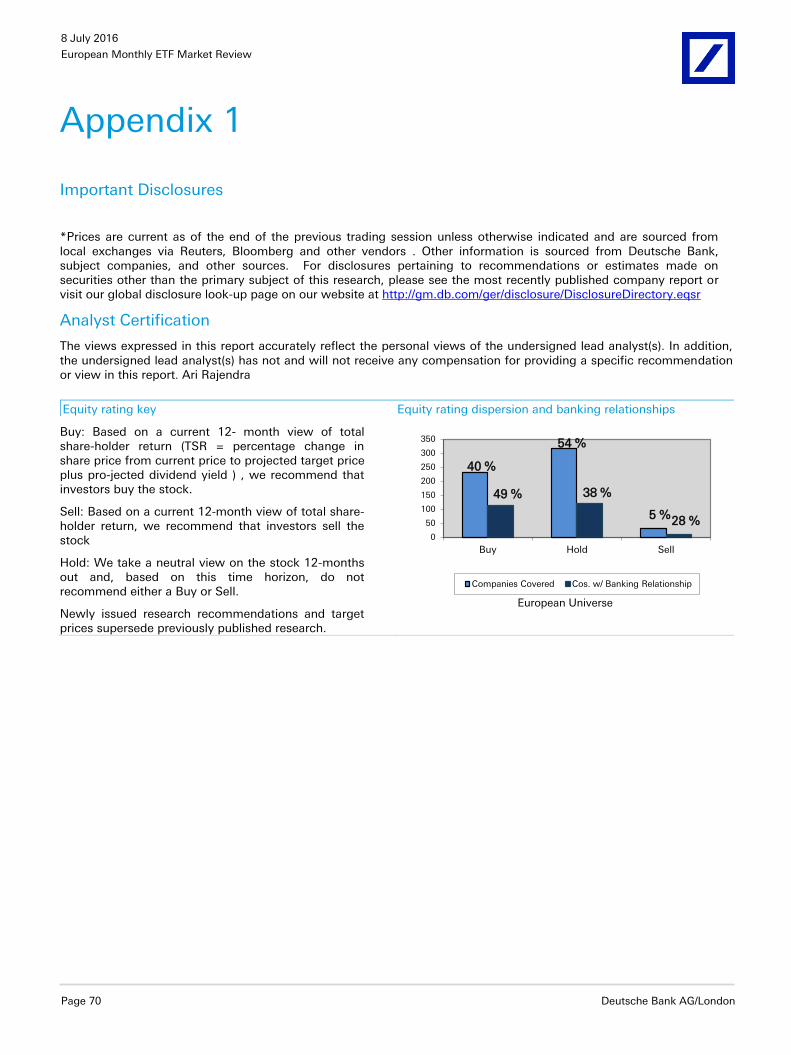
8 July 2016
European Monthly ETF Market Review
Page 70 Deutsche Bank AG/London
Appendix 1
Important Disclosures
*Prices are current as of the end of the previous trading session unless otherwise indicated and are sourced from local exchanges via Reuters, Bloomberg and other vendors . Other information is sourced from Deutsche Bank, subject companies, and other sources. For disclosures pertaining to recommendations or estimates made on securities other than the primary subject of this research, please see the most recently published company report or visit our global disclosure look-up page on our website at http://gm.db.com/ger/disclosure/DisclosureDirectory.eqsr
Analyst Certification
The views expressed in this report accurately reflect the personal views of the undersigned lead analyst(s). In addition, the undersigned lead analyst(s) has not and will not receive any compensation for providing a specific recommendation or view in this report. Ari Rajendra
Equity rating key Equity rating dispersion and banking relationships
Buy: Based on a current 12- month view of total share-holder return (TSR = percentage change in share price from current price to projected target price plus pro-jected dividend yield ) , we recommend that investors buy the stock.
Sell: Based on a current 12-month view of total share-holder return, we recommend that investors sell the stock
Hold: We take a neutral view on the stock 12-months out and, based on this time horizon, do not recommend either a Buy or Sell.
Newly issued research recommendations and target prices supersede previously published research.
40 %
54 %
5 %
49 % 38 %
28 %0
50
100
150
200
250
300
350
Buy Hold Sell
European Universe
Companies Covered Cos. w/ Banking Relationship

8 July 2016
European Monthly ETF Market Review
Deutsche Bank AG/London Page 71
Regulatory Disclosures
1.Additional Information
Information on ETFs is provided strictly for illustrative purposes and should not be deemed an offer to sell or a
solicitation of an offer to buy shares of any fund that is described in this document. Consider carefully any fund's
investment objectives, risk factors, and charges and expenses before investing. This and other information can be found
in the fund's prospectus. Prospectuses about db X-trackers funds and Powershares DB funds can be obtained by calling
1-877-369-4617 or by visiting www.DBXUS.com. Read prospectuses carefully before investing. Past performance is not
necessarily indicative of future results. Investing involves risk, including possible loss of principal. To better understand
the similarities and differences between investments, including investment objectives, risks, fees and expenses, it is
important to read the products' prospectuses. Shares of ETFs may be sold throughout the day on an exchange through
any brokerage account. However, shares may only be redeemed directly from an ETF by authorized participants, in very
large creation/redemption units. Transactions in shares of ETFs will result in brokerage commissions and will generate
tax consequences. ETFs are obliged to distribute portfolio gains to shareholders. Deutsche Bank may be an issuer,
advisor, manager, distributor or administrator of, or provide other services to, an ETF included in this report, for which it
receives compensation. db X-trackers and Powershares DB funds are distributed by ALPS Distributors, Inc. The opinions
expressed are those of the authors and do not necessarily reflect the views of DB, ALPS or their affiliates.
Aside from within this report, important conflict disclosures can also be found at https://gm.db.com/equities under the
"Disclosures Lookup" and "Legal" tabs. Investors are strongly encouraged to review this information before investing.
2. Short-Term Trade Ideas
Deutsche Bank equity research analysts sometimes have shorter-term trade ideas (known as SOLAR ideas) that are
consistent or inconsistent with Deutsche Bank's existing longer term ratings. These trade ideas can be found at the
SOLAR link at http://gm.db.com.

8 July 2016
European Monthly ETF Market Review
Page 72 Deutsche Bank AG/London
Additional Information
The information and opinions in this report were prepared by Deutsche Bank AG or one of its affiliates (collectively
"Deutsche Bank"). Though the information herein is believed to be reliable and has been obtained from public sources
believed to be reliable, Deutsche Bank makes no representation as to its accuracy or completeness.
If you use the services of Deutsche Bank in connection with a purchase or sale of a security that is discussed in this
report, or is included or discussed in another communication (oral or written) from a Deutsche Bank analyst, Deutsche
Bank may act as principal for its own account or as agent for another person.
Deutsche Bank may consider this report in deciding to trade as principal. It may also engage in transactions, for its own
account or with customers, in a manner inconsistent with the views taken in this research report. Others within
Deutsche Bank, including strategists, sales staff and other analysts, may take views that are inconsistent with those
taken in this research report. Deutsche Bank issues a variety of research products, including fundamental analysis,
equity-linked analysis, quantitative analysis and trade ideas. Recommendations contained in one type of communication
may differ from recommendations contained in others, whether as a result of differing time horizons, methodologies or
otherwise. Deutsche Bank and/or its affiliates may also be holding debt or equity securities of the issuers it writes on.
Analysts are paid in part based on the profitability of Deutsche Bank AG and its affiliates, which includes investment
banking revenues.
Opinions, estimates and projections constitute the current judgment of the author as of the date of this report. They do
not necessarily reflect the opinions of Deutsche Bank and are subject to change without notice. Deutsche Bank research
analysts sometimes have shorter-term trade ideas that are consistent or inconsistent with Deutsche Bank's existing
longer term ratings. These trade ideas for equities can be found at the SOLAR link at http://gm.db.com. A SOLAR idea
represents a high conviction belief by an analyst that a stock will outperform or underperform the market and/or sector
delineated over a time frame of no less than two weeks. In addition to SOLAR ideas, the analysts named in this report
may have from time to time discussed with our clients, including Deutsche Bank salespersons and traders, or may
discuss in this report or elsewhere, trading strategies or ideas that reference catalysts or events that may have a near-
term or medium-term impact on the market price of the securities discussed in this report, which impact may be
directionally counter to the analysts' current 12-month view of total return as described herein. Deutsche Bank has no
obligation to update, modify or amend this report or to otherwise notify a recipient thereof if any opinion, forecast or
estimate contained herein changes or subsequently becomes inaccurate. Coverage and the frequency of changes in
market conditions and in both general and company specific economic prospects makes it difficult to update research at
defined intervals. Updates are at the sole discretion of the coverage analyst concerned or of the Research Department
Management and as such the majority of reports are published at irregular intervals. This report is provided for
informational purposes only. It is not an offer or a solicitation of an offer to buy or sell any financial instruments or to
participate in any particular trading strategy. Target prices are inherently imprecise and a product of the analyst’s
judgment. The financial instruments discussed in this report may not be suitable for all investors and investors must
make their own informed investment decisions. Prices and availability of financial instruments are subject to change
without notice and investment transactions can lead to losses as a result of price fluctuations and other factors. If a
financial instrument is denominated in a currency other than an investor's currency, a change in exchange rates may
adversely affect the investment. Past performance is not necessarily indicative of future results. Unless otherwise
indicated, prices are current as of the end of the previous trading session, and are sourced from local exchanges via
Reuters, Bloomberg and other vendors. Data is sourced from Deutsche Bank, subject companies, and in some cases,
other parties.
The Deutsche Bank Research Department is independent of other business areas divisions of the Bank. Details regarding
our organizational arrangements and information barriers we have to prevent and avoid conflicts of interest with respect
to our research is available on our website under Disclaimer found on the Legal tab.
Macroeconomic fluctuations often account for most of the risks associated with exposures to instruments that promise
to pay fixed or variable interest rates. For an investor who is long fixed rate instruments (thus receiving these cash
flows), increases in interest rates naturally lift the discount factors applied to the expected cash flows and thus cause a

8 July 2016
European Monthly ETF Market Review
Deutsche Bank AG/London Page 73
loss. The longer the maturity of a certain cash flow and the higher the move in the discount factor, the higher will be the
loss. Upside surprises in inflation, fiscal funding needs, and FX depreciation rates are among the most common adverse
macroeconomic shocks to receivers. But counterparty exposure, issuer creditworthiness, client segmentation, regulation
(including changes in assets holding limits for different types of investors), changes in tax policies, currency
convertibility (which may constrain currency conversion, repatriation of profits and/or the liquidation of positions), and
settlement issues related to local clearing houses are also important risk factors to be considered. The sensitivity of fixed
income instruments to macroeconomic shocks may be mitigated by indexing the contracted cash flows to inflation, to
FX depreciation, or to specified interest rates – these are common in emerging markets. It is important to note that the
index fixings may -- by construction -- lag or mis-measure the actual move in the underlying variables they are intended
to track. The choice of the proper fixing (or metric) is particularly important in swaps markets, where floating coupon
rates (i.e., coupons indexed to a typically short-dated interest rate reference index) are exchanged for fixed coupons. It is
also important to acknowledge that funding in a currency that differs from the currency in which coupons are
denominated carries FX risk. Naturally, options on swaps (swaptions) also bear the risks typical to options in addition to
the risks related to rates movements.
Derivative transactions involve numerous risks including, among others, market, counterparty default and illiquidity risk.
The appropriateness or otherwise of these products for use by investors is dependent on the investors' own
circumstances including their tax position, their regulatory environment and the nature of their other assets and
liabilities, and as such, investors should take expert legal and financial advice before entering into any transaction similar
to or inspired by the contents of this publication. The risk of loss in futures trading and options, foreign or domestic, can
be substantial. As a result of the high degree of leverage obtainable in futures and options trading, losses may be
incurred that are greater than the amount of funds initially deposited. Trading in options involves risk and is not suitable
for all investors. Prior to buying or selling an option investors must review the "Characteristics and Risks of Standardized
Options”, at http://www.optionsclearing.com/about/publications/character-risks.jsp. If you are unable to access the
website please contact your Deutsche Bank representative for a copy of this important document.
Participants in foreign exchange transactions may incur risks arising from several factors, including the following: ( i)
exchange rates can be volatile and are subject to large fluctuations; ( ii) the value of currencies may be affected by
numerous market factors, including world and national economic, political and regulatory events, events in equity and
debt markets and changes in interest rates; and (iii) currencies may be subject to devaluation or government imposed
exchange controls which could affect the value of the currency. Investors in securities such as ADRs, whose values are
affected by the currency of an underlying security, effectively assume currency risk.
Unless governing law provides otherwise, all transactions should be executed through the Deutsche Bank entity in the
investor's home jurisdiction.
United States: Approved and/or distributed by Deutsche Bank Securities Incorporated, a member of FINRA, NFA and
SIPC. Analysts employed by non-US affiliates may not be associated persons of Deutsche Bank Securities Incorporated
and therefore not subject to FINRA regulations concerning communications with subject companies, public appearances
and securities held by analysts.
Germany: Approved and/or distributed by Deutsche Bank AG, a joint stock corporation with limited liability incorporated
in the Federal Republic of Germany with its principal office in Frankfurt am Main. Deutsche Bank AG is authorized under
German Banking Law and is subject to supervision by the European Central Bank and by BaFin, Germany’s Federal
Financial Supervisory Authority.
United Kingdom: Approved and/or distributed by Deutsche Bank AG acting through its London Branch at Winchester
House, 1 Great Winchester Street, London EC2N 2DB. Deutsche Bank AG in the United Kingdom is authorised by the
Prudential Regulation Authority and is subject to limited regulation by the Prudential Regulation Authority and Financial
Conduct Authority. Details about the extent of our authorisation and regulation are available on request.
Hong Kong: Distributed by Deutsche Bank AG, Hong Kong Branch.
India: Prepared by Deutsche Equities India Pvt Ltd, which is registered by the Securities and Exchange Board of India
(SEBI) as a stock broker. Research Analyst SEBI Registration Number is INH000001741. DEIPL may have received
administrative warnings from the SEBI for breaches of Indian regulations.

8 July 2016
European Monthly ETF Market Review
Page 74 Deutsche Bank AG/London
Japan: Approved and/or distributed by Deutsche Securities Inc.(DSI). Registration number - Registered as a financial
instruments dealer by the Head of the Kanto Local Finance Bureau (Kinsho) No. 117. Member of associations: JSDA,
Type II Financial Instruments Firms Association and The Financial Futures Association of Japan. Commissions and risks
involved in stock transactions - for stock transactions, we charge stock commissions and consumption tax by
multiplying the transaction amount by the commission rate agreed with each customer. Stock transactions can lead to
losses as a result of share price fluctuations and other factors. Transactions in foreign stocks can lead to additional
losses stemming from foreign exchange fluctuations. We may also charge commissions and fees for certain categories
of investment advice, products and services. Recommended investment strategies, products and services carry the risk
of losses to principal and other losses as a result of changes in market and/or economic trends, and/or fluctuations in
market value. Before deciding on the purchase of financial products and/or services, customers should carefully read the
relevant disclosures, prospectuses and other documentation. "Moody's", "Standard & Poor's", and "Fitch" mentioned in
this report are not registered credit rating agencies in Japan unless Japan or "Nippon" is specifically designated in the
name of the entity. Reports on Japanese listed companies not written by analysts of DSI are written by Deutsche Bank
Group's analysts with the coverage companies specified by DSI. Some of the foreign securities stated on this report are
not disclosed according to the Financial Instruments and Exchange Law of Japan.
Korea: Distributed by Deutsche Securities Korea Co.
South Africa: Deutsche Bank AG Johannesburg is incorporated in the Federal Republic of Germany (Branch Register
Number in South Africa: 1998/003298/10).
Singapore: by Deutsche Bank AG, Singapore Branch or Deutsche Securities Asia Limited, Singapore Branch (One Raffles
Quay #18-00 South Tower Singapore 048583, +65 6423 8001), which may be contacted in respect of any matters
arising from, or in connection with, this report. Where this report is issued or promulgated in Singapore to a person who
is not an accredited investor, expert investor or institutional investor (as defined in the applicable Singapore laws and
regulations), they accept legal responsibility to such person for its contents.
Taiwan: Information on securities/investments that trade in Taiwan is for your reference only. Readers should
independently evaluate investment risks and are solely responsible for their investment decisions. Deutsche Bank
research may not be distributed to the Taiwan public media or quoted or used by the Taiwan public media without
written consent. Information on securities/instruments that do not trade in Taiwan is for informational purposes only and
is not to be construed as a recommendation to trade in such securities/instruments. Deutsche Securities Asia Limited,
Taipei Branch may not execute transactions for clients in these securities/instruments.
Qatar: Deutsche Bank AG in the Qatar Financial Centre (registered no. 00032) is regulated by the Qatar Financial Centre
Regulatory Authority. Deutsche Bank AG - QFC Branch may only undertake the financial services activities that fall
within the scope of its existing QFCRA license. Principal place of business in the QFC: Qatar Financial Centre, Tower,
West Bay, Level 5, PO Box 14928, Doha, Qatar. This information has been distributed by Deutsche Bank AG. Related
financial products or services are only available to Business Customers, as defined by the Qatar Financial Centre
Regulatory Authority.
Russia: This information, interpretation and opinions submitted herein are not in the context of, and do not constitute,
any appraisal or evaluation activity requiring a license in the Russian Federation.
Kingdom of Saudi Arabia: Deutsche Securities Saudi Arabia LLC Company, (registered no. 07073-37) is regulated by the
Capital Market Authority. Deutsche Securities Saudi Arabia may only undertake the financial services activities that fall
within the scope of its existing CMA license. Principal place of business in Saudi Arabia: King Fahad Road, Al Olaya
District, P.O. Box 301809, Faisaliah Tower - 17th Floor, 11372 Riyadh, Saudi Arabia.
United Arab Emirates: Deutsche Bank AG in the Dubai International Financial Centre (registered no. 00045) is regulated
by the Dubai Financial Services Authority. Deutsche Bank AG - DIFC Branch may only undertake the financial services
activities that fall within the scope of its existing DFSA license. Principal place of business in the DIFC: Dubai
International Financial Centre, The Gate Village, Building 5, PO Box 504902, Dubai, U.A.E. This information has been
distributed by Deutsche Bank AG. Related financial products or services are only available to Professional Clients, as

8 July 2016
European Monthly ETF Market Review
Deutsche Bank AG/London Page 75
defined by the Dubai Financial Services Authority.
Australia: Retail clients should obtain a copy of a Product Disclosure Statement (PDS) relating to any financial product
referred to in this report and consider the PDS before making any decision about whether to acquire the product. Please
refer to Australian specific research disclosures and related information at
https://australia.db.com/australia/content/research-information.html
Australia and New Zealand: This research, and any access to it, is intended only for "wholesale clients" within the
meaning of the Australian Corporations Act and New Zealand Financial Advisors Act respectively.
Additional information relative to securities, other financial products or issuers discussed in this report is available upon
request. This report may not be reproduced, distributed or published without Deutsche Bank's prior written consent.
Copyright © 2016 Deutsche Bank AG

David Folkerts-Landau Group Chief Economist and Global Head of Research
Raj Hindocha Global Chief Operating Officer
Research
Michael Spencer Head of APAC Research
Global Head of Economics
Steve Pollard Head of Americas Research
Global Head of Equity Research
Anthony Klarman Global Head of Debt Research
Paul Reynolds Head of EMEA
Equity Research
Dave Clark Head of APAC
Equity Research
Pam Finelli Global Head of
Equity Derivatives Research
Andreas Neubauer Head of Research - Germany
Stuart Kirk Head of Thematic Research
International Locations
Deutsche Bank AG
Deutsche Bank Place
Level 16
Corner of Hunter & Phillip Streets
Sydney, NSW 2000
Australia
Tel: (61) 2 8258 1234
Deutsche Bank AG
Große Gallusstraße 10-14
60272 Frankfurt am Main
Germany
Tel: (49) 69 910 00
Deutsche Bank AG
Filiale Hongkong
International Commerce Centre,
1 Austin Road West,Kowloon,
Hong Kong
Tel: (852) 2203 8888
Deutsche Securities Inc.
2-11-1 Nagatacho
Sanno Park Tower
Chiyoda-ku, Tokyo 100-6171
Japan
Tel: (81) 3 5156 6770
Deutsche Bank AG London
1 Great Winchester Street
London EC2N 2EQ
United Kingdom
Tel: (44) 20 7545 8000
Deutsche Bank Securities Inc.
60 Wall Street
New York, NY 10005
United States of America
Tel: (1) 212 250 2500