Embed Size (px)
Citation preview
European Semester Country Report for Greece
European Commission – IOBE conference:
Integrating Greece into the European Semester Policy Framework: Priorities for sustainable growth and
competitiveness
Wednesday, 20 March 2019
Acropolis Museum, Athens
Declan Costello
Mission Chief for Greece
DG ECFIN
Barbara Kauffmann
Director, Employment & Social Governance
DG EMPLCopyright rests with the author. All rights reserved
Outline
2
• 1. European Semester process
• 2. Country Report on Greece (27 Feb)
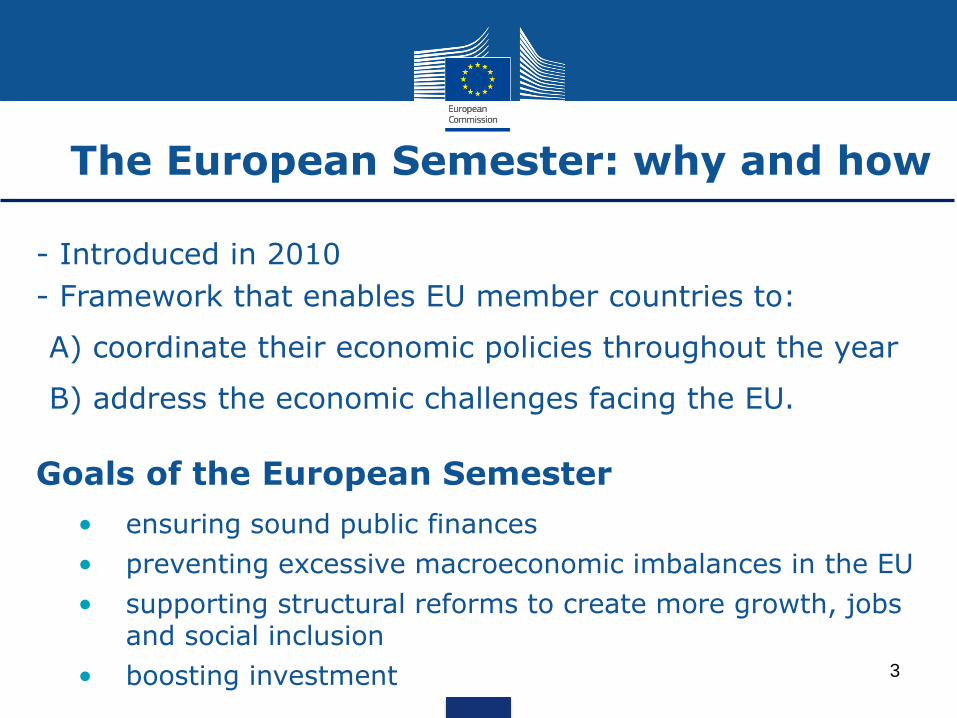
The European Semester: why and how
3
- Introduced in 2010
- Framework that enables EU member countries to:
-A) coordinate their economic policies throughout the year
-B) address the economic challenges facing the EU.
Goals of the European Semester
• ensuring sound public finances
• preventing excessive macroeconomic imbalances in the EU
• supporting structural reforms to create more growth, jobsand social inclusion
• boosting investment
4
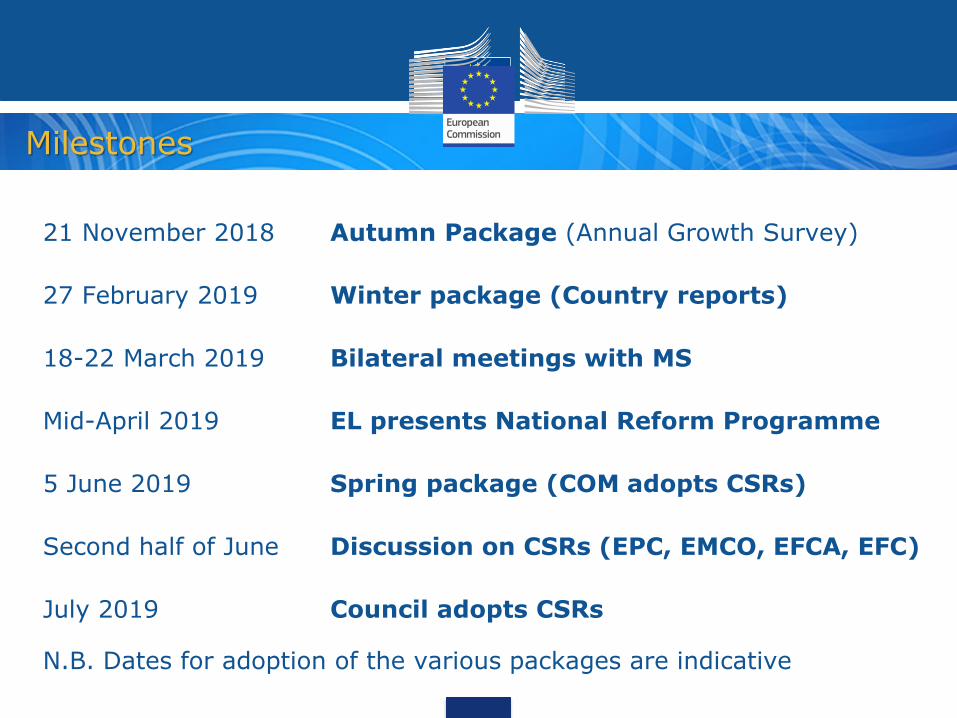
21 November 2018 Autumn Package (Annual Growth Survey)
27 February 2019 Winter package (Country reports)
18-22 March 2019 Bilateral meetings with MS
Mid-April 2019 EL presents National Reform Programme
5 June 2019 Spring package (COM adopts CSRs)
Second half of June Discussion on CSRs (EPC, EMCO, EFCA, EFC)
July 2019 Council adopts CSRs
N.B. Dates for adoption of the various packages are indicative
Milestones
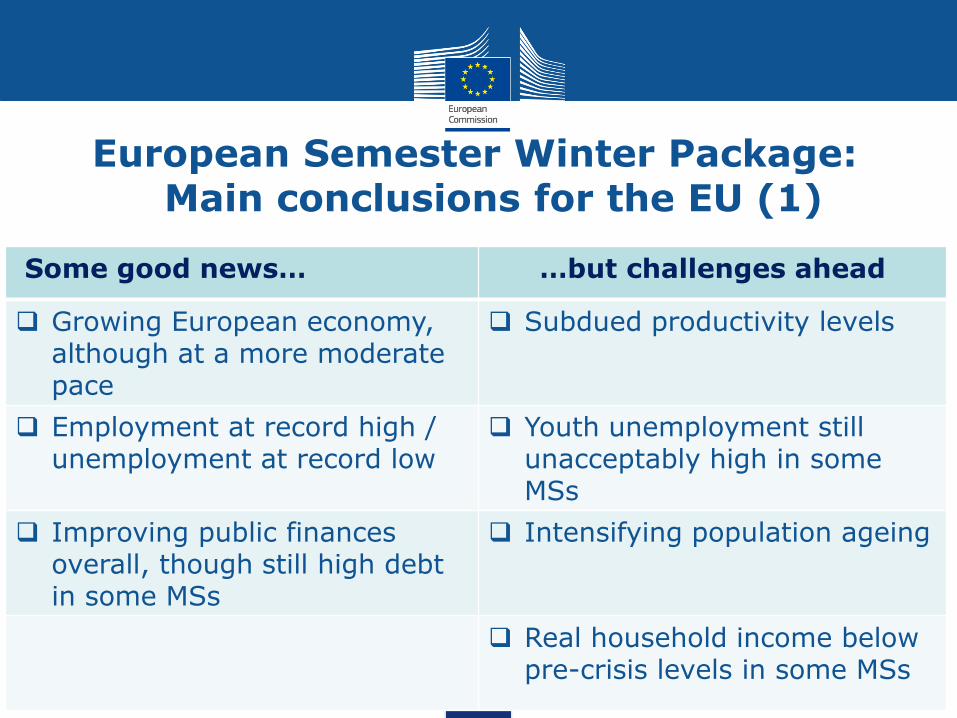
European Semester Winter Package: Main conclusions for the EU (1)
6
Challenges vary significantly across countriesand call for appropriate and determined policyaction:
Some good news… …but challenges ahead
Growing European economy, although at a more moderate pace
Subdued productivity levels
Employment at record high / unemployment at record low
Youth unemployment still unacceptably high in some MSs
Improving public finances overall, though still high debt in some MSs
Intensifying population ageing
Real household income below pre-crisis levels in some MSs
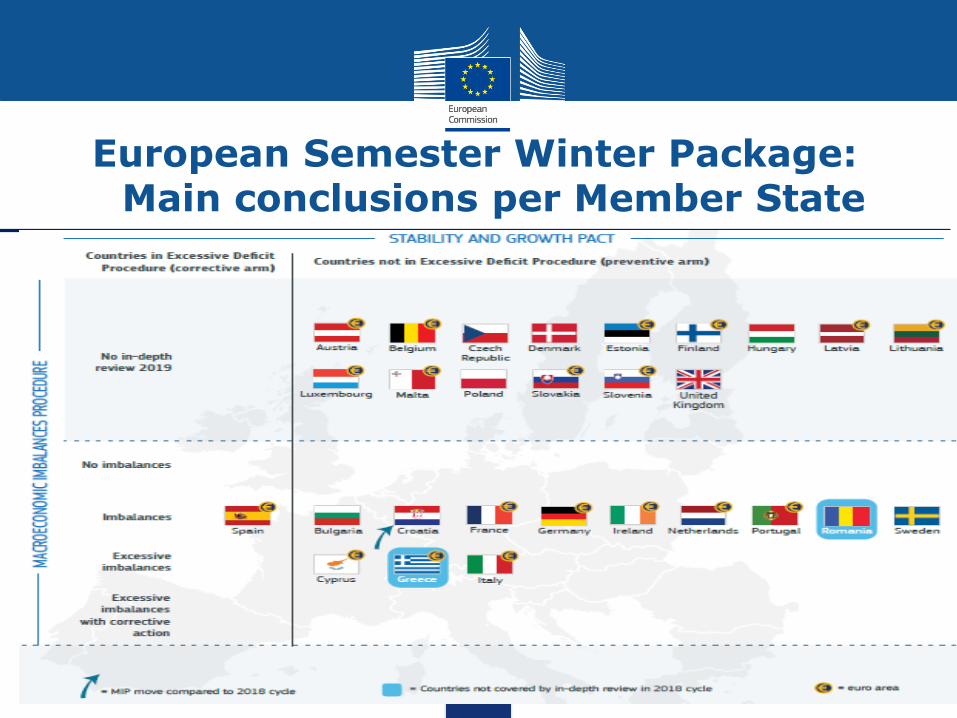
European Semester Winter Package: Main conclusions per Member State
7
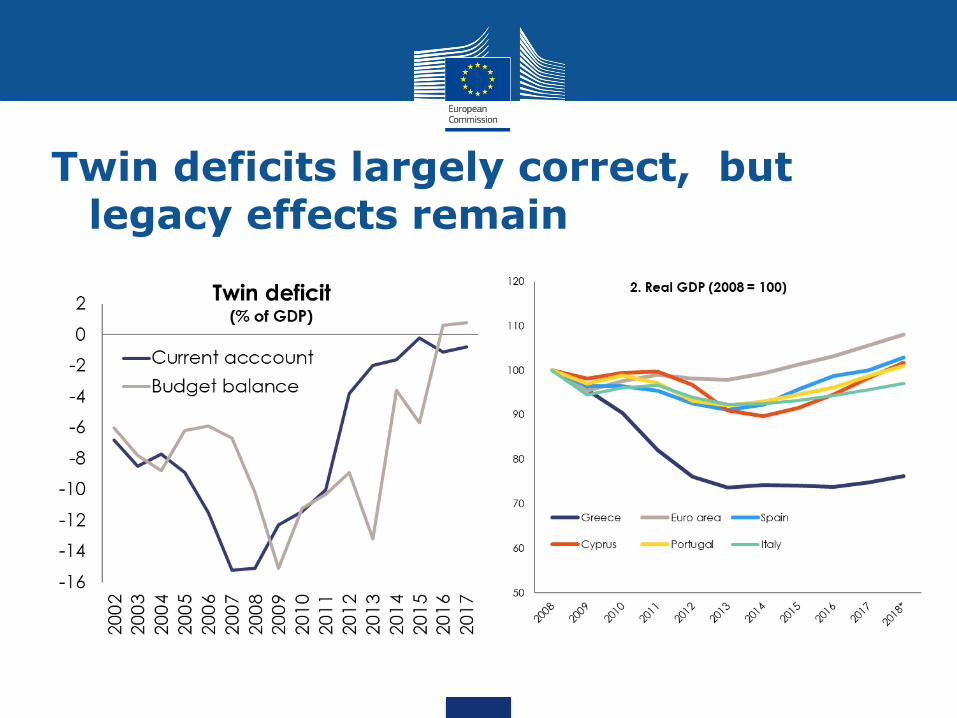
Twin deficits largely correct, but legacy effects remain
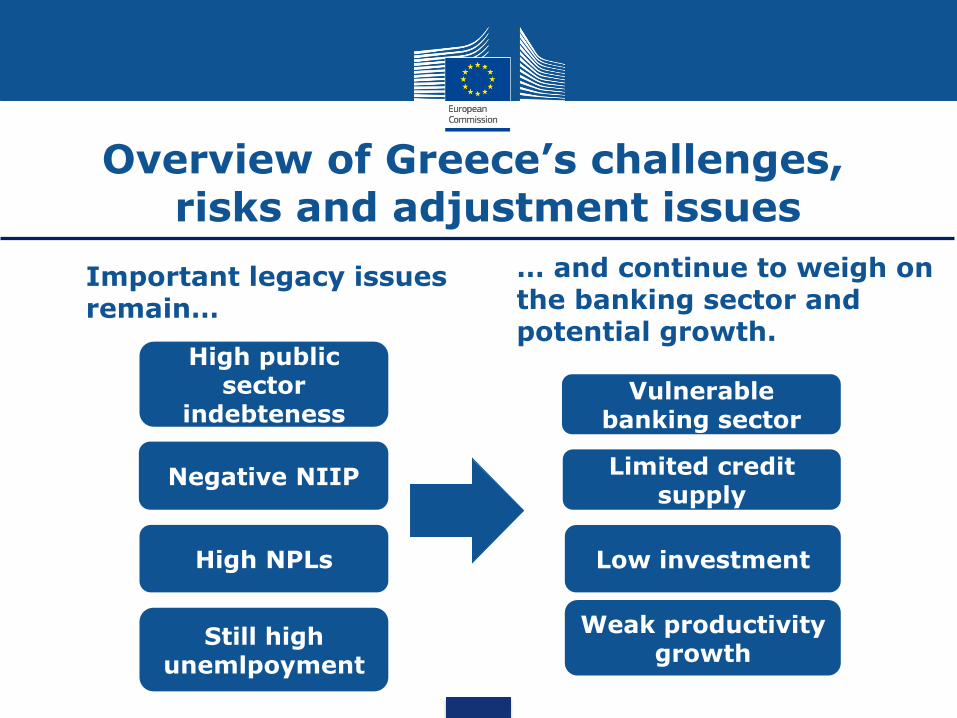
Overview of Greece’s challenges, risks and adjustment issues
Important legacy issues remain…
… and continue to weigh on the banking sector and potential growth.
Low investment
Weak productivity growth
High NPLs
High public sector
indebteness
Limited credit supply
Negative NIIP
Vulnerablebanking sector
Still high unemlpoyment
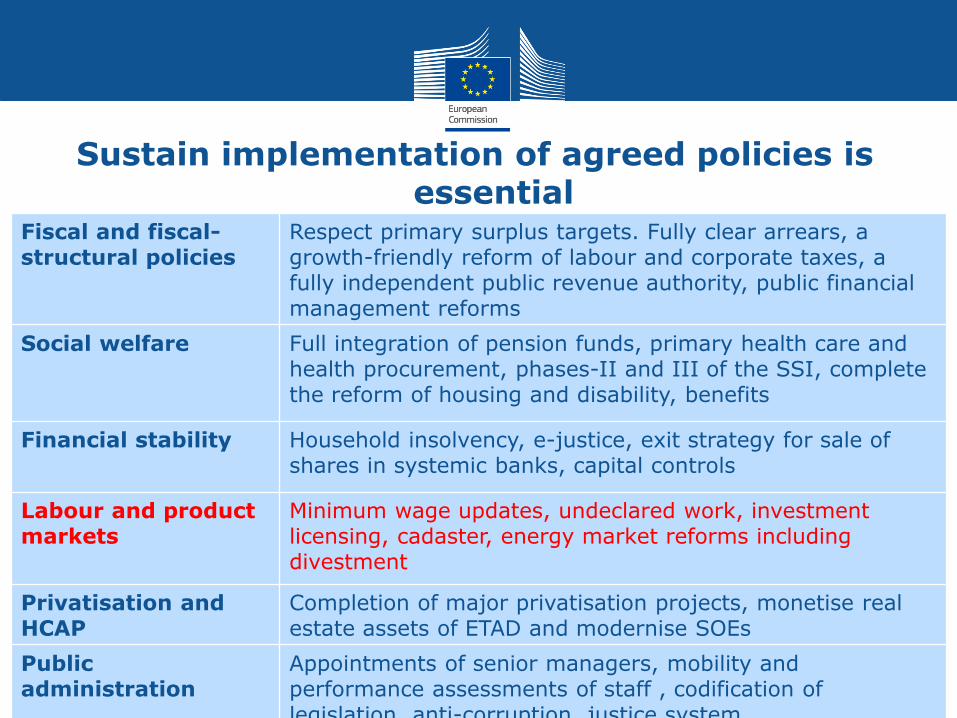
Sustain implementation of agreed policies is essential
10
Fiscal and fiscal-structural policies
Respect primary surplus targets. Fully clear arrears, agrowth-friendly reform of labour and corporate taxes, afully independent public revenue authority, public financial management reforms
Social welfare Full integration of pension funds, primary health care and health procurement, phases-II and III of the SSI, complete the reform of housing and disability, benefits
Financial stability Household insolvency, e-justice, exit strategy for sale of shares in systemic banks, capital controls
Labour and product markets
Minimum wage updates, undeclared work, investment licensing, cadaster, energy market reforms includingdivestment
Privatisation and HCAP
Completion of major privatisation projects, monetise real estate assets of ETAD and modernise SOEs
Public administration
Appointments of senior managers, mobility and performance assessments of staff , codification of legislation, anti-corruption, justice system
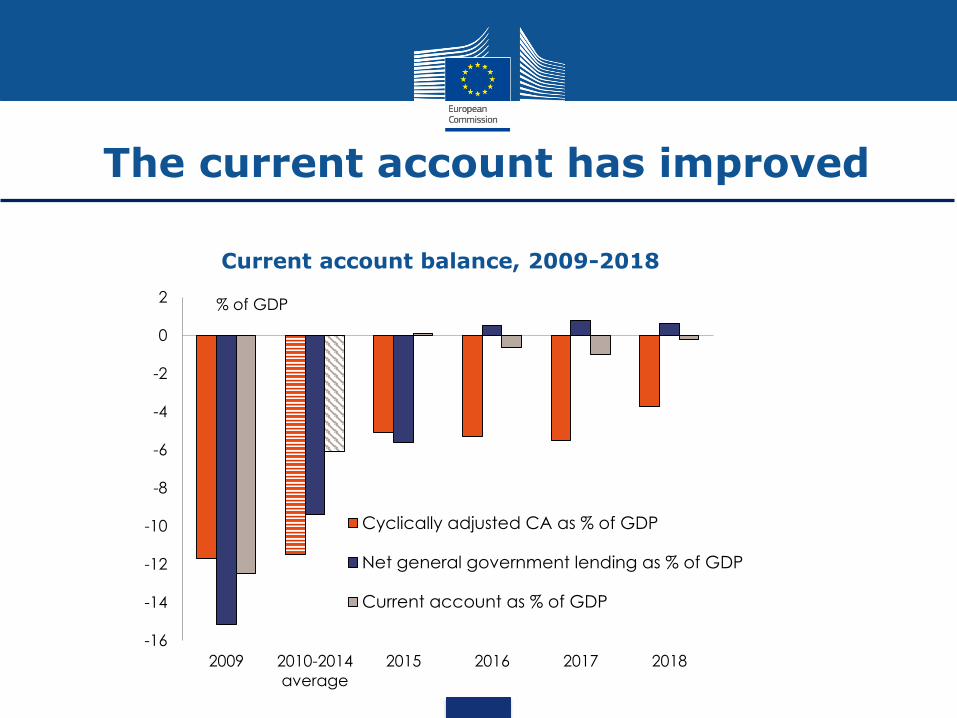
The current account has improved
Current account balance, 2009-2018
-16
-14
-12
-10
-8
-6
-4
-2
0
2
2009 2010-2014
average
2015 2016 2017 2018
% of GDP
Cyclically adjusted CA as % of GDP
Net general government lending as % of GDP
Current account as % of GDP
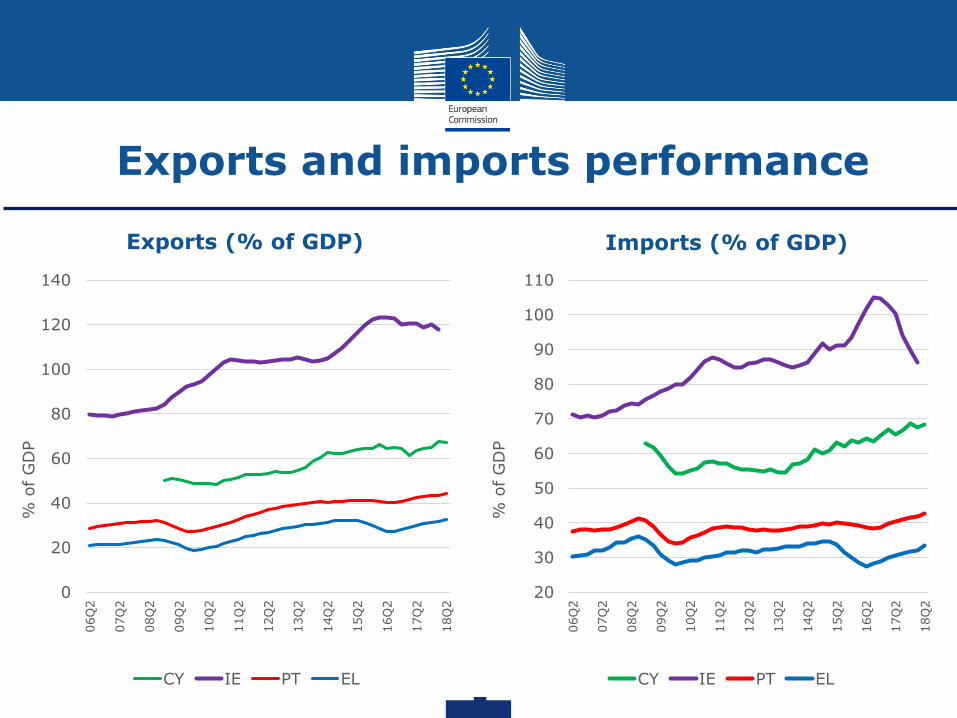
Exports and imports performance
Exports (% of GDP) Imports (% of GDP)
20
30
40
50
60
70
80
90
100
110
06Q
2
07Q
2
08Q
2
09Q
2
10Q
2
11Q
2
12Q
2
13Q
2
14Q
2
15Q
2
16Q
2
17Q
2
18Q
2
% o
f G
DP
CY IE PT EL
0
20
40
60
80
100
120
140
06Q
2
07Q
2
08Q
2
09Q
2
10Q
2
11Q
2
12Q
2
13Q
2
14Q
2
15Q
2
16Q
2
17Q
2
18Q
2
% o
f G
DP
CY IE PT EL
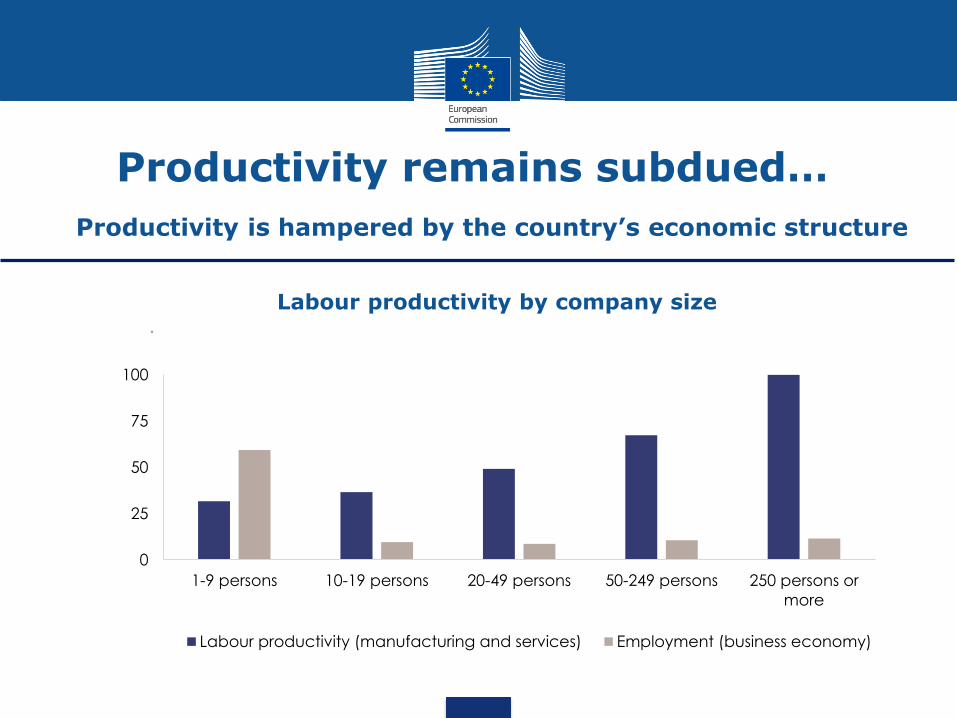
Productivity remains subdued…
13
Labour productivity by company size
Productivity is hampered by the country’s economic structure
0
25
50
75
100
1-9 persons 10-19 persons 20-49 persons 50-249 persons 250 persons or
more
*
Labour productivity (manufacturing and services) Employment (business economy)
14
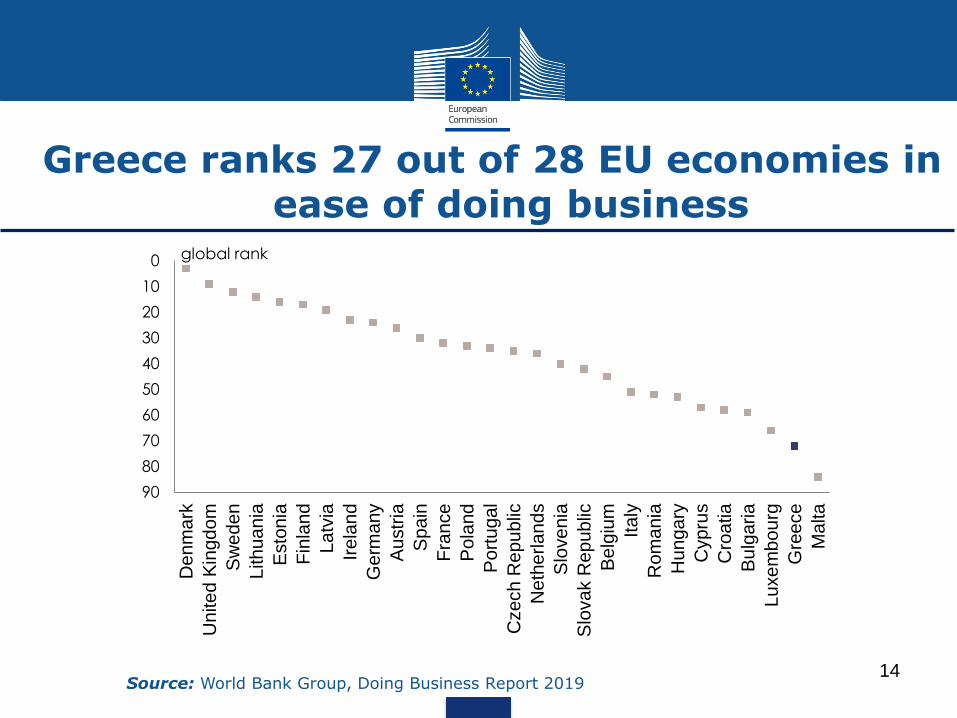
Greece ranks 27 out of 28 EU economies in ease of doing business
0
10
20
30
40
50
60
70
80
90
De
nm
ark
Un
ite
d K
ing
do
m
Sw
ed
en
Lith
ua
nia
Esto
nia
Fin
lan
d
La
tvia
Ire
lan
d
Germ
any
Au
str
ia
Spain
Fra
nce
Po
land
Port
ugal
Czech
Re
pu
blic
Ne
the
rla
nd
s
Slo
ve
nia
Slo
va
k R
ep
ub
lic
Be
lgiu
m
Ita
ly
Ro
ma
nia
Hu
ng
ary
Cypru
s
Cro
atia
Bu
lgaria
Lu
xe
mb
ou
rg
Gre
ece
Ma
lta
global rank
Source: World Bank Group, Doing Business Report 2019
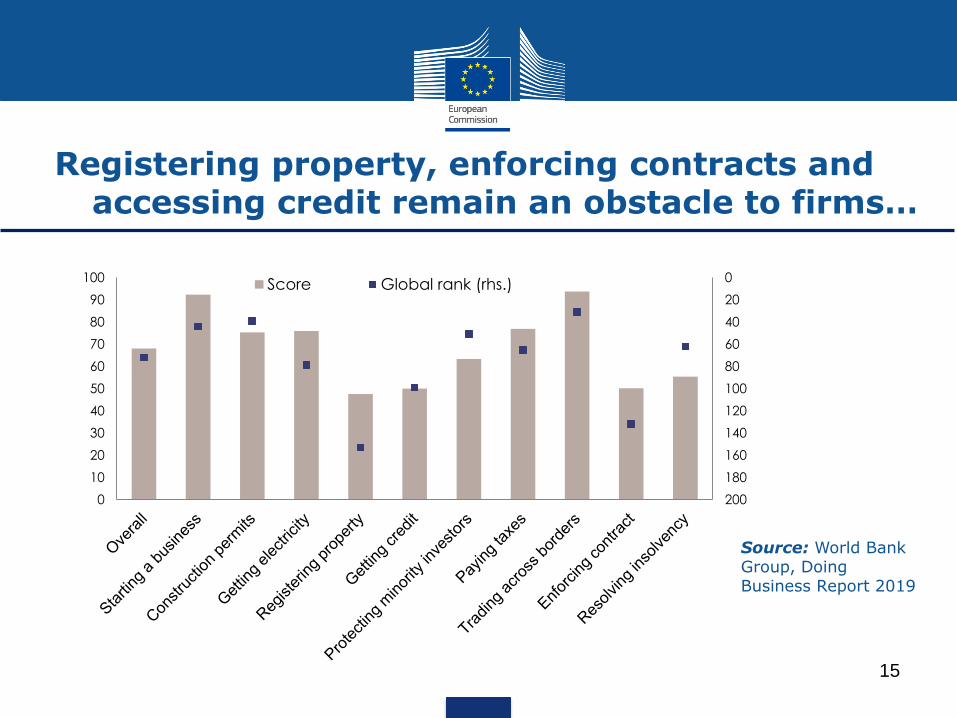
15
Source: World Bank Group, Doing Business Report 2019
0
20
40
60
80
100
120
140
160
180
2000
10
20
30
40
50
60
70
80
90
100Score Global rank (rhs.)
Registering property, enforcing contracts and accessing credit remain an obstacle to firms…
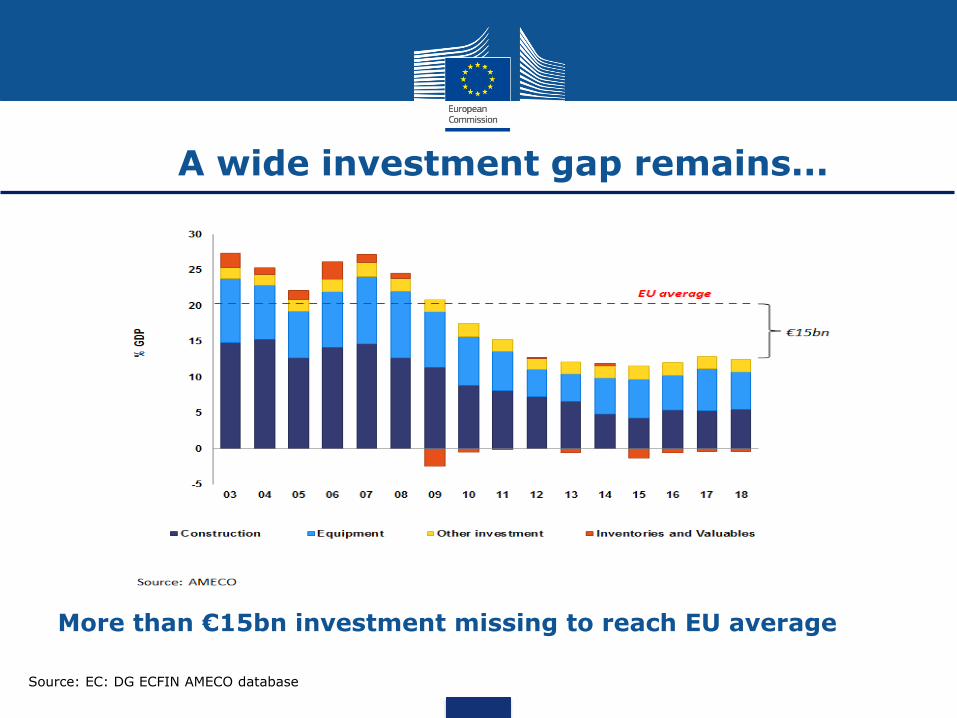
More than €15bn investment missing to reach EU average
Source: EC: DG ECFIN AMECO database
A wide investment gap remains...
Investment opportunities
17
• Investment needs are high & support to growth enablers is needed
• Transport and logistics: ports, completion of the railway axis Patras-Athens-Thessalonica, small port infrastructures, coastal shipping routes
• Energy market: generation, transmission, energy efficiency, innovation
• Public infrastructure: climate adaptation, environmental challenges
• Skills and employability: education, social inclusion, public employmentservice, childcare and long-term care
• Build-up of competitive advantage: agro-food, tourism, health, R&D
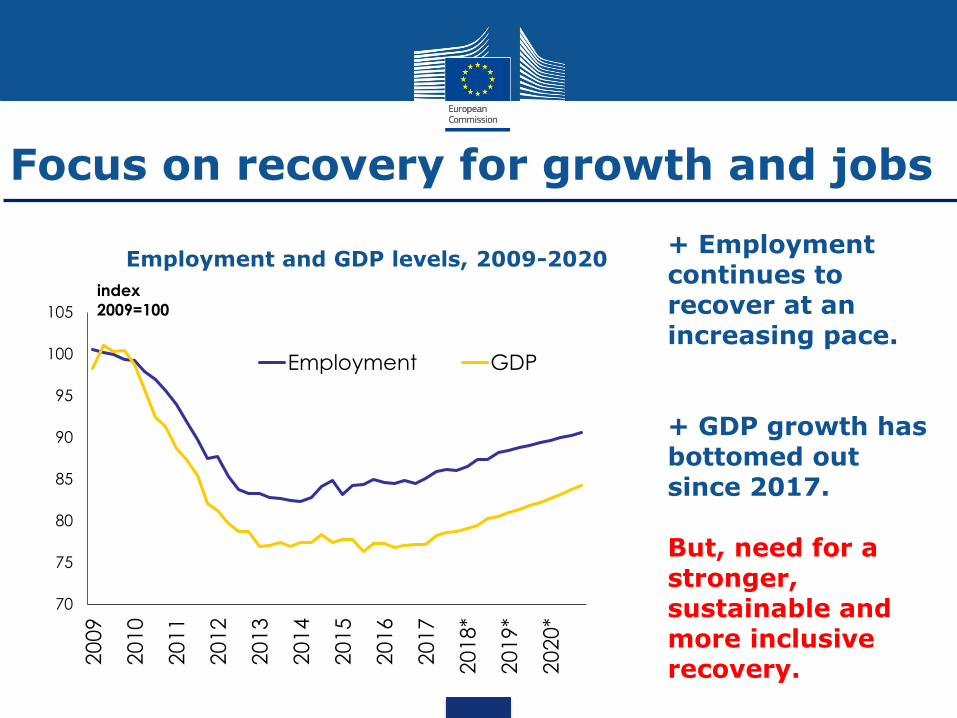
Focus on recovery for growth and jobs
Employment and GDP levels, 2009-2020+ Employment continues to recover at an increasing pace.
+ GDP growth has bottomed out since 2017.
But, need for a stronger, sustainable and more inclusive recovery.
70
75
80
85
90
95
100
105
20
09
20
10
20
11
20
12
20
13
20
14
20
15
20
16
20
17
20
18
*
20
19
*
20
20
*
index
2009=100
Employment GDP
Source: ELSTAT
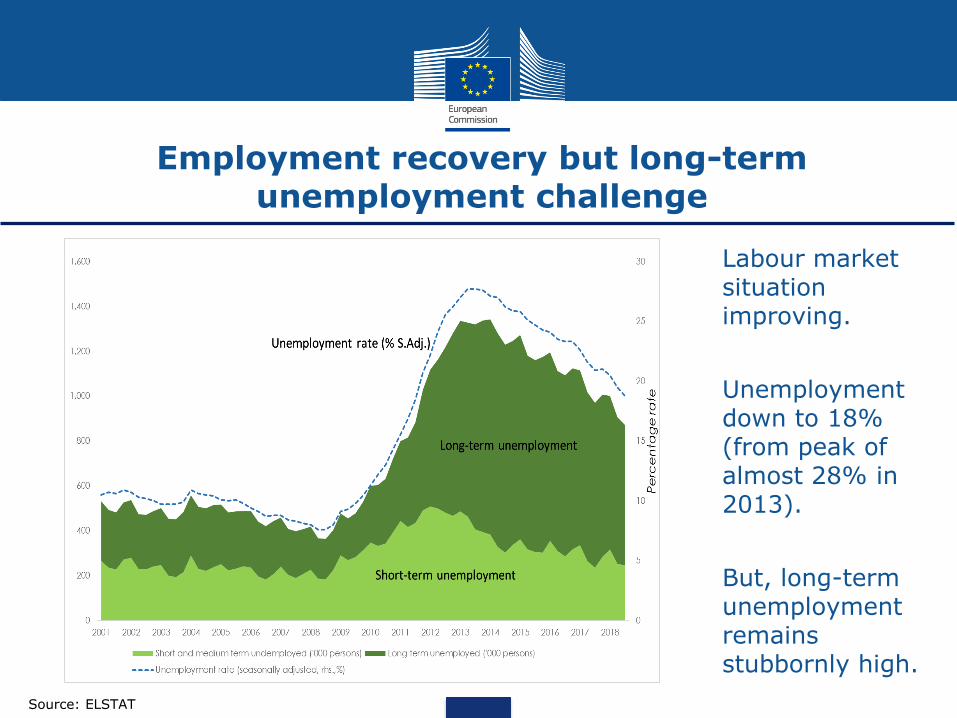
Employment recovery but long-term unemployment challenge
Labour market situation improving.
Unemployment down to 18% (from peak of almost 28% in 2013).
But, long-term unemployment remains stubbornly high.
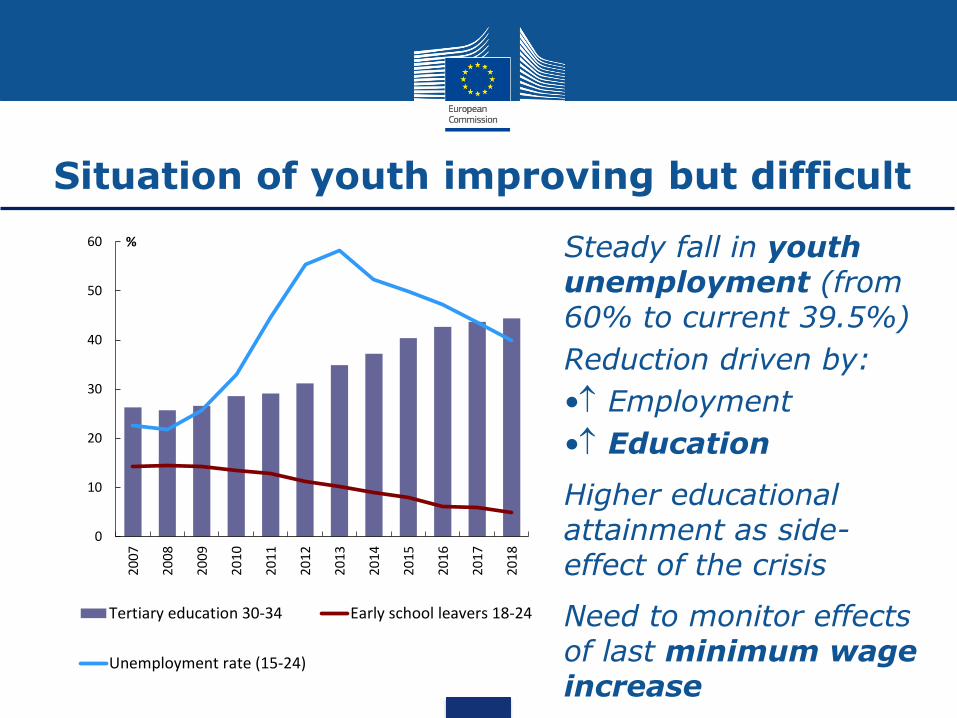
Situation of youth improving but difficult
Steady fall in youth unemployment (from 60% to current 39.5%)
Reduction driven by:
• Employment
• Education
Higher educational attainment as side-effect of the crisis
Need to monitor effects of last minimum wage increase
0
10
20
30
40
50
60
20
07
20
08
20
09
20
10
20
11
20
12
20
13
20
14
20
15
20
16
20
17
20
18
%
Tertiary education 30-34 Early school leavers 18-24
Unemployment rate (15-24)
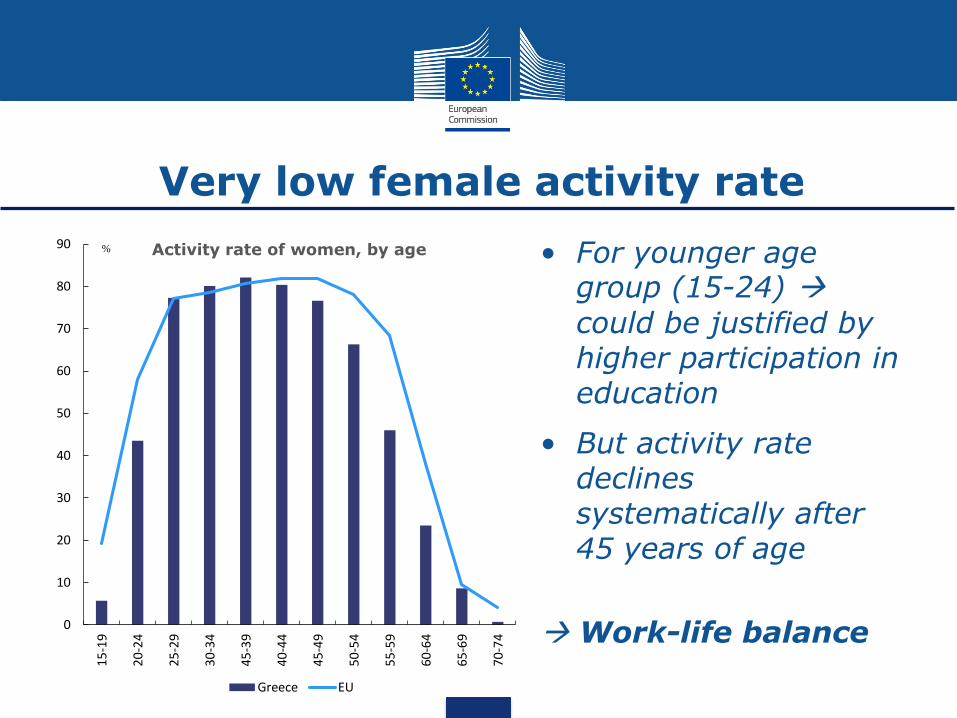
Very low female activity rate
• For younger age group (15-24)
could be justified by higher participation in education
• But activity rate declines systematically after 45 years of age
Work-life balance0
10
20
30
40
50
60
70
80
90
15-1
9
20-2
4
25-2
9
30-3
4
45-3
9
40-4
4
45-4
9
50-5
4
55-5
9
60-6
4
65-6
9
70-7
4
Activity rate of women, by age
Greece EU
%
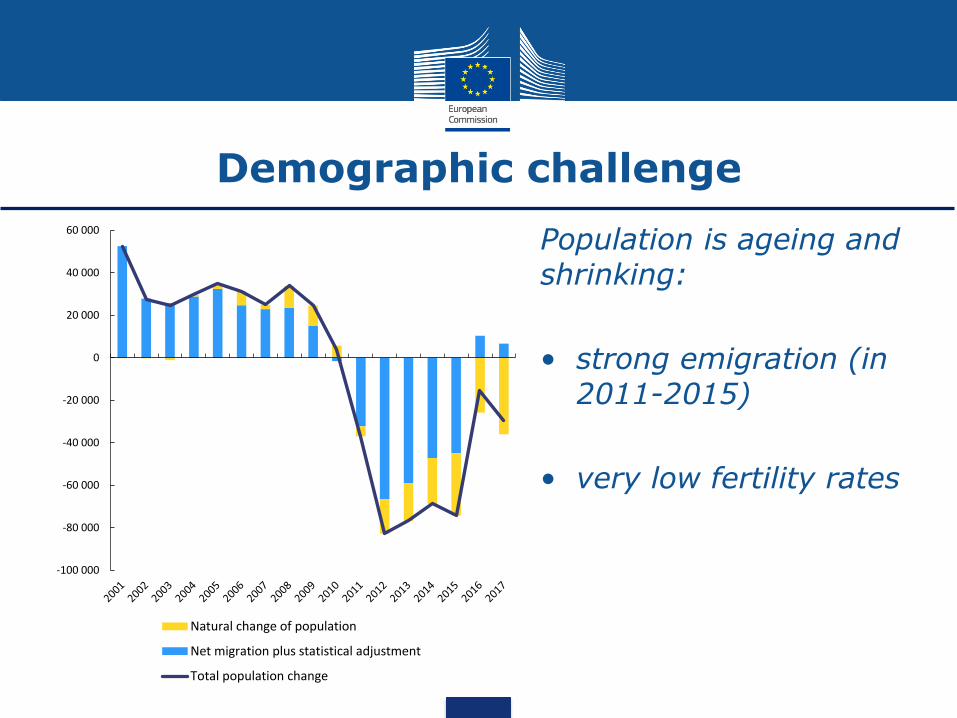
Demographic challenge
Population is ageing and shrinking:
• strong emigration (in 2011-2015)
• very low fertility rates
-100 000
-80 000
-60 000
-40 000
-20 000
0
20 000
40 000
60 000
Natural change of population
Net migration plus statistical adjustment
Total population change
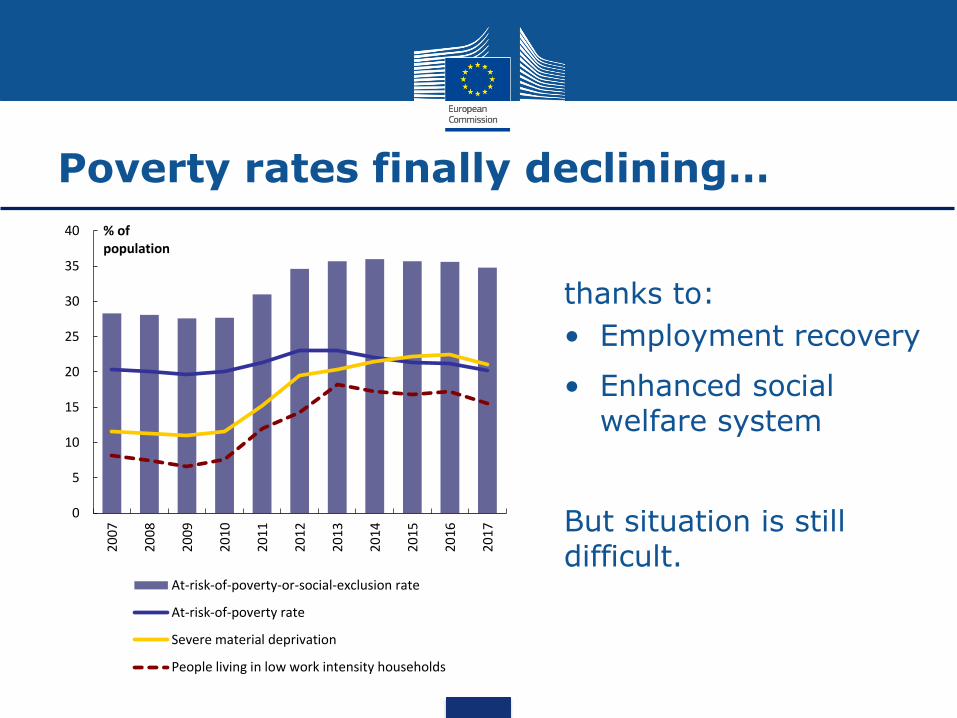
Poverty rates finally declining…
thanks to:
• Employment recovery
• Enhanced social welfare system
But situation is still difficult.
0
5
10
15
20
25
30
35
40
20
07
20
08
20
09
20
10
20
11
20
12
20
13
20
14
20
15
20
16
20
17
% of population
At-risk-of-poverty-or-social-exclusion rate
At-risk-of-poverty rate
Severe material deprivation
People living in low work intensity households
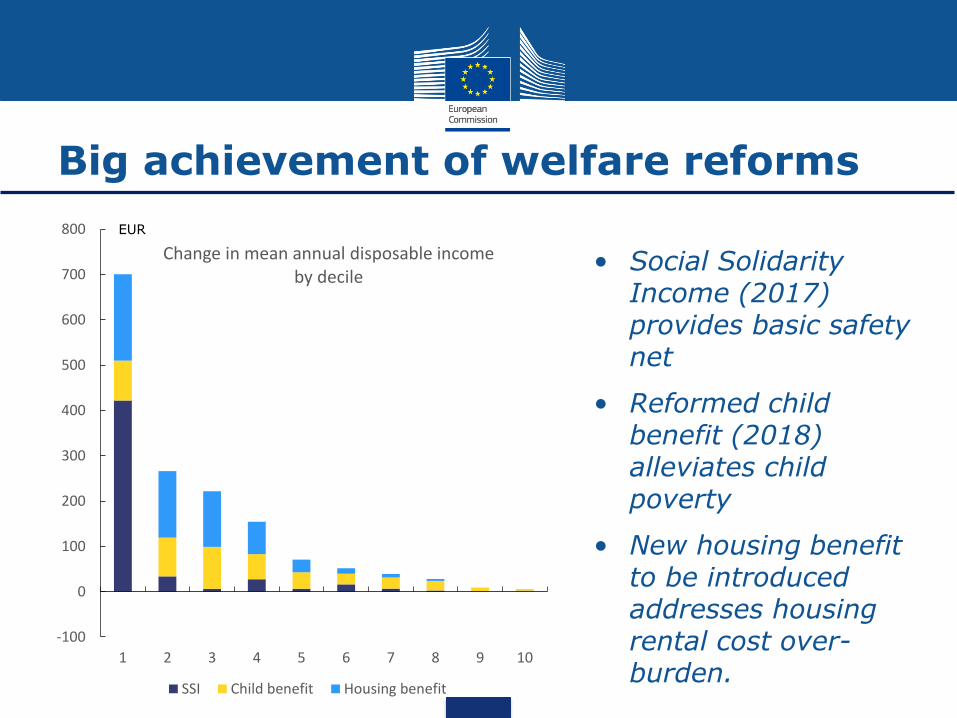
Big achievement of welfare reforms
• Social Solidarity Income (2017) provides basic safety net
• Reformed child benefit (2018) alleviates child poverty
• New housing benefit to be introduced addresses housing rental cost over-burden.
-100
0
100
200
300
400
500
600
700
800
1 2 3 4 5 6 7 8 9 10
Change in mean annual disposable incomeby decile
SSI Child benefit Housing benefit
EUR
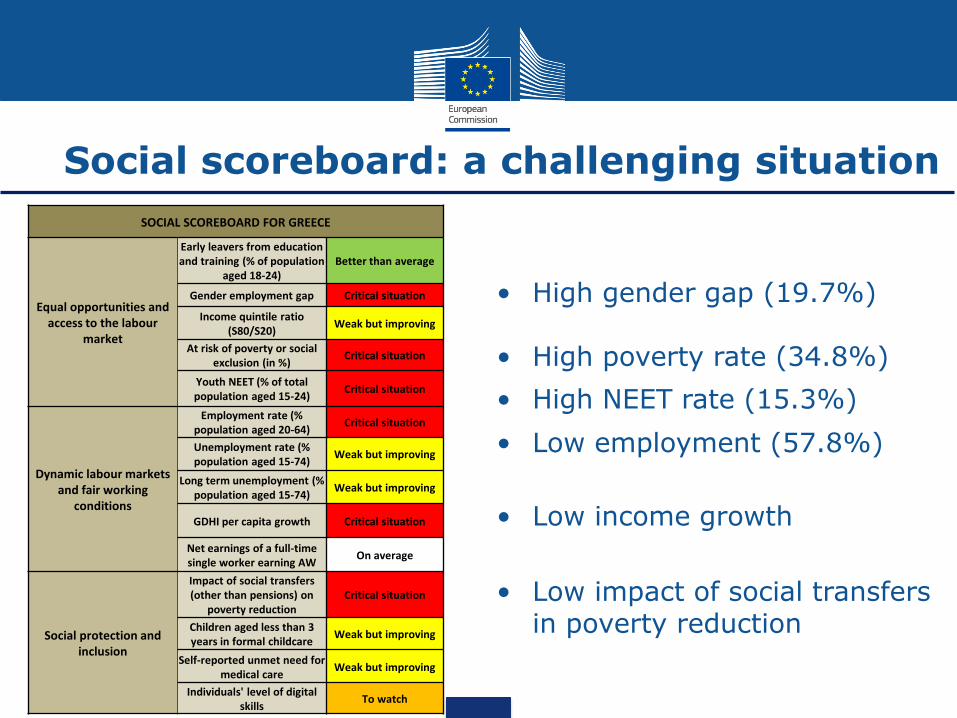
Social scoreboard: a challenging situation
SOCIAL SCOREBOARD FOR GREECE
Equal opportunities and access to the labour
market
Early leavers from education and training (% of population
aged 18-24)Better than average
Gender employment gap Critical situation
Income quintile ratio (S80/S20)
Weak but improving
At risk of poverty or social exclusion (in %)
Critical situation
Youth NEET (% of total population aged 15-24)
Critical situation
Dynamic labour markets and fair working
conditions
Employment rate (% population aged 20-64)
Critical situation
Unemployment rate (% population aged 15-74)
Weak but improving
Long term unemployment (% population aged 15-74)
Weak but improving
GDHI per capita growth Critical situation
Net earnings of a full-time single worker earning AW
On average
Social protection and inclusion
Impact of social transfers (other than pensions) on
poverty reductionCritical situation
Children aged less than 3 years in formal childcare
Weak but improving
Self-reported unmet need for medical care
Weak but improving
Individuals' level of digital skills
To watch
• High gender gap (19.7%)
• High poverty rate (34.8%)
• High NEET rate (15.3%)
• Low employment (57.8%)
• Low income growth
• Low impact of social transfers in poverty reduction
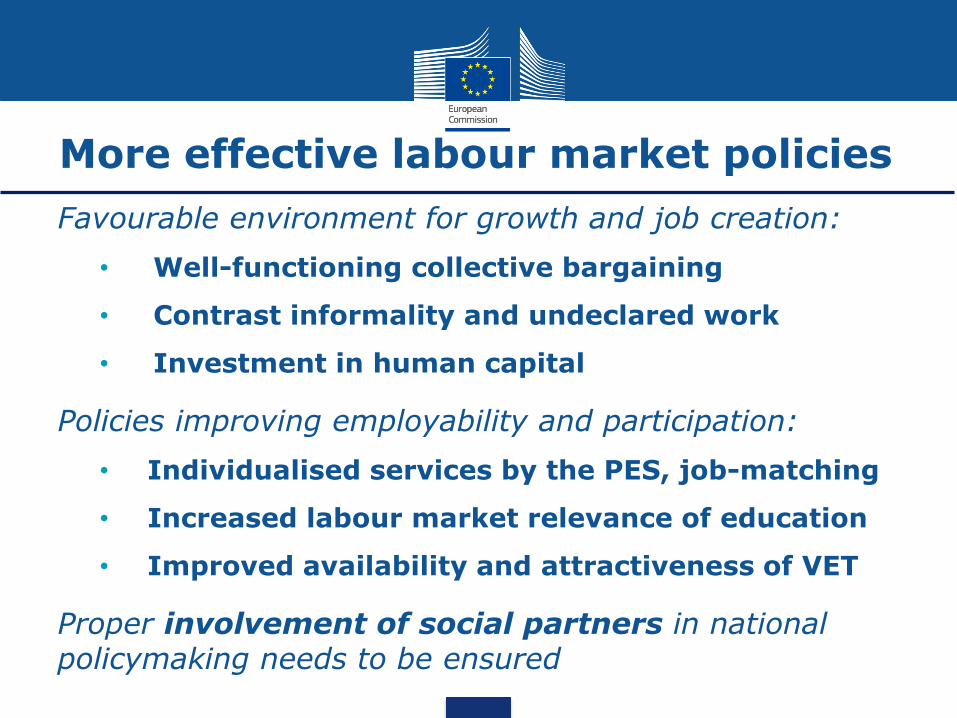
More effective labour market policies
Favourable environment for growth and job creation:
• Well-functioning collective bargaining
• Contrast informality and undeclared work
• Investment in human capital
Policies improving employability and participation:
• Individualised services by the PES, job-matching
• Increased labour market relevance of education
• Improved availability and attractiveness of VET
Proper involvement of social partners in national policymaking needs to be ensured
Concrete actions in line with commitments
Improved support for the unemployed
Modernisation of public employment service
More effective design and delivery of active labour market policies
Full implementation of Action plan to fight undeclared work
On-going modernisation of the social welfaresystem
Completion of setup of single pension fund EFKA
Completion of primary health care system
Completion of the disability benefits

Ευχαριστώ!
28