Embed Size (px)
Citation preview
Europe’s tax deals for diesel Annex 1: Country specific graphs October 2015 In house analysis by Transport & Environment, with data support from CE Delft Published by Transport & Environment
For more information, contact: Carlos Calvo Ambel Policy Analyst Transport & Environment [email protected] Tel: +32(0)2 851 02 13
a study by
2
a study by
Legend
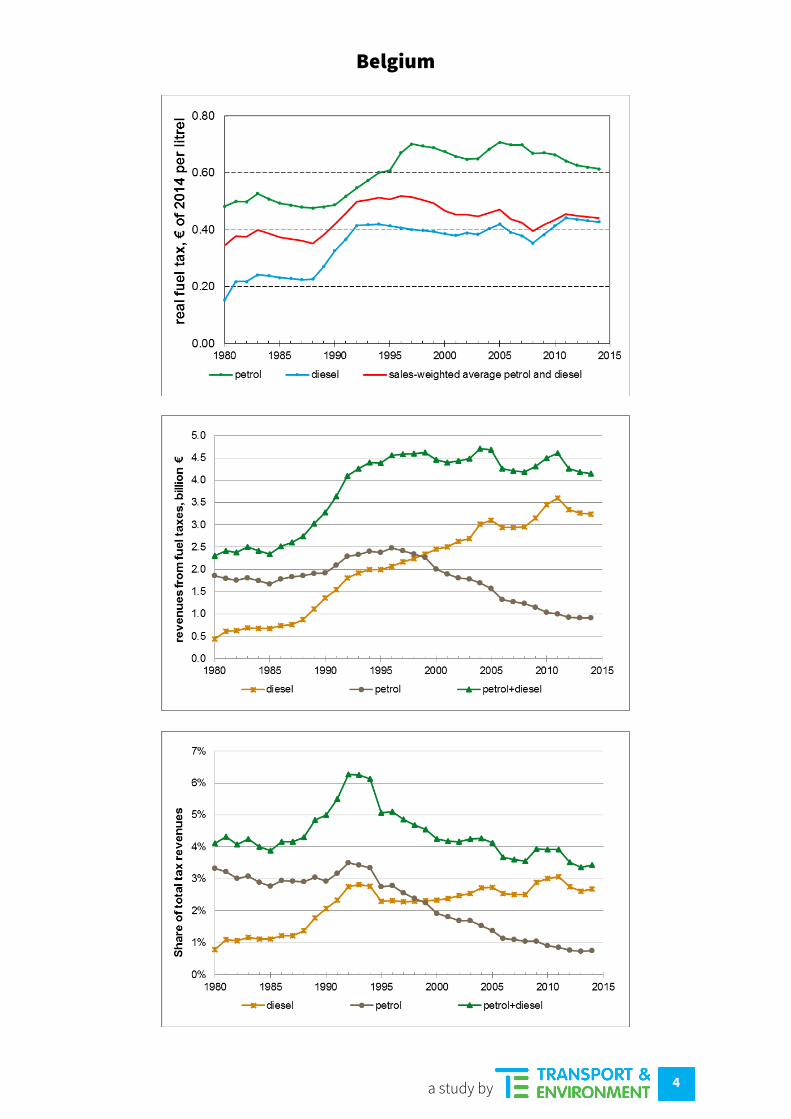
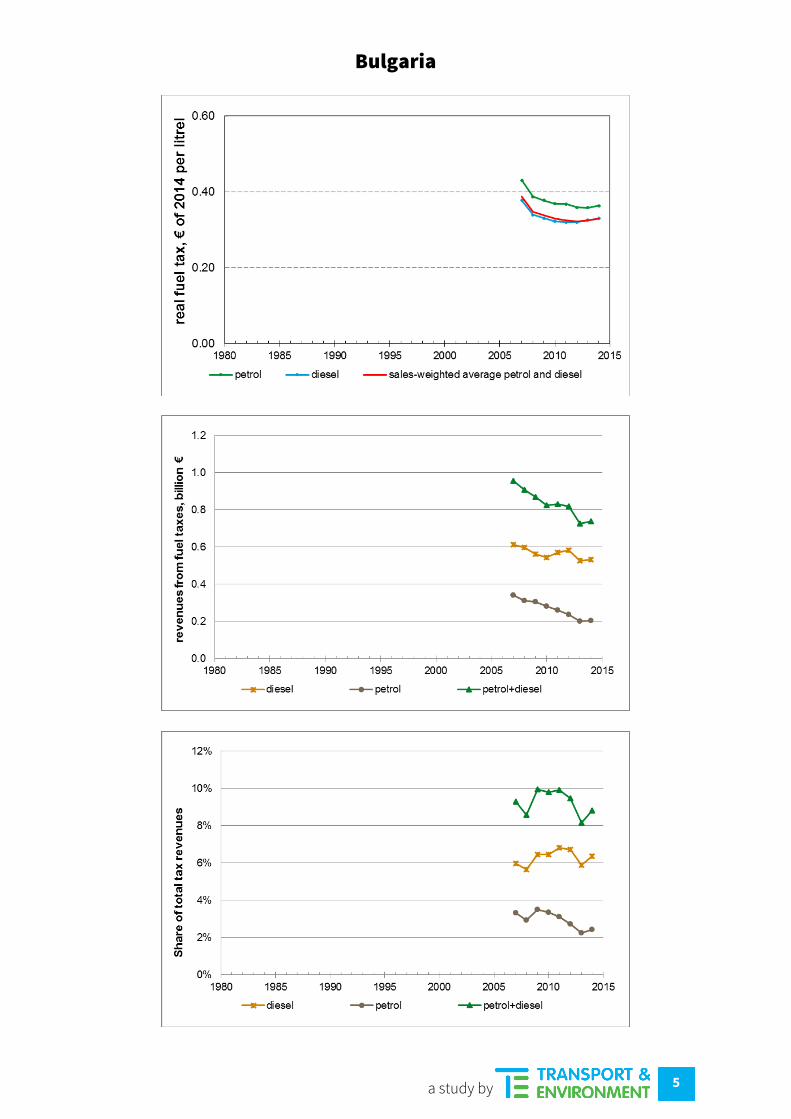
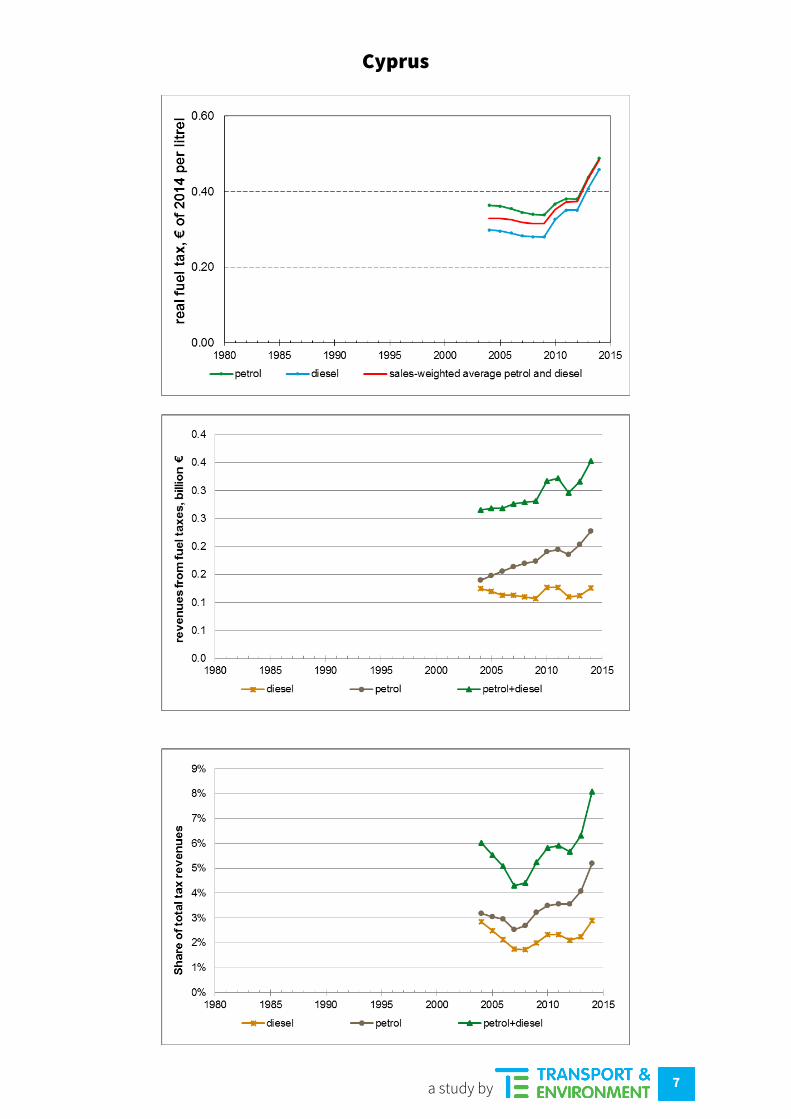
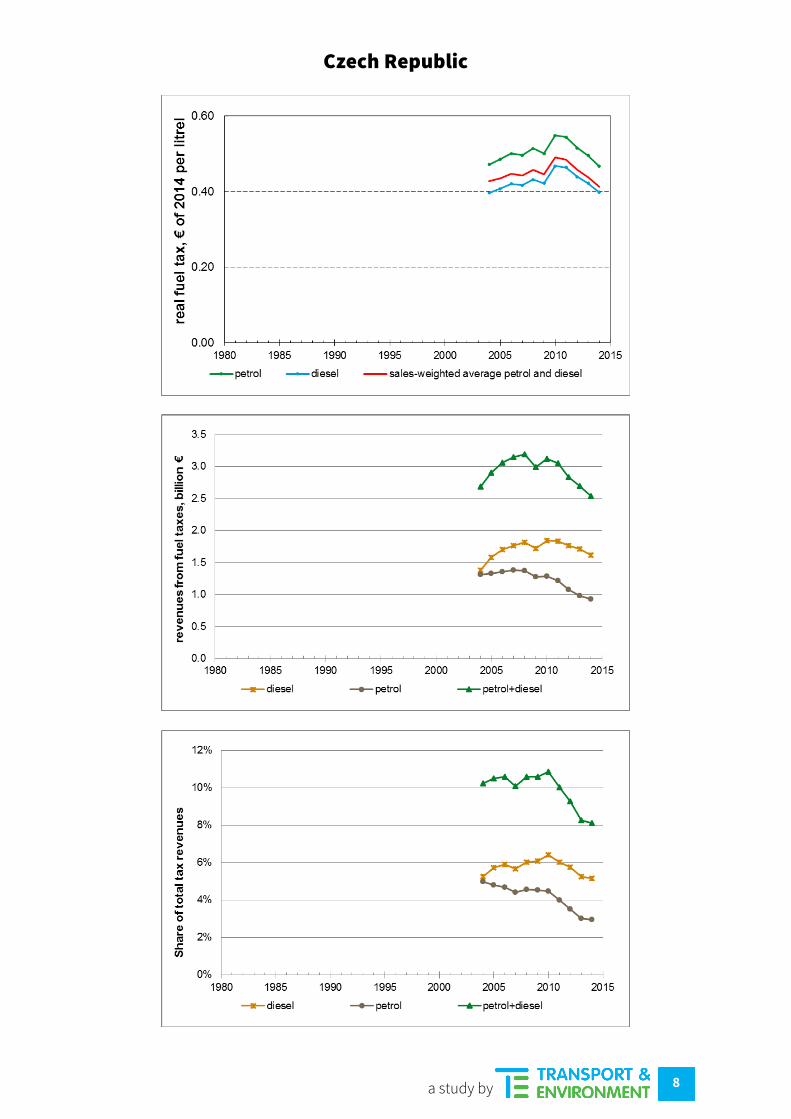
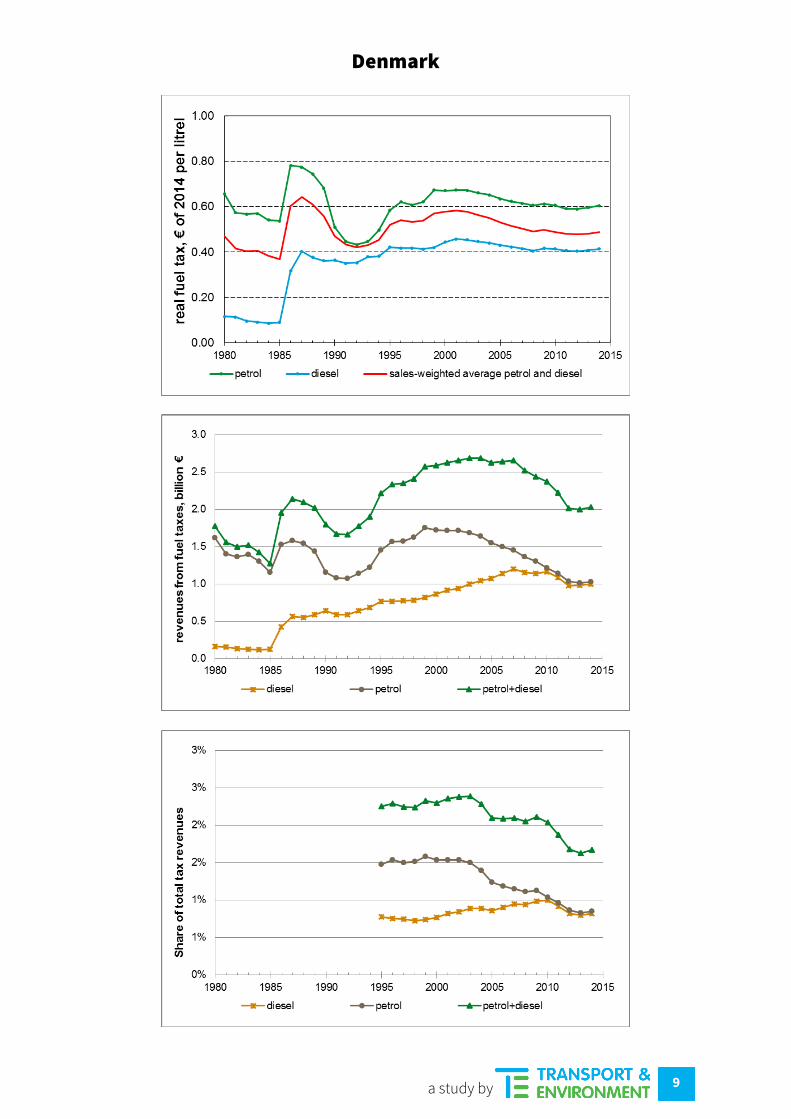
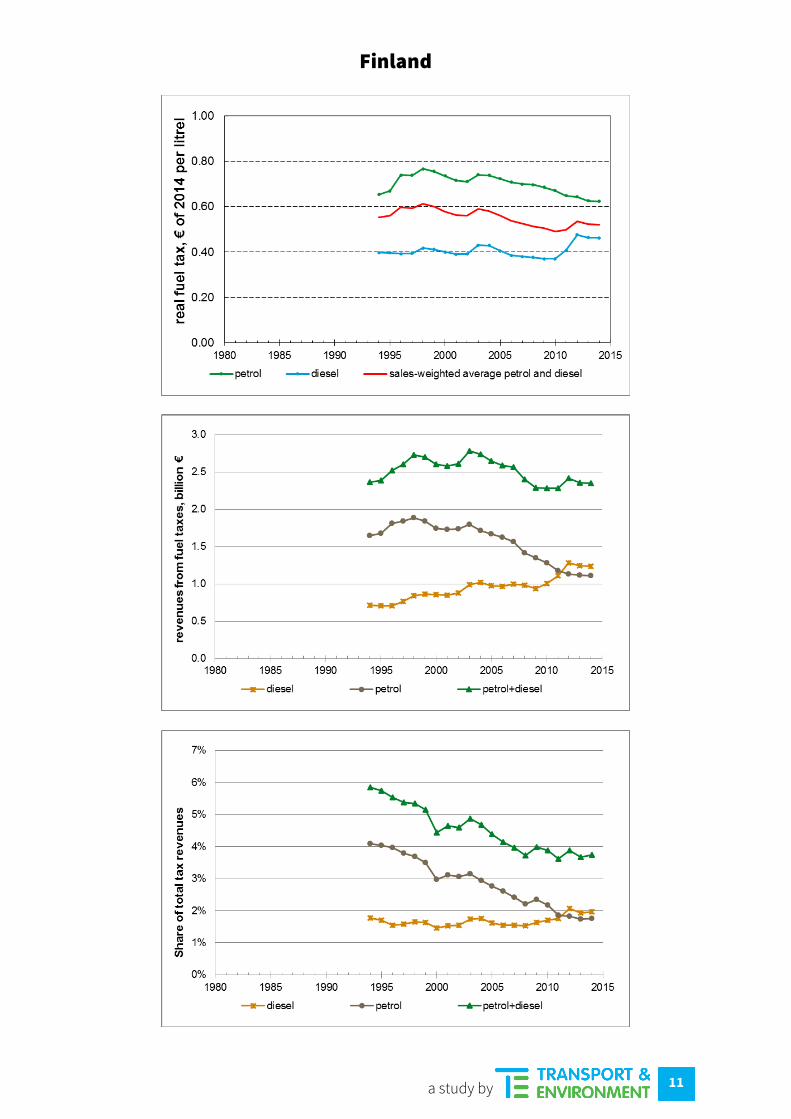
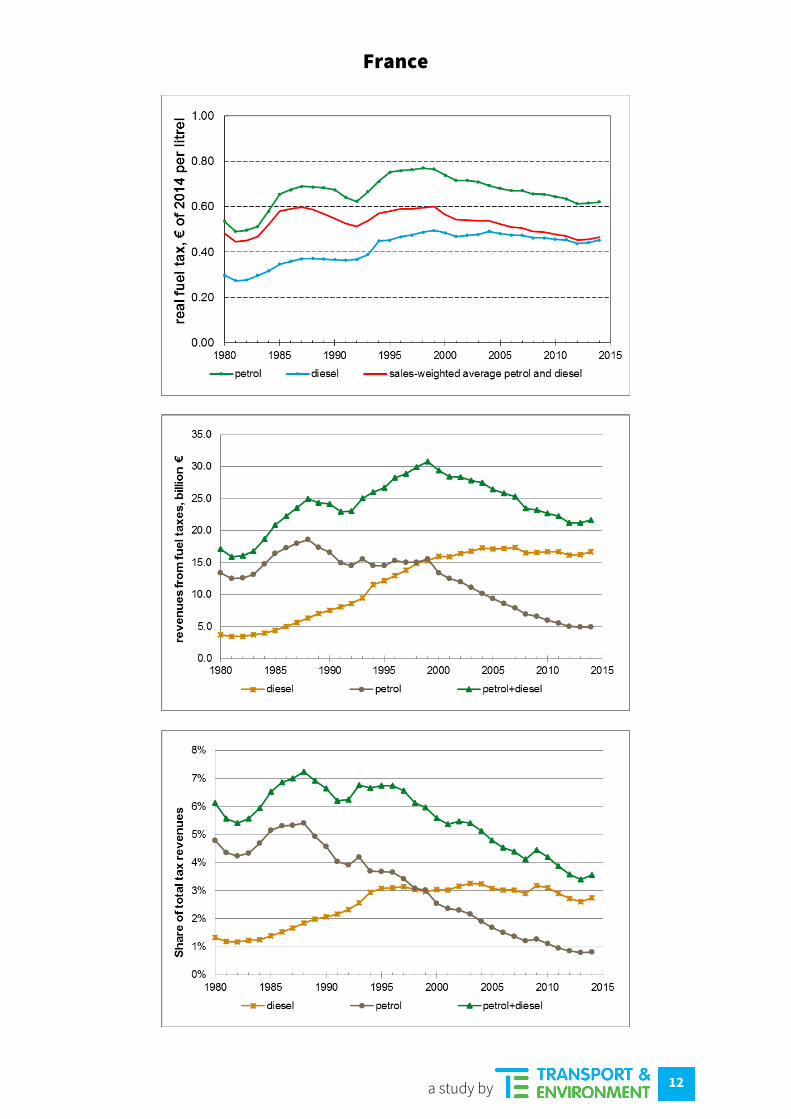
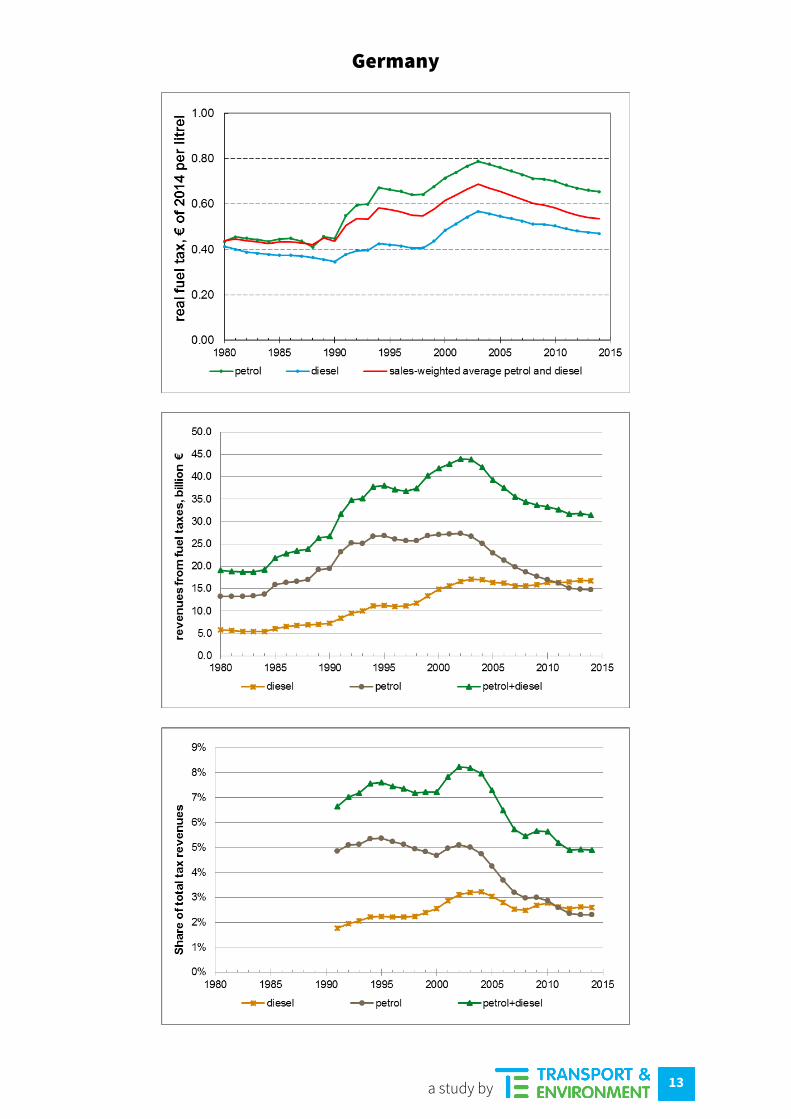
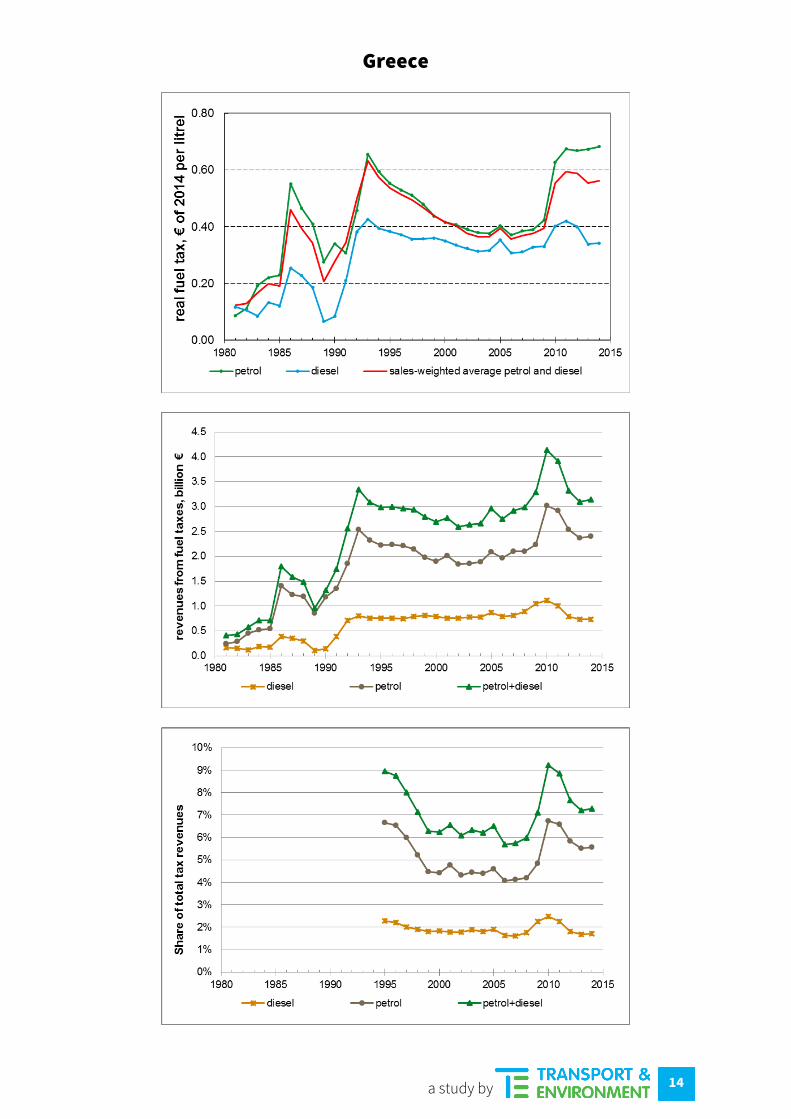
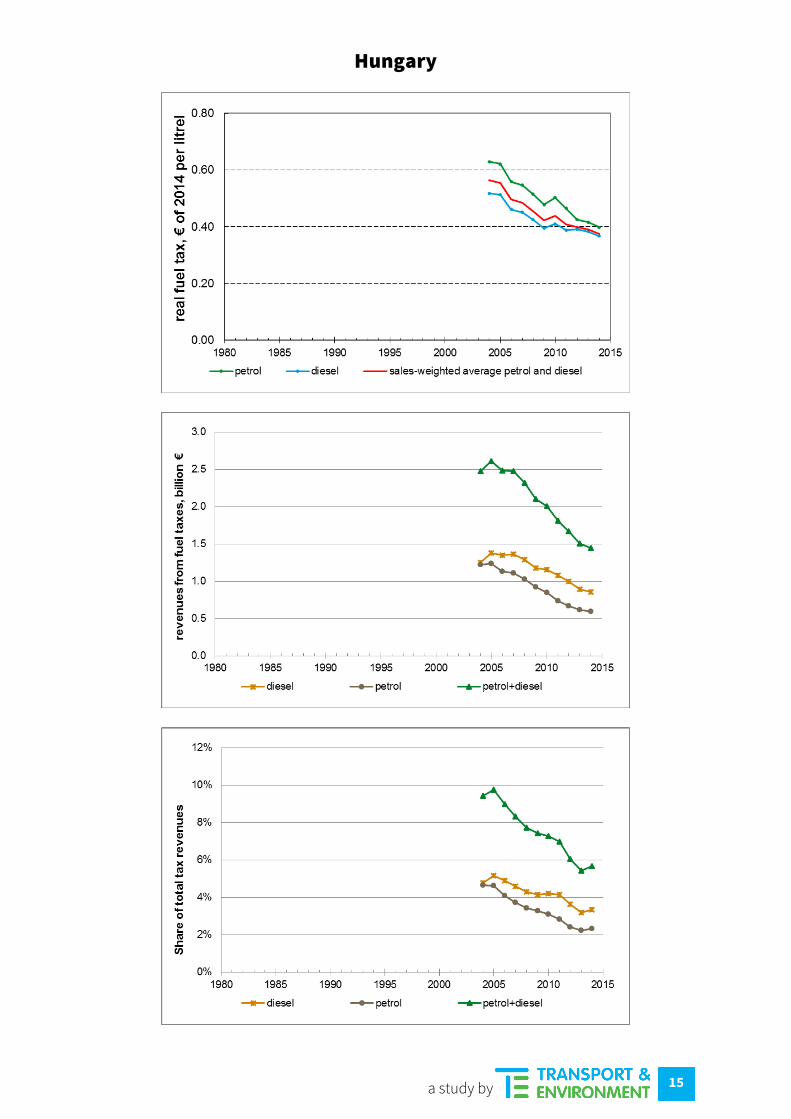
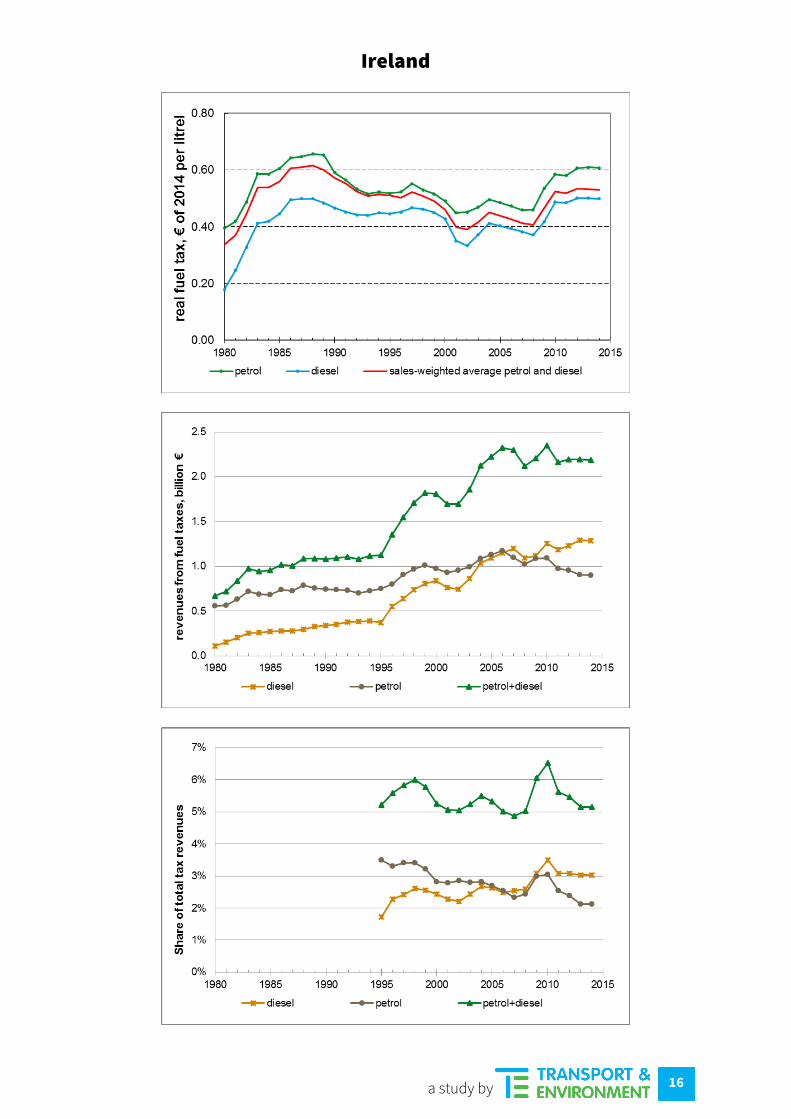
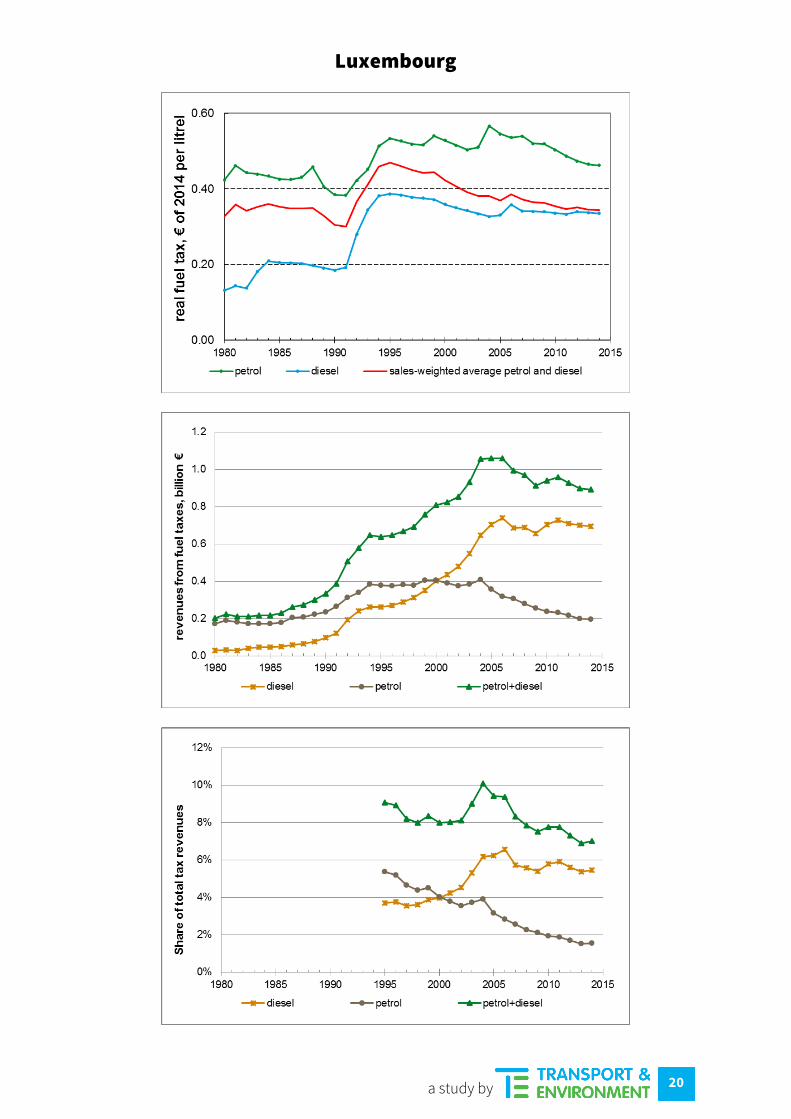
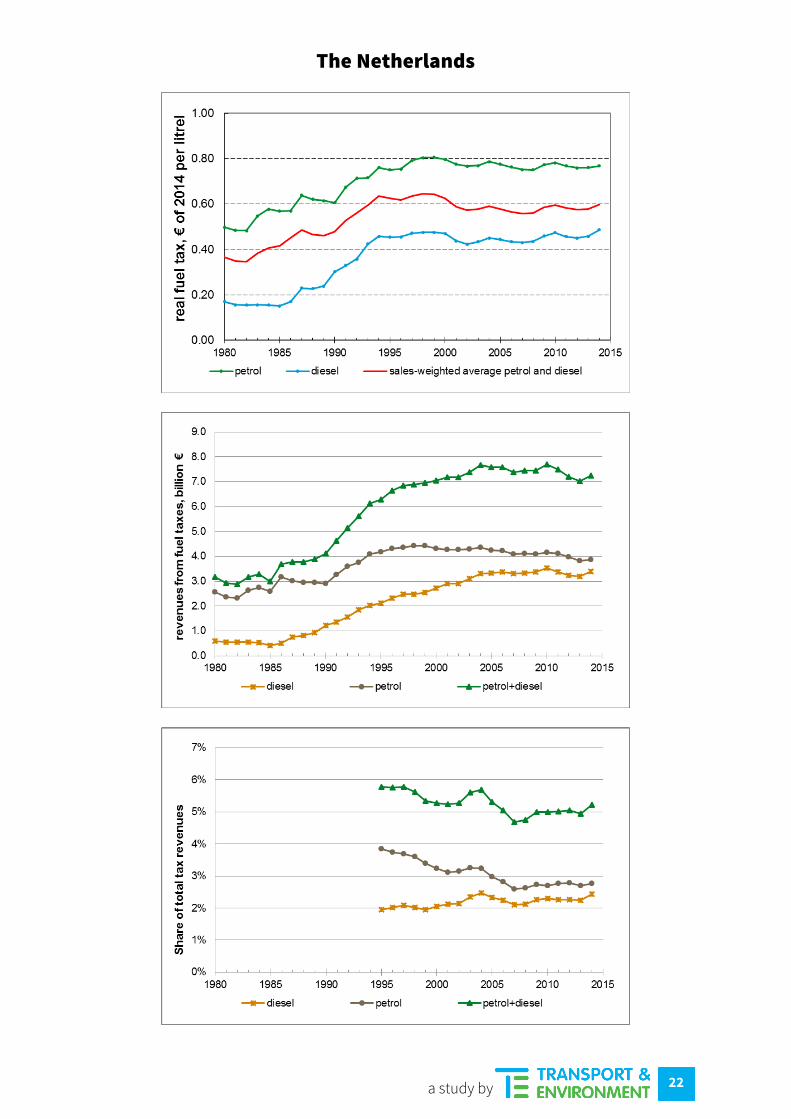
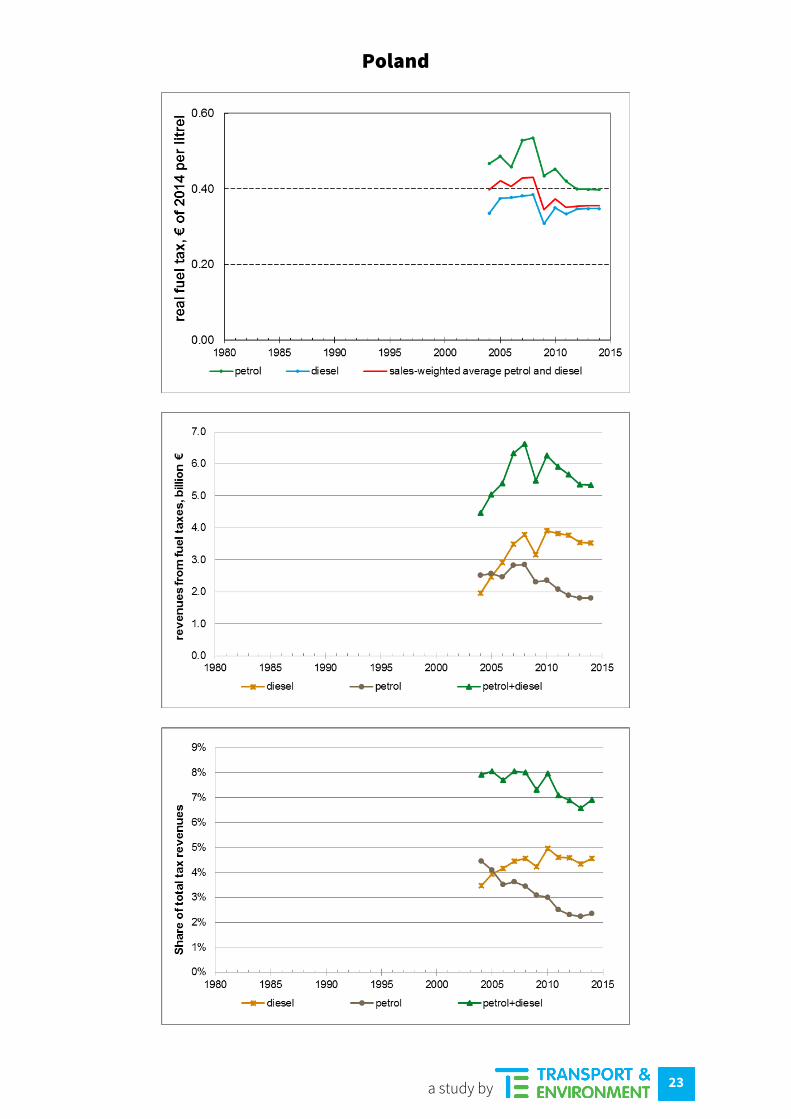
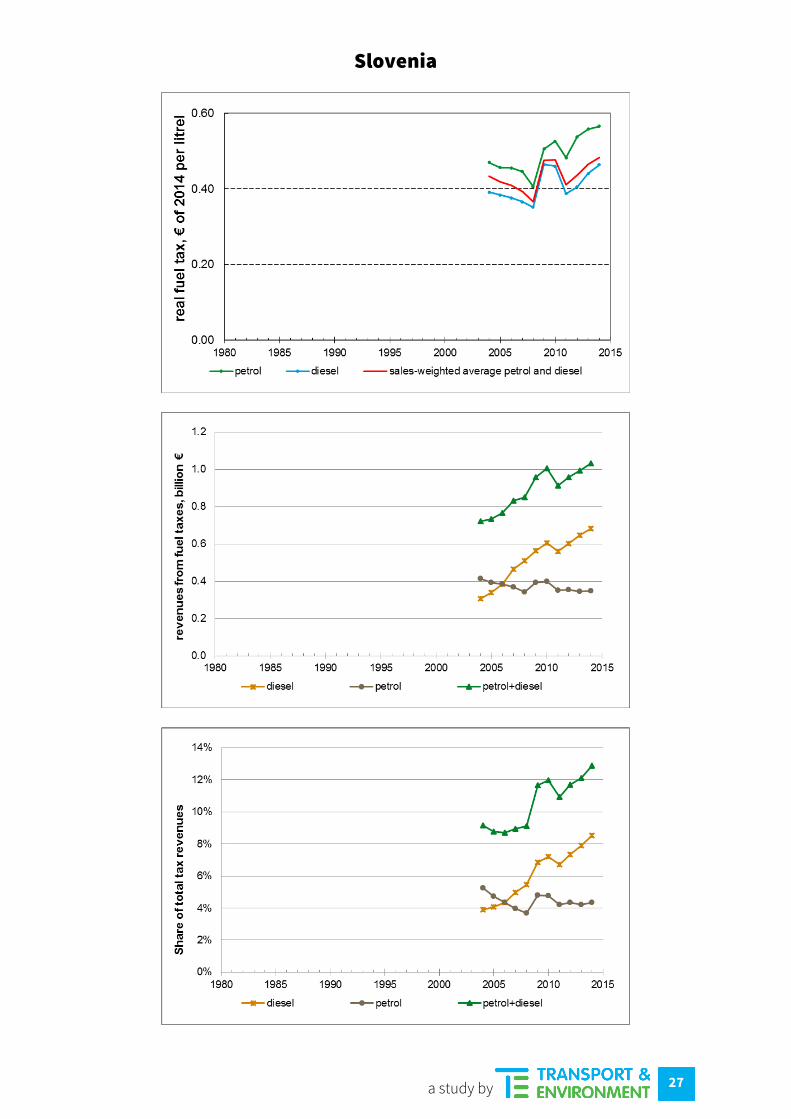
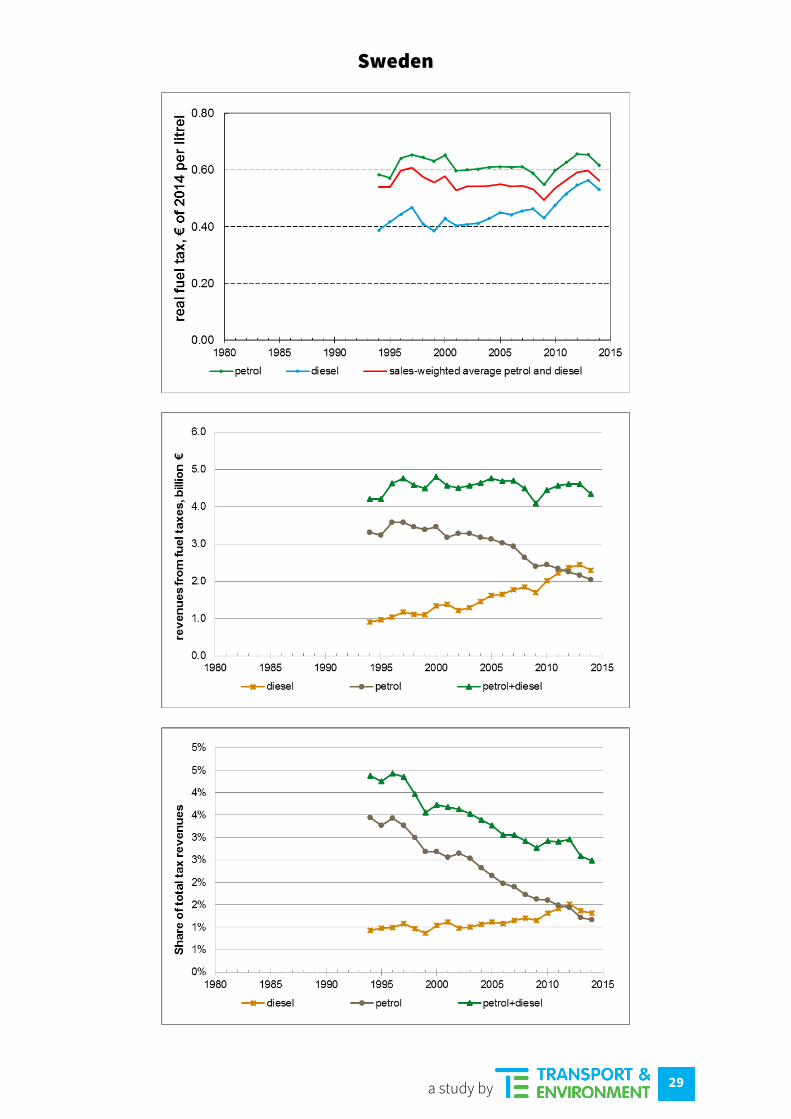
The following pages present some of the main graphs per country. Below is an explanation for each of the three graphs per country, in the order of appearance.
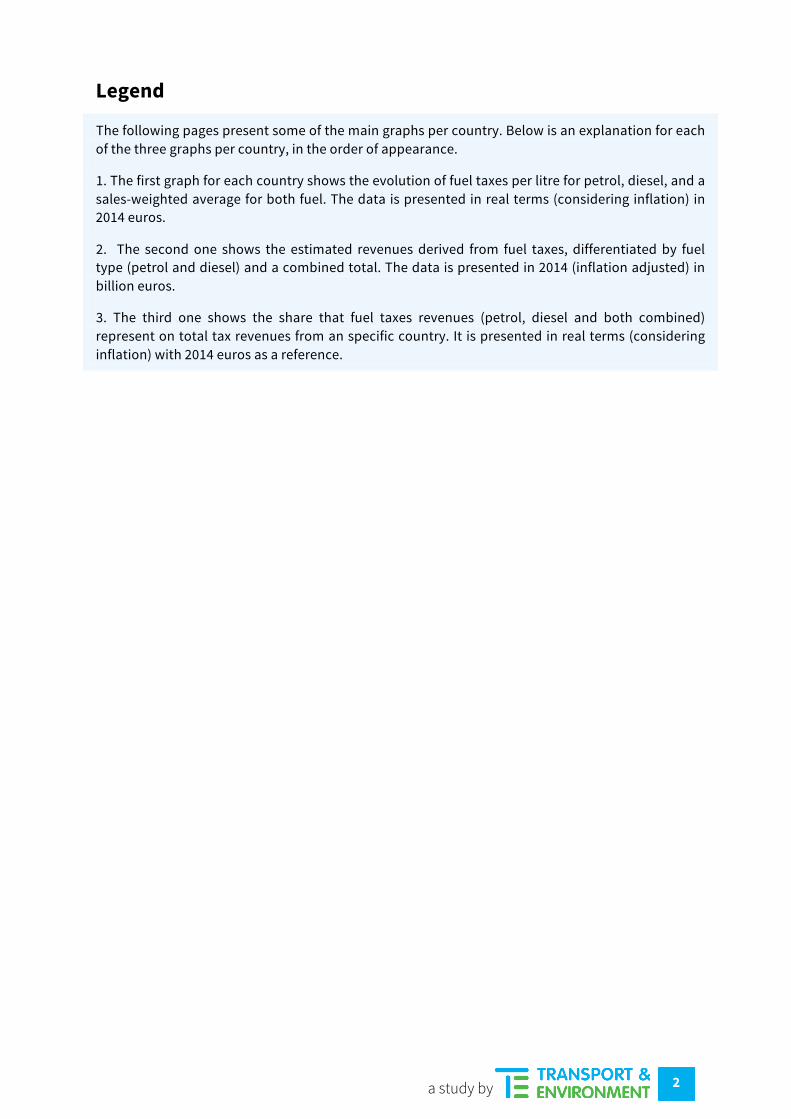
1. The first graph for each country shows the evolution of fuel taxes per litre for petrol, diesel, and a sales-weighted average for both fuel. The data is presented in real terms (considering inflation) in 2014 euros.
2. The second one shows the estimated revenues derived from fuel taxes, differentiated by fuel type (petrol and diesel) and a combined total. The data is presented in 2014 (inflation adjusted) in billion euros.
3. The third one shows the share that fuel taxes revenues (petrol, diesel and both combined) represent on total tax revenues from an specific country. It is presented in real terms (considering inflation) with 2014 euros as a reference.
3
a study by
Austria
4
a study by
Belgium
5
a study by
Bulgaria

6
a study by
Croatia
7
a study by
Cyprus
8
a study by
Czech Republic
9
a study by
Denmark

10
a study by
Estonia
11
a study by
Finland
12
a study by
France
13
a study by
Germany
14
a study by
Greece
15
a study by
Hungary
16
a study by
Ireland

17
a study by
Italy

18
a study by
Latvia

19
a study by
Lithuania
20
a study by
Luxembourg

21
a study by
Malta
22
a study by
The Netherlands
23
a study by
Poland

24
a study by
Portugal

25
a study by
Romania

26
a study by
Slovakia
27
a study by
Slovenia

28
a study by
Spain
29
a study by
Sweden

30
a study by
United Kingdom

31
a study by
Switzerland


![Tax and Duty Appeals Manual - [Tax and Duty Appeals Manual]€¦ · (Appeals) section of the ‘Income Tax Capital Gains Tax Corporation Tax’ TDM. It deals primarily with appeals](https://img.pdfslide.net/doc/110x75/5f5da6e540c1206ec80f8f94/tax-and-duty-appeals-manual-tax-and-duty-appeals-manual-appeals-section-of.jpg)