Embed Size (px)
Citation preview
1Scientific RepoRts | (2019) 9:1068 | https://doi.org/10.1038/s41598-018-37680-7
www.nature.com/scientificreports
europium (III) as a Circularly polarized Luminescence probe of DNA structuretao Wu , petr Bouř & Valery Andrushchenko
We report as a proof-of-concept the first application of circularly polarized luminescence (CPL) measured with a Raman optical activity (ROA) spectrometer to differentiate several DNA structures without need of sensitizing complexes. The ROA/CPL approach provides sufficiently high CPL intensity to use hydrated eu3+ ions, thus avoiding DNA structural changes associated with binding of sensitizers and overcoming the sensitizer quenching issue. We showed that deoxyguanosine monophosphate (dGMP), single- and double-stranded DNA provide different CPL spectra, which could be used for their discrimination. our results demonstrate that RoA/CpL method is a promising approach to measure CpL spectra of complex biomolecules when the use of sensitizers is not possible. the method can be extended to other biomolecules, such as proteins, lipids, sugars, etc.
Circularly polarized luminescence (CPL) of lanthanides is extremely sensitive to local molecular environment. Compared to the total luminescence (TL)1–7, CPL provides additional information on chirality and conforma-tion of studied systems8,9. Because the nearly forbidden transitions within the f electronic states of lanthanides normally provide only a weak intensity, sensitizing organic complexes must be used to increase the emission9–12.
However, application of CPL to DNA studies using commercial CPL spectrometers has been so far unsuc-cessful due to low signal intensity and quenching of the luminescence of sensitizing agents upon their binding to DNA10–12. Furthermore, the sensitizers can distort the DNA structure upon intercalation11.
In the present work we demonstrate a proof-of-concept that lanthanide CPL can be successfully measured for DNA using Raman optical activity (ROA) spectrometer (ROA/CPL method13). The method provides sufficiently high intensity of the CPL signal to avoid sensitizing complexes and use bare (hydrated-only) lanthanide ions at relatively low concentrations. Eu3+ is the most suitable metal because its excitation energy (5D0 → 7F1) is close to the 532 nm wavelength of the excitation laser used in the ROA spectrometer. Different DNA model systems tested in the present work provided distinct CPL spectra, allowing for their discrimination. Vibrational ROA signal (difference in scattering of the right and left circularly polarized light) is present in the spectrum as well, generally enabling measurement of four spectral types (TL, CPL, Raman and ROA spectra) in a single experiment, which makes the approach very attractive for structural studies of biomolecules. It has been recently shown that the method can be successfully used for studies of sugars, amino acids and proteins14,15. In the future, we plan to investigate the effect of DNA base content, conformation, number of strands, salt content, pH and temperature on the CPL signal.
Results and DiscussionGeneral Features of RoA/CpL spectra of eu3+ Complexed with DNA Model systems. CPL spec-tra of Eu3+ aqua-ion bound to dGMP and three model DNA systems are presented in Fig. 1. The CPL band shapes significantly vary, indicating different local chiral environment of Eu3+ and suggesting different binding modes and sites.
Further analysis can help us to understand the spectra better. Lanthanide luminescence can be clearly distin-guished from the vibrational Raman signal by application of an external magnetic field (Supplementary Fig. S1), which also helps to further resolve and assign the luminescence bands (Supplementary Table S1). Europium binding to the DNA samples changes the spherical (on average) Eu3+ symmetry and its total luminescence (cf. Figure 1b and Supplementary Fig. S1). Particularly, a very weak band around 1521 cm−1 (579 nm) in EuCl3 water solution (5D0 → 7F0) (Supplementary Fig. S1), known to be especially symmetry-sensitive16, increases in intensity
Institute of Organic Chemistry and Biochemistry, Czech Academy of Sciences, Flemingovo náměstí 2, 16610, Prague 6, Czech Republic. Correspondence and requests for materials should be addressed to V.A. (email: [email protected])
Received: 12 October 2018
Accepted: 12 December 2018
Published: xx xx xxxx
opeN

www.nature.com/scientificreports/
2Scientific RepoRts | (2019) 9:1068 | https://doi.org/10.1038/s41598-018-37680-7
and shifts to cca. 1530 cm−1 upon metal binding to DNA (Fig. 1b). Table 1 outlines assignments of the main lumi-nescence bands observed in Eu3+-DNA complexes. The highest intensity bands around 1800–2000 cm−1 (588–595 nm) originate from degenerate sublevels of 5D0 → 7F1 europium transition17. The TL band around 1530 cm−1 (5D0 → 7F0 transition) does not show measurable CPL except for the case of DNA2 (1533 cm−1). Although the bands above 2450 cm−1 (>610 nm) (5D0 → 7F2 transition) are not accessible with our instrument, they could be measured with extended-range custom-made ROA spectrometers18,19, thus this is not a general limitation of the method.
RoA/CpL spectra of eu3+ Complexes with dGMp. Despite the very low [Eu3+]/[dGMP] ratio of 0.001, the metal ion binding to dGMP is easily detectable by the presence of a strong CPL signal in the region of 1700–2200 cm−1 (585–603 nm). The TL/CPL spectra are complemented by the rich Raman and ROA spectra in the 200–1600 cm−1 range. The (+/−) CPL pattern observed at [Eu3+]/[dGMP] = 0.001 (170 mM of dGMP) changed
Figure 1. ROA/CPL (a) and Raman/TL (b) spectra of blank dGMP and dGMP, DNA1, DNA2 and DNA3 complexes with EuCl3. The spectral ranges corresponding to mainly ROA/Raman and mainly CPL/TL signal are indicated with curly brackets. IL and IR represent the corresponding intensities of left- and right-circularly polarized emission or Raman scattering. The details on the sample concentrations are provided in Supplementary Information.
dGMP DNA1 DNA2 DNA3
Eu3+ transitionδ λ δ λ δ λ δ λ
>2450 >610 >2450 >610 >2450 >610 >2450 >610 5D0 → 7F2
2019 596 1997 595 2023 596 2030 596 5D0 → 7F1
1995 595 1993 595 1993 595 1990 595 ″
1933 593 1917 592 ″
1890 591 1899 592 1907 592 1897 592 ″
1872 591 1829 589 1813 589 1802 588 ″
1825 589 1833 589 1819 589 1820 589 5D0 → 7F1
1528 579 1533 579 1530 579 5D0 → 7F0
Table 1. Positions of the luminescence bands (Raman shift δ in cm−1 and wavelength λ in nm) observed in CPL spectra of dGMP and DNA complexes with Eu3+.
www.nature.com/scientificreports/
3Scientific RepoRts | (2019) 9:1068 | https://doi.org/10.1038/s41598-018-37680-7
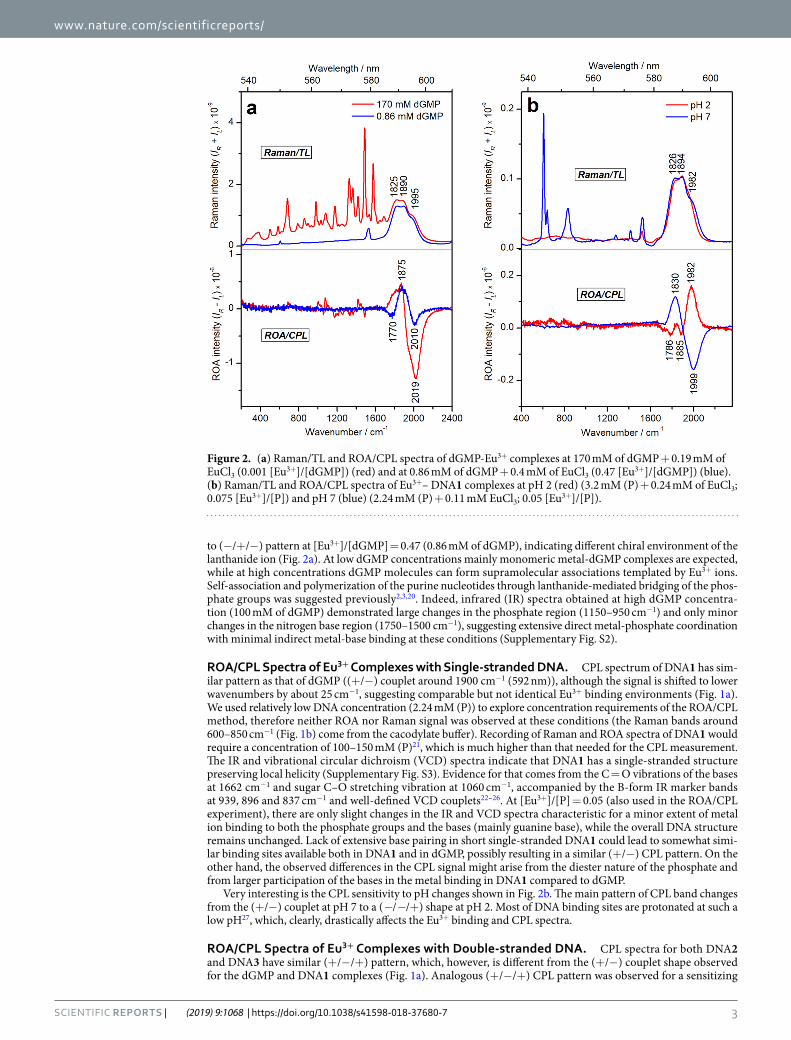
to (−/+/−) pattern at [Eu3+]/[dGMP] = 0.47 (0.86 mM of dGMP), indicating different chiral environment of the lanthanide ion (Fig. 2a). At low dGMP concentrations mainly monomeric metal-dGMP complexes are expected, while at high concentrations dGMP molecules can form supramolecular associations templated by Eu3+ ions. Self-association and polymerization of the purine nucleotides through lanthanide-mediated bridging of the phos-phate groups was suggested previously2,3,20. Indeed, infrared (IR) spectra obtained at high dGMP concentra-tion (100 mM of dGMP) demonstrated large changes in the phosphate region (1150–950 cm−1) and only minor changes in the nitrogen base region (1750–1500 cm−1), suggesting extensive direct metal-phosphate coordination with minimal indirect metal-base binding at these conditions (Supplementary Fig. S2).
RoA/CpL spectra of eu3+ Complexes with single-stranded DNA. CPL spectrum of DNA1 has sim-ilar pattern as that of dGMP ((+/−) couplet around 1900 cm−1 (592 nm)), although the signal is shifted to lower wavenumbers by about 25 cm−1, suggesting comparable but not identical Eu3+ binding environments (Fig. 1a). We used relatively low DNA concentration (2.24 mM (P)) to explore concentration requirements of the ROA/CPL method, therefore neither ROA nor Raman signal was observed at these conditions (the Raman bands around 600–850 cm−1 (Fig. 1b) come from the cacodylate buffer). Recording of Raman and ROA spectra of DNA1 would require a concentration of 100–150 mM (P)21, which is much higher than that needed for the CPL measurement. The IR and vibrational circular dichroism (VCD) spectra indicate that DNA1 has a single-stranded structure preserving local helicity (Supplementary Fig. S3). Evidence for that comes from the C = O vibrations of the bases at 1662 cm−1 and sugar C–O stretching vibration at 1060 cm−1, accompanied by the B-form IR marker bands at 939, 896 and 837 cm−1 and well-defined VCD couplets22–26. At [Eu3+]/[P] = 0.05 (also used in the ROA/CPL experiment), there are only slight changes in the IR and VCD spectra characteristic for a minor extent of metal ion binding to both the phosphate groups and the bases (mainly guanine base), while the overall DNA structure remains unchanged. Lack of extensive base pairing in short single-stranded DNA1 could lead to somewhat simi-lar binding sites available both in DNA1 and in dGMP, possibly resulting in a similar (+/−) CPL pattern. On the other hand, the observed differences in the CPL signal might arise from the diester nature of the phosphate and from larger participation of the bases in the metal binding in DNA1 compared to dGMP.
Very interesting is the CPL sensitivity to pH changes shown in Fig. 2b. The main pattern of CPL band changes from the (+/−) couplet at pH 7 to a (−/−/+) shape at pH 2. Most of DNA binding sites are protonated at such a low pH27, which, clearly, drastically affects the Eu3+ binding and CPL spectra.
RoA/CpL spectra of eu3+ Complexes with Double-stranded DNA. CPL spectra for both DNA2 and DNA3 have similar (+/−/+) pattern, which, however, is different from the (+/−) couplet shape observed for the dGMP and DNA1 complexes (Fig. 1a). Analogous (+/−/+) CPL pattern was observed for a sensitizing
Figure 2. (a) Raman/TL and ROA/CPL spectra of dGMP-Eu3+ complexes at 170 mM of dGMP + 0.19 mM of EuCl3 (0.001 [Eu3+]/[dGMP]) (red) and at 0.86 mM of dGMP + 0.4 mM of EuCl3 (0.47 [Eu3+]/[dGMP]) (blue). (b) Raman/TL and ROA/CPL spectra of Eu3+– DNA1 complexes at pH 2 (red) (3.2 mM (P) + 0.24 mM of EuCl3; 0.075 [Eu3+]/[P]) and pH 7 (blue) (2.24 mM (P) + 0.11 mM EuCl3; 0.05 [Eu3+]/[P]).
www.nature.com/scientificreports/
4Scientific RepoRts | (2019) 9:1068 | https://doi.org/10.1038/s41598-018-37680-7
Eu3+ complex bound to poly(dGdC) and was assigned to predominantly metal-phosphate interactions10. The IR and VCD spectra confirm the double-helical B-conformation for DNA2 (Supplementary Fig. S4). Evidence for that comes from the C = O vibrations of the bases at 1680 cm−1 and sugar C–O stretching vibration at 1054 cm−1, accompanied by the B-form IR marker bands at 939, 896 and 839 cm−1 and strong VCD couplets characteristic for double-stranded B-DNA22–26. The electronic circular dichroism (ECD) spectrum of DNA3 is also characteristic for the double-stranded structure in B-conformation (Supplementary Fig. S4)28. The IR/VCD spectra show very little changes upon adding Eu3+ even at twice as high [Eu3+]/[P] ratio as that used in the ROA/CPL experiment (Supplementary Fig. S4), suggesting mainly indirect water-mediated metal ion binding to double-stranded DNA and absence of a substantial distortion of DNA structure. The ECD spectral changes observed for Eu3+– DNA3 complex are attributed to a partial DNA compaction (condensation) rather than to changes in the secondary structure (Supplementary Fig. S4)3,26. The double-stranded conformation of DNA2 and DNA3 results in differ-ent metal binding sites compared to dGMP and short single-stranded DNA1, which might lead to the observed differences in the CPL pattern.
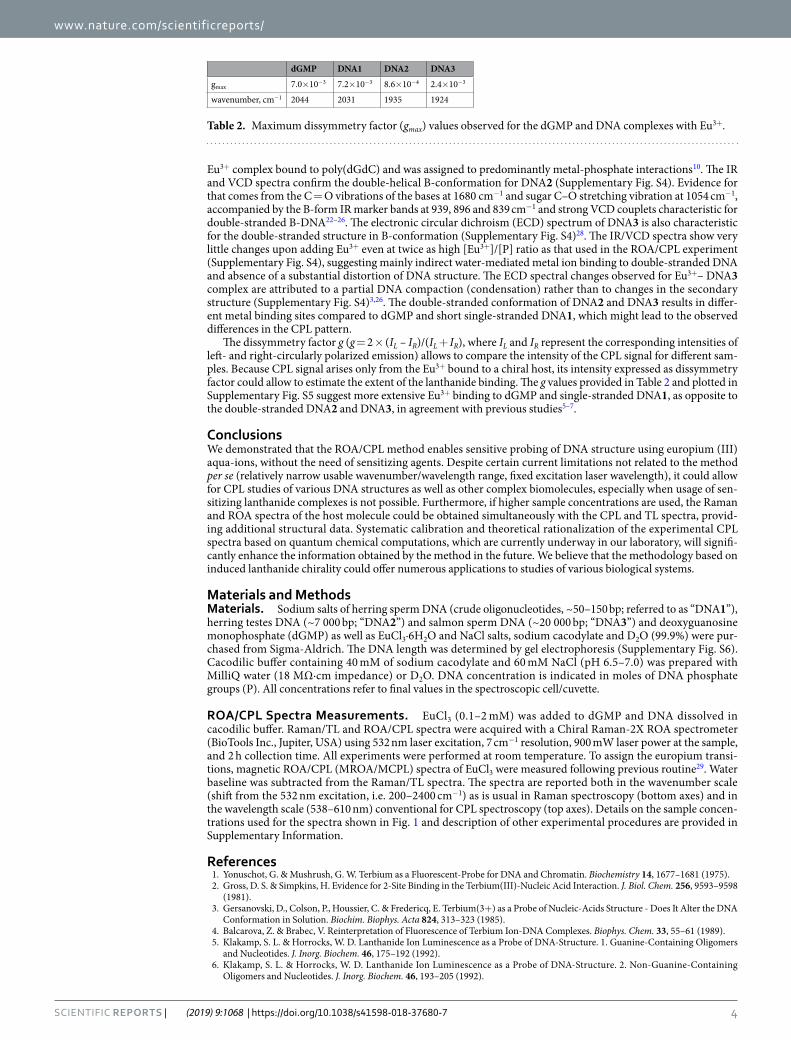
The dissymmetry factor g (g = 2 × (IL – IR)/(IL + IR), where IL and IR represent the corresponding intensities of left- and right-circularly polarized emission) allows to compare the intensity of the CPL signal for different sam-ples. Because CPL signal arises only from the Eu3+ bound to a chiral host, its intensity expressed as dissymmetry factor could allow to estimate the extent of the lanthanide binding. The g values provided in Table 2 and plotted in Supplementary Fig. S5 suggest more extensive Eu3+ binding to dGMP and single-stranded DNA1, as opposite to the double-stranded DNA2 and DNA3, in agreement with previous studies5–7.
ConclusionsWe demonstrated that the ROA/CPL method enables sensitive probing of DNA structure using europium (III) aqua-ions, without the need of sensitizing agents. Despite certain current limitations not related to the method per se (relatively narrow usable wavenumber/wavelength range, fixed excitation laser wavelength), it could allow for CPL studies of various DNA structures as well as other complex biomolecules, especially when usage of sen-sitizing lanthanide complexes is not possible. Furthermore, if higher sample concentrations are used, the Raman and ROA spectra of the host molecule could be obtained simultaneously with the CPL and TL spectra, provid-ing additional structural data. Systematic calibration and theoretical rationalization of the experimental CPL spectra based on quantum chemical computations, which are currently underway in our laboratory, will signifi-cantly enhance the information obtained by the method in the future. We believe that the methodology based on induced lanthanide chirality could offer numerous applications to studies of various biological systems.
Materials and MethodsMaterials. Sodium salts of herring sperm DNA (crude oligonucleotides, ~50–150 bp; referred to as “DNA1”), herring testes DNA (~7 000 bp; “DNA2”) and salmon sperm DNA (~20 000 bp; “DNA3”) and deoxyguanosine monophosphate (dGMP) as well as EuCl3·6H2O and NaCl salts, sodium cacodylate and D2O (99.9%) were pur-chased from Sigma-Aldrich. The DNA length was determined by gel electrophoresis (Supplementary Fig. S6). Cacodilic buffer containing 40 mM of sodium cacodylate and 60 mM NaCl (pH 6.5–7.0) was prepared with MilliQ water (18 MΩ·cm impedance) or D2O. DNA concentration is indicated in moles of DNA phosphate groups (P). All concentrations refer to final values in the spectroscopic cell/cuvette.
RoA/CpL spectra Measurements. EuCl3 (0.1–2 mM) was added to dGMP and DNA dissolved in cacodilic buffer. Raman/TL and ROA/CPL spectra were acquired with a Chiral Raman-2X ROA spectrometer (BioTools Inc., Jupiter, USA) using 532 nm laser excitation, 7 cm−1 resolution, 900 mW laser power at the sample, and 2 h collection time. All experiments were performed at room temperature. To assign the europium transi-tions, magnetic ROA/CPL (MROA/MCPL) spectra of EuCl3 were measured following previous routine29. Water baseline was subtracted from the Raman/TL spectra. The spectra are reported both in the wavenumber scale (shift from the 532 nm excitation, i.e. 200–2400 cm−1) as is usual in Raman spectroscopy (bottom axes) and in the wavelength scale (538–610 nm) conventional for CPL spectroscopy (top axes). Details on the sample concen-trations used for the spectra shown in Fig. 1 and description of other experimental procedures are provided in Supplementary Information.
References 1. Yonuschot, G. & Mushrush, G. W. Terbium as a Fluorescent-Probe for DNA and Chromatin. Biochemistry 14, 1677–1681 (1975). 2. Gross, D. S. & Simpkins, H. Evidence for 2-Site Binding in the Terbium(III)-Nucleic Acid Interaction. J. Biol. Chem. 256, 9593–9598
(1981). 3. Gersanovski, D., Colson, P., Houssier, C. & Fredericq, E. Terbium(3+) as a Probe of Nucleic-Acids Structure - Does It Alter the DNA
Conformation in Solution. Biochim. Biophys. Acta 824, 313–323 (1985). 4. Balcarova, Z. & Brabec, V. Reinterpretation of Fluorescence of Terbium Ion-DNA Complexes. Biophys. Chem. 33, 55–61 (1989). 5. Klakamp, S. L. & Horrocks, W. D. Lanthanide Ion Luminescence as a Probe of DNA-Structure. 1. Guanine-Containing Oligomers
and Nucleotides. J. Inorg. Biochem. 46, 175–192 (1992). 6. Klakamp, S. L. & Horrocks, W. D. Lanthanide Ion Luminescence as a Probe of DNA-Structure. 2. Non-Guanine-Containing
Oligomers and Nucleotides. J. Inorg. Biochem. 46, 193–205 (1992).
dGMP DNA1 DNA2 DNA3
gmax 7.0×10−3 7.2×10⁻³ 8.6×10⁻⁴ 2.4×10⁻³
wavenumber, cm−1 2044 2031 1935 1924
Table 2. Maximum dissymmetry factor (gmax) values observed for the dGMP and DNA complexes with Eu3+.
www.nature.com/scientificreports/
5Scientific RepoRts | (2019) 9:1068 | https://doi.org/10.1038/s41598-018-37680-7
7. Morrow, J. R. & Andolina, C. M. In Interplay between Metal Ions and Nucleic Acids. Metal Ions in Life Sciences Vol. 10 Metal Ions in Life Sciences (eds Sigel, A., Sigel, H. & Sigel, R. K. O.) 171–199 (Springer Science + Business Media B. V., 2012).
8. Muller, G. Luminescent chiral lanthanide(III) complexes as potential molecular probes. Dalton Trans. 9692–9707 (2009). 9. Carr, R., Evans, N. H. & Parker, D. Lanthanide complexes as chiral probes exploiting circularly polarized luminescence. Chem. Soc.
Rev. 41, 7673–7686 (2012). 10. Bobba, G., Kean, S. D., Parker, D., Beeby, A. & Baker, G. DNA binding studies of cationic lanthanide complexes bearing a
phenanthridinium group. J. Chem. Soc., Perkin Trans. 2, 1738–1741 (2001). 11. Bobba, G. et al. Chiroptical, ESMS and NMR spectroscopic study of the interaction of enantiopure lanthanide complexes with
selected self-complementary dodecamer oligonucleotides. J. Chem. Soc. Perkin Trans. 2, 1729–1737 (2001). 12. Bobba, G., Frias, J. C. & Parker, D. Highly emissive, nine-coordinate enantiopure lanthanide complexes incorporating
tetraazatriphenylenes as probes for DNA. Chem. Commun. 890–891 (2002). 13. Wu, T., Kapitán, J., Mašek, V. & Bouř, P. Detection of Circularly Polarized Luminescence of a Cs-Eu-III Complex in Raman Optical
Activity Experiments. Angew. Chem. Int. Ed. 54, 14933–14936 (2015). 14. Wu, T., Kessler, J. & Bouř, P. Chiral sensing of amino acids and proteins chelating with Eu-III complexes by Raman optical activity
spectroscopy. Phys. Chem. Chem. Phys. 18, 23803–23811 (2016). 15. Wu, T. et al. Detection of Sugars via Chirality Induced in Europium(III) Compounds. Anal. Chem. 88, 8878–8885 (2016). 16. Binnemans, K. Interpretation of europium(III) spectra. Coord. Chem. Rev. 295, 1–45 (2015). 17. Zinna, F. & Di Bari, L. Lanthanide Circularly Polarized Luminescence: Bases and Applications. Chirality 27, 1–13 (2015). 18. Hudecová, J. et al. CH Stretching Region: Computational Modeling of Vibrational Optical Activity. J. Chem. Theory Comput. 9,
3096–3108 (2013). 19. Profant, V., Pazderková, M., Pazderka, T., Malon, P. & Baumruk, V. Relative intensity correction of Raman optical activity spectra
facilitates extending the spectral region. J. Raman Spectrosc. 45, 603–609 (2014). 20. Tajmir-Riahi, H. A. Interaction of La (III) and Tb (III) ions with purine nucleotides: evidence for metal chelation (N-7-M-PO3) and
the effect of macrochelate formation on the nucleotide sugar conformation. Biopolymers 31, 1065–1075 (1991). 21. Bell, A. F., Hecht, L. & Barron, L. D. Vibrational Raman optical activity of DNA and RNA. J. Am. Chem. Soc. 120, 5820–5821 (1998). 22. Tsuboi, M. Application of Infrared Spectroscopy to Structure Studies of Nucleic Acids. Appl. Spectrosc. Rev. 3, 45–90 (1969). 23. Taillandier, E., Liquier, J. & Taboury, J. A. In Advances in Infrared and Raman Spectroscopy Vol. 12 (eds Clark, R. J. H. & Hester, R. E.)
65–114 (Wiley-Heyden, 1985). 24. Tajmir-Riahi, H. A., Naoui, M. & Ahmad, R. The effects of Cu2+ and Pb2+ on the solution structure of calf thymus DNA: DNA
condensation and denaturation studied by Fourier transform IR difference spectroscopy. Biopolymers 33, 1819–1827 (1993). 25. Keiderling, T. A. In Circular Dichroism and the Conformational Analysis of Biomolecules (ed. Fasman, G. D.) 555–597 (Plenum Press,
1996). 26. Andrushchenko, V., Leonenko, Z., Cramb, D., van de Sande, H. & Wieser, H. Vibrational CD (VCD) and atomic force microscopy
(AFM) study of DNA interaction with Cr3+ ions: VCD and AFM evidence of DNA condensation. Biopolymers 61, 243–260 (2001). 27. Tajmir-Riahi, H. A., Ahmad, R., Naoui, M. & Diamantoglou, S. The effect of HCl on the solution structure of calf thymus DNA: a
comparative study of DNA denaturation by proton and metal cations using Fourier transform IR difference spectroscopy. Biopolymers 35, 493–501 (1995).
28. Kypr, J., Kejnovska, I., Renciuk, D. & Vorlíčková, M. Circular dichroism and conformational polymorphism of DNA. Nucleic Acids Res. 37, 1713–1725 (2009).
29. Wu, T., Kapitán, J., Andrushchenko, V. & Bouř, P. Identification of Lanthanide(III) Luminophores in Magnetic Circularly Polarized Luminescence Using Raman Optical Activity Instrumentation. Anal. Chem. 89, 5043–5049 (2017).
AcknowledgementsThe work was supported by the Czech Science Foundation (Grants 16–04902 S, 16–08764Y and 18–005770 S) and Ministry of Education (Grants LTC17012 and CZ.02.1.01/0.0/0.0/16_019/0000729). The authors thank Dr. Radek Pelc (IOCB) for helpful discussion of the topic, Dr. Jelena Radosavljevich (IOCB) for performing DNA gel electrophoresis and Leah Koutna (IOCB) for help with the ECD experiments.
Author ContributionsT.W. performed the ROA/CPL measurements. P.B. participated in discussion of the results and in manuscript writing. V.A. performed most of the sample preparations, IR/VCD and ECD measurements, data processing and manuscript writing. All authors reviewed the manuscript.
Additional InformationSupplementary information accompanies this paper at https://doi.org/10.1038/s41598-018-37680-7.Competing Interests: The authors declare no competing interests.Publisher’s note: Springer Nature remains neutral with regard to jurisdictional claims in published maps and institutional affiliations.
Open Access This article is licensed under a Creative Commons Attribution 4.0 International License, which permits use, sharing, adaptation, distribution and reproduction in any medium or
format, as long as you give appropriate credit to the original author(s) and the source, provide a link to the Cre-ative Commons license, and indicate if changes were made. The images or other third party material in this article are included in the article’s Creative Commons license, unless indicated otherwise in a credit line to the material. If material is not included in the article’s Creative Commons license and your intended use is not per-mitted by statutory regulation or exceeds the permitted use, you will need to obtain permission directly from the copyright holder. To view a copy of this license, visit http://creativecommons.org/licenses/by/4.0/. © The Author(s) 2019