Embed Size (px)
Citation preview

ASX|SEHsinogasenergy.com
Euroz Investor ConferenceMarch 2018Fuelling China’s Clean Energy Future

sinogasenergy.com ASX|SEH2
Unique and Compelling Value Proposition
1. Refer to Reserves & Resources statement on slide 19 2. Refer to Development Plan dated 30 October 2017 slides 8 & 10, slides 8 & 9 and the disclaimer statement on slides 20 & 21, all production numbers are gross field 3. NDRC, 1 February 2018, Bernstein Research, “Bernstein Global Gas: China steps on the gas. Will this trigger the next LNG super-cycle”, October 2017 4. Capex plus Opex; Refer to disclaimer statement slide 19 5. Based on IHS Markit China Natural Gas Price Outlook, August 2017
Well positioned to unlock significant value and returns
Low cost production underpins strong margin potential• One of China’s lowest cost producers, targeting <$2/Mscf 4
• Forecast well-head prices US$6.50 - $9.00+/Mscf 5
World scale, substantial production & cash flow targeted • 5.3 tcf gross discovered resources - 2.1 tcf 2P & 3.2 tcf 2C 1
• 350 to >550 MMscf/d with significant Free Cash Flow targeted from 2020 2
Well positioned in attractive China gas market• Gas demand forecast to triple by 2030 3
• Ready access to infrastructure & proven gas marketing strategy
Funding secured for development• Existing cash, cash flow from operations and US$100m Macquarie facility funds
development
ODP process well advanced• ODPs submitted, targeting approvals in 1H 2018• Production ramp up with ODP approvals

sinogasenergy.com ASX|SEH3
▪ 2017 demand surged > 15% from 2016 2:▪ Domestic supply: 149bcm, up 8.5% y/y▪ Imported gas: 92bcm up 27.6% y/y
▪ Long-term fundamentals remain strong▪ NRDC forecasts 2018 demand to increase 13.5%▪ Continued substantial coal to gas switching program in
Northern China ▪ Tackling air pollution a key government priority▪ Robust gas prices underpinned by high marginal cost of
supply
0
50
100
150
200
250
300
350
400
bcm
/ ye
ar
China Demand China Domestic Production
Serving China’s Large, Fast Growing Gas Needs
1. Bernstein Research, “Bernstein Global Gas: China steps on the gas. Will this trigger the next LNG super-cycle”, October 2017 2. NDRC, February 2018 3. IHS Markit, China’s Provincial Gas Demand and National Supply Outlook, NDRC, February 2018. 4. BP Statistical Review of Energy, June 2017
Supply-demand gap – domestic gas a priority
2016 Natural Gas Consumption
-5%
-
5%
10%
15%
20%
- 10% 20% 30% 40%
2005-2
016 D
em
an
d G
row
th
(% C
AG
R)
Natural Gas Share of Primary Energy Mix (%)
China
US
Europe
Australia
Asia ex China
China vs. world natural gas demand 4
Growth, % of Primary Energy, 2016 consumption
Demand outpacing domestic supply 3
China demand
China domestic production
Tripling of gas demand expected by 2030 1
sinogasenergy.com ASX|SEH4
Sino Gas Ideally Positioned in Ordos Basin
1. Source: IHS Markit, China’s Natural Gas Supply and Cost Outlooks, August 2017
2. Based on population of Shanxi, Beijing, Tianjin, Shandong, Hebei and Henan
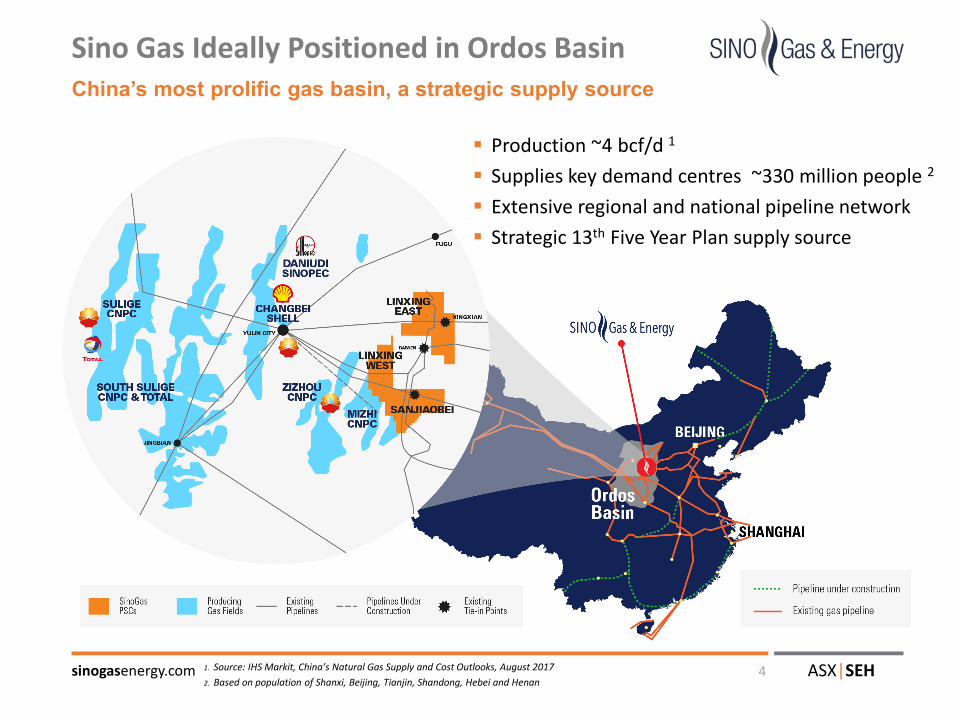
China’s most prolific gas basin, a strategic supply source
▪ Production ~4 bcf/d 1
▪ Supplies key demand centres ~330 million people 2
▪ Extensive regional and national pipeline network
▪ Strategic 13th Five Year Plan supply source
sinogasenergy.com ASX|SEH5
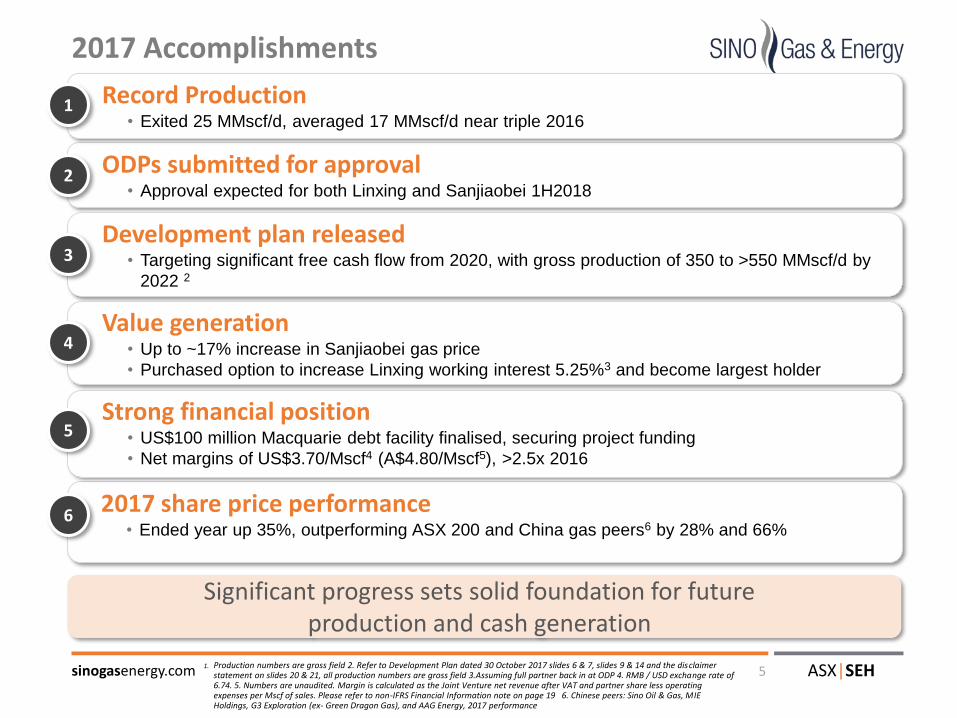
Significant progress sets solid foundation for futureproduction and cash generation
2017 Accomplishments
1. Production numbers are gross field 2. Refer to Development Plan dated 30 October 2017 slides 6 & 7, slides 9 & 14 and the disclaimer statement on slides 20 & 21, all production numbers are gross field 3.Assuming full partner back in at ODP 4. RMB / USD exchange rate of 6.74. 5. Numbers are unaudited. Margin is calculated as the Joint Venture net revenue after VAT and partner share less operating expenses per Mscf of sales. Please refer to non-IFRS Financial Information note on page 19 6. Chinese peers: Sino Oil & Gas, MIE Holdings, G3 Exploration (ex- Green Dragon Gas), and AAG Energy, 2017 performance
2017 share price performance• Ended year up 35%, outperforming ASX 200 and China gas peers6 by 28% and 66%
ODPs submitted for approval• Approval expected for both Linxing and Sanjiaobei 1H2018
Development plan released• Targeting significant free cash flow from 2020, with gross production of 350 to >550 MMscf/d by
2022 2
Value generation• Up to ~17% increase in Sanjiaobei gas price
• Purchased option to increase Linxing working interest 5.25%3 and become largest holder
Strong financial position• US$100 million Macquarie debt facility finalised, securing project funding
• Net margins of US$3.70/Mscf4 (A$4.80/Mscf5), >2.5x 2016
Record Production• Exited 25 MMscf/d, averaged 17 MMscf/d near triple 2016
1
2
3
4
5
6

sinogasenergy.com ASX|SEH6
Analogous to Major Ordos Gas Fields
▪ ~1,000m of gross gas bearing section
▪ Low risk sandstone reservoir with proven deliverability
▪ Higher quality reservoir reduces fracture stimulation requirements
▪ Stacked reservoirs drive high ultimate recoveries per well
▪ Higher gas volumes per km2
1. Source: Third Party Fields: Wood Mackenzie, August 2017; Sino Gas based on P50 Gas Initially in Place estimate from RISC as of 31 December 2016 – refer to announcement dated 6 March 2017; Area based on total block area; GIIP estimate NA for Daniudi
Stacked reservoirs result in high gas in place
Key Producing Reservoirs 1
Sino Gas benefits from more producing zones
-
1.0
2.0
3.0
4.0
Sino Gas South Sulige Changbei Sulige
Gas Initially in Place (GIIP) density 1
GII
P B
cf/
km
2
~1.5-2x other Ordos fields 1
sinogasenergy.com ASX|SEH7
Standout Producer in Proven Hydrocarbon Basin
Source: Third Party Fields: Wood Mackenzie, August 2017, Mizhi production also includes adjacent field Zizhou, GIIP estimate NA for Daniudi,; Sino Gas: Area - total block size; GIIP - P50 Discovered Gas Initially in Place estimate from RISC as of 31 December 2016 – refer to announcement dated 6 March 2017; Permeability and Porosity - average across discovered area; Plateau Gas Rate – J Energy estimate of Phase 1 and Phase 1 Optimised, refer to disclaimer statement on slide 21
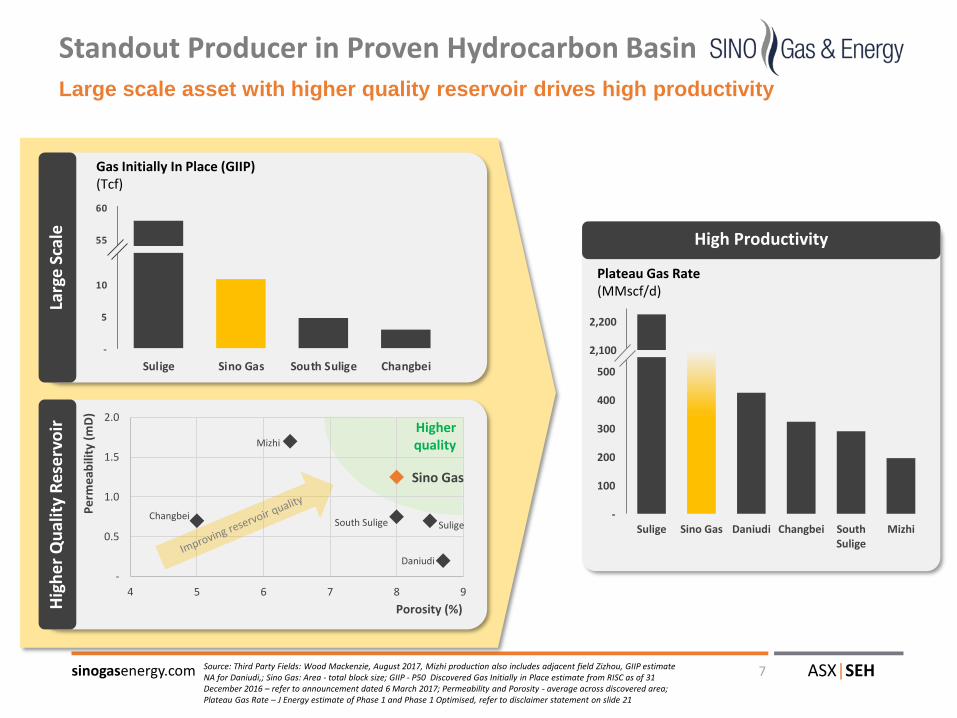
Large scale asset with higher quality reservoir drives high productivity
Larg
e S
cale High Productivity
Hig
he
r Q
ual
ity
Re
serv
oir
ChangbeiSouth Sulige
Mizhi
Sulige
Daniudi
Sino Gas
-
0.5
1.0
1.5
2.0
4 5 6 7 8 9
Pe
rme
abili
ty (
mD
)
Porosity (%)
Higher quality
Gas Initially In Place (GIIP)(Tcf)
-
5
10
55
60
Sulige Sino Gas South Sulige Changbei
Plateau Gas Rate(MMscf/d)
-
100
200
300
400
500
2,100
2,200
Sulige Sino Gas Daniudi Changbei SouthSulige
Mizhi
sinogasenergy.com ASX|SEH8
Development Plan
1. J Energy estimate of 30 year Estimated Ultimate Recovery (EUR), refer to Type Curve slide 11 and the disclaimer statement on slide 20 for additional details. Refer to Development Plan dated 30 October 2017 for additional details, slides 28 & 29
2. All production numbers gross field. Gas converted at 6Mscf:1boe; J Energy estimate of Phase 1, Phase 1 Optimised and Phase 2 for Conceptual Development Plan, Phase 2 includes prospective area, unrisked, refer to disclaimer statement slides 20 & 21
3. Conceptual development plan is indicative only and not guidance, and remains subject to any necessary regulatory approvals and applicable investment decisions
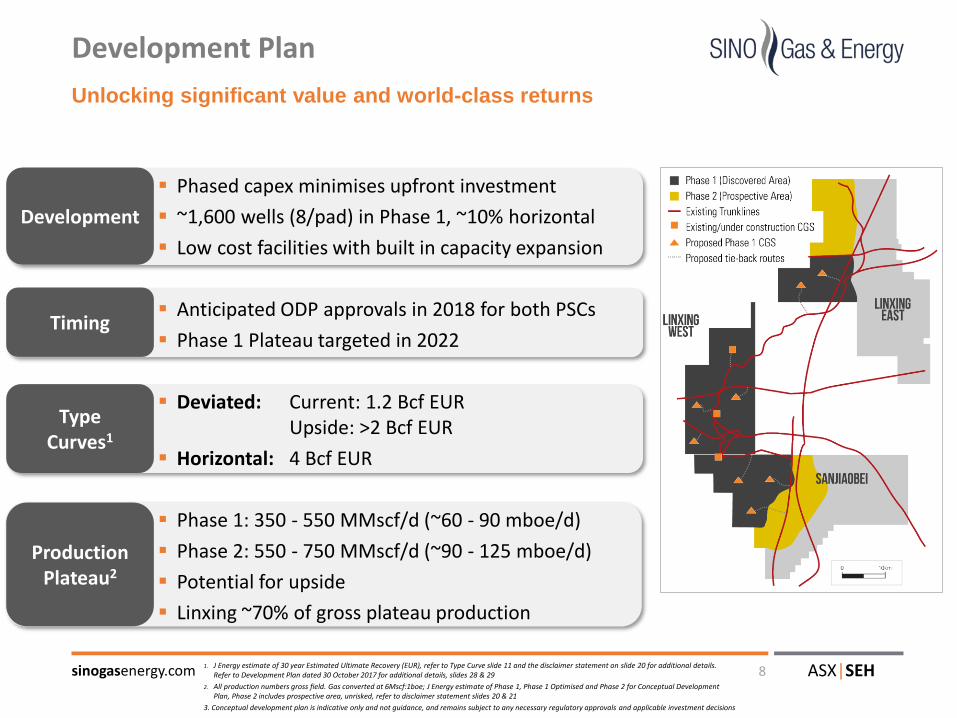
Unlocking significant value and world-class returns
Development
TypeCurves1
ProductionPlateau2
Timing
▪ Phased capex minimises upfront investment
▪ ~1,600 wells (8/pad) in Phase 1, ~10% horizontal
▪ Low cost facilities with built in capacity expansion
▪ Anticipated ODP approvals in 2018 for both PSCs
▪ Phase 1 Plateau targeted in 2022
▪ Deviated: Current: 1.2 Bcf EURUpside: >2 Bcf EUR
▪ Horizontal: 4 Bcf EUR
▪ Phase 1: 350 - 550 MMscf/d (~60 - 90 mboe/d)
▪ Phase 2: 550 - 750 MMscf/d (~90 - 125 mboe/d)
▪ Potential for upside
▪ Linxing ~70% of gross plateau production

sinogasenergy.com ASX|SEH9
Significant Production Growth
1. China domestic production source IHS Markit, China’s Provincial Gas Demand and National Supply Outlook, August 2017, based on 2022 domestic supply estimate
2. Production growth projections, based on J Energy estimates of Phase 1, Phase 1 Optimised and Phase 2; Phase 2 includes production from prospective area, unrisked. Refer to slide 8 and disclaimer statement on slide 21
3. Production growth projection are indicative only and not guidance, and remain subject to any necessary regulatory approvals and applicable investment decisions
4. All production numbers are gross field, to be read in conjunction with disclaimer on slide 20
▪ Phase 1 Discovered area of 1,131 km2, current type curves
▪ Optimised Potential additional productivity from identified optimisations
▪ Phase 2 Low Risk prospective area, 467km2
▪ PSC extension would capture further volumes beyond current PSC expiry – discussions underway
~2-4% of China’s domestic gas supply at plateau 1M
Msc
f/d

sinogasenergy.com ASX|SEH10
Strategic Priorities:
• Secure ODP approvals
• Maximise production and cashflow
• Position for future growth
2018 Work Program
• ODP approvals 1H
• Commission Linxing North CGS by 3Q
• Exit 38 – 42 MMscf/d, avg. 22 – 27 MMscf/d
• Gross capital expenditure US$60-70 million
• 40 – 50 wells
• 2019+ drilling preparation
• Sanction new facilities post-ODP approvals
1. Production numbers are gross field, to be read in conjunction with slide 20
2018 Core Focus:
2018 Work Program Key Activities
Delivering the Development Plan

sinogasenergy.com ASX|SEH11
Overall Development Plan Process
• ODP process being streamlined with reduced approval requirements
• ODP approval fully de-risks project and represents commencement of full field development
• Process progressing in close cooperation with SOE partners
• Five Year Energy Plan supports acceleration of ODP at Linxing
ODPs submitted and approvals on track for 1H 2018
Pilot production
CRR endorsed
Compile geological and reservoir engineering
Optimise according to final CRR
Full field development plan
Economic analysis
Submit ODP to SOE
Environmental Impact Assessment
JMC review and revise
SOE approval
NDRC filing
Full field development commences
LegendCompleted/in progressYet to be completed

sinogasenergy.com ASX|SEH12
Production deliveryGross average MMscf/d
4 6
17
22 - 27 Average
38 - 42Exit
2015 2016 2017 2018 E
-
0.5
1.0
1.5
Dai
ly G
as (
MM
scf/
d)
Year0 5 10
Technology driving improved well performance
Continuing Production Growth
1. J Energy estimates, refer to disclaimer statement slide 21. All type curve EURs are for 30 years. Current curve modelled from ~50 production wells. Actual production from over 500 days of production data from ~50 wells
Targeting exit rate of 38 – 42 MMscf/d, driving continuous improvement
▪ Technology focus areas:• Well design and placement• Fracture design• Completion technology
Current type curve (1.2 Bcf)Identified optimisations (1.4 Bcf)Actual production data
sinogasenergy.com ASX|SEH13
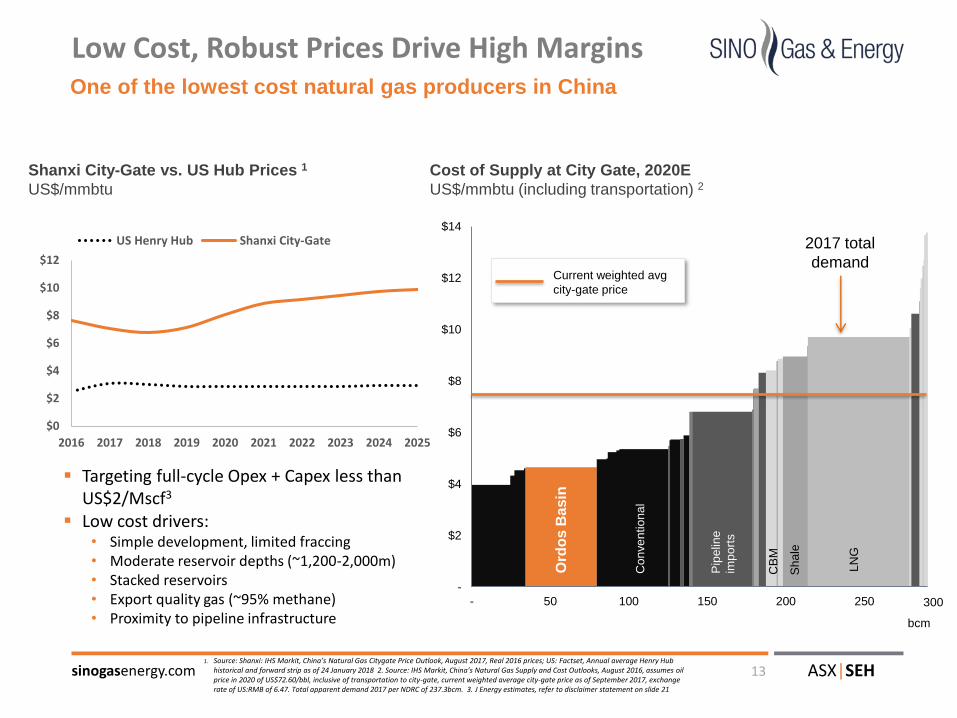
Low Cost, Robust Prices Drive High Margins
1. Source: Shanxi: IHS Markit, China’s Natural Gas Citygate Price Outlook, August 2017, Real 2016 prices; US: Factset, Annual average Henry Hub historical and forward strip as of 24 January 2018 2. Source: IHS Markit, China’s Natural Gas Supply and Cost Outlooks, August 2016, assumes oil price in 2020 of US$72.60/bbl, inclusive of transportation to city-gate, current weighted average city-gate price as of September 2017, exchange rate of US:RMB of 6.47. Total apparent demand 2017 per NDRC of 237.3bcm. 3. J Energy estimates, refer to disclaimer statement on slide 21
One of the lowest cost natural gas producers in China
-
$2
$4
$6
$8
$10
$12
$14
- 50 100 150 200 250
CB
M
LN
G
Sh
ale
Con
ve
ntio
na
l
Ord
os B
asin
Pip
elin
e
imp
ort
s
2017 total
demandCurrent weighted avg
city-gate price
Cost of Supply at City Gate, 2020E
US$/mmbtu (including transportation) 2Shanxi City-Gate vs. US Hub Prices 1
US$/mmbtu
▪ Targeting full-cycle Opex + Capex less than US$2/Mscf3
▪ Low cost drivers:• Simple development, limited fraccing• Moderate reservoir depths (~1,200-2,000m)• Stacked reservoirs• Export quality gas (~95% methane) • Proximity to pipeline infrastructure
$0
$2
$4
$6
$8
$10
$12
2016 2017 2018 2019 2020 2021 2022 2023 2024 2025
US Henry Hub Shanxi City-Gate
300
bcm

sinogasenergy.com ASX|SEH14
- 10 20 30 40
Demonstrated capability to reduce well costs, ~75% total project capex
Strengthening Low Cost Advantage
1. Based on average drilling time per well in 2017; target drilling time based on J Energy estimates, refer to disclaimer statement on slide 21 2. Average drilling and completion cost per deviated well, excludes tie-in cost; target cost based on J Energy estimates, refer to disclaimer statement.
Efficiencies identified to further drive down costs
Average days per deviated well 1
2019 / 20
Deviated well costs reduced by half (2013-2017) 2
-
50
100
150
200
-
0.5
1.0
1.5
2013 2014 2015 2016 2017 TargetA
ve
rag
e w
ell
co
st (U
S$
mm
)
Cu
mu
lative
We
lls D
rille
d2013
2017
Batch Drilling
Logging Optimisation
NPT Reduction
Directional Control
Mud Optimisation
Bit Optimisation
Cement Optimisation
Rig Modification
Offline activities
Best = 11 days
sinogasenergy.com ASX|SEH15
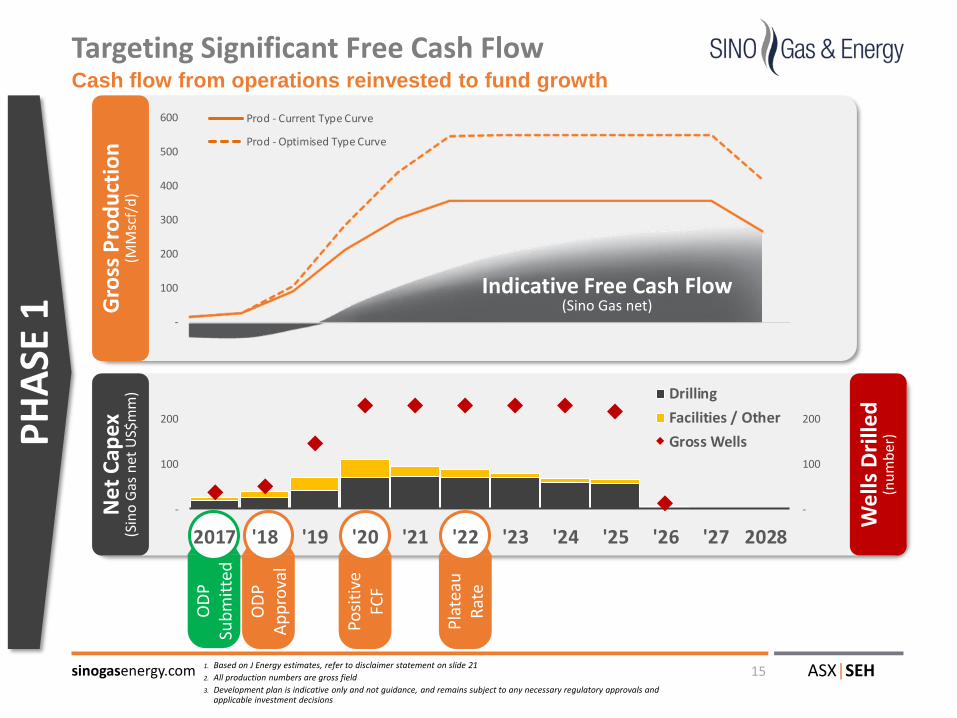
Targeting Significant Free Cash Flow
1. Based on J Energy estimates, refer to disclaimer statement on slide 21
2. All production numbers are gross field
3. Development plan is indicative only and not guidance, and remains subject to any necessary regulatory approvals and applicable investment decisions
Ne
t C
apex
(Sin
o G
as n
et U
S$m
m)
Gro
ss P
rod
uct
ion
(MM
scf/
d)
PH
ASE
1
We
lls D
rille
d(n
um
ber
)
Drilling
Facilities / Other
Gross Wells
OD
PA
pp
rova
l
Posi
tive
FC
F
Pla
teau
R
ate
Cash flow from operations reinvested to fund growth
OD
PSu
bm
itte
d
Prod - Current Type Curve
Prod - Optimised Type Curve
-
100
200
300
400
500
600
-
100
200
-
100
200
2017 '18 '19 '20 '21 '22 '23 '24 '25 '26 '27 2028
Indicative Free Cash Flow(Sino Gas net)

sinogasenergy.com ASX|SEH16
Strong Cash Generation
1. Gross production multiplied by price, assumes $7.00/Mscf in 20182. Refer to non-IFRS Financial Information note on slide 21. Assumes current type curves, well cost of US$800,000 drilled in
Investment Phase (i.e. prior to recovery of all historical costs) and 76% SGE take. Government Take includes VAT, Fees and SOE share of Cost Recovery and Profit Split averaged over Linxing and Sanjiaobei PSCs. J Energy estimates for conceptual development plan, refer to disclaimer statement slide 21
Revenue growth with high margins reinvested to fund development
Net Margins 2:
SGE margin Government take Unit opex
▪ Revenue and margin expansion driven by production growth and rising gas prices
▪ High cash margins underpin attractive returns▪ Favourable PSC terms result in significant share of
revenue▪ Cost-reduction culture and increasing scale reduce
unit opex
US$/Mscf
-
10
20
30
40
50
60
70
80
2014 2015 2016 2017 2018 E$7.00 Flat $8.00 Flat2016
Actual
2017
Actual Investment Phase
2.00
4.00
6.00
8.00
$7.00 Flat $8.00 Flat2016
Actual
2017
Actual Investment Phase
2.00
4.00
6.00
8.00
Gross Revenue 1:US$ million
sinogasenergy.com ASX|SEH17
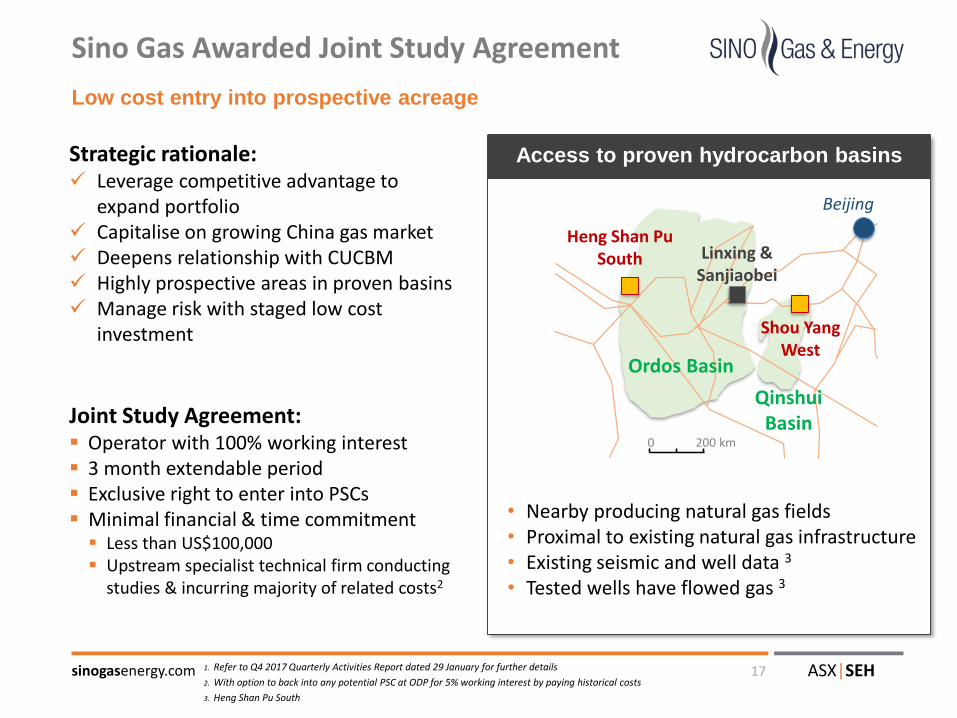
Access to proven hydrocarbon basins
Sino Gas Awarded Joint Study Agreement
1. Refer to Q4 2017 Quarterly Activities Report dated 29 January for further details
2. With option to back into any potential PSC at ODP for 5% working interest by paying historical costs
3. Heng Shan Pu South
Low cost entry into prospective acreage
• Nearby producing natural gas fields • Proximal to existing natural gas infrastructure• Existing seismic and well data 3
• Tested wells have flowed gas 3
Beijing
Shou Yang West
0 200 km
Ordos Basin
Linxing & Sanjiaobei
Heng Shan Pu South
QinshuiBasin
Strategic rationale:✓ Leverage competitive advantage to
expand portfolio✓ Capitalise on growing China gas market✓ Deepens relationship with CUCBM✓ Highly prospective areas in proven basins✓ Manage risk with staged low cost
investment
Joint Study Agreement:▪ Operator with 100% working interest▪ 3 month extendable period▪ Exclusive right to enter into PSCs▪ Minimal financial & time commitment▪ Less than US$100,000▪ Upstream specialist technical firm conducting
studies & incurring majority of related costs2
sinogasenergy.com ASX|SEH18
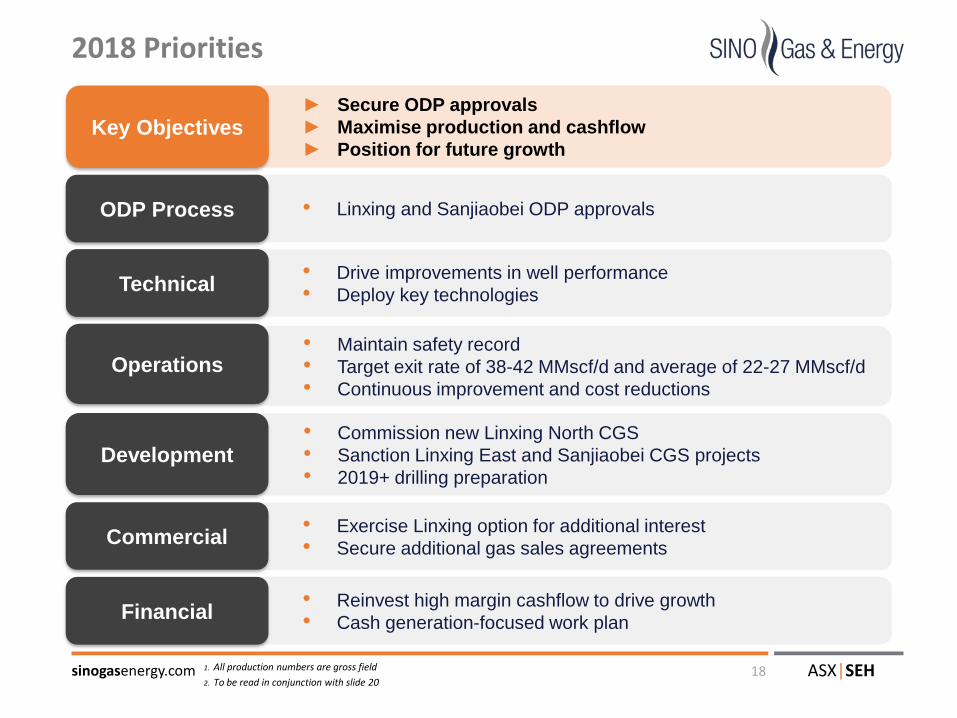
2018 Priorities
1. All production numbers are gross field
2. To be read in conjunction with slide 20
• Maintain safety record
• Target exit rate of 38-42 MMscf/d and average of 22-27 MMscf/d
• Continuous improvement and cost reductions
Operations
• Drive improvements in well performance
• Deploy key technologiesTechnical
• Linxing and Sanjiaobei ODP approvalsODP Process
• Exercise Linxing option for additional interest
• Secure additional gas sales agreementsCommercial
• Reinvest high margin cashflow to drive growth
• Cash generation-focused work planFinancial
► Secure ODP approvals
► Maximise production and cashflow
► Position for future growthKey Objectives
• Commission new Linxing North CGS
• Sanction Linxing East and Sanjiaobei CGS projects
• 2019+ drilling preparationDevelopment

sinogasenergy.com ASX|SEH19
Selected Pictures
1. Third-part equipment shown
Lin County, Shanxi Province, May 2017
Fracking operations1
Linxing CGS Drilling rig1

sinogasenergy.com ASX|SEH20
Disclaimer (1 / 2)
Sino Gas & Energy Holdings Limited (“Sino Gas” ASX: SEH) is an Australian energy company focused on developing natural gas assets in China. Sino Gas holds a 49% interest in Sino Gas & Energy Limited (“SGE”), the operator of the Linxing and Sanjiaobei Production Sharing Contracts (“PSCs”) in the Ordos Basin, China's largest gas producing basin. SGE has been established in Beijing since 2005 and is jointly owned with China New Energy Mining Limited (“CNEML”) via a strategic partnership.
SGE’s interest in the Linxing PSC with CUCBM (a CNOOC wholly-owned subsidiary) is 70% and 49% for the Sanjiaobei PSC held with PCCBM (a PetroChina wholly-owned subsidiary). SGE has a 100% working interest during the exploration phase of the PSC, and SGE’s PSC partners are entitled to participate upon Overall Development Plan (“ODP”) approval up to their PSC working interest by contributing their future share of costs.
Sino Gas also holds an option to acquire a 5.25% participating interest from SGE (assuming full SOE partner participation) in the Linxing PSC at ODP by contributing 7.5% of historical back costs to SGE. Upon exercise of the option, Sino Gas will hold the largest net working interest in the Linxing PSC.
Certain statements included in this release constitute forward looking information. This information is based upon a number of estimates and assumptions made on a reasonable basis by the Company in light of its experience, current conditions and expectations of future developments, as well as other factors that the Company believes are appropriate in the circumstances. While these estimates and assumptions are considered reasonable, they are inherently subject to business, economic, competitive, political and social uncertainties and contingencies. Whilst the Company considers all the material assumptions to be based on reasonable grounds, there is no certainty that they will prove correct or that the outcomes indicated in the Development Plan will be achieved. Production profile, plateau rates and other conceptual development plan parameters are indicative only and not guidance, and remain subject to any necessary regulatory approvals and applicable investment decisions.
Many factors could cause the Company’s actual results to differ materially from those expressed or implied in any forward-looking information provided by the Company, or on behalf of, the Company. Such factors include, among other things, risks relating to gas prices, exploration, acquisition, development and operating risks, gas production rates, the costs associated with producing these volumes, access to product markets, product prices, competition, production risks, regulatory restrictions, including environmental regulation and liability, potential title disputes and additional funding requirements. Further, despite the Company having attempted to identify all material factors that may cause actual results to differ, there may be other factors that cause results not to be as anticipated, estimated or intended. Forward-looking information is no guarantee of future performance and, accordingly, investors are cautioned not to put undue reliance on forward-looking information due to the inherent uncertainty therein. Forward-looking information is made as at the date of this release (or as otherwise specified) and the Company disclaims any intent or obligation to update publicly such forward-looking information, whether as a result of new information, future events or results or otherwise.
The purpose of this presentation is to provide general information about the Company (it is in summary form and does not purport to be all inclusive or complete). No representation or warranty, express or implied, is made by the Company that the material contained in this presentation will be achieved or prove to be correct. Except for statutory liability which cannot be excluded, each of the Company, its officers, employees and advisers expressly disclaims any responsibility for the accuracy or completeness of the material contained in this presentation and excludes all liability whatsoever (including in negligence) for any loss or damage which may be suffered by any person as a consequence of any information in this presentation or any error or omission therefrom.
This presentation should be read in conjunction with the Annual Financial Report as at 31 December 2016, the half year financial statements together with any ASX announcements made by the Company in accordance with its continuous disclosure obligations arising under the Corporations Act 2001 (Cth). This document is protected by copyright laws.
sinogasenergy.com ASX|SEH21
Disclaimer (2 / 2)
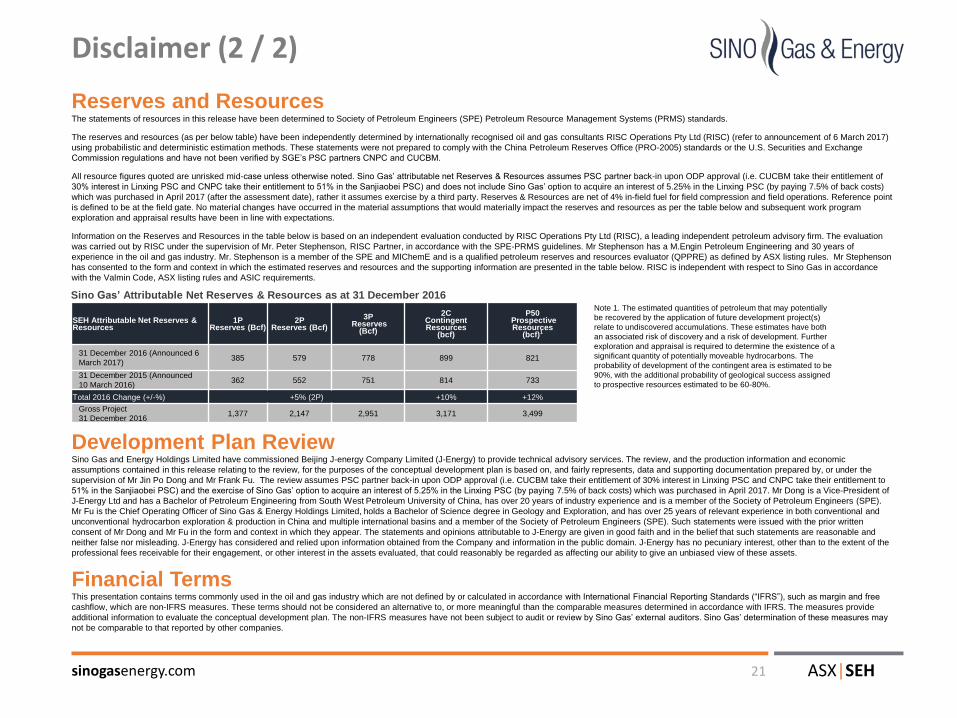
The statements of resources in this release have been determined to Society of Petroleum Engineers (SPE) Petroleum Resource Management Systems (PRMS) standards.
The reserves and resources (as per below table) have been independently determined by internationally recognised oil and gas consultants RISC Operations Pty Ltd (RISC) (refer to announcement of 6 March 2017)
using probabilistic and deterministic estimation methods. These statements were not prepared to comply with the China Petroleum Reserves Office (PRO-2005) standards or the U.S. Securities and Exchange
Commission regulations and have not been verified by SGE’s PSC partners CNPC and CUCBM.
All resource figures quoted are unrisked mid-case unless otherwise noted. Sino Gas’ attributable net Reserves & Resources assumes PSC partner back-in upon ODP approval (i.e. CUCBM take their entitlement of
30% interest in Linxing PSC and CNPC take their entitlement to 51% in the Sanjiaobei PSC) and does not include Sino Gas’ option to acquire an interest of 5.25% in the Linxing PSC (by paying 7.5% of back costs)
which was purchased in April 2017 (after the assessment date), rather it assumes exercise by a third party. Reserves & Resources are net of 4% in-field fuel for field compression and field operations. Reference point
is defined to be at the field gate. No material changes have occurred in the material assumptions that would materially impact the reserves and resources as per the table below and subsequent work program
exploration and appraisal results have been in line with expectations.
Information on the Reserves and Resources in the table below is based on an independent evaluation conducted by RISC Operations Pty Ltd (RISC), a leading independent petroleum advisory firm. The evaluation
was carried out by RISC under the supervision of Mr. Peter Stephenson, RISC Partner, in accordance with the SPE-PRMS guidelines. Mr Stephenson has a M.Engin Petroleum Engineering and 30 years of
experience in the oil and gas industry. Mr. Stephenson is a member of the SPE and MIChemE and is a qualified petroleum reserves and resources evaluator (QPPRE) as defined by ASX listing rules. Mr Stephenson
has consented to the form and context in which the estimated reserves and resources and the supporting information are presented in the table below. RISC is independent with respect to Sino Gas in accordance
with the Valmin Code, ASX listing rules and ASIC requirements.
Reserves and Resources
Sino Gas’ Attributable Net Reserves & Resources as at 31 December 2016
SEH Attributable Net Reserves & Resources
1P Reserves (Bcf)
2P Reserves (Bcf)
3PReserves
(Bcf)
2C Contingent Resources
(bcf)
P50Prospective Resources
(bcf)1
31 December 2016 (Announced 6
March 2017)385 579 778 899 821
31 December 2015 (Announced
10 March 2016)362 552 751 814 733
Total 2016 Change (+/-%) +5% (2P) +10% +12%
Gross Project
31 December 20161,377 2,147 2,951 3,171 3,499
Note 1. The estimated quantities of petroleum that may potentially
be recovered by the application of future development project(s)
relate to undiscovered accumulations. These estimates have both
an associated risk of discovery and a risk of development. Further
exploration and appraisal is required to determine the existence of a
significant quantity of potentially moveable hydrocarbons. The
probability of development of the contingent area is estimated to be
90%, with the additional probability of geological success assigned
to prospective resources estimated to be 60-80%.
Development Plan ReviewSino Gas and Energy Holdings Limited have commissioned Beijing J-energy Company Limited (J-Energy) to provide technical advisory services. The review, and the production information and economic
assumptions contained in this release relating to the review, for the purposes of the conceptual development plan is based on, and fairly represents, data and supporting documentation prepared by, or under the
supervision of Mr Jin Po Dong and Mr Frank Fu. The review assumes PSC partner back-in upon ODP approval (i.e. CUCBM take their entitlement of 30% interest in Linxing PSC and CNPC take their entitlement to
51% in the Sanjiaobei PSC) and the exercise of Sino Gas’ option to acquire an interest of 5.25% in the Linxing PSC (by paying 7.5% of back costs) which was purchased in April 2017. Mr Dong is a Vice-President of
J-Energy Ltd and has a Bachelor of Petroleum Engineering from South West Petroleum University of China, has over 20 years of industry experience and is a member of the Society of Petroleum Engineers (SPE).
Mr Fu is the Chief Operating Officer of Sino Gas & Energy Holdings Limited, holds a Bachelor of Science degree in Geology and Exploration, and has over 25 years of relevant experience in both conventional and
unconventional hydrocarbon exploration & production in China and multiple international basins and a member of the Society of Petroleum Engineers (SPE). Such statements were issued with the prior written
consent of Mr Dong and Mr Fu in the form and context in which they appear. The statements and opinions attributable to J-Energy are given in good faith and in the belief that such statements are reasonable and
neither false nor misleading. J-Energy has considered and relied upon information obtained from the Company and information in the public domain. J-Energy has no pecuniary interest, other than to the extent of the
professional fees receivable for their engagement, or other interest in the assets evaluated, that could reasonably be regarded as affecting our ability to give an unbiased view of these assets.
Financial Terms This presentation contains terms commonly used in the oil and gas industry which are not defined by or calculated in accordance with International Financial Reporting Standards (“IFRS”), such as margin and free
cashflow, which are non-IFRS measures. These terms should not be considered an alternative to, or more meaningful than the comparable measures determined in accordance with IFRS. The measures provide
additional information to evaluate the conceptual development plan. The non-IFRS measures have not been subject to audit or review by Sino Gas’ external auditors. Sino Gas’ determination of these measures may
not be comparable to that reported by other companies.

sinogasenergy.com ASX|SEH22
Definitions and Conversions
1. Sources: BP Statistical Review, June 2016, Factset January 2018, company calculations
Bcf – billion cubic feetBOE – barrels of oil equivalentCGS – Central gathering stationCNEML – China New Energy Mining Limited – 51% owner of SGECRR – Chinese Reserve ReportCUCBM – China United Coal Bed Methane, subsidiary of China National
Offshore Oil Company (CNOOC), PSC Partner in Linxing PSCEUR – Estimated Ultimate RecoveryGIIP – Gas Initially in PlaceGSA – Gas Sales AgreementHSE – Health, Safety and EnvironmentIRR – Internal Rate of ReturnJMC – Joint Management CommitteeMboe/d – thousand barrel of oil equivalent per daymm – millionMMbtu – Million British Thermal UnitsMMscf/d – Million standard cubic feet per dayMscf/d – Thousand standard cubic feet per dayNDRC – National Development and Reform CommissionODP – Overall Development PlanPCCBM – PetroChina CBM, subsidiary of PetroChina, PSC Partner in
SanjiaobeiPSC – Production sharing contractSGE – Sino Gas Energy Limited – Sino Gas’ 49% owned Joint Venture
CompanySOE – State Owned Enterprise Tcf – trillion cubic feetToP – Take or Pay YOY – Year on Year
Definitions
1 barrel of oil equivalent (boe) = 6 thousand standard cubic feet gas (Mscf)
1 billion cubic meter (bcm) = 35.3 billion cubic feet (bcf)
1 BCM/annum = 0.1 bcf/d
1 million ton LNG = 48 bcf gas
1 US dollar (US$) = 6.37 Chinese Remnimbi (RMB)
1 million tonnes oil equivalent (mmtoe) = 39.2 bcf
1 million british thermal units (mmbtu) = 0.99 Mscf
1 bcf natural gas generates aprox. 112 gigawatt hours of electricity (in a modern power plant)
1 tonne of coal equivalent (tce)= 0.7 tonnes of oil equivalent (toe) = 27 Mscf gas
Approximate conversion factors 1

ASX|SEHsinogasenergy.com
APPENDIX
sinogasenergy.com ASX|SEH24
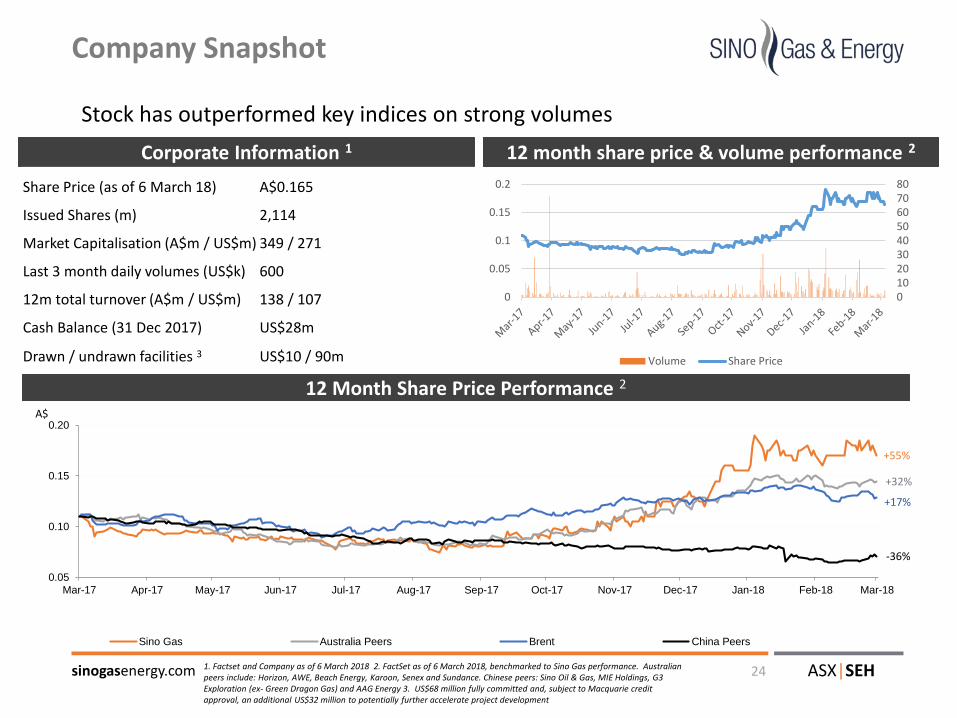
Corporate Information 1 12 month share price & volume performance 2
12 Month Share Price Performance 2
Company Snapshot
1. Factset and Company as of 6 March 2018 2. FactSet as of 6 March 2018, benchmarked to Sino Gas performance. Australian peers include: Horizon, AWE, Beach Energy, Karoon, Senex and Sundance. Chinese peers: Sino Oil & Gas, MIE Holdings, G3 Exploration (ex- Green Dragon Gas) and AAG Energy 3. US$68 million fully committed and, subject to Macquarie credit approval, an additional US$32 million to potentially further accelerate project development
+55%
+17%
-36%
+32%
Stock has outperformed key indices on strong volumes
Share Price (as of 6 March 18) A$0.165
Issued Shares (m) 2,114
Market Capitalisation (A$m / US$m) 349 / 271
Last 3 month daily volumes (US$k) 600
12m total turnover (A$m / US$m) 138 / 107
Cash Balance (31 Dec 2017) US$28m
Drawn / undrawn facilities 3 US$10 / 90m
A$
0.05
0.10
0.15
0.20
Mar-17 Apr-17 May-17 Jun-17 Jul-17 Aug-17 Sep-17 Oct-17 Nov-17 Dec-17 Jan-18 Feb-18 Mar-18
Sino Gas Australia Peers Brent China Peers
01020304050607080
0
0.05
0.1
0.15
0.2
Volume Share Price

sinogasenergy.com ASX|SEH25
Large Markets with Diverse Buyer Universe
▪ Extensive and growing pipeline network
▪ Proximal, large and growing demand centres, with ~330 million people
▪ Diverse universe of gas buyers
xx
3.3
15
12
30
15
3
5.89.8
16
7.2
6.0
X
Xiong’an
End users1:
Regional demand expected to double by 2025 1
39%
16%
15%
12%
4%
Commerical / Industrial ResidentialTransportation HeatingGas Fired Power Gen.
1. Source: IHS Markit, China’s Provincial Gas Demand and National Supply Outlook, August 2017, Target markets defined as Shanxi, Shandong, Hebei, Beijing, Tianjin and Henan, doubles between 2015 and 2025
2. Map source: SIA Energy, October 2017, major pipelines only

sinogasenergy.com ASX|SEH26
PSC Mechanism
Government Take Income Tax (25%)SGE Take
Gross Revenue splits1
InvestmentPhase
Full Cycle▪ China attractive fiscal and regulatory regime
▪ Accelerated Cost Recovery provides immediate cash flow to contractor
▪ Supports funding of investment phase
▪ Full cycle take attractive by global standards
VAT, Fees, Surcharges
Gross Revenues
SGE priority recovery of pre-ODP costs
Cost Recovery
~95% split via working interests~5% Government royalty
Profit Recovery
Net Revenues
UnusedRecoverygas
Illustrative PSC waterfall
~80% ~20%
~12%
42%
50%
8%
21%
76%
3%
1. Assumes IHS Markit August 2017 price (refer to slide 13) with Sino Gas’ realised wellhead gas price $1/Mscf less than Shanxi Province city-gate price
sinogasenergy.com ASX|SEH27
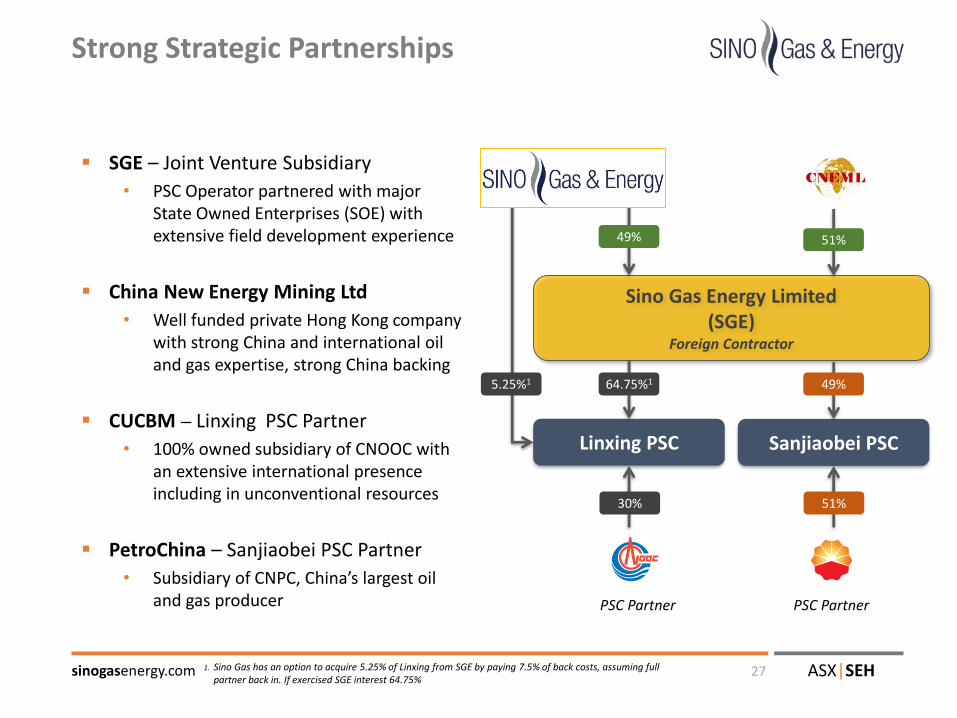
Strong Strategic Partnerships
1. Sino Gas has an option to acquire 5.25% of Linxing from SGE by paying 7.5% of back costs, assuming full partner back in. If exercised SGE interest 64.75%
▪ SGE – Joint Venture Subsidiary
• PSC Operator partnered with major State Owned Enterprises (SOE) with extensive field development experience
▪ China New Energy Mining Ltd
• Well funded private Hong Kong company with strong China and international oil and gas expertise, strong China backing
▪ CUCBM – Linxing PSC Partner
• 100% owned subsidiary of CNOOC with an extensive international presence including in unconventional resources
▪ PetroChina – Sanjiaobei PSC Partner
• Subsidiary of CNPC, China’s largest oil and gas producer
Linxing PSC Sanjiaobei PSC
Sino Gas Energy Limited (SGE)
Foreign Contractor
49% 51%
64.75%1 49%
PSC Partner PSC Partner
51%30%
5.25%1
sinogasenergy.com ASX|SEH
Investor Relations+86 10 8458 30011300 746 642 (local call within Australia)[email protected]