Embed Size (px)
Citation preview

EUS guided tissue acquisition
Jayapal Ramesh
Advanced Endoscopist
Royal Liverpool and Broadgreen University Hospitals NHS Trust
Honorary Senior Lecturer, University of Liverpool

Learning Objectives and Outline
•To review the different tissue acquisition techniques
•Practical tips based on current evidence for effective tissue acquisition
•To apply evidence to everyday practice EUS FN tissue procurement
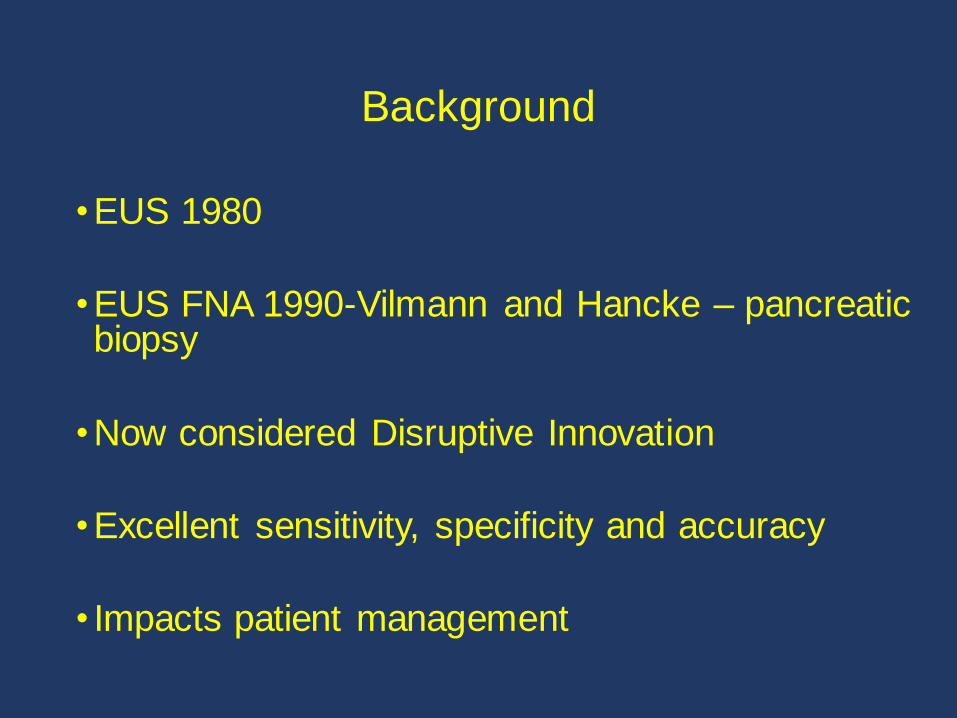
Background
•EUS 1980
•EUS FNA 1990-Vilmann and Hancke – pancreatic biopsy
•Now considered Disruptive Innovation
•Excellent sensitivity, specificity and accuracy
• Impacts patient management

Pancreatic Cytology from 1990-2010
EUS Instituted 07/2000

Disruptive Innovation 2761 samples
Eltoum IA: Arch Pathol Lab Med 2012
Non-EUS-guided FNAC: 36% to 1%
Needle Biopsy: 29% to 9%
55%
78%
16% 16%
7%
88%
96%
3% 4% 1%
0%
10%
20%
30%
40%
50%
60%
70%
80%
90%
100%
Sen
sitiv
ity
Sp
ecific
ity
Su
sp
icio
us
Aty
pic
al
Un
sa
tisfa
cto
ry
1990-2000
2001-2010
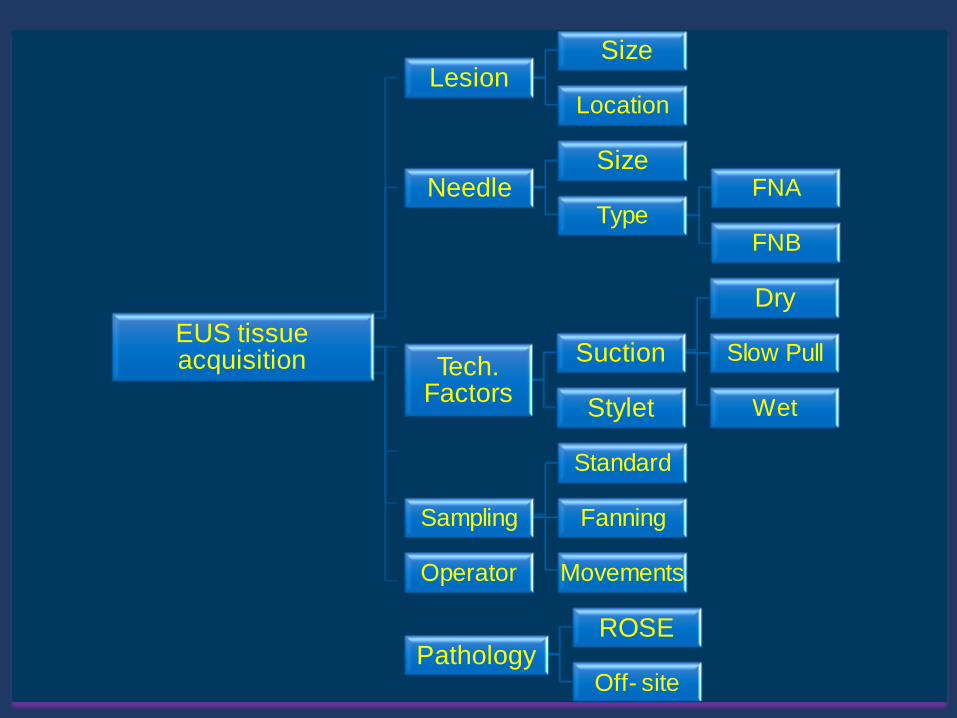
EUS tissue acquisition
Lesion Size
Location
Needle Size
Type FNA
FNB
Tech. Factors
Suction
Dry
Slow Pull
Wet Stylet
Sampling
Standard
Fanning
Movements Operator
Pathology ROSE
Off- site
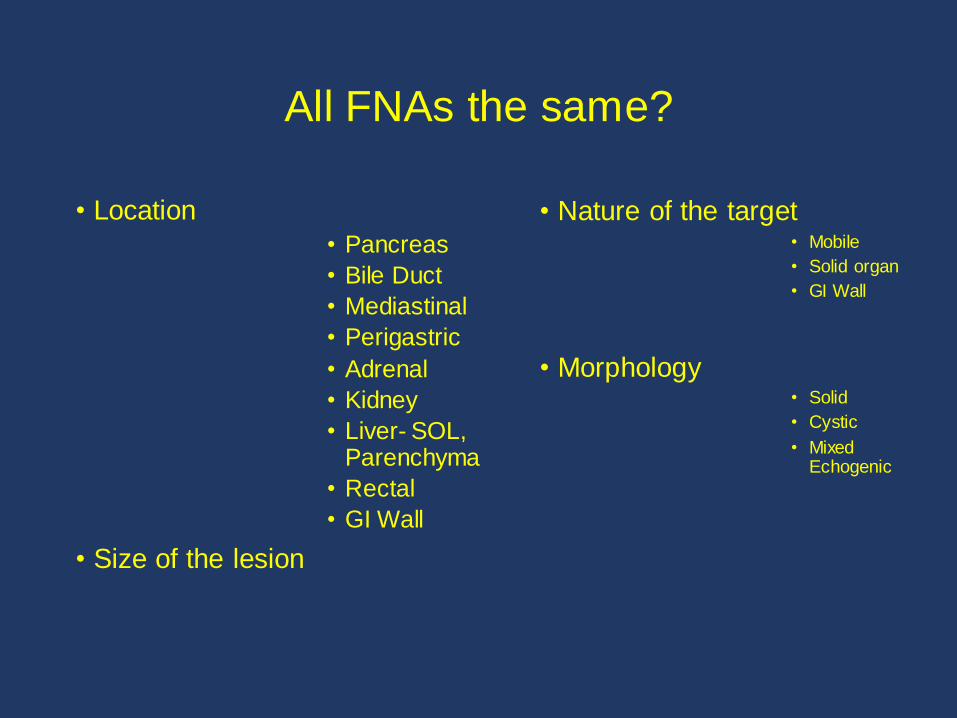
All FNAs the same?
• Location
• Pancreas
• Bile Duct
• Mediastinal
• Perigastric
• Adrenal
• Kidney
• Liver- SOL, Parenchyma
• Rectal
• GI Wall
• Size of the lesion
• Nature of the target • Mobile
• Solid organ
• GI Wall
• Morphology • Solid
• Cystic
• Mixed Echogenic
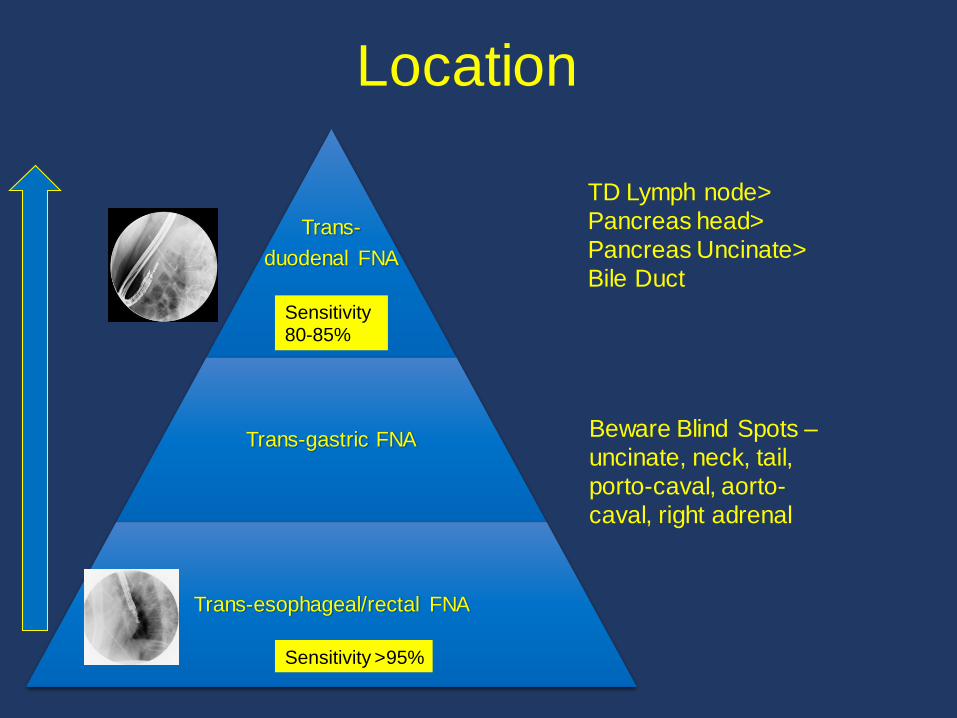
Location
Trans-
duodenal FNA
Trans-gastric FNA
Trans-esophageal/rectal FNA
Sensitivity >95%
Sensitivity 80-85%
TD Lymph node>
Pancreas head>
Pancreas Uncinate>
Bile Duct
Beware Blind Spots –
uncinate, neck, tail,
porto-caval, aorto-
caval, right adrenal

Performance characteristic of endoscopic ultrasound-guided fine needle aspiration is
unaffected by pancreatic mass size
Group A Group B Group C Group D Total
Sensitivity 0.7333 0.8738 0.8776 0.7846 0.8595
Diagnostic
accuracy 0.7333 0.8661 0.8811 0.8158 0.8644
Ramesh J et al Endosc Int Open. 2016 Apr; 4(4): E434

Size does not matter
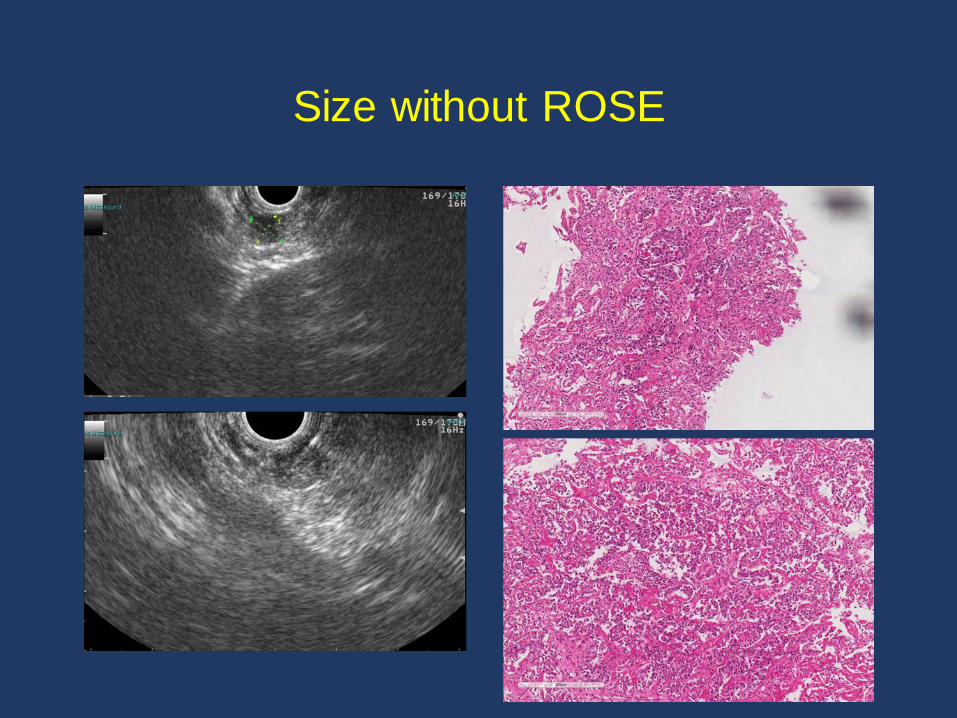
Size without ROSE

Needle Selection

Needle Selection
Author No. Lesion Needle Diagnostic Accuracy
Camellini L
Fabbri C
Siddiqui UD
Song TH
Ramesh J
127
50
131
117
72
All Lesions
Pancreatic Masses
All Lesions
Pancreatic Masses
Pancreatic Masses
22 vs. 25G
22 vs. 25G
22 vs. 25G
22 vs. 19G
19 vs. 25G
77.8 vs. 78.1%
86 vs. 94%
87.5 vs. 95.5%
78.1 vs. 94.5%
94.4 vs. 88.9%
25G for Head/Uncinate Masses
22G = 25G for FNA’s
Meta-analysis Lesions 22 vs. 25G Pooled Sensitivity p
Madhoun MF 1364 799 vs. 565 0.85 (95% CI=82-88)
vs. 93 (95% CI-91-96)
0.0003
25G for Pancreatic Masses

Bang JY: Endoscopy 2016
ProCore FNA
Outcome Measure ProCore
(n)
FNA
(n) Mean % (95% CI) Mean % (95% CI) Pooled RR (95%CI) p-value
Diagnostic Adequacy: 742 745 82.7 (74.2-89.8) 79.3 (70.4-87.0) 1.06 (0.97-1.16) 0.221
All Masses
Diagnostic Adequacy: 317 324 84.8 (70.4-95.0) 88.5 (80.1-94.9) 0.98 (0.85-1.12) 0.721
Pancreatic Masses
Diagnostic Accuracy: 421 474 84.9 (76.1-92.0) 79.3 (71.8-85.9) 1.06 (0.99-1.14) 0.083
All Masses
Diagnostic Accuracy: 225 277 88.4 (82.4-93.3) 79.9 (73.6-85.5) 1.12 (0.99-1.26) 0.067
Pancreatic Masses
Histology: 104 108 66.8 (49.7-81.9) 68.7 (54.5-81.3) 1.02 (0.85-1.22) 0.864
All Masses
Histology: 66 70 75.4 (60.2-87.8) 75.2 (63.2-85.5) 1.03 (0.84-1.26) 0.756
Pancreatic Masses
Mean passes for
diagnosis: All Masses 209 209 - -
SMD -0.90 (-1.80 -
0.005) 0.051
Meta-analysis: ProCore and FNA needles
Mean passes for
diagnosis: All Masses 209 209 - -
SMD -0.90 (-1.80 -
0.005) 0.051
Needle Selection

Summary of studies evaluating the role of suction
Author Study design No. of
patients
With
suction
Without
suction
P value
Wallace et al.
2001
RCT 43 Higher NA 0.01
Puri et al. 2009 RCT 52 100% 100% NS
Lee et al. 2013 RCT 81 72.8% 58.6% 0.001
Adequate specimens
Puri et al. Scand J Gastroenterol, 2009; 44: 499-504.
Wallace et al. Gastrointest Endosc, 2001; 54: 441-7.
Lee et al. Gastrointest Endosc 2013;77:745-51.

Summary of studies evaluating the role of suction
Author Study design No. of
patients
With
suction
Without
suction
P value
Wallace et al.
2001
RCT 43 Higher NA 0.0004
Puri et al. 2009 RCT 52 76.9% 88.5% 0.14
Lee et al. 2013 RCT 81 6.2% 0.6% <0.001
Bloodiness
Puri et al. Scand J Gastroenterol, 2009; 44: 499-504.
Wallace et al. Gastrointest Endosc, 2001; 54: 441-7.
Lee et al. Gastrointest Endosc 2013;77:745-51.

Summary of studies evaluating the role of suction
Author Study design No. of
patients
With
suction
Without
suction
P value
Wallace et al.
2001
RCT 43 No difference 0.19
Puri et al. 2009 RCT 52 85.7% 66.7% 0.05
Lee et al. 2013 RCT 81 82.4% 72.1% 0.005
Diagnostic Yield of Malignancy
Puri et al. Scand J Gastroenterol, 2009; 44: 499-504.
Wallace et al. Gastrointest Endosc, 2001; 54: 441-7.
Lee et al. Gastrointest Endosc 2013;77:745-51.

Wet vs Dry Suction Technique
•22G needle
•117 lesions
•Either wet suction or standard ‘dry’ suction
•Subsequent passes using alternating techniques.
Wet Technique Dry technique P value
Mean Cellularity 1.83 (+/- 0.79) 1.44 (+/-0769) < 0.001
Diagnostic Yield 85.5% 74.4% <0.001
Gastrointest Endosc. 2015;81(6):1401-7.

Suction vs Capillary
• 367 passes in 93 solid pancreatic lesions were retrospectively analyzed
• 181 by suction and 186 by slow pull (capillary)
Nakai et al. Dig Dis Sci. 2014; 59:1578–1585.
Overall Suction Slow pull P value
Diagnostic accuracy 75.1 % 83.9 % 0.039
Cellularity 71.8 % 52.2 % <0.001
Bloodiness 60.8 % 51.1 % 0.074
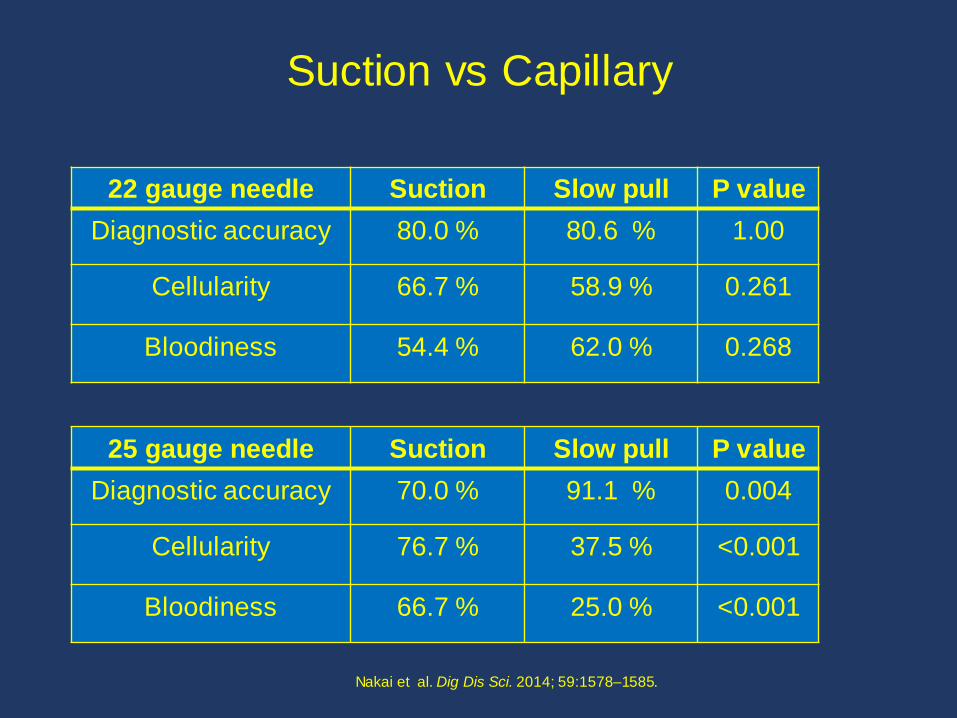
Suction vs Capillary
Nakai et al. Dig Dis Sci. 2014; 59:1578–1585.
22 gauge needle Suction Slow pull P value
Diagnostic accuracy 80.0 % 80.6 % 1.00
Cellularity 66.7 % 58.9 % 0.261
Bloodiness 54.4 % 62.0 % 0.268
25 gauge needle Suction Slow pull P value
Diagnostic accuracy 70.0 % 91.1 % 0.004
Cellularity 76.7 % 37.5 % <0.001
Bloodiness 66.7 % 25.0 % <0.001

Standard vs Fanning Technique of FNA
Bang, Endoscopy

RT of Standard vs. Fanning FNA
Standard Fanning
n= 26 n = 28
First pass diagnosis
57.7% 85.7%
No Needle Dysfunction
Bang, Endoscopy
Standard Fanning P
value
No. of passes for
diagnosis
1.7±0.88 1.2 ±0.57
0.02
76.90%
57.70%
96.40% 85.70%
Diagnostic accuracy Diagnostic yield of passone
Standard Fanning
P=0.05 P=0.02
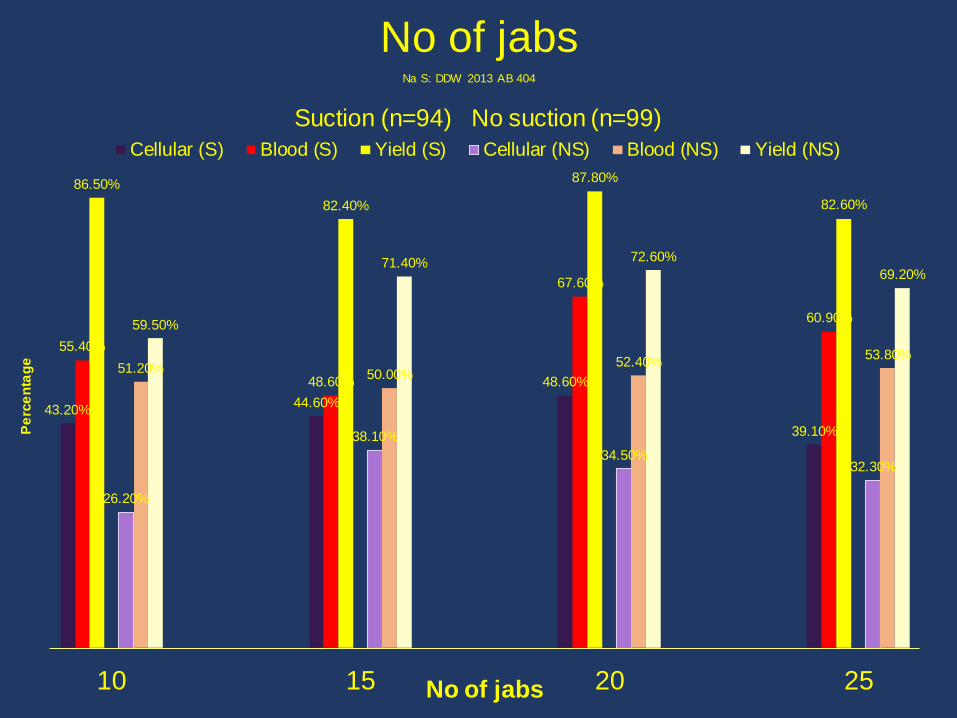
No of jabs
43.20% 44.60%
48.60%
39.10%
55.40%
48.60%
67.60%
60.90%
86.50%
82.40%
87.80%
82.60%
26.20%
38.10%
34.50% 32.30%
51.20% 50.00% 52.40%
53.80%
59.50%
71.40% 72.60%
69.20%
10 15 20 25
Pe
rce
nta
ge
No of jabs
Cellular (S) Blood (S) Yield (S) Cellular (NS) Blood (NS) Yield (NS)
Na S: DDW 2013 AB 404
Suction (n=94) No suction (n=99)

All cases (N = 82) DKM CM P value
Tissue acquisition (cellularity score ≥1) 91.5% (75/82) 89.0% (73/82) .37
High-cellularity tissue acquisition (cellularity score = 3) 54.9% (45/82) 41.5% (34/82) .03
Adequate quality (quality score ≥2) 78.0% (64/82) 80.5% (66/82) .42
Accuracy 76.8% (63/82) 78.0% (64/82) .50
Transgastric (n = 63)
Tissue acquisition (cellularity score ≥1) 93.7% (59/63) 85.7% (54/63) .06
High-cellularity tissue acquisition (cellularity score = 3) 63.5% (40/63) 39.7% (25/63) .002
Adequate quality (quality score ≥2) 84.1% (53/63) 79.4% (50/63) .30
Accuracy 84.1% (53/63) 76.2% (48/63) .11
Transduodenal (n = 19)
Tissue acquisition (cellularity score ≥1) 84.2% (16/19) 100% (19/19) .13
High-cellularity tissue acquisition (cellularity score = 3) 26.3% (5/19) 47.4% (9/19) .11
Adequate quality (quality score ≥2) 57.9% (11/19) 84.2% (16/19) .03
Accuracy 52.6% (10/19) 84.2% (16/19) .02
Mass size ≥20 mm (n = 53)
Tissue acquisition (cellularity score ≥1) 96.2% (51/53) 92.5% (49/53) .34
High-cellularity tissue acquisition (cellularity score = 3) 52.8% (28/53) 37.7% (20/53) .07
Adequate quality (quality score ≥2) 83.0% (44/53) 81.1% (43/53) .50
Accuracy 83.0% (44/53) 81.1% (43/53) .50
Mass size <20 mm (n = 29)
Tissue acquisition (cellularity score ≥1) 89.6% (26/29) 79.3% (23/29) .19
High-cellularity tissue acquisition (cellularity score = 3) 51.7% (15/29) 48.3% (14/29) .50
Adequate quality (quality score ≥2) 69.0% (20/29) 79.3% (23/29) .27
Accuracy 65.5% (19/29) 72.4% (21/29) .36
Door Knocking Method Gastrointest Endosc. 2015 Oct 30.
High-cellularity tissue acquisition (cellularity score = 3) 54.9% (45/82) 41.5% (34/82) .03
High-cellularity tissue acquisition (cellularity score = 3) 63.5% (40/63) 39.7% (25/63) .002
Adequate quality (quality score ≥2) 57.9% (11/19) 84.2% (16/19) .03
Accuracy 52.6% (10/19) 84.2% (16/19) .02

Author Number of patients Comparators Diagnostic Accuracy
Fisher JM 268 Stent vs. No stent 92.4% vs. 88.5%
Siddiqui AA 677 Plastic vs. metal stent 97.1 vs. 97 %
Varadarajulu S 241 Stent vs. no stent
Plastic vs. metal
95% vs. 93%
95% vs. 95%
Relationship between stents and EUS-FNA
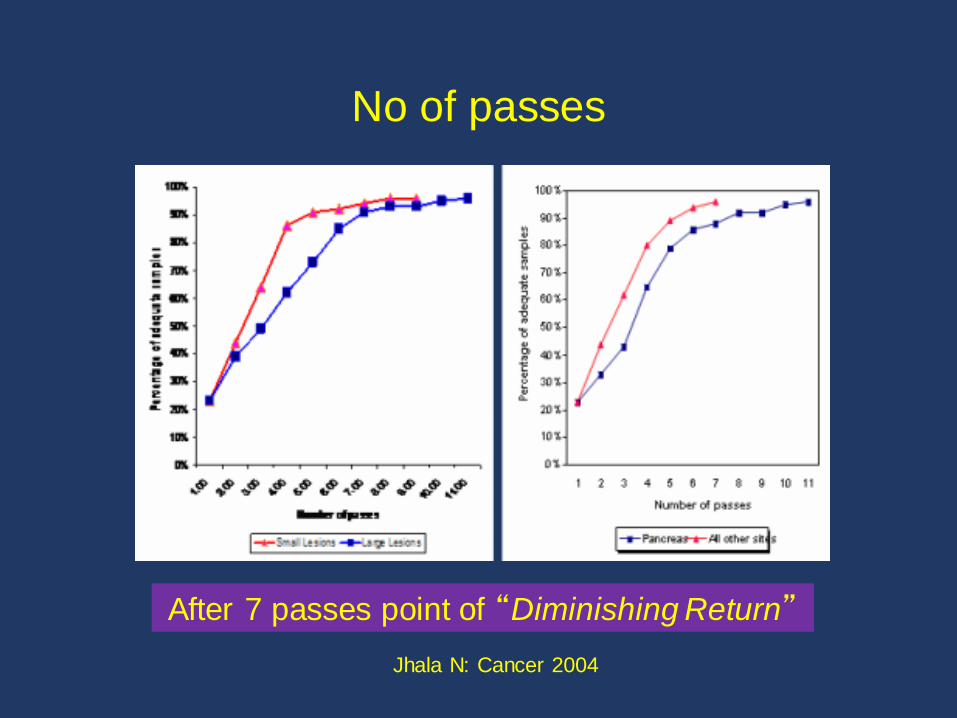
No of passes
After 7 passes point of “Diminishing Return”
Jhala N: Cancer 2004
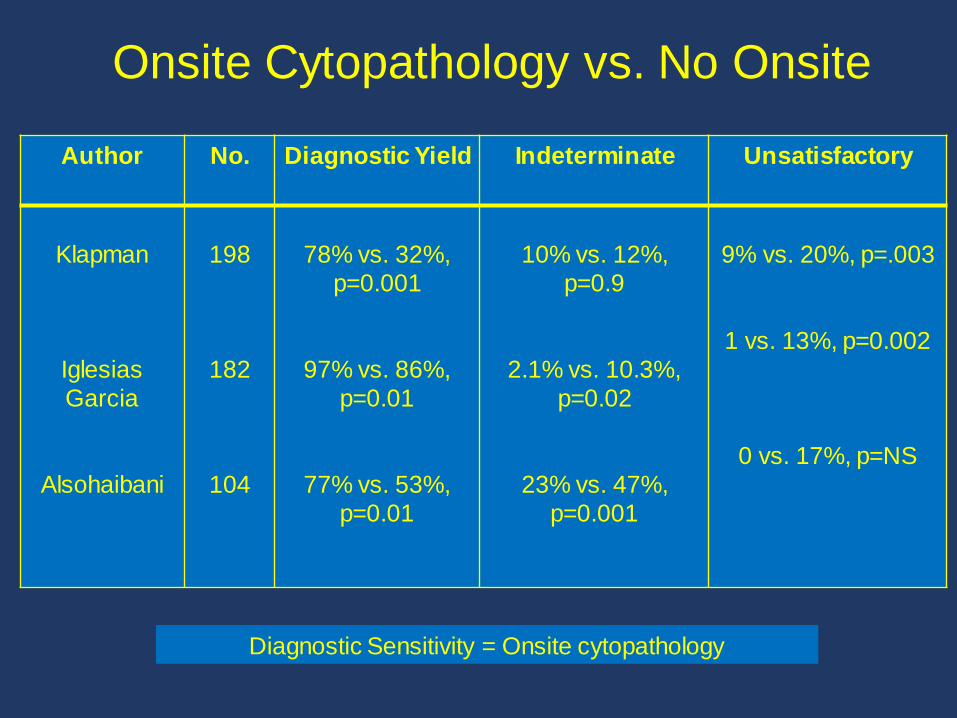
Onsite Cytopathology vs. No Onsite
Author No. Diagnostic Yield Indeterminate Unsatisfactory
Klapman
Iglesias
Garcia
Alsohaibani
198
182
104
78% vs. 32%,
p=0.001
97% vs. 86%,
p=0.01
77% vs. 53%,
p=0.01
10% vs. 12%,
p=0.9
2.1% vs. 10.3%,
p=0.02
23% vs. 47%,
p=0.001
9% vs. 20%, p=.003
1 vs. 13%, p=0.002
0 vs. 17%, p=NS
Diagnostic Sensitivity = Onsite cytopathology
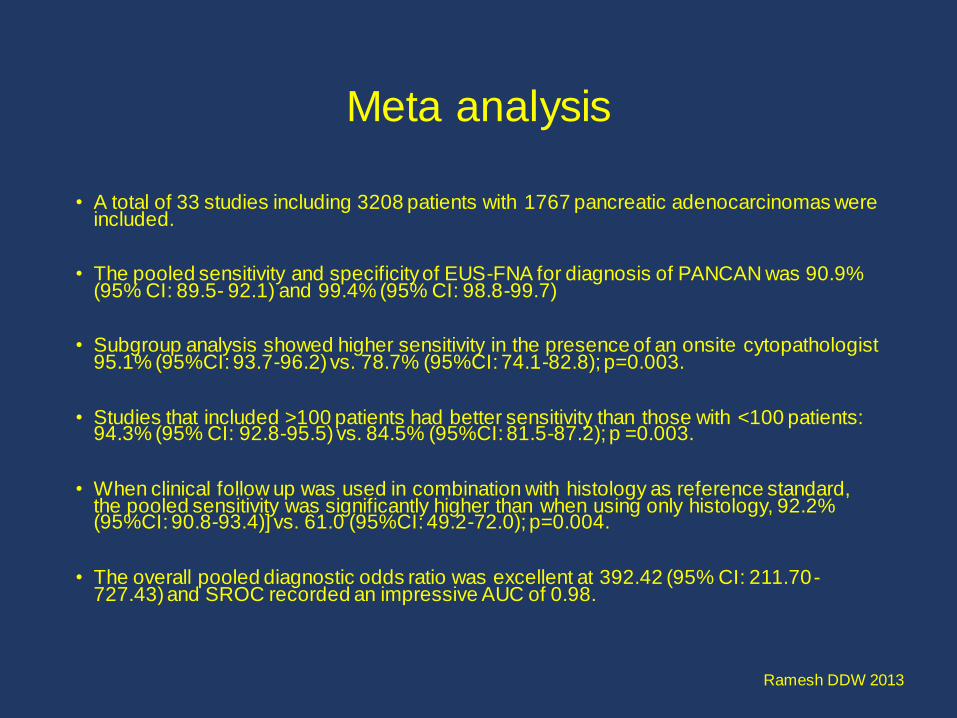
Meta analysis
• A total of 33 studies including 3208 patients with 1767 pancreatic adenocarcinomas were included.
• The pooled sensitivity and specificity of EUS-FNA for diagnosis of PANCAN was 90.9% (95% CI: 89.5- 92.1) and 99.4% (95% CI: 98.8-99.7)
• Subgroup analysis showed higher sensitivity in the presence of an onsite cytopathologist 95.1% (95%CI: 93.7-96.2) vs. 78.7% (95%CI: 74.1-82.8); p=0.003.
• Studies that included >100 patients had better sensitivity than those with <100 patients: 94.3% (95% CI: 92.8-95.5) vs. 84.5% (95%CI: 81.5-87.2); p =0.003.
• When clinical follow up was used in combination with histology as reference standard, the pooled sensitivity was significantly higher than when using only histology, 92.2% (95%CI: 90.8-93.4)] vs. 61.0 (95%CI: 49.2-72.0); p=0.004.
• The overall pooled diagnostic odds ratio was excellent at 392.42 (95% CI: 211.70-727.43) and SROC recorded an impressive AUC of 0.98.
Ramesh DDW 2013


Indeterminate FNAs
Author Proportion of
Total cases
Indication Diagnostic
Accuracy
Eloubeidi
Dewitt
Nicaud
24/517 (4.6%) Pan.
Masses
73/8396 (0.8%)
EUS exams
30/3895 (0.77%)
EUS exams
Panc. Mass
55% Panc. Mass
Panc. Mass
84%
63%
61%
Most common indication is Pancreatic Mass
Diagnostic accuracy of repeat FNA > 60%

Why histology?
•Better assessment of tumors
•Definitive for benign diseases
•No need for on-site assessment
•Parenchymal biopsy- Liver, Pancreas for AIP
•Lymphoma
•SMT
•Molecular studies
• Immunohistochemistry for characterization
•Chronic Pancreatitis
• IPMN Cancer
•Characterization of tumors

Shark core 22G
19G
19-TCB
19-Procore
22 Procore
19G
Flex-19G
HISTOLOGY
Yasuda 2006: Lymphoma
Sakomoto 2009: Pan Head: 8%
Iglesias Garcia 2011: Accuracy >90% Difficult Pan Head
JY Bang 2012: FNB = FNA Accuracy: 89.3 vs. 100%
Larghi A 2011: Accuracy 90% No Pancreatic Head
Varadarajulu 2012 Cytology 92% Histology 95% Combined 100% Kandel 2016: Pancreas lesions

Newer Needles
• 33 underwent 312 passes in 42 different lesions.
• A diagnosis of malignancy was more likely with FNB than FNA (72.7% vs 66.7%, p=0.727)
• FNA and FNB had similar sensitivities, specificities, and accuracies for cancer (81.5% vs 88.9%, 100% vs 100%, and 84.8% vs 90.9%, respectively)
• FNB provided qualitative information not reported on FNA, such as degree of differentiation in malignancy, metastatic origin, and rate of proliferation in neuroendocrine tumors.
Impact of EUS-guided fine-needle biopsy with a new core needle on the need
for on-site cytopathological assessment: a preliminary study.
Gastrointest Endosc. 2016 Jun 23.

EUS-guided fine needle biopsy sampling using a novel fork-tip needle: a case-control study.
Median no. of passes
Size for histologic screening
Median histology score
Two groups
Total number 156
25% (n = 39)
FNB
4 (sufficient for adequate histology)
95%
2
75% (n = 117)
FNA
2 (sufficient for cytology but not histology)
59%
4
P = .01
P = .001
There was significant difference in the median number of passes to all lesion sites
and needle gauges.
Gastrointest Endosc. 2016 Mar 24
Retrospective case control study with 1:3 matching by lesion site and needle gauge
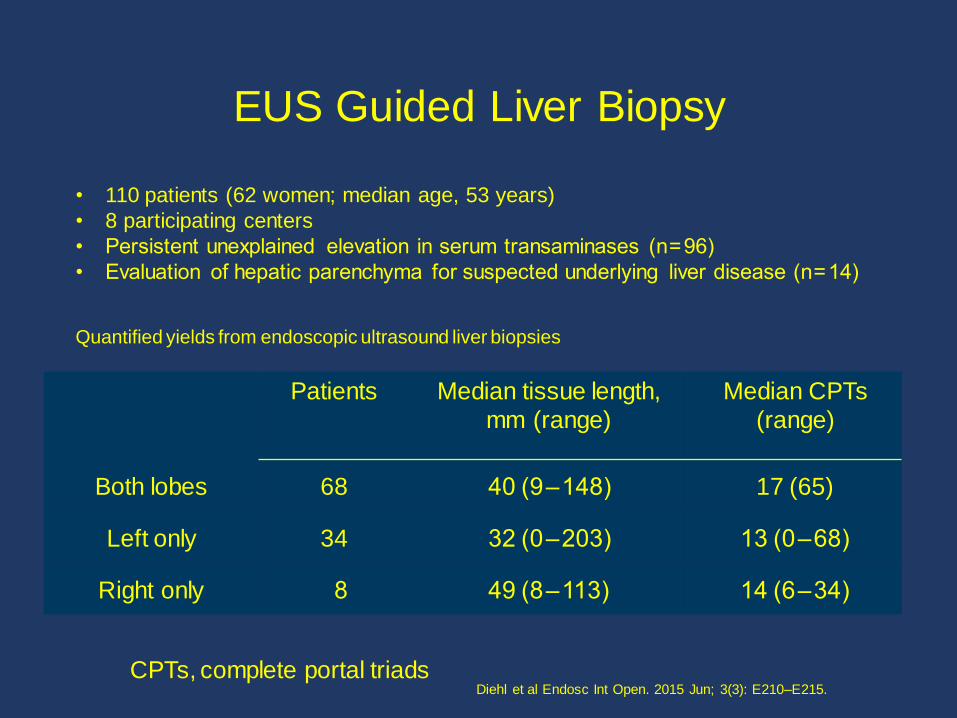
EUS Guided Liver Biopsy
Patients Median tissue length,
mm (range)
Median CPTs
(range)
Both lobes 68 40 (9 – 148) 17 (65)
Left only 34 32 (0 – 203) 13 (0 – 68)
Right only 8 49 (8 – 113) 14 (6 – 34)
• 110 patients (62 women; median age, 53 years)
• 8 participating centers
• Persistent unexplained elevation in serum transaminases (n = 96)
• Evaluation of hepatic parenchyma for suspected underlying liver disease (n = 14)
Quantified yields from endoscopic ultrasound liver biopsies
CPTs, complete portal triads Diehl et al Endosc Int Open. 2015 Jun; 3(3): E210–E215.

Summary
• Question asked – mass, cyst, LN, SMT, GI Wall, parenchyma
• Pathologist discussion key • Plan early
• Set your parameters
• Have a system in place
• Consistency

Aim is to acquire adequate good quality specimen
with minimal number of passes, efficiently and
safely

Thank You