Embed Size (px)
Citation preview
Eutrophication 4Modelling, Assessing,
Monitoring and Remediation
G. GiordaniYongjin Xiao
Ana Cristina CardosoLaurence Mee
Joao Gomes FerreiraF. Coljin
Alice Newton

This lecture is a summary overview, a series of detailed separate lectures are
also available

Modelling, Monitoring, Assessing and Remediation~ Nutrient budget model (LOICZ tool)
~ Monitoring eutrophication
~ Assessing Eutrophication~ Europe
~ OSPAR~ DPSIR~ ELME scenarios and indicators (Black Sea)
~ NEEA-USA~ ASSETS- Global (LOICZ tool)
LOICZNutrient budget modelling
(for full presentation use file Eutrophication 4.1Modelling)
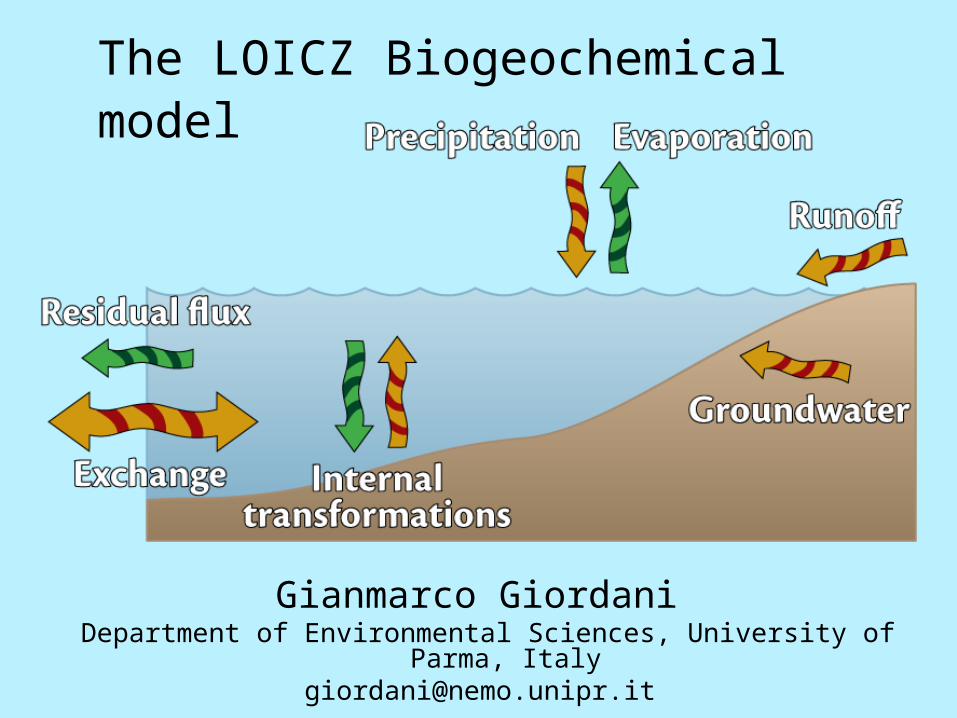
The LOICZ Biogeochemical model
Gianmarco Giordani Department of Environmental Sciences, University of Parma, Italy
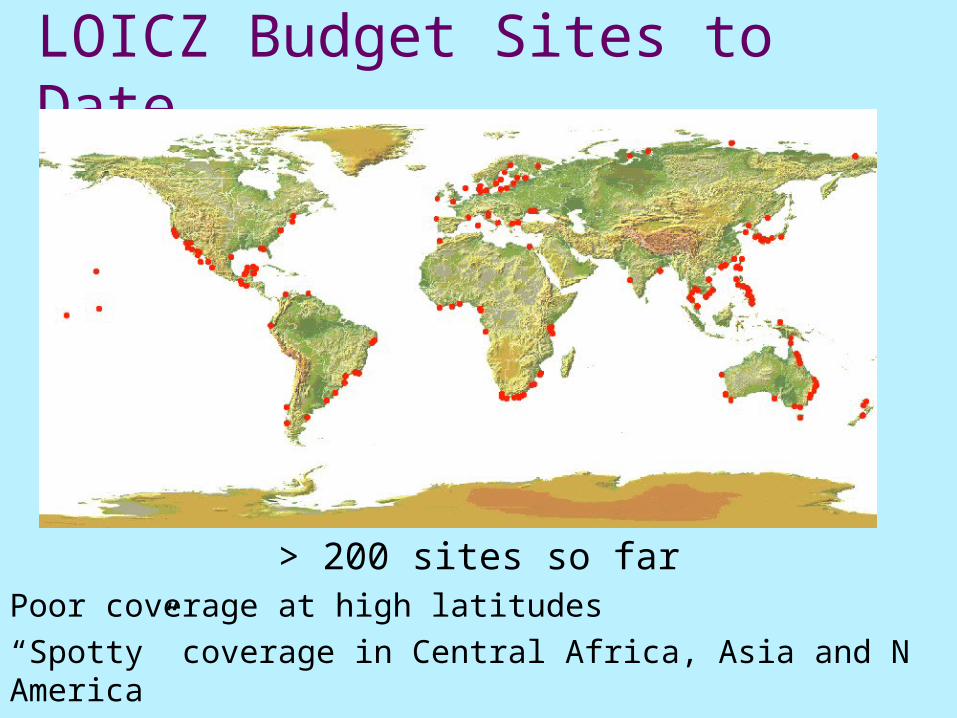
LOICZ Budget Sites to Date
> 200 sites so farPoor coverage at high latitudes“Spotty” coverage in Central Africa, Asia and N America
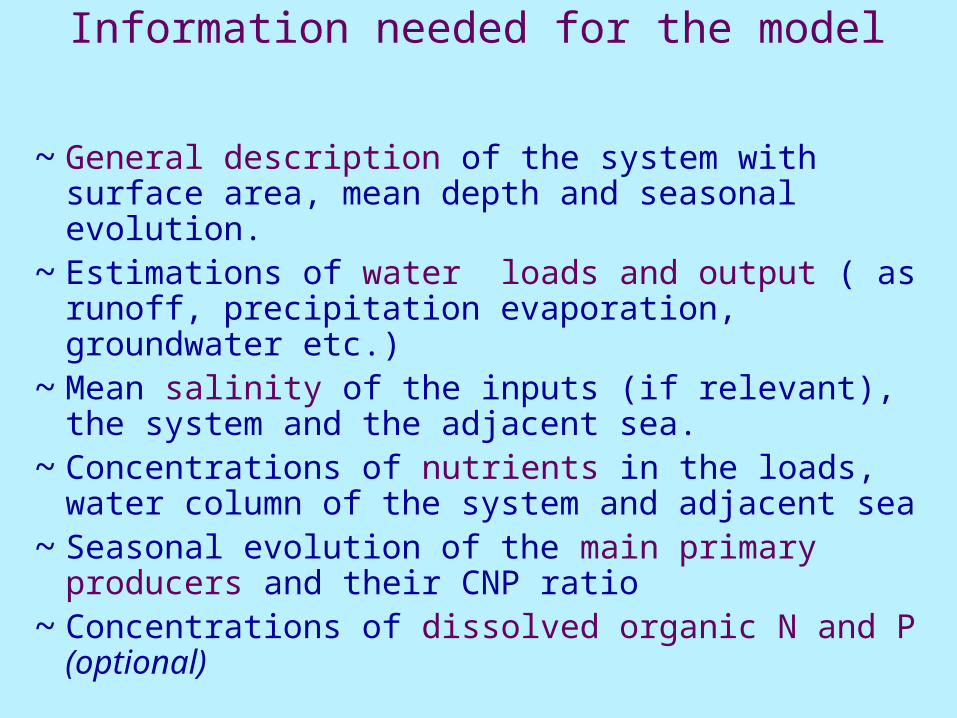
Information needed for the model
~ General description of the system with surface area, mean depth and seasonal evolution.
~ Estimations of water loads and output ( as runoff, precipitation evaporation, groundwater etc.)
~ Mean salinity of the inputs (if relevant), the system and the adjacent sea.
~ Concentrations of nutrients in the loads, water column of the system and adjacent sea
~ Seasonal evolution of the main primary producers and their CNP ratio
~ Concentrations of dissolved organic N and P (optional)
Monitoring Eutrophication
EEA and JRC
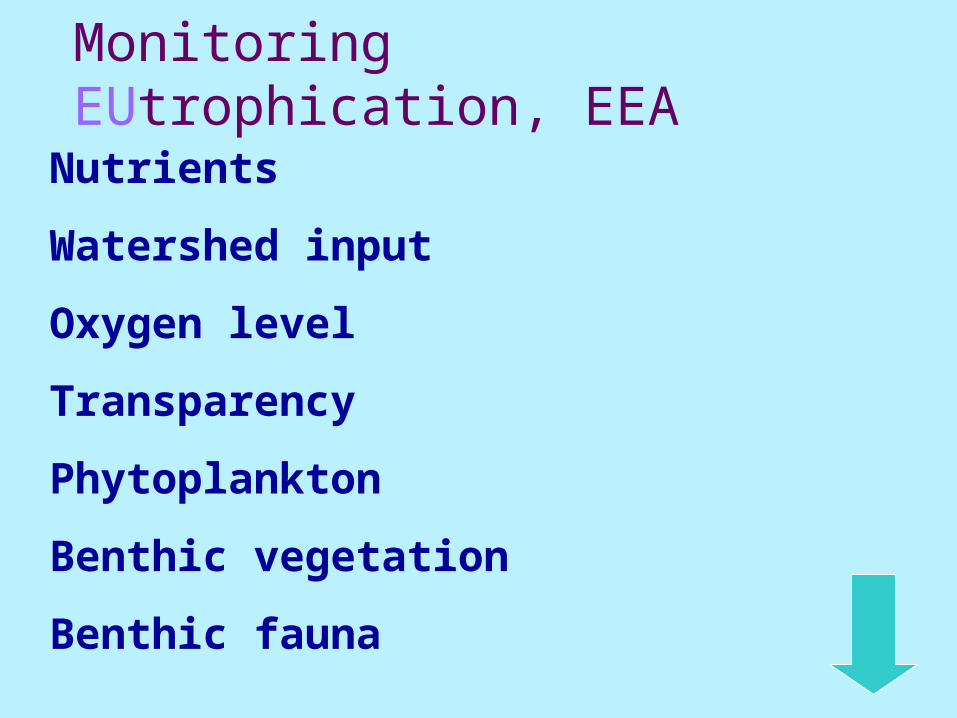
Monitoring EUtrophication, EEA
Nutrients
Watershed input
Oxygen level
Transparency
Phytoplankton
Benthic vegetation
Benthic fauna
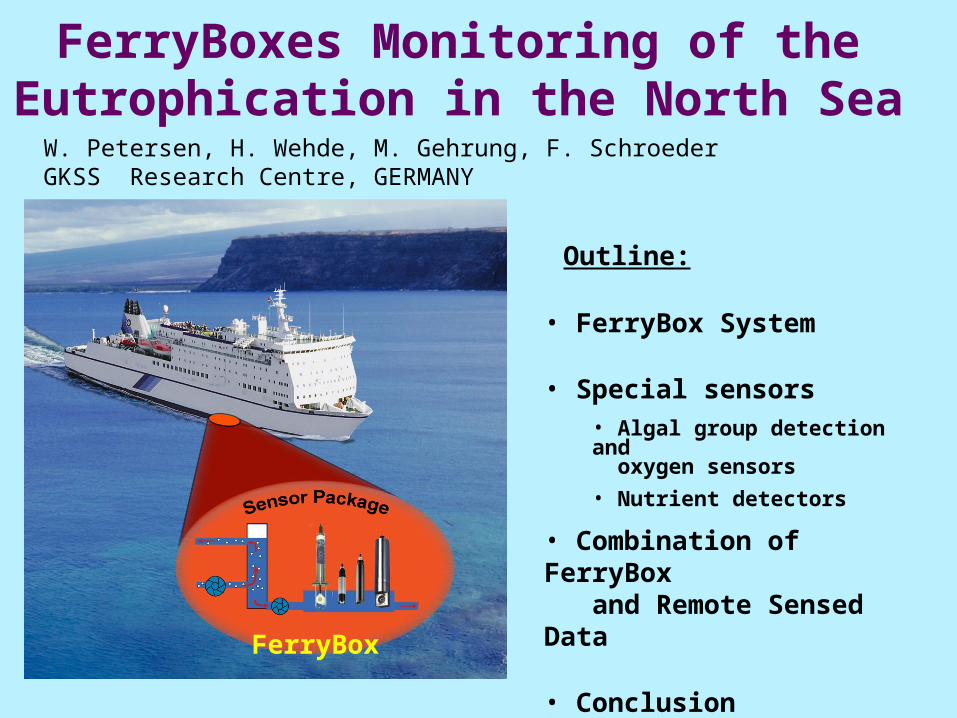
FerryBoxes Monitoring of the Eutrophication in the North Sea
W. Petersen, H. Wehde, M. Gehrung, F. SchroederGKSS Research Centre, GERMANY
FerryBox
Outline:
• FerryBox System
• Special sensors• Algal group detection and oxygen sensors
• Nutrient detectors
• Combination of FerryBox and Remote Sensed Data
• Conclusion
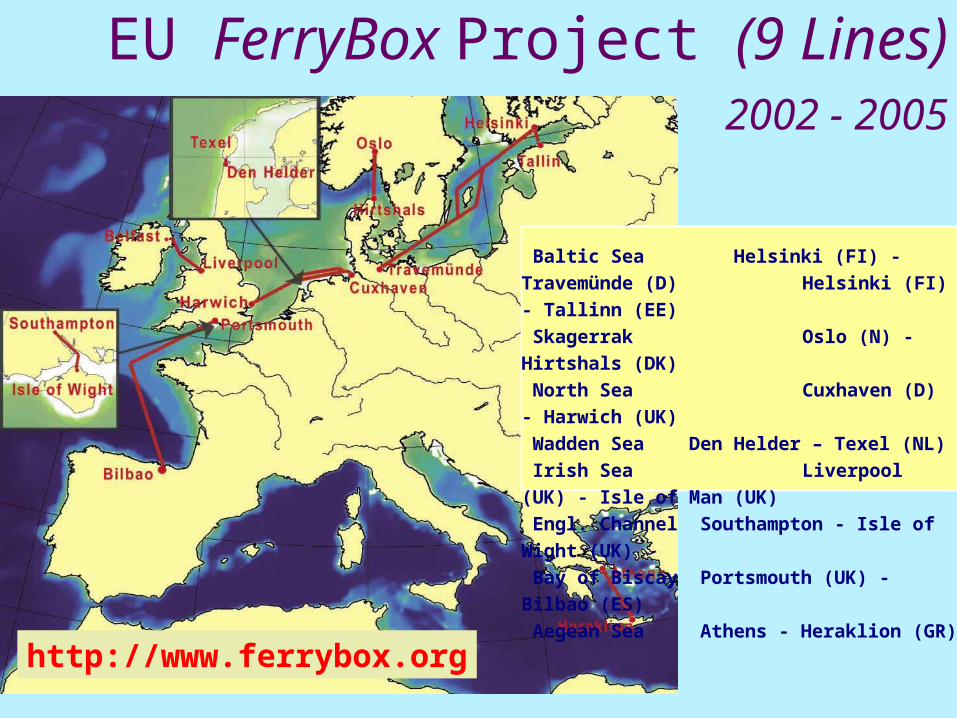
http://www.ferrybox.org
Baltic Sea Helsinki (FI) - Travemünde (D)
Helsinki (FI) - Tallinn (EE)
Skagerrak Oslo (N) - Hirtshals (DK)
North Sea Cuxhaven (D) - Harwich (UK)
Wadden Sea Den Helder – Texel (NL)
Irish Sea Liverpool (UK) - Isle of Man (UK)
Engl. Channel Southampton - Isle of Wight (UK)
Bay of Biscay Portsmouth (UK) - Bilbao (ES)
Aegean Sea Athens - Heraklion (GR)
EU FerryBox Project (9 Lines)2002 - 2005
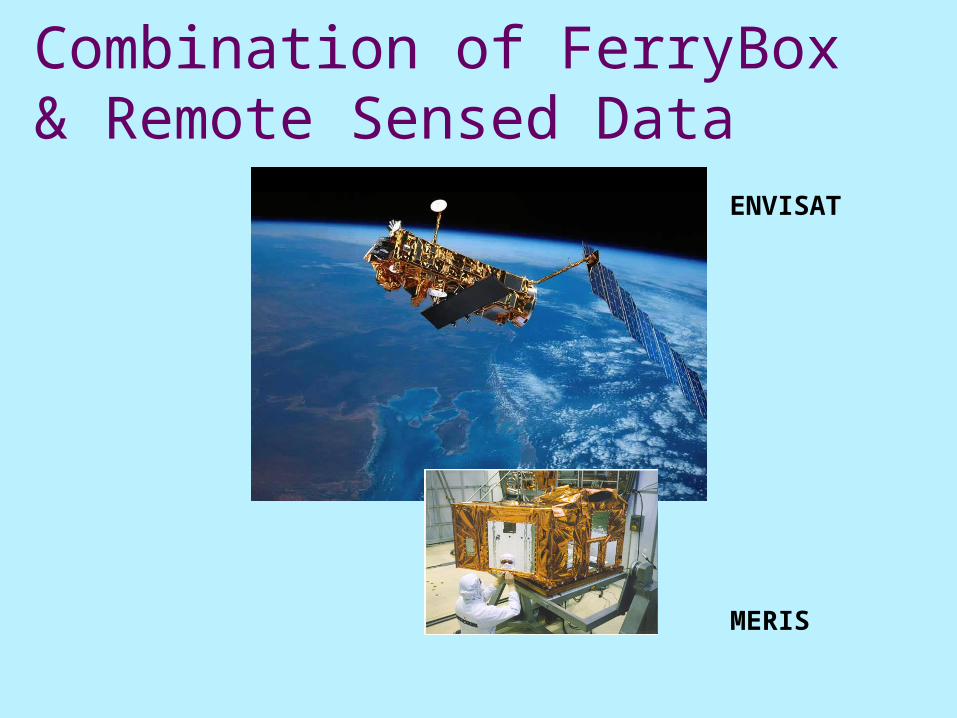
Combination of FerryBox & Remote Sensed Data
MERIS
ENVISAT
Assessing Eutrophicationvarious methods
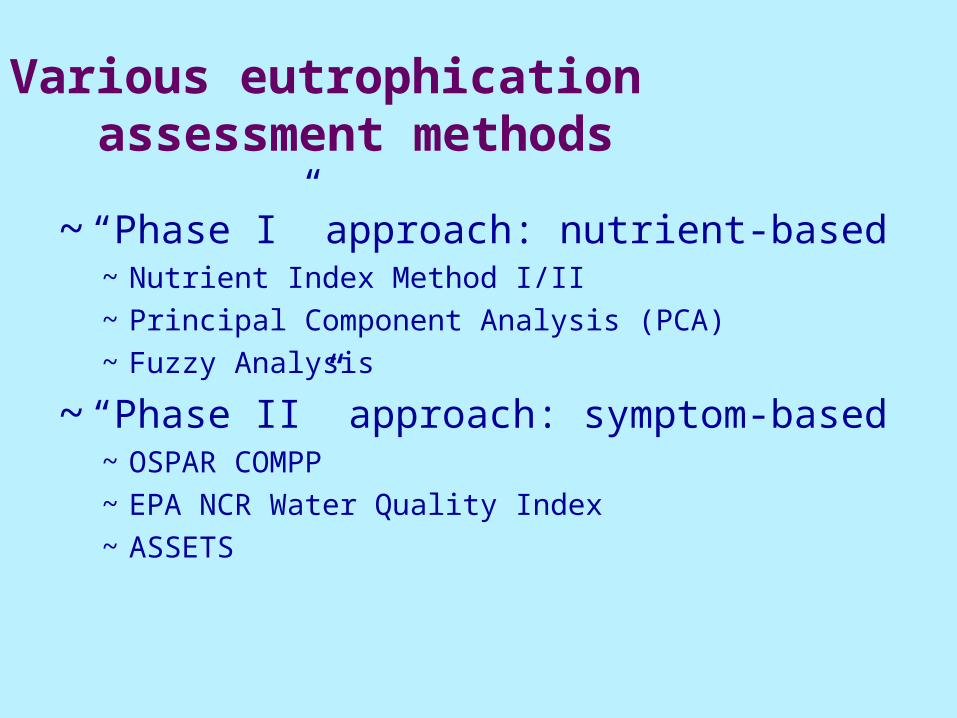
~ “Phase I” approach: nutrient-based ~ Nutrient Index Method I/II~ Principal Component Analysis (PCA)~ Fuzzy Analysis
~ “Phase II” approach: symptom-based~ OSPAR COMPP~ EPA NCR Water Quality Index~ ASSETS
Various eutrophication assessment methods
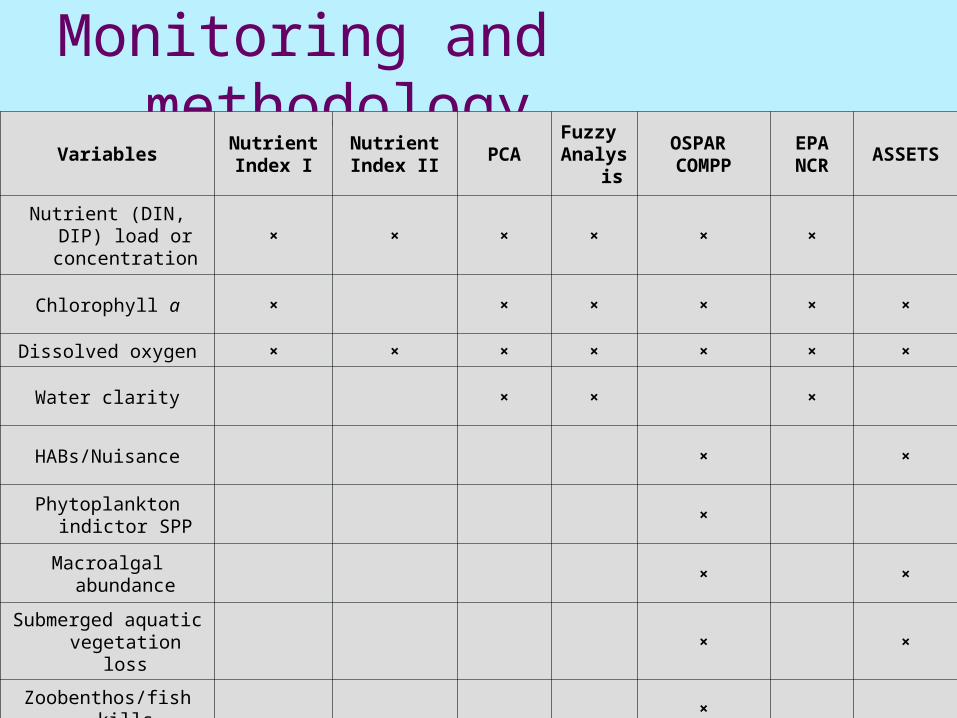
Monitoring and methodology
VariablesNutrientIndex I
NutrientIndex II
PCAFuzzy Analy
sis
OSPAR COMPP
EPANCR
ASSETS
Nutrient (DIN, DIP) load or
concentration× × × × × ×
Chlorophyll a × × × × × ×
Dissolved oxygen × × × × × × ×
Water clarity × × ×
HABs/Nuisance × ×
Phytoplankton indictor SPP
×
Macroalgal abundance
× ×
Submerged aquatic vegetation loss
× ×
Zoobenthos/fish kills ×
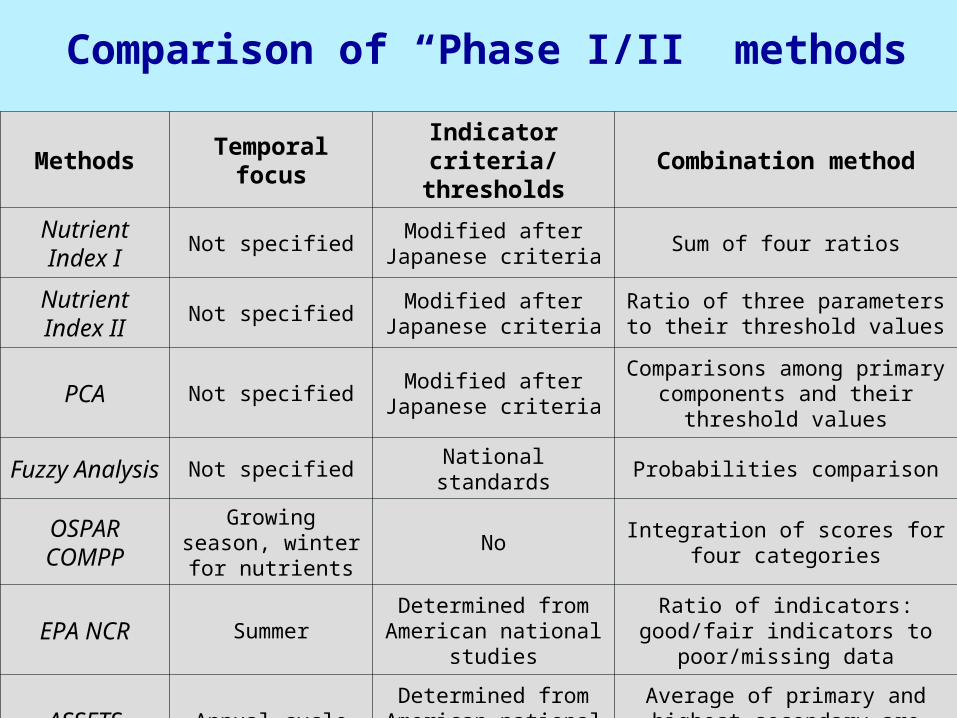
Comparison of “Phase I/II” methods
Methods Temporal focusIndicator criteria/
thresholdsCombination method
Nutrient Index I
Not specifiedModified after Japanese
criteriaSum of four ratios
Nutrient Index II
Not specifiedModified after Japanese
criteriaRatio of three parameters to their
threshold values
PCA Not specifiedModified after Japanese
criteria
Comparisons among primary components and their threshold
values
Fuzzy Analysis Not specified National standards Probabilities comparison
OSPAR COMPP
Growing season, winter for nutrients
NoIntegration of scores for four
categories
EPA NCR SummerDetermined from
American national studiesRatio of indicators: good/fair
indicators to poor/missing data
ASSETS Annual cycleDetermined from
American national studiesAverage of primary and highest
secondary are combined by matrix
Assessing Eutrophicationin Europe
Evaluation of Impact of EU Directives on nutrients
~ Assessment of Directive (UWWT) effect on P
~ Assessment of Directive (Nitrate Directive) effect on N
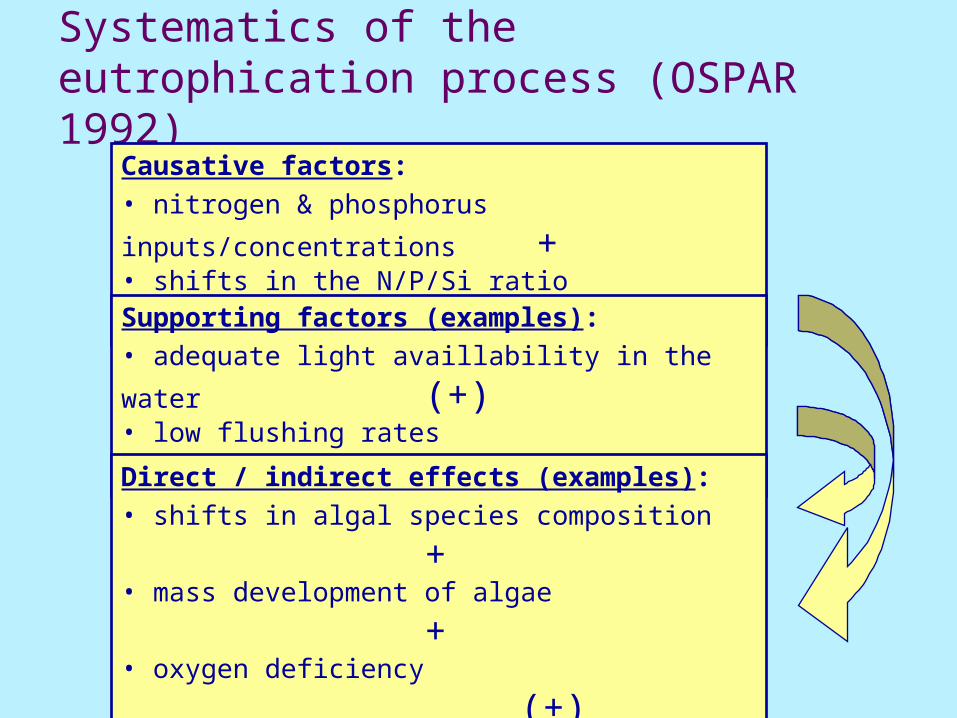
Systematics of the eutrophication process (OSPAR 1992)
Causative factors:
• nitrogen & phosphorus inputs/concentrations +• shifts in the N/P/Si ratio +
Supporting factors (examples):
• adequate light availlability in the water (+)• low flushing rates (+)
Direct / indirect effects (examples):
• shifts in algal species composition +• mass development of algae +• oxygen deficiency (+)• benthic mortality etc. (+)
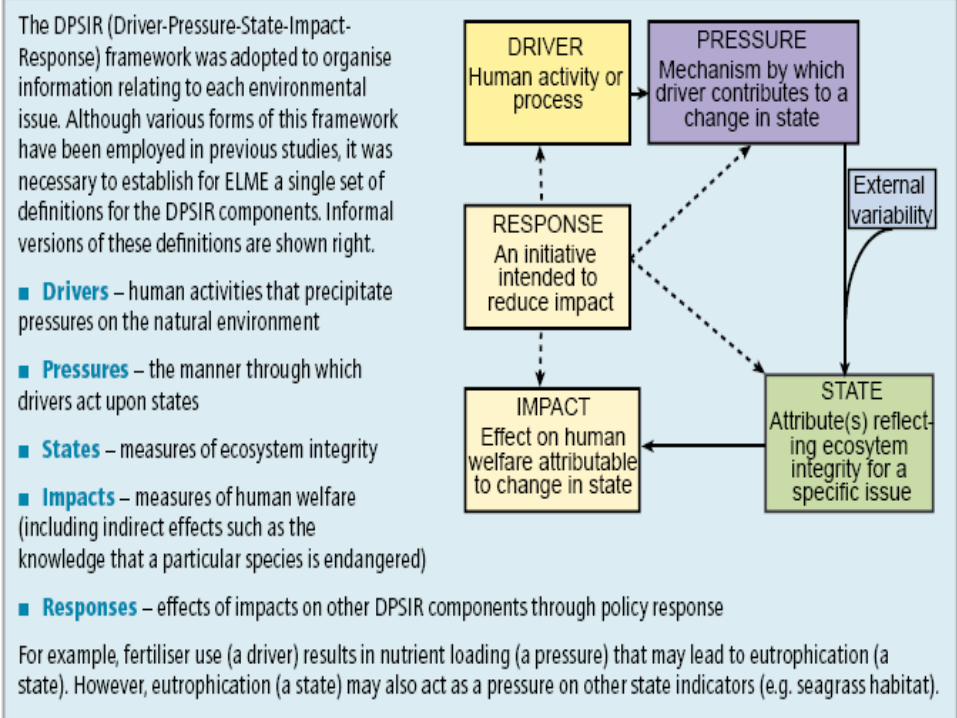
DPSIR framework for Assessment of Eutrophication
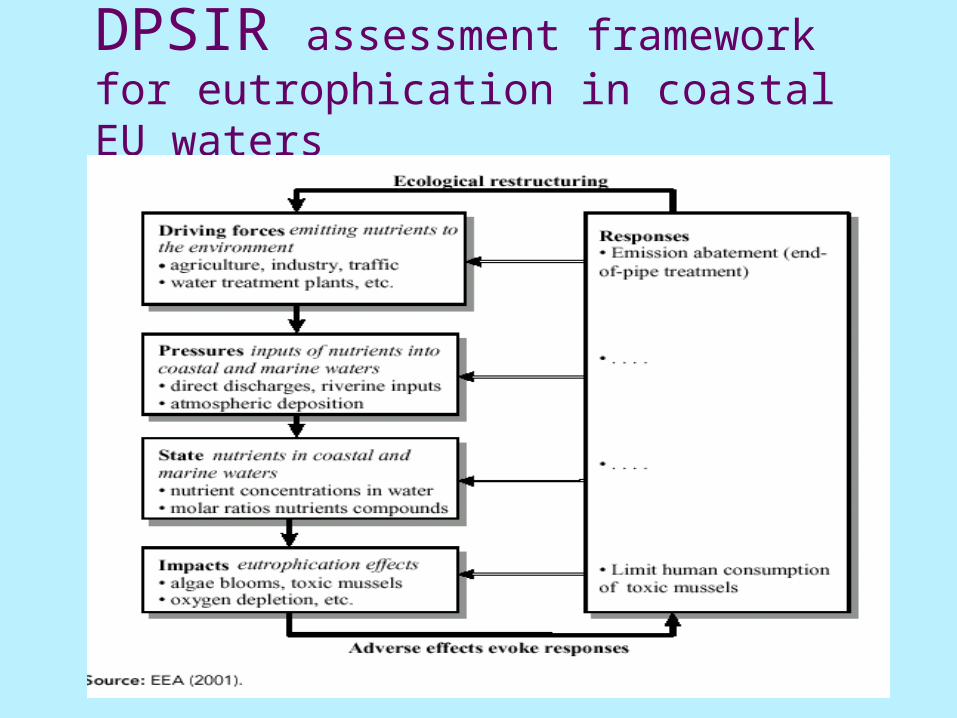
DPSIR assessment framework for eutrophication in coastal EU waters
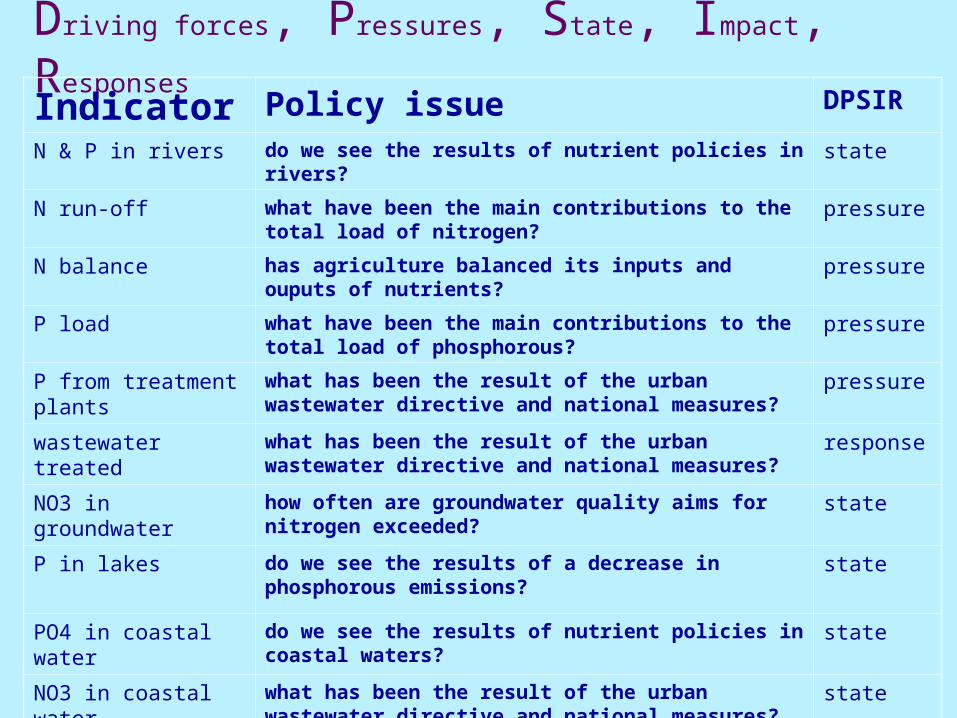
Driving forces, Pressures, State, Impact, Responses
Indicator Policy issue DPSIR
N & P in rivers do we see the results of nutrient policies in rivers?
state
N run-off what have been the main contributions to the total load of nitrogen?
pressure
N balance has agriculture balanced its inputs and ouputs of nutrients?
pressure
P load what have been the main contributions to the total load of phosphorous?
pressure
P from treatment plants
what has been the result of the urban wastewater directive and national measures?
pressure
wastewater treated what has been the result of the urban wastewater directive and national measures?
response
NO3 in groundwater
how often are groundwater quality aims for nitrogen exceeded?
state
P in lakes do we see the results of a decrease in phosphorous emissions?
state
PO4 in coastal water
do we see the results of nutrient policies in coastal waters?
state
NO3 in coastal water
what has been the result of the urban wastewater directive and national measures?
state
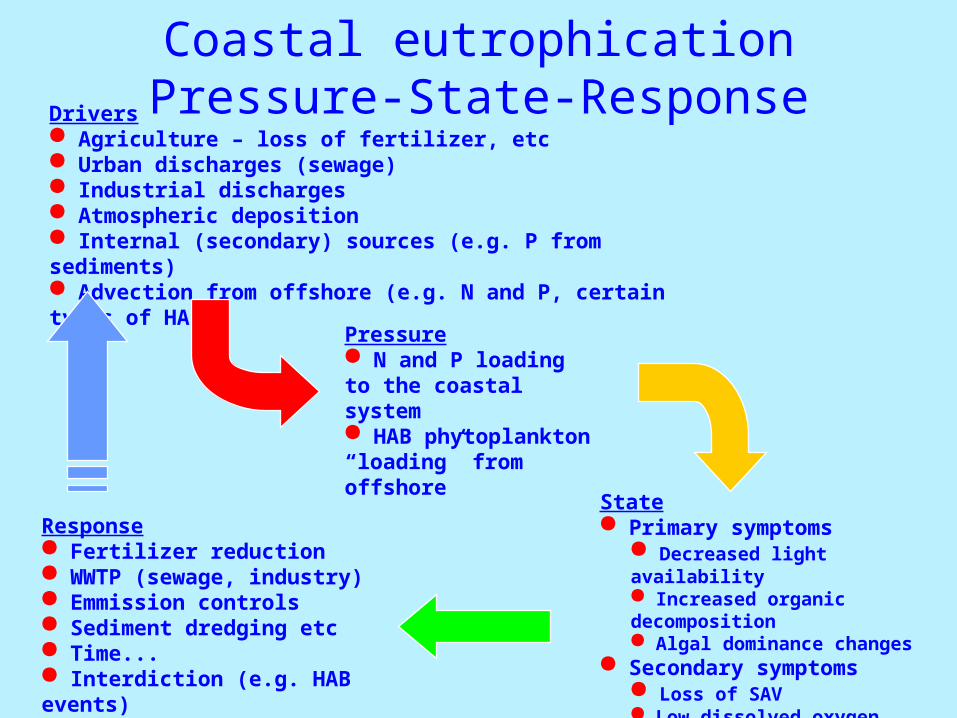
Coastal eutrophication
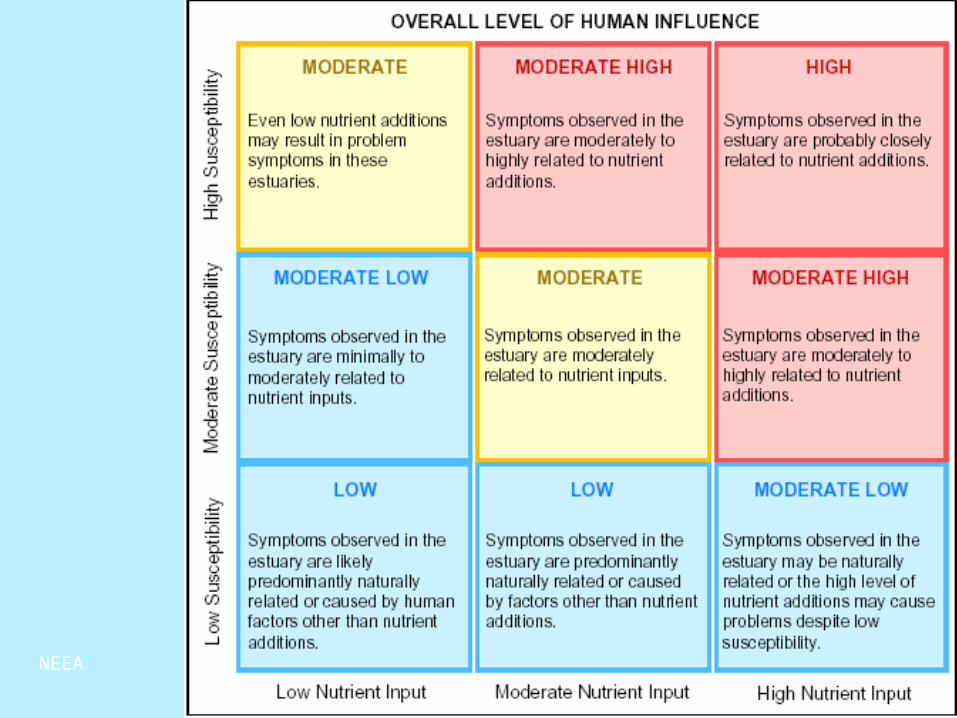
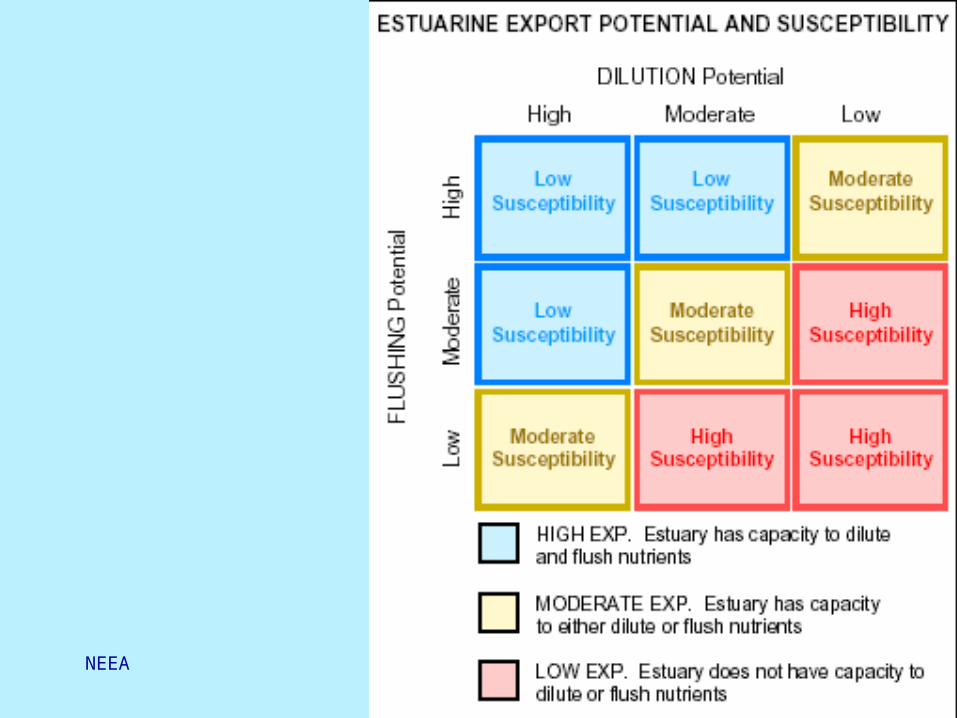
Pressure-State-ResponseDrivers Agriculture – loss of fertilizer, etc Urban discharges (sewage) Industrial discharges Atmospheric deposition Internal (secondary) sources (e.g. P from sediments) Advection from offshore (e.g. N and P, certain types of HAB)
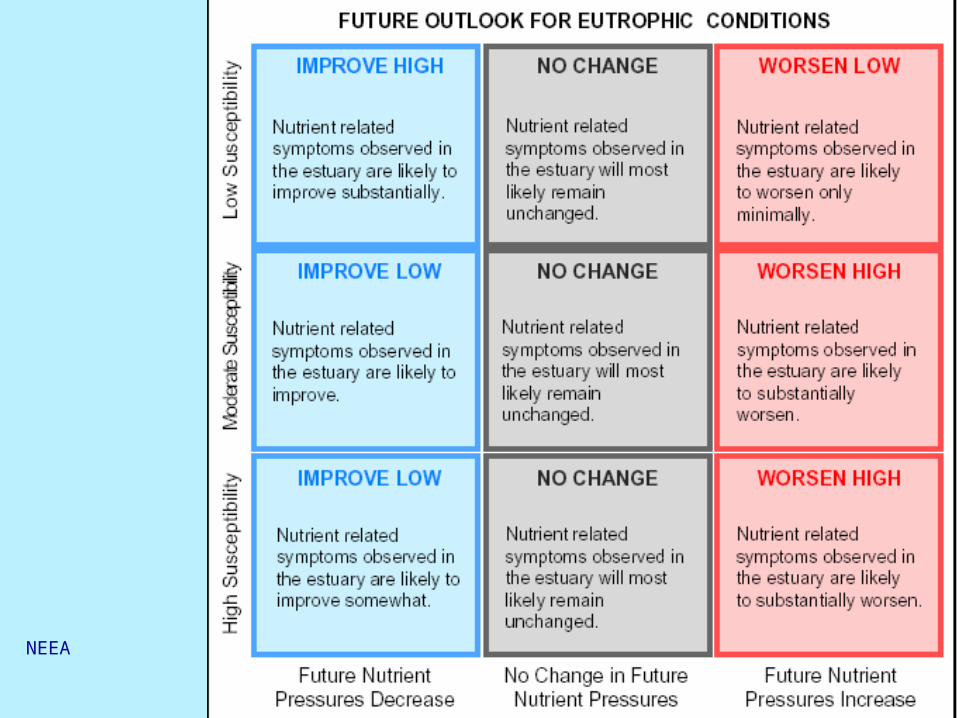
Response Fertilizer reduction WWTP (sewage, industry) Emmission controls Sediment dredging etc Time... Interdiction (e.g. HAB events)
Pressure N and P loading to the coastal system HAB phytoplankton “loading” from offshore
State Primary symptoms
Decreased light availability Increased organic decomposition Algal dominance changes
Secondary symptoms Loss of SAV Low dissolved oxygen Harmful algae
Scenarios and Indicators ELME Black Sea example
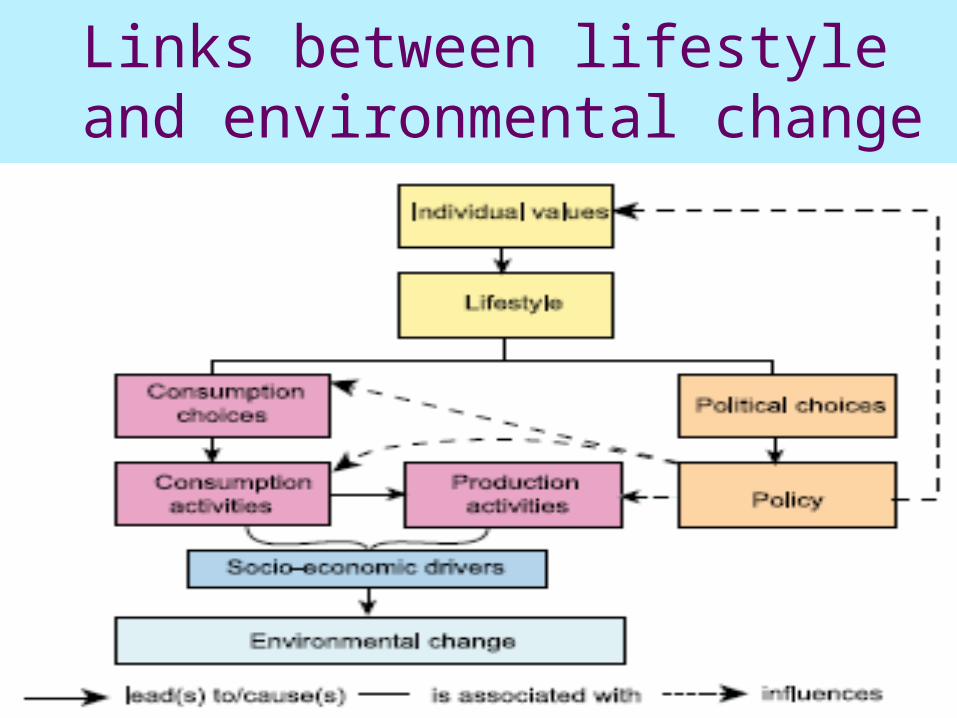
Links between lifestyle and environmental change
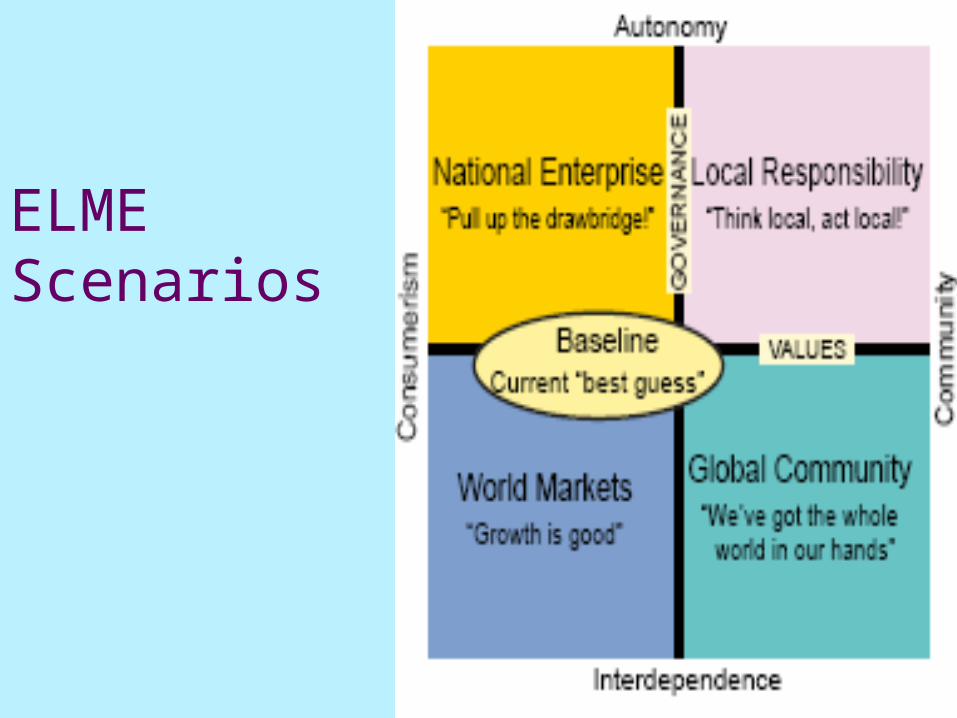
ELME Scenarios
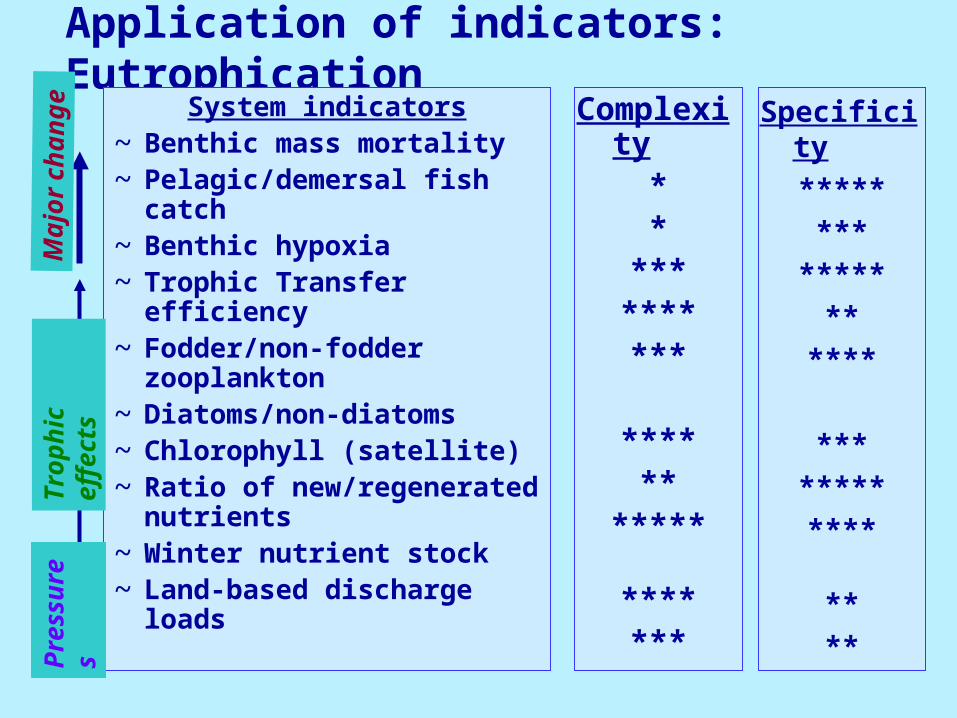
Application of indicators: Eutrophication
System indicators~ Benthic mass mortality~ Pelagic/demersal fish catch~ Benthic hypoxia~ Trophic Transfer efficiency~ Fodder/non-fodder
zooplankton~ Diatoms/non-diatoms~ Chlorophyll (satellite)~ Ratio of new/regenerated
nutrients~ Winter nutrient stock~ Land-based discharge loads
Complexity**
**********
******
*****
*******
Tro
phic
eff
ects
Pre
ssu
res
Maj
or c
han
ge Specificity
********
*******
****
************
****
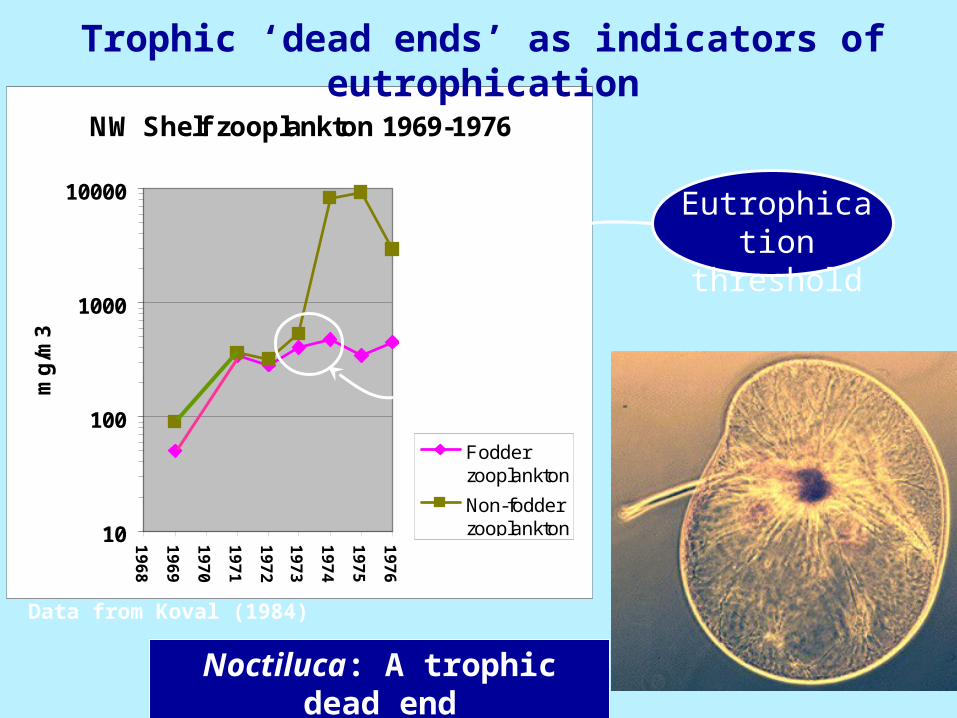
Noctiluca: A trophic dead end
NW Shelf zooplankton 1969-1976
10
100
1000
10000
19
68
19
69
19
70
19
71
19
72
19
73
19
74
19
75
19
76
mg
/m3
Fodderzooplankton
Non-fodderzooplankton
Eutrophication threshold
Data from Koval (1984)
Trophic ‘dead ends’ as indicators of eutrophication
NEEA-USA
Eutrophication Assessment
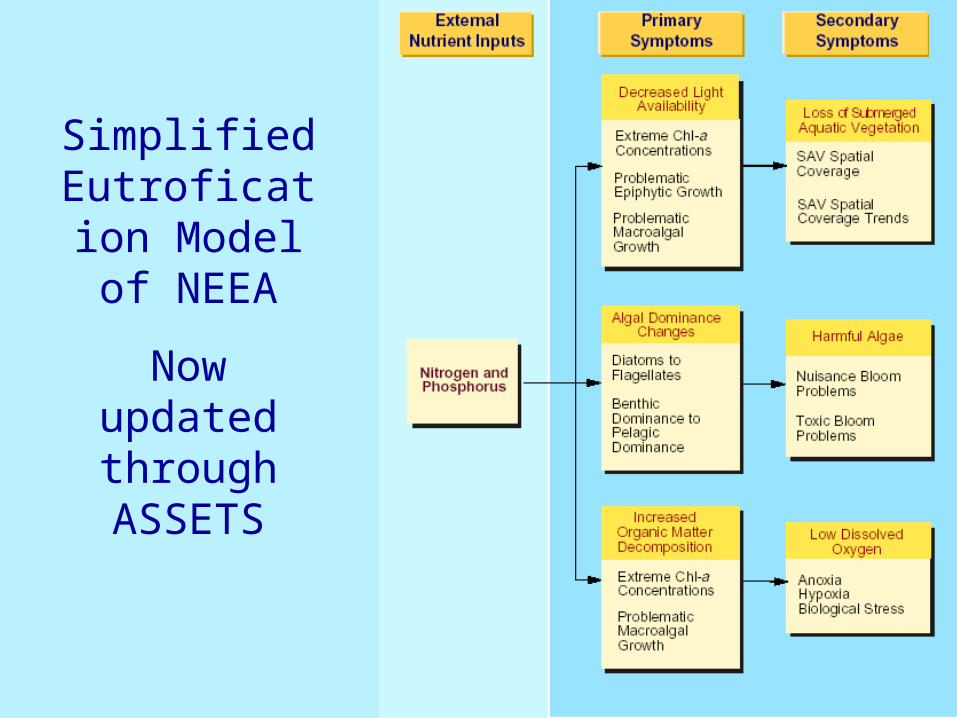
Simplified Eutrofication
Model of NEEA
Now updated through ASSETS
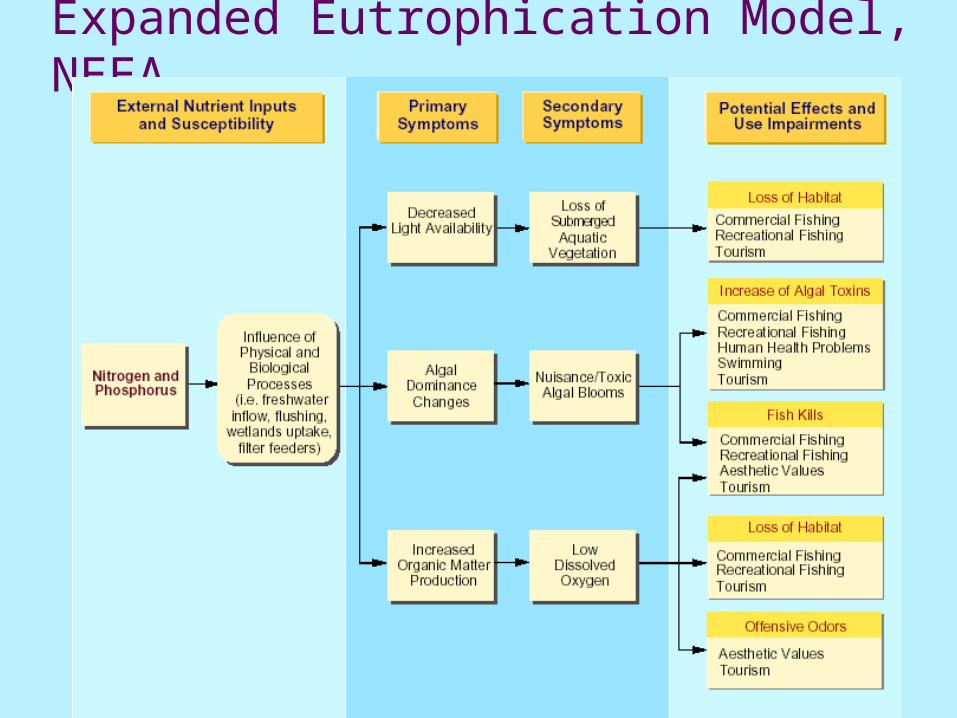
Expanded Eutrophication Model, NEEA
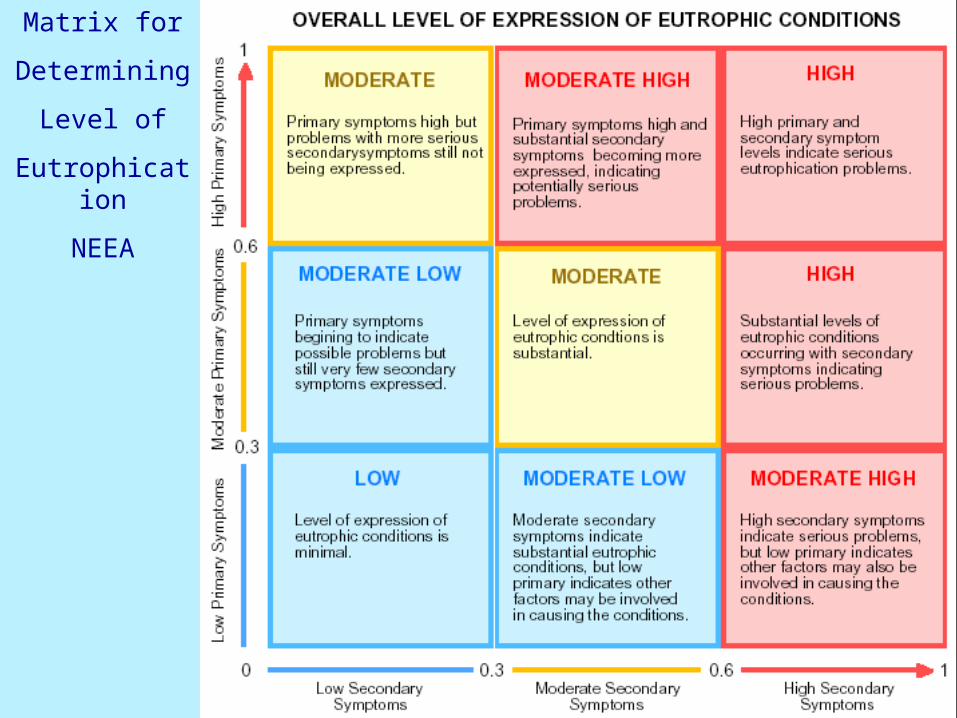
Matrix for
Determining
Level of
Eutrophication
NEEA
NEEA
NEEA
NEEA
International Assessment of Eutrophication
ASSETShttp://www.eutro.org
Slides from Joao Gomes Ferreira
LOICZ tool for assessment of eutrophication
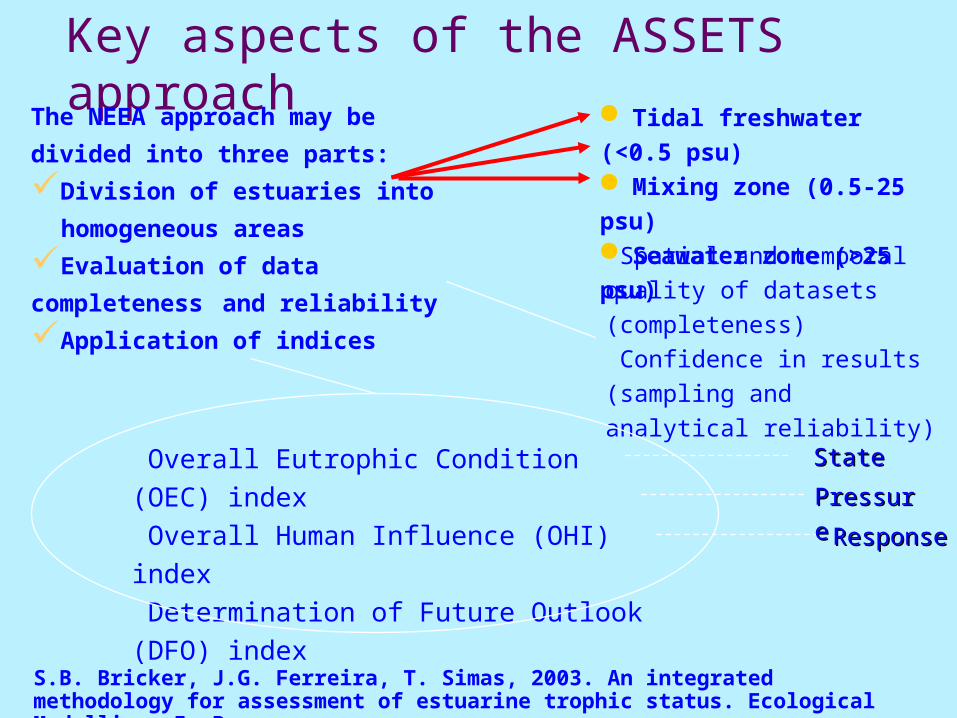
Key aspects of the ASSETS approach
The NEEA approach may be divided
into three parts:
Division of estuaries into
homogeneous areas
Evaluation of data completeness
and reliability
Application of indices
Tidal freshwater (<0.5 psu) Mixing zone (0.5-25 psu) Seawater zone (>25 psu)
Spatial and temporal quality of datasets (completeness) Confidence in results (sampling and analytical reliability)
Overall Eutrophic Condition (OEC) index
Overall Human Influence (OHI) index
Determination of Future Outlook (DFO)
index
PressurPressur
ee
StateState
ResponseResponse
S.B. Bricker, J.G. Ferreira, T. Simas, 2003. An integrated methodology for assessment of estuarine trophic status. Ecological Modelling, In Press.
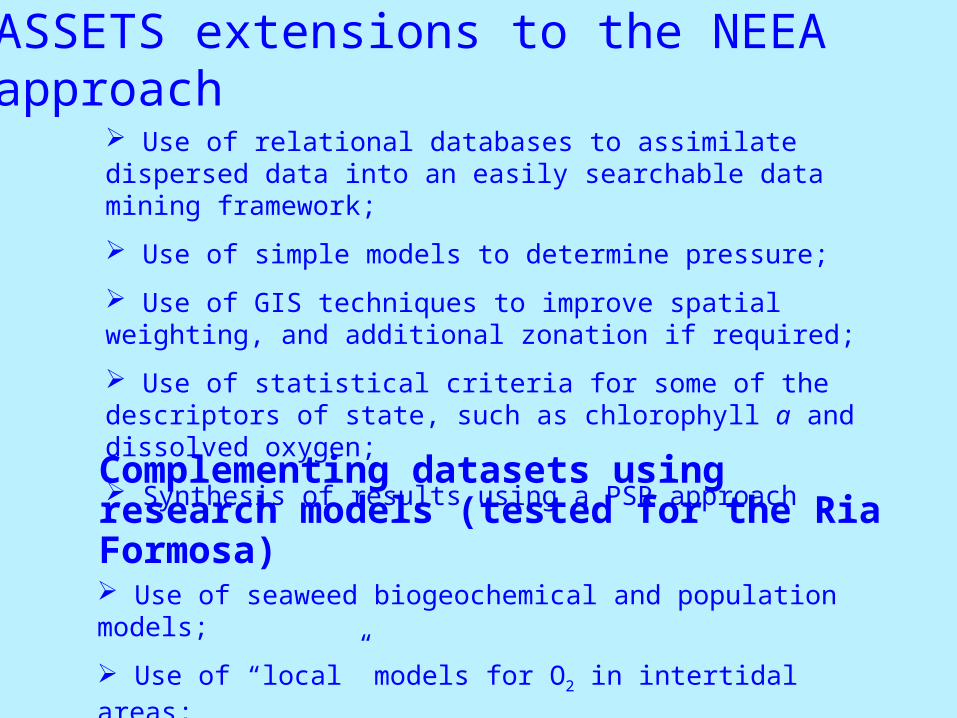
ASSETS extensions to the NEEA approach
Complementing datasets using research models (tested for the Ria Formosa)
Use of seaweed biogeochemical and population models;
Use of “local” models for O2 in intertidal areas;
Use of relational databases to assimilate dispersed data into an easily searchable data mining framework;
Use of simple models to determine pressure;
Use of GIS techniques to improve spatial weighting, and additional zonation if required;
Use of statistical criteria for some of the descriptors of state, such as chlorophyll a and dissolved oxygen;
Synthesis of results using a PSR approach
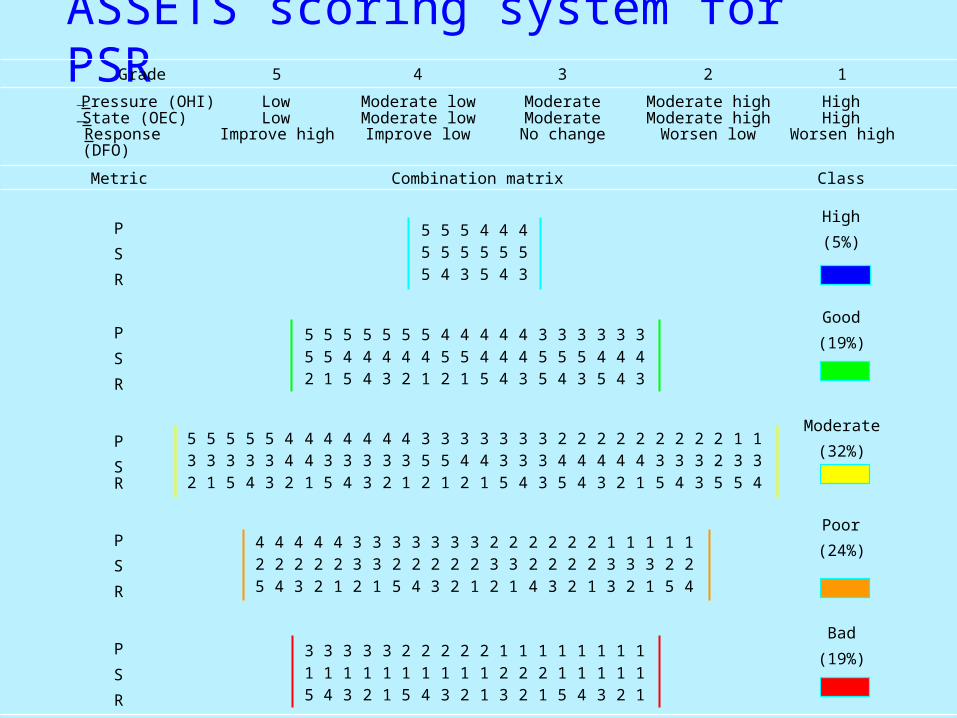
ASSETS scoring system for PSRGrade 5 4 3 2 1
Pressure (OHI) Low Moderate low Moderate Moderate high High State (OEC) Low Moderate low Moderate Moderate high High Response
(DFO) Improve high Improve low No change Worsen low Worsen high
Metric Combination matrix Class
P
S
R
5 5 5 4 4 45 5 5 5 5 55 4 3 5 4 3
High
(5%)
P
S
R
5 5 5 5 5 5 5 4 4 4 4 4 3 3 3 3 3 3
5 5 4 4 4 4 4 5 5 4 4 4 5 5 5 4 4 42 1 5 4 3 2 1 2 1 5 4 3 5 4 3 5 4 3
Good
(19%)
P
S R
5 5 5 5 5 4 4 4 4 4 4 4 3 3 3 3 3 3 3 2 2 2 2 2 2 2 2 2 1 13 3 3 3 3 4 4 3 3 3 3 3 5 5 4 4 3 3 3 4 4 4 4 4 3 3 3 2 3 32 1 5 4 3 2 1 5 4 3 2 1 2 1 2 1 5 4 3 5 4 3 2 1 5 4 3 5 5 4
Moderate
(32%)
P
S
R
4 4 4 4 4 3 3 3 3 3 3 3 2 2 2 2 2 2 1 1 1 1 12 2 2 2 2 3 3 2 2 2 2 2 3 3 2 2 2 2 3 3 3 2 2
5 4 3 2 1 2 1 5 4 3 2 1 2 1 4 3 2 1 3 2 1 5 4
Poor
(24%)
P
S
R
3 3 3 3 3 2 2 2 2 2 1 1 1 1 1 1 1 1
1 1 1 1 1 1 1 1 1 1 2 2 2 1 1 1 1 15 4 3 2 1 5 4 3 2 1 3 2 1 5 4 3 2 1
Bad
(19%)
Mitigation and Remediation of Eutrophication
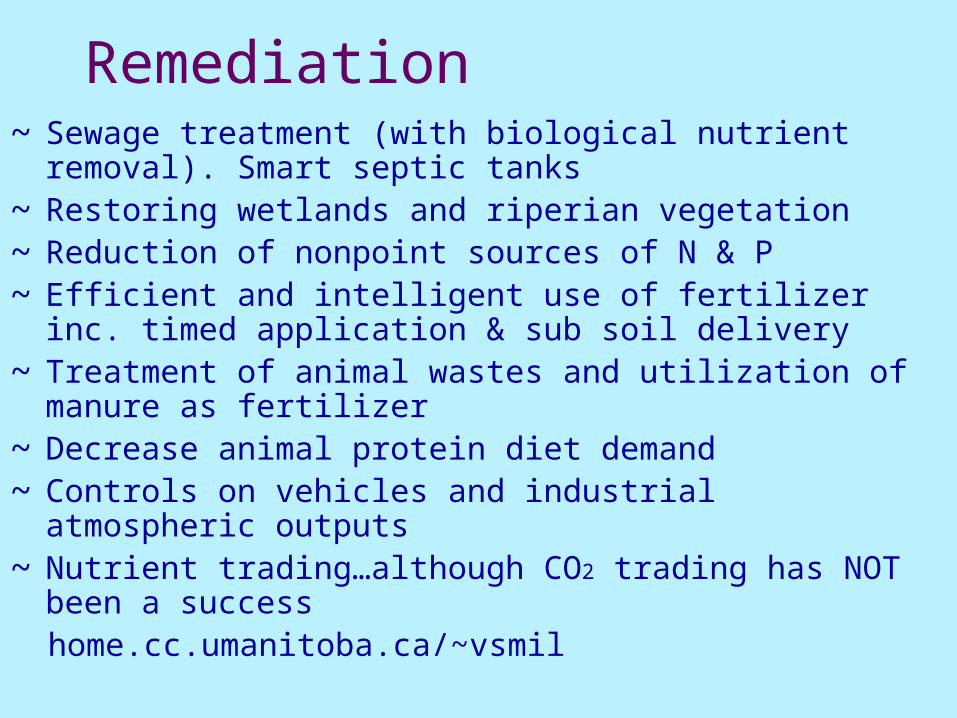
Remediation~ Sewage treatment (with biological nutrient removal).
Smart septic tanks~ Restoring wetlands and riperian vegetation~ Reduction of nonpoint sources of N & P~ Efficient and intelligent use of fertilizer inc. timed
application & sub soil delivery~ Treatment of animal wastes and utilization of manure
as fertilizer~ Decrease animal protein diet demand~ Controls on vehicles and industrial atmospheric
outputs~ Nutrient trading…although CO2 trading has NOT been
a success home.cc.umanitoba.ca/~vsmil
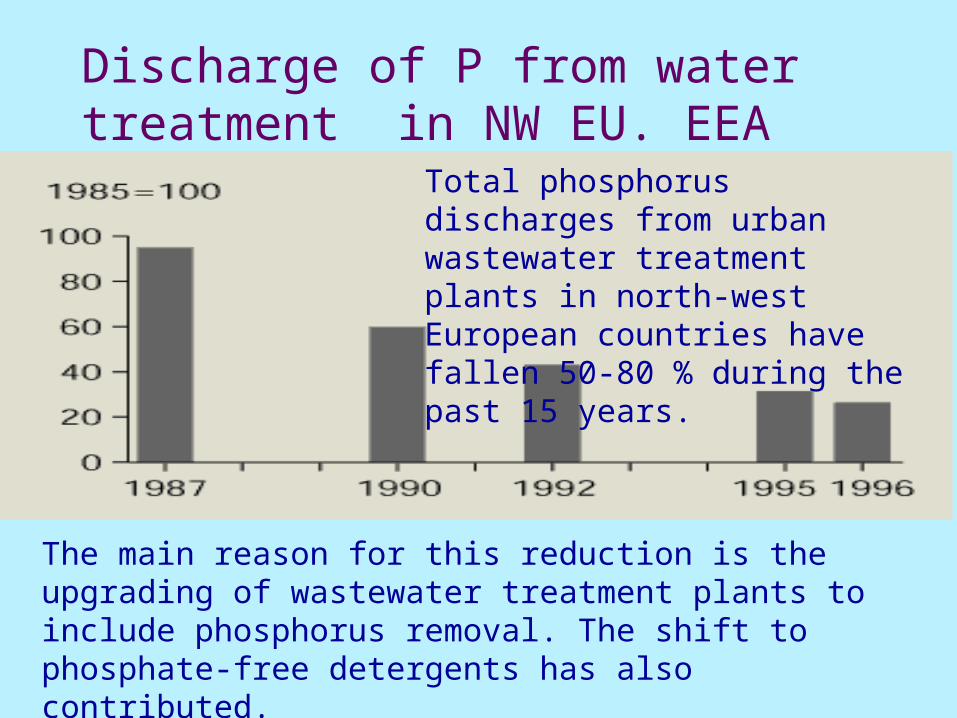
Discharge of P from water treatment in NW EU. EEA
Total phosphorus discharges from urban wastewater treatment plants in north-west European countries have fallen 50-80 % during the past 15 years.
The main reason for this reduction is the upgrading of wastewater treatment plants to include phosphorus removal. The shift to phosphate-free detergents has also contributed.
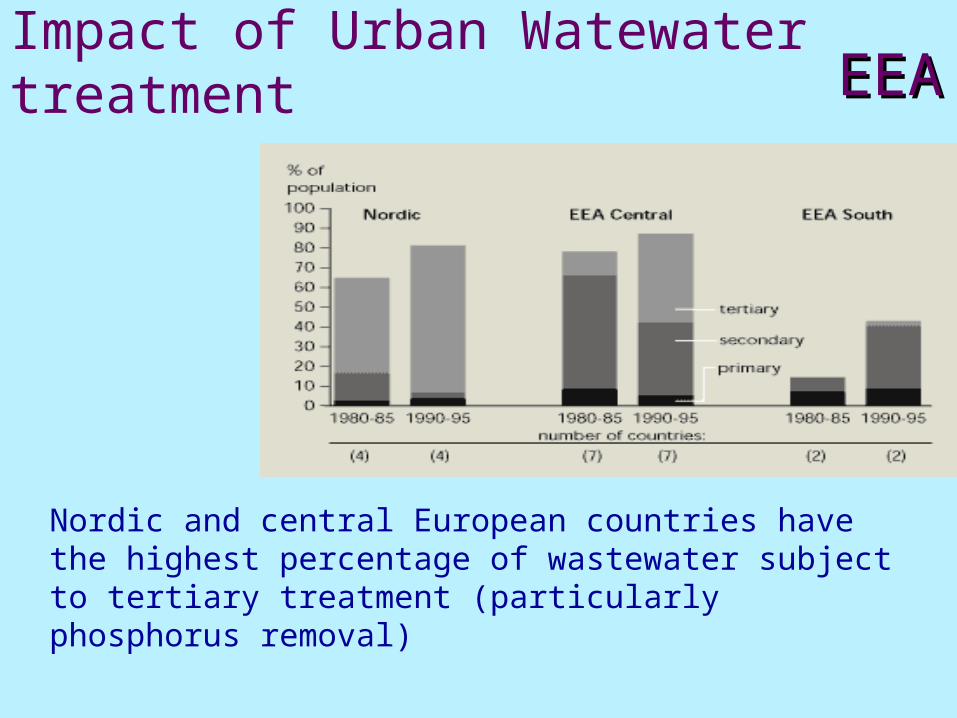
Impact of Urban Watewater treatment
Nordic and central European countries have the highest percentage of wastewater subject to tertiary treatment (particularly phosphorus removal)
EEAEEA