Embed Size (px)
Citation preview
Eutrophication Assessment in Coastal WatersEutrophication Assessment in Coastal WatersA Decade of ChangeA Decade of Change
New Jersey Water Quality Monitoring Council Meeting September 6, 2007
NJDEP HQ – Public Hearing Room, Trenton, NJ
S.B. BrickerNational Oceanic and Atmospheric Administration
Silver Spring, MD, USA
http://www.eutro.orghttp://www.eutro.us
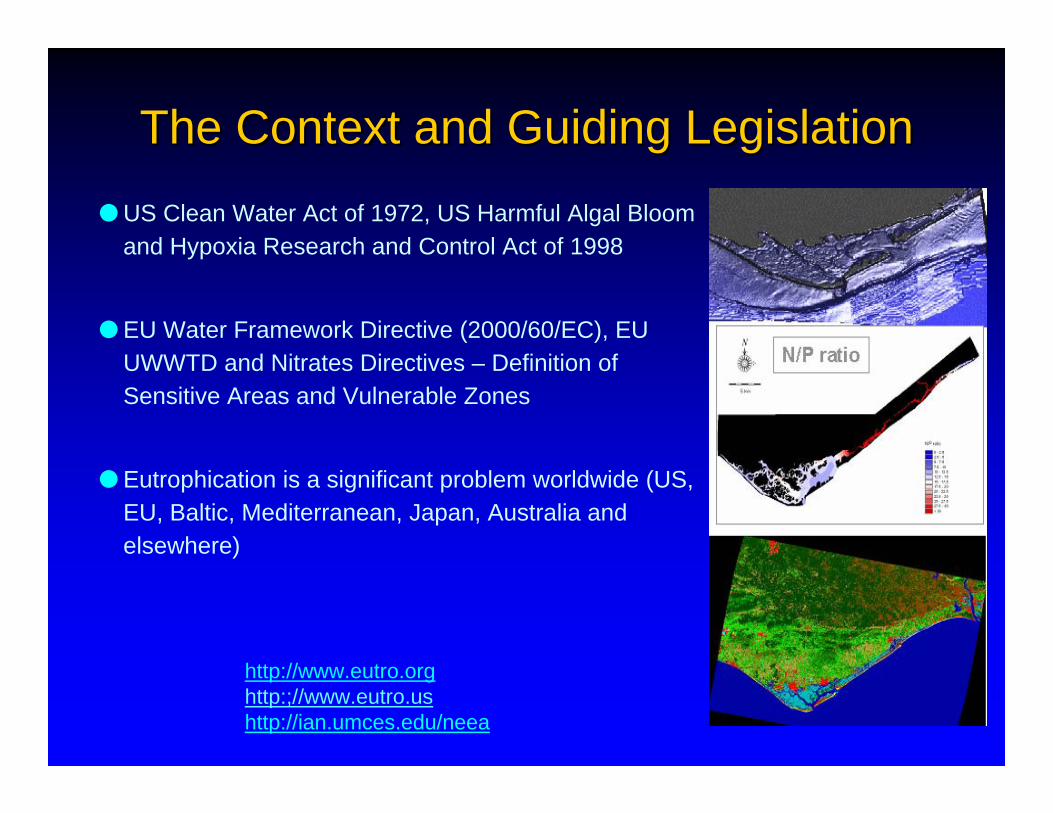
The Context and Guiding LegislationThe Context and Guiding LegislationUS Clean Water Act of 1972, US Harmful Algal Bloom and Hypoxia Research and Control Act of 1998
EU Water Framework Directive (2000/60/EC), EU UWWTD and Nitrates Directives – Definition of Sensitive Areas and Vulnerable Zones
Eutrophication is a significant problem worldwide (US, EU, Baltic, Mediterranean, Japan, Australia and elsewhere)
http://www.eutro.orghttp:;//www.eutro.ushttp://ian.umces.edu/neea
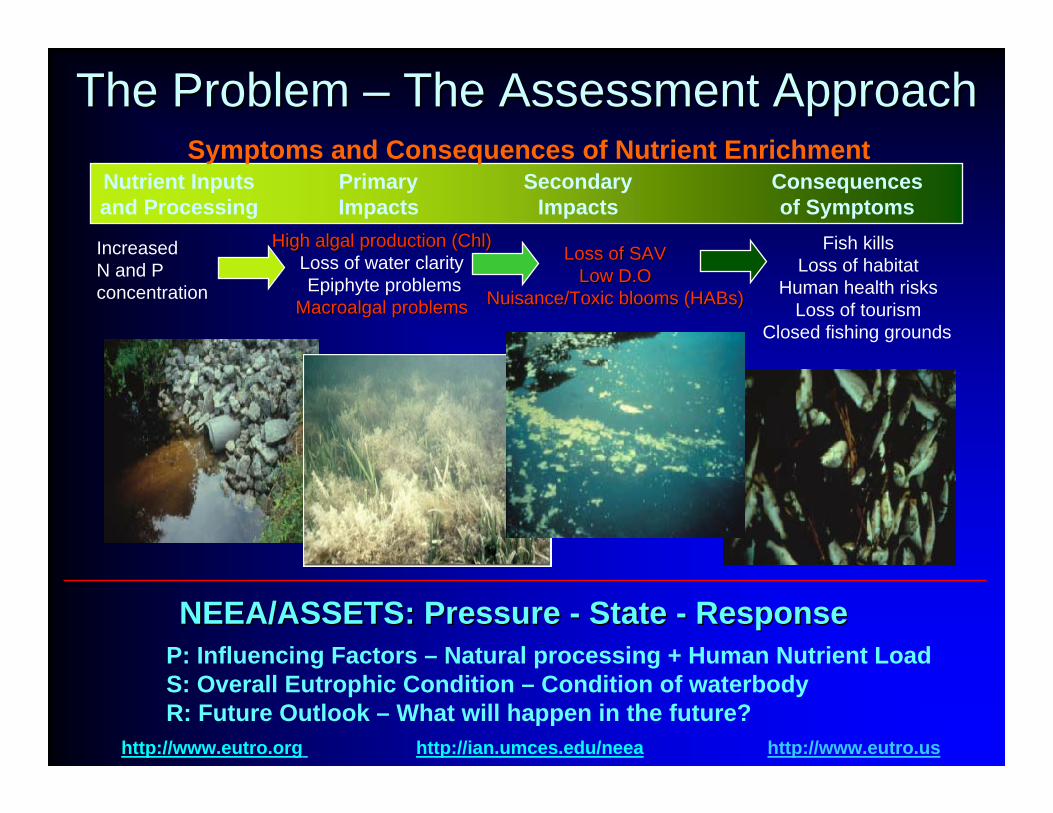
The Problem The Problem –– The Assessment ApproachThe Assessment Approach
High algal production (High algal production (ChlChl))Loss of water clarityEpiphyte problems
MacroalgalMacroalgal problemsproblems
Fish kills Loss of habitat
Human health risksLoss of tourism
Closed fishing grounds
Loss of SAVLoss of SAVLow D.OLow D.O
Nuisance/Toxic blooms (Nuisance/Toxic blooms (HABsHABs))
IncreasedN and P concentration
Symptoms and Consequences of Nutrient EnrichmentNutrient Inputs Primary Secondary Consequences and Processing Impacts Impacts of Symptoms
P: Influencing Factors – Natural processing + Human Nutrient LoadS: Overall Eutrophic Condition – Condition of waterbodyR: Future Outlook – What will happen in the future?
NEEA/ASSETS: Pressure NEEA/ASSETS: Pressure -- State State -- ResponseResponse
http://www.eutro.org http://ian.umces.edu/neea http://www.eutro.us
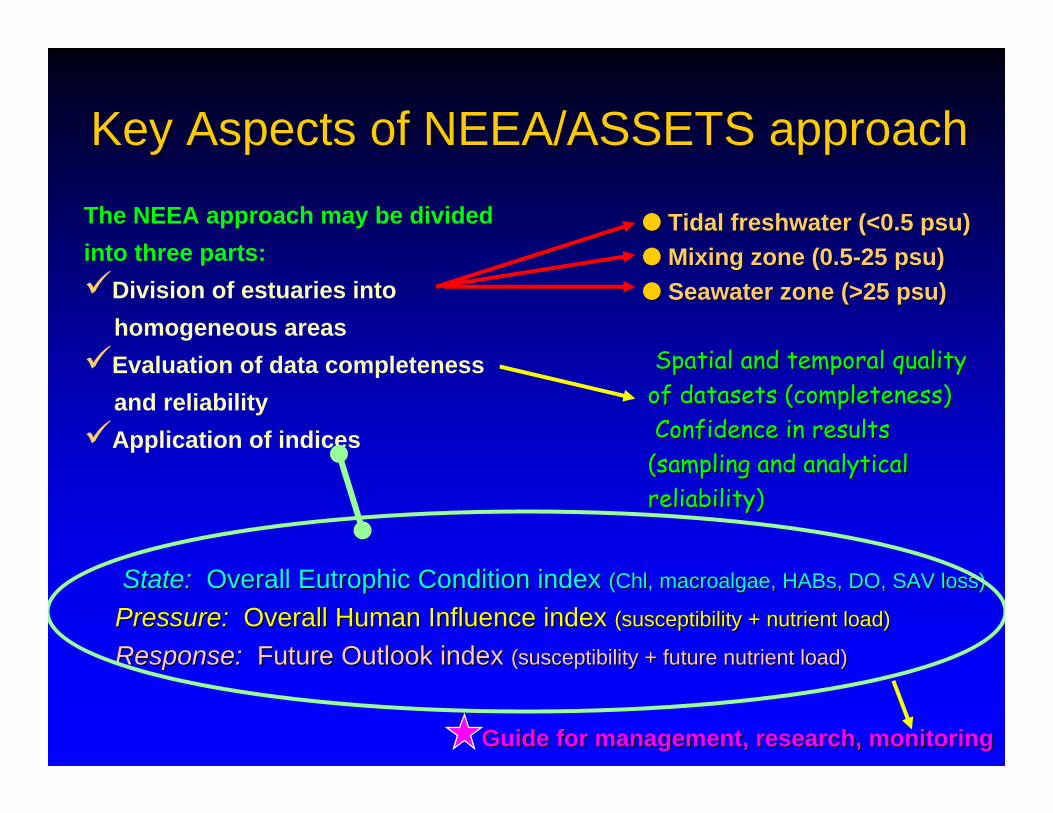
Key Aspects of NEEA/ASSETS approachKey Aspects of NEEA/ASSETS approachThe NEEA approach may be divided into three parts:
Division of estuaries into homogeneous areasEvaluation of data completeness and reliabilityApplication of indices
Tidal freshwater (<0.5 Tidal freshwater (<0.5 psupsu) ) Mixing zone (0.5Mixing zone (0.5--25 25 psupsu))Seawater zone (>25 Seawater zone (>25 psupsu))
Spatial and temporal quality Spatial and temporal quality of datasets (completeness) of datasets (completeness) Confidence in results Confidence in results
(sampling and analytical (sampling and analytical reliability)reliability)
State:State: Overall Eutrophic Condition index Overall Eutrophic Condition index ((ChlChl, , macroalgaemacroalgae, , HABsHABs, DO, SAV loss), DO, SAV loss)
Pressure:Pressure: Overall Human Influence index Overall Human Influence index (susceptibility + nutrient load)(susceptibility + nutrient load)
Response:Response: Future Outlook index Future Outlook index (susceptibility + future nutrient load)(susceptibility + future nutrient load)
Guide for management, research, monitoringGuide for management, research, monitoring
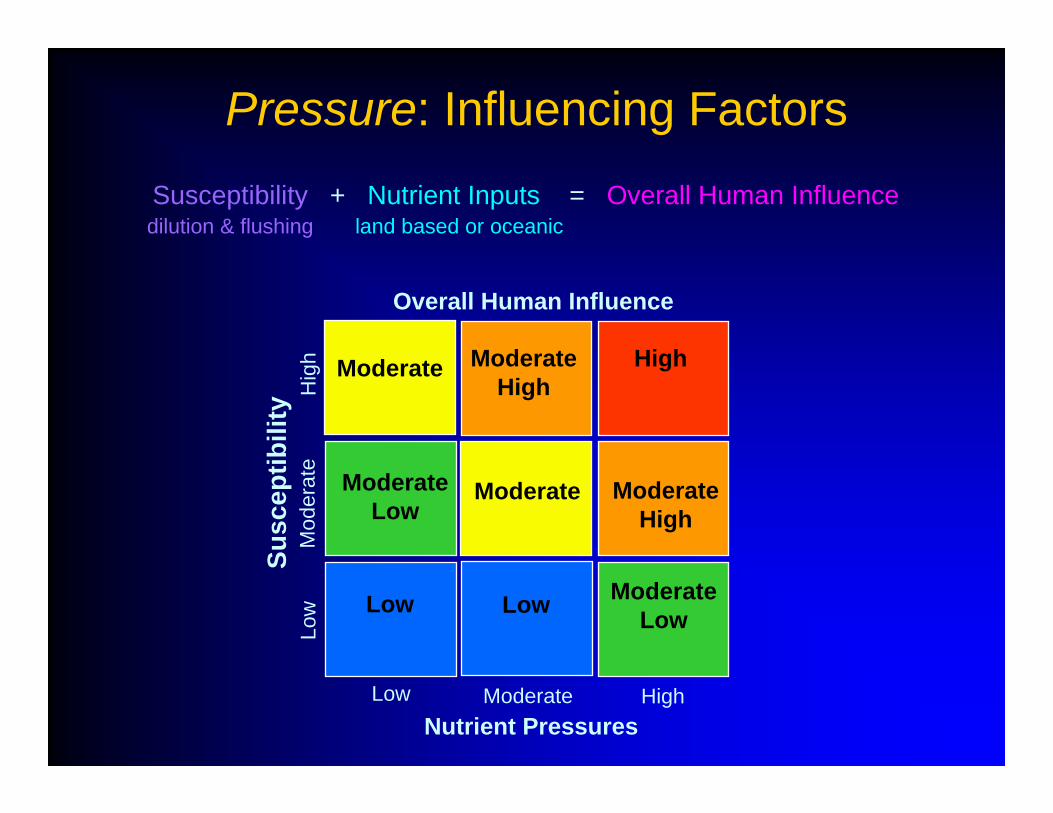
Pressure: Influencing Factors
Moderate
Moderate Low
Low
Moderate High
Moderate
Low
High
Moderate High
Moderate Low
Overall Human Influence
Nutrient PressuresLow Moderate High
Low
Mod
erat
eH
igh
Susc
eptib
ility
Susceptibility + Nutrient Inputs = Overall Human Influencedilution & flushing land based or oceanic
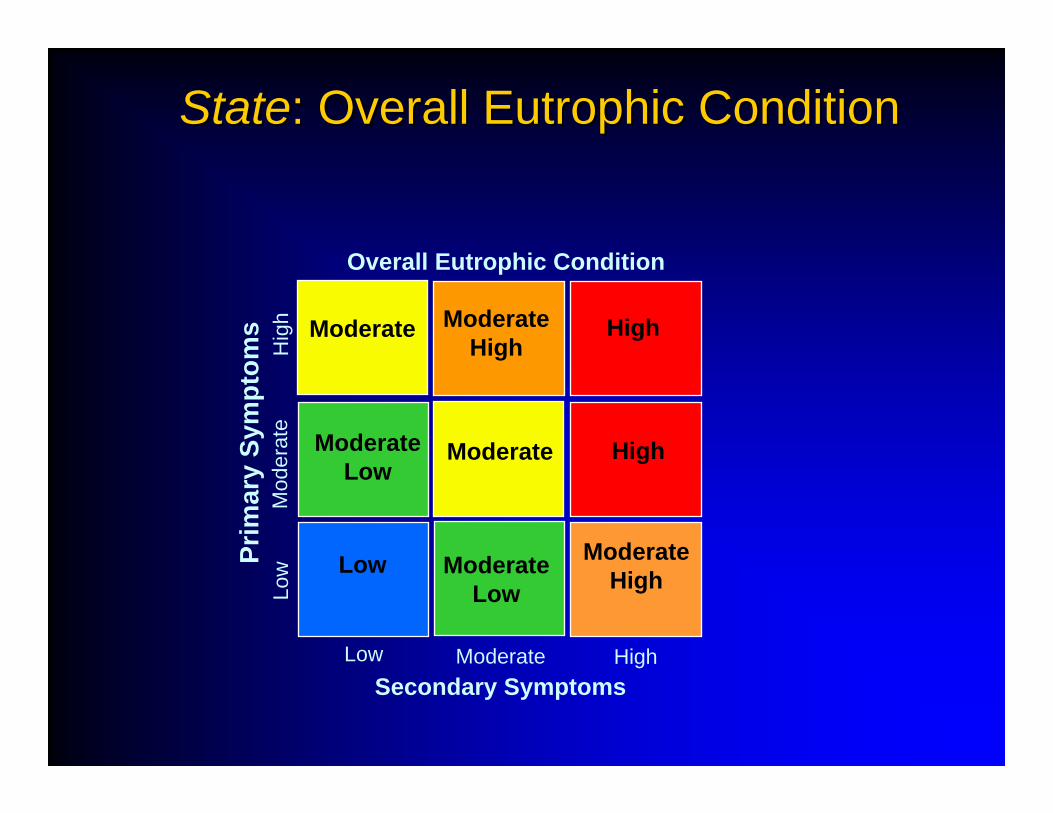
StateState: Overall Eutrophic Condition: Overall Eutrophic Condition
Moderate
Moderate Low
Low
Moderate High
Moderate
Moderate Low
High
High
Moderate High
Overall Eutrophic Condition
Secondary Symptoms Low Moderate High
Low
Mod
erat
eH
igh
Prim
ary
Sym
ptom
s
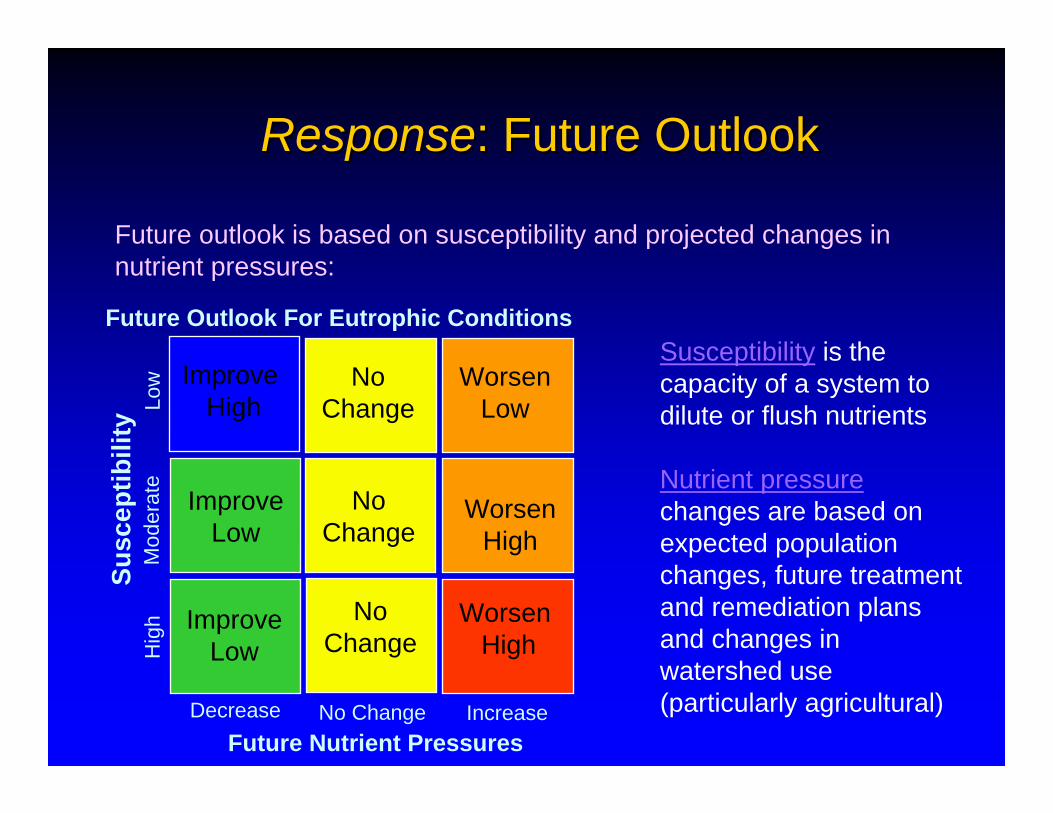
ResponseResponse: Future Outlook: Future Outlook
Future outlook is based on susceptibility and projected changes in nutrient pressures:
Susceptibility is the capacity of a system to dilute or flush nutrients
Nutrient pressurechanges are based on expected population changes, future treatment and remediation plans and changes in watershed use (particularly agricultural)
Improve High
Improve Low
ImproveLow
No Change
No Change
No Change
WorsenLow
WorsenHigh
WorsenHigh
Future Outlook For Eutrophic Conditions
Future Nutrient PressuresDecrease No Change Increase
Hig
hM
oder
ate
Low
Susc
eptib
ility
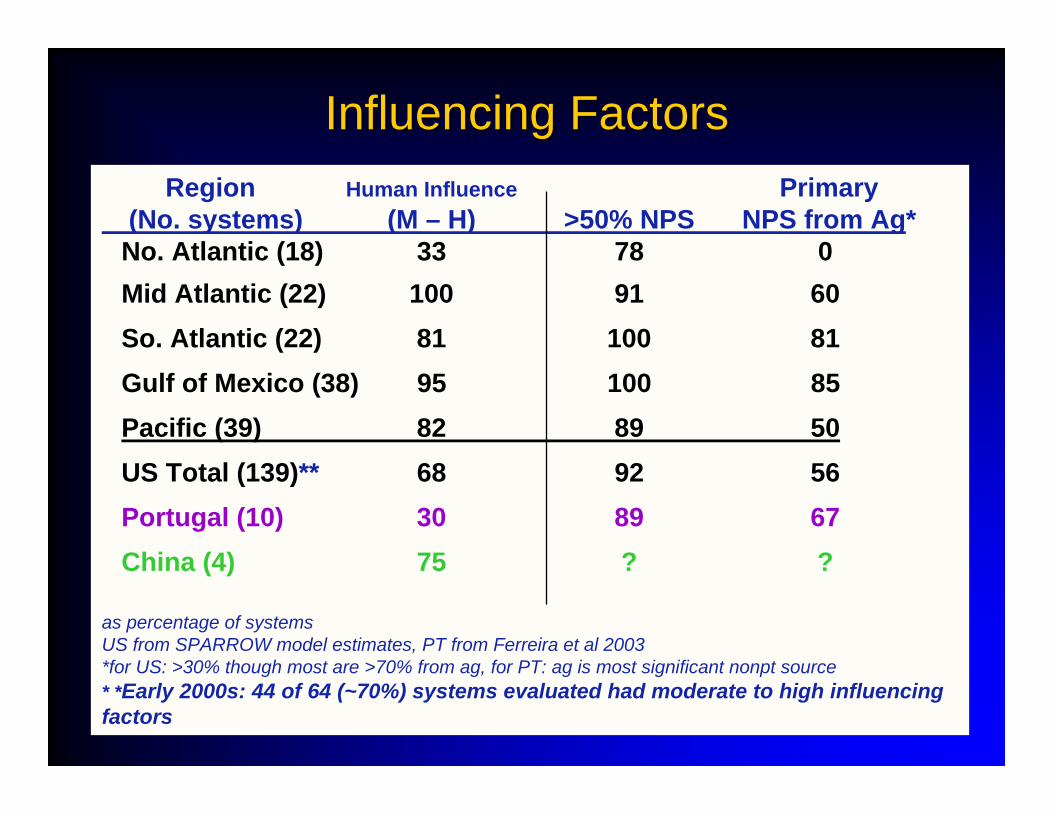
Region Human Influence Primary(No. systems) (M – H) >50% NPS NPS from Ag*No. Atlantic (18) 33 78 0Mid Atlantic (22) 100 91 60So. Atlantic (22) 81 100 81Gulf of Mexico (38) 95 100 85Pacific (39) 82 89 50US Total (139)** 68 92 56Portugal (10) 30 89 67China (4) 75 ? ?
as percentage of systemsUS from SPARROW model estimates, PT from Ferreira et al 2003*for US: >30% though most are >70% from ag, for PT: ag is most significant nonpt source* *Early 2000s: 44 of 64 (~70%) systems evaluated had moderate to high influencing factors
Influencing FactorsInfluencing Factors
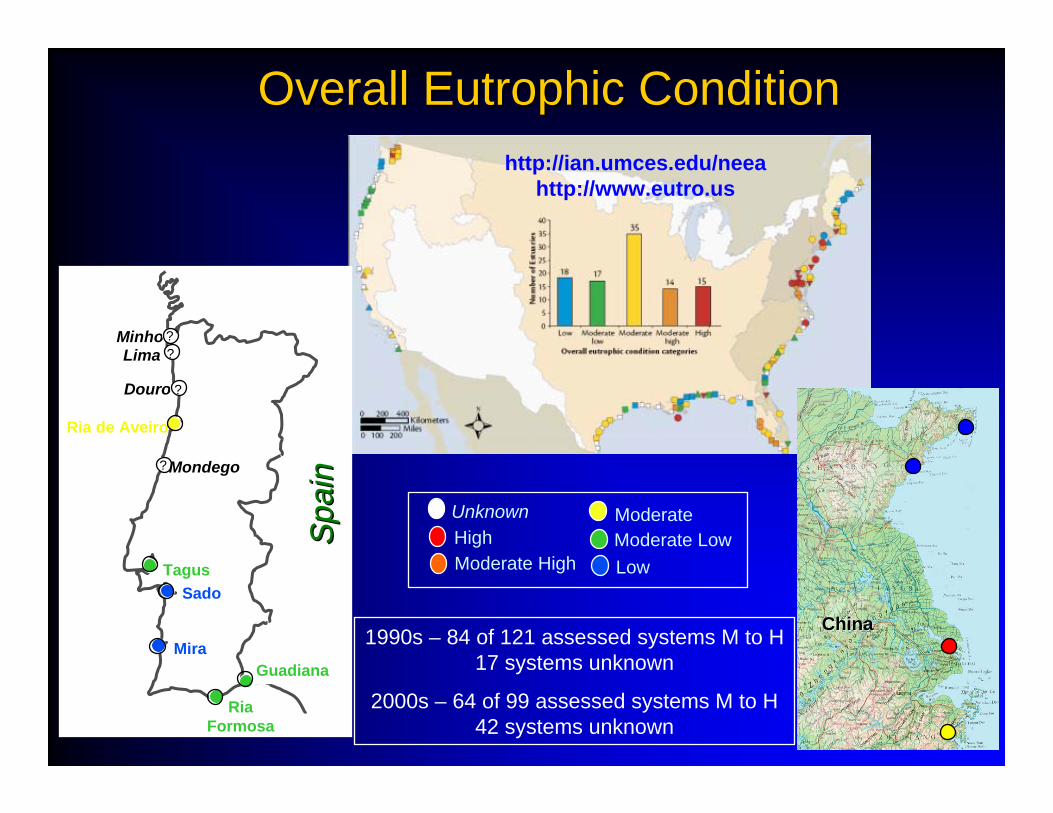
Overall Eutrophic ConditionOverall Eutrophic Condition
? UnknownHighModerate High
Moderate LowLow
Moderate
TagusSado
Mira
MinhoMinhoLimaLima
DouroDouro
Ria de Aveiro
MondegoMondego
RiaFormosa
Guadiana
Spa
inS
pain
??
?
?
ChinaChina
http://ian.umces.edu/neeahttp://www.eutro.us
1990s – 84 of 121 assessed systems M to H17 systems unknown
2000s – 64 of 99 assessed systems M to H42 systems unknown
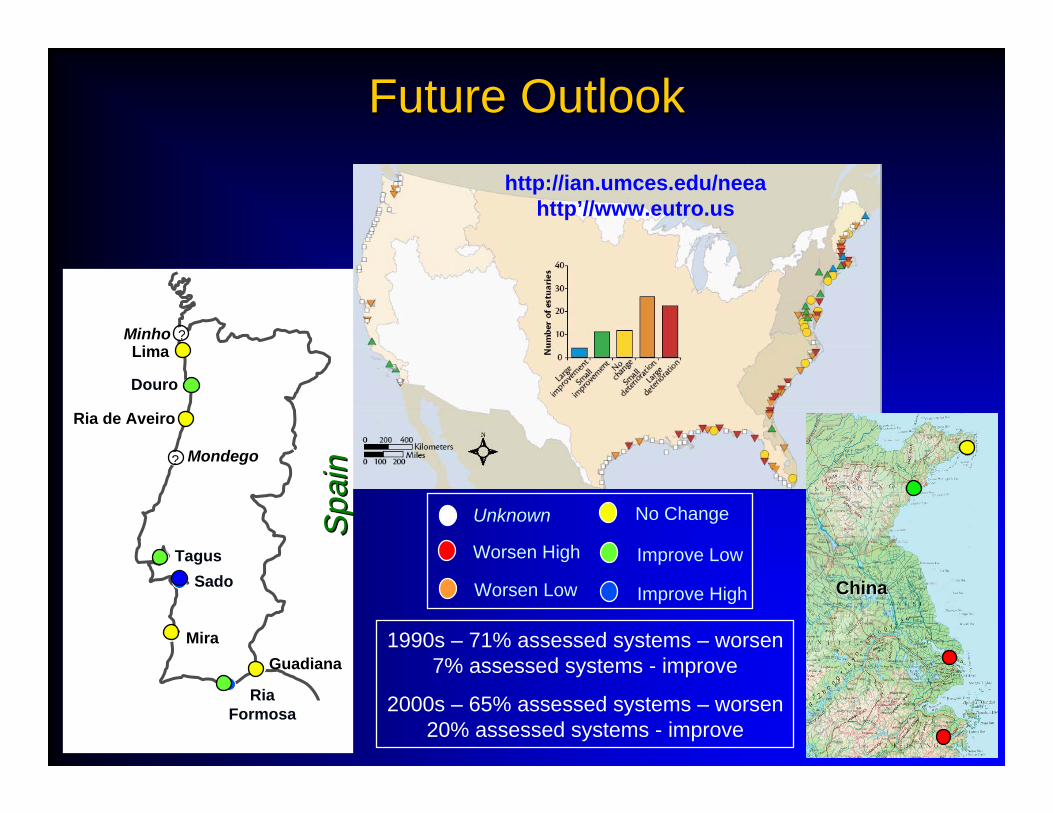
Future OutlookFuture Outlook
ChinaChina
http://ian.umces.edu/neeahttp’//www.eutro.us
1990s – 71% assessed systems – worsen7% assessed systems - improve
2000s – 65% assessed systems – worsen20% assessed systems - improve
? Unknown No Change
Worsen High Improve Low
Worsen Low Improve High
TagusSado
Mira
MinhoLima
Douro
Ria de Aveiro
Mondego
RiaFormosa
Guadiana
Spa
inS
pain
?
?
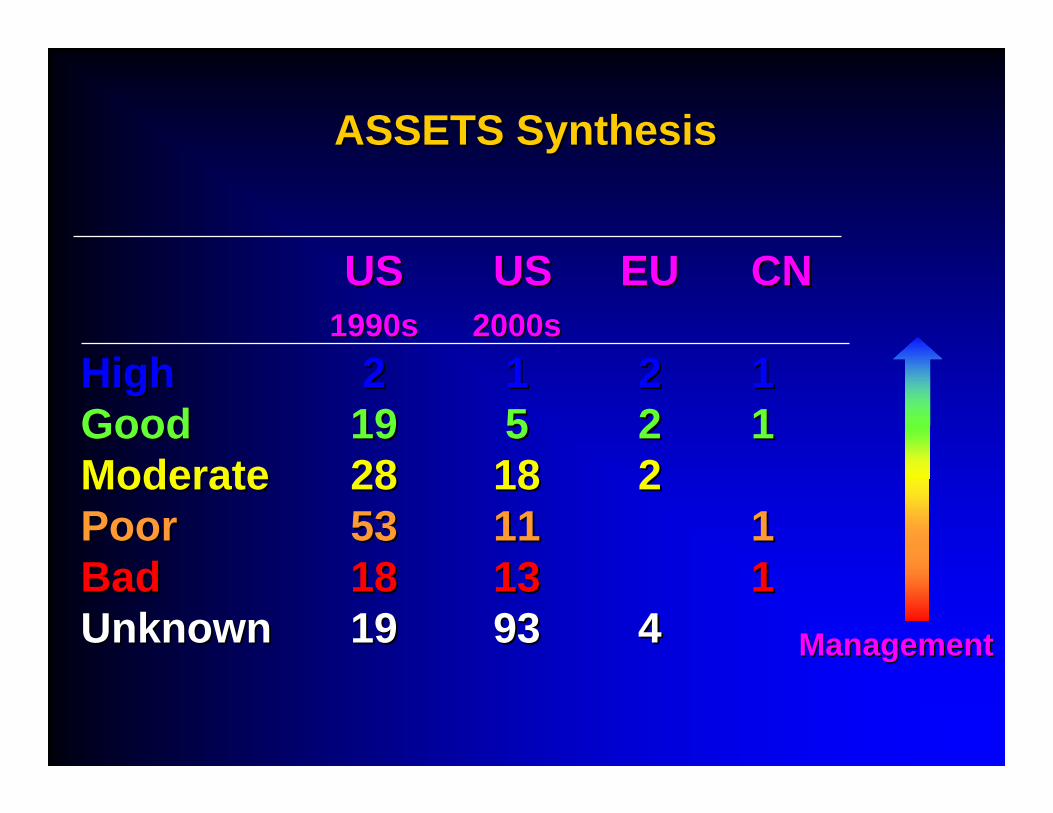
ASSETS SynthesisASSETS Synthesis
USUS US US EUEU CNCN1990s1990s 2000s2000s
HighHigh 22 11 22 11GoodGood 1919 55 22 11ModerateModerate 2828 1818 22PoorPoor 5353 1111 11BadBad 1818 1313 11UnknownUnknown 1919 9393 44 ManagementManagement
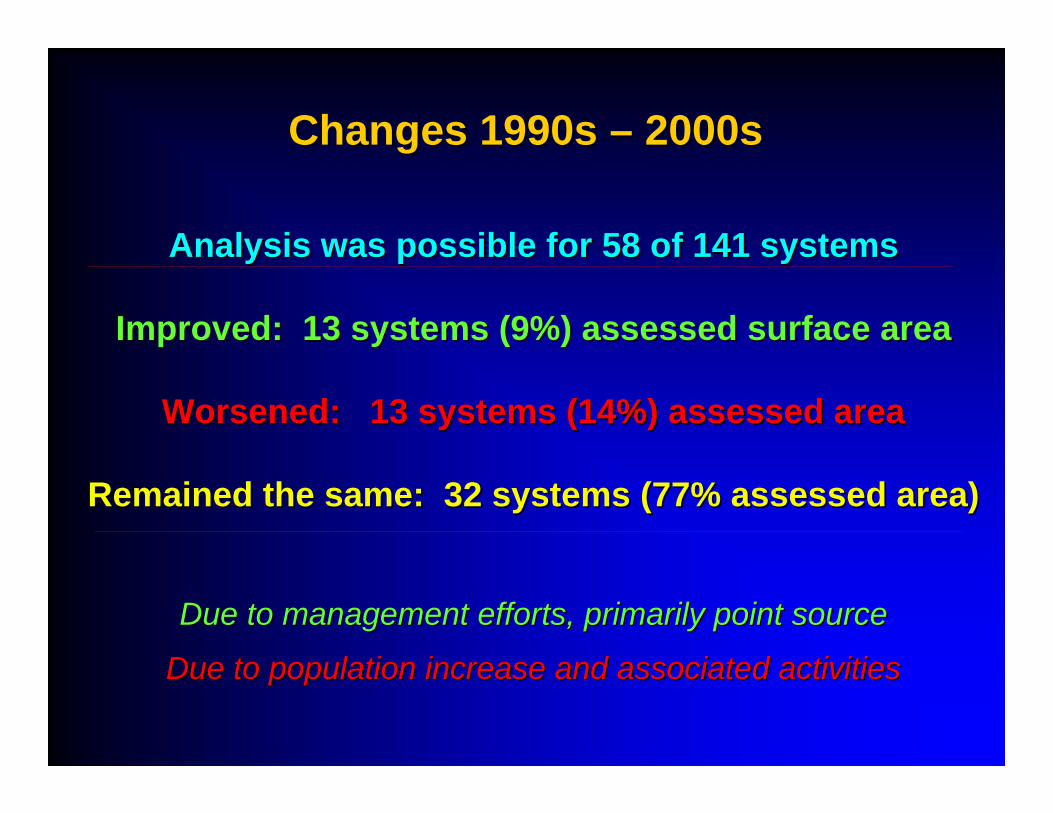
Changes 1990s Changes 1990s –– 2000s2000s
Analysis was possible for 58 of 141 systemsAnalysis was possible for 58 of 141 systems
Improved: 13 systems (9%) assessed surface areaImproved: 13 systems (9%) assessed surface area
Worsened: 13 systems (14%) assessed areaWorsened: 13 systems (14%) assessed area
Remained the sameRemained the same: : 32 systems (77% assessed area)32 systems (77% assessed area)
Due to management efforts, primarily point sourceDue to management efforts, primarily point source
Due to population increase and associated activitiesDue to population increase and associated activities
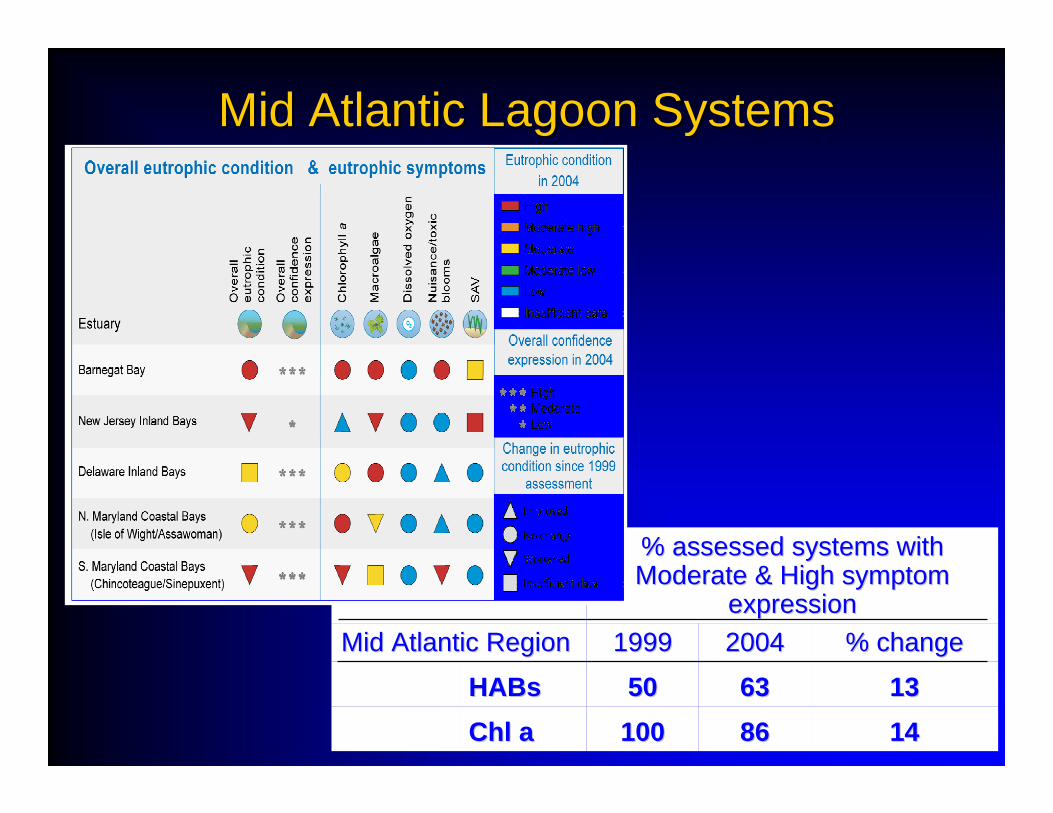
Mid Atlantic Lagoon SystemsMid Atlantic Lagoon Systems
14148686100100ChlChl aa131363635050HABsHABs
% change% change2004200419991999Mid Atlantic RegionMid Atlantic Region
% assessed systems with % assessed systems with Moderate & High symptom Moderate & High symptom
expressionexpression
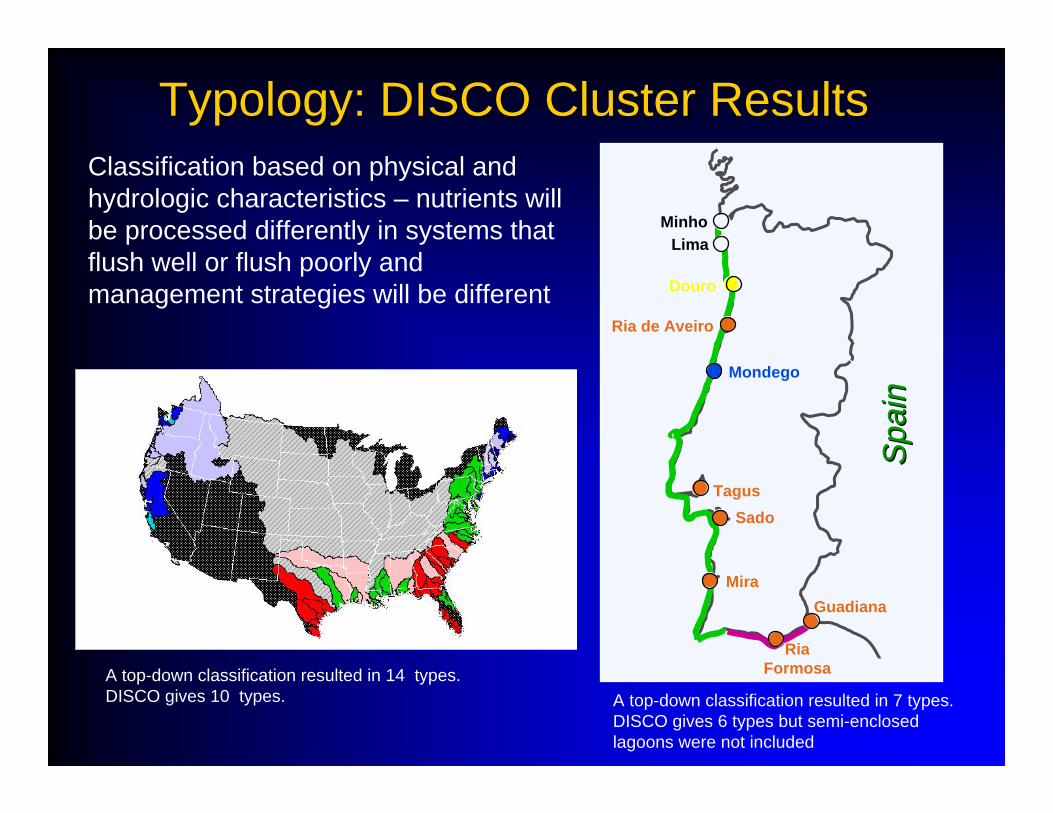
Classification based on physical and hydrologic characteristics – nutrients will be processed differently in systems that flush well or flush poorly and management strategies will be different
A top-down classification resulted in 7 types. DISCO gives 6 types but semi-enclosed lagoons were not included
TagusSado
Mira
MinhoLima
Douro
Ria de Aveiro
Mondego
RiaFormosa
Guadiana
Spa
inS
pain
A top-down classification resulted in 14 types.DISCO gives 10 types.
Typology: DISCO Cluster ResultsTypology: DISCO Cluster Results
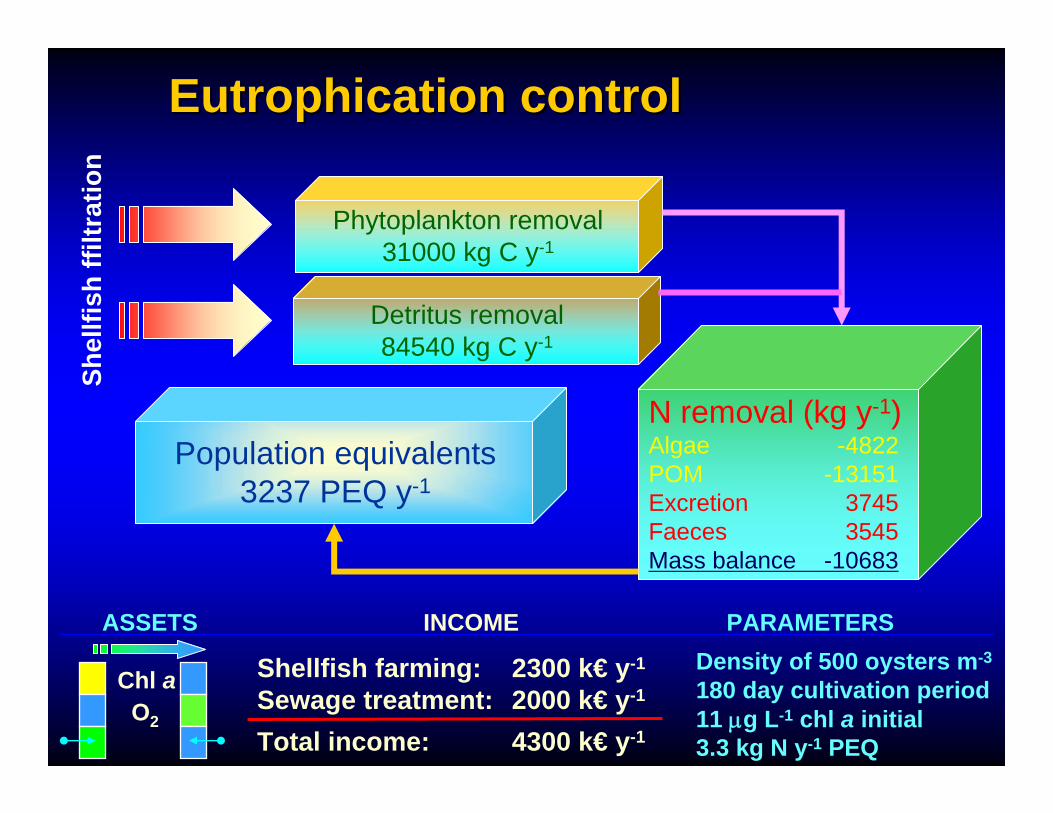
Eutrophication control Eutrophication control ������������
Phytoplankton removal31000 kg C y-1
N removal (kg y-1)Algae -4822POM -13151Excretion 3745Faeces 3545Mass balance -10683
Population equivalents3237 PEQ y-1
Shel
lfish
ffilt
ratio
n
Density of 500 oysters m-3
180 day cultivation period11 μg L-1 chl a initial3.3 kg N y-1 PEQ
Shellfish farming: 2300 k€ y-1
Sewage treatment: 2000 k€ y-1
Total income: 4300 k€ y-1
ASSETS INCOME PARAMETERS
Chl aO2
Detritus removal84540 kg C y-1
National and International PartnersNational and International Partners
Thank You!Thank You!