Embed Size (px)
Citation preview
Oecol. Aust., 15(3): 458-475, 2011
Oecologia Australis 15(3): 458-475, Setembro 2011doi:10.4257/oeco.2011.1503.03
EUTROPHICATION OF RESERVOIRS IN VENEZUELA: RELATIONSHIPS BETWEEN NITROGEN, PHOSPHORUS AND PHYTOPLANKTON BIOMASS
Ernesto J. González 1* & Rolando Quirós 2†
1Universidad Central de Venezuela, Instituto de Biología Experimental, Apartado 47106 - Los Chaguaramos, Caracas - Venezuela.2Universidad de Buenos Aires, Facultad de Agronomía, Buenos Aires - Argentina. († Deceased in 2008).Email: [email protected]
ABSTRACTVenezuela has more than 110 operating reservoirs. However, limnological information is only available
for about 20%, despite the fact that several of them are subject to negative impacts (eutrophication) caused by anthropogenic activities in their drainage basins. We analyzed the relationships between nutrients and phytoplankton biomass (as chlorophyll a). A total of 14 reservoirs from the north-central and northeastern regions of Venezuela were assessed. The reservoirs showed different degrees of eutrophication, with the most enriched located in unprotected drainage basins. The systems could be separated according to low (<20µg/l) and high (>20µg/l) total phosphorus concentrations. Furthermore, in reservoirs with low NO3:NH4 ratios, Cyanobacteria were dominant, whereas other phytoplankton groups were dominant in high NO3:NH4 ratios. Our results showed a significant linear relationship between chlorophyll a concentrations and nutrients, phosphorus and nitrogen. This is because both nutrients can be limiting for phytoplankton growth, at least in some systems. Following these results, we suggest that the control or mitigation of eutrophication in Venezuelan reservoirs should be based on an improved management of the drainage basins, rather than simply that of the reservoirs themselves. Keywords: Eutrophication; Venezuelan reservoirs; TN:TP ratio; NO3:NH4 ratio; phytoplankton biomass.
RESUMENEUTROFIZACIóN DE EMBALSES EN VENEZUELA: RELACIONES ENTRE EL NITRóGENO,
EL FóSFORO Y LA BIOMASA DEL FITOPLANCTON. Venezuela cuenta con más de 110 embalses operativos. Sin embargo, sólo se cuenta con algún tipo de información limnológica en un 20% de ellos, a pesar de que varios sufren impactos negativos (eutrofización) por las actividades antrópicas desarrolladas en sus cuencas de drenaje. En este trabajo, se analizaron las relaciones entre los nutrientes y la biomasa del fitoplancton (como clorofila a). Se evaluaron 14 embalses de la región centro-norte y nororiental de Venezuela en este estudio. Los embalses presentaron diferentes grados de eutrofización, siendo los más eutrofizados aquéllos ubicados en cuencas no protegidas. Los embalses pudieron ser separados según sus concentraciones de fósforo total: bajas (<20µg/l) y altas (>20µg/l). Además, en los embalses con bajos cocientes NO3:NH4 dominaron las cianobacterias, mientras que otros grupos del fitoplancton dominaron con altos cocientes NO3:NH4. Los resultados mostraron una relación lineal significativa entre las concentraciones de clorofila a y los nutrientes, tanto el fósforo como el nitrógeno. Esto es debido a que ambos nutrientes pueden ser limitantes para el crecimiento del fitoplancton, al menos en algunos sistemas. Estos resultados implican que el control o mitigación de la eutrofización de los embalses venezolanos debe basarse en el manejo adecuado de las cuencas de drenaje, más que el solo manejo de los embalses.Palabras clave: Eutrofización; embalses de Venezuela; cociente TN:TP; cociente NO3:NH4; biomasa del fitoplancton.
EUTROPHICATION OF RESERVOIRS IN VENEZUELA
Oecol. Aust., 15(3): 458-475, 2011
459
INTRODUCTION
The explosive demographic growth in Latin America during the last few years, and consequently the demand for water resources, has accelerated the construction of artificial lakes for multiple uses: to supply water for industrial use and drinking purposes, irrigation and generation of hydroelectric power, amongst others (Ryding & Rast 1992). However, many of these reservoirs have suffered the consequences of eutrophication, which has interfered with their functions (Matsumura-Tundisi et al. 1981, Harper 1992, Ryding & Rast 1992, Pütz & Benndorf 1998, Smith & Schindler 2009).
Eutrophication has been defined as a natural ageing process of the catchment areas of water bodies, which continuously become shallower and more productive from a biological point of view (Rhode 1969, Schindler 2006). This process leads to an increase in the amount of nutrients in the water, especially nitrogen and phosphorus and under natural conditions can take hundreds of years to complete (Branco 1984, Rocha & Branco 1986, Tundisi & Matsumura-Tundisi 2008). However, due to intense urbanization together with industrial activities, a considerable increase in the discharge of nitrogen and phosphorus occurs in some aquatic ecosystems, leading to an acceleration in the eutrophication process (Rocha & Branco 1986, Tundisi & Matsumura-Tundisi 2008), known as “cultural eutrophication” (Schindler 2006). This nutrient enrichment, derived from both point and non-point anthropogenic sources, results in a rapid increase in biological productivity and significant reductions in the transparency of the water column, leading to a wide range of undesirable changes in the water quality of aquatic ecosystems (Schindler 2006). Ryding & Rast (1992) define eutrophication as the enrichment of nutrients in water that provokes the stimulation of a series of symptomatic changes, amongst which the increase in the production of algae and macrophytes and the deterioration in water quality are undesirable as they interfere with water use.
Venezuela has more than 110 operating reservoirs (MINAMB 2007) distributed over the entire country and which are used for multiple purposes: the supply of drinking water and water for industrial uses, the generation of hydroelectric power, irrigation, flood control and recreation. However, limnological
information is only known for about 20% of these, in spite of the fact that anthropogenic activities that have developed within their catchment areas have been reflected in the eutrophication of the reservoirs: high nitrogen and phosphorus concentrations, high densities of phytoplankton and/or macrophytes, cyanobacterial blooms and poor water quality (Infante et al. 1992, 1995, Ortaz et al. 1999, González et al. 2003, González 2008, González et al. 2009).
In this study, we aimed to analyze the relationships between water transparency, nutrient concentrations, and phytoplankton biomass (estimated as chlorophyll a) in 14 reservoirs in Venezuela. We suggest that some of these relationships could constitute valuable tools for the determination of the trophic states of reservoirs and their management.
METHODS
STUDY AREAS
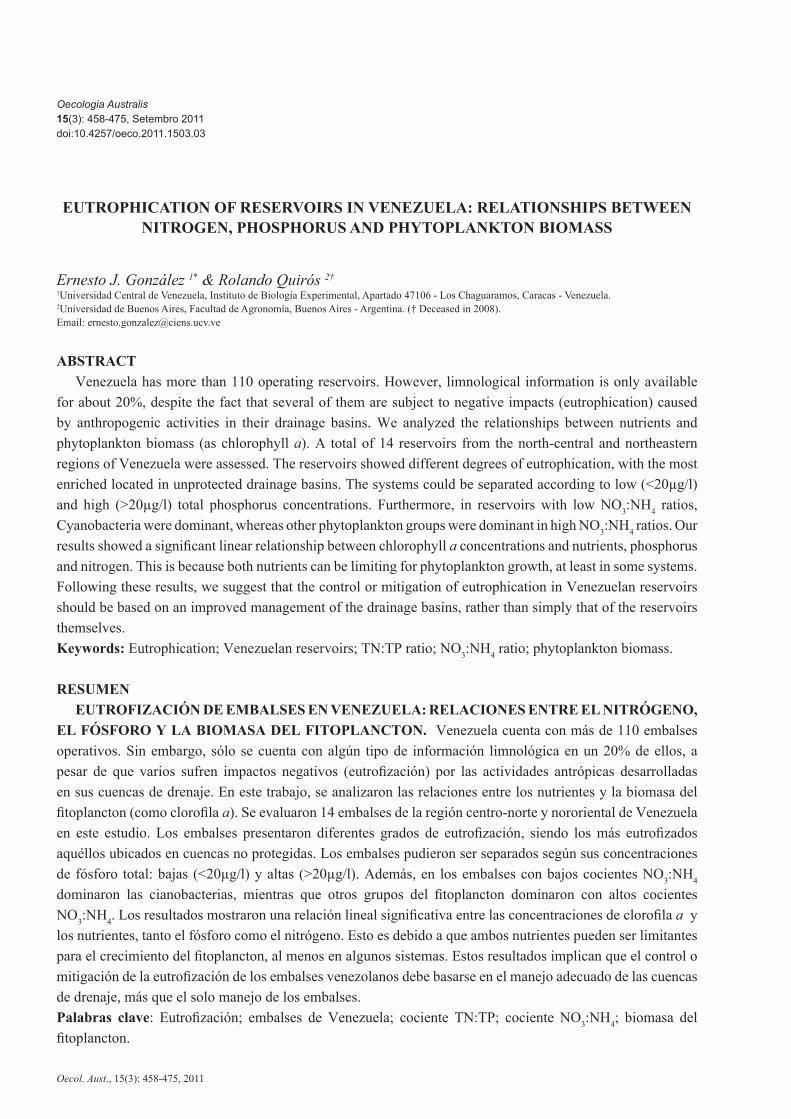
Nutrient mean values from the euphotic zone were compiled from reservoirs studied from 1993 to the present day (Figure 1). The reservoirs are all located in the north-central and northeastern regions of the country.
Figure 1. Map of Venezuela, showing the relative locations of the reservoirs. 1: Agua Fría, 2: Taguaza, 3: Lagartijo, 4: Clavellinos, 5: Tierra Blanca, 6: Loma de Níquel, 7: El Pueblito, 8: El Cigarrón, 9: El Cují, 10: El Andino, 11: La Mariposa, 12: La Pereza, 13: Pao-Cachinche 1 (western wing with uptake point and outlet), 14: Pao-Cachinche 2 (eastern wing
without outlet), 15: Quebrada Seca.Figura 1. Mapa de Venezuela mostrando la ubicación relativa de los embalses. 1: Agua Fría, 2: Taguaza, 3: Lagartijo, 4: Clavellinos, 5: Tierra Blanca, 6: Loma de Níquel, 7: El Pueblito, 8: El Cigarrón, 9: El Cují, 10: El Andino, 11: La Mariposa, 12: La Pereza, 13: Pao-Cachinche 1 (ala oeste con aliviadero y torre-toma), 14: Pao-Cachinche 2 (ala este
sin aliviadero), 15: Quebrada Seca.
González , e.j. & Quirós, r.
Oecol. Aust., 15(3): 458-475, 2011
460
The following reservoirs were investigated: Agua Fría (AFR), Taguaza (TAG), Lagartijo (LAG), Clavellinos (CLA), Tierra Blanca (TBL), Loma de Níquel (LNI), El Cigarrón (ECI), El Pueblito (EPU), El Cují (ECU), El Andino (EAN), La Mariposa (LMA), La Pereza (LPE), Quebrada
Table 1. Main morphometric features of the reservoirs.Tabla 1. Principales características morfométricas de los embalses estudiados.
Seca (QSE) and Pao-Cachinche (PC1 – to the west where the water outlet and uptake point are located, and PC2 – to the east where there is no water outlet). Some of the morphometric characteristics of these reservoirs are shown in Table 1.
Reservoir Mean depth(m)
Area(km2)
Volume(km3)
Residence time(d)
Coordinates
Agua Fría 13.2 0.440 0.0058 38 10º23’ N - 67º10’ W
Taguaza 20.6 6.490 0.1340 40 10º10’ N - 66º26’ W
Lagartijo 17.7 4.510 0.0800 243 10º11’ N - 66º43’ W
Clavellinos 12.5 10.500 0.1310 106 10°21’ N - 63°36’ W
Tierra Blanca 12.5 0.400 0.0050 144 9º58’ N - 67º25’ W
Loma Níquel 6.0 0.506 0.0030 -- 10º09’ N - 67º06’ W
El Cigarrón 4.9 50.500 0.2460 158 9º12’ N - 65º40’ W
El Pueblito 6.4 49.500 0.3150 152 9º12’ N - 65º34’ W
El Cují 3.9 12.720 0.0493 375 9º37’ N - 65º14’ W
El Andino 7.9 1.780 0.0140 167 9º32’ N - 65º09’ W
La Mariposa 13.0 0.540 0.0070 12 10º24’ N - 66º33’ W
La Pereza 14.2 0.563 0.0080 12 10º27’ N - 66º46’ W
Pao-Cachinche 10.6 16.100 0.1700 281 9º53’ N - 68º08’ W
Quebrada Seca 7.9 0.950 0.0075 17 10º13’ N - 66º43’ W
Agua Fría (AFR): Located within a protected area (Macarao National Park, Miranda State). Used to supply drinking water to the city of Los Teques (population approximately 172,000). This reservoir shows low nutrient concentrations, but the water level has declined over the years due to an increase in the demand for drinking water. Meromictic with a tendency to warm monomictic, following Lewis’ (1983) criteria; shows hypolimnetic anoxia during the rainy season (González et al. 2004a).
Taguaza (TAG): Located within a protected area (Guatopo National Park, Miranda State). Used to supply drinking water to areas surrounding the city of Caracas (population approximately 4 million). Shows low nutrient concentrations. Meromictic with
a tendency to warm monomictic and with permanent hypolimnetic anoxia (González et al. 2002).
Lagartijo (LAG): Located within a protected area (Guatopo National Park, Miranda State). Used to supply drinking water to the city of Caracas (population approximately 4 million). Shows low nutrient concentrations, but due to the increasing demand for water by the metropolitan area of Caracas, water is pumped to the reservoir from the Tuy river (a highly contaminated river) after sedimentation and chlorination, although this pumped water only affects a small part of the water body. Meromictic with a tendency to warm monomictic and with nearly permanent hypolimnetic anoxia (Infante et al. 1992, Ortaz et al. 1999).
EUTROPHICATION OF RESERVOIRS IN VENEZUELA
Oecol. Aust., 15(3): 458-475, 2011
461
Clavellinos (CLA): Located in Sucre State and used to supply drinking water to the town of Carúpano and Nueva Esparta State (population 512,366) as well as for irrigation. High nitrate concentrations were detected in its waters, possibly from the use of fertilizers on the surrounding land. Warm monomictic; shows anoxic conditions in the hypolimnion during the rainy season (Merayo & González 2010).
Loma de Níquel (LNI): Situated in Aragua State, the water is used for the cooling of the turbines after nickel extraction. The reservoir suffers moderate impact but has a high cyanobacteria density. LNI was only sampled twice and was found to be thermally stratified (González et al. 1999).
Tierra Blanca (TBL): Situated in Guárico State and used to supply drinking water to the city of San Juan de Los Morros (population 85,000), as well as for recreational purposes. Its drainage basin is partially protected, although this is limited by free public access. The water level fluctuates strongly due to demand. Meromictic with a tendency to warm monomictic and with nearly permanent hypolimnetic anoxia (González 2006).
El Pueblito (EPU): Located in Guárico State and used for flood control, subsistence agriculture, irrigation and recreation. Shows moderate nutrient concentrations. Classified as warm monomictic according to the criteria of Hutchinson (1957) and Lewis (1983), with hypolimnetic anoxia during the rainy season (González 2000a).
El Cigarrón (ECI): Located in Guárico State and used for flood control, subsistence agriculture and irrigation. Shows high nutrient concentrations due to the use of fertilizers in the surrounding areas. Warm monomictic; with hypolimnetic anoxia during the rainy season (unpublished data).
El Andino (EAN): Located in Anzoátegui State. Used for subsistence agriculture and irrigation. Shows moderate nutrient concentrations due to the use of fertilizers in the surrounding areas. Warm monomictic; with hypolimnetic anoxia during the rainy season (Infante et al. 1995, González 2000b).
El Cují (ECU): Situated in Anzoátegui State and used for the supply of drinking water to the towns of Onoto and Zaraza, as well as for flood control and irrigation. Warm monomictic; with hypolimnetic hypoxia and anoxia during the rainy season (Infante et al. 1995).
La Mariposa (LMA): This is an urban reservoir, located 8 km from the city of Caracas (population approximately 4 million) and used to supply drinking water as well as for recreation. The catchment area is highly intervened and its waters show high nutrient concentrations, which has recently produced excessive growth of the macrophyte Eichhornia crassipes. In spite of low residence times, its waters show thermal stratification during the rainy season, when hypoxic conditions may also be detected in the hypolimnion (Ortaz et al. 1999).
La Pereza (LPE): Located in Miranda State and used for recreational purposes and the supply of drinking water to areas surrounding Caracas (population approximately 4 million). Its waters show high nutrient concentrations, which come from nearby pig and chicken farms, as well as waste waters from a galvanized steel factory. Warm monomictic; with anoxic conditions in the hypolimnion during the rainy season (Ortaz et al. 1999).
Quebrada Seca (QSE): Located in Miranda State and used for purifying untreated water from the Tuy river before pre treating and pumping it to the Lagartijo reservoir, from which it is used to supply drinking water to Caracas. Its catchment area is highly intervened, with surrounding rural communities that discharge their waste waters directly into the reservoir. It mixes only once a year (warm monomictic) and shows hypolimnetic anoxia during the rainy season (Ortaz et al. 1999).
Pao-Cachinche (PCA): Located between Carabobo and Guárico States. Supplies drinking water to the cities of Valencia, Maracay, San Carlos and neighboring areas (population approximately 2 million). Shows high nutrient concentrations due to inadequately treated domestic and industrial waste, as well as discharges from chicken and pig farms in its drainage basin, all of which are transported to the reservoir via its tributaries. Meromictic, with a tendency to warm monomictic; showed permanent hypolimnetic anoxia (González et al. 2004b).
SAMPLING AND SAMPLE ANALYSES
Monthly or bimonthly samples were taken covering at least an annual cycle, except for Loma de Níquel reservoir as stated in the previous section.
González , e.j. & Quirós, r.
Oecol. Aust., 15(3): 458-475, 2011
462
Samples were taken using a van Dorn type bottle in the limnetic region of reservoirs.
Water transparency (SD) was measured with a 20cm diameter Secchi disk. The euphotic zone of each water body was defined as 3 times Secchi disk transparency (Cole 1994), in order to relate it to the phytoplankton biomass. Dissolved nutrients were analyzed from samples filtered “in situ” with a 0.45µm Millipore Membrane Filter and maintained under cold dark conditions until analysis. Nitrites were analyzed by diazotization with sulfanilamide and coupling with N-(1-naftil)- ethylendiamine (Strickland & Parsons 1968), nitrates by reduction to nitrites using a cadmium-copper column and then by diazotization with sulfanilamide and coupling with N-(1-naftil)-ethylendiamine (Strickland & Parsons 1968), ammonium by the formation of an indophenol compound using the phenol – sodium hypochlorite method (Solórzano 1969) and orthophosphates by the formation of the phospho-molybdic complex with ascorbic acid (Murphy & Riley 1962). Total nitrogen (TN) and total phosphorus (TP) were measured simultaneously by the digestion of non-filtered samples, using potassium persulfate and autoclaving for 30 minutes at 110°C (Valderrama 1981).
Phytoplankton biomass was determined as the concentration of chlorophyll a; samples were taken in the euphotic zone of the reservoirs using a van Dorn type sampling bottle (3– liters). Samples were maintained in cold dark conditions and filtered as soon as possible using Whatman GF/C glass-fiber filters. The photosynthetic pigments were extracted with ethanol at 75°C (Nusch & Palme 1975). The dominant phytoplankton groups were noted for each reservoir, after sedimentation in Utermöhl chambers and counting under an inverted Zeiss IM microscope.
DATA ANALYSES
The trophic states of the reservoirs were defined using the criteria of Salas & Martino (1991) for warm tropical lakes. Linear regressions were performed between phytoplankton biomass (chlorophyll a) and
nutrients based on mean values from euphotic zone. In order to approach normality, data were log 10 transformed. We checked for Spearman correlations to assess the influence between variables. Cluster analysis was done to separate the reservoirs into groups according to the following variables: mean depth, water transparency, concentrations of TP, TN, orthophosphates, nitrites, nitrates, ammonium and chlorophyll a, as well as the TN:TP and NO3:NH4 ratios. The City Block (Manhattan) grouping method was used as this gives less data distortion. All statistical tests were done using the PAST program, version 1.93 (Hammer et al. 2001).
RESULTS
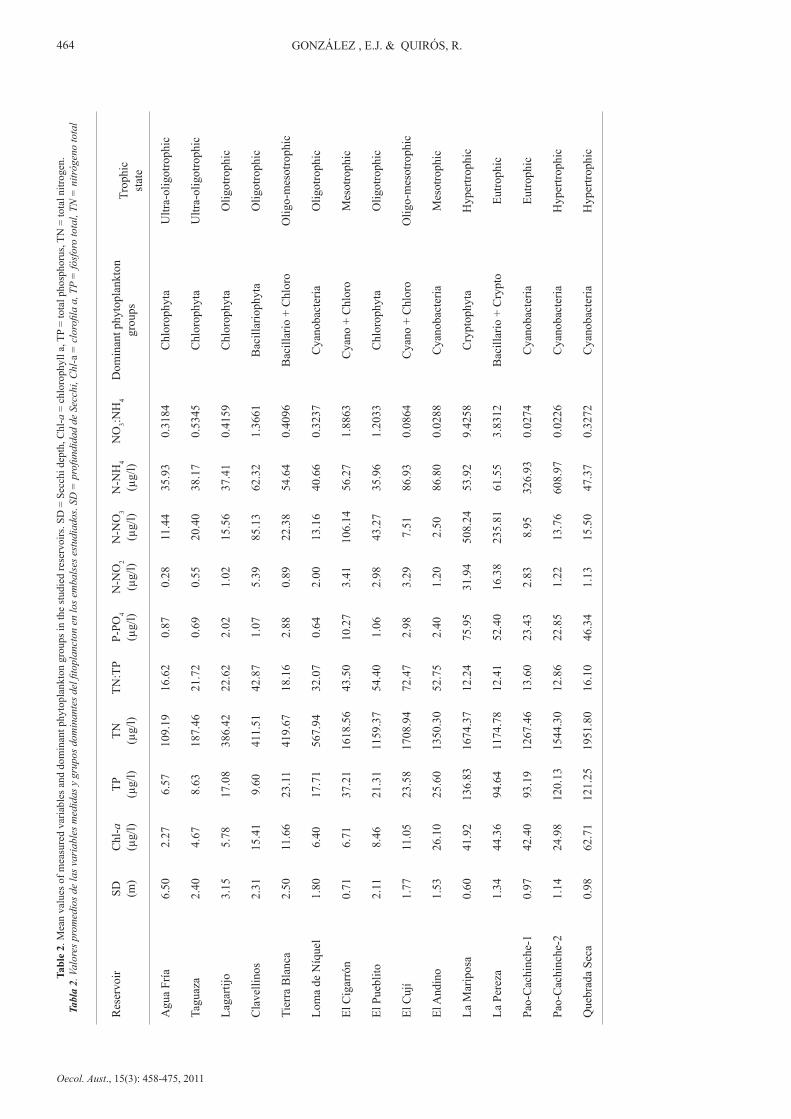
Mean values of the measured variables and dominant phytoplankton groups are shown in Table 2. It can be observed that the reservoirs show a wide range of conditions between ultra-oligotrophic and hypertrophic systems and have different groups of dominant phytoplankton. The trophic states of the reservoirs, following the criteria of Salas & Martino (1991) for warm tropical lakes according to the TP, are also given in Table 2.
All of the reservoirs assessed underwent thermal stratification during the study period and were classified as warm monomictic or meromictic with tendency to warm monomictic, following the cited authors (see “Study areas”).
In the least enriched reservoirs, Agua Fría and Taguaza, Chlorophyta was the dominant phytoplankton group (up to 70% of relative abundance) during almost the whole year with Cosmarium sp. (green algae), Cyclotella sp. (Bacillariophyta) and Cryptomonas erosa (Cryptophyta) as the dominant species. In both water bodies orthophosphate (PO4) concentrations were less than 10µg/l while dissolved inorganic nitrogen (DIN= nitrate + nitrite + ammonium) was less than 100µg/l.
The Lagartijo reservoir also showed low values of PO4 and DIN and green algae dominance (more than 40% of total phytoplankton), although Sphaerocystis
EUTROPHICATION OF RESERVOIRS IN VENEZUELA
Oecol. Aust., 15(3): 458-475, 2011
463
schroeteri was the dominant species. The Clavellinos reservoir showed low PO4 concentrations, but DIN was >100µg/l. In this reservoir, Achnanthidium minutissimum (Bacillariophyta) was the dominant species especially during the mixing period, while Staurastrum, Cosmarium and Tetraedron (Chlorophyta) increased in abundance during thermal stratification of the reservoir.
The other reservoir with low nutrient concentrations (PO4 and DIN) was Loma de Níquel. However, this reservoir was studied for just two months during thermal stratification when Cyanobacteria (mostly Leptolyngbya limnetica) accounted for more than 60% of total phytoplankton.
The following reservoirs showed >20µg/l TP concentrations, although some of them had low DIN and PO4 values:
In Tierra Blanca reservoir, Bacillariophyta showed high relative abundances (>40%), followed by Chlorophyta. The diatoms Navicula (mainly), Aulacoseira, Cyclotella, Stephanodiscus and Synedra were the dominant genera, followed by the green algae Chlorella, Monoraphidium, Oocystis and Schroederia. Annual averages of PO4 and DIN were 2.88µg/l and 77.91µg/l, respectively.
In El Pueblito reservoir, Cyanobacteria (Cylindrospermopsis raciborskii, Synechococcus sp., Oscillatoria punctata and Lyngbya limnetica) and Bacillariophyta (Aulacoseira granulata, Cyclotella spp. and Synedra ulna) were the dominant groups during the study period. Chlorophyta (mainly Schroederia setigera) increased their abundance during the rainy season (reservoir was thermally stratified). The mean PO4 concentration was low (1.06µg/l), but the DIN concentration was close to 100µg/l (82.21µg/l).
El Andino and El Cují reservoirs showed similar average PO4 and DIN concentrations (2.40µg/l and 90.50µg/l, respectively, for El Andino, and 2.98µg/l and 97.73µg/l, respectively, for El Cují). In both reservoirs, Cyanobacteria dominated the phytoplankton community during most of the year. Cylindrospermopsis raciborskii and Dactylococcopsis acicularis were present in high densities in both
reservoirs, especially in El Andino, while in El Cují some green algae species were noted in high numbers (Monoraphidium tortile and Oocystis lacustris). Cryptomonas erosa (Cryptophyta) was abundant at the beginning of the thermal stratification period (April).
The rest of the reservoirs presented PO4 concentrations greater than 10µg/l, and except for Quebrada Seca, also showed high average DIN values (>100µg/l). In El Cigarrón, Cyanobacteria represented more than 60% of total phytoplankton during several months, with Merismopedia elegans as the dominant species. Cylindrospermopsis raciborskii (Cyanobacteria) and Monoraphidium sp. and Schroederia setigera (Chlorophyta) were also present in high densities.
La Mariposa and La Pereza reservoirs showed higher concentrations of PO4 and DIN (mainly nitrates). Cryptophyta accounted for more than 60% of the phytoplankton community in La Mariposa, and the dominant species was Cryptomonas erosa. On the other hand in La Pereza, the phytoplankton community was dominated by Bacillariophyta (Cyclotella meneghiniana, Aulacoseira granulata, Synedra sp. and Navicula sp.), that accounted for about 50% of total abundance and Cryptophyta (Cryptomonas erosa). These reservoirs showed low residence times.
In Quebrada Seca, Cylindrospermopsis raciborskii (Cyanobacteria) was the dominant species during almost the whole study period. Other species that showed high numbers were Oscillatoria sp. and Anabaena sp. Cyanobacteria accounted for more than 60% of total phytoplankton. In this reservoir, a high PO4 concentration (46.34µg/l) was registered, although DIN was lower than 100µg/l.
In Pao-Cachinche reservoir, high PO4 (>22µg/l) and DIN (>300µg/l) concentrations were registered, and Cyanobacteria accounted for, on average, almost 90% of total phytoplankton. The dominant species in this reservoir were Cylindrospermopsis raciborskii, Synechocystis aquatilis, Leptolyngbya limnetica, Limnothrix sp., Microcystis spp., Dactylococcopsis acicularis and Rhaphidiopsis curvata.
González , e.j. & Quirós, r.
Oecol. Aust., 15(3): 458-475, 2011
464
Res
ervo
irSD (m
)C
hl-a
(µg/
l)TP (µg/
l)TN (µg/
l)TN
:TP
P-PO
4(µ
g/l)
N-N
O2
(µg/
l)N
-NO
3(µ
g/l)
N-N
H4
(µg/
l)N
O3:N
H4
Dom
inan
t phy
topl
ankt
on
grou
psTr
ophi
cst
ate
Agu
a Fr
ía6.
502.
276.
5710
9.19
16.6
20.
870.
2811
.44
35.9
30.
3184
Chl
orop
hyta
U
ltra-
olig
otro
phic
Tagu
aza
2.40
4.67
8.63
187.
4621
.72
0.69
0.55
20.4
038
.17
0.53
45C
hlor
ophy
ta
Ultr
a-ol
igot
roph
ic
Laga
rtijo
3.15
5.78
17.0
838
6.42
22.6
22.
021.
0215
.56
37.4
10.
4159
Chl
orop
hyta
O
ligot
roph
ic
Cla
velli
nos
2.31
15.4
19.
6041
1.51
42.8
71.
075.
3985
.13
62.3
21.
3661
Bac
illar
ioph
yta
Olig
otro
phic
Tier
ra B
lanc
a2.
5011
.66
23.1
141
9.67
18.1
62.
880.
8922
.38
54.6
40.
4096
Bac
illar
io +
Chl
oro
Olig
o-m
esot
roph
ic
Lom
a de
Níq
uel
1.80
6.40
17.7
156
7.94
32.0
70.
642.
0013
.16
40.6
60.
3237
Cya
noba
cter
ia
Olig
otro
phic
El C
igar
rón
0.71
6.71
37.2
116
18.5
643
.50
10.2
73.
4110
6.14
56.2
71.
8863
Cya
no +
Chl
oro
Mes
otro
phic
El P
uebl
ito2.
118.
4621
.31
1159
.37
54.4
01.
062.
9843
.27
35.9
61.
2033
Chl
orop
hyta
O
ligot
roph
ic
El C
ují
1.77
11.0
523
.58
1708
.94
72.4
72.
983.
297.
5186
.93
0.08
64C
yano
+ C
hlor
o O
ligo-
mes
otro
phic
El A
ndin
o1.
5326
.10
25.6
013
50.3
052
.75
2.40
1.20
2.50
86.8
00.
0288
Cya
noba
cter
ia
Mes
otro
phic
La M
arip
osa
0.60
41.9
213
6.83
1674
.37
12.2
475
.95
31.9
450
8.24
53.9
29.
4258
Cry
ptop
hyta
H
yper
troph
ic
La P
erez
a1.
3444
.36
94.6
411
74.7
812
.41
52.4
016
.38
235.
8161
.55
3.83
12B
acill
ario
+ C
rypt
o Eu
troph
ic
Pao-
Cac
hinc
he-1
0.97
42.4
093
.19
1267
.46
13.6
023
.43
2.83
8.95
326.
930.
0274
Cya
noba
cter
ia
Eutro
phic
Pao-
Cac
hinc
he-2
1.14
24.9
812
0.13
1544
.30
12.8
622
.85
1.22
13.7
660
8.97
0.02
26C
yano
bact
eria
H
yper
troph
ic
Que
brad
a Se
ca0.
9862
.71
121.
2519
51.8
016
.10
46.3
41.
1315
.50
47.3
70.
3272
Cya
noba
cter
ia
Hyp
ertro
phic
Tabl
e 2.
Mea
n va
lues
of m
easu
red
varia
bles
and
dom
inan
t phy
topl
ankt
on g
roup
s in
the
stud
ied
rese
rvoi
rs. S
D =
Sec
chi d
epth
, Chl
-a =
chl
orop
hyll
a, T
P =
tota
l pho
spho
rus,
TN =
tota
l nitr
ogen
.Ta
bla
2. V
alor
es p
rom
edio
s de
las v
aria
bles
med
idas
y g
rupo
s dom
inan
tes d
el fi
topl
anct
on e
n lo
s em
bals
es e
stud
iado
s. SD
= p
rofu
ndid
ad d
e Se
cchi
, Chl
-a =
clo
rofil
a a,
TP
= fó
sfor
o to
tal,
TN =
nitr
ógen
o to
tal
EUTROPHICATION OF RESERVOIRS IN VENEZUELA
Oecol. Aust., 15(3): 458-475, 2011
465
CORRELATIONS
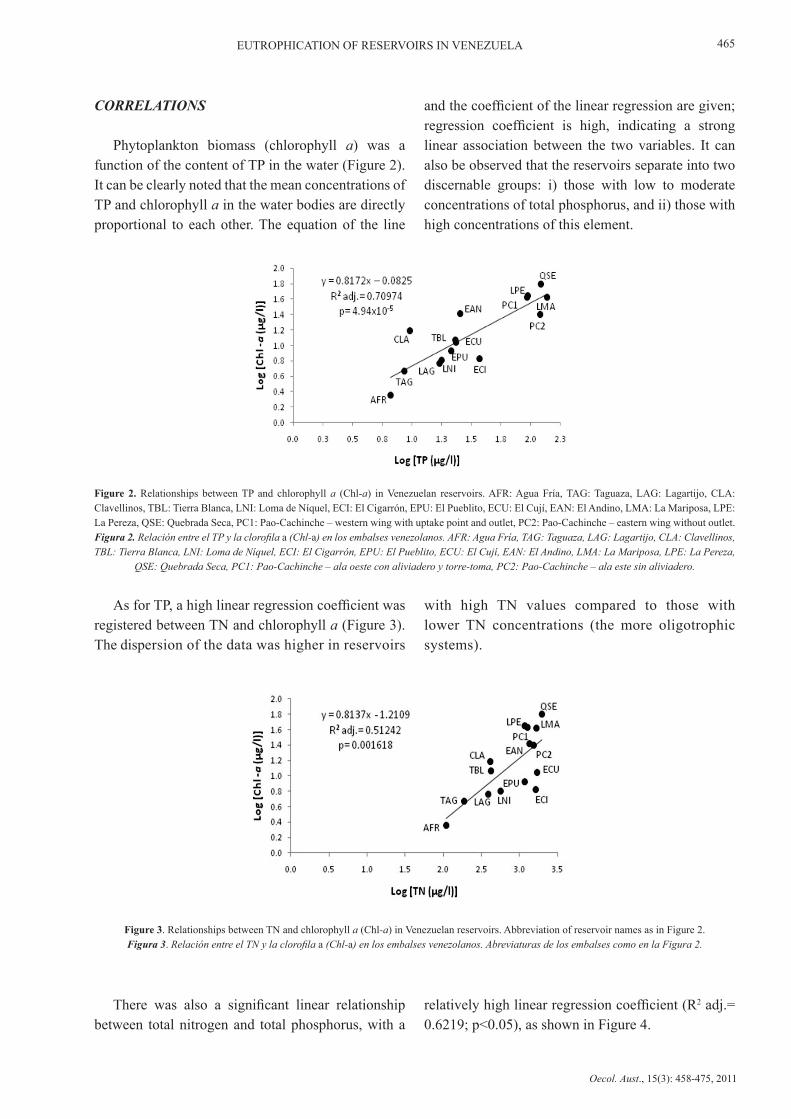
Phytoplankton biomass (chlorophyll a) was a function of the content of TP in the water (Figure 2). It can be clearly noted that the mean concentrations of TP and chlorophyll a in the water bodies are directly proportional to each other. The equation of the line
and the coefficient of the linear regression are given; regression coefficient is high, indicating a strong linear association between the two variables. It can also be observed that the reservoirs separate into two discernable groups: i) those with low to moderate concentrations of total phosphorus, and ii) those with high concentrations of this element.
Figure 2. Relationships between TP and chlorophyll a (Chl-a) in Venezuelan reservoirs. AFR: Agua Fría, TAG: Taguaza, LAG: Lagartijo, CLA: Clavellinos, TBL: Tierra Blanca, LNI: Loma de Níquel, ECI: El Cigarrón, EPU: El Pueblito, ECU: El Cují, EAN: El Andino, LMA: La Mariposa, LPE: La Pereza, QSE: Quebrada Seca, PC1: Pao-Cachinche – western wing with uptake point and outlet, PC2: Pao-Cachinche – eastern wing without outlet.Figura 2. Relación entre el TP y la clorofila a (Chl-a) en los embalses venezolanos. AFR: Agua Fría, TAG: Taguaza, LAG: Lagartijo, CLA: Clavellinos, TBL: Tierra Blanca, LNI: Loma de Níquel, ECI: El Cigarrón, EPU: El Pueblito, ECU: El Cují, EAN: El Andino, LMA: La Mariposa, LPE: La Pereza,
QSE: Quebrada Seca, PC1: Pao-Cachinche – ala oeste con aliviadero y torre-toma, PC2: Pao-Cachinche – ala este sin aliviadero.
Figure 3. Relationships between TN and chlorophyll a (Chl-a) in Venezuelan reservoirs. Abbreviation of reservoir names as in Figure 2.Figura 3. Relación entre el TN y la clorofila a (Chl-a) en los embalses venezolanos. Abreviaturas de los embalses como en la Figura 2.
As for TP, a high linear regression coefficient was registered between TN and chlorophyll a (Figure 3). The dispersion of the data was higher in reservoirs
with high TN values compared to those with lower TN concentrations (the more oligotrophic systems).
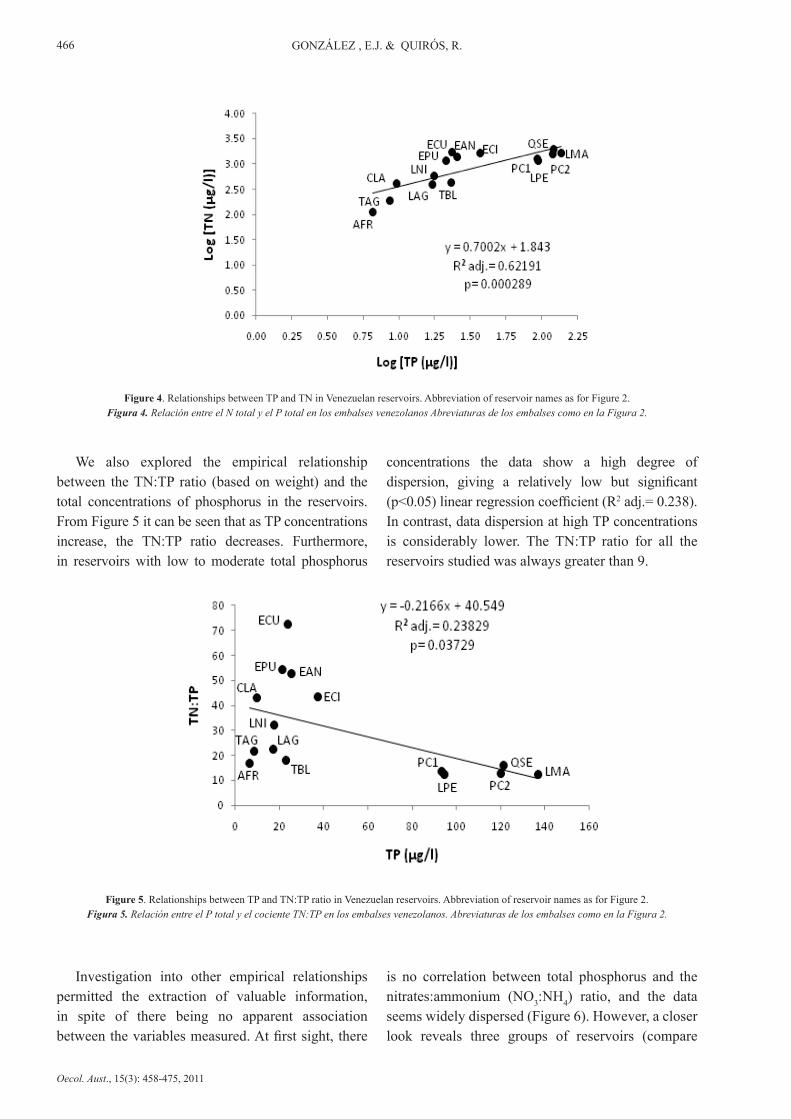
There was also a significant linear relationship between total nitrogen and total phosphorus, with a
relatively high linear regression coefficient (R2 adj.= 0.6219; p<0.05), as shown in Figure 4.
González , e.j. & Quirós, r.
Oecol. Aust., 15(3): 458-475, 2011
466
Figure 4. Relationships between TP and TN in Venezuelan reservoirs. Abbreviation of reservoir names as for Figure 2.Figura 4. Relación entre el N total y el P total en los embalses venezolanos Abreviaturas de los embalses como en la Figura 2.
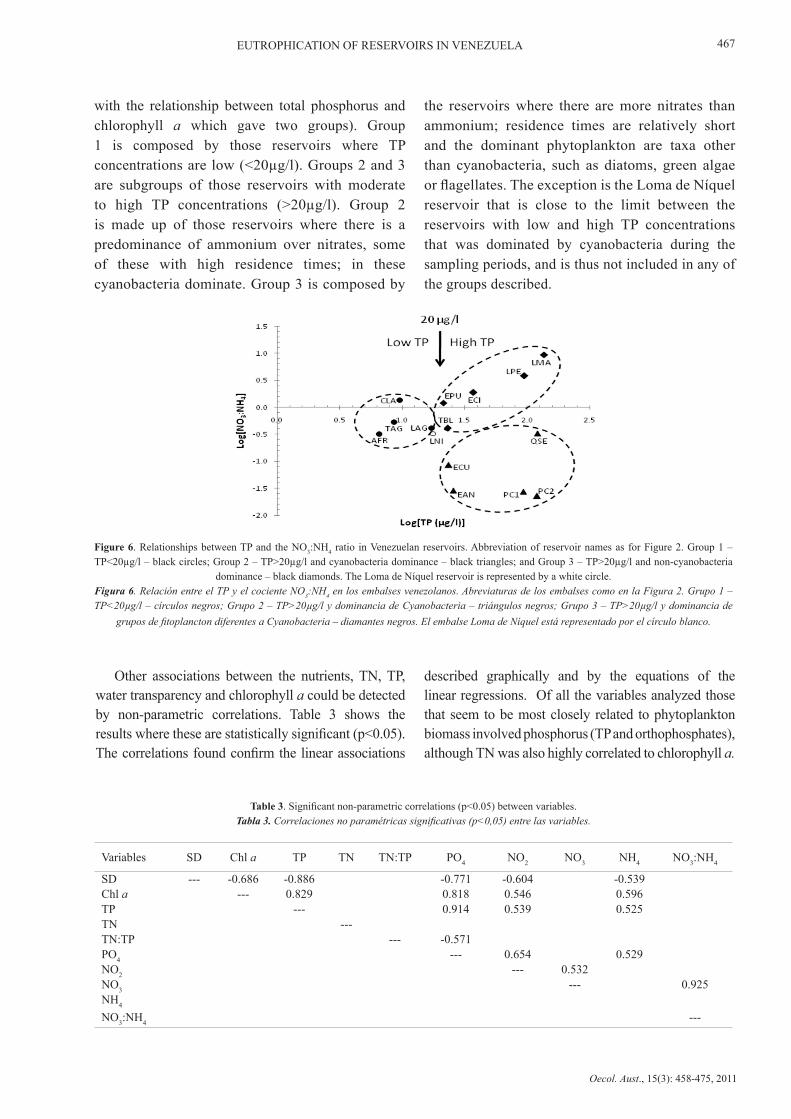
We also explored the empirical relationship between the TN:TP ratio (based on weight) and the total concentrations of phosphorus in the reservoirs. From Figure 5 it can be seen that as TP concentrations increase, the TN:TP ratio decreases. Furthermore, in reservoirs with low to moderate total phosphorus
concentrations the data show a high degree of dispersion, giving a relatively low but significant (p<0.05) linear regression coefficient (R2 adj.= 0.238). In contrast, data dispersion at high TP concentrations is considerably lower. The TN:TP ratio for all the reservoirs studied was always greater than 9.
Figure 5. Relationships between TP and TN:TP ratio in Venezuelan reservoirs. Abbreviation of reservoir names as for Figure 2.Figura 5. Relación entre el P total y el cociente TN:TP en los embalses venezolanos. Abreviaturas de los embalses como en la Figura 2.
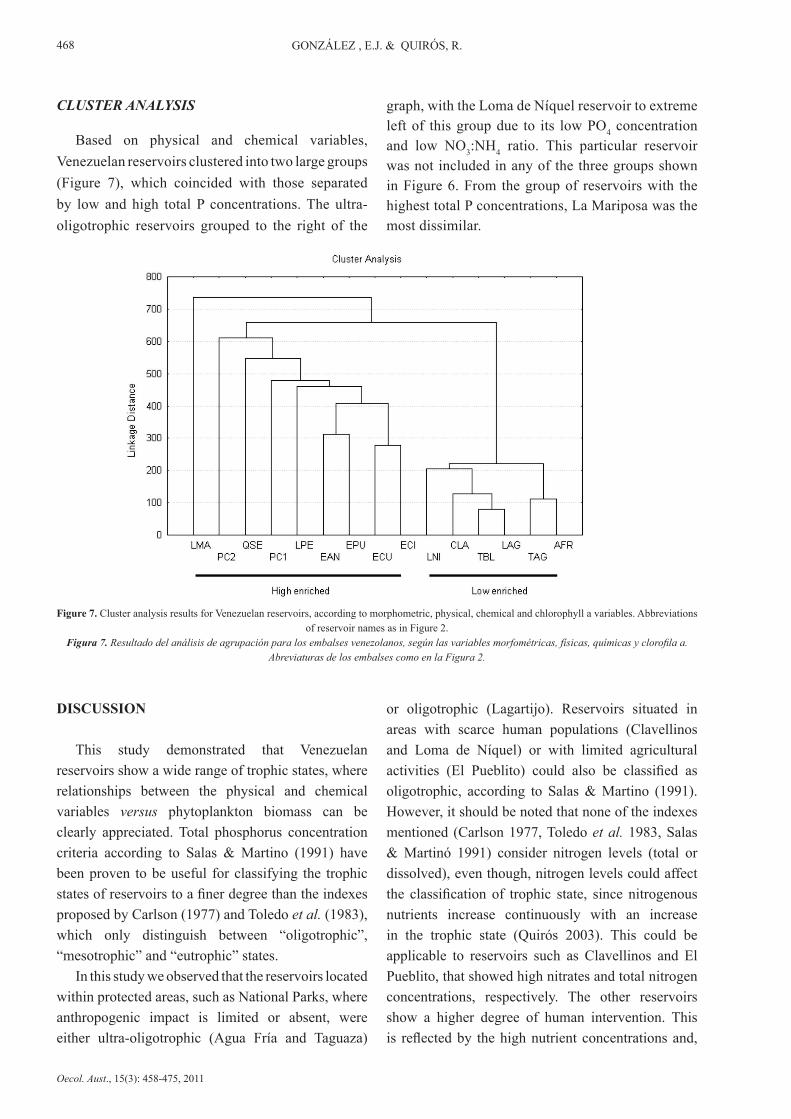
Investigation into other empirical relationships permitted the extraction of valuable information, in spite of there being no apparent association between the variables measured. At first sight, there
is no correlation between total phosphorus and the nitrates:ammonium (NO3:NH4) ratio, and the data seems widely dispersed (Figure 6). However, a closer look reveals three groups of reservoirs (compare
EUTROPHICATION OF RESERVOIRS IN VENEZUELA
Oecol. Aust., 15(3): 458-475, 2011
467
with the relationship between total phosphorus and chlorophyll a which gave two groups). Group 1 is composed by those reservoirs where TP concentrations are low (<20µg/l). Groups 2 and 3 are subgroups of those reservoirs with moderate to high TP concentrations (>20µg/l). Group 2 is made up of those reservoirs where there is a predominance of ammonium over nitrates, some of these with high residence times; in these cyanobacteria dominate. Group 3 is composed by
the reservoirs where there are more nitrates than ammonium; residence times are relatively short and the dominant phytoplankton are taxa other than cyanobacteria, such as diatoms, green algae or flagellates. The exception is the Loma de Níquel reservoir that is close to the limit between the reservoirs with low and high TP concentrations that was dominated by cyanobacteria during the sampling periods, and is thus not included in any of the groups described.
Figure 6. Relationships between TP and the NO3:NH4 ratio in Venezuelan reservoirs. Abbreviation of reservoir names as for Figure 2. Group 1 – TP<20µg/l – black circles; Group 2 – TP>20µg/l and cyanobacteria dominance – black triangles; and Group 3 – TP>20µg/l and non-cyanobacteria
dominance – black diamonds. The Loma de Níquel reservoir is represented by a white circle.Figura 6. Relación entre el TP y el cociente NO3:NH4 en los embalses venezolanos. Abreviaturas de los embalses como en la Figura 2. Grupo 1 – TP<20µg/l – círculos negros; Grupo 2 – TP>20µg/l y dominancia de Cyanobacteria – triángulos negros; Grupo 3 – TP>20µg/l y dominancia de
grupos de fitoplancton diferentes a Cyanobacteria – diamantes negros. El embalse Loma de Níquel está representado por el círculo blanco.
Other associations between the nutrients, TN, TP, water transparency and chlorophyll a could be detected by non-parametric correlations. Table 3 shows the results where these are statistically significant (p<0.05). The correlations found confirm the linear associations
Table 3. Significant non-parametric correlations (p<0.05) between variables.Tabla 3. Correlaciones no paramétricas significativas (p<0,05) entre las variables.
described graphically and by the equations of the linear regressions. Of all the variables analyzed those that seem to be most closely related to phytoplankton biomass involved phosphorus (TP and orthophosphates), although TN was also highly correlated to chlorophyll a.
Variables SD Chl a TP TN TN:TP PO4 NO2 NO3 NH4 NO3:NH4
SD --- -0.686 -0.886 -0.771 -0.604 -0.539Chl a --- 0.829 0.818 0.546 0.596TP --- 0.914 0.539 0.525TN ---TN:TP --- -0.571PO4 --- 0.654 0.529NO2 --- 0.532NO3 --- 0.925NH4
NO3:NH4 ---
González , e.j. & Quirós, r.
Oecol. Aust., 15(3): 458-475, 2011
468
CLUSTER ANALYSIS
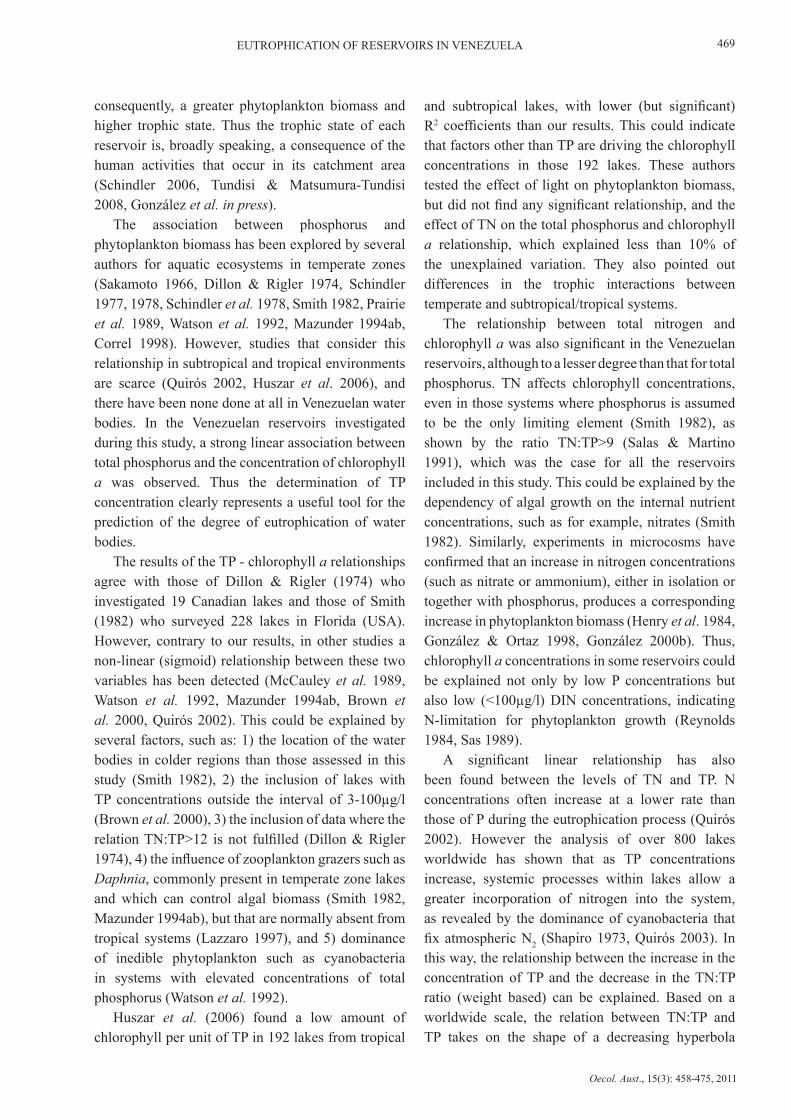
Based on physical and chemical variables, Venezuelan reservoirs clustered into two large groups (Figure 7), which coincided with those separated by low and high total P concentrations. The ultra-oligotrophic reservoirs grouped to the right of the
graph, with the Loma de Níquel reservoir to extreme left of this group due to its low PO4 concentration and low NO3:NH4 ratio. This particular reservoir was not included in any of the three groups shown in Figure 6. From the group of reservoirs with the highest total P concentrations, La Mariposa was the most dissimilar.
Figure 7. Cluster analysis results for Venezuelan reservoirs, according to morphometric, physical, chemical and chlorophyll a variables. Abbreviations of reservoir names as in Figure 2.
Figura 7. Resultado del análisis de agrupación para los embalses venezolanos, según las variables morfométricas, físicas, químicas y clorofila a. Abreviaturas de los embalses como en la Figura 2.
DISCUSSION
This study demonstrated that Venezuelan reservoirs show a wide range of trophic states, where relationships between the physical and chemical variables versus phytoplankton biomass can be clearly appreciated. Total phosphorus concentration criteria according to Salas & Martino (1991) have been proven to be useful for classifying the trophic states of reservoirs to a finer degree than the indexes proposed by Carlson (1977) and Toledo et al. (1983), which only distinguish between “oligotrophic”, “mesotrophic” and “eutrophic” states.
In this study we observed that the reservoirs located within protected areas, such as National Parks, where anthropogenic impact is limited or absent, were either ultra-oligotrophic (Agua Fría and Taguaza)
or oligotrophic (Lagartijo). Reservoirs situated in areas with scarce human populations (Clavellinos and Loma de Níquel) or with limited agricultural activities (El Pueblito) could also be classified as oligotrophic, according to Salas & Martino (1991). However, it should be noted that none of the indexes mentioned (Carlson 1977, Toledo et al. 1983, Salas & Martinó 1991) consider nitrogen levels (total or dissolved), even though, nitrogen levels could affect the classification of trophic state, since nitrogenous nutrients increase continuously with an increase in the trophic state (Quirós 2003). This could be applicable to reservoirs such as Clavellinos and El Pueblito, that showed high nitrates and total nitrogen concentrations, respectively. The other reservoirs show a higher degree of human intervention. This is reflected by the high nutrient concentrations and,
EUTROPHICATION OF RESERVOIRS IN VENEZUELA
Oecol. Aust., 15(3): 458-475, 2011
469
consequently, a greater phytoplankton biomass and higher trophic state. Thus the trophic state of each reservoir is, broadly speaking, a consequence of the human activities that occur in its catchment area (Schindler 2006, Tundisi & Matsumura-Tundisi 2008, González et al. in press).
The association between phosphorus and phytoplankton biomass has been explored by several authors for aquatic ecosystems in temperate zones (Sakamoto 1966, Dillon & Rigler 1974, Schindler 1977, 1978, Schindler et al. 1978, Smith 1982, Prairie et al. 1989, Watson et al. 1992, Mazunder 1994ab, Correl 1998). However, studies that consider this relationship in subtropical and tropical environments are scarce (Quirós 2002, Huszar et al. 2006), and there have been none done at all in Venezuelan water bodies. In the Venezuelan reservoirs investigated during this study, a strong linear association between total phosphorus and the concentration of chlorophyll a was observed. Thus the determination of TP concentration clearly represents a useful tool for the prediction of the degree of eutrophication of water bodies.
The results of the TP - chlorophyll a relationships agree with those of Dillon & Rigler (1974) who investigated 19 Canadian lakes and those of Smith (1982) who surveyed 228 lakes in Florida (USA). However, contrary to our results, in other studies a non-linear (sigmoid) relationship between these two variables has been detected (McCauley et al. 1989, Watson et al. 1992, Mazunder 1994ab, Brown et al. 2000, Quirós 2002). This could be explained by several factors, such as: 1) the location of the water bodies in colder regions than those assessed in this study (Smith 1982), 2) the inclusion of lakes with TP concentrations outside the interval of 3-100µg/l (Brown et al. 2000), 3) the inclusion of data where the relation TN:TP>12 is not fulfilled (Dillon & Rigler 1974), 4) the influence of zooplankton grazers such as Daphnia, commonly present in temperate zone lakes and which can control algal biomass (Smith 1982, Mazunder 1994ab), but that are normally absent from tropical systems (Lazzaro 1997), and 5) dominance of inedible phytoplankton such as cyanobacteria in systems with elevated concentrations of total phosphorus (Watson et al. 1992).
Huszar et al. (2006) found a low amount of chlorophyll per unit of TP in 192 lakes from tropical
and subtropical lakes, with lower (but significant) R2 coefficients than our results. This could indicate that factors other than TP are driving the chlorophyll concentrations in those 192 lakes. These authors tested the effect of light on phytoplankton biomass, but did not find any significant relationship, and the effect of TN on the total phosphorus and chlorophyll a relationship, which explained less than 10% of the unexplained variation. They also pointed out differences in the trophic interactions between temperate and subtropical/tropical systems.
The relationship between total nitrogen and chlorophyll a was also significant in the Venezuelan reservoirs, although to a lesser degree than that for total phosphorus. TN affects chlorophyll concentrations, even in those systems where phosphorus is assumed to be the only limiting element (Smith 1982), as shown by the ratio TN:TP>9 (Salas & Martino 1991), which was the case for all the reservoirs included in this study. This could be explained by the dependency of algal growth on the internal nutrient concentrations, such as for example, nitrates (Smith 1982). Similarly, experiments in microcosms have confirmed that an increase in nitrogen concentrations (such as nitrate or ammonium), either in isolation or together with phosphorus, produces a corresponding increase in phytoplankton biomass (Henry et al. 1984, González & Ortaz 1998, González 2000b). Thus, chlorophyll a concentrations in some reservoirs could be explained not only by low P concentrations but also low (<100µg/l) DIN concentrations, indicating N-limitation for phytoplankton growth (Reynolds 1984, Sas 1989).
A significant linear relationship has also been found between the levels of TN and TP. N concentrations often increase at a lower rate than those of P during the eutrophication process (Quirós 2002). However the analysis of over 800 lakes worldwide has shown that as TP concentrations increase, systemic processes within lakes allow a greater incorporation of nitrogen into the system, as revealed by the dominance of cyanobacteria that fix atmospheric N2 (Shapiro 1973, Quirós 2003). In this way, the relationship between the increase in the concentration of TP and the decrease in the TN:TP ratio (weight based) can be explained. Based on a worldwide scale, the relation between TN:TP and TP takes on the shape of a decreasing hyperbola
González , e.j. & Quirós, r.
Oecol. Aust., 15(3): 458-475, 2011
470
(Quirós 2002): the TN:TP ratio decreases abruptly when TP varies between 1 and 8-10µg/l, declines more gradually at TP concentrations of between 10 and 25µg/l and tends to stabilize at TN:TP values of between 6 and 10 at higher TP concentrations. This would explain the lower dispersion of the data at higher TP concentrations in Venezuelan reservoirs (see Figure 5).
The Venezuelan reservoirs studied grouped according to the association between the phosphorus content and the NO3:NH4 ratio, which also controls which phytoplankton group will be dominant in each water body (Blomqvist et al., 1994; Quirós 2003). According to Correl (1998), when TP concentrations increase beyond 20µg/l, problems related to eutrophication often start to appear. This value marks the delimitation of the groups of reservoirs in most of the empirical analyses (graphs) in this study, as well as the differences that determine the dominant phytoplankton group. In addition, in highly enriched Venezuelan water bodies (high PO4 and TP concentrations), it can be noted that at a NO3:NH4 ratio of less than 0.3, Cyanobacteria became dominant, and genera such as Cylindrospermopsis, Merismopedia, Lyngbya and Oscillatoria, increased their numbers.
During the thermal stratification period in the reservoirs, those with a higher trophic state develop anoxic conditions in the hypolimnion, favoring the presence of reduced substances such as orthophosphates and ammonium, as products of the release of sediments and the decomposition of organic material, respectively (Horne & Goldman 1994, Wetzel 2001). With an increase in nutrient concentrations, the relative abundance of the cyanobacteria also increases, while the importance of other phytoplankton groups declines (Pizzolon 1996, Watson et al. 1997). Thus, under eutrophic conditions and a stable water column, cyanobacteria dominate (Reynolds 1984, De León & Chalar 2003, Becker & Motta Marques 2004). Cyanobacteria dominate in eutrophic lakes, amongst other reasons, due to their ability to fix atmospheric nitrogen when the TN:TP ratio is low, by monopolizing ammonium as a source of nitrogen and by shading out other algae (Shapiro 1973, Quirós 2003, Ferber et al. 2004). In contrast, low TP concentrations and the predominance of oxidized forms of nitrogen and unstable water columns (for example, those with short residence times), favor
other phytoplankton groups, as noted for Agua Fría, Taguaza, Lagartijo and Clavellinos reservoirs, where green algae and diatoms were the dominant groups. In the case of the Loma de Níquel reservoir that does not seem to conform to any of the three reservoir clusters, the apparent stability of the water column allowed cyanobacteria to dominate in spite of relatively low TP concentrations. Furthermore, this water body also showed low DIN concentration, which could promote the proliferation of cyanobacteria, as registered for some lakes (Huszar & Caraco 1998).
The high R2 values and correlations found for Venezuelan reservoirs are consistent with those expected during the eutrophication process, which affects water clarity. The rise in nutrient concentrations produces conditions that promote an increase in biological productivity in general (Wetzel 2001). Thus, an increase in N and P concentrations leads to an increase in phytoplankton biomass and a decrease in water transparency.
The cluster analysis separated the reservoirs into two large groups, although differences could be observed within each of them. The clusters coincided with the two groups separated empirically: low and high phosphorus concentrations with the limit between the groups defined as being around 20µg/l, following Correl (1998). In group 1, TP concentrations were less than or close to 20µg/l. This group is composed, broadly speaking, by the ultra-oligotrophic reservoirs at one extreme and reservoirs classified as oligotrophic or oligo-mesotrophic with low TP concentrations and low to moderate nitrogen concentrations (dissolved or total) (Lagartijo, Clavellinos and Loma de Níquel). The Loma de Níquel reservoir was at the limit of this group, as for the grouping pattern related to the NO3:NH4 ratio. Tierra Blanca was the only group 1 reservoir with concentrations of TP>20µg/l, but concentrations of orthophosphates were very low (<3µg/l), which explains its association with this group. Group 2 includes reservoirs with moderate to high phosphorus concentrations (TP >20µg/l) and is made up of the rest of the reservoirs, which were classified as oligo-mesotrophic to hypertrophic. Thus, cluster analysis separated the more eutrophicated reservoirs at the extreme furthest from the oligotrophic reservoirs. Furthermore, it should be noted that the two wings of the Pao-Cachinche reservoir were never found
EUTROPHICATION OF RESERVOIRS IN VENEZUELA
Oecol. Aust., 15(3): 458-475, 2011
471
together in the analyses although they were always close to each other. The eastern wing (PC2), which did not have either water entering or leaving the reservoir and thus no water renewal, showed a higher degree of eutrophication than the western wing where both the water outlet and inlet are located.
From both the empirical and statistical analyses, it seems clear that for the Venezuelan reservoirs included in this study that fulfill the conditions of thermal stratification and with ratios of TN:TP>12, phosphorus is the most important element for determining trophic state. Problems associated with eutrophication could start to show at concentrations over 20µg/l, even when the effects of nitrogen (dissolved or total) are not taken into account. These results agree with Carpenter (2008) and Schindler et al. (2008), who stated that the focus of management must be on decreasing inputs of phosphorus to reduce eutrophication.
In addition, the NO3:NH4 ratio could also permit the differentiation of subgroups of reservoirs, according to the dominance or not, of cyanobacteria. This ratio is closely linked to the trophic state of water bodies and thus, in general, to the TN:TP ratio (Quirós 2003).
The strong linear relationships between nutrients and phytoplankton biomass provide useful tools for predicting the trophic states of reservoirs, and should thus be incorporated as factors for the management of Venezuelan reservoirs. As for other aquatic ecosystems worldwide, the increase in N and P concentrations produces a corresponding increase in aquatic productivity. Thus, in order to control or mitigate the effects of eutrophication the management of water bodies should be based on the management of the drainage basin, as noted by Kosten et al. (2009). This management should include: a) the protection of catchment areas and the application of policies regulating anthropogenic activity within them, b) the establishment of regulatory measures that properly control waste discharge, nutrients and organic loads, and c) permanent monitoring of water quality in reservoirs and their tributaries (Straskraba & Tundisi 2000, Schindler 2006, Tundisi & Matsumura-Tundisi 2008, González et al., in press).
ACKNOWLEDGEMENTS: This study was supported by the Organization of American States, Fondo Nacional de Ciencia y Tecnología,
Consejo de Desarrollo Científico y Humanístico – UCV, The hydrological Companies HIDROVEN, HIDROCAPITAL, HIDROCENTRO, HIDROCARIBE and HIDROPAEZ, Ministerio del Ambiente. The authors would also like to thank Mario Ortaz and Carlos Peñaherrera for field and laboratory assistance. We also thank Coordinación de Investigación - Ciencias - UCV. Two anonymous reviewers also helped in improving the manuscript.
In Memorian: Rolando Quirós, who worked on the initial version of this manuscript.
REFERENCES
ANTONIADES, D.; MICHELUTTI, N.; QUINLAN, R.; BLAIS,
J.M.; BONILLA, S.; DOUGLAS, M.S.V.; PIENITZ, R.; SMOL,
J.P. & VINCENT, W.F. 2011. Cultural eutrophication, anoxia,
and ecosystem recovery in Meretta Lake, High Arctic Canada.
Limnology and Oceanography, 56: 639-650.
BECKER, D. & MOTTA MARQUES, D. 2004. Water dynamics,
phytoplankton biomass and size structure of a shallow freshwater
subtropical lake (Itapeva Lake, south of Brazil). Acta Limnologica
Brasiliensia, 16: 163-174.
BLOMQVIST, D.O.; PETTERSSON, A. & HYENSTRAND,
P. 1994. Ammoniun-nitrogen: A key regulatory factor causing
dominance of non-nitrogen-fixing Cyanobacteria in aquatic
systems. Archiv für Hydrobiologie, 132: 141-164.
BRANCO, S.M. 1984. Limnología sanitaria, estudio de la
polución de aguas continentales. Secretaría General de la
Organización de los Estados Americanos. Serie de Biología.
Monografía, 28. Washington, D.C. 120p.
BROWN, C.D.; HOYER, M.V.; BACHMAN, R.W. &
CANFIELD, D.E. 2000. Nutrient-chlorophyll relationships: An
evaluation of empirical nutrient-chlorophyll models using Florida
and North-temperate lake data. Canadian Journal of Fisheries
and Aquatic Sciences, 57: 1574-1583.
CARLSON, R.E. 1977. A trophic state index for lakes. Limnology
and Oceanography, 22: 361-369.
CARPENTER, S.R. 2008. Phosphorus control is critical to
mitigating eutrophication. Proceedings of the National Academy
of Sciences, 105: 11039-11040.
COLE, G.A. 1994. Textbook of Limnology. 4th Edition. Long
Grove. 412p.
CORREL, D.L. 1998. The role of phosphorus in the eutrophication
of receiving waters: A review. Journal of Environmental Quality,
27: 261-266.
González , e.j. & Quirós, r.
Oecol. Aust., 15(3): 458-475, 2011
472
DE LEÓN, L. & CHALAR, G. 2003. Abundancia y diversidad
del fitoplancton en el embalse de Salto Grande (Argentina -
Uruguay). Ciclo estacional y distribución espacial. Limnetica,
22: 103-113.
DILLON, P.J. & RIGLER, F.H. 1974. The phosphorus-
chlorophyll relationship in lakes. Limnology and Oceanography,
19: 767-773.
FERBER, L.R.; LEVINE, S.N.; LINI, A. & LIVINGSTON, G.P.
2004. Do cyanobacteria dominate in eutrophic lakes because they
fix atmospheric nitrogen? Freshwater Biology, 49: 690-708.
GONZÁLEZ, E.J. 2000a. Caracterización limnológica del embalse
El Pueblito (Estado Guárico, Venezuela). Trabajo de Ascenso a la
Categoría de Profesor Agregado. Monograph. Universidad Central
de Venezuela. Caracas, Venezuela. 85p.
GONZÁLEZ, E.J. 2000b. Nutrient enrichment and zooplankton
effects on the phytoplankton community in microcosms from El
Andino reservoir (Venezuela). Hydrobiologia, 434: 81-96.
GONZÁLEZ, E.J. 2006. Caracterización limnológica de los
embalses Agua Fría (Estado Miranda) y Tierra Blanca (Estado
Guárico). Informe final del Proyecto S1 - 98001361. Technical
Report. Fondo Nacional de Ciencia y Tecnología. Universidad
Central de Venezuela. Caracas, Venezuela. 210p.
GONZÁLEZ, E.J. 2008. Eutrofización de embalses en Venezuela.
Memorias del Instituto de Biología Experimental, 5: 169-172.
GONZÁLEZ, E.J. & ORTAZ, M. 1998. Efectos del
enriquecimiento con N y P sobre la comunidad del fitoplancton en
microcosmos de un embalse tropical (La Mariposa, Venezuela).
Revista de Biología Tropical, 46: 27-34.
GONZÁLEZ, E.J.; ORTAZ, M.; MANDUCA, J.;
PEÑAHERRERA, C. & GONZÁLEZ, R. 1999. Evaluación de
la potencialidad para el cultivo de peces en el embalse Loma de
Níquel. Technical Report. Hidroimpacto C.A. Geoespecialistas.
Universidad Central de Venezuela. Caracas, Venezuela. 72p.
GONZÁLEZ, E.J.; ORTAZ, M.; MATOS, M.L.; MENDOZA,
J.; PEÑAHERRERA, C. & CARRILLO, V. 2002. Zooplancton
de dos embalses neotropicales con distintos estados tróficos.
Interciencia, 27: 551-558.
GONZÁLEZ, E.J.; ORTAZ, M.; PEÑAHERRERA, C.; MONTES,
E.; MATOS, M.L. & MENDOZA, J. 2003. Fitoplancton de cinco
embalses de Venezuela con diferentes estados tróficos. Limnetica,
22: 15-35.
GONZÁLEZ, E.J.; CARRILLO, V. & PEÑAHERRERA, C.
2004a. Características físicas y químicas del embalse Agua Fría
(Parque Nacional Macarao, Estado Miranda, Venezuela). Acta
Científica Venezolana, 55: 225-236.
GONZÁLEZ, E.J.; ORTAZ, M.; PEÑAHERRERA, C. &
INFANTE, A. 2004b. Physical and chemical features of a tropical
hypertrophic reservoir permanently stratified. Hydrobiologia,
522: 301-310.
GONZÁLEZ, E.J.; ÁLVAREZ, M.; BARRERO, M. & FINOL,
H. 2009. Limnología y efecto de los impactos antrópicos sobre los
peces de interés comercial del embalse de Suata (Estado Aragua)
y del Lago de Valencia (Estados Aragua y Carabobo). Technical
Report. Etapa I del Proyecto de Grupo PG 03.00.6495.2006.
Consejo de Desarrollo Científico y Humanístico, Universidad
Central de Venezuela. Caracas, Venezuela.
GONZÁLEZ, E.J.; MATOS, M.L. & ORTAZ, M. Management
and general problems of ten reservoirs in North – Central
Venezuela. Interacademy Panel Water Programme Regional
Workshop for the Americas. (in press).
HAMMER, Ø.; HARPER, D.A.T. & RYAN, P.D. 2001. PAST:
Paleontological Statistics software package for education and
data analysis. Paleontologia Electronica, 4: 1-9.
HARPER, D. 1992. Eutrophication of freshwaters. Principles,
problems and restoration. Chapman & Hall. London. 327p.
HENRY, R.; TUNDISI, J.G. & CURI, P.R. 1984. Effects of
phosphorus and nitrogen enrichment on the phytoplankton in a
tropical reservoir (Lobo Reservoir, Brazil). Hydrobiologia, 118:
177-185.
HORNE, A.J. & GOLDMAN, C.R. 1994. Limnology. 2nd edition.
McGraw-Hill. New York. 576p.
HUSZAR, V.L.M. & CARACO, N.F. 1998. The relationship
between phytoplankton composition and physical-chemical
variables: A comparison of taxonomic and morphological-
functional descriptors in six temperate lakes. Freshwater Biology,
40: 675-696.
HUSZAR, V.L.M.; CARACO, N.F.; ROLAND, F. & COLE, J.
2006. Nutrient-chlorophyll relationships in tropical-subtropical
lakes: Do temperate model fit? Biogeochemistry, 79: 239-250.
HUTCHINSON, G.E. 1957. A treatise on Limnology. 1.
Geography, Physics, and Chemistry. Wiley & Sons, New York.
1015p.
EUTROPHICATION OF RESERVOIRS IN VENEZUELA
Oecol. Aust., 15(3): 458-475, 2011
473
INFANTE, A.; INFANTE, O. & VEGAS, T. 1992. Caracterización
limnológica de los embalses Camatagua, Guanapito y Lagartijo,
Venezuela. Proyecto Multinacional de Medio Ambiente y
Recursos Naturales. Technical Report. Organización de los
Estados Americanos, Universidad Central de Venezuela. Caracas,
Venezuela.
INFANTE, A.; INFANTE, O. & GONZÁLEZ, E.J. 1995.
Caracterización limnológica de los embalses El Cují y El
Andino, Venezuela. Proyecto Multinacional de Medio Ambiente
y Recursos Naturales. Technical Report. Organización de los
Estados Americanos, Universidad Central de Venezuela. Caracas,
Venezuela.
KOSTEN, S.; HUSZAR, V.L.M.; MAZZEO, N.; SCHEFFER,
M.; STERNBERG, L.S.L. & JEPPESEN, E. 2009. Lake and
watershed characteristics rather than climate influence nutrient
limitation in shallow lakes. Ecological Applications, 19: 1791-
1804.
LAZZARO, X. 1997. Do the trophic cascade hypothesis and
classical biomanipulation approaches apply to tropical lakes
and reservoirs? Verhandlungen Internationale Vereinigung für
Theoretische und Angewandte Limnologie, 26: 719-730.
LEWIS, W.M. 1983. A revised classification of lakes based on
mixing. Canadian Journal of Fisheries and Aquatic Sciences, 40:
1779-1787.
MATSUMURA-TUNDISI, T.; HINO, K. & CLARO, S.M. 1981.
Limnological studies at 23 reservoirs in southern part of Brazil.
Verhandlungen Internationale Vereinigung für Theoretische und
Angewandte Limnologie, 21: 1040-1047.
MAZUNDER, A. 1994a. Phosphorus-chlorophyll relationships
under contrasting herbivory and termal stratification: Predictions
and patterns. Canadian Journal of Fisheries and Aquatic
Sciences, 51: 390-400.
MAZUNDER, A. 1994b. Phosphorus-chlorophyll relationships
under contrasting zooplankton community structure: Potential
mechanisms. Canadian Journal of Fisheries and Aquatic
Sciences, 51: 401-407.
McCAULEY, E.; DOWNING, J.A. & WATSON, S. 1989.
Sigmoid relationships between nutrients and chlorophyll among
lakes. Canadian Journal of Fisheries and Aquatic Sciences, 46:
1171-1175.
MERAYO, S. & GONZÁLEZ, E.J. 2010. Variaciones de
abundancia y biomasa del zooplancton en un embalse tropical
oligo-mesotrófico del norte de Venezuela. Revista de Biología
Tropical, 58: 603-619.
MINAMB. 2007. Rehabilitación de presas a nivel nacional.
Organización para la rehabilitación y mantenimiento de embalses.
Ministerio del Poder Popular para el Ambiente (MINAMB).
Technical Report. Serie de Informes Técnicos, DGEA/IT/864.
No. X-002/P-129/02 . Caracas, Venezuela.
MURPHY, J. & RILEY, J.P. 1962. A modified single solution
method for the determination of phosphate in natural waters.
Analytica Chimica Acta, 27: 26-30.
NUSCH, E.A. & PALME, G. 1975. Biologische methoden für der
praxis der gewässeruntersuchung, bestimmung des chlorophyll-a
und phaeopigment-gehaltes in oberflachenwäser. GWF-Wasser/
Abwässer, 116: 562-565.
ORTAZ, M.; GONZÁLEZ, E.J.; MANDUCA, J.;
PEÑAHERRERA, C. & MONTES, E. 1999. Características
limnológicas de los embalses La Pereza, Lagartijo, La Mariposa y
Quebrada Seca y preservación del zooplancton como controlador
de microalgas, mediante técnicas de biomanipulación. Technical
Report. Hidroimpacto C.A., Hidrocapital, Universidad Central de
Venezuela. Caracas, Venezuela. 247p.
PIZZOLON, L. 1996. Importancia de las cianobacterias como
factor de toxicidad en las aguas continentales. Interciencia, 21:
239-245.
PRAIRIE, Y.T.; DUARTE, C.M. & KALFF, J. 1989. Unifying
nutrient-chlorophyll relationships in lakes. Canadian Journal of
Fisheries and Aquatic Sciences, 46:1176-1182.
PÜTZ, K. & BENNDORF, J. 1998. The importance of pre-
reservoirs for the control of eutrophication of reservoirs. Water
Science and Technology, 37: 317-324.
QUIRÓS, R. 1988. Relationships between air temperature,
depth, nutrients and chlorophyll in 103 Argentinian lakes.
Verhandlungen Internationale Vereinigung für Theoretische und
Angewandte Limnologie, 23: 647-658.
QUIRÓS, R. 1998. Trophic cascade effects in a continuous
series of temperate-subtropical water bodies. Verhandlungen
Internationale Vereinigung für Theoretische und Angewandte
Limnologie, 26: 2315-2319.
QUIRÓS, R. 2002. The nitrogen to phosphorus ratio for lakes:
A cause or a consequence of aquatic biology? Pp. 11-26. In:
A. Fernández-Cirelli y G. Chalar-Marquisá (eds.). El agua en
González , e.j. & Quirós, r.
Oecol. Aust., 15(3): 458-475, 2011
474
Iberoamérica. De la Limnología a la Gestión en Sudamérica.
Programa Iberoamericano de Ciencia y Tecnología para el
Desarrollo, CYTED XVII. Aprovechamiento y Gestión de
Recursos Hídricos; Centro de Estudios Transdisciplinarios del
Agua; Facultad de Ciencias Veterinarias de la Universidad de
Buenos Aires. Buenos Aires, Argentina. 172p.
QUIRÓS, R. 2003. The relationship between nitrate and ammonia
concentrations in the pelagic zone of lakes. Limnetica, 22: 37-50.
REYNOLDS, C.S. 1984. The ecology of freshwater phytoplankton.
Cambridge University Press. Cambridge. 384p.
RHODE, W. 1969. Crystallization of eutrophication concepts
in Northern Europe. Pp. 50-64. In: Eutrophication: Causes,
consequences, and correctives. National Academy of Science.
Washington, USA. 661p.
ROCHA, A.A. & BRANCO, S.M. 1986. A eutrofização e suas
implicações na ciclagem de nutrientes. Acta Limnologica
Brasiliensia, 1: 201-242.
RYDING, S.O. & RAST, W. 1992. El control de la eutroficación
en lagos y pantanos. Ediciones Pirámide S.A. Unesco. Madrid.
385p.
SAKAMOTO, M. 1966. Primary production by phytoplankton
community in some Japanese lakes and its dependence on lake
depth. Archiv für Hydrobiologie, 62: l-28.
SALAS, H. & MARTINO, P. 1991. A simplified phosphorus
trophic state model for warm-water tropical lakes. Water
Research, 25: 341-350.
SCHINDLER, D.W. 1977. Evolution of phosphorus limitation in
lakes. Science, 195: 260-262.
SCHINDLER, D.W. 1978. Factors regulating phytoplankton
production and standing crop in the world’s freshwaters.
Limnology and Oceanography, 23: 478-486.
SCHINDLER, D.W. 2006. Eutrophication of freshwater and
marine ecosystems. Limnology and Oceanography, 51(1, part 2):
351-355.
SCHINDLER, D.W.; FEE, E.J. & RUSZCZYNSKI, T. 1978.
Phosphorus input and its consequences for phytoplankton
standing crop and production in the Experimental Lakes Area
and similar lakes. Journal of the Fisheries and Research Board of
Canada, 35: 190-195.
SCHINDLER, D.W.; HECKY, R.E.; FINDLAY, D.L.;
STAINTON, M.P.; PARKER, B.R.; PATERSON, M.J.; BEATY,
K.G.; LYNG, M. & KASIAN, S.E.M. 2008. Eutrophication of
lakes cannot be controlled by reducing nitrogen input: Results
of 37-year whole-ecosystem experiment. Proceedings of the
National Academy of Sciences, 105: 11254-111258.
SHAPIRO, J. 1973. Blue-green algae: Why they become
dominant. Science, 179: 382-384.
SMITH, V.H. 1982. The nitrogen and phosphorus dependence
of algal biomass in lakes: An empirical and theoretical analysis.
Limnology and Oceanography, 27: 1101-1112.
SMITH, V.H.; TILMAN, G.D. & NEKOLA, J.C. 1999.
Eutrophication: Impacts of excess nutrient inputs on freshwater,
marine, and terrestrial ecosystems. Environmental Pollution, 100:
179-196.
SMITH, V.H. & SCHINDLER, D.W. 2009. Eutrophication
science: Where do we go from here? Trends in Ecology and
Evolution, 24: 201-207.
SOLÓRZANO, L. 1969. Determination of ammonia in natural
waters by the phenolhypochlorite method. Limnology and
Oceanography, 14: 799-801.
STRAŠKRABA, M. & TUNDISI, J.G. 2000. Diretrizes para
o gerenciamento de lagos. Vol. 9. Gerenciamento da qualidade
da água de represas. International Lake Environment Committe,
Instituto Internacional de Ecologia. Rima Artes e Textos. São
Carlos. 258p.
STRICKLAND, J.D.H. & PARSONS, T.R. 1968. A practical
handbook of seawater analysis. Bulletin Fisheries Research
Board of Canada, 167. 331p.
TOLEDO Jr., A.P.; TALARICO, M.; CHINEZ, S.J. & AGUDO,
E.G. 1983. A aplicação de modelos simplificados para a avaliação
de processos de eutrofização em lagos e reservatórios tropicais.
Pp. 1-34. In: XII Congresso Brasileiro de Engenharia Sanitária.
Camboriú, SC, Brazil.
TUNDISI, J.G. & MATSUMURA-TUNDISI, T. 2008. Limnologia.
Oficina de Textos. São Paulo, SP. 632p.
VALDERRAMA, J.C. 1981. The simultaneous analysis of
total nitrogen and total phosphorus in natural waters. Marine
Chemistry, 10: 109-122.
WATSON, S.; McCAULEY, E. & DOWNING, J.A. 1992.
Sigmoid relationships between phosphorus, algal biomass, and
algal community structure. Canadian Journal of Fisheries and
Aquatic Sciences, 49: 2605-2610.
EUTROPHICATION OF RESERVOIRS IN VENEZUELA
Oecol. Aust., 15(3): 458-475, 2011
475
WATSON, S.; McCAULEY, E. & DOWNING, J.A. 1997. Patterns
in phytoplankton taxonomic composition across temperate lakes
of different nutrient status. Limnology and Oceanography, 42:
487-495.
WETZEL, R.G. 2001. Limnology. Lake and river ecosystems. 3rd
edition. San Diego. 1006p.
Submetido em 22/03/2011Aceito em 26/07/2011