Embed Size (px)
Citation preview
EV CITY CASEBOOK
AMSTERDAM
BARCELONA
BERLIN
BRABANTSTAD
GOTO ISLANDS, NAGASAKI
HAMBURG
HELSINKI
KANAGAWA
LOS ANGELES
NEW YORK CITY
NORTH EAST ENGLAND
PORTLAND
RESEARCH TRIANGLE, NC
ROTTERDAM
SHANGHAI
STOCKHOLM2012
A LOOK AT THE GLOBAL ELECTRIC VEHICLE MOVEMENT
EV CITY CASEBOOK // SECTION PG_01EV CITY CASEBOOK
����������� ��������������������������������������������������������������������� ��!�������"#�#�������$%$& �'�� �����(��%��"������)��*��+�!������� ���!�����,���"�� ���-�������.�!���������,�&����/������-��� ���������������������������������������������������0�1����������������2�3�����4��3������ ����'������ ������3�����������2�3���� ���������������3�������������+��� �����5�6��������!���������� �����������3���! ������3� ��2������� �1��*�����������������3����������1������7��3�!��������7������������ ���5����������� � 3�!���1�� ������8�������������5�43���2������� �1��*�� ��3���� !�����������1�������������������3���������������������������)��*��+�!������� ���!�����3�����������������������������������������0�1����������������2�3�����4��3������ ����'������ ���3�����������2�3���� ���������������3�������������+��� ������9�3��:���������� ;<�7��3� !������������=������� ���������� 3���7��3��3��������������������������5��������7 ��(��� �������3� ��2������� �1��*������������ �������>�����3�����7 ���������������������3������������ �����������3�����������!�����1�����!����� �����1�� ������������� 5�43���2������� �1��*���� �������� ���!�������� ����������������� ����?��� !����� ��!����5�43������������ ��*���������� �����������7��������(��� ������������������ ���������3���2������� �1��*@ �������� �9����!������ ����������� ������!���<���� 3�������1���� ��� �1����������! ����������������������3���2������� �1��*5�"����!��3������������������ ��������8�������������5�92A�&<
EV CITY CASEBOOK // TABLE OF CONTENTS
PG_04 B�������
PG_05 �2��!����*
PG_09 �� �����
PG_13 .������
PG_17 .�����
PG_21 .�1��-���
PG_25 C����� ��� ��6 *�
PG_29 0�1!�
PG_33 0�� ��*�
PG_37 D�7�'������!��
PG_41 E� ������ �
PG_45 6�7�F��*�����
PG_49 6���3�� �������
PG_53 '������
PG_57 )� ���3�4�������6�
PG_61 )��������
PG_65 -3�3�
PG_69 -���*3���
PG_73 ������1!���
PG_75 C�� ������4���
EV CITY CASEBOOK
PORTLAND
NEW YORK
CITY
NORTH EAST ENGLAND
AMSTERDAM
ROTTERDAM
BRABANTSTAD
BARCELONA
HELSINKI
STOCKHOLM
HAMBURG
BERLIN
KANAGAWA
PREFECTURE
GOTO ISLANDS
NAGASAKI
SHANGHAI
RESEARCH
TRIANGLE,
NC
LOS ANGELES
EV CITY CASEBOOK // WELCOME PG_04
���������������3���� �9�2 <�3�����3���
��������������� ��������3��7���3��
7��������� 5��2 ��������� ��������
��!�����1������� �������3���!�����(�
�������� ������������������
�������!���73����� �����!�����
��� ��� ��������3�! �� � ������3�������!��� 5�G! �� �
�����������2 ����!����*����������������������7��������
���! ���� ��3�� �!��H�1���7�3������3���������������� ���I
���5�0�7�������3��� ����������������2 �7������J!������� I
��������� � ��� ���1�������������������� �������3� ���7�
���3�����5�4������������3� ���� ������������ ����������������
����� ���!����3��7����������������2I������������ � ��� �
���1!�������3����!�����������7��� ������������5�
����������������������3���������������!�1���� �����3���
������!��������� ���I!����������������3���� ���3���2������
� �1��*���� ��� ������������� �� �!��� �������������������
�2������������������ ���!����3��7����5�43� ��� �� �!��� ����
���! ��������(���� ����3�7���������������� �������������
�3����!�������� ���*����2�����������5�43���������1��3��
J!�����������J!���������������������������� @��2��� ��
����� ��������� ����������� ������� �� ��������������5��
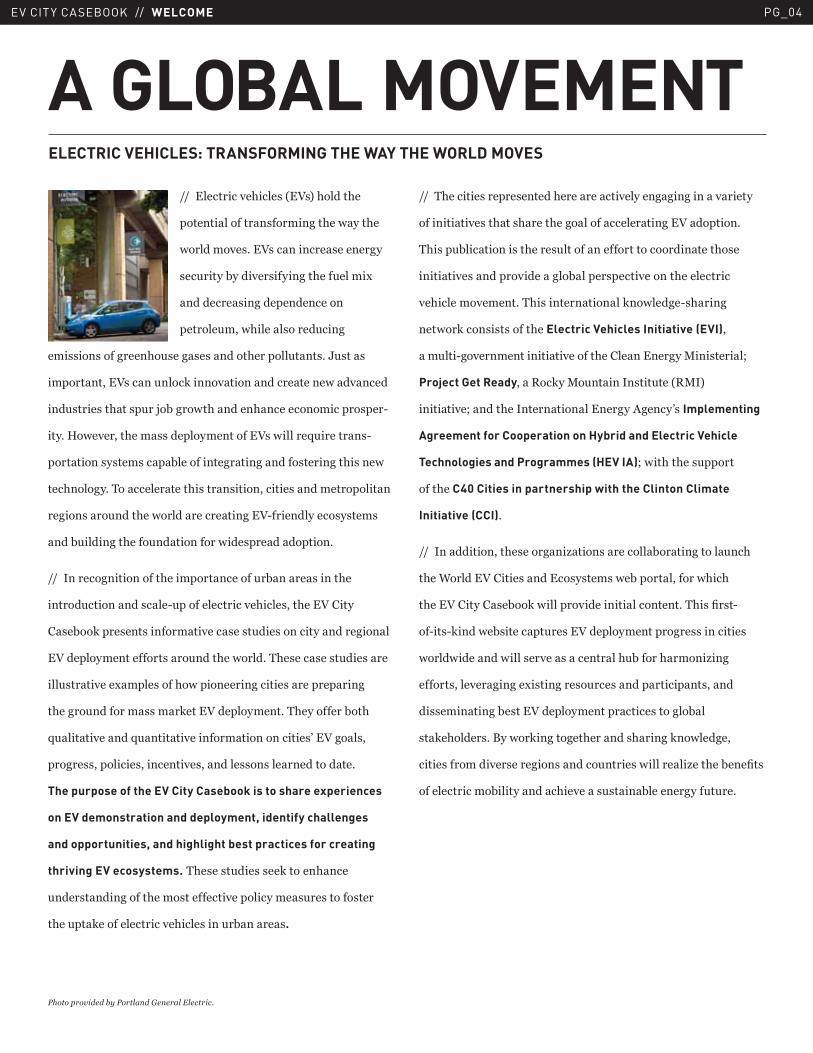
The purpose of the EV City Casebook is to share experiences
on EV demonstration and deployment, identify challenges
and opportunities, and highlight best practices for creating
thriving EV ecosystems. 43� �� �!��� � ��*������3����
!���� ����������3���� ��������������������� !�� ������ �����
�3��!��*����������������3���� ����!�1���� .
����43������� ������ ������3��������������������������������
������������ ��3�� 3����3�������������������2��������5�
43� ��!1��������� ��3���� !�����������������������������3� ���
��������� ���������������1����� ������������3������������
��3�������������5�43� �������������*��7����I 3�����
���7��*���� � � �����3��Electric Vehicles Initiative (EVI)��
��!���I������������������������3�������������+��� �����K�
Project Get Ready���)��*��+�!������� ���!���9)+�<�
���������K�����3�������������������������@ �Implementing
Agreement for Cooperation on Hybrid and Electric Vehicle
Technologies and Programmes (HEV IA)K�7��3��3�� !������
����3��C40 Cities in partnership with the Clinton Climate
Initiative (CCI)5�
�����������������3� ������L���� ��������1����������!��3�
�3��B������2������ ������� � ��� �7�1������������73��3��
�3���2������� �1��*�7��������������������������5�43� �?� �I�
��I�� I*����7�1 �������!�� ��2����������������� ��������� ��
7����7�������7���� ����� ���������3!1�����3�����L����
������ �����������(� ������ �!��� ������������� ������
�� ��������1� ���2������������������� ������1���
�*�3����� 5�.��7��*�������3������ 3����*��7�������
����� ����������� ������� ������!����� �7��������L���3��1���?� �
��������������1����������3������ ! ���1����������!�!��5
A GLOBAL MOVEMENTELECTRIC VEHICLES: TRANSFORMING THE WAY THE WORLD MOVES
���������������� ��������������������
EV CITY CASEBOOK // EV OUTLOOK PG_05
���������� ����� ������������!�������������(��������
���I?��3������1���������������! ���������J!������������
�����I���������1������(����9���<���� ��� ��7��3��������
3�������3� ����� ��� ���������������� �������3���� ��
M�N5�����3��1 ������ �����������3�������������������������@ �
9���<�������4��3������'�� ������� �������73��3� !�� ����
�H�������������������������� ����������!��������� ��(�������
�3����3����� ���* �����!������ !�������7������ �� �������������
�3����!1����1����%��M�NM�N5�43� � �������7�!�������� ���
������� ��� �����������3�3��������������������������
����� �!�7���!��� ���7� !����� ����1��!3�������*����
��������������!�� �1���������1��5�
�������3�!3�������������������3��������3������ �����!�� ��
���1��������������������������3���� ������ ������������3���
�� ������� ������3��������37� ������!���������! ������
�����������I*���������1 � 5�B��3������������������
���������������2 �����3�����%���� ������������*����������
7����1���7�����@ ��� ����?�������� ��73��3������1��7�����
��������%���� ������������*��������5������3�1��������������
��3���� �90�2 <��3������������!��� ���� �������������
*���������M�NM�N5
����43������3 �������������:�������;� �������������!����
������� ��� �������������������1��������!������7��
��� ������3���� �� !�3� ���!I���3�1���������������3���� �
9'0�2 <��1�����������������3���� �9.�2 <������!����������3���� �
9"�2 <5�����3� � ���������$���������'0�2 ����.�2 �����
�(����������1�� ����1�������������������1�������1����%����
� 3�7�����"�!�� ��������� �� �������!���������� ��� ��
1��������� �9C� <�1����%�������7��3� ������!��I���������
����������� ���������������������������1! ���������� 5
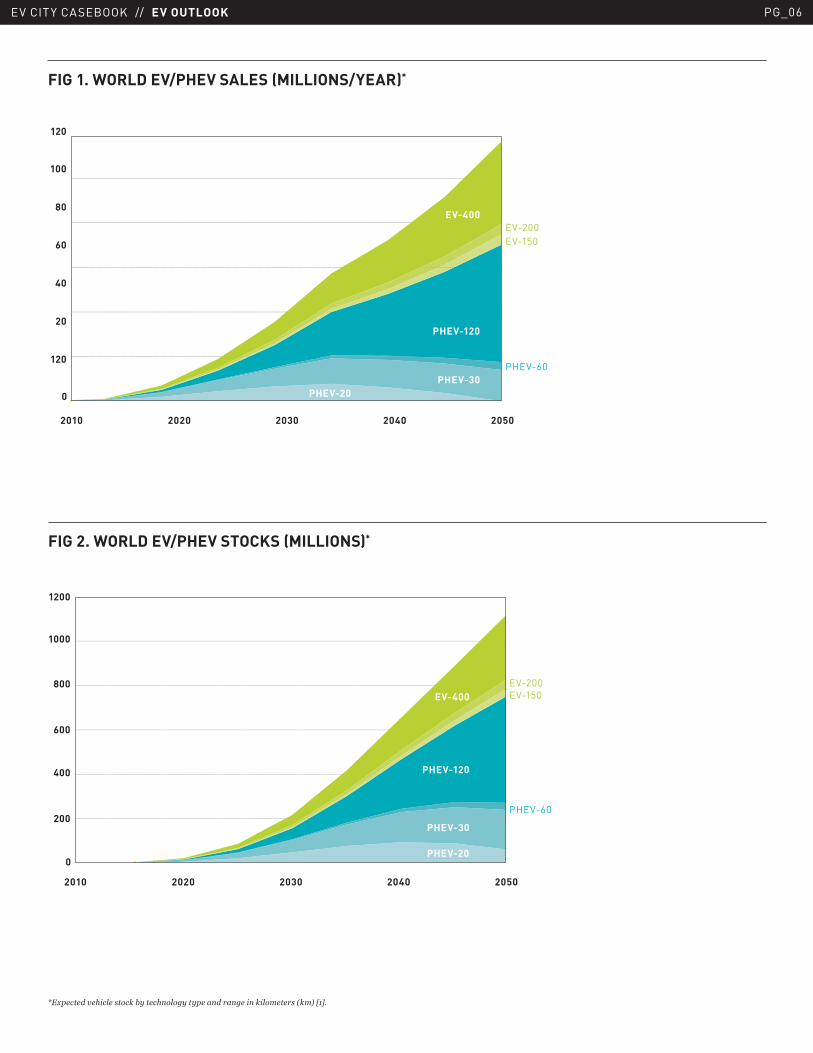
����43���!�!����������������� ������2����'0�2� �� ��
���!�����1���2�����1������������ ����!�������� ���
�(���������1��������7��3� !������7�3���� ����������������
��������9"�!���&<5�����3��������3� �7�!������ �����3��
�(�������������������3����� �� �1������������� !�����������������
�2 �����3����������3������9"�!���=<5��2�@ ������������������
�2 �'0�2 �����3������7����7����� ���� � �����7��3��3������
�������� �������� ��������������I������������������������
�3�������������� 5
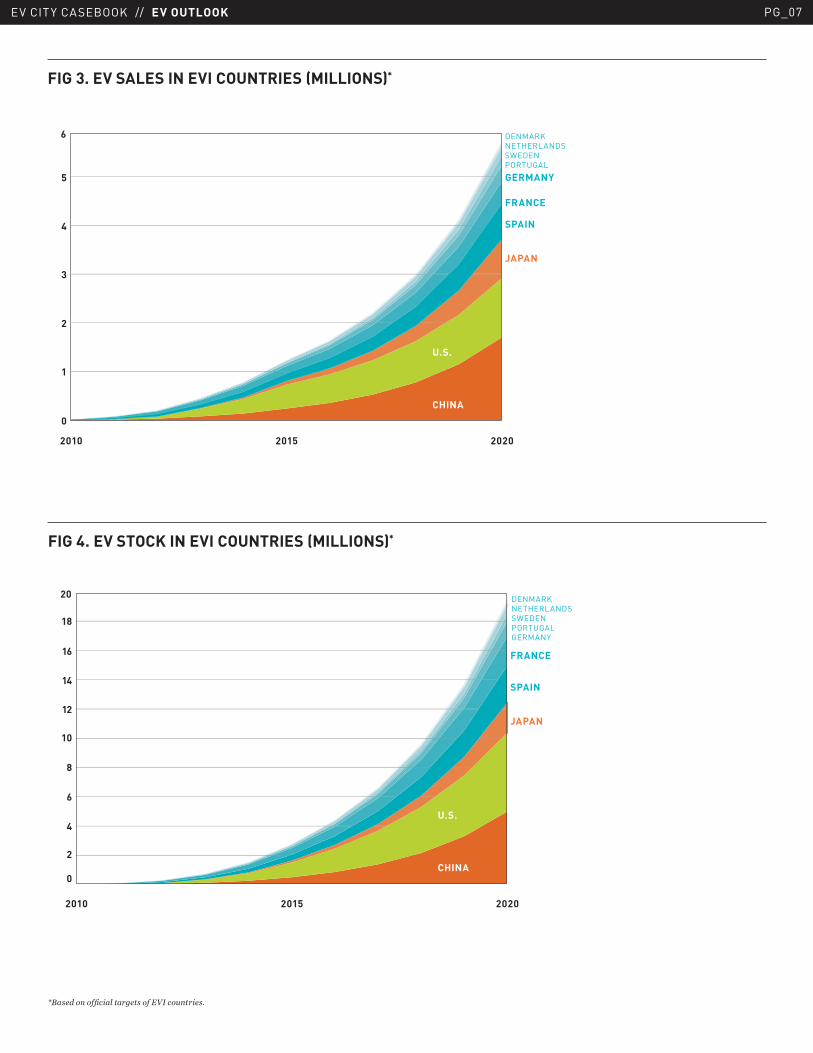
����.���������3����3� ��1����! ����������������3������
���3�������! ��� ��3��!3� ������ �� ������*����
�������������������L�������� ���I!�5����3�!3��3���!������
�2���*���� � ������3���!����*�� �����!���5��1�!��=�������
�2 �'0�2 �7���� ����7����7��������������3���� �������������
���3� �����9����������3���3��3� ��������2� ���*���*�����
����(�������&���������3���!�������3�����3�����!��<�M=N5��
-������3��� �������*���� � ����������������7��3����������� �
1�����!��3�����3�����3������ �������3�������!��� �� �7����
1��������������������������3������3������������������3���� 5
EV OUTLOOKELECTRIC VEHICLE DEPLOYMENT IN THE GLOBAL CONTEXT
��������M�N������ �!"�������#��������� ���������$%&%"� '()�*+,�*$-./-%,0*+-,"� ���"�1$%&%2��������333�������4�M�N� ����������������!������������4�M&N���������5������ �������"��������333�������������6���"�����������333��������7��������������8�93��:�������9�������4�M=N�;�:<����������
EV CITY CASEBOOK // EV OUTLOOK PG_06
120
100
80
60
40
20
120
0
EV-400
PHEV-120
PHEV-30
EV-200
PHEV-60
EV-150
PHEV-20
2010 2020 2030 2040 2050
FIG 1. WORLD EV/PHEV SALES (MILLIONS/YEAR)*
1200
1000
800
600
400
200
0
EV-400
PHEV-120
PHEV-30
PHEV-20
EV-200
PHEV-60
EV-150
2010 2020 2030 2040 2050
FIG 2. WORLD EV/PHEV STOCKS (MILLIONS)*
=�6���������������:����������������������������:���7����1:72�>&?�
EV CITY CASEBOOK // EV OUTLOOK PG_07
6
5
4
3
2
1
0
U.S.
CHINA
JAPAN
SPAIN
FRANCE
GERMANY
2010 2015 2020
DENMARKNETHERLANDSSWEDENPORTUGAL
FIG 3. EV SALES IN EVI COUNTRIES (MILLIONS)*
=(��������@��������������5 ���8������
20
12
14
16
18
10
8
6
4
2
0
U.S.
CHINA
JAPAN
SPAIN
FRANCE
DENMARKNETHERLANDSSWEDENPORTUGALGERMANY
2010 2015 2020
FIG 4. EV STOCK IN EVI COUNTRIES (MILLIONS)*
EV CITY CASEBOOK // EV OUTLOOK PG_08
����� ��3���2������� �1��*��
����� ���� ����!�1�������H����
����� ��������� ���!����3��7������
�����������������*������������
��1�������������5�43��������������
�!� !����1����! �������������� �
�3��!3������������������������������� !�� ��������� 5�
B3�����3� �������3� �����������������������3�����@ ��
�����!�������!� ���� �������������������� ������5��
"����� ��������������� �����������(����?����������
���I?��������� !������������� ��
���1�� ��������������3���� �����3�������� ��!��!��5��
"���������������� �����!�����1�� �����(������� ������3���� �
9������������7��3�������������������!��3 �� !1 ���� <��
�(������� ��������3�������� ��������(� ��������� ����� ���
�� ��!��������� ������*������ �� �7���� ��� ��!�� ������
���3�����J!������������ �������5����������������I�
?��������������� �?!���H! �� ������������������!�����
��������������*��� ��� ����� ������ ��������3�37����� ��
����(����������������������� ����������������������3������
!������J!�������9�2-�<5
��������� ����� ��������1���(����5�+���3��������������
�����������3���� �����!�������>��� ����������������3�1����
1! � �������!1������� ��������5�43�������������3���� ��� �
���!1����1!����� �������� ����� � ������������ ��!������
��������������� ������2�! �� �������!������I�7����!������� 5�
G! �� ���������������� ����! ����3���������������7������
��1����!���I �*�3��������!� ��3������!�������������� ��
!���*�� ��!������� ������ ��!��!��� !������ ����������
����� ���3��� ���!���� ����������������������?��� 5��
43� ����!� �7��*�����3������������������������2��
������ ��3����� ���� ���� �*�3��������� ������� �����
��* �������������������� ����3�������������������
��!������1����� �����2���������������������5��
�������� �����3�������(������3����1���2�����������3���3���
������ �����3� �������3�������� �1�����������!�������������5�
� ��3�����I7�����:�� ��1�� ;�����2������������������ �7����1���
�3��?� ������(����������3��������!��������� ���?����! ������
�2����3������������� ��!��!��5�C������3������� ��������
���������� 3��������!�� ��!�1�����!����� ����7������ ��������
���1���?������������������3���� 5�43���(�������� ����!�1���
������ �����3������������������� ������������������ �����
3���� �!��7��� ������2�!��*���������������3����� �������
����������� ! ���1�����1�����5
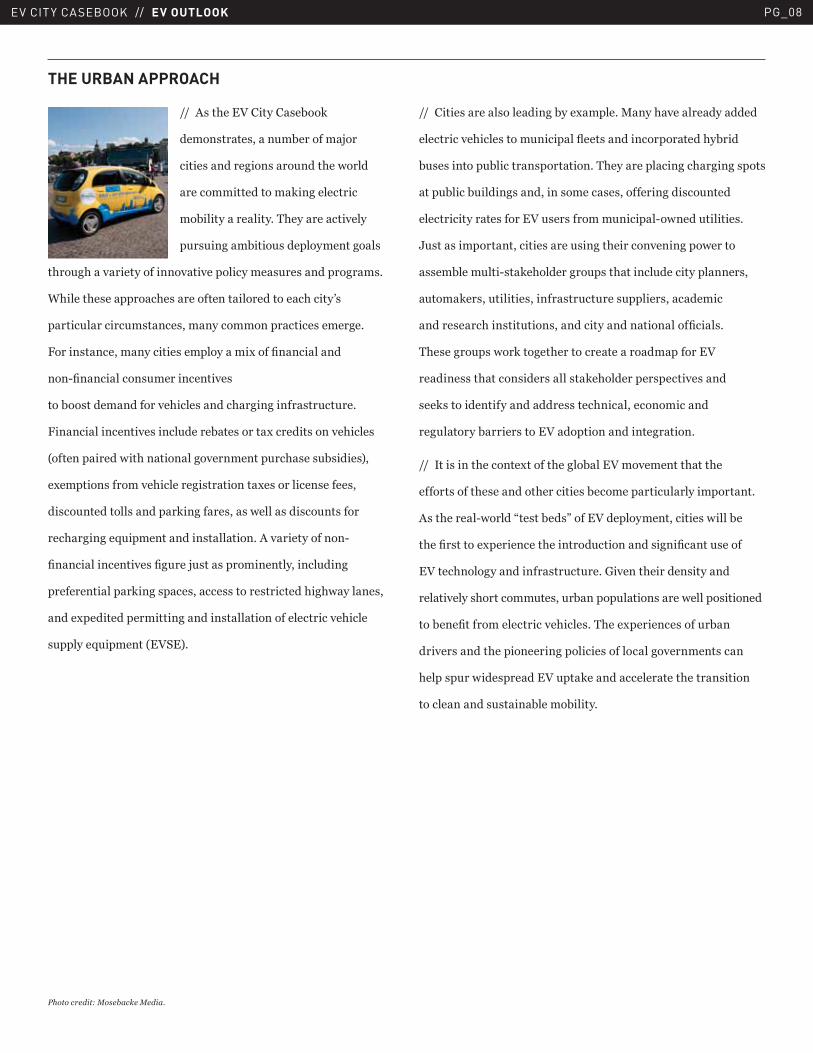
THE URBAN APPROACH
������������;����:�;����
EV CITY CASEBOOK // AMSTERDAM PG_09
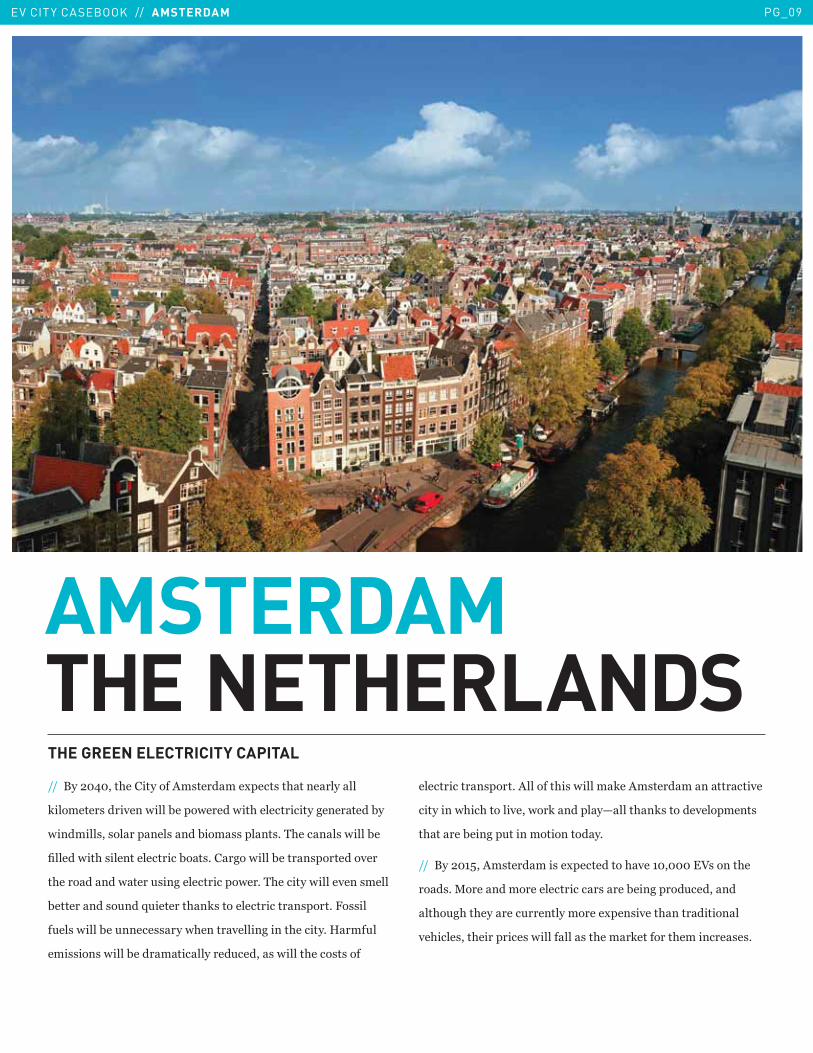
AMSTERDAMTHE NETHERLANDSTHE GREEN ELECTRICITY CAPITAL
����.����=����3������������ �������(���� ��3�����������
*�������� ��������7����1����7�����7��3���������������������1��
7������� �� �������� ����1��� ����� 5�43����� �7����1��
?�����7��3� ���������������1�� 5�����7����1����� ������������
�3���������7����! ��������������7��5�43�������7��������� �����
1��������� �!���J!�������3�* ���������������� ����5�"� ���
�!�� �7����1��!����� ���73����������������3������5�0���!��
��� ��� �7����1���������������!����� �7�����3���� � ����
������������ ����5���������3� �7�����*���� �����������������
��������73��3����������7��*�������O����3�* ��������������� �
�3�����1�����!����������������5�
����.�����%���� ������� ��(����������3�����������2 �����3��
��� 5�+����������������������� ����1��������!��������
��3�!3��3�������!��������������(��� �����3������������
��3���� ���3��������� �7�������� ��3����*��������3�������� � 5
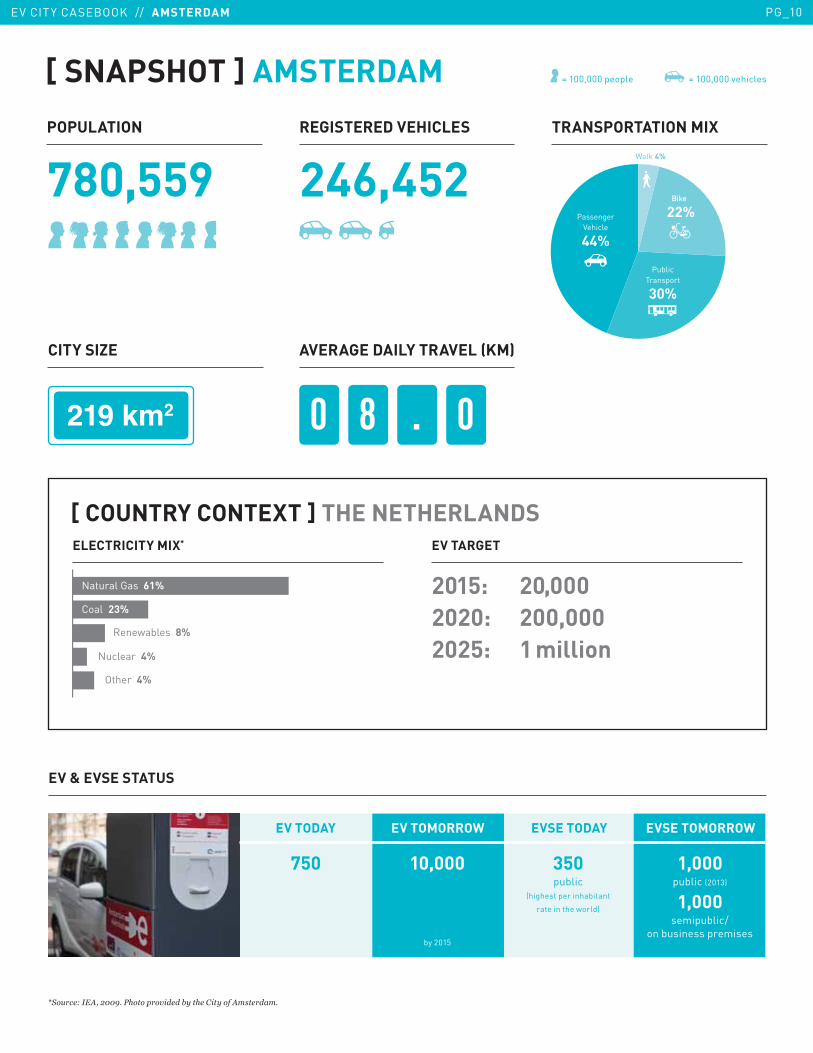
EV CITY CASEBOOK // AMSTERDAM PG_10
POPULATION
780,559
REGISTERED VEHICLES
246,452
AVERAGE DAILY TRAVEL (KM)
0 8 . 0
EV & EVSE STATUS
CITY SIZE
�������
='�8���� �!"�$%%*�� ���������������������������!7����7�
TRANSPORTATION MIX
[ SNAPSHOT ] AMSTERDAM
750 10,000 1,000public (2013)
1,000semipublic/
on business premises
350public
(highest per inhabitant
rate in the world)
= 100,000 people = 100,000 vehicles
Walk 4%
PublicTransport
30%
PassengerVehicle
44%
Bike
22%
by 2015
[ COUNTRY CONTEXT ] THE NETHERLANDS
EV TARGET
2015: 20,000
2020: 200,000
2025: 1 million
ELECTRICITY MIX*
Renewables 8%
Nuclear 4%
Other 4%
Coal 23%
Natural Gas 61%
EV TODAY EV TOMORROW EVSE TODAY EVSE TOMORROW
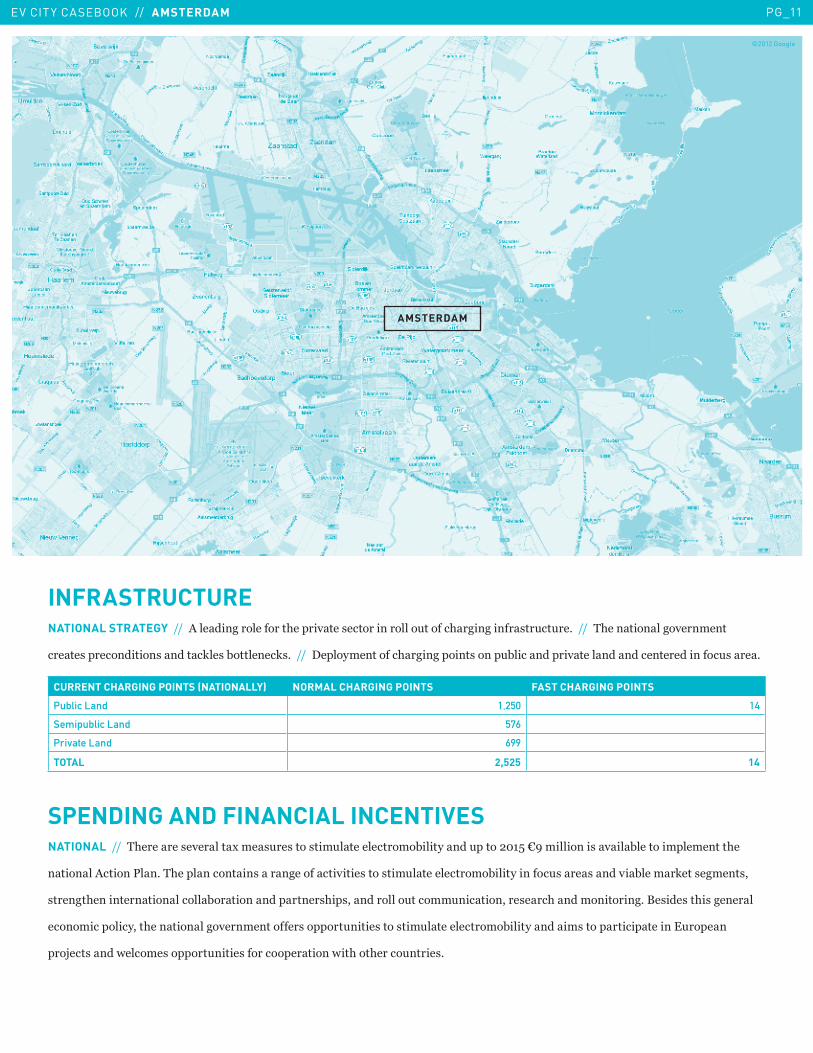
EV CITY CASEBOOK // AMSTERDAM PG_11
INFRASTRUCTURENATIONAL STRATEGY ����������������������3��������� ���������������!������3�������� ��!��!��5 ����43�������������������
����� ������������� ������*�� �1��������* 5 �������������������3��������� �����!1������������������������������������! ���5��
CURRENT CHARGING POINTS (NATIONALLY) NORMAL CHARGING POINTS FAST CHARGING POINTS
Public Land 1,250 14
Semipublic Land 576
Private Land 699
TOTAL 2,525 14
SPENDING AND FINANCIAL INCENTIVESNATIONAL ����43������� �������(��� !�� ���� ���!�������������1���������!��������%�P ���������� ����1�����������������3��
��������������'��5�43������������ ����������������� ���� ���!�������������1������������! ��� ������1�����*��� ����� ���
�����3�������������������1���������������� 3�� �����������!������!����������� ���3�������������5�.� ��� ��3� �������
������������������3������������������������ �������!����� ���� ���!�������������1����������� ������������������!�������
���H��� ����7������ �������!����� ����������������7��3���3�����!����� 5�
©2012 Google
AMSTERDAM
EV CITY CASEBOOK // AMSTERDAM PG_12
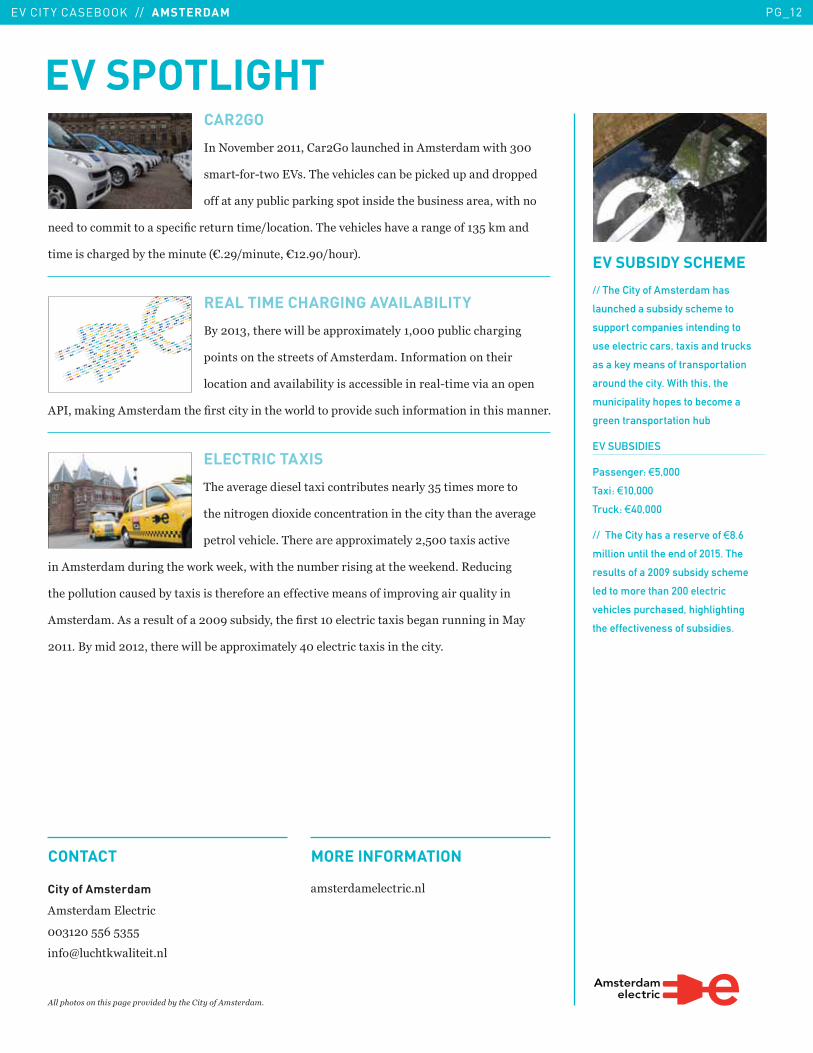
CAR2GO
���6����1������������C���!��3�������� ������7��3�&���
���I���I�7���2 5�43����3���� ����1�����*���!�������������
����������!1������*��� ������ �����3��1! ��� �����7��3����
������������������� ����?�����!���������������5�43����3���� �3������������&%�*�����
������ ��3����1���3�����!���9P5� ����!����P��5 ��3�!�<5
REAL TIME CHARGING AVAILABILITY
.�����&���3����7����1������(��������������!1�����3����
����� �����3�� ����� ������ �����5����������������3����
��������������1������� ���� �1���������I���������������
�'����*����� �������3��?� �����������3��7���������������� !�3����������������3� ������5�
ELECTRIC TAXIS
43���������� ����(��������1!�� �������&%����� ���������
�3�������������(���������������������3��������3���3�������
���������3����5�43�����������(���������%����(� �������
����� �������!�����3��7��*�7��*��7��3��3���!�1����� ������3��7��*���5�)��!����
�3������!������! ���1���(� �� ��3����������������������� ����������������J!��������
�� �����5�� ���� !���������� � !1 ������3��?� ���������������(� �1����!��������+��
����5�.�������������3����7����1������(�������=������������(� �����3������5
EV SUBSIDY SCHEME
// The City of Amsterdam has
launched a subsidy scheme to
support companies intending to
use electric cars, taxis and trucks
as a key means of transportation
around the city. With this, the
municipality hopes to become a
green transportation hub
EV SUBSIDIES
Passenger: �5,000
Taxi: �10,000
Truck: �40,000
// The City has a reserve of �8.6
million until the end of 2015. The
results of a 2009 subsidy scheme
led to more than 200 electric
vehicles purchased, highlighting
the effectiveness of subsidies.
EV SPOTLIGHT
electric
One North East
Tilburg
TNT
TNT
Tilburg
electric
One North East
Tilburg
TNT
TNT
Tilburg
TNT
electric
One North East
Tilburg
TNT
TNT
Tilburg
electric
One North East
TilburgTNT
TNT
TNT
electric
One North East
Tilburg
electric
One North East
Tilburg
TNT
electric
One North East
Tilburg
Tilburg
electric
One North East
electric
One North EastTNT
Tilburg
Tilburg
Tilburg
TNT
electric
One North East
TNT
TNTTNT
Tilburg
electric
One North East
TNT
Tilburg
electric
One North East
TNT
electric
One North East
Tilburg
City of Amsterdam
�� ���������������
��&����%%Q�%&%%�
����R�!�3�*7������5��
� �������������5��
CONTACT MORE INFORMATION
!�������������������������������������������!7����7�
EV CITY CASEBOOK // BARCELONA PG_13
BARCELONA SPAINA CENTER OF INNOVATION IN ELECTRIC MOBILITY
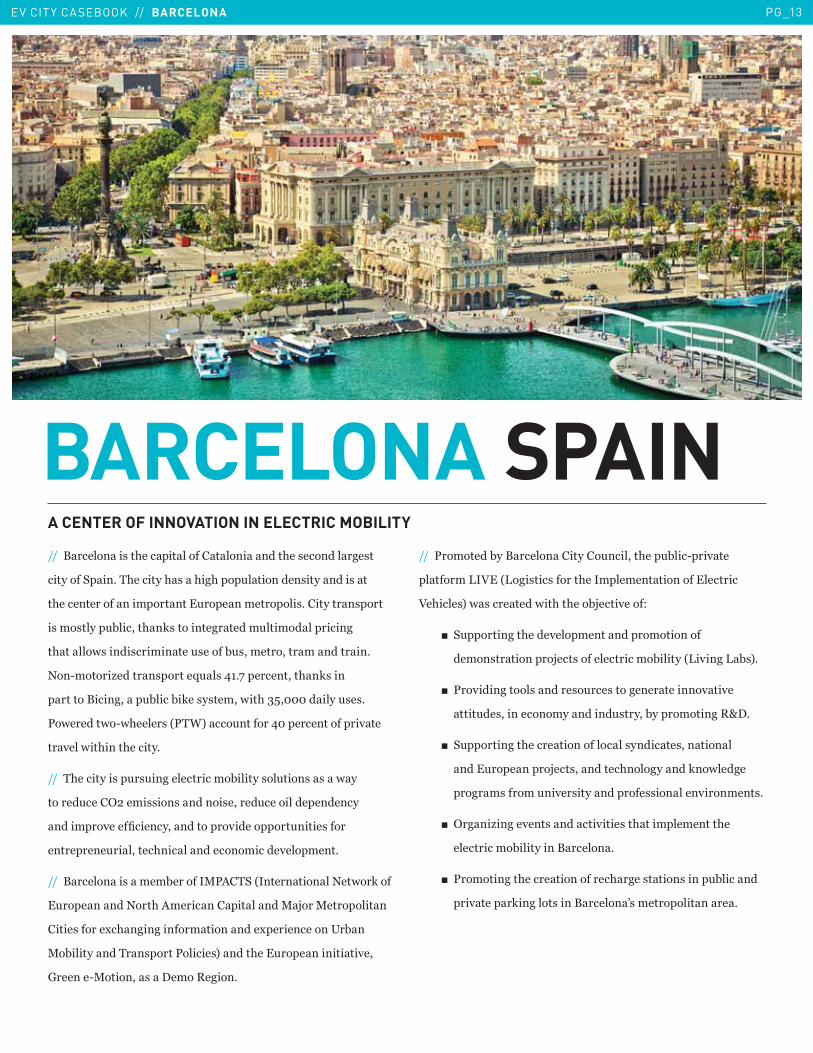
����.�������� ��3����������������������3�� ��������� ��
��������-���5�43�������3 ��3�3����!��������� �������� ����
�3������������������������!��������������� 5��������� ������
� ��� �����!1������3�* ��������������!����������������
�3�����7 ����� ���������! �����1! ��������������������5��
6��I������L������ ������J!� �=�5$�����������3�* �����
�������.��������!1����1�*�� � �����7��3�&%����������! � 5��
'�7������7�I73����� �9'4B<����!�������=���������������������
������7��3����3������5
����43�������� ��!� !��������������1������ ��!���� � ��7��
������!���������� ��� ������� ������!������������������
�������������?����������������������������!����� �����
����������!��������3����������������������������5
����.�������� �����1�������+'��4-�9������������6��7��*����
�!���������6���3������������������+H���+�����������
����� ������(�3�������������������(������������/�1��
+�1���������4�� �����'������ <�����3���!�����������������
C������I+������� �������)����5
����'��������1��.��������������!�������3���!1���I�������
��������E�2��9E�� ��� ������3����������������������������
2�3���� <�7 ��������7��3��3���1H���������8
�� -!���������3������������������������������
����� ����������H��� ���������������1������9E�����E1 <5
�� '������������ ������ �!��� ���������������������
����!�� �������������������! �����1�����������)S�5
�� -!���������3������������������ ������� ���������
����!���������H��� ��������3���������*��7�����
����� ������!����� ������������ ���������������� 5
�� ����L�������� ������������ ��3�������������3��
�����������1���������.������5
�� '���������3����������������3��� ����� �����!1�������
���������*������ ����.������@ ���������������5
�����������
EV CITY CASEBOOK // BARCELONA PG_14
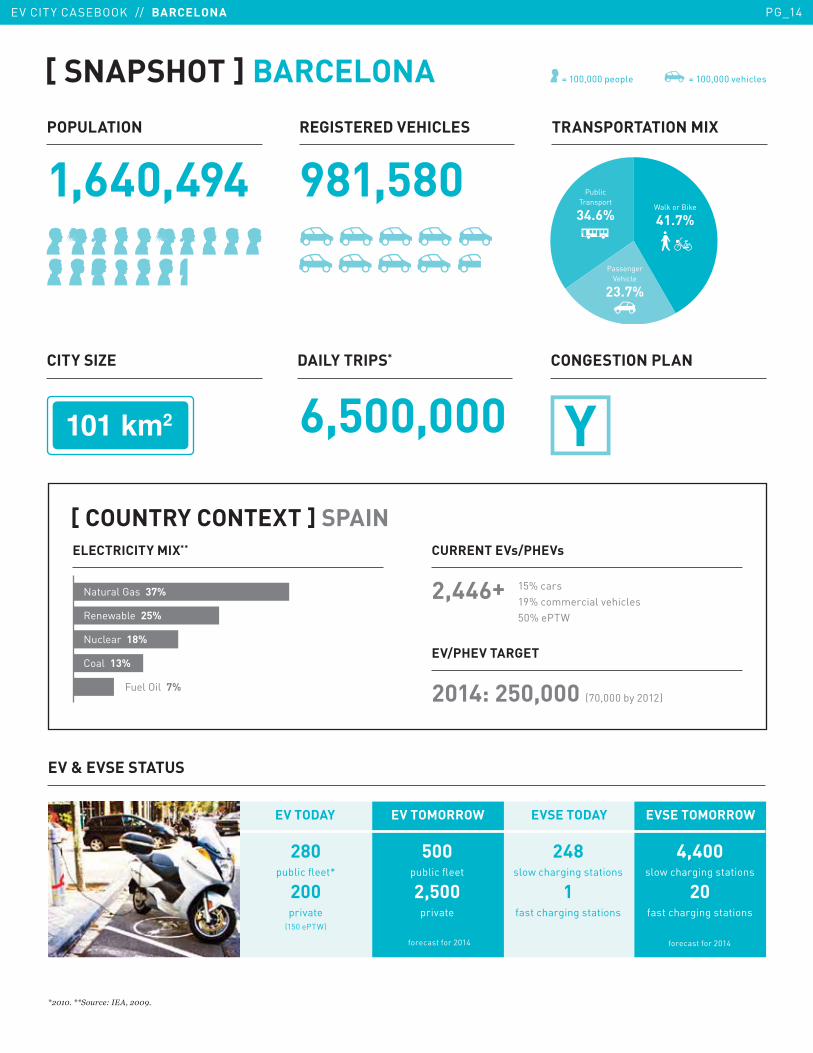
6,500,000
EV & EVSE STATUS
[ SNAPSHOT ] BARCELONA
280 public fleet*
200 private
(150 ePTW)
500 public fleet
2,500private
4,400 slow charging stations
20fast charging stations
EV TODAY EV TOMORROW
248 slow charging stations
1fast charging stations
EVSE TODAY EVSE TOMORROW
CITY SIZE
�������
DAILY TRIPS* CONGESTION PLAN
=$%&%��=='�8���� �!"�$%%*�
Walk or Bike
41.7%
PublicTransport
34.6%
PassengerVehicle
23.7%
forecast for 2014 forecast for 2014
POPULATION
1,640,494
REGISTERED VEHICLES
981,580
TRANSPORTATION MIX
= 100,000 people = 100,000 vehicles
CURRENT EVs/PHEVs
2,446+
EV/PHEV TARGET
2014: 250,000 (70,000 by 2012)
15% cars19% commercial vehicles 50% ePTW
[ COUNTRY CONTEXT ] SPAIN
ELECTRICITY MIX**
Coal 13%
Fuel Oil 7%
Renewable 25%
Natural Gas 37%
Nuclear 18%
EV CITY CASEBOOK // BARCELONA PG_15
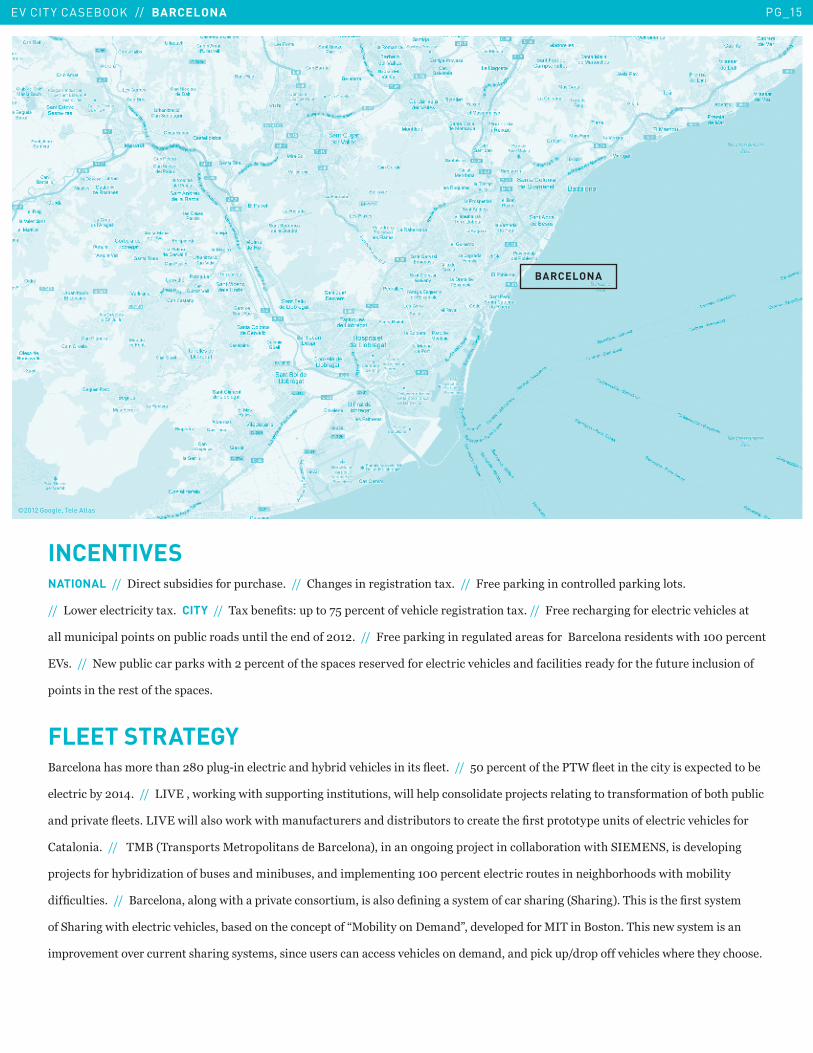
INCENTIVESNATIONAL ����������� !1 ���� ������!��3 �5 �����3�� ������� ��������(5������"������*�������������������*������ 5
����E�7����������������(5��CITY ����4(�1���?� 8�!�����$%��������������3�������� ��������(5�����"�������3�������������������3���� ���
����!������������ �����!1������� �!������3�������������5 ����"������*��������!������� ������.��������� ����� �7��3�������������
�2 5 ����6�7��!1���������* �7��3���������������3�� ��� ��� ���������������������3���� ������������ �����������3���!�!�������! �������
����� �����3���� ������3�� ��� 5
FLEET STRATEGY.�������3 �������3���,����!I���������������3�1������3���� ������ �>���5 ����%��������������3��'4B�>��������3�������� ��(����������1��
���������1�����=5 ����E�2����7��*���7��3� !���������� ���!���� ��7����3������� ����������H��� �������������� ������������1��3��!1����
����������>��� 5�E�2��7����� ��7��*�7��3���!���!��� ������ ���1!��� �����������3��?� ������������!��� ���������������3���� �����
������5 �����4+.�94�� ���� �+���������� ����.������<����������������H�����������1�������7��3�-��+�6-��� �����������
���H��� �����3�1����L��������1! � ��������1! � ����������������������������������������!�� �������31��3��� �7��3���1�������
���?�!���� 5������.������������7��3������������ ����!���� �� ����?����� � ���������� 3����9-3���<5�43� �� ��3��?� �� � ����
���-3����7��3������������3���� ��1 �������3�������������:+�1��������������;����������������+�4����.� ���5�43� ���7� � ����� ����
������������������!������ 3���� � ��� �� �����! �� ������� ���3���� �����������������*�!�������������3���� �73�����3����3�� �5
�����������
©2012 Google, Tele Atlas
BARCELONA
EV CITY CASEBOOK // BARCELONA PG_16
MORE INFORMATION
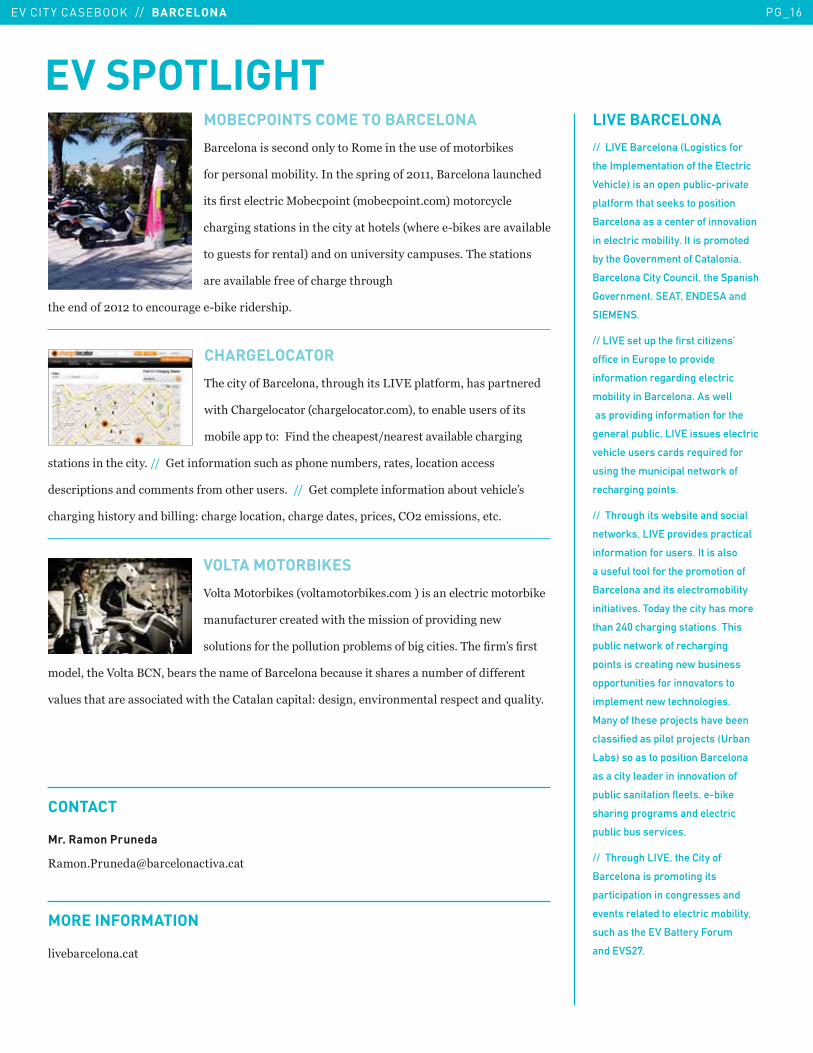
MOBECPOINTS COME TO BARCELONA
.�������� � ��������������)��������3��! ����������1�*� ��
������� ������1�����5�����3�� ��������������.��������!��3���
�� �?� �����������+�1��������9��1�������5���<������������
�3���� ����� �����3���������3���� �973�����I1�*� �������1���
���!� � ����������<�������!����� �������! � 5�43�� ����� �
������1������������3����3��!3��
�3���������������������!����I1�*������� 3��5
CHARGELOCATOR
43����������.���������3��!3��� �E�2�����������3 ����������
7��3��3���������9�3��������5���<�������1���! �� ������ �
��1���������8��"�����3���3��� ������ �����1����3����
����� �����3������5�����C�������������� !�3� ��3�����!�1�� ����� ������������� �
�� �������� ����������� ��������3���! �� 5������C�����������������������1�!����3����@ �
�3����3� ��������1�����8��3�������������3������ ������� ��������� ��� �����5
VOLTA MOTORBIKES
2����+����1�*� �9���������1�*� 5����<�� �����������������1�*��
��!���!�����������7��3��3���� ������������������7�
��!���� ������3������!��������1��� ����1������� 5�43��?��@ �?� ��
��������3��2����.�6��1�� ��3���������.�������1��! ����� 3�� ���!�1����������������
��!� ��3����� �������7��3��3������������8��� ������������������� ��������J!����5
LIVE BARCELONA
// LIVE Barcelona (Logistics for
the Implementation of the Electric
Vehicle) is an open public-private
platform that seeks to position
Barcelona as a center of innovation
in electric mobility. It is promoted
by the Government of Catalonia,
Barcelona City Council, the Spanish
Government, SEAT, ENDESA and
SIEMENS.
// LIVE set up the first citizens’
office in Europe to provide
information regarding electric
mobility in Barcelona. As well
as providing information for the
general public, LIVE issues electric
vehicle users cards required for
using the municipal network of
recharging points.
// Through its website and social
networks, LIVE provides practical
information for users. It is also
a useful tool for the promotion of
Barcelona and its electromobility
initiatives. Today the city has more
than 240 charging stations. This
public network of recharging
points is creating new business
opportunities for innovators to
implement new technologies.
Many of these projects have been
classified as pilot projects (Urban
Labs) so as to position Barcelona
as a city leader in innovation of
public sanitation fleets, e-bike
sharing programs and electric
public bus services.
// Through LIVE, the City of
Barcelona is promoting its
participation in congresses and
events related to electric mobility,
such as the EV Battery Forum
and EVS27.
EV SPOTLIGHT
Mr. Ramon Pruneda
)���5'�!���R1����������5��
CONTACT
����1������5���
EV CITY CASEBOOK // BERLIN PG_17
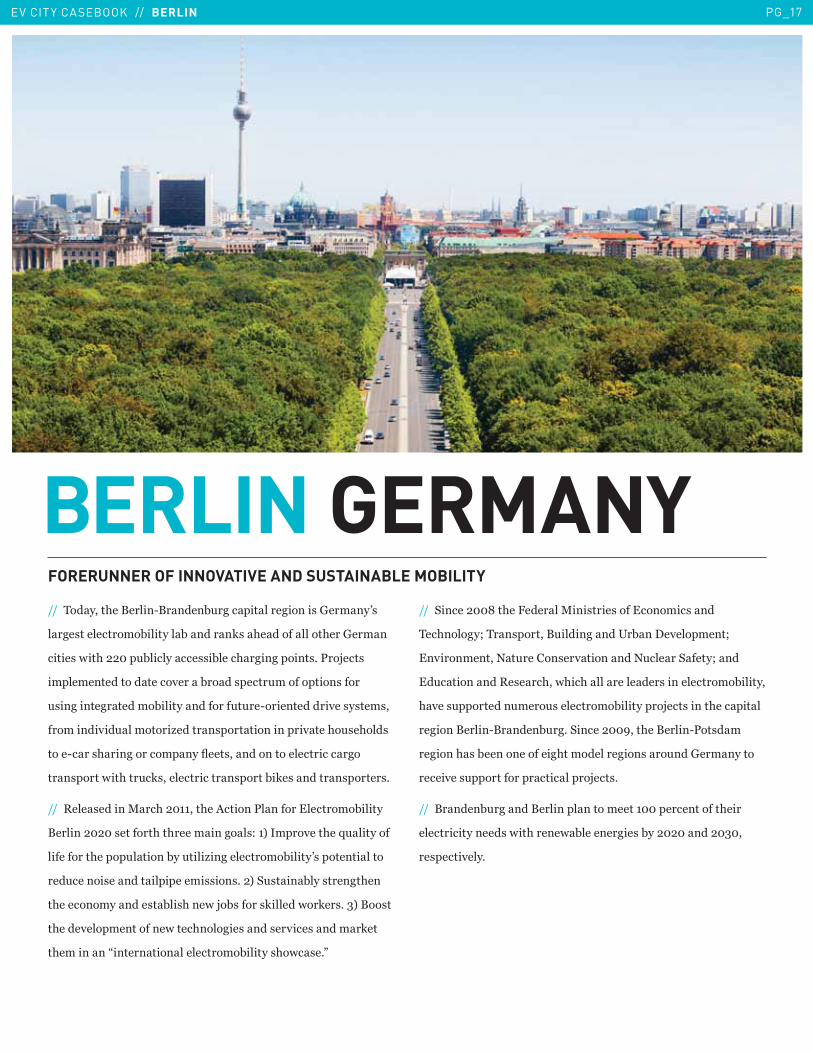
BERLIN GERMANYFORERUNNER OF INNOVATIVE AND SUSTAINABLE MOBILITY
����4������3��.�����I.�����1!��������������� �C�����@ �
��� �����������1�������1������* �3�����������3���C�����
����� �7��3������!1��������� �1����3��������� 5�'��H��� �
��������������������������1���� �����!����������� �����
! ��������������1��������������!�!��I��������������� � ��� ��
������������!��������L������ �������������������3�! �3��� �
����I��� 3��������������>��� ������������������������
��� �����7��3���!�* �������������� �����1�*� ������� ������ 5�
����)��� ������+��3��������3���������'����������������1������
.����������� �������3��3���������� 8��<����������3��J!��������
����������3�����!������1��!����L������������1�����@ �������������
���!������ ���������������� ��� 5��<�-! ���1��� �����3���
�3�������������� �1�� 3���7�H�1 ����� *������7��*�� 5�&<�.�� ��
�3�������������������7����3������ ���� ������ ������*���
�3��������:���������������������1������ 3�7� �5;�
����-��������,��3��"������+��� ���� ������������ ����
4��3�����K�4�� ������.!���������/�1�������������K�
�������������6�!������ �����������6!�����-����K����
��!���������)� ���3��73��3������������ �������������1�������
3��� !���������!����! ����������1���������H��� �����3��������
������.�����I.�����1!�5�-�������� ���3��.�����I'�� ���
������3 �1�������������3������������� ���!���C���������
�������� !���������������������H��� 5
����.�����1!�����.����������������������������������3����
���������������� �7��3�����71��������� �1������������&���
�� ���������5
�����������
EV CITY CASEBOOK // BERLIN PG_18
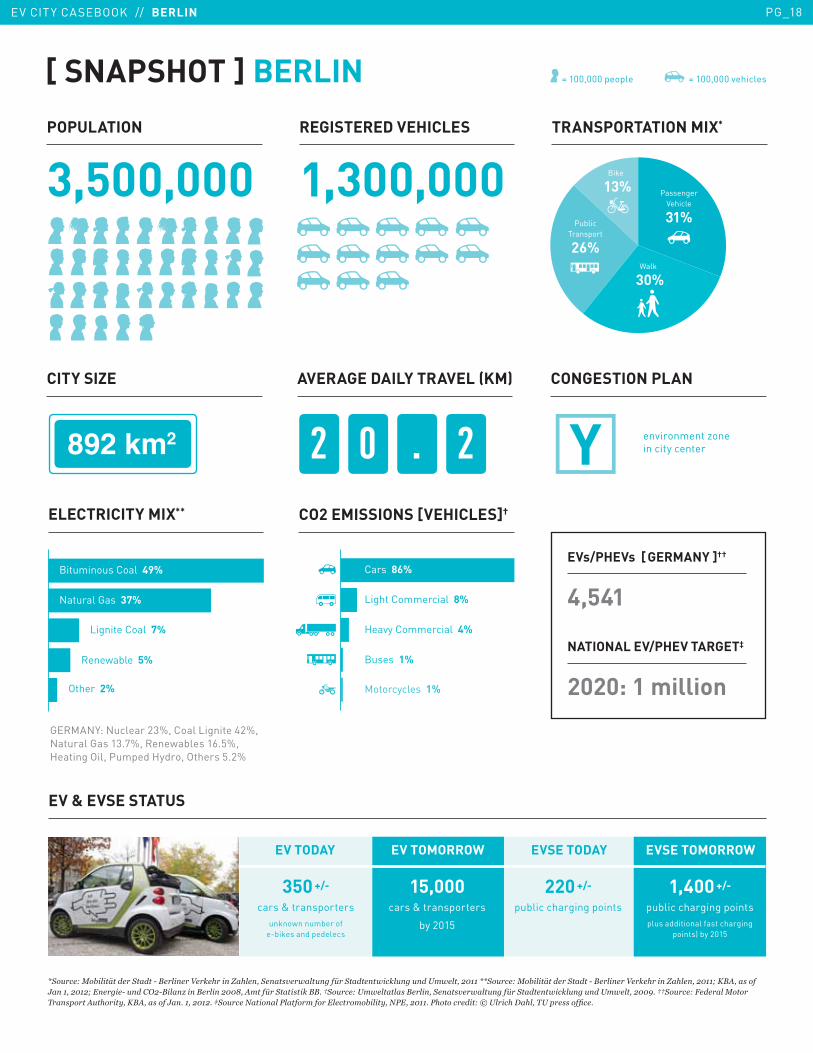
EVs/PHEVs [ GERMANY ]††
4,541
NATIONAL EV/PHEV TARGET‡
2020: 1 million
2 0 . 2
EV & EVSE STATUS
������
='�8����;������A�����'����-�(������5�:������B���"�'�����3��8����C��'�����3��:�8���8���D73��"�$%&&�=='�8����;������A�����'����-�(������5�:������B���"�$%&&4�E(!"������F��&"�$%&$4������-�8�����$-(���G����(�����$%%,"�!7���C��'������:�((��H'�8����D73������(����"�'�����3��8����C��'�����3��:�8���8���D73��"�$%%*��HH'�8����I����;�����#��������!8�������"�E(!"������F���&"�$%&$��J'�8���)������ �����7�����������7�������"�) �"�$%&&�� ������������K�D���������"�#D��������@��
CO2 EMISSIONS [VEHICLES]†
environment zone in city center
[ SNAPSHOT ] BERLIN
350 +/- cars & transporters
unknown number ofe-bikes and pedelecs
15,000cars & transporters
by 2015
1,400 +/-
public charging pointsplus additional fast charging
points) by 2015
220 +/-
public charging points
ELECTRICITY MIX**
GERMANY: Nuclear 23%, Coal Lignite 42%,Natural Gas 13.7%, Renewables 16.5%, Heating Oil, Pumped Hydro, Others 5.2%
PublicTransport
26%
PassengerVehicle
31%
Bike
13%
Walk
30%
POPULATION
3,500,000
REGISTERED VEHICLES
1,300,000
TRANSPORTATION MIX*
= 100,000 people = 100,000 vehicles
CITY SIZE AVERAGE DAILY TRAVEL (KM) CONGESTION PLAN
Lignite Coal 7%
Renewable 5%
Other 2%
Natural Gas 37%
Bituminous Coal 49%
EV TODAY EV TOMORROW EVSE TODAY EVSE TOMORROW
Heavy Commercial 4%
Light Commercial 8%
Buses 1%
Motorcycles 1%
Cars 86%
EV CITY CASEBOOK // BERLIN PG_19
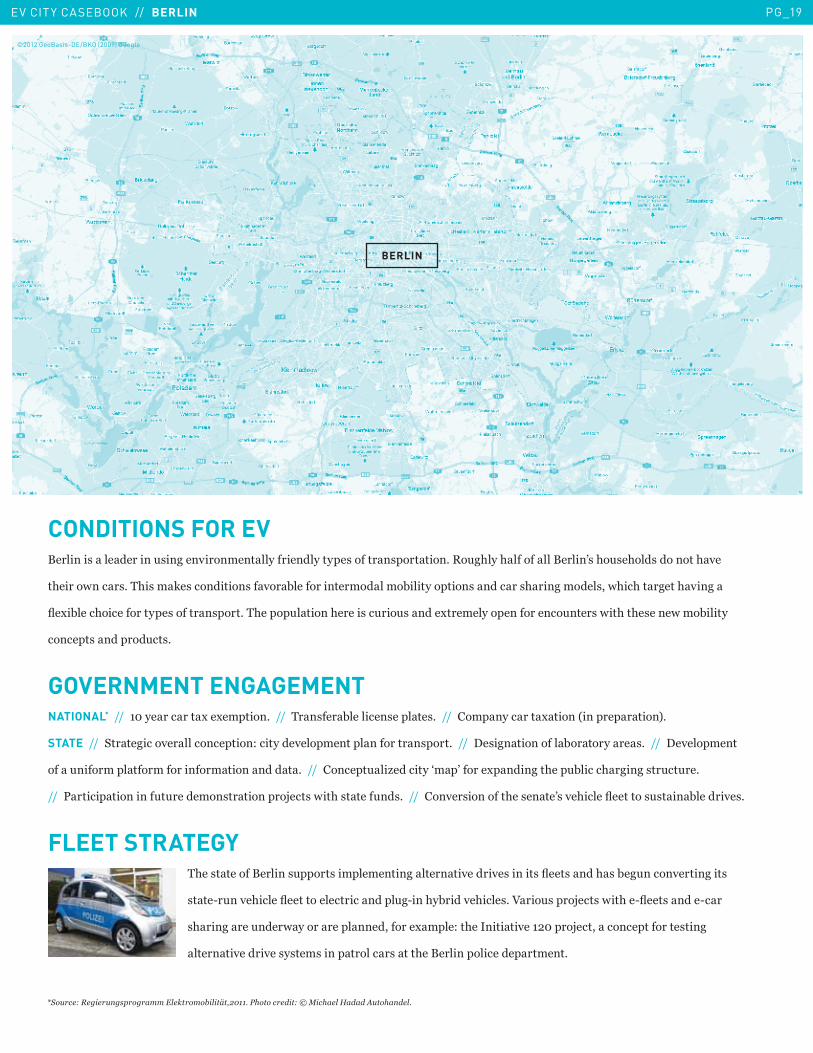
CONDITIONS FOR EV .������� �����������! ������������������������������� ������� ��������5�)�!3���3���������.�����@ �3�! �3��� ��������3����
�3�����7���� 5�43� ��*� ���������� �����1�������������������1������������ ������� 3��������� ��73��3������3������
>�(�1����3������������� ������� ����5�43�����!������3����� ��!���! �����(���������������������!���� �7��3��3� ����7���1�������
������� ��������!�� 5�
GOVERNMENT ENGAGEMENT NATIONAL*�����������������(��(�������5������4�� ���1�������� ������ 5�����������������(�����9������������<5
STATE������-������������������������8����������������������������� ����5�������� �����������1��������� 5������������������
����!�����������������������������������5�������������!��L��������T��@������(�������3���!1�����3���� ��!��!��5��
����'���������������!�!�������� ����������H��� �7��3� �����!�� 5������������ ��������3�� ����@ ���3�����>������� ! ���1�������� 5�
FLEET STRATEGY43�� �������.������ !����� ���������������������������� ������ �>��� ����3 �1�!�������������� ��
���I�!����3�����>���������������������!I���3�1������3���� 5�2���! ����H��� �7��3��I>��� �����I����
3�������!����7���������������������(����8��3�������������������H�������������������� �����
���������������� � ��� ������������ ����3��.����������������������5
='�8��������8��������77���:���7������A�"$%&&�� ������������K�;�����L���!8��������
©2012 GeoBasis-DE/BKO (2009) Google
BERLIN
EV CITY CASEBOOK // BERLIN PG_20
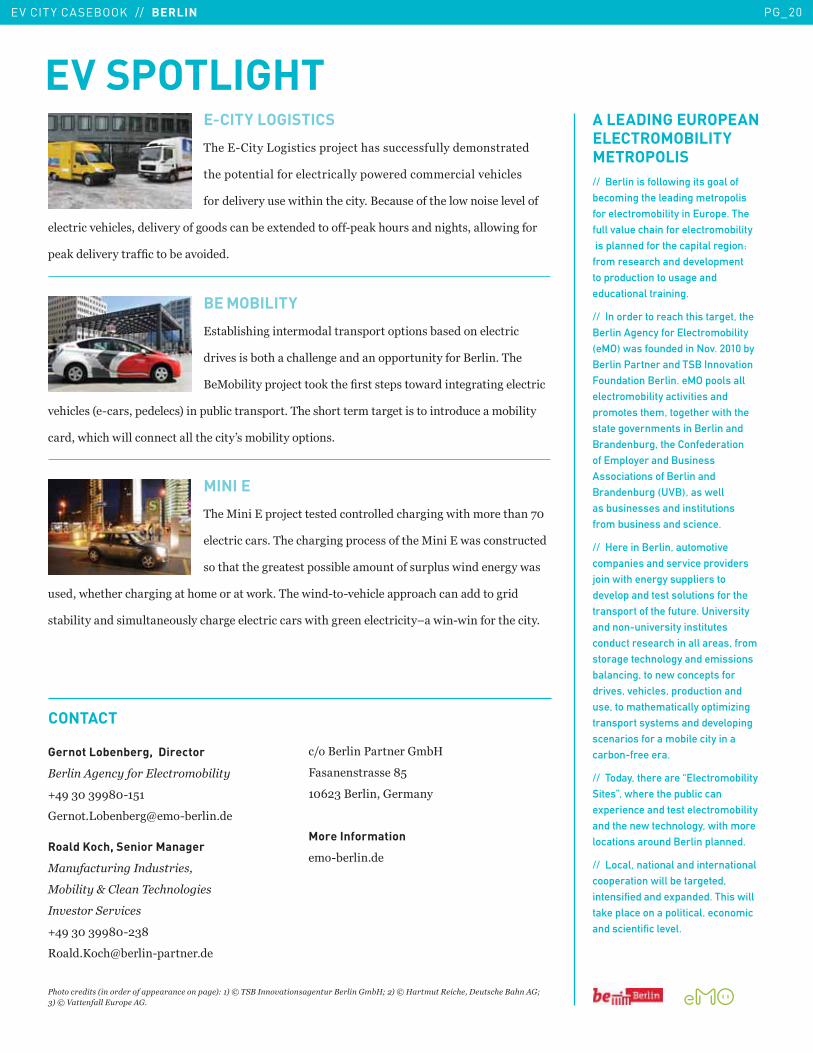
E-CITY LOGISTICS
43���I�����E�� ��� ����H����3 � !��� �!��������� ������
�3�����������������������������7�����������������3���� �
�������������! ��7��3����3������5�.��! ������3����7���� �����������
�����������3���� ����������������� ����1���(�������������I��*�3�!� ������3� �����7�������
��*�������������?�����1��������5
BE MOBILITY
� �1�� 3���������������� ����������� �1 ���������������
����� �� �1��3���3�����������������!���������.�����5�43��
.�+�1���������H�������*��3��?� �� ��� ���7���������������������
��3���� �9�I�� ��������� <�����!1������� ����5�43�� 3��������������� ����������!������1������
�����73��3�7����������������3������@ ���1������������ 5
MINI E
43��+���������H������ ����������������3����7��3�������3��$��
����������� 5�43���3��������� �����3��+������7 ���� ��!�����
���3���3������ ���� �1�����!������ !���! �7����������7 �
! ����73��3����3������3���������7��*5�43��7���I��I��3����������3��������������
�1��������� ��!�����! ����3�������������� �7��3�����������������U�7��I7��������3������5
A LEADING EUROPEAN
ELECTROMOBILITY
METROPOLIS
// Berlin is following its goal of becoming the leading metropolis for electromobility in Europe. The full value chain for electromobility is planned for the capital region: from research and development to production to usage and educational training.
// In order to reach this target, the Berlin Agency for Electromobility (eMO) was founded in Nov. 2010 by Berlin Partner and TSB Innovation Foundation Berlin. eMO pools all electromobility activities and promotes them, together with the state governments in Berlin and Brandenburg, the Confederation of Employer and Business Associations of Berlin and Brandenburg (UVB), as well as businesses and institutions from business and science.
// Here in Berlin, automotive companies and service providers join with energy suppliers to develop and test solutions for the transport of the future. University and non-university institutes conduct research in all areas, from storage technology and emissions balancing, to new concepts for drives, vehicles, production and use, to mathematically optimizing transport systems and developing scenarios for a mobile city in a carbon-free era.
// Today, there are “Electromobility Sites”, where the public can experience and test electromobility and the new technology, with more locations around Berlin planned.
// Local, national and international cooperation will be targeted, intensified and expanded. This will take place on a political, economic and scientific level.
EV SPOTLIGHT
Gernot Lobenberg, Director
(�����!���������������7�������
V= �&��& ,�I�%�
C�����5E�1��1��R���I1�����5��
Roald Koch, Senior Manager
;�8���8����� ��8�����"
;��������M�����#���������
�������'�����
V= �&��& ,�I�&,
)���5D��3R1�����I������5��
����.������'������C�10
" ��� �� ��,%
��Q�&�.�������C�����
More Information
���I1�����5��
CONTACT
������������1����������������������2��&2�K�#'(� ������������8��(������7�L4�$2�K�L��78������"��8�����(���!�4�N2�K�5��������8����!��
EV CITY CASEBOOK // BRABANTSTAD PG_21
�����������
��������
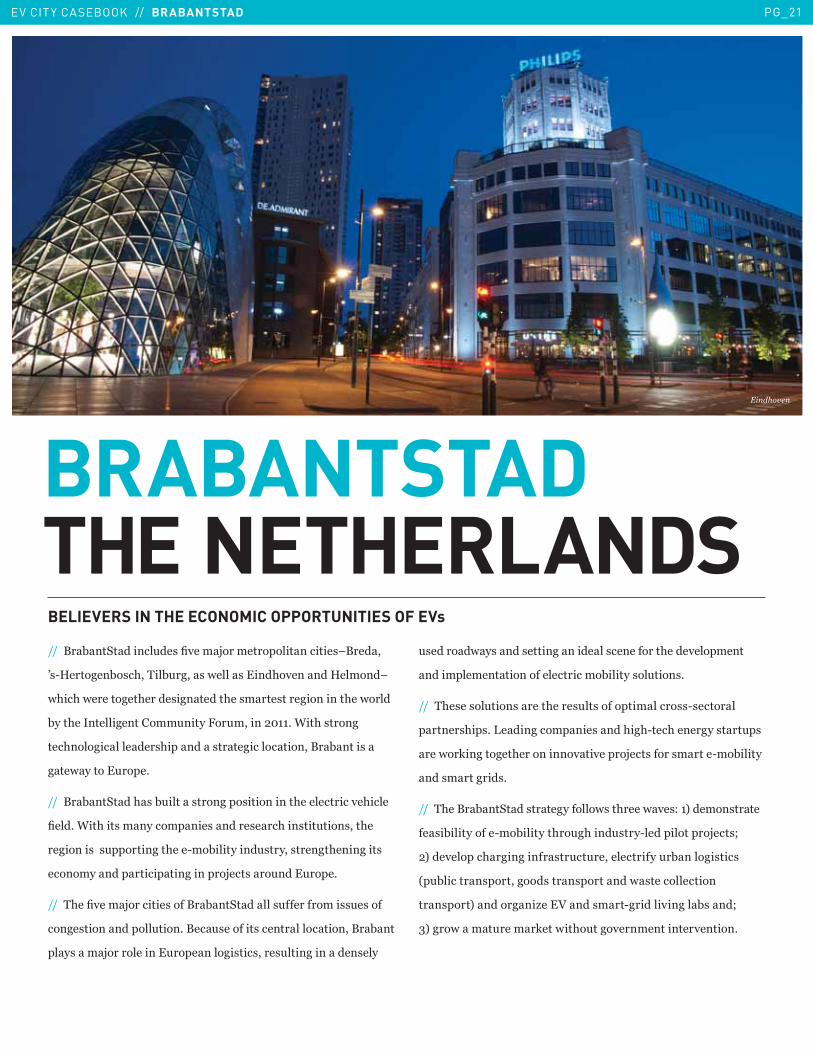
BRABANTSTADTHE NETHERLANDSBELIEVERS IN THE ECONOMIC OPPORTUNITIES OF EVs
����.�1��-�������!�� �?����H�������������������� U.�����
@ I0������1� �3��4��1!��� �7���� �����3��������0������U
73��3�7��������3����� �������3�� ���� ������������3��7�����
1���3�����������������!�����"��!����������5�B��3� �����
���3������������� 3������� ����������������.�1���� ��
��7������!����5�
����.�1��-���3 �1!����� ������� ����������3�������������3�����
?���5�B��3��� ������������ ������ ���3��� ���!���� ���3��
������� �� !���������3���I��1���������! ����� �����3������� �
����������������������������H��� ���!����!����5
����43��?����H�������� ����.�1��-������ !����������� !� ����
���� ������������!����5�.��! ������� �����������������.�1���
��� ���H������������!��������� ��� ���� !������������ ����
! ������7� ���� ������������� ����������3��������������
�������������������������������1������ ��!���� 5
����43� �� ��!���� �����3���� !�� �������������� I �������
������ 3�� 5�E������������ ����3�3I���3������� ���!� �
���7��*�������3�������������������H��� ����� �����I��1������
��� ������� 5
����43��.�1��-��� �����������7 ��3����7�� 8��<������ �����
�� �1����������I��1�������3��!3����! ���I�������������H��� K��
�<����������3�������� ��!��!��������������!�1����� ��� �
9�!1������� ��������� ���� ��������7 ��������������
��� ����<��������L���2���� ���I�����������1 ���K��
&<���7����!�����*���7��3�!������������������������5
EV CITY CASEBOOK // BRABANTSTAD PG_22
EV & EVSE STATUS
=$%&&��==$%%*��H ���8����(��"���������"�L�7���"�O�-L����������7"�#���8�������8���8��������������HH$%&&�!����8����-����87���8���������������@�������������������������J'�8���� �!"�$%%*��!��������������������� �����:��������
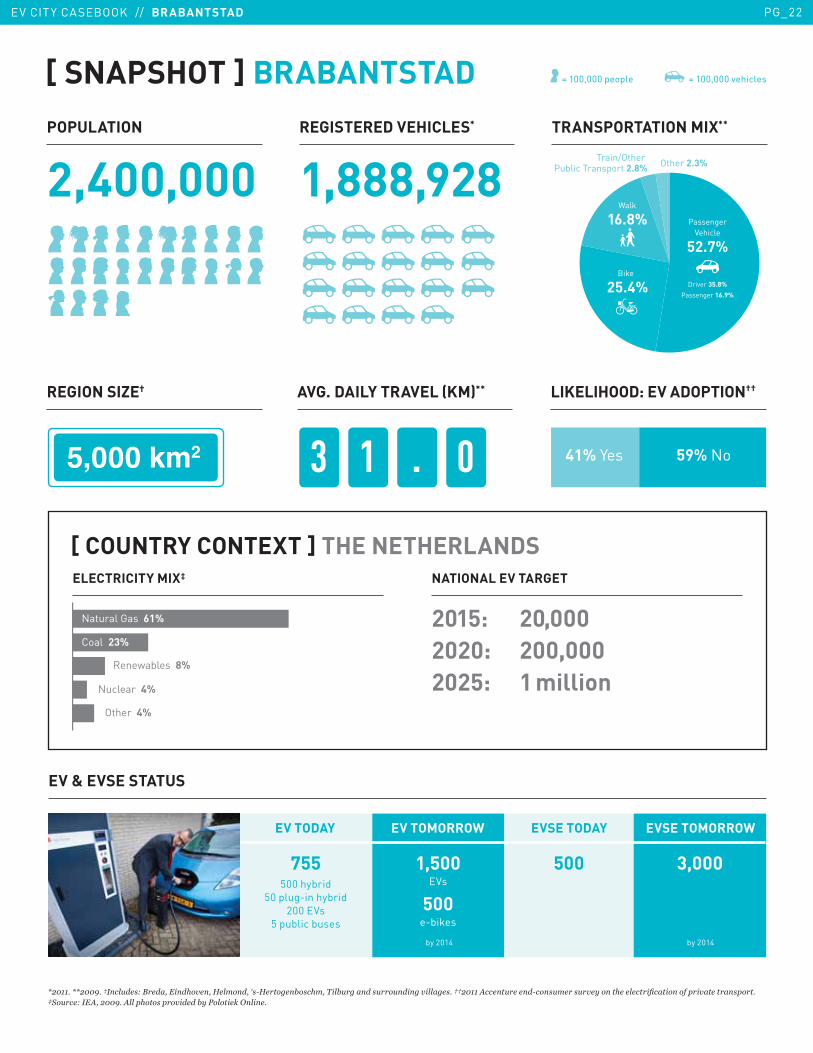
[ SNAPSHOT ] BRABANTSTAD
755 500 hybrid
50 plug-in hybrid200 EVs
5 public buses
500 3,0001,500EVs
500e-bikes
by 2014 by 2014
Train/Other Public Transport 2.8%
Other 2.3%
Walk
16.8%
Driver 35.8%
Passenger 16.9%
PassengerVehicle
52.7%
Bike
25.4%
[ COUNTRY CONTEXT ] THE NETHERLANDS
NATIONAL EV TARGET
2015: 20,000
2020: 200,000
2025: 1 million
ELECTRICITY MIX‡
Renewables 8%
Nuclear 4%
Other 4%
Coal 23%
Natural Gas 61%
POPULATION
2,400,000
REGISTERED VEHICLES*
1,888,928
TRANSPORTATION MIX**
3 1 . 0�������� 41% Yes 59% No
REGION SIZE† AVG. DAILY TRAVEL (KM)** LIKELIHOOD: EV ADOPTION††
EV TODAY EV TOMORROW EVSE TODAY EVSE TOMORROW
= 100,000 people = 100,000 vehicles
EV CITY CASEBOOK // BRABANTSTAD PG_23
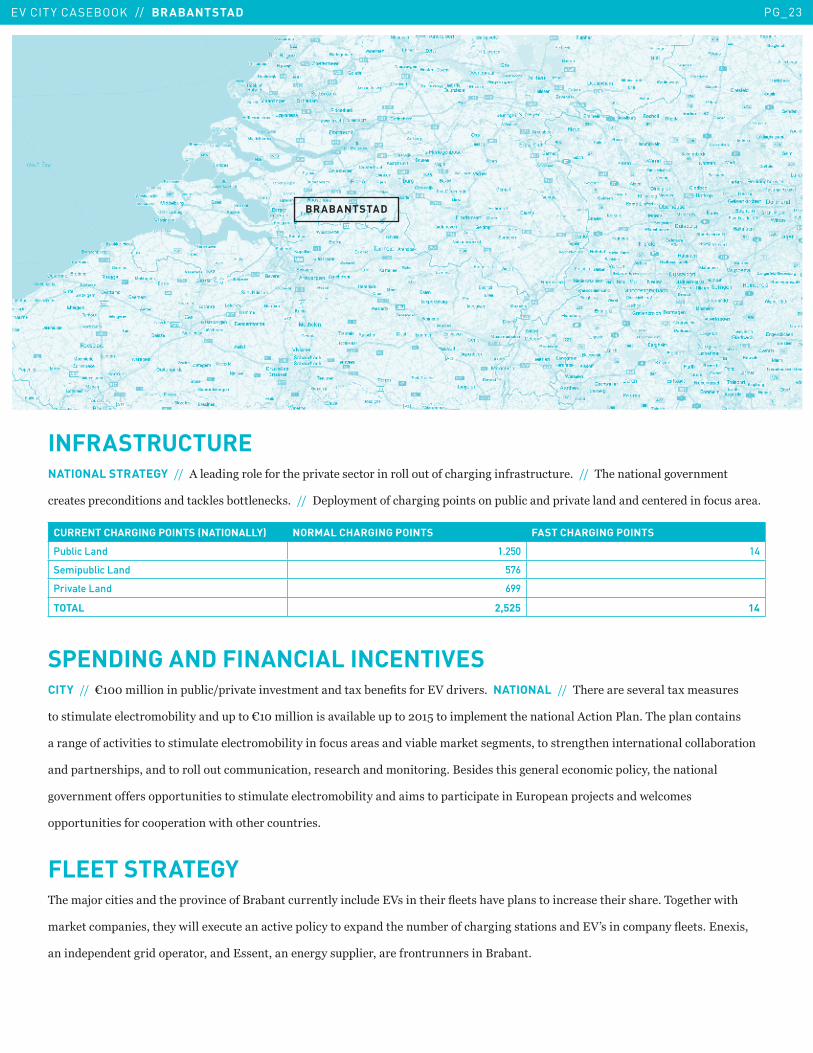
INFRASTRUCTURENATIONAL STRATEGY������������������������3��������� ���������������!������3�������� ��!��!��5������43�������������������
����� ������������� ������*�� �1��������* 5���������������������3��������� �����!1������������������������������������! ���5�
CURRENT CHARGING POINTS (NATIONALLY) NORMAL CHARGING POINTS FAST CHARGING POINTS
Public Land 1,250 14
Semipublic Land 576
Private Land 699
TOTAL 2,525 14
SPENDING AND FINANCIAL INCENTIVESCITY������P����������������!1��������������� ����������(�1���?� ������2������� 5��NATIONAL������43������� �������(��� !�� �
��� ���!�������������1���������!�����P������������ ����1���!��������%���������������3����������������'��5�43������������ ��
���������������� ���� ���!�������������1������������! ��� ������1�����*��� ����� ����� �����3�������������������1�������
��������� 3�� ��������������!������!����������� ���3�������������5�.� ��� ��3� �������������������������3����������
��������������� �������!����� ���� ���!�������������1����������� ������������������!���������H��� ����7������ ��
������!����� ����������������7��3���3�����!����� 5�
FLEET STRATEGY43���H�������� �����3��������������.�1����!������������!����2 �����3����>��� �3������ ��������� ���3���� 3��5�4���3���7��3�
��*���������� ���3���7�����(��!����������������������(�����3���!�1�������3���� ����� �����2@ �����������>��� 5����(� ���
������������������������������� ������������� !�����������������!���� ����.�1��5
BRABANTSTAD
EV CITY CASEBOOK // BRABANTSTAD PG_24
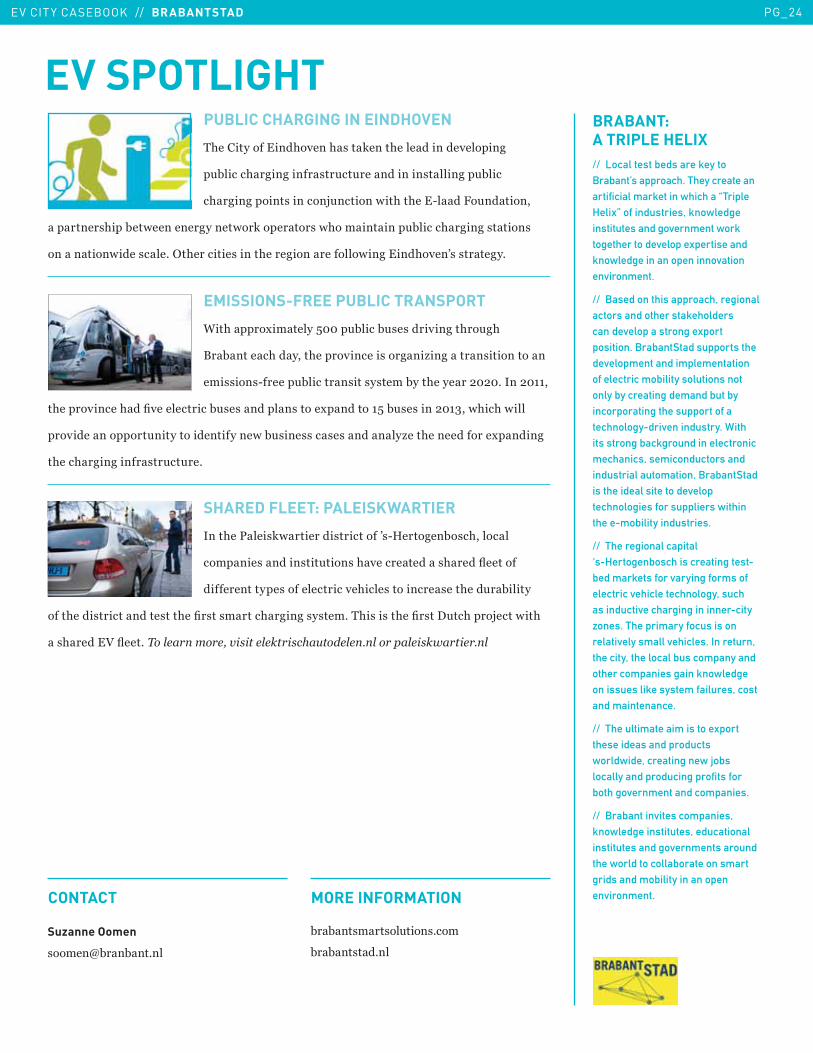
PUBLIC CHARGING IN EINDHOVEN
43��������������3�����3 ��*����3��������������������
�!1�����3�������� ��!��!����������� �������!1����
�3��������� �������H!�������7��3��3���I���"�!���������
������� 3���1��7�������������7��*�������� �73����������!1�����3���� ����� ��
���������7���� ���5���3�������� �����3����������������7�������3����@ � �����5
EMISSIONS-FREE PUBLIC TRANSPORT
B��3�����(�������%����!1����1! � ���������3��!3�
.�1�����3������3������������ �����L������� �����������
��� ��� I������!1������� ��� � ����1���3����������5����������
�3�����������3��?������������1! � ������� �����(��������%�1! � �������&��73��3�7����
����������������!�������������������7�1! ��� �� � �������L���3������������(������
�3���3�������� ��!��!��5��
SHARED FLEET: PALEISKWARTIER
����3��'��� *7�������� ���������@ I0������1� �3�������
������� ������ ���!���� �3����������� 3����>�������
�������������� ���������������3���� ��������� ���3���!�1�������
����3���� ����������� ���3��?� �� �����3���� � ���5�43� �� ��3��?� ���!��3����H����7��3��
� 3�����2�>���5�#������7��"��������:������8����������������:3�������
BRABANT:
A TRIPLE HELIX
// Local test beds are key to Brabant’s approach. They create an artificial market in which a “Triple Helix” of industries, knowledge institutes and government work together to develop expertise and knowledge in an open innovation environment.
// Based on this approach, regional actors and other stakeholders can develop a strong export position. BrabantStad supports the development and implementation of electric mobility solutions not only by creating demand but by incorporating the support of a technology-driven industry. With its strong background in electronic mechanics, semiconductors and industrial automation, BrabantStad is the ideal site to develop technologies for suppliers within the e-mobility industries.
// The regional capital ‘s-Hertogenbosch is creating test-bed markets for varying forms of electric vehicle technology, such as inductive charging in inner-city zones. The primary focus is on relatively small vehicles. In return, the city, the local bus company and other companies gain knowledge on issues like system failures, cost and maintenance.
// The ultimate aim is to export these ideas and products worldwide, creating new jobs locally and producing profits for both government and companies.
// Brabant invites companies, knowledge institutes, educational institutes and governments around the world to collaborate on smart grids and mobility in an open environment.
EV SPOTLIGHT
Suzanne Oomen
�����R1��1��5��
1�1�� ��� ��!���� 5����
1�1�� ��5��
CONTACT MORE INFORMATION
EV CITY CASEBOOK // GOTO ISLANDS, NAGASAKI PG_25
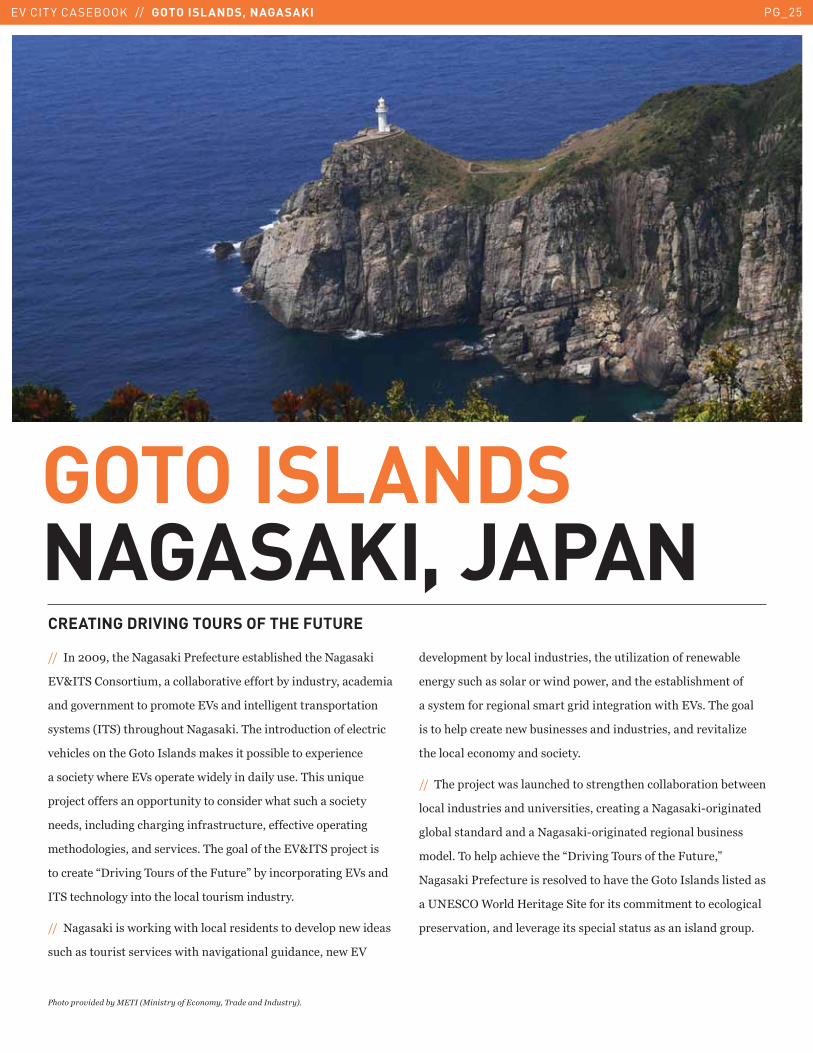
CREATING DRIVING TOURS OF THE FUTURE
���������� ���3��6 *��'������!���� �1�� 3����3��6 *��
�2S�4-���� ����!��������1��������������1�����! �����������
�������������������������2 ������������������ ���������
� ��� �9�4-<��3��!3�!��6 *�5�43��������!������������������
��3���� �����3��C����� ��� ��*� ������ �1�������(���������
� �������73�����2 ��������7��������������! �5�43� �!��J!��
���H��������� ���������!����������� �����73�� !�3�� �������
���� ������!�����3�������� ��!��!����������������������
���3������� ����� ������ 5�43���������3���2S�4-����H����� �
���������:�������4�!� �����3��"!�!��;�1���������������2 ����
�4-����3������������3���������!�� �����! ���5
����6 *��� �7��*���7��3�������� ����� ��������������7���� �
!�3� ���!�� �� ������ �7��3����������!���������7��2�
������������1����������! ���� ���3��!����L������������71���
������ !�3� � �������7������7��������3��� �1�� 3���������
� � ��������������� ������������������7��3��2 5�43������
� ����3������������7�1! ��� � �������! ���� ������������L��
�3������������������ ������5
����43�����H����7 ��!��3������ �����3�������1�������1��7����
��������! ���� ����!����� ���� ����������6 *�I���������
��1�� ����������6 *�I����������������1! ��� �
�����5�4��3�����3������3��:�������4�!� �����3��"!�!���;�
6 *��'������!���� ��� ���������3����3��C����� ��� ��� ���� �
�/6�-���B�����0������-���������� ������������������������
��� ��������������������� � ������ ��! � ���� ������!�5�
�����������
GOTO ISLANDSNAGASAKI, JAPAN
����������������;�# �1;����������������7�"�#������ ��8����2�
EV CITY CASEBOOK // GOTO ISLANDS, NAGASAKI PG_26
=D���������@�"�P�����'������Q������7�����������7�$%&%��='�8��� �!"�$%%*�� ����������������;�# �1;����������������7�"�#������ ��8����2�
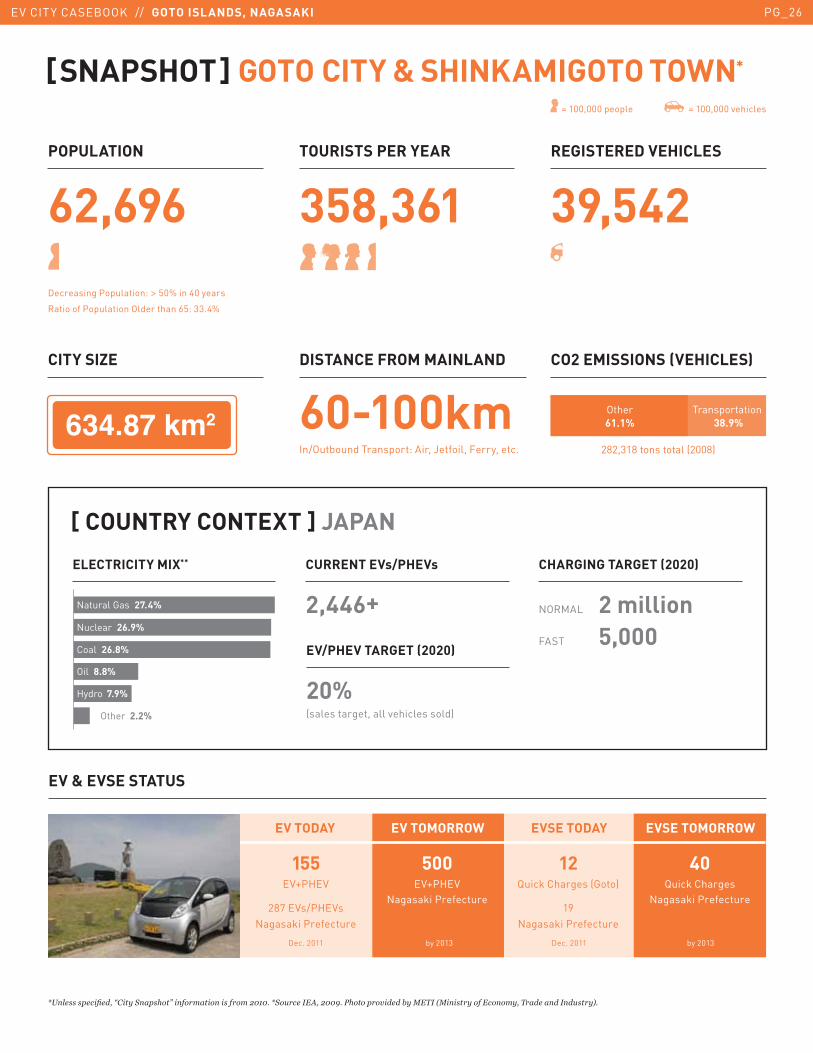
[ SNAPSHOT ] GOTO CITY & SHINKAMIGOTO TOWN*
155EV+PHEV
287 EVs/PHEVs Nagasaki Prefecture
500EV+PHEV
Nagasaki Prefecture
40Quick Charges
Nagasaki Prefecture
12Quick Charges (Goto)
19 Nagasaki Prefecture
Dec. 2011 Dec. 2011by 2013 by 2013
POPULATION
62,696
TOURISTS PER YEAR
358,361
REGISTERED VEHICLES
39,542
CITY SIZE DISTANCE FROM MAINLAND
60-100kmIn/Outbound Transport: Air, Jetfoil, Ferry, etc.
CO2 EMISSIONS (VEHICLES)
� �������
282,318 tons total (2008)
Transportation 38.9%
Other61.1%
[ COUNTRY CONTEXT ] JAPAN
ELECTRICITY MIX** CURRENT EVs/PHEVs
2,446+
CHARGING TARGET (2020)
NORMAL 2 million
FAST 5,000EV/PHEV TARGET (2020)
20% (sales target, all vehicles sold)
Nuclear 26.9%
Natural Gas 27.4%
Other 2.2%
Oil 8.8%
Hydro 7.9%
Coal 26.8%
EV & EVSE STATUS
EV TODAY EV TOMORROW EVSE TODAY EVSE TOMORROW
Decreasing Population: W�50% in 40 years
Ratio of Population Older than 65: 33.4%
= 100,000 people = 100,000 vehicles
EV CITY CASEBOOK // GOTO ISLANDS, NAGASAKI PG_27
©2012 SK M&C, ZENRIN
GOTO ISLANDS, NAGASAKI
EV CITY CASEBOOK // GOTO ISLANDS, NAGASAKI PG_28
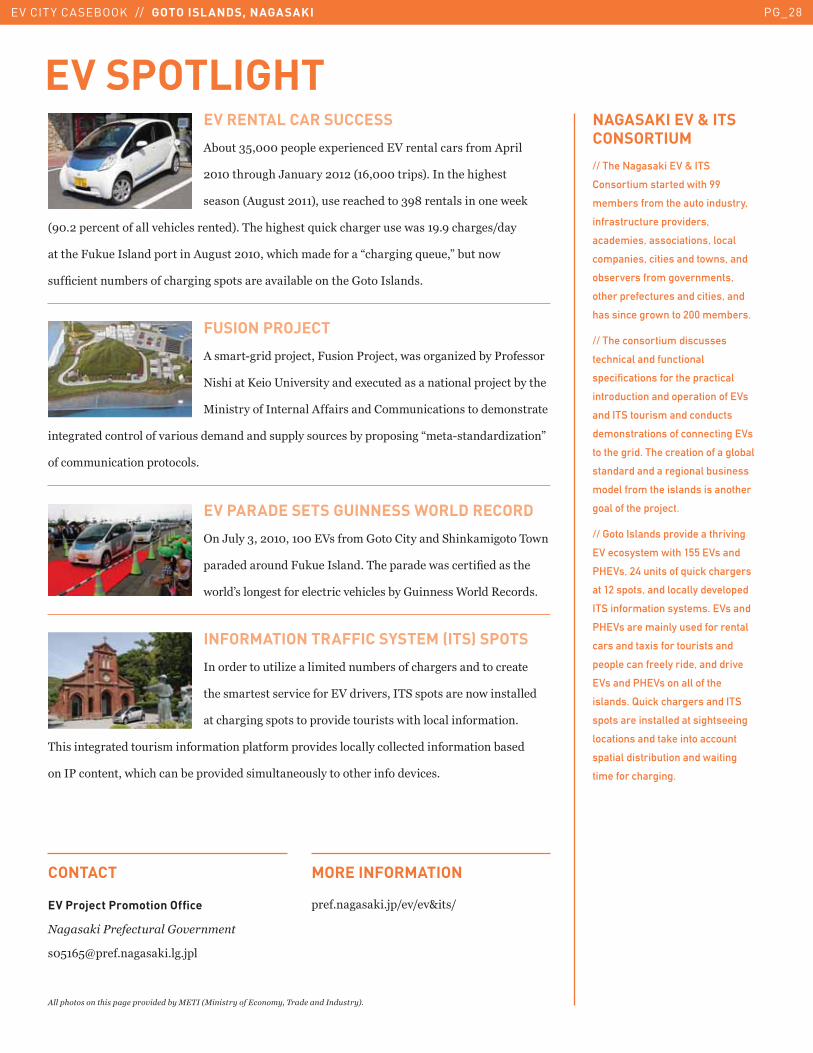
EV RENTAL CAR SUCCESS
�1�!��&%�������������(�����������2��������� �������������
������3��!3�G�!��������9�Q��������� <5�����3��3�3� ���
� ���9�!! ������<��! �����3������& ,������ ��������7��*�
9 �5������������������3���� �������<5�43��3�3� ��J!��*��3����! ��7 �� 5 ��3�� �����
���3��"!*!��� �������������!! ��������73��3����������:�3����J!�!��;�1!����7�
!�?�������!�1�� �����3���� ��� �������1�������3��C����� ��� 5
FUSION PROJECT
�� ���I�������H�����"! ����'��H�����7 �����L���1��'���� ���
6� 3����D����/����� ��������(��!���� ������������H����1���3��
+��� �������������������� ��������!������� ��������� �����
������������������������! ���������� !����� �!��� �1������� ���:���I ������L����;�
�������!���������������� 5
EV PARADE SETS GUINNESS WORLD RECORD
���G!���&�������������2 ������C������������-3��*������4�7��
��������!���"!*!��� ���5�43�������7 ������?��� ��3��
7����@ ����� �����������������3���� �1��C!���� �B�����)����� 5
INFORMATION TRAFFIC SYSTEM (ITS) SPOTS
������������!����L������������!�1�� �����3��� �������������
�3�� ���� �� ������������2������� ���4-� ��� ������7��� �������
���3���� ��� ��������������!�� � �7��3����������������5��
43� ������������!�� ���������������������������� �����������������������������1 ����
����'����������73��3����1����������� ��!�����! ��������3�������������� 5
NAGASAKI EV & ITS
CONSORTIUM
// The Nagasaki EV & ITS
Consortium started with 99
members from the auto industry,
infrastructure providers,
academies, associations, local
companies, cities and towns, and
observers from governments,
other prefectures and cities, and
has since grown to 200 members.
// The consortium discusses
technical and functional
specifications for the practical
introduction and operation of EVs
and ITS tourism and conducts
demonstrations of connecting EVs
to the grid. The creation of a global
standard and a regional business
model from the islands is another
goal of the project.
// Goto Islands provide a thriving
EV ecosystem with 155 EVs and
PHEVs, 24 units of quick chargers
at 12 spots, and locally developed
ITS information systems. EVs and
PHEVs are mainly used for rental
cars and taxis for tourists and
people can freely ride, and drive
EVs and PHEVs on all of the
islands. Quick chargers and ITS
spots are installed at sightseeing
locations and take into account
spatial distribution and waiting
time for charging.
EV SPOTLIGHT
!��������������������������������;�# �1;����������������7�"�#������ ��8����2�
EV Project Promotion Office
)��:�� ����8��������7���
�%�Q%R����5� *�5�5H��
CONTACT
����5� *�5H�������S�� �
MORE INFORMATION
EV CITY CASEBOOK // HAMBURG PG_29
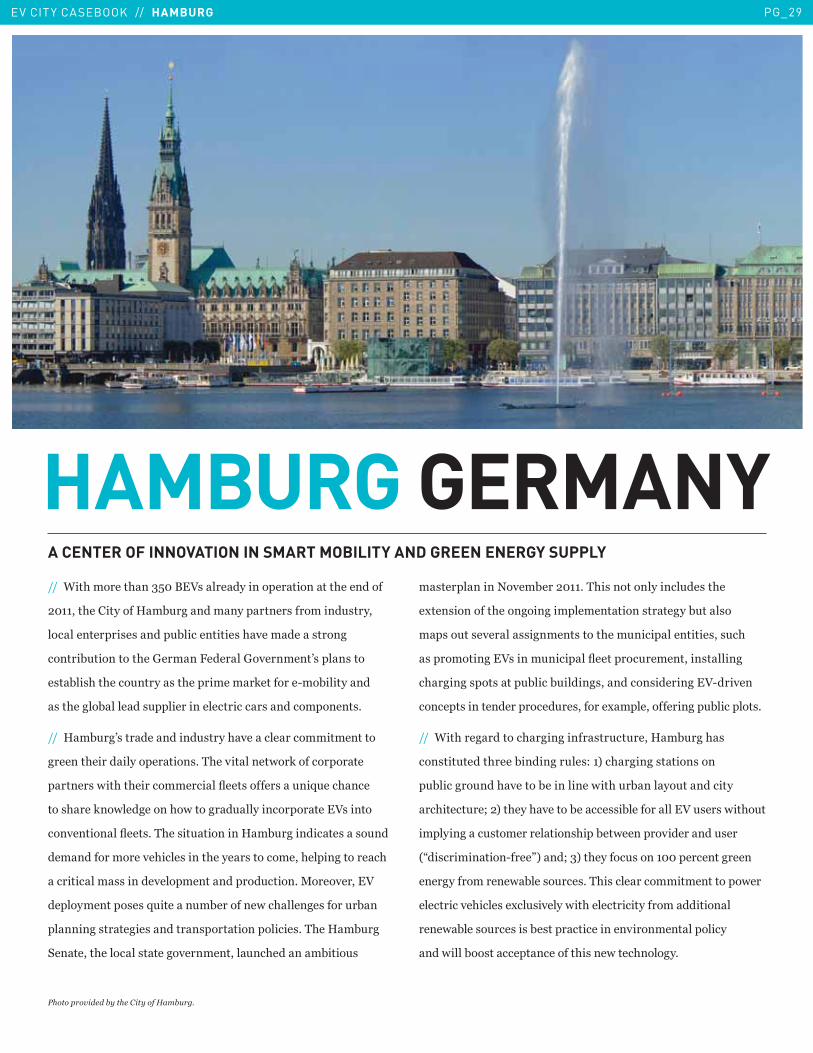
HAMBURG GERMANYA CENTER OF INNOVATION IN SMART MOBILITY AND GREEN ENERGY SUPPLY
����B��3�������3��&%��.�2 ����������������������3���������
�������3����������0�1!��������������� ���������! �����
������������� � �����!1����������� �3�������� �����
������1!���������3��C�����"������C���������@ ���� ����
� �1�� 3��3����!����� ��3����������*��������I��1����������
��3����1������ !��������������������� ������������� 5
����0�1!�@ ������������! ����3�����������������������
������3����������������� 5�43����������7��*�������������
������ �7��3��3��������������>��� ������ ��!��J!���3����
��� 3���*��7��������3�7������!����������������2 ������
������������>��� 5�43�� ��!��������0�1!��������� �� �!���
�����������������3���� �����3����� ����������3������������3�
���������� �����������������������!�����5�+����������2�
������������� � �J!������!�1��������7��3����� �����!�1��
������� ������ ������� ���������������� 5�43��0�1!��
-�������3������� ����������������!��3������1����! �
� ����������6����1�������5�43� ��������������!�� ��3��
�(��� ��������3���������������������� ������1!��� ��
�� ��!�� ������ ������ �����3���!�������������� �� !�3�
�����������2 �����!�������>��������!���������� ������
�3���� ��� ����!1����1!����� �������� ��������2I�������
������� �����������������!�� �������(���������������!1�������� 5
����B��3����������3�������� ��!��!����0�1!��3 �
��� ���!�����3����1�������!�� 8��<��3���� ����� ����
�!1������!���3������1����������7��3�!�1�����!����������
��3�����!��K��<��3���3������1����� �1�����������2�! �� �7��3�!��
����������! ������������� 3���1��7����������������! ���
9:�� ����������I����;<���K�&<��3������! ���������������������
���������������71��� �!��� 5�43� ����������������������7���
�����������3���� ��(��! ������7��3���������������������������
����71��� �!��� �� �1� ����������������������������������
���7����1�� ���������������3� ���7����3�����5
����������� ���������������������������L7�8���
EV CITY CASEBOOK // HAMBURG PG_30
3 2 . 0�����
='�8������������L7�8��"�$%&$��==I����!������������������������������R��� ��8�����1(��R2��HI����;�����#��������!8�������"�E(!"������F���&"�$%&$��HH'�8���)������ �����7�����������7�������"�) �"�$%&&�� ���������������������������L7�8���
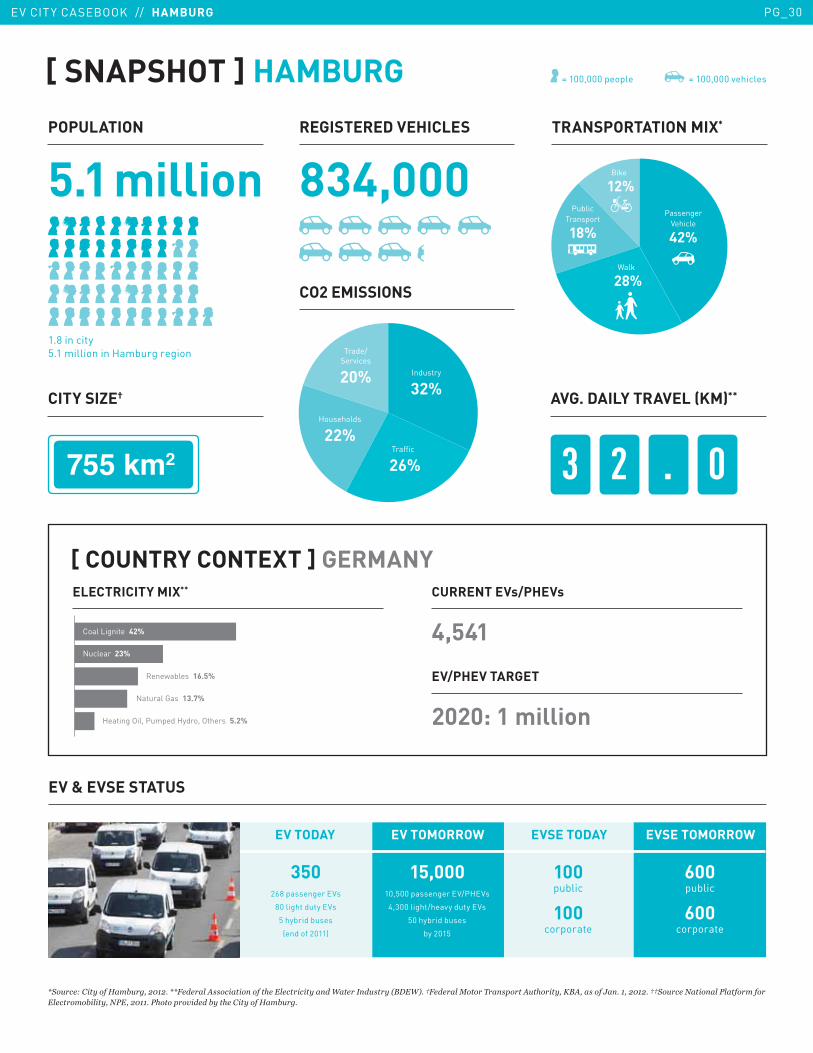
[ SNAPSHOT ] HAMBURG
350 268 passenger EVs
80 light duty EVs
5 hybrid buses
(end of 2011)
15,00010,500 passenger EV/PHEVs
4,300 light/heavy duty EVs
50 hybrid buses
by 2015
600public
600corporate
100public
100 corporate
1.8 in city5.1 million in Hamburg region Trade/
Services
20% Industry
32%
Traffic
26%
Households
22%
PublicTransport
18%
PassengerVehicle
42%
Bike
12%
Walk
28%
= 100,000 people = 100,000 vehicles
POPULATION
5.1 million
REGISTERED VEHICLES
834,000
TRANSPORTATION MIX*
CITY SIZE† AVG. DAILY TRAVEL (KM)**
CO2 EMISSIONS
Natural Gas 13.7%
Heating Oil, Pumped Hydro, Others 5.2%
Nuclear 23%
Coal Lignite 42%
Renewables 16.5%
CURRENT EVs/PHEVs
4,541
EV/PHEV TARGET
2020: 1 million
[ COUNTRY CONTEXT ] GERMANY
ELECTRICITY MIX**
EV & EVSE STATUS
EV TODAY EV TOMORROW EVSE TODAY EVSE TOMORROW
EV CITY CASEBOOK // HAMBURG PG_31
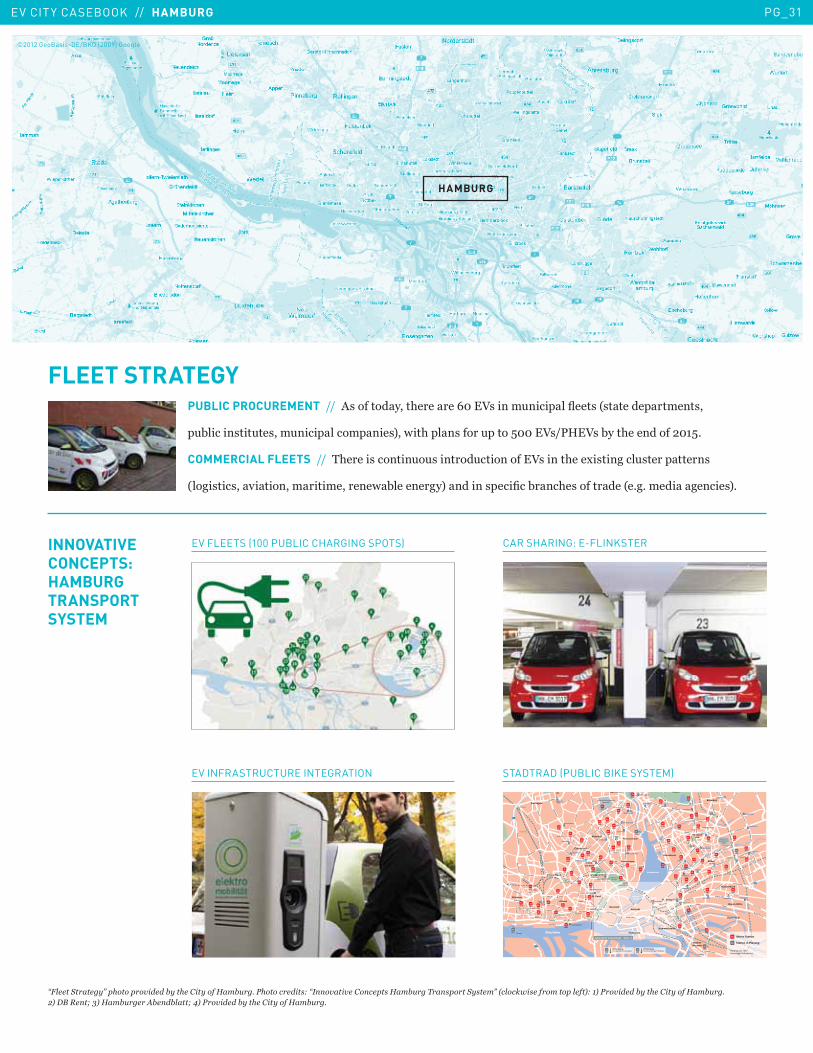
FLEET STRATEGYPUBLIC PROCUREMENT������� �����������3�������Q���2 �����!�������>��� �9 ������������� ��
�!1������ ���!�� ���!�������������� <��7��3���� �����!�����%����2 �'0�2 �1���3������������%5���
COMMERCIAL FLEETS������43����� �������!�! �������!����������2 �����3���(� ������! ���������� �
9��� ��� �����������������������71��������<������� ����?��1���3� ���������9�55����������� <5
PI���'�����Q�����������������������������L7�8���� �������������P ����������������L7�8���#��������'���7Q�1����:3������7��������2��&2� ���������������������L7�8�����$2��(����4�N2�L7�8����!�������4�/2� ���������������������L7�8���
INNOVATIVE
CONCEPTS:
HAMBURG
TRANSPORT
SYSTEM
STADTRAD (PUBLIC BIKE SYSTEM)
Ausschnitt Innenstadt - Seite 2
Hammerbrook
Hamm-Süd
Rothen-burgsort
Hamm-Mitte
Hamm-Nord
HafenCity
St. Georg
AltstadtNeustadt
St. Pauli
Stern-schanze
Rotherbaum
Uhlenhorst
BarmbekSüd
Eilbek
Barmbek
Eimsbüttel
Hoheluft
Eppendorf
Harvestehude
Altona
Altona-Nord
Ottensen
Stellingen
Elbe/Hafen
Binnen-
alster
Außenalster
Hamburg Hbf
Hamburg Dammtor
HamburgAltona
Versmannstr.
Brooktorkai
Dovenfleet
Adenauerallee
Stein
damm
Wallstr.
Eiffestr.
Eiffestr.
Bil
lho
rner
Deic
h
Ausschläger B
illdeich
Billstr.
Borgfelder Str.
Amsinckstr.
Süderstr.
Högerdamm
Heid
enkam
psw
eg
Nagelsw
eg
Ham
mer- b
rookstr.
Spaldingstr.
Nordkanalstr.
K.-Schumacher-Allee
Rödin
gsm
ark
t
Vorsetzen
Ballin
dam
mJungfernstieg
Alt
er
Elb
tun
nel
Hols
tenw
all
Feldstr.
Reeperbahn
Gla
cisc
hauss
ee
Budapester Str.
Ludwig-Erhard-Str.
Willy-Brandt-Str.
Hafenstr. Hel
golä
nd
er
All
ee
Deichtor-platz
Glockengießerw
allSte
into
rwall
HAMMERBROOK
REEPERBAHN
HASSELBROOK
WANDSBEKERCHAUSSEE
FRIEDRICHSBERG
BARMBEK
KÖNIGSTRASSE
UniversitätskrankenhausEppendorf
AllgemeinesKrankenhaus
Eilbek
Stadtpark
Planten unBlomen
Stern-schanzen-
park
Innocentia-park
STERNSCHANZE
HOLSTENSTRASSE
BERLINER TOR
ROTHENBURGSORT
LANDWEHR
Fischmarkt
Zirkus-weg
Paulinenplatz
Gr. Brunnenstr.
Bahren-felderstr.
Völckerstr.
Wo
hlw
ills
tr.
Breite Str.
Peperm
öle
nbek
Mu
seu
mst
r.
Ottenser
Marktplatz
Bernadottestr.
Bleicken-allee
Arnoldstr.
Eulenstr.
Fis
ch
ers
- a
llee
Keplerstr.
Ehrenbergstr.
Beh
nstr.
Chemnitzstr.
Thadenstr.
Eimsbütteler Str.
Schlü
terstr.
Waterloostr.
Hoh
e W
eide
Osterstr.
Em
ilie
nst
r.
Heu
ßweg
Goeb
enstr.
Unnastr.
Wiesenstr.
Stellinger Weg
Eidelstedter Weg
Wrangelstr.
Gra
ndw
eg
Str
ese
man
all
ee
Em
il-And
rese
n-St
r.
Moltkestr.
Löwenstr.
Bism
arckst
r.
Ises
tr.
Oberstr.
Eppendorfer W
eg
Alte Rabenstraße
Leinpfad
Mühle
nkam
p
Kell
ingh
use
nst
r.
Hudtwalck
erstr.
Goldbekufe
r
Bo
rgw
eg
Südring
Südring
Jarrestr.
Harv
este
hud
er W
eg
Schöne A
ussic
ht
Iffland
str.
Normannen-
weg
Horner Weg
Zimmerstr.
Bach
str.
Barth
olo
mäusstr.
Eilbektal
Eilbeker W
eg
Frie
dric
hsberg
er S
tr
Sch
loßgarte
n
Hasselbrookstr.
Papenstr.
Ritte
rstr.
Eilenau
Armgartstr.
Uferstr.
Glückstr. Lortzingstr.
Wagnerstr.
Ho
fweg
Am
Langenzug
L.-Schroeder-Str.
B.-Nocht-Str.Struenseestr.
Gr. Bergstr.
Jessenstr
.
Sch
um
ach
erstr.
Sternschanze
Bern
storf
fstr
.
Palmaille
Große Elbstr.Neumühlen
Max-B
rau
er-
All
ee
Max
-Bra
uer-A
llee
Altonaer S
tr.
Beim S
chlu
mp
Als
enst
r.
Kie
ler S
tr.
Kie
ler S
tr.
Koppelstr.
Hagenbeck
str.
Fruchtallee
Gärt
ners
tr.
Breite
nfelder Str.
Sch
ulte
rbla
tt
Schröderstiftstr.
Grin
delallee
Grin
delb
erg
Hohelu
ftchau
ssee
Sie
richstr.
Sie
richstr.
Sch
wan
en
wik
H.-W
eich
mann-S
tr.
Win
terhuder W
eg
A.-S
chön-
feld
er-S
tr.
Weidestr.
Schle
iden
str.
Barmbeker Str.
Wiesendamm
Saarla
nd
str.
Barm
beker S
tr.
Eppendorfer Baum St. Benedictst
r.
Eppendorf
er
Ldst
r.
Scho
ttm
ülle
rstr.
Mart
inist
r.
Tropto
witzstr
.
Mun
dsbu
rger
Dam
mSch
ürb
eker
Str
.
Bürgerweide
Sievekingsallee
Wandsbeker Chaussee
Wandsbeker Marktst
r.
R.-S
chum
ann-B
r.
Fuhlsb
üttle
r Str.
Habichtstr.
Straßburger Str.
Kra
use
str.
Bra
hm
feld
er
Str
.
er S
tr.
Bra
hmfe
lder
Ch
Dehnhaide
Jüth
ornst
r.
Hammer Ldstr.
Horner Ldstr.
Ham
mer S
tr.
Sieve
kingdam
m
Burg
str.
Mühle
nd
am
m
Sechslingspforte
Ham
burg
er S
tr.
Lerchen
feld
Lo
kste
dte
r Ste
ind
am
m
Hallerstr.
Ro
therb
au
mch
au
ssee
Holste
nstr.
Stresemannstr.
Stresemannstr.
Leunastr.
Holstenkamp
Bo
rnkam
psw
eg
Sch
nacken
bu
rgalle
e
Königstr.
J.-Leber-Str.
Friedensallee
Behringstr.
Elbchaussee
Ho
hen
zoll
ern
rin
g
Bahrenfelder
Steindamm
enfelderssee
Kümmellstr.
Neuer Pferdemarkt
Moorweidenstr.
Binderstr.
Johnsallee
Gri
ndelh
of
Esplanade
Kennedybrücke
An der A
lster
Lombardsbrücke
Plö
ner Str.
Lübecke
r Str
.
DIEBSTEICH
LANGENFELDE
STELLINGEN
Fernsicht
Looge-platz
Millerntor-platz
ST. PAULI
FELDSTRASSE
HALLERSTRASSE
CHRISTUSKIRCHE SCHLUMP
EMILIENSTRASSE
LUTTEROTHSTRASSE
HAGENBECKS
TIERPARK
OSTERSTRASSEHOHELUFTBRÜCKE
KLOSTERSTERN
HUDTWALCKERSTR.
KELLINGHUSENSTR.
BORGWEG
SIERICHSTRASSE
EPPENDORFER BAUM
UHLANDSTRASSE
LÜBECKER STR.
WARTENAU
RITTERSTR.
HAMBURGER STR.
DEHNHAIDE
SAARLANDSTR.
HABICHTSTR.
ALTER TEICHWEG
STRASSBURGER STR.
WANDSBEKER
MARKT
MUNDSBURG
BERLINER TORBURGSTRASSE HAMMER KIRCHE RAUHES HAUS
Allende-platz
Methfesselstr.
Barmbeker Markt
Lindleystr.
7
7
24
Elbtunnel
Nord
schle
swige
r Str.
Wandsb
eker A
llee
Holsteinischer Kamp
FISCHMARKT
FERNSEHTURM
Schloßstr.
Biedermann-platz
Beim AltenSchützenhof
Osterbekstr.
Rüb
en
kam
p
Hellbrookstr.
Düppelstr.
Hin
denburg
str.
Bergedorfer Str.
Vierländer Damm
2316
2151
2251
22242221
2244
2551
2682
2681
2562
2337
2413
2351
2711
WilhelmsburgVeringstraße/Mannesallee
2712
WilhelmsburgBarkassenanleger/Mengestr.
2112
23322326
2334
2336
2333
2134
2126
21242125
2133
2222
2223
2242
2225
22262235
2371
2373
2372
2363
2364
2365
2335
2411
2331
2412
2432
2341
2431
2366
2367
2369
2241
2243
2232
2233
2231
2212
2213
2214
2215
2111
2611
2613
2131
2132
2135
2115
2116
2122
2114
2121
2113
2321
2312
2311
2315
2322
2323
2324
2313
2561
2314
2645
2651
Aktive Station
Station in Planung
Stand: Januar 2012Änderungen vorbehalten
EV INFRASTRUCTURE INTEGRATION
CAR SHARING: E-FLINKSTEREV FLEETS (100 PUBLIC CHARGING SPOTS)
©2012 GeoBasis-DE/BKO (2009) Google
HAMBURG
EV CITY CASEBOOK // HAMBURG PG_32
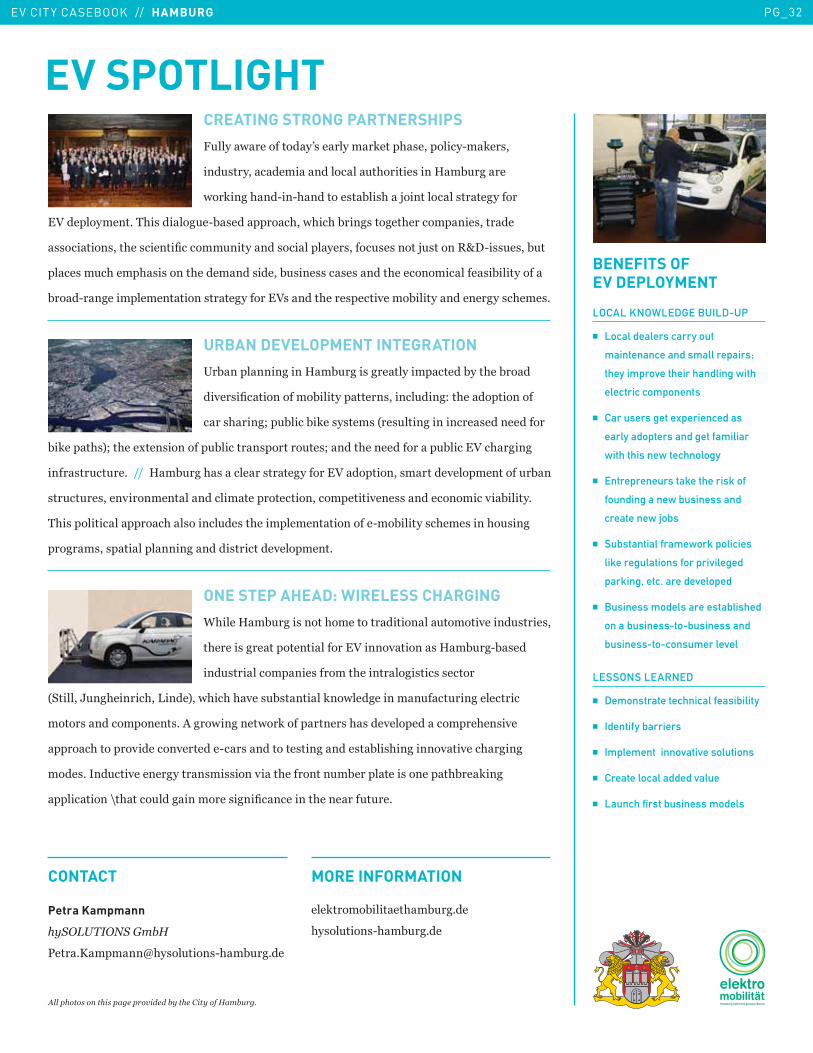
CREATING STRONG PARTNERSHIPS
"!����7����������@ ��������*����3 ���������I�*�� ��
���! �������������������!�3������ ����0�1!�����
7��*���3��I��I3������� �1�� 3��H���������� ����������
�2�����������5�43� �����!�I1 ��������3��73��3�1��� �����3���������� �������
������� ���3�� ������?������!�������� ���������� �����! � �����H! �����)S�I� !� ��1!��
���� ��!�3����3 � �����3�������� �����1! ��� �� � �����3�������������� �1����������
1���I������������������ �����������2 �����3���� ����������1��������������� �3��� 5
URBAN DEVELOPMENT INTEGRATION
/�1������������0�1!��� ���������������1���3��1����
����� �?�����������1������������ ������!���8��3�������������
��� 3���K��!1����1�*�� � ��� �9�� !������������� ������������
1�*����3 <K��3���(��� ��������!1������� �������!�� K�����3�������������!1�����2��3����
���� ��!��!��5������0�1!��3 ������� �����������2���������� �������������������!�1��
��!��!�� �������������������������������������������������� ���������������1�����5�
43� ���������������3�� ������!�� ��3��������������������I��1������ �3��� ����3�! ���
����� �� ����������������� �����������������5
ONE STEP AHEAD: WIRELESS CHARGING
B3����0�1!��� �����3�����������������!������������! ���� ��
�3����� �������������������2����������� �0�1!�I1 ���
���! ������������ �������3��������� ��� � �������
9-������G!�3������3��E����<��73��3�3��� !1 ������*��7����������!���!�������������
����� ������������� 5�����7������7��*���������� �3 ������������������3�� ����
�����3�����������������������I�� ��������� �������� �1�� 3��������������3����
���� 5����!��������������� �� ��������3���������!�1��������� �������31��*���
����������X�3����!����������� ���?���������3�������!�!��5
BENEFITS OF
EV DEPLOYMENT
LOCAL KNOWLEDGE BUILD-UP
�� Local dealers carry out
maintenance and small repairs;
they improve their handling with
electric components
�� Car users get experienced as
early adopters and get familiar
with this new technology
�� Entrepreneurs take the risk of
founding a new business and
create new jobs
�� Substantial framework policies
like regulations for privileged
parking, etc. are developed
�� Business models are established
on a business-to-business and
business-to-consumer level
LESSONS LEARNED
�� Demonstrate technical feasibility
�� Identify barriers
�� Implement innovative solutions
�� Create local added value
�� Launch first business models
EV SPOTLIGHT
Petra Kampmann
��'�<D# �)'��7�L
'���5D�����R3� ��!���� I3�1!�5��
���*�����1������3�1!�5���
3� ��!���� I3�1!�5��
CONTACT MORE INFORMATION
!�������������������������������������������L7�8���
EV CITY CASEBOOK // HELSINKI PG_33
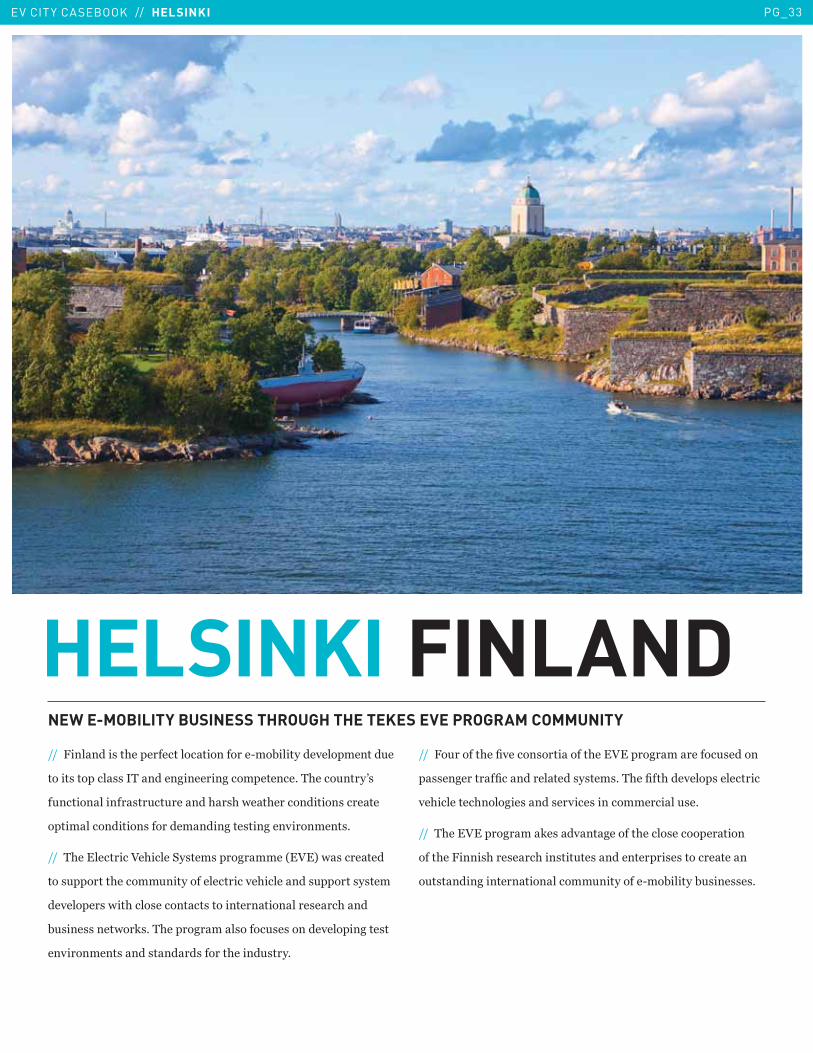
HELSINKI FINLANDNEW E-MOBILITY BUSINESS THROUGH THE TEKES EVE PROGRAM COMMUNITY
����"������� ��3�����������������������I��1�������������������!��
����� ������� ��4������������������������5�43����!����@ �
�!������������ ��!��!������3� 3�7��3������������ �������
���������������� ��������������� ��������������� 5
����43�����������2�3�����-� ��� ���������9�2�<�7 ��������
��� !�������3������!�������������������3�������� !������ � ����
��������� �7��3���� �������� ������������������ ���3����
1! ��� ����7��* 5�43��������� �����! � ���������������� ��
����������� ���� ����� ������3�����! ���5�
����"�!������3��?������ ���������3���2��������������! ������
� ��������?������������ � ��� 5�43��?��3�������� ����������
��3��������3������ ���� ������ ��������������! �5
����43���2��������*� �����������3����� �������������
����3��"���� 3��� ���3��� ���!�� ������������ � ������������
�!� ����������������������!���������I��1������1! ��� � 5
EV CITY CASEBOOK // HELSINKI PG_34
='�8����D����!8���"�$%%/�=='�8���� �!�$%%*
������
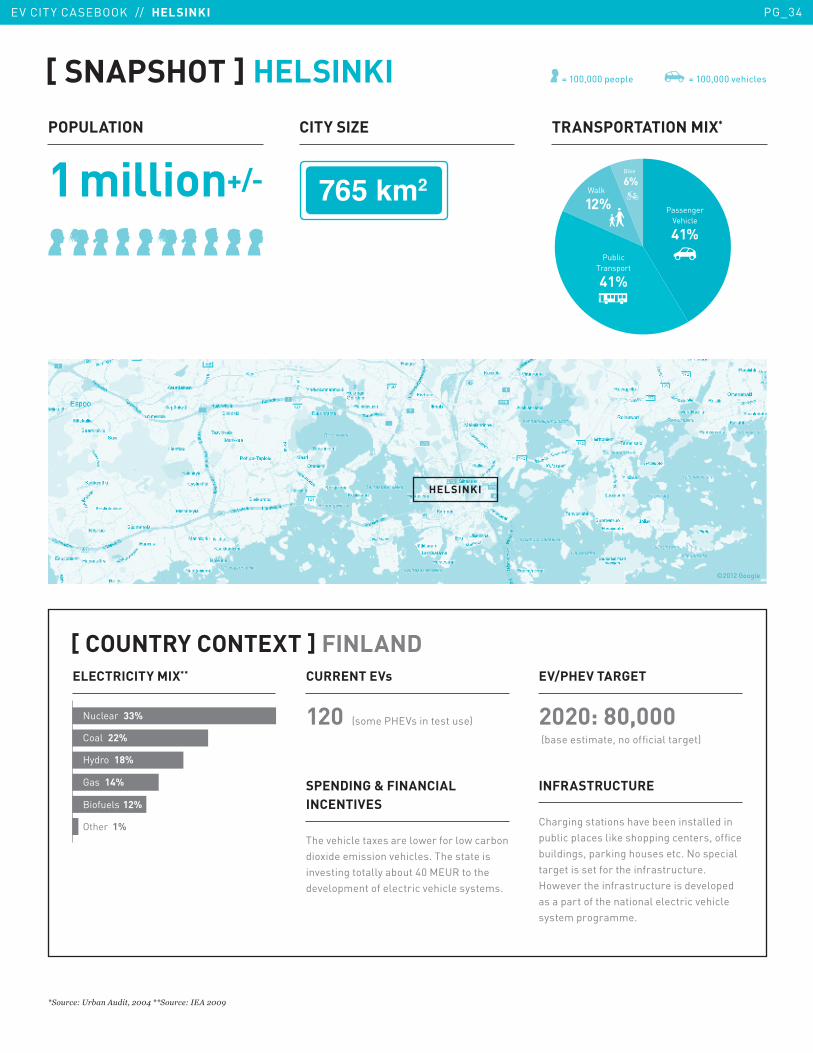
[ SNAPSHOT ] HELSINKI
©2012 Google
POPULATION
1 million+/-
CITY SIZE TRANSPORTATION MIX*
CURRENT EVs
120 (some PHEVs in test use)
SPENDING & FINANCIAL
INCENTIVES
The vehicle taxes are lower for low carbon dioxide emission vehicles. The state is investing totally about 40 MEUR to the development of electric vehicle systems.
INFRASTRUCTURE
Charging stations have been installed in public places like shopping centers, office buildings, parking houses etc. No special target is set for the infrastructure. However the infrastructure is developed as a part of the national electric vehicle system programme.
EV/PHEV TARGET
2020: 80,000 (base estimate, no official target)
[ COUNTRY CONTEXT ] FINLAND
ELECTRICITY MIX**
Gas 14%
Hydro 18%
Biofuels 12%
Other 1%
Coal 22%
Nuclear 33%
= 100,000 people = 100,000 vehicles
HELSINKI
PublicTransport
41%
Bike
6%Walk
12% PassengerVehicle
41%
EV CITY CASEBOOK // HELSINKI PG_35
EV SPOTLIGHT
������������1����������������������2��&2�!&$N�'���7�4�$2� ����������5##�#���������������I������
EVC: HELSINKI’S COMMERCIAL ELECTRIC VEHICLE PROGRAM
0�� ��*�@ ��2��������*� ��:�������1������������3;������ ���������3��1� �� ��!���� �����
���������������������3���� ������ ������5�43� ������3�������� ���������1������������3��
! �� ������� ��������2I�������1! ��� � 5�244�4��3�����)� ���3�����������"������� �������
�������������������2�3���� �9��2<��������7������ �������������������������3���� �����3����
� ��� ������������� 5�� �244@ �> 3���������������3�������� ��* ����������!������������1! � ������0�� ��*����������?��
��� !������)S�������������1������ 5��������2�7��������������������� �����7����I�� ��� ���3������ �������� ��!��!���
�������������������������3���� �������� ����1���� ����������3���� ������1! � ���� ������!�* ������3�����3����7��*���
��3�����5�43�����H����!���� ��� ������3��"���� 3�������� ������ ���3������� �7��*�������3� ���5�43�������� ���3������ �
�����2���8��<��3�1��������!������������1! � ����3�����3������1������3���������������3������������ ����������3�������������
��������� K��<��3�������������3���������� ���������������������������!����������� ������3�����1������������������� �
����� !1 � ��� ����� � ��� � ���������3���2���� ������������3���2K��&<��1��������� ���������������� �� � ��� ������3���� ��
��� ��!���������������������������� K����=<�?������ �������� � ������������������!����5������2�����4�� �����"������
� ��*������������� �7��*����7��3�244���� ����!���3��?� �����������1! �?������ �����"�����5�2�����4�� �����"������7�����������
����������1���������������1! � ����� ��������244�7���� !�������3�����H����7��3���I����3���������������!���� 5�������������
������������� ���3�1! �7 �1!�����������������������������������������1���3I��*��5�"����(���������(��� ����1�������� ��
�1�� �����������(������3�����������1! �)S���������� 5�-���������I���������������������� �����3��������3�� ���� ��!������3��
���H����3������������������ ������ �����1��3�"���� 3�������������������! ����������� 5
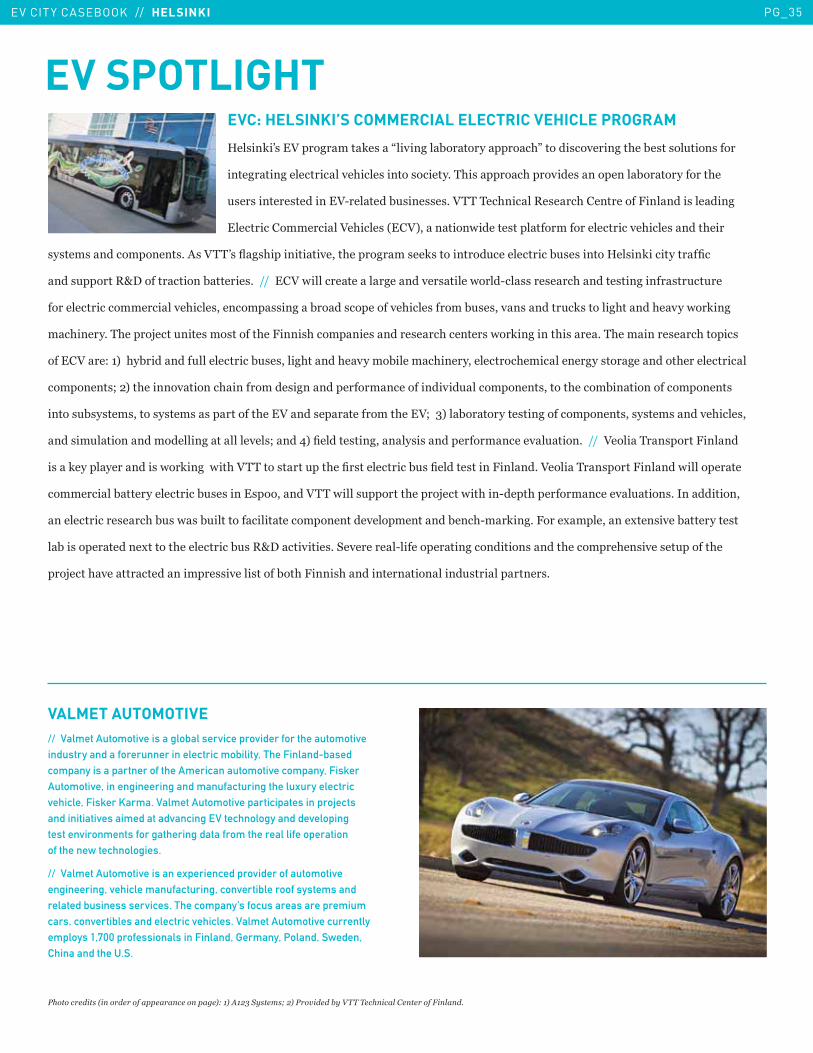
VALMET AUTOMOTIVE
// Valmet Automotive is a global service provider for the automotive industry and a forerunner in electric mobility. The Finland-based company is a partner of the American automotive company, Fisker Automotive, in engineering and manufacturing the luxury electric vehicle, Fisker Karma. Valmet Automotive participates in projects and initiatives aimed at advancing EV technology and developing test environments for gathering data from the real life operation of the new technologies.
// Valmet Automotive is an experienced provider of automotive engineering, vehicle manufacturing, convertible roof systems and related business services. The company’s focus areas are premium cars, convertibles and electric vehicles. Valmet Automotive currently employs 1,700 professionals in Finland, Germany, Poland, Sweden, China and the U.S.

EV CITY CASEBOOK // HELSINKI PG_36
OPEN PLATFORM COLLABORATION
43������/�1��E���������������9�/E<�� ����������������������������7�!�1��������������
������������1�����I����������3������ 5�43���/E��� ������ ���3���� ���������� �����
�3�����!�� �����!���������������!���������������3���� � �7���� ��3������������� �1���������
���������������� ������!��������! ��3���� ��!���� 5�43������������������ �����������
������������7��������3�����������������!����L��������������� �����J!���������� ������ 5��
�����/E�� ������� ������ ��������������� 8��<��2�4��3��������<��! ����������!���
&<�+�*���+*������ � ��� ������=<�B�����������������E�7���1�������� 5��
�����/E�������� ��3�������������������7��2I����������3������ ���� ������ � �7����
� �����3�� ����������������7��*������ !������������������������L���������3��
����� ��������� !�� � �7���� ��3����!����L�����1��3��������������������������5��
43! ���3������������3 ��3��������� ��� 8����������� ���3I���������������������5�
����'�������� �����/E�����!��8������������ K�������� � !�3� �-����! ����2�����
�!��������K��!1���� ����������L���� ��!����� ��������� ���3��� ���!�� �� !�3� ������
/����� ������3��4��3�����/����� �������E����������0�*���-�3��������������� ���
����3��4��3�����)� ���3�����������"������9244<� �7���� ��3����������� ���U���7��3�
��������������������7��* ������ !����3���3���� ���3�������1!���� �7��������������������
�� !�� �������������� ��!���� 5������I���7��������7����"���������-8������������7����7����
L���:�L8����������8����7����F8����L8�::���������8����7
ECO URBAN LIVING:
OPEN PLATFORM
COLLABORATION
Electric Traffic Helsinki Test Bed
(Electrictraffic.fi) is an R&D
and networking project that looks
into the design of services within
an electric traffic ecosystem of
the future. Behind the project
is a unique private-public
partnership between 20 Finnish
and international companies,
five cities, three educational and
research institutes as well as
local and national authorities.
Electricttraffic.fi is the largest of
Tekes EVE program projects and
one of World Design Capital 2012
Helsinki projects.
// The companies behind the
project include energy companies
like Siemens; Fortum and Helsingin
Energia; infranet solutions
provider Eltel Networks; charging
equipment manufacturer Ensto;
construction group Lemminkäinen;
electrical components wholesaler
SLO; vehicle importer Veho; retail,
grocery store and restaurant
operator HOK-Elanto–and many
others.
// The project’s focal points are
the services EV users need and the
infrastructures behind them. The
project companies are building a
fully-functional EV ecosystem in
the Helsinki capital area–including
a test fleet of several hundred EVs–
that allows an EV driver to take
advantage of all the charging points
of different electricity providers
without the need of becoming a
direct client of them all.
// To learn more, please visit
electrictraffic.fi or email
EV SPOTLIGHT
EV CITY CASEBOOK // KANAGAWA PG_37
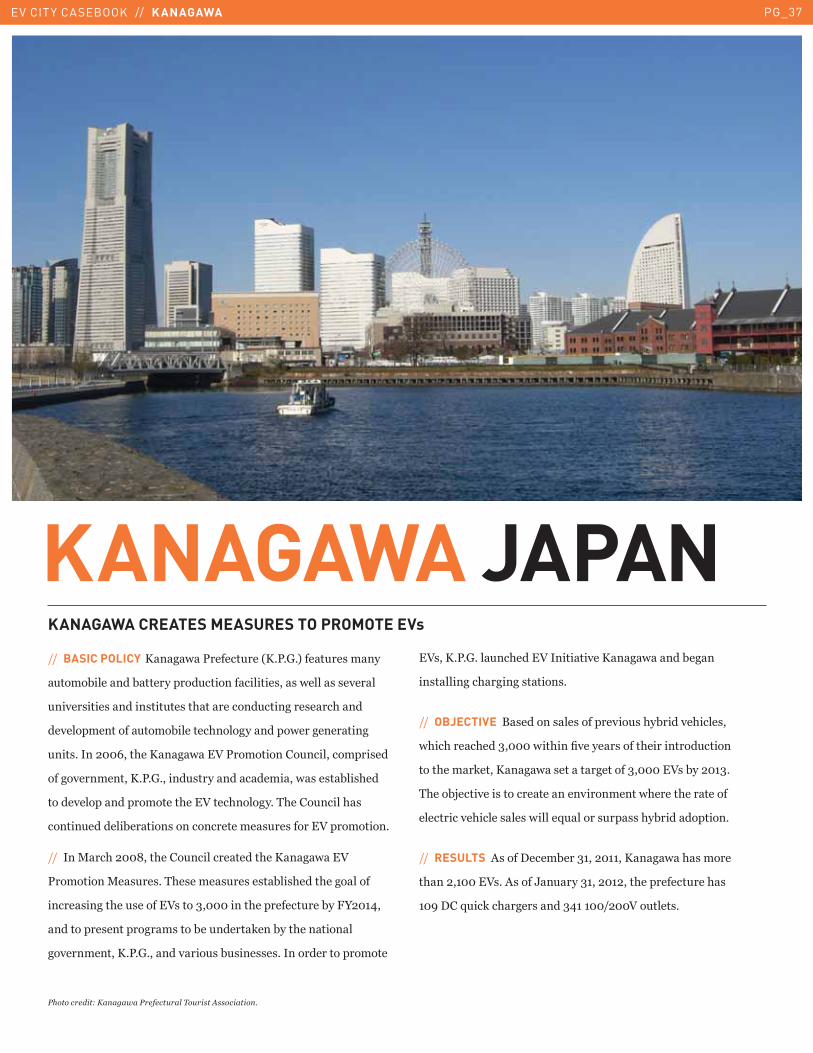
KANAGAWA CREATES MEASURES TO PROMOTE EVs
����BASIC POLICY�D�7�'������!���9D5'5C5<����!�� �����
!����1�������1����������!�������������� �� �7���� � ������
!����� ���� ������ ���!�� ��3���������!������� ���3����
���������������!����1�������3�����������7�����������
!��� 5�������Q���3��D�7��2�'�����������!������������ ���
��������������D5'5C5�����! ��������������7 �� �1�� 3���
�����������������������3���2����3�����5�43����!�����3 �
������!�������1������ ��������������� !�� ������2����������5
�������+��3����,���3����!�������������3��D�7��2�
'���������+� !�� 5�43� ���� !�� �� �1�� 3����3��������
����� ����3��! ������2 ����&���������3���������!���1��"F���=��
��������� ��������� ����1��!�����*���1���3���������
�����������D5'5C5���������! �1! ��� � 5���������������������
�2 ��D5'5C5��!��3����2�����������D�7����1���
�� �������3���� ����� 5�
����OBJECTIVE . ������ �� ����������! �3�1������3���� ��
73��3����3���&�����7��3���?������ �����3����������!�������
����3����*����D�7� ������������&������2 �1�����&5��
43���1H�������� ������������������������73�����3���������
�����������3����� �� �7�����J!����� !�� �3�1�����������5
����RESULTS � ���������1���&���������D�7�3 ������
�3���������2 5�� ����G�!���&����������3���������!���3 ��
�� ����J!��*��3��� ����&=���������2��!���� 5
�����������
KANAGAWA JAPAN
������������E��3� ����8���#�8�����!����������
='�8��� �!"�$%%*�� �������������E��3� ����8��������7���
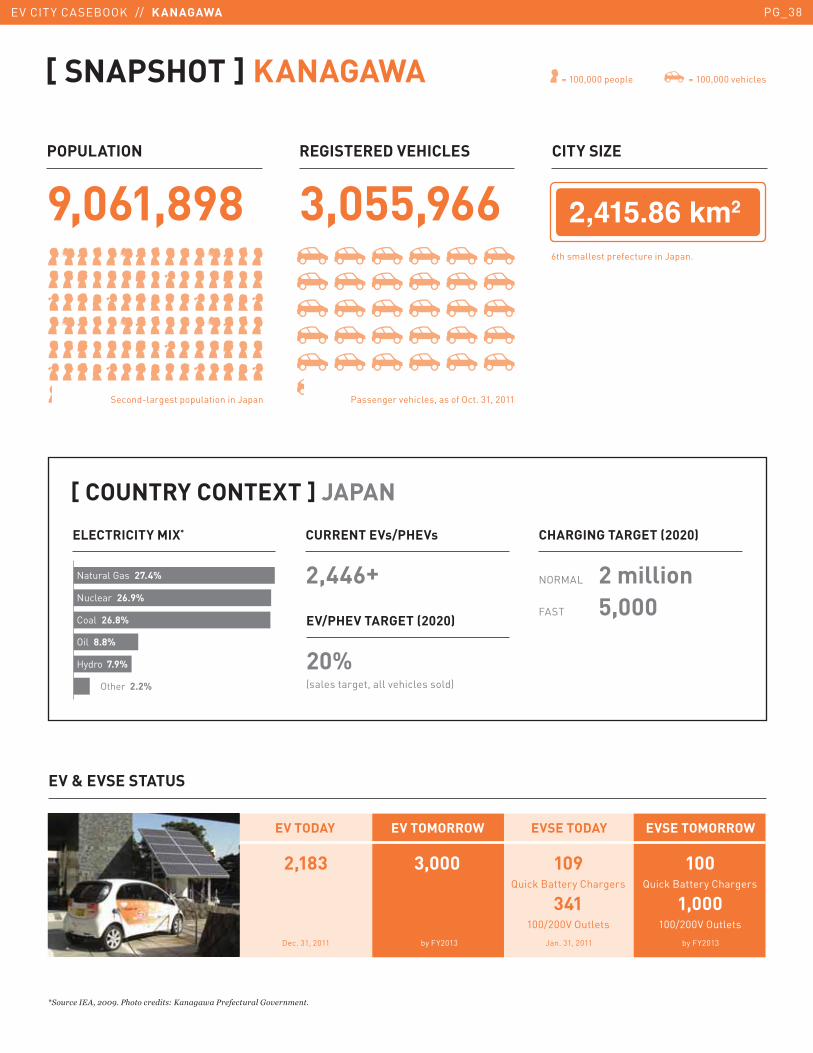
Second-largest population in Japan
6th smallest prefecture in Japan.
Passenger vehicles, as of Oct. 31, 2011
����������
[ SNAPSHOT ] KANAGAWA
[ COUNTRY CONTEXT ] JAPAN
ELECTRICITY MIX* CURRENT EVs/PHEVs
2,446+
CHARGING TARGET (2020)
NORMAL 2 million
FAST 5,000EV/PHEV TARGET (2020)
20% (sales target, all vehicles sold)
Nuclear 26.9%
Natural Gas 27.4%
Other 2.2%
Oil 8.8%
Hydro 7.9%
Coal 26.8%
2,183 3,000 100Quick Battery Chargers
1,000100/200V Outlets
109Quick Battery Chargers
341100/200V Outlets
Dec. 31, 2011 Jan. 31, 2011by FY2013 by FY2013
EV & EVSE STATUS
EV TODAY EV TOMORROW EVSE TODAY EVSE TOMORROW
POPULATION
9,061,898
REGISTERED VEHICLES
3,055,966
CITY SIZE
= 100,000 people = 100,000 vehicles
EV CITY CASEBOOK // KANAGAWA PG_38
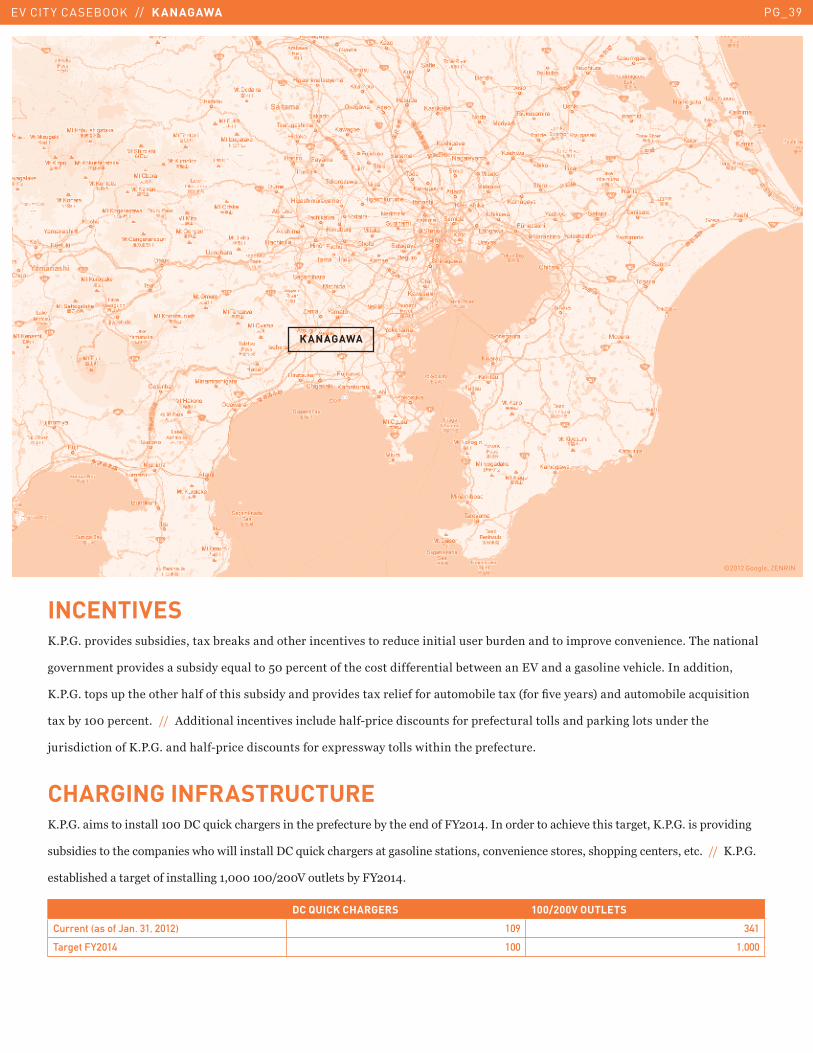
INCENTIVESD5'5C5�������� � !1 ���� ���(�1��* ������3������������ �������!����������! ���1!������������������������������5�43���������
����������������� �� !1 �����J!�����%��������������3���� ��������������1��7�������2����� ��������3����5�������������
D5'5C5���� �!���3����3���3�������3� � !1 �������������� ��(������������!����1�����(�9����?������ <����!����1�����J!� ������
�(�1�������������5������������������������� �����!���3��I�������� ��!�� ������������!������� ������*������ �!������3��
H!�� �����������D5'5C5����3��I�������� ��!�� ������(��� 7������ �7��3����3���������!��5
CHARGING INFRASTRUCTURED5'5C5��� ������ �����������J!��*��3��� �����3���������!���1���3���������"F���=5��������������3������3� �������D5'5C5�� ����������
!1 ���� �����3��������� �73��7������ �������J!��*��3��� ��� ������ ����� �������������� ���� �� 3������������ �����5������D5'5C5�
� �1�� 3�������������� �������������������2��!���� �1��"F���=5
TYPE OF CHARGING STATION DC QUICK CHARGERS 100/200V OUTLETS
Current (as of Jan. 31, 2012) 109 341
Target FY2014 100 1,000
©2012 Google, ZENRIN
K ANAGAWA
EV CITY CASEBOOK // KANAGAWA PG_39
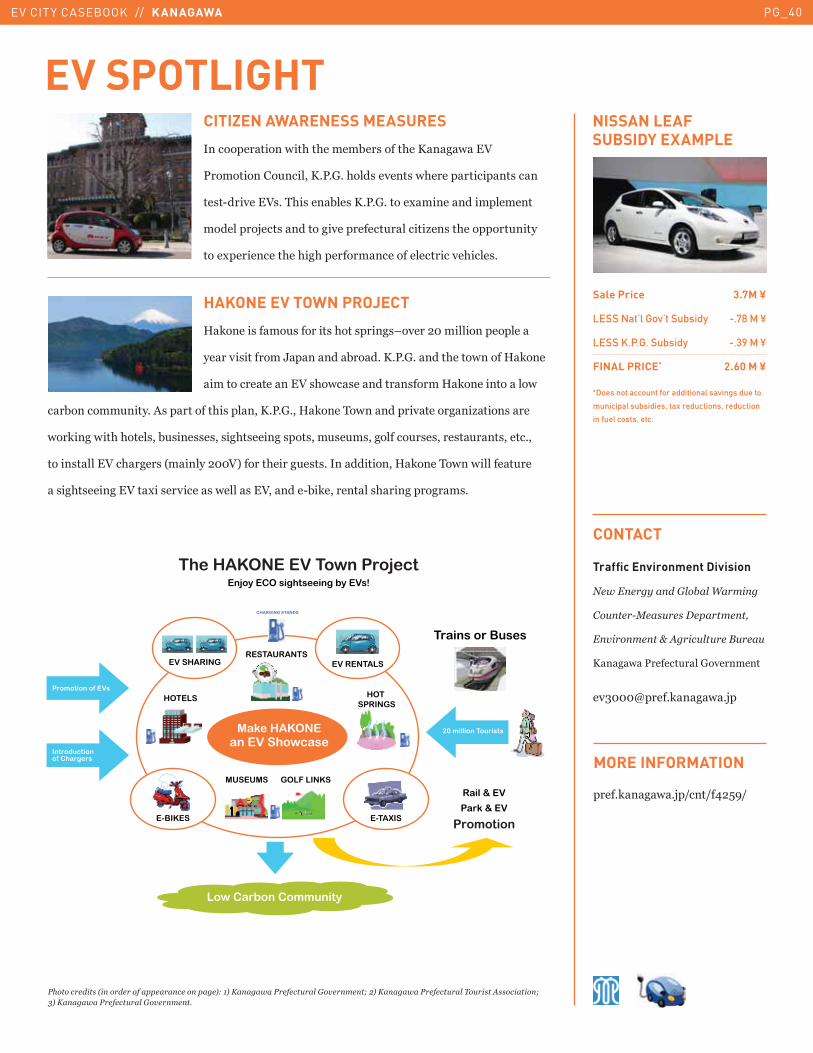
HAKONE EV TOWN PROJECT
0*����� ����! ������� �3��� ���� U������������������������
������ ��������G������1���5�D5'5C5�����3����7�����0*����
���������������2� 3�7� �������� �����0*������������7�
��1�������!����5�� ���������3� ������D5'5C5��0*����4�7����������������L���� ����
7��*���7��3�3���� ��1! ��� � �� �3� ����� ��� ���! �!� ��������!� � ���� �!��� �����5���
����� �����2��3��� �9���������2<������3����!� � 5�������������0*����4�7��7�������!����
� �3� ������2��(�� ������� �7���� ��2������I1�*��������� 3��������� 5
CITIZEN AWARENESS MEASURES
��������������7��3��3�����1�� �����3��D�7��2�
'�����������!������D5'5C5�3��� ������ �73������������� ����
�� �I�������2 5�43� ���1�� �D5'5C5�����(������������������
���������H��� ������������������!�������L�� ��3��������!������
����(����������3��3�3��������������������������3���� 5
NISSAN LEAF
SUBSIDY EXAMPLE
������������1����������������������2��&2�E��3� ����8��������7��4�$2�E��3� ����8���#�8�����!���������4��N2�E��3� ����8��������7���
Traffic Environment Division
)3����������������R�7�����
��8���-;�8�������7��"�
�������7���M�!����8��8��(8�8
D�7�'������!���C���������
��&���R����5*�75H�
CONTACT
����5*�75H�������=�% �
MORE INFORMATION
EV SPOTLIGHT
������������� ����� ������� ������������������������
� ������ ��� �������
�� � �� �� ����
!"���##� ��� ������
$��� %���� �� ���������
�� � �� �
���&����'
�()$��'
���'��&$*
+�,������������'� �����
�(��-$'���,�.���
&��#�.���
���&*$*�'��/'
+0'�0+' *�1��$�'
���'�&$*'
&�'��0&��'
����'
������� ��)����
Sale Price 3.7M ¥
LESS Nat’l Gov’t Subsidy -.78 M ¥
LESS K.P.G. Subsidy -.39 M ¥
FINAL PRICE* 2.60 M ¥
*Does not account for additional savings due to
municipal subsidies, tax reductions, reduction
in fuel costs, etc.
EV CITY CASEBOOK // KANAGAWA PG_40
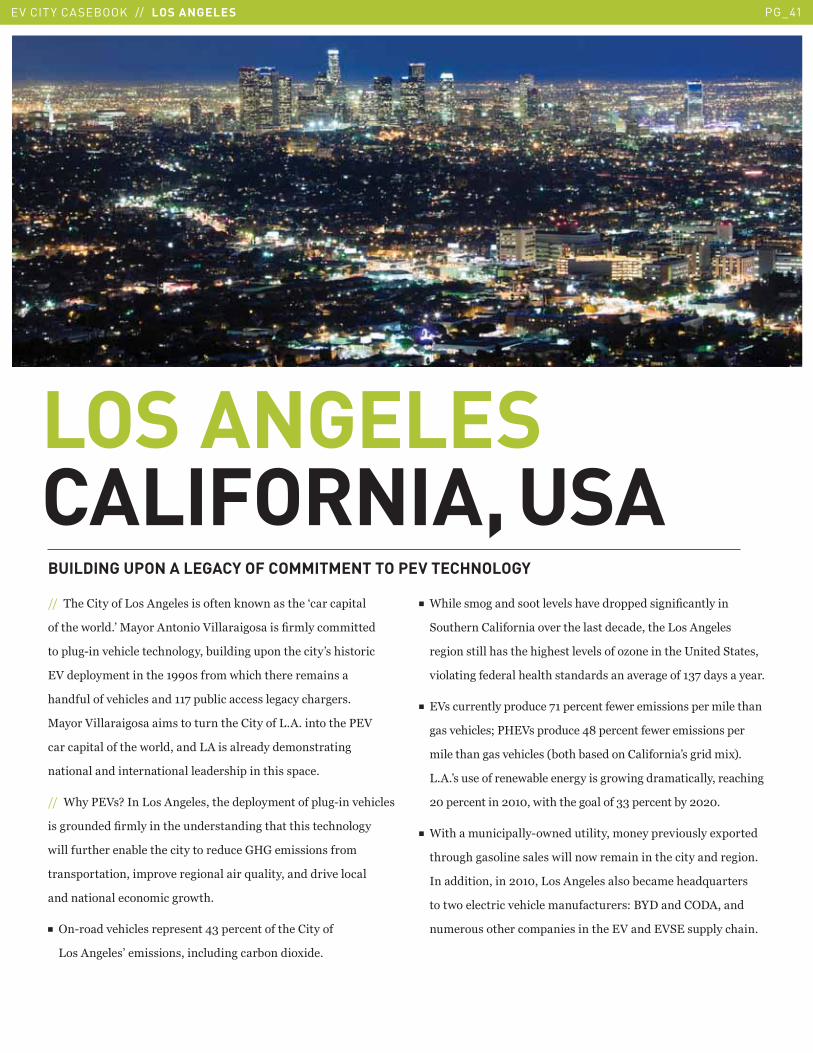
EV CITY CASEBOOK // LOS ANGELES PG_41
LOS ANGELESCALIFORNIA, USABUILDING UPON A LEGACY OF COMMITMENT TO PEV TECHNOLOGY
����43����������E� ������ �� �������*��7�� ��3��T���������
����3��7����5@�+������������2������ �� �?����������������
�����!I�����3��������3�������1!������!�����3������@ �3� �������
�2����������������3��� � ������73��3��3��������� ���
3���!�������3���� ������$��!1������� �������3��� 5��
+����2������ ��� �����!����3����������E5�5�������3��'�2��
�������������3��7���������E��� ������������ ������
��������������������������� 3�������3� � ���5
����B3��'�2 Y����E� ������ ���3������������������!I�����3���� �
� ���!�����?���������3��!���� �������3���3� ����3������
7�����!��3�����1����3�������������!���C0C���� ��� ������
��� ����������������������������J!���������������������
���������������������7�35
�� ��I������3���� ������ ����=&�������������3����������
E� ������ @���� ��� ������!������1������(���5
�� B3���� ������ ��������� �3����������� ���?���������
-�!�3�������������������3��� ����������3��E� ������ �
������ �����3 ��3��3�3� ������� �����L��������3��/������-��� ��
���������������3���3� ����� ������������&$��� �����5
�� �2 ��!������������!���$������������7������ ��� �����������3��
���3���� K�'0�2 �����!���=,�����������7������ ��� �����
������3�� ���3���� �91��3�1 ��������������@ �������(<5�
E5�5@ �! ���������71���������� ���7�����������������3���
��������������������7��3��3��������&&���������1������5
�� B��3���!��������I�7����!��������������������! ����(�������
�3��!3� ������ �� �7������7�����������3���������������5�
���������������������E� ������ �� ��1�����3��J!���� �
����7�������������3�������!���!��� 8�.F��������������
�!����! ���3���������� �����3���2�����2-�� !������3��5
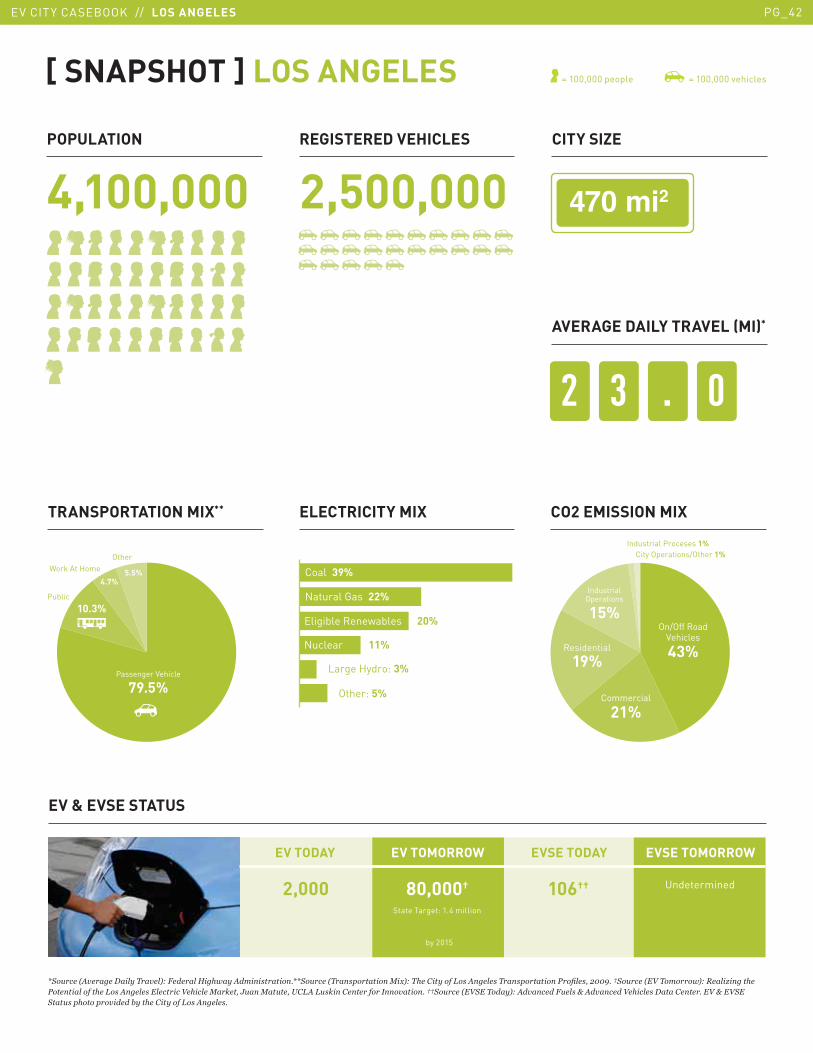
2 3 . 0
�������
='�8���1!���������#���2��I����L���3��!�7�����������=='�8���1#������������;�62��#����������<���!�����#������������ ��@��"�$%%*��H'�8���1�5�#�7����32�����G������� �������������<���!�������������5�����;�:�"�F8��;�8�"�D�<!�<8�:������������ ����������HH'�8���1�5'��#���2��!������I8���M�!������5����������������5�M��5'��'��8������������������������������<���!�����
[ SNAPSHOT ] LOS ANGELES
2,000 80,000†
State Target: 1.4 million
Undetermined106††
by 2015
Coal 39%
Natural Gas 22%
Eligible Renewables 20%
Nuclear 11%
Large Hydro: 3%
Other: 5%
Work At Home
Public
Passenger Vehicle
79.5%
10.3%
Other
4.7%
5.5%
On/Off RoadVehicles
43%
Commercial
21%
IndustrialOperations
15%
Residential
19%
Industrial Proceses 1% City Operations/Other 1%
EV & EVSE STATUS
EV TODAY EV TOMORROW EVSE TODAY EVSE TOMORROW
= 100,000 people = 100,000 vehicles
POPULATION
4,100,000
REGISTERED VEHICLES
2,500,000
CITY SIZE
AVERAGE DAILY TRAVEL (MI)*
TRANSPORTATION MIX** ELECTRICITY MIX CO2 EMISSION MIX
EV CITY CASEBOOK // LOS ANGELES PG_42
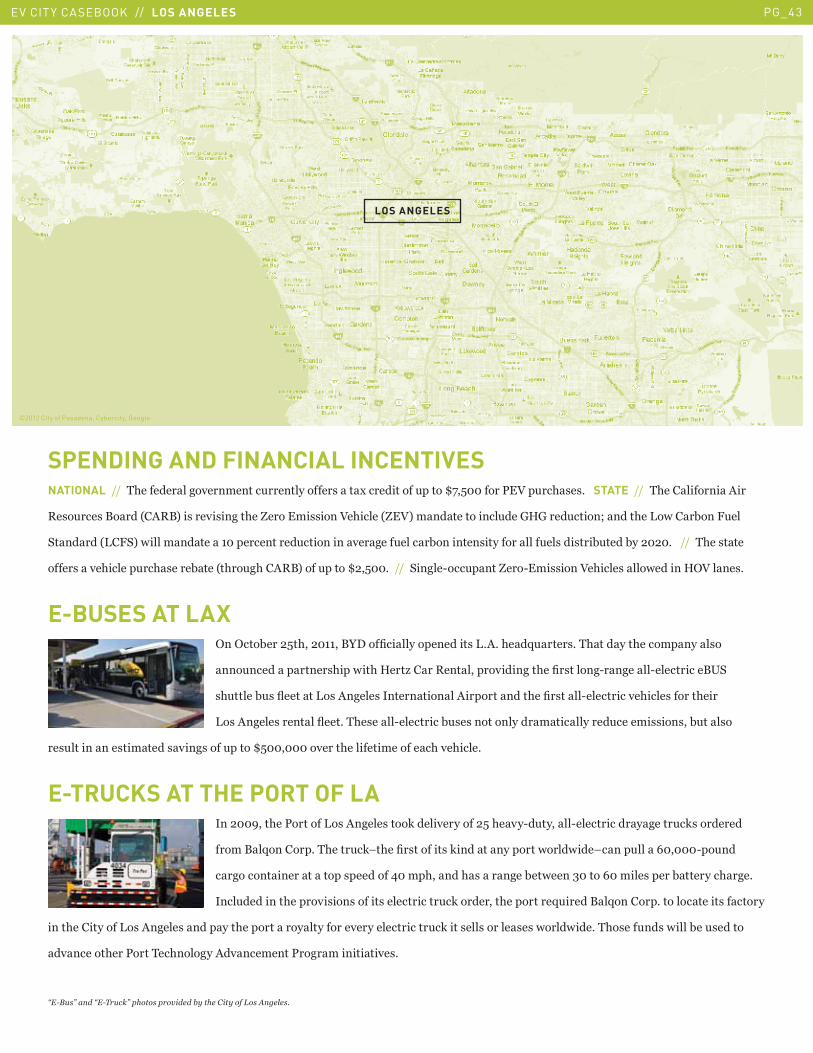
SPENDING AND FINANCIAL INCENTIVESNATIONAL �����43��������������������!������������� ���(�����������!�����Z$�%�������'�2��!��3 � 5���STATE �����43���������������
)� �!��� �.����9��).<�� ����� ����3��[������� ����2�3�����9[�2<��������������!���C0C����!�����K�����3��E�7���1���"!���
-������9E�"-<�7�������������������������!���������������!�����1�������� ������������!�� ��� ���1!����1������5� �����43�� ����
����� ����3������!��3 ����1���9�3��!3���).<����!�����Z��%��5 �����-����I���!����[���I��� ����2�3���� ����7������0�2���� 5�
E-BUSES AT LAX�������1����%�3��������.F����?��������������� �E5�5�3��J!���� 5�43������3���������� ���
���!������������ 3���7��3�0���L����)����������������3��?� �����I������I����������./-��
3!�����1! �>������E� ������ �������������������������3��?� ����I�����������3���� ������3�����
E� ������ �������>���5�43� ����I���������1! � �����������������������!������ ��� ��1!��� ���
�� !��������� ������� ��� ����!�����Z%�������������3����������������3���3����5
E-TRUCKS AT THE PORT OF LA������ ���3��'�������E� ������ ����*��������������%�3���I�!������I����������������!�* ���������
�����.�J�������5�43����!�*U�3��?� ������� �*��������������7����7���U����!����Q�����I��!���
�������������������� ��������=����3�����3 ������1��7����&�����Q������ �����1�������3��5�
����!��������3������� ��� ������ ������������!�*���������3���������J!�����.�J�������5������������ ��������
����3����������E� ������ ��������3������������������������������������!�*���� ��� ������ � �7����7���5�43� ���!�� �7����1��! ������
��������3���'����4��3�����������������'�������������� 5
P�-(8�Q����P�-#�8�:Q������������������������������<���!�����
©2012 City of Pasadena, Cybercity, Google
LOS ANGELES
EV CITY CASEBOOK // LOS ANGELES PG_43
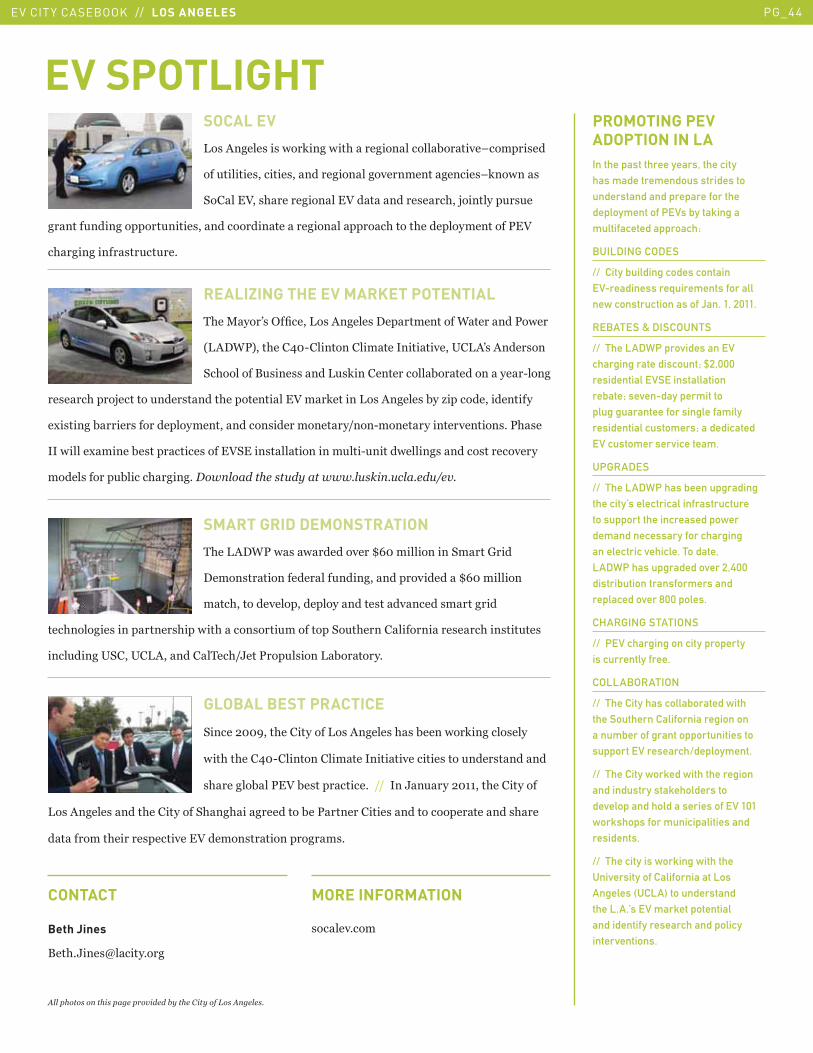
REALIZING THE EV MARKET POTENTIAL
43��+���@ ���?����E� ������ ��������������B�������'�7���
9E��B'<���3���=�I��������������������������/�E�@ ������ ���
-�3�������.! ��� ����E! *��������������1�������������I����
�� ���3����H�������!���� �����3������������2���*������E� ������ �1��L������������������
�(� ����1����� ����������������������� ����������������I�������������������� 5�'3 ��
���7�����(�����1� ��������� �����2-���� ������������!���I!�����7����� ������ �����������
����� ������!1�����3���5���3����������8�����333��8�:���8����8���
SMART GRID DEMONSTRATION
43��E��B'�7 �7����������ZQ�������������-����C����
����� ���������������!�������������������ZQ����������
���3�������������������������� ��������� ��������
���3������ ���������� 3���7��3����� ����!���������-�!�3��������������� ���3��� ���!�� �
����!����/-���/�E��������4��3�G���'���!� ����E1������5
SOCAL EV
E� ������ �� �7��*���7��3�������������1������U������ ���
���!������� ������� ��������������������������� U*��7�� �
-�����2�� 3�����������2��������� ���3��H��������!� !��
�����!�����������!����� ����������������������������3�����3����������������'�2�
�3�������� ��!��!��5�
GLOBAL BEST PRACTICE
-�������� ���3����������E� ������ �3 �1����7��*������ ����
7��3��3���=�I������������������������������ ����!���� �������
3�����1��'�2�1� ���������5���������G�!����������3����������
E� ������ �����3����������-3�3����������1��'����������� ������������������� 3���
���������3������ ���������2������ ������������ 5�
PROMOTING PEV
ADOPTION IN LA
In the past three years, the city has made tremendous strides to understand and prepare for the deployment of PEVs by taking a multifaceted approach:
BUILDING CODES
// City building codes contain EV-readiness requirements for all new construction as of Jan. 1, 2011.
REBATES & DISCOUNTS
// The LADWP provides an EV charging rate discount; $2,000 residential EVSE installation rebate; seven-day permit to plug guarantee for single family residential customers; a dedicated EV customer service team.
UPGRADES
// The LADWP has been upgrading the city’s electrical infrastructure to support the increased power demand necessary for charging an electric vehicle. To date, LADWP has upgraded over 2,400 distribution transformers and replaced over 800 poles.
CHARGING STATIONS
// PEV charging on city property is currently free.
COLLABORATION
// The City has collaborated with the Southern California region on a number of grant opportunities to support EV research/deployment.
// The City worked with the region and industry stakeholders to develop and hold a series of EV 101 workshops for municipalities and residents.
// The city is working with the University of California at Los Angeles (UCLA) to understand the L.A.’s EV market potential and identify research and policy interventions.
EV SPOTLIGHT
Beth Jines
.��35G��� R�����5���
CONTACT
�����5���
MORE INFORMATION
!�������������������������������������������<���!�����
EV CITY CASEBOOK // LOS ANGELES PG_44
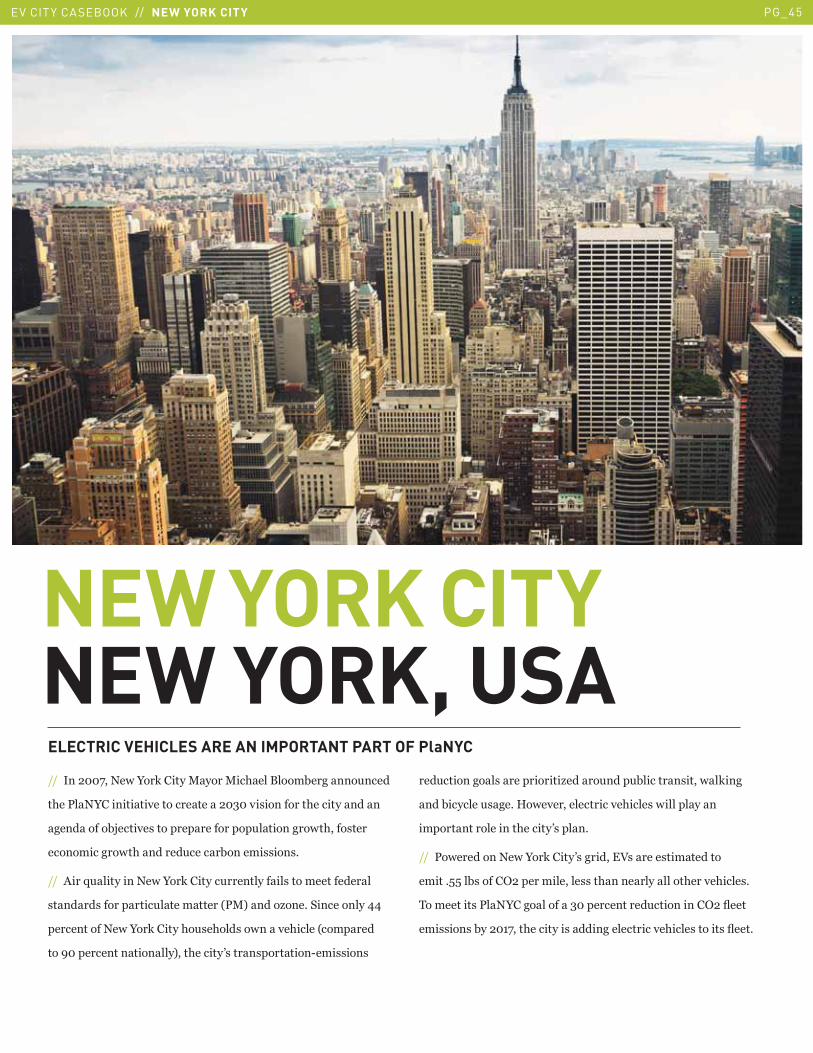
EV CITY CASEBOOK // NEW YORK CITY PG_45
NEW YORK CITYNEW YORK, USAELECTRIC VEHICLES ARE AN IMPORTANT PART OF PlaNYC
����������$��6�7�F��*������+����+��3���.����1������!�����
�3��'�6F������������������������&���� ���������3������������
��������1H������ ������������������!��������7�3���� ����
�����������7�3�������!�����1������ ��� 5�
��������J!��������6�7�F��*�������!����������� ����������������
����� ����������!����������9'+<�����L���5�-����������==�
�����������6�7�F��*������3�! �3��� ��7�����3�����9��������
��� ������������������<���3������@ ���� ��������I��� ��� �
���!�������� ������������L�����!����!1������� ����7�*����
���1�������! �5�0�7�����������������3���� �7����������
������������������3������@ ����5�
����'�7��������6�7�F��*�����@ �������2 ����� ����������
�����5%%��1 �������������������� ��3�������������3�����3���� 5��
4��������� �'�6F���������&�������������!�������������>����
��� ��� �1�����$���3�������� �����������������3���� ������ �>���5
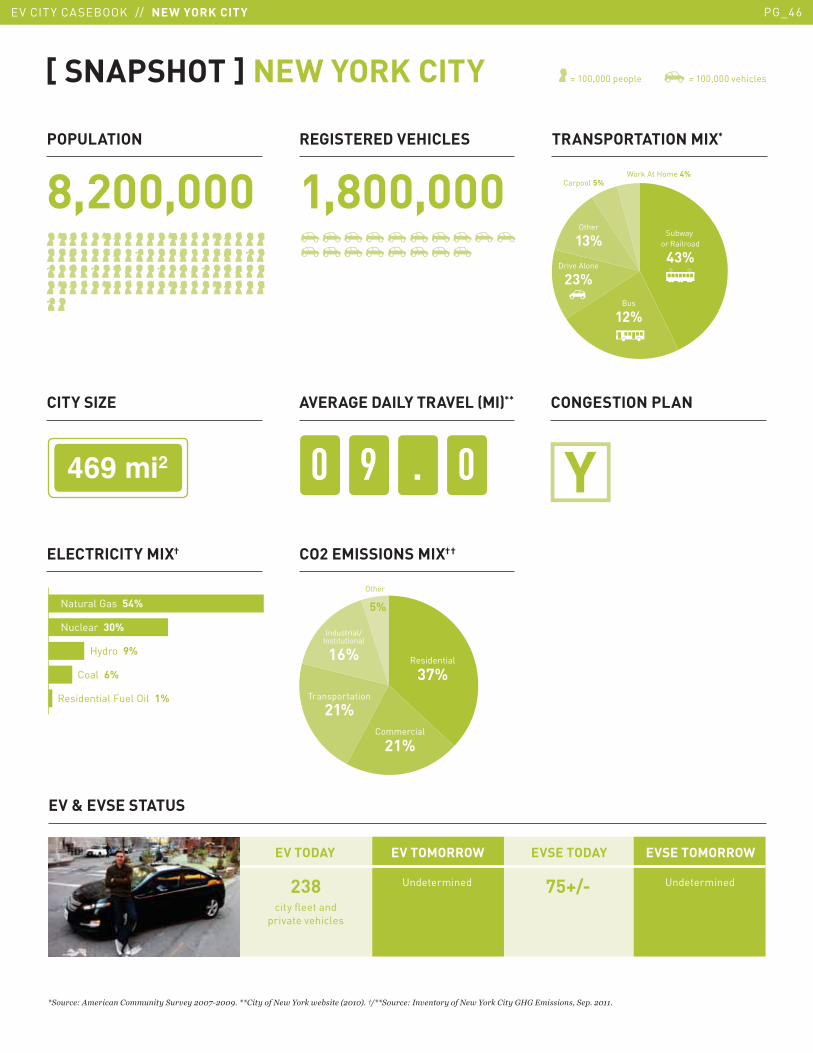
0 9 . 0�������
='�8����!7�������778�����'8����$%%+-$%%*��==��������)3�S��:�3�����1$%&%2��H�=='�8���� �����������)3�S��:�������L���7�������"�'���$%&&�
[ SNAPSHOT ] NEW YORK CITY
238city fleet and
private vehicles
Undetermined Undetermined75+/-
= 100,000 people = 100,000 vehicles
Coal 6%
Residential Fuel Oil 1%
Nuclear 30%
Natural Gas 54%
Hydro 9%
EV & EVSE STATUS
EV TODAY EV TOMORROW EVSE TODAY EVSE TOMORROW
POPULATION
8,200,000
CITY SIZE
ELECTRICITY MIX† CO2 EMISSIONS MIX††
AVERAGE DAILY TRAVEL (MI)** CONGESTION PLAN
REGISTERED VEHICLES
1,800,000
TRANSPORTATION MIX*
Residential
37%
Commercial
21%
Industrial/Institutional
16%
Other
Transportation
21%
5%
Work At Home 4%
Other
13%
Drive Alone
23%
Bus
12%
Subway or Railroad
43%
Carpool 5%
EV CITY CASEBOOK // NEW YORK CITY PG_46
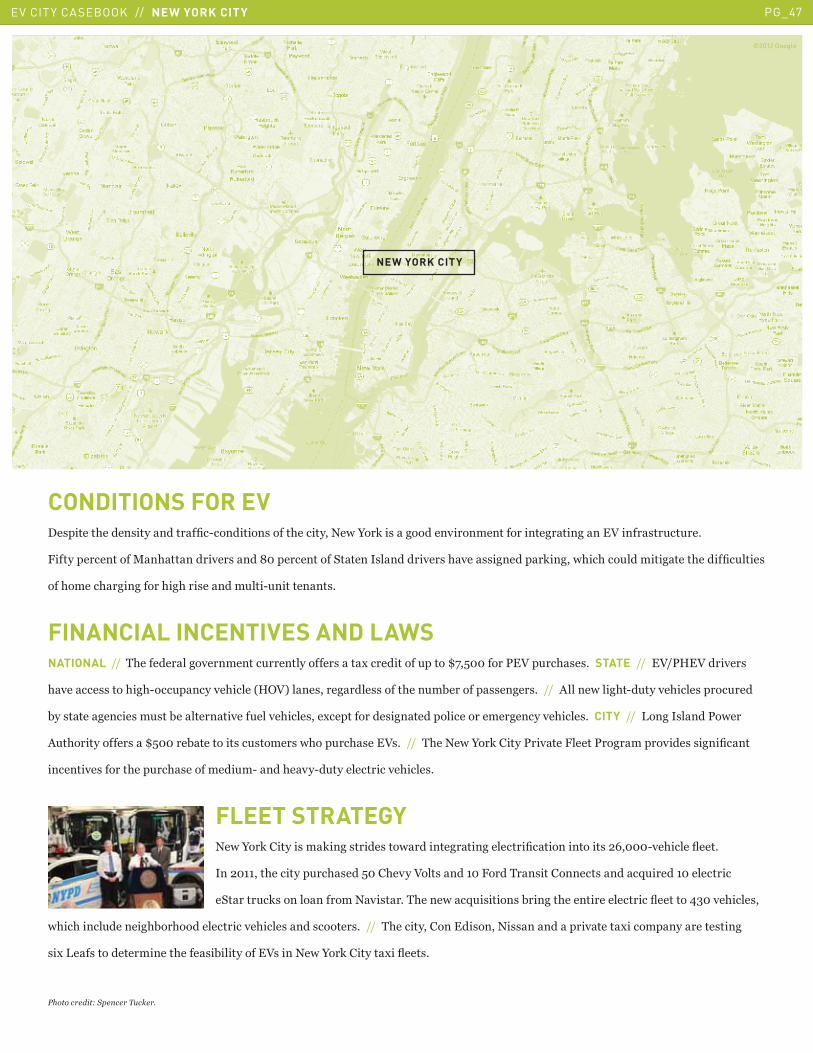
EV CITY CASEBOOK // SECTION PG_01
CONDITIONS FOR EV�� ������3����� ����������?�I��������� �����3��������6�7�F��*�� ����������������������������������2����� ��!��!��5��
"����������������+�3���������� ����,�������������-������ ���������� �3��� �������*����73��3���!�����������3�����?�!���� �
���3�����3��������3�3��� ������!���I!��������� 5
FINANCIAL INCENTIVES AND LAWSNATIONAL �����43��������������������!������������� ���(�����������!�����Z$�%�������'�2��!��3 � 5��STATE�������2�'0�2�������
3������ ����3�3I���!�������3�����90�2<���� �������� �����3���!�1������� ���� 5������������7���3�I�!�����3���� �����!����
1�� ��������� ��! ��1�������������!�����3���� ���(����������� ���������������������������3���� 5��CITY������E���� ����'�7���
�!�3����������� ��Z%�����1�������� ��! ����� �73���!��3 ���2 5������43��6�7�F��*������'������"�����'������������ � ���?����
��������� ������3���!��3 ���������!�I����3���I�!��������������3���� 5
FLEET STRATEGY6�7�F��*������� ��*��� ����� ���7�������������������?������������� ��Q����I��3�����>���5��
����������3��������!��3 ���%���3����2��� �������"����4�� ���������� �����J!������������������
�-�����!�* �������������6�� ��5�43����7��J!� ����� �1�����3������������������>�������=&����3���� ��
73��3�����!������31��3���������������3���� ���� ������ 5������43��������������� ����6� ��������������(�������������� ����
�(�E�� ���������������3���� �1����������2 ����6�7�F��*�������(��>��� 5
������������'�����#8�:��
©2012 Google
NEW YORK CITY
EV CITY CASEBOOK // NEW YORK CITY PG_47
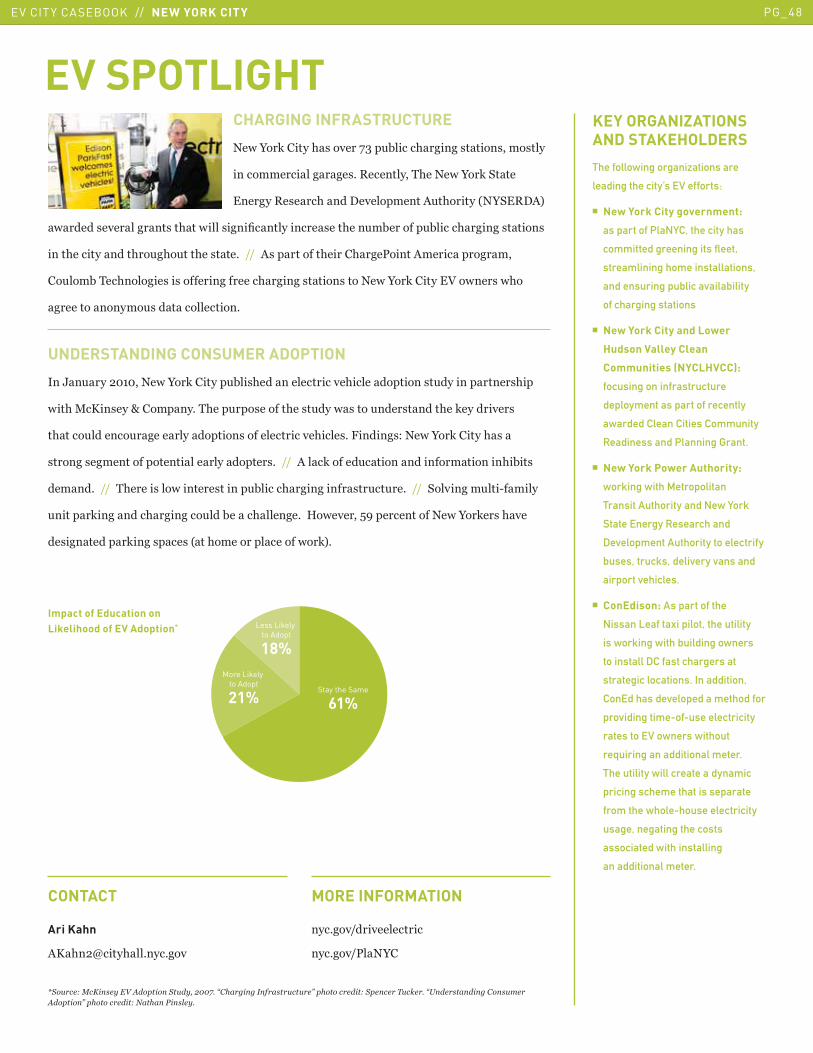
EV CITY CASEBOOK // SECTION PG_01
UNDERSTANDING CONSUMER ADOPTION
���G�!���������6�7�F��*�������!1�� 3����������������3������������� �!������������ 3���
7��3�+�D�� ���S�������5�43���!��� ������3�� �!���7 ����!���� �����3��*��������� �
�3����!�������!��������������� ���������������3���� 5�"����� 8�6�7�F��*������3 ��
����� ����������������������������� 5����������*������!����������������������3�1�� �
�����5������43����� ���7������� ������!1�����3�������� ��!��!��5������-�������!���I������
!������*�������3������!���1����3�����5��0�7������% ������������6�7�F��*�� �3���
�� ��������*��� ��� �9��3���������������7��*<5
CHARGING INFRASTRUCTURE
6�7�F��*������3 ������$&��!1�����3���� ����� ���� ����
��������������� 5�)���������43��6�7�F��*�-����
������)� ���3�����������������!�3������96F-�)��<�
7����� ��������� ��3��7���� ���?����������� ���3���!�1�������!1�����3���� ����� �
����3�����������3��!3�!���3�� ���5������� ���������3�����3��'�������������������
��!���1�4��3������ �� ���������������3���� ����� ����6�7�F��*�������2��7��� �73��
�������������! ��������������5
KEY ORGANIZATIONS
AND STAKEHOLDERS
The following organizations are
leading the city’s EV efforts:
� New York City government:
as part of PlaNYC, the city has
committed greening its fleet,
streamlining home installations,
and ensuring public availability
of charging stations
� New York City and Lower
Hudson Valley Clean
Communities (NYCLHVCC):
focusing on infrastructure
deployment as part of recently
awarded Clean Cities Community
Readiness and Planning Grant.
� New York Power Authority:
working with Metropolitan
Transit Authority and New York
State Energy Research and
Development Authority to electrify
buses, trucks, delivery vans and
airport vehicles.
� ConEdison: As part of the
Nissan Leaf taxi pilot, the utility
is working with building owners
to install DC fast chargers at
strategic locations. In addition,
ConEd has developed a method for
providing time-of-use electricity
rates to EV owners without
requiring an additional meter.
The utility will create a dynamic
pricing scheme that is separate
from the whole-house electricity
usage, negating the costs
associated with installing
an additional meter.
EV SPOTLIGHT
Ari Kahn
�D3��R����3��5���5��
CONTACT
���5����������������
���5���'�6F�
MORE INFORMATION
='�8����;�E������5�!��������'�8��"�$%%+��P�������� ������8��8�Q��������������'�����#8�:���PD���������������87���!�������Q��������������)���� ������
Impact of Education on
Likelihood of EV Adoption*
Stay the Same
61%
More Likely to Adopt
21%
Less Likely to Adopt
18%
EV CITY CASEBOOK // NEW YORK CITY PG_48
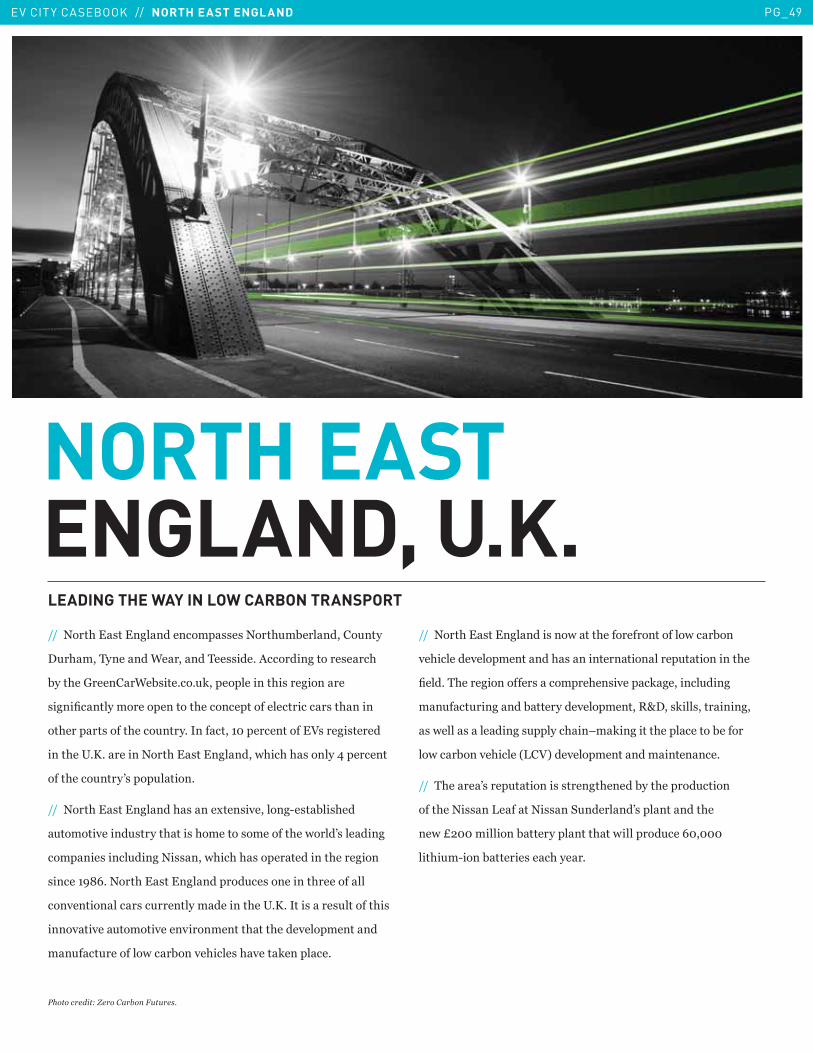
EV CITY CASEBOOK // NORTH EAST ENGLAND PG_49
NORTH EASTENGLAND, U.K.LEADING THE WAY IN LOW CARBON TRANSPORT
����6���3�� �������������� � �6���3!�1���������!����
�!�3���4�������B�������4�� ���5��������������� ���3�
1���3��C������B�1 ���5��5!*�������������3� ����������
���?��������������������3������������������������ ��3�����
��3������ �����3����!����5������������������������2 ���� �������
����3��/5D5�������6���3�� ���������73��3�3 ������=���������
����3����!����@ ����!�����5��
����6���3�� ��������3 ����(��� ��������I� �1�� 3���
!������������! �����3��� �3������� ��������3��7����@ �������
������� �����!����6� ���73��3�3 �������������3��������
������ ,Q5�6���3�� ������������!�� ���������3����������
�������������� ��!����������������3��/5D5����� ���� !�������3� �
����������!����������������������3���3�����������������
��!���!��������7���1�����3���� �3����*�������5
����6���3�� ��������� ���7����3�����������������7���1���
��3��������������������3 ������������������!����������3��
?���5�43������������� ��������3�� ������*�������!����
��!���!�������1�������������������)S��� *��� �����������
�7���� �������� !������3��U�*�������3����������1�������
��7���1�����3�����9E�2<�������������������������5
����43����@ ����!������� � �����3�����1���3������!������
����3��6� ��E�����6� ��-!�������@ ����������3���
��7�\������������1������������3��7��������!���Q������
���3�!�I����1������ ���3����5
������������B���������I8�8���
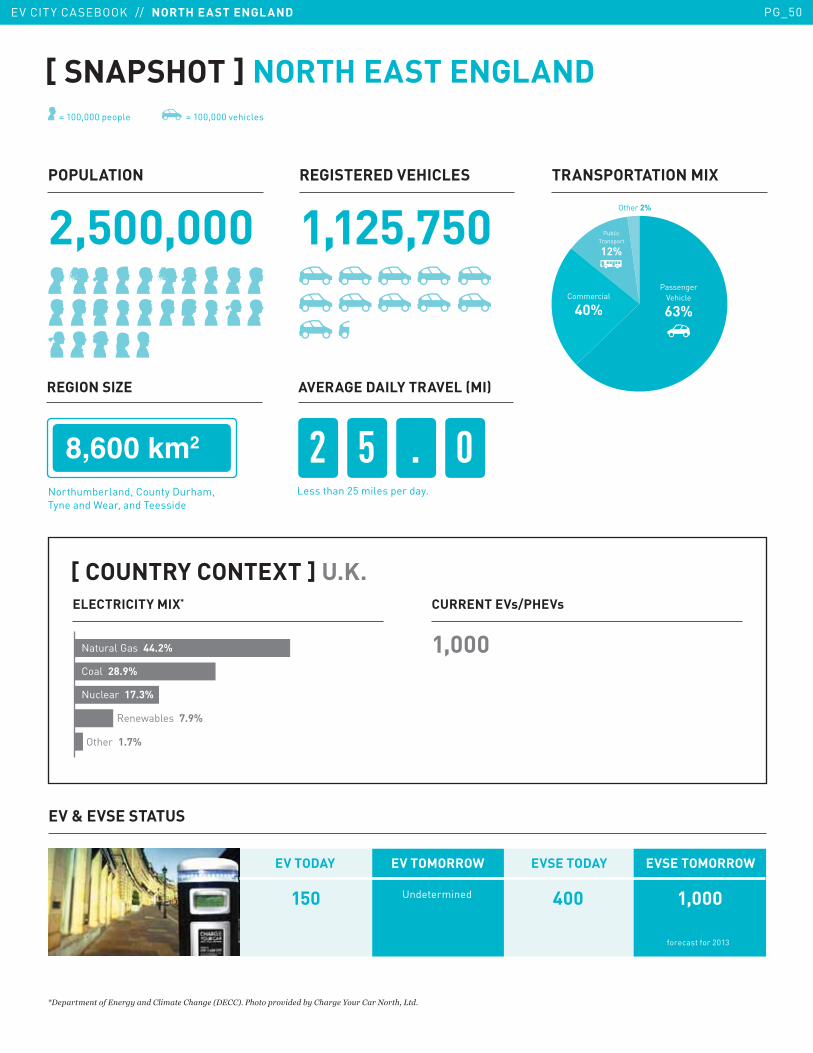
[ SNAPSHOT ] NORTH EAST ENGLAND
150 Undetermined 1,000400
REGION SIZE
��������
=����7������������������7�������1����2�� ���������������������S�8�����)����"�<���
Northumberland, County Durham, Tyne and Wear, and Teesside
Less than 25 miles per day.
AVERAGE DAILY TRAVEL (MI)
2 5 . 0
= 100,000 people = 100,000 vehicles
POPULATION
2,500,000
REGISTERED VEHICLES
1,125,750
TRANSPORTATION MIX
CURRENT EVs/PHEVs
1,000
[ COUNTRY CONTEXT ] U.K.
ELECTRICITY MIX*
Renewables 7.9%
Nuclear 17.3%
Other 1.7%
Coal 28.9%
Natural Gas 44.2%
EV & EVSE STATUS
EV TODAY EV TOMORROW EVSE TODAY EVSE TOMORROW
forecast for 2013
Commercial
40%
PublicTransport
12%
Other 2%
PassengerVehicle
63%
EV CITY CASEBOOK // NORTH EAST ENGLAND PG_50
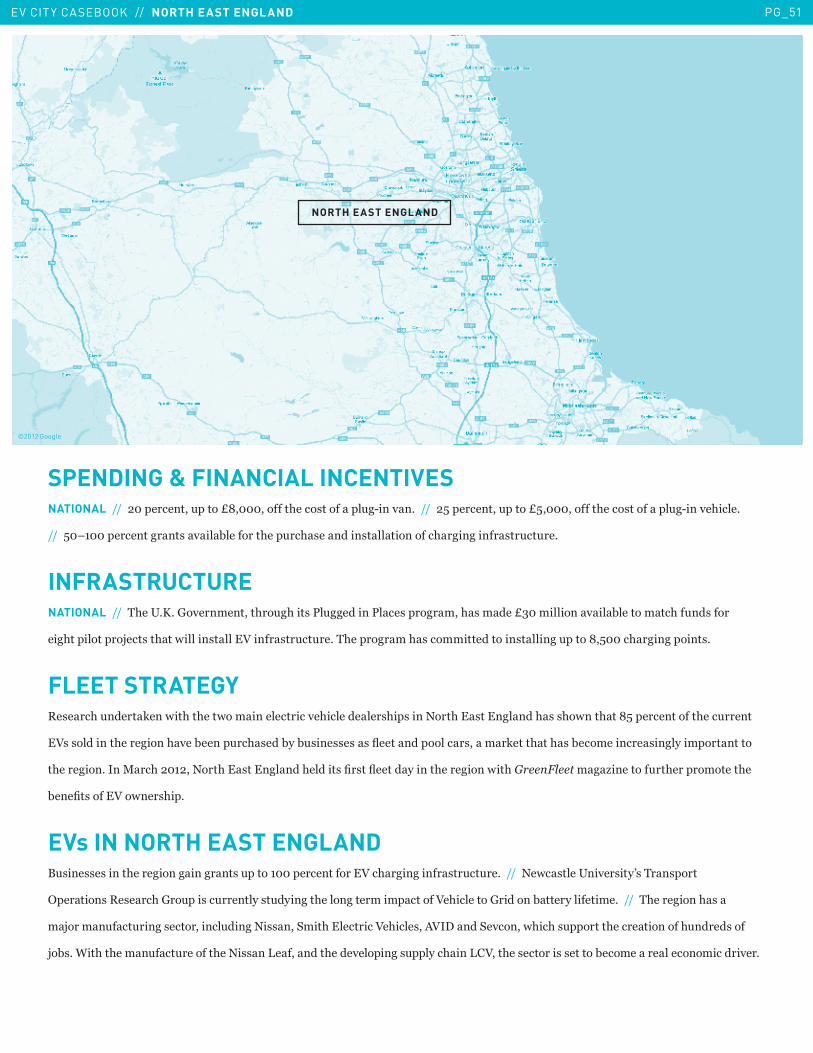
SPENDING & FINANCIAL INCENTIVESNATIONAL������������������!�����\,�����������3���� ��������!I�����5�������%����������!�����\%�����������3���� ��������!I�����3����5��
����%�U��������������� ����1��������3���!��3 ������� ������������3�������� ��!��!��5
INFRASTRUCTURENATIONAL������43��/5D5�C������������3��!3��� �'�!������'��� ��������3 �����\&�������������1���������3��!�� �����
��3�����������H��� ��3��7������ �����2����� ��!��!��5�43��������3 ���������������� ������!�����,�%����3��������� 5
FLEET STRATEGY)� ���3�!�����*���7��3��3���7�����������������3���������� 3�� ����6���3�� ��������3 � 3�7���3��,%�������������3���!�������
�2 � ��������3��������3���1�����!��3 ���1��1! ��� � � �>�������������� �����*����3��3 �1����������� �����������������
�3�������5����+��3�������6���3�� ��������3������ �?� ��>�����������3��������7��3����I����L��������!��3������������3��
1���?� �����2��7��� 3��5
EVs IN NORTH EAST ENGLAND.! ��� � �����3�������������� �!����������������������2��3�������� ��!��!��5������6�7� ����/����� ���@ �4�� �����
�������� �)� ���3�C��!��� ��!�������� �!������3��������������������2�3��������C�������1��������������5������43��������3 ��
�H�����!���!���� �����������!����6� ���-���3����������2�3���� ���2������-�������73��3� !�������3�������������3!����� ����
H�1 5�B��3��3����!���!�������3��6� ��E��������3������������ !������3���E�2���3�� ������� � ������1��������������������������5
©2012 Google
NORTH EAST ENGLAND
EV CITY CASEBOOK // NORTH EAST ENGLAND PG_51
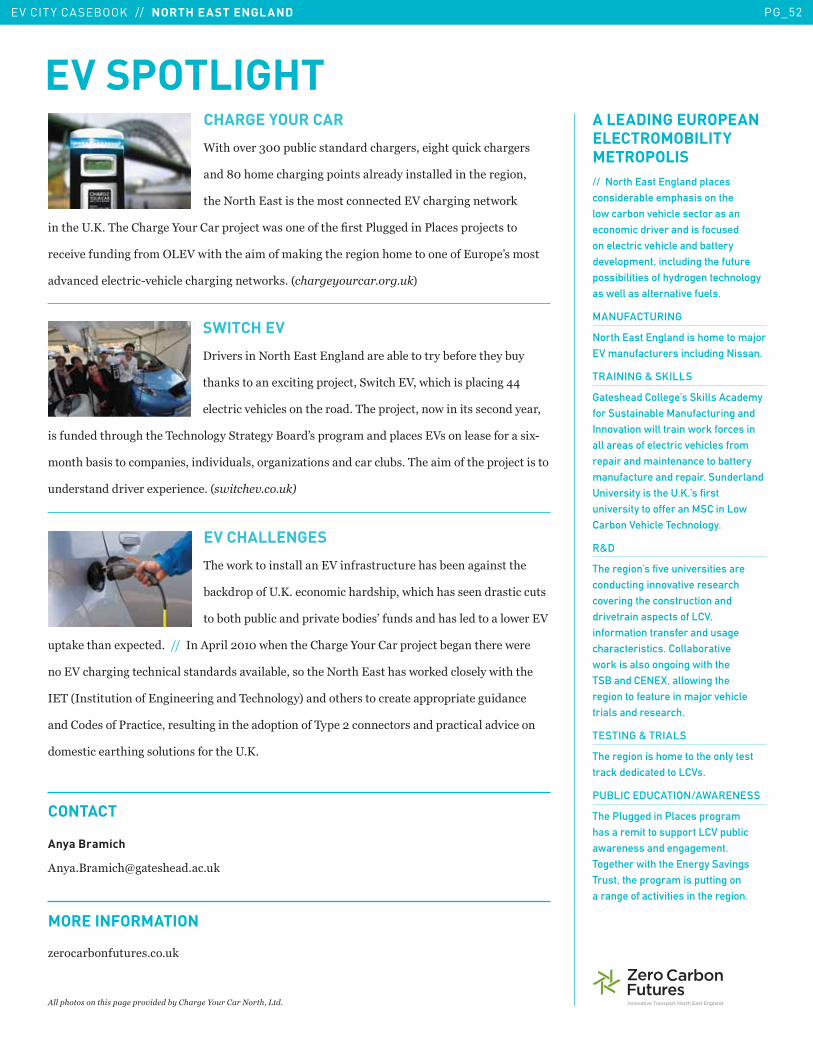
MORE INFORMATION
CHARGE YOUR CAR
B��3������&����!1���� �������3��� ����3��J!��*��3��� �
���,��3�����3��������� ��������� ����������3���������
�3��6���3�� ��� ��3���� �������������2��3�������7��*�
����3��/5D5�43���3���F�!��������H����7 ���������3��?� ��'�!������'��� ����H��� ����
���������!�����������E�2�7��3��3���������*����3��������3���������������!����@ ��� ��
���������������I��3������3�������7��* 5�9������8��������8:<
SWITCH EV
������ ����6���3�� �����������1����������1�������3���1!��
�3�* �������(���������H�����-7���3��2��73��3�� �������==�
�����������3���� �����3�����5�43�����H�������7������ � �����������
� ��!������3��!3��3��4��3������-������.���@ �������������� ��2 ������ ������� �(I�
����3�1 � ����������� ���������!� ������L���� ���������!1 5�43���������3�����H����� ����
!���� ������������(��������5�9�3���������8:2
EV CHALLENGES
43��7��*������ �������2����� ��!��!���3 �1������ ���3��
1�*��������/5D5����������3�� 3����73��3�3 � ������ �����!� �
���1��3��!1��������������1���� @��!�� ����3 �����������7����2�
!��*���3���(������5��������������������73����3���3���F�!��������H����1����3����7����
����2��3�������3����� ����� ����1���� ���3��6���3�� ��3 �7��*������ ����7��3��3��
��4�9�� ���!���������������������4��3�����<������3�� ��������������������!������
������� ����'���������� !���������3�������������4��������������� ���������������������
���� �������3��� ��!���� ������3��/5D5��
A LEADING EUROPEAN
ELECTROMOBILITY
METROPOLIS
// North East England places considerable emphasis on the low carbon vehicle sector as an economic driver and is focused on electric vehicle and battery development, including the future possibilities of hydrogen technology as well as alternative fuels.
MANUFACTURING
North East England is home to major EV manufacturers including Nissan.
TRAINING & SKILLS
Gateshead College’s Skills Academy for Sustainable Manufacturing and Innovation will train work forces in all areas of electric vehicles from repair and maintenance to battery manufacture and repair. Sunderland University is the U.K.’s first university to offer an MSC in Low Carbon Vehicle Technology.
R&D
The region’s five universities are conducting innovative research covering the construction and drivetrain aspects of LCV, information transfer and usage characteristics. Collaborative work is also ongoing with the TSB and CENEX, allowing the region to feature in major vehicle trials and research.
TESTING & TRIALS
The region is home to the only test track dedicated to LCVs.
PUBLIC EDUCATION/AWARENESS
The Plugged in Places program has a remit to support LCV public awareness and engagement. Together with the Energy Savings Trust, the program is putting on a range of activities in the region.
EV SPOTLIGHT
Anya Bramich
���5.����3R�� 3��5�5!*
CONTACT
L�����1���!�!�� 5��5!*
!�������������������������������������S�8�����)����"�<���
EV CITY CASEBOOK // NORTH EAST ENGLAND PG_52
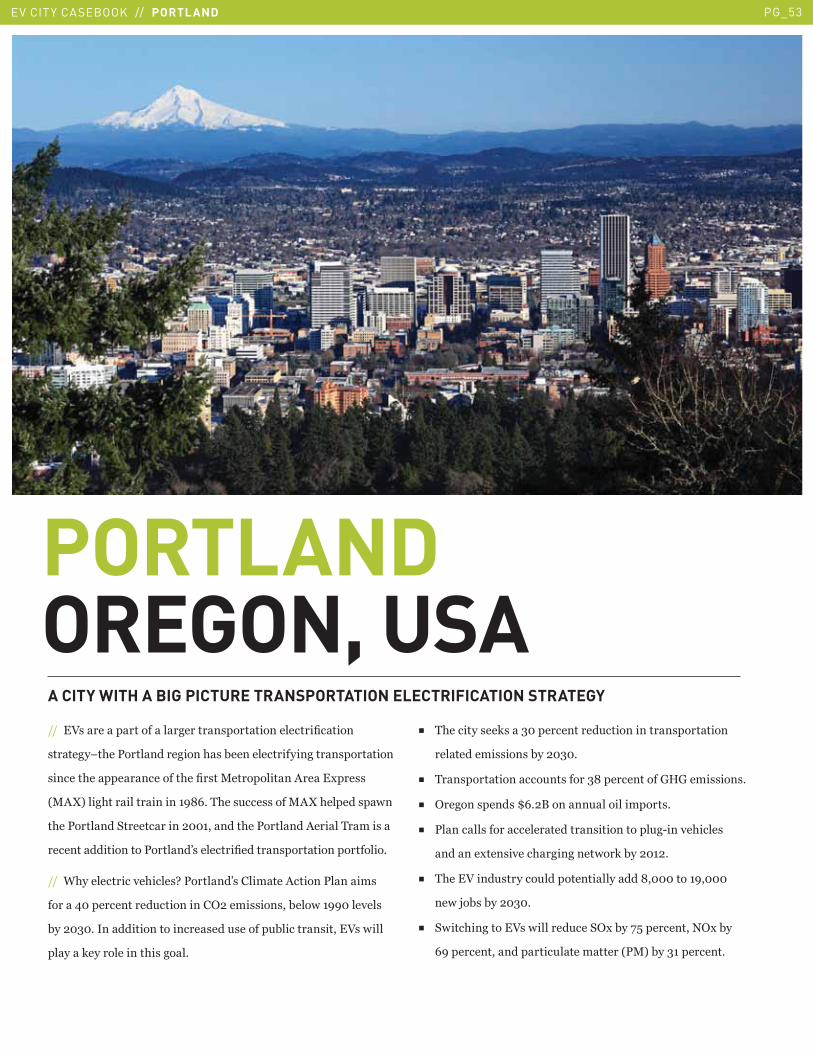
EV CITY CASEBOOK // PORTLAND PG_53
PORTLANDOREGON, USAA CITY WITH A BIG PICTURE TRANSPORTATION ELECTRIFICATION STRATEGY
�����2 ��������������������� ����������������?������
�����U�3��'�������������3 �1������������������� ���������
������3��������������3��?� ��+����������������(��� �
9+�]<���3��������������� ,Q5�43�� !��� ����+�]�3������ �7��
�3��'�������-���������������������3��'�������������4���� ��
������������������'������@ ��������?������ ������������������5���
����B3�������������3���� Y�'������@ ���������������'����� �
�����=�������������!���������������� ��� ��1���7�� ������� �
1����&�5�������������������� ���! ������!1������� �����2 �7�����
�����*������������3� ���5�
�� 43������� ��* ��&�������������!������������ ���������
���������� ��� �1����&�5
�� 4�� ������������!�� �����&,������������C0C���� ��� 5�
�� ������ ���� �ZQ5�.������!������������ 5
�� '������ ������������������ �����������!I�����3���� �
������(��� �����3�������7��*�1������5�
�� 43���2����! ������!�����������������,��������� �����
��7�H�1 �1����&�5
�� -7���3�������2 �7�������!���-�(�1��$%����������6�(�1��
Q ������������������!����������9'+<�1��&���������5
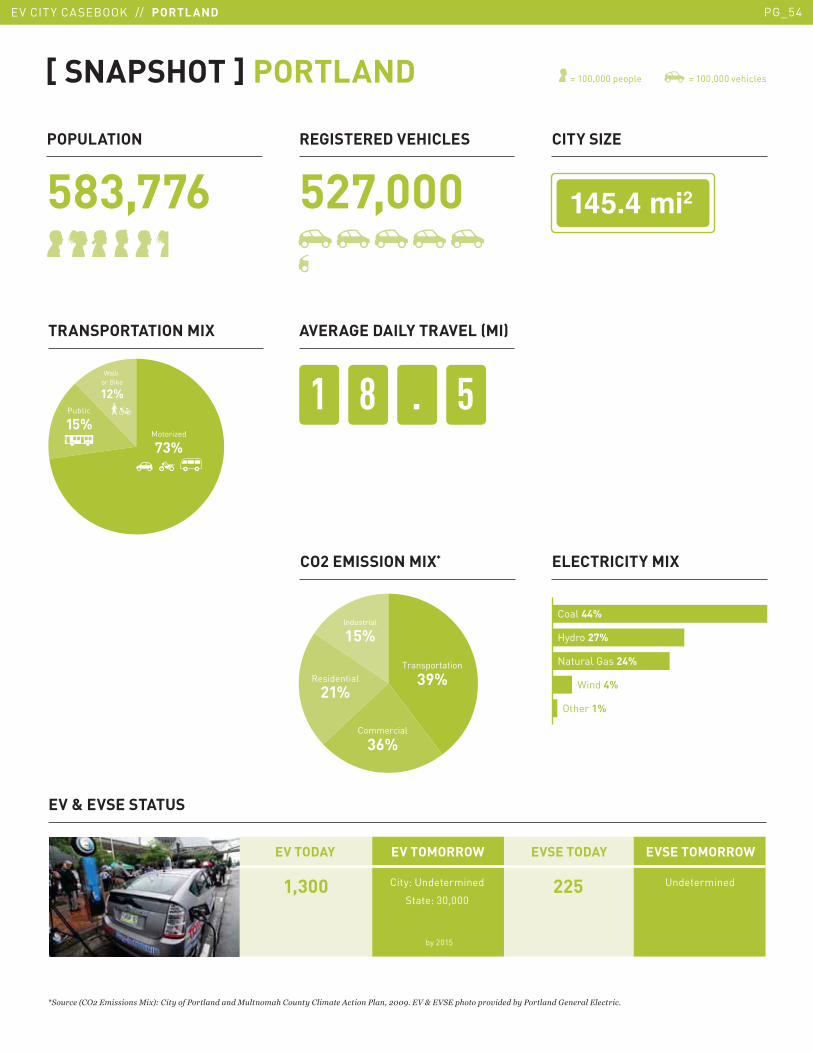
CITY SIZE
1 8 . 5
AVERAGE DAILY TRAVEL (MI)
��������
='�8���1��$��7��������;�62���������� ����������;8����7����8�������7��!������ ��"�$%%*���5�M��5'������������������� ��������������������
[ SNAPSHOT ] PORTLAND
1,300 City: Undetermined
State: 30,000
Undetermined225
by 2015
ELECTRICITY MIX
Wind 4%
Other 1%
Hydro 27%
Coal 44%
Natural Gas 24%
EV & EVSE STATUS
EV TODAY EV TOMORROW EVSE TODAY EVSE TOMORROW
POPULATION
583,776
TRANSPORTATION MIX
REGISTERED VEHICLES
527,000
CO2 EMISSION MIX*
= 100,000 people = 100,000 vehicles
Walk or Bike
12%
Public
15%Motorized
73%
Transportation
39%
Commercial
36%
Industrial
15%
Residential
21%
EV CITY CASEBOOK // PORTLAND PG_54
CONDITIONS FOR EV��������� ������2�! �����'�����������(������������1��5������-3��������!�� �9����8��,5%����� <5������������1�������������������� 5��
����������������������������������� � ���5������C����������8�7�������� !���� ����7����1!��������7����� 5������������������������
�����������!1���8�%,��������� !�������� ������������������'��K�������������� ��������5�
INFRASTRUCTURE43���2�'��H������!�����1���3��/5-5���������������������7����������������� ����� ����'�����������3�� !���!��������1�����&5��
�����3����7����1������������������� �73���������������! ��������������5������+� ����E�������9���2<��3�����1!�����" ��
�3��� �7����1�����1������ �������� 5�
SPENDING AND FINANCIAL INCENTIVESNATIONAL �����43��������������������!������������� ���(�����������!�����Z$�%�������'�2��!��3 � 5��STATE �����/�����Z$%������
�� ���������3������ ������� 5������/�����&%����������(������������1! ��� � ��� �������3���� ����� 5 �����.! ��� � ��������1���
����!�����&%�������������3��������������� ��1��7������������3�����������2����������.! ��� �������4(������� �9.�4�<5
FLEET STRATEGYSTATE �������������������������������3�����>����1����&�5������43��������4�� �������������� �����������������������������3��
�� ���� �Z=�������������������1! ��� � ������� ������������������ �����!�* �7��3���������5�
©2012 Google, Sanborn
PORTLAND
EV CITY CASEBOOK // PORTLAND PG_55
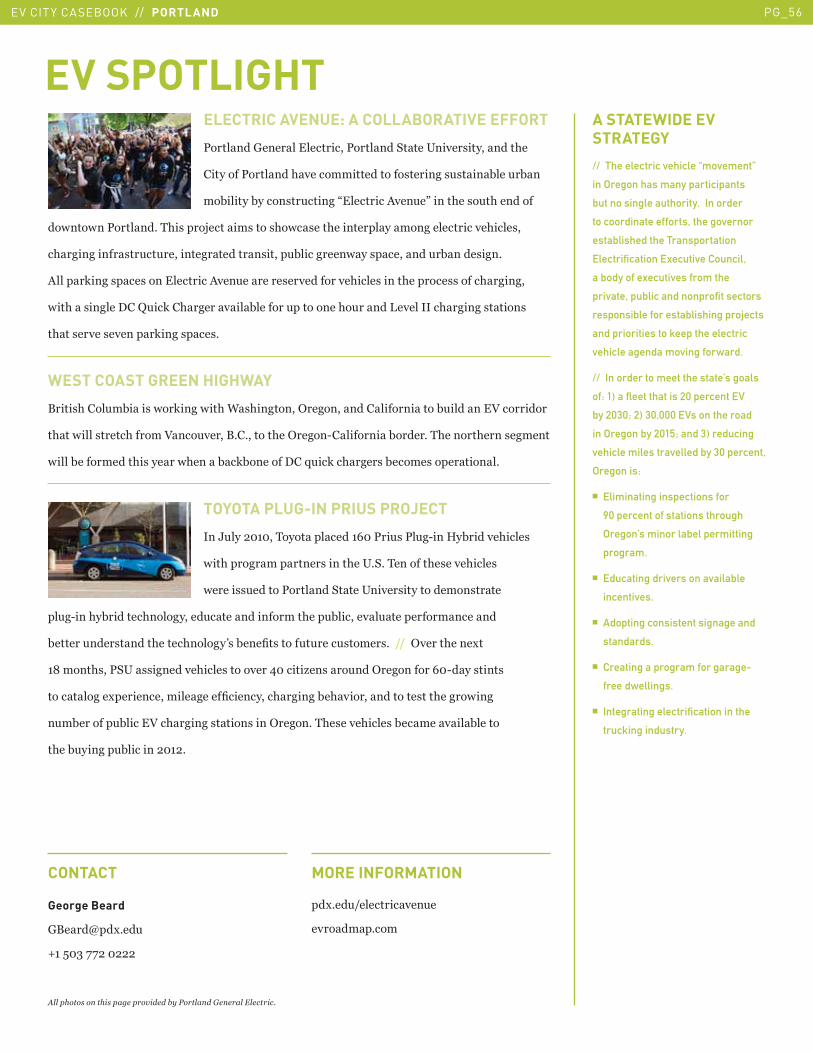
ELECTRIC AVENUE: A COLLABORATIVE EFFORT
'�������C����������������'�������-����/����� ���������3��
��������'�������3������������������ ������ ! ���1���!�1��
��1������1����� ��!�����:�������������!�;�����3�� �!�3��������
��7���7��'������5�43� ����H������ ���� 3�7� ���3��������������������������3���� ��
�3�������� ��!��!���������������� �����!1��������7�� ��������!�1���� ��5��
������*��� ��� �����������������!������� ������������3���� �����3������� �����3�����
7��3�� ��������^!��*��3�������1�������!���������3�!�����E���������3���� ����� ��
�3�� ����� �������*��� ��� 5
WEST COAST GREEN HIGHWAY
.���� 3����!�1��� �7��*���7��3�B 3�����������������������������1!�������2����������
�3��7���� �����3������2���!�����.5�5������3�������I���������1�����5�43������3���� ������
7����1����������3� �����73����1�*1����������J!��*��3��� �1����� ����������5�
TOYOTA PLUG-IN PRIUS PROJECT
���G!���������4������������Q��'��! �'�!I���0�1������3���� �
7��3������������� �����3��/5-5�4�������3� ����3���� ��
7����� !������'�������-����/����� ������������ ������
��!I���3�1�������3���������!���������������3���!1��������!������������������
1������!���� �����3�����3�����@ �1���?� �����!�!����! ����� 5������������3����(��
�,�����3 ��'-/� �������3���� ���������=������L�� ���!�������������Q�I��� ���� ��
���������(������������������?���������3����1�3�������������� ���3����7����
�!�1�������!1�����2��3���� ����� ���������5�43� ����3���� �1��������1�������
�3��1!�����!1�����������5
A STATEWIDE EV
STRATEGY
// The electric vehicle “movement”
in Oregon has many participants
but no single authority. In order
to coordinate efforts, the governor
established the Transportation
Electrification Executive Council,
a body of executives from the
private, public and nonprofit sectors
responsible for establishing projects
and priorities to keep the electric
vehicle agenda moving forward.
// In order to meet the state’s goals
of: 1) a fleet that is 20 percent EV
by 2030; 2) 30,000 EVs on the road
in Oregon by 2015; and 3) reducing
vehicle miles travelled by 30 percent,
Oregon is:
� Eliminating inspections for
90 percent of stations through
Oregon’s minor label permitting
program.
� Educating drivers on available
incentives.
� Adopting consistent signage and
standards.
� Creating a program for garage-
free dwellings.
� Integrating electrification in the
trucking industry.
EV SPOTLIGHT
George Beard
C.���R��(5��!�
V��%�&�$$������
CONTACT
��(5��!������������!�
�������5���
MORE INFORMATION
!�������������������������������� ��������������������
EV CITY CASEBOOK // PORTLAND PG_56
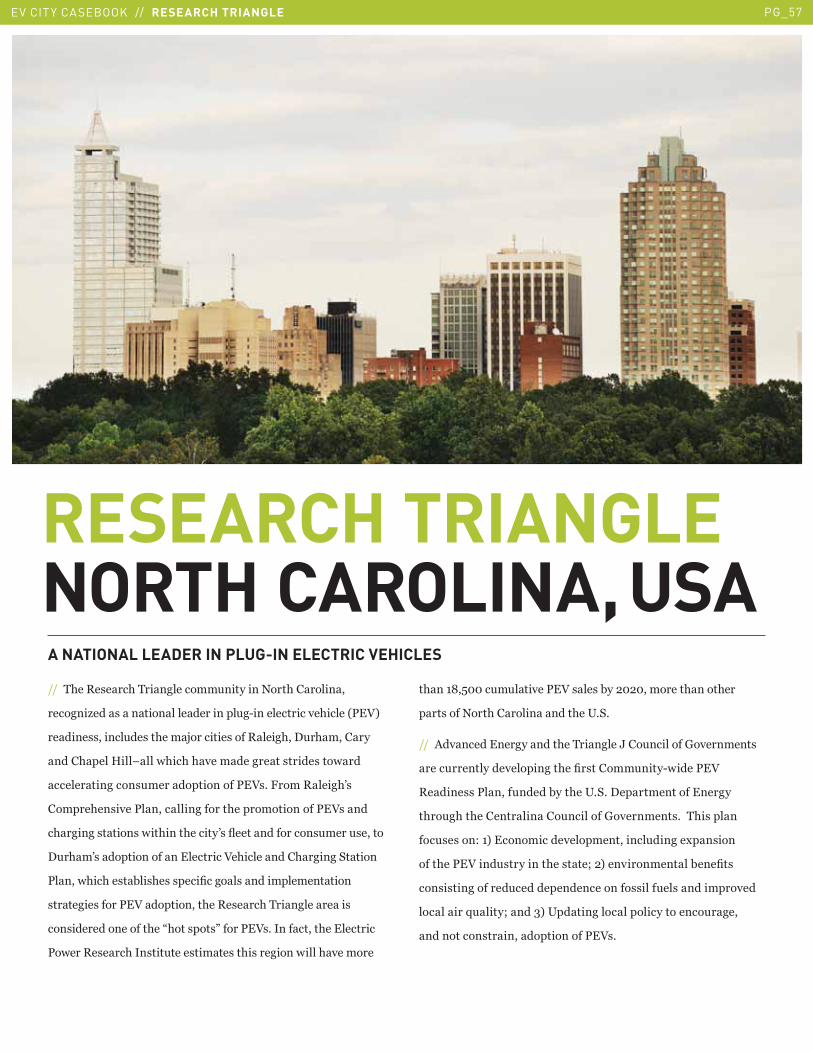
EV CITY CASEBOOK // RESEARCH TRIANGLE PG_57
RESEARCH TRIANGLENORTH CAROLINA, USA A NATIONAL LEADER IN PLUG-IN ELECTRIC VEHICLES
����43��)� ���3�4����������!��������6���3���������
������L��� ��������������������!I��������������3�����9'�2<�
������ ������!�� ��3���H�������� ����)���3���!�3�������
����3����0���U���73��3�3����������� ����� ���7���
������������� !���������������'�2 5�"����)���3@ �
������3�� ����'���������������3���������������'�2 ����
�3���� ����� �7��3����3������@ �>�������������� !����! ������
�!�3�@ �����������������������2�3���������3����-������
'����73��3�� �1�� 3� � ����?���� ������������������
������ �����'�2�����������3��)� ���3�4���������� �
��� ���������������3��:3��� ��� ;�����'�2 5����������3�����������
'�7���)� ���3��� ���!���� ����� ��3� �������7����3��������
�3���,�%����!�!������'�2� �� �1��������������3����3����
��� ����6���3������������3��/5-5�
����������������������3��4������G���!��������C��������� �
����!�������������������3��?� ������!����I7����'�2�
)����� �'�����!�����1���3��/5-5��������������������
�3��!3��3�������������!��������C��������� 5��43� �����
���! � ���8��<���������������������������!�����(�� �����
����3��'�2����! ��������3�� ���K��<��������������1���?� �
��� � ����������!�������������������� ����!�� �������������
��������J!����K����&<�/�������������������������!�����
���������� �����������������'�2 5
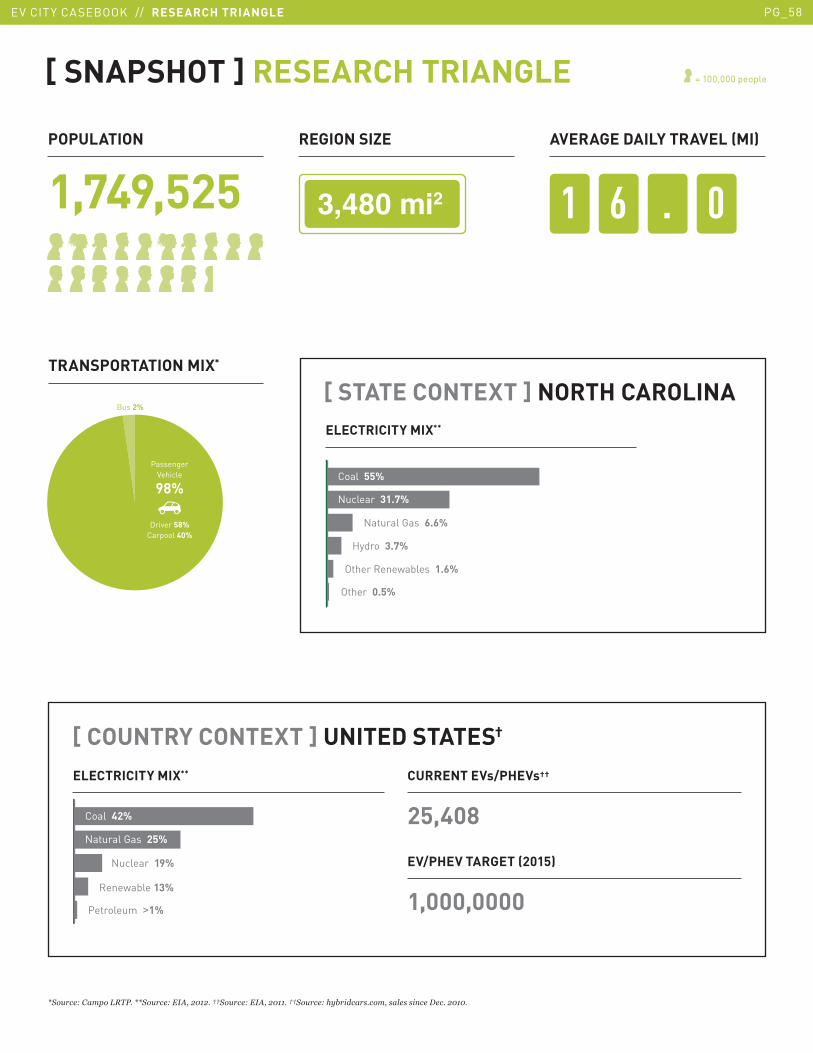
='�8�����7���<�# ��=='�8����� !"�$%&$��HH'�8����� !"�$%&&��HH'�8����������������7"��������������$%&%�
= 100,000 people[ SNAPSHOT ] RESEARCH TRIANGLE
�������
REGION SIZE
1 6 . 0
AVERAGE DAILY TRAVEL (MI)POPULATION
1,749,525
[ STATE CONTEXT ] NORTH CAROLINA
Hydro 3.7%
Other Renewables 1.6%
Other 0.5%
Natural Gas 6.6%
Coal 55%
Nuclear 31.7%
ELECTRICITY MIX**
TRANSPORTATION MIX*
[ COUNTRY CONTEXT ] UNITED STATES†
ELECTRICITY MIX**
Renewable 13%
Petroleum �1%
Nuclear 19%
Coal 42%
Natural Gas 25%
CURRENT EVs/PHEVs††
25,408
EV/PHEV TARGET (2015)
1,000,0000
Bus 2%
Driver 58%
Carpool 40%
PassengerVehicle
98%
EV CITY CASEBOOK // RESEARCH TRIANGLE PG_58
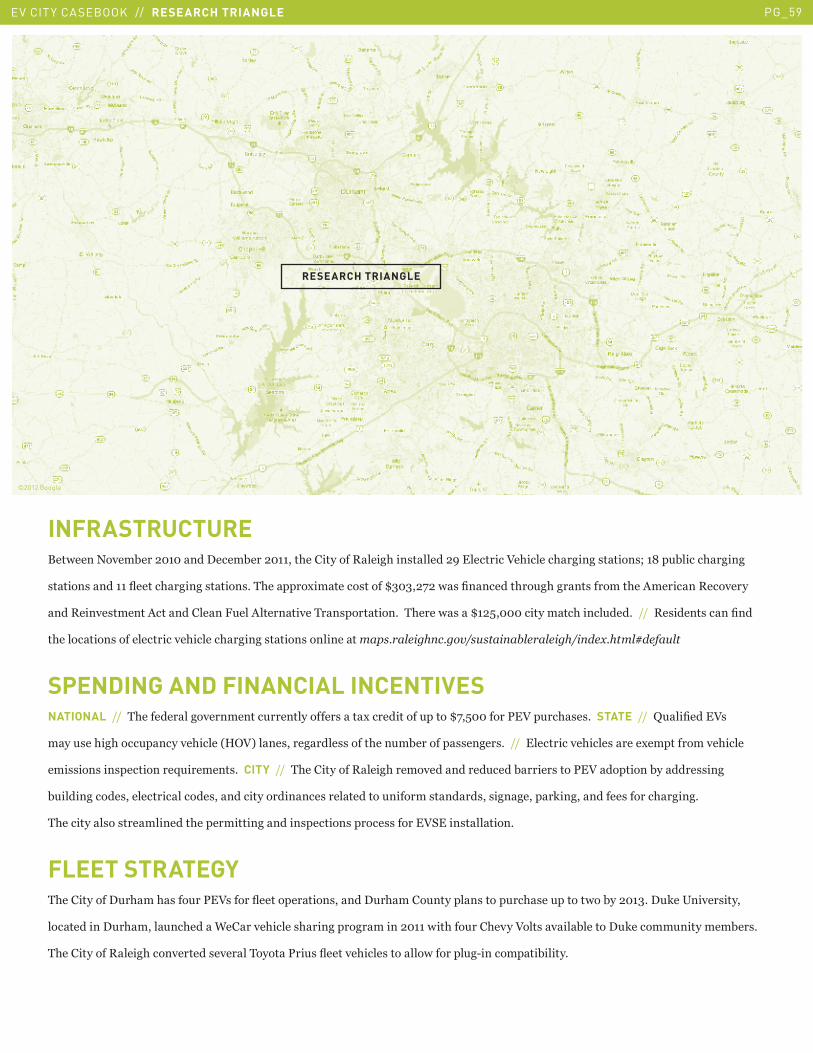
INFRASTRUCTURE.��7����6����1����������������1����������3����������)���3��� ������� ����������2�3������3���� ����� K��,��!1�����3����
����� �������>�����3���� ����� 5�43������(������� �����Z&�&��$��7 �?�������3��!3���� �������3����������)��������
���)����� ������������������"!��������������4�� ��������5��43����7 ��Z��%�������������3�����!���5������)� ����� ����?���
�3��������� ���������������3������3���� ����� ����������7����������������8���������������6���7�T��8��
SPENDING AND FINANCIAL INCENTIVESNATIONAL �����43��������������������!������������� ���(�����������!�����Z$�%�������'�2��!��3 � 5��STATE �����^!��?����2 �
���! ��3�3����!�������3�����90�2<���� �������� �����3���!�1������� ���� 5�����������������3���� �����(������������3�����
��� ��� ��� ����������J!������� 5��CITY �����43����������)���3���������������!����1����� ����'�2���������1������ ���
1!���������� ���������������� ������������������ �����������!������� ����� �� �������*���������� ������3���5���
43�������� �� �����������3����������������� ������� ������ ������2-���� �������5��
FLEET STRATEGY43�����������!�3��3 ���!��'�2 �����>������������ ������!�3����!������� �����!��3 ��!������7��1�����&5��!*��/����� �����
�����������!�3����!��3����B������3����� 3������������������7��3���!���3����2��� ����1�������!*������!��������1�� 5�
43����������)���3����������� ������4�����'��! �>������3���� �������7�������!I���������1�����5
©2012 Google
RESEARCH TRIANGLE
EV CITY CASEBOOK // RESEARCH TRIANGLE PG_59
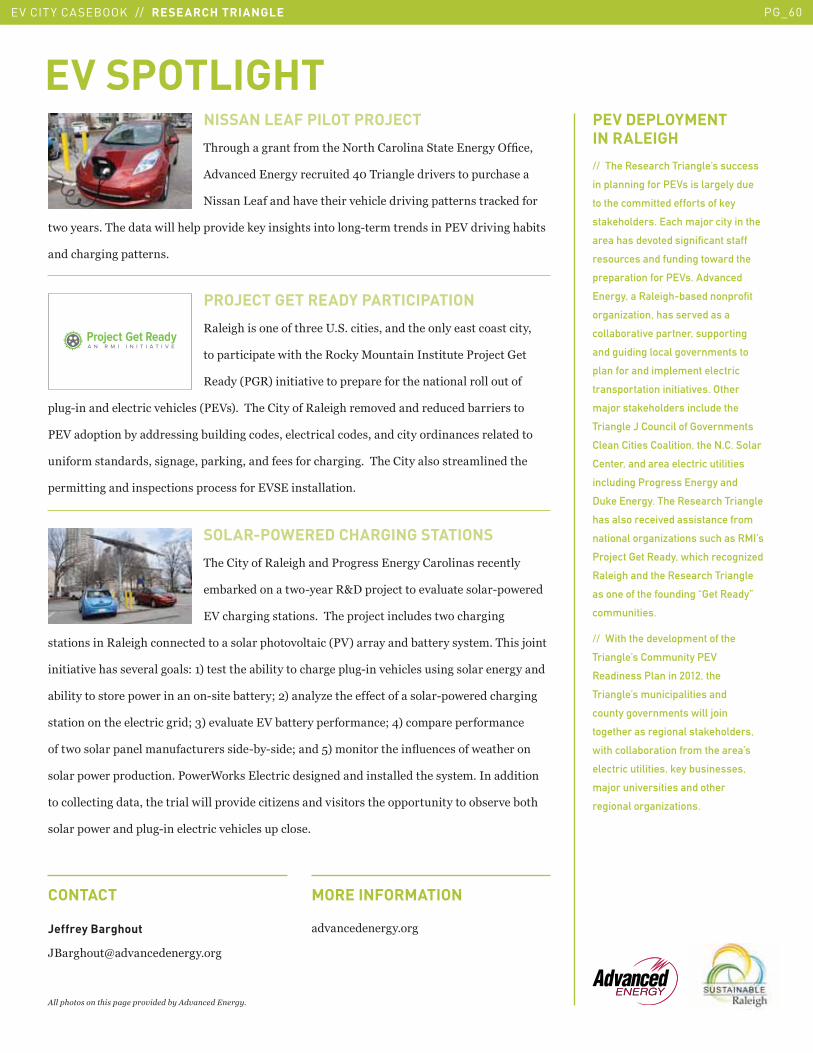
SOLAR-POWERED CHARGING STATIONS
43����������)���3����'���� ������������� ����������
��1�*��������7�I����)S�����H����������!��� ���I��7�����
�2��3���� ����� 5��43�����H��������!�� ��7���3����
����� ����)���3��������������� �����3����������9'2<��������1������ � ���5�43� �H�����
����������3 � �������� 8��<��� ���3��1����������3�����!I�����3���� �! ��� �������������
1��������� �������7����������I ����1�����K��<����L���3������������� ���I��7������3����
����������3��������������K�&<����!����2�1����������������K�=<�������������������
����7�� �����������!���!��� � ���I1�I ���K����%<����������3����>!���� ����7��3������
������7�������!�����5�'�7��B��* ������������ ���������� �������3�� � ���5������������
������������������3�������7����������������L�� ������ ���� ��3��������!���������1 �����1��3�
������7��������!I��������������3���� �!����� �5
PROJECT GET READY PARTICIPATION
)���3�� ���������3����/5-5������ ������3�������� ���� ���������
�������������7��3��3��)��*��+�!������� ���!���'��H����C���
)����9'C)<��������������������������3���������������!�����
��!I�����������������3���� �9'�2 <5��43����������)���3���������������!����1����� ����
'�2���������1������ ���1!���������� ���������������� ������������������ �����������
!������� ����� �� �������*���������� ������3���5��43�������� �� �����������3��
��������������� ������� ������ ������2-���� �������5�
NISSAN LEAF PILOT PROJECT
43��!3������������3��6���3��������-������������?����
������������������!�����=��4������������ �����!��3 ���
6� ��E������3����3������3������������������ ����*�������
�7����� 5�43�����7����3������������*����� �3� ���������I���������� ����'�2��������31�� �
����3���������� 5�
PEV DEPLOYMENT
IN RALEIGH
// The Research Triangle’s success
in planning for PEVs is largely due
to the committed efforts of key
stakeholders. Each major city in the
area has devoted significant staff
resources and funding toward the
preparation for PEVs. Advanced
Energy, a Raleigh-based nonprofit
organization, has served as a
collaborative partner, supporting
and guiding local governments to
plan for and implement electric
transportation initiatives. Other
major stakeholders include the
Triangle J Council of Governments
Clean Cities Coalition, the N.C. Solar
Center, and area electric utilities
including Progress Energy and
Duke Energy. The Research Triangle
has also received assistance from
national organizations such as RMI’s
Project Get Ready, which recognized
Raleigh and the Research Triangle
as one of the founding “Get Ready”
communities.
// With the development of the
Triangle’s Community PEV
Readiness Plan in 2012, the
Triangle’s municipalities and
county governments will join
together as regional stakeholders,
with collaboration from the area’s
electric utilities, key businesses,
major universities and other
regional organizations.
EV SPOTLIGHT
Jeffrey Barghout
G.�3�!�R�����������5��
CONTACT
�����������5��
MORE INFORMATION
!��������������������������������!������������
EV CITY CASEBOOK // RESEARCH TRIANGLE PG_60
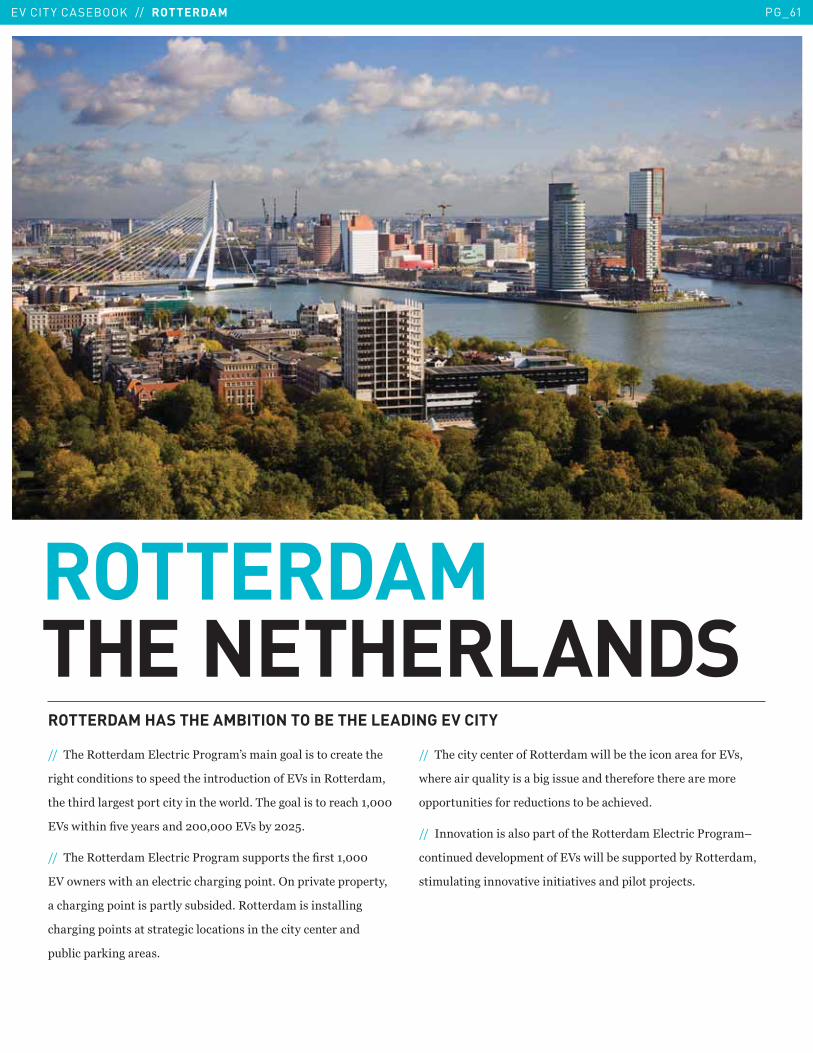
EV CITY CASEBOOK // ROTTERDAM PG_61
ROTTERDAMTHE NETHERLANDSROTTERDAM HAS THE AMBITION TO BE THE LEADING EV CITY
����43��)�����������������'����@ ��������� �����������3��
��3����������� ���� ������3��������!����������2 ����)���������
�3���3������� ����������������3��7����5�43������ �������3�������
�2 �7��3���?������ �������������2 �1�����%5���
����43��)�����������������'����� !����� ��3��?� ��������
�2��7��� �7��3�������������3���������5���������������������
��3����������� ������� !1 ����5�)��������� ��� ������
�3��������� ��� �������������� �����3�����������������
�!1������*����� 5�
����43�����������������)��������7����1���3���������������2 ��
73�������J!������ ��1��� !������3���������3������������
������!����� ��������!����� ����1���3�����5�
��������������� �� ����������3��)�����������������'����U
������!�������������������2 �7����1�� !��������1��)���������
���!������������������������ �������������H��� 5����������
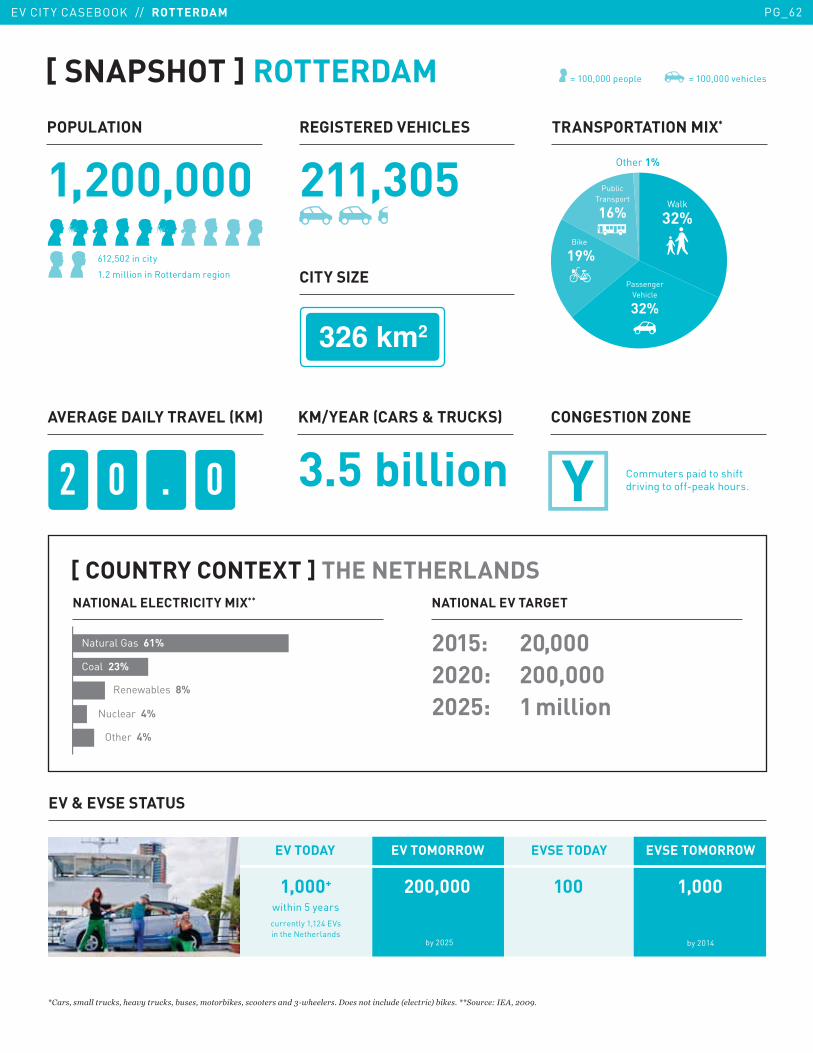
612,502 in city
1.2 million in Rotterdam region
=����"��7�����8�:�"�������8�:�"��8��"�7������:�"������������N-3������������������8��1������2���:���=='�8���� �!"�$%%*�
[ SNAPSHOT ] ROTTERDAM
1,000+
within 5 yearscurrently 1,124 EVs in the Netherlands
200,000 1,000100
by 2025 by 2014
Other 1%
Walk
32%
PublicTransport
16%
PassengerVehicle
32%
Bike
19%
[ COUNTRY CONTEXT ] THE NETHERLANDS
NATIONAL EV TARGET
2015: 20,000
2020: 200,000
2025: 1 million
NATIONAL ELECTRICITY MIX**
Renewables 8%
Nuclear 4%
Other 4%
Coal 23%
Natural Gas 61%
TRANSPORTATION MIX*POPULATION
1,200,000
REGISTERED VEHICLES
211,305
������
CITY SIZE
2 0 . 0 Commuters paid to shift driving to off-peak hours.
AVERAGE DAILY TRAVEL (KM) KM/YEAR (CARS & TRUCKS)
3.5 billion
CONGESTION ZONE
= 100,000 people = 100,000 vehicles
EV & EVSE STATUS
EV TODAY EV TOMORROW EVSE TODAY EVSE TOMORROW
EV CITY CASEBOOK // ROTTERDAM PG_62
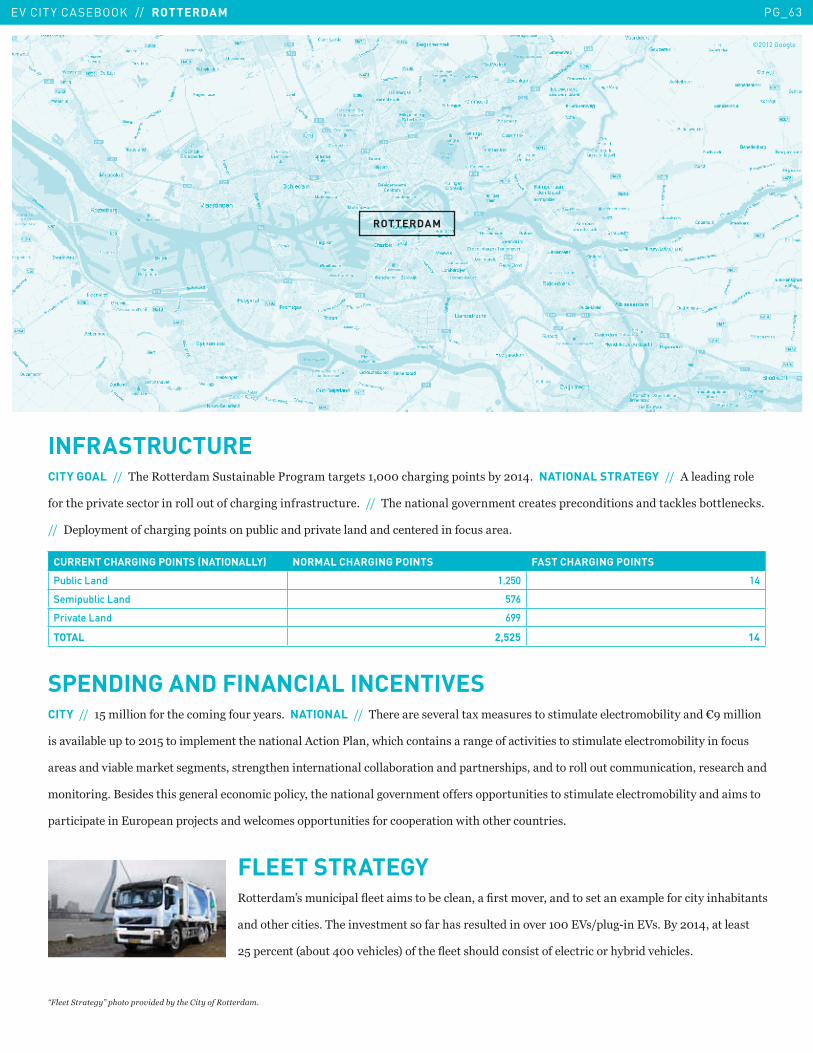
INFRASTRUCTURECITY GOAL������43��)��������-! ���1���'��������� ��������3��������� �1�����=5��NATIONAL STRATEGY�������������������
�����3��������� ���������������!������3�������� ��!��!��5������43������������������������ ������������� ������*�� �1��������* 5��
�������������������3��������� �����!1������������������������������������! ���5��
CURRENT CHARGING POINTS (NATIONALLY) NORMAL CHARGING POINTS FAST CHARGING POINTS
Public Land 1,250 14
Semipublic Land 576
Private Land 699
TOTAL 2,525 14
SPENDING AND FINANCIAL INCENTIVESCITY�������%��������������3����������!����� 5��NATIONAL������43������� �������(��� !�� ���� ���!�������������1���������P ���������
� ����1���!��������%���������������3����������������'����73��3������� ����������������� ���� ���!�������������1������������! �
�� ������1�����*��� ����� �� �����3�������������������1���������������� 3�� ��������������!������!����������� ���3����
���������5�.� ��� ��3� �������������������������3������������������������ �������!����� ���� ���!�������������1����������� ����
��������������!���������H��� ����7������ �������!����� ����������������7��3���3�����!����� 5�
FLEET STRATEGY)�������@ ��!�������>������ ����1���������?� ��������������� ������(����������������31���� �
�����3�������� 5�43������ ������ �����3 ��� !������������������2 ���!I����2 5�.�����=������ ���
�%���������91�!��=�����3���� <�����3��>���� 3�!������ � �����������������3�1������3���� 5
PI���'�����Q�����������������������������������7�
©2012 Google
ROTTERDAM
EV CITY CASEBOOK // ROTTERDAM PG_63
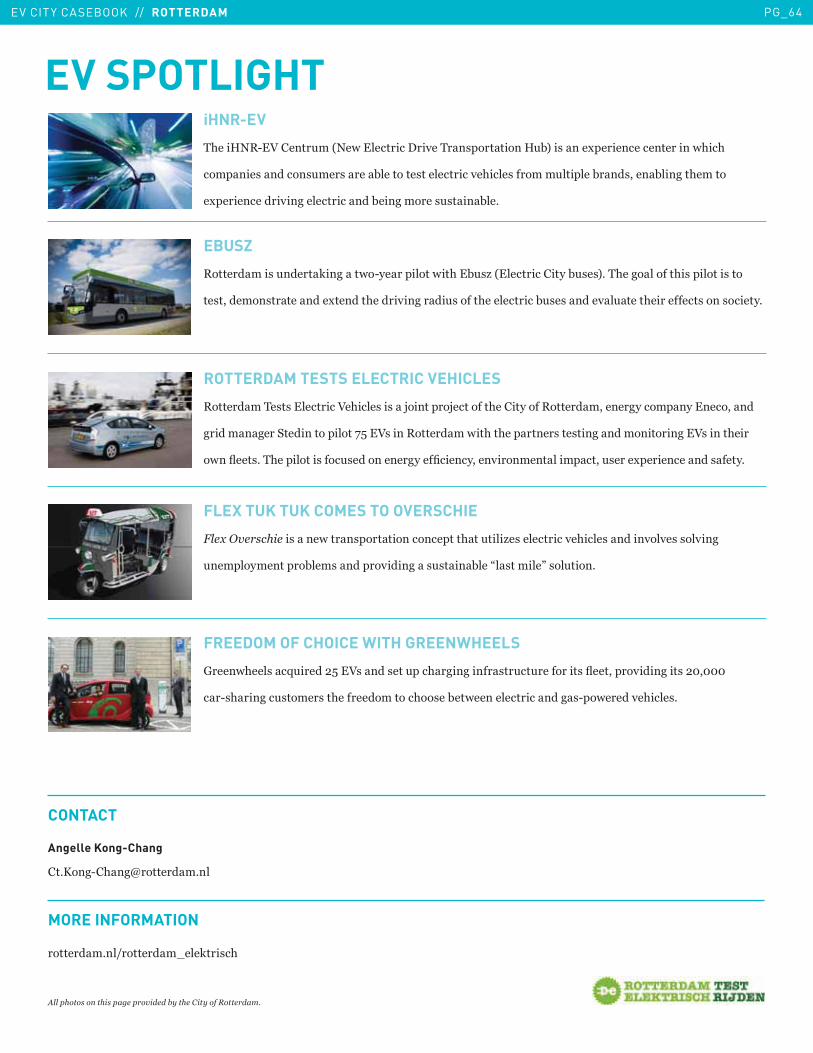
iHNR-EV
43���06)I�2������!��96�7����������������4�� ���������0!1<�� ����(�������������������73��3�
������� ������� !��� ����1�������� �������������3���� �������!�������1��� ����1�����3������
�(����������������������������1��������� ! ���1��5
EBUSZ
)��������� �!�����*�����7�I����������7��3��1! L�9��������������1! � <5�43���������3� �������� ����
�� �������� ���������(������3������������! �����3�����������1! � �������!����3���������� ���� ������5
ROTTERDAM TESTS ELECTRIC VEHICLES
)��������4� � ����������2�3���� �� ��H��������H��������3����������)��������������������������������
���������-���������������$%��2 ����)��������7��3��3�������� ��� ������������������2 �����3����
�7��>��� 5�43��������� ����! ��������������?����������������������������! ����(������������ ����5
FLEX TUK TUK COMES TO OVERSCHIE
I�6���������� ����7���� ������������������3��!����L� ������������3���� ����������� � ������
!���������������1��� �������������� ! ���1���:� ������;� ��!����5
FREEDOM OF CHOICE WITH GREENWHEELS
C����73��� ��J!������%��2 ���� ���!���3�������� ��!��!��������� �>���������������� ���������
��I 3�����! ����� ��3��������������3�� ��1��7���������������� I��7�������3���� 5
EV SPOTLIGHT
Angelle Kong-Chang
��5D��I�3�R��������5��
CONTACT
��������5�����������A���*��� �3
MORE INFORMATION
!�������������������������������������������������7�
EV CITY CASEBOOK // ROTTERDAM PG_64
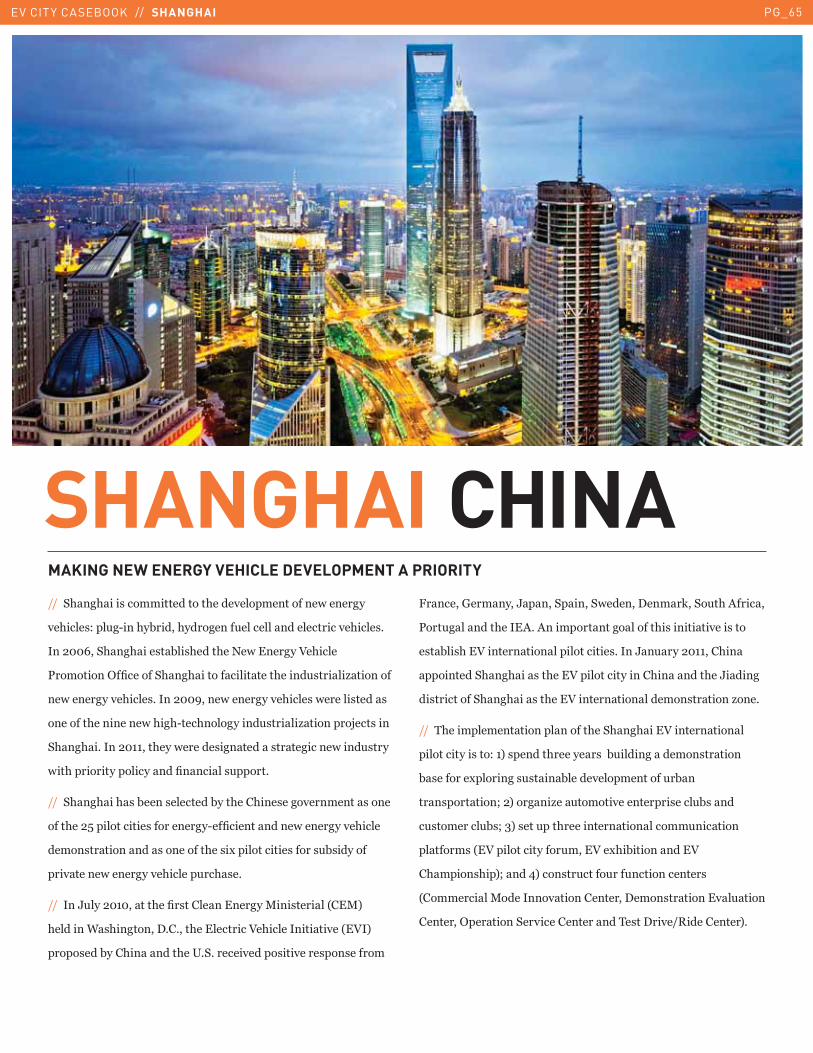
EV CITY CASEBOOK // SHANGHAI PG_65
MAKING NEW ENERGY VEHICLE DEVELOPMENT A PRIORITY
����-3�3��� ���������������3�������������������7�������
��3���� 8���!I���3�1�����3��������!����������������������3���� 5�
������Q��-3�3��� �1�� 3����3��6�7�������2�3�����
'�����������?������-3�3���������������3�����! �����L��������
��7���������3���� 5������� ����7���������3���� �7������ ���� �
��������3���������7�3�3I���3���������! �����L��������H��� ����
-3�3�5�����������3���7������ ������� ���������7����! ����
7��3��������������������?������ !�����5
����-3�3��3 �1���� ��������1���3���3��� ������������ �����
����3���%������������ ����������I��?�����������7���������3�����
����� ���������� ���������3�� �(������������ ����� !1 �������
���������7���������3������!��3 �5�
�������G!������������3��?� �������������+��� ������9��+<�
3�������B 3��������5�5���3�����������2�3���������������9�2�<�
����� ���1���3�������3��/5-5������������ �������� ��� �������
"������C�������G����-�����-7�����������*��-�!�3��������
'���!������3�����5��������������������3� ������������ ����
� �1�� 3��2������������������������ 5����G�!����������3���
���������-3�3�� ��3���2����������������3�������3��G�����
�� ���������-3�3�� ��3���2������������������ �������L���5
����43������������������������3��-3�3���2�������������
������������ ���8��<� ������3������� ��1!������������ �������
1 �������(������� ! ���1������������������!�1��
��� ��������K��<�����L��!����������������� ����!1 ����
�! ��������!1 K�&<� ���!���3��������������������!��������
������� �9�2���������������!����2��(3�1����������2�
�3����� 3��<K����=<���� ��!�����!���!������������� �
9����������+��������������������������� ����������!�����
�����������������-�����������������4� ��������)����������<5
SHANGHAI CHINA

POPULATION
14,047,100 Registered population
23,026,600 Resident population
REGISTERED VEHICLES
1,702,500
TRANSPORTATION MIX*
CITY SIZE AVG. DAILY CAR TRAVEL (KM)
='�8����<���#��������!8�������"�$%&&��=='�8����� !"�$%%,�
30,000-
50,00090% passenger/ 10% commercial
5,000Public Charging Poles
97 Charging Stations
2 Swapping
687 Charging Poles
2 hydrogen refilling stations at the Expo Site and Anting
and 2 movable hydrogen refilling stations
1,614*
Public Service (69% EV)
19*
Private Sector (74% EV)
*Energy Efficient Vehicles by 2015 by 2015
3 9 . 0�� �������
[ SNAPSHOT ] SHANGHAI
PublicTransport
33%
PassengerVehicle
20%
Bike
10%E-Bike
10%
Walk
27%
[ COUNTRY CONTEXT ] CHINA
PLUG-IN HYBRID
Buses: 1,511
Passenger Vehicles: 635
BATTERY EV
Buses: 1,280
Passenger Vehicles: 4,095
Electric Bicycles: 130 million+
500,000
Natural Gas 3%
Hydro 6%
Nuclear 1%
Other Renewables 0.2%
Coal 71%
Oil 19%
CURRENT PLUG-IN/PURE EVs (through November 2011)
NATIONAL GOAL: PLUG-IN/PURE EVs (by 2015)
ELECTRICITY MIX*
EV & EVSE STATUS
EV TODAY EV TOMORROW EVSE TODAY EVSE TOMORROW
EV CITY CASEBOOK // SHANGHAI PG_66
INCENTIVES43���3��� ������������������� �������� !1 ���� ����%������)+.�������!I���3�1���������������3���� �����Q������)+.������!���
�����������3���� 5��������������3����������-3�3������� ��������)+.����=������)+.���� ���������5�'!1���� ���������3���� �� !�3��
���3���!���������������!�* ����1! � ��� ���������� !1 ���� 5������43� ����������� �������������������������������!����3��
����������������������3���� 5�.� ��� �-3�3����3���3��� ������������������� �������� !1 ���� ����?�����3�������� ������!�����
.��H������-�3��L3��5�43� ������� ������������ �� ��������������� !1 ���� �����3�����7�5
CHARGING INFRASTRUCTURE-3�3��7���������������������5�I�5%��3���� ����� ����������������������3����5�4������������� � ��������!1�����3������3��
�2�[����3 ��� ������,����� ��7I�3�������� 5�47���������3� �� ����� �3���1������ ������ ���������:��*��������;���������3��
�������� ����������������������5��������������3�������3 � �����$����!�!����3����������� �����3���������!����������-�6�'����
3 ������������:��?���������3���;� ������7��3���!������ ���3������� �(���� ��7��3�������� 5
©2012 Google, Mapabc
SHANGHAI
EV CITY CASEBOOK // SHANGHAI PG_67
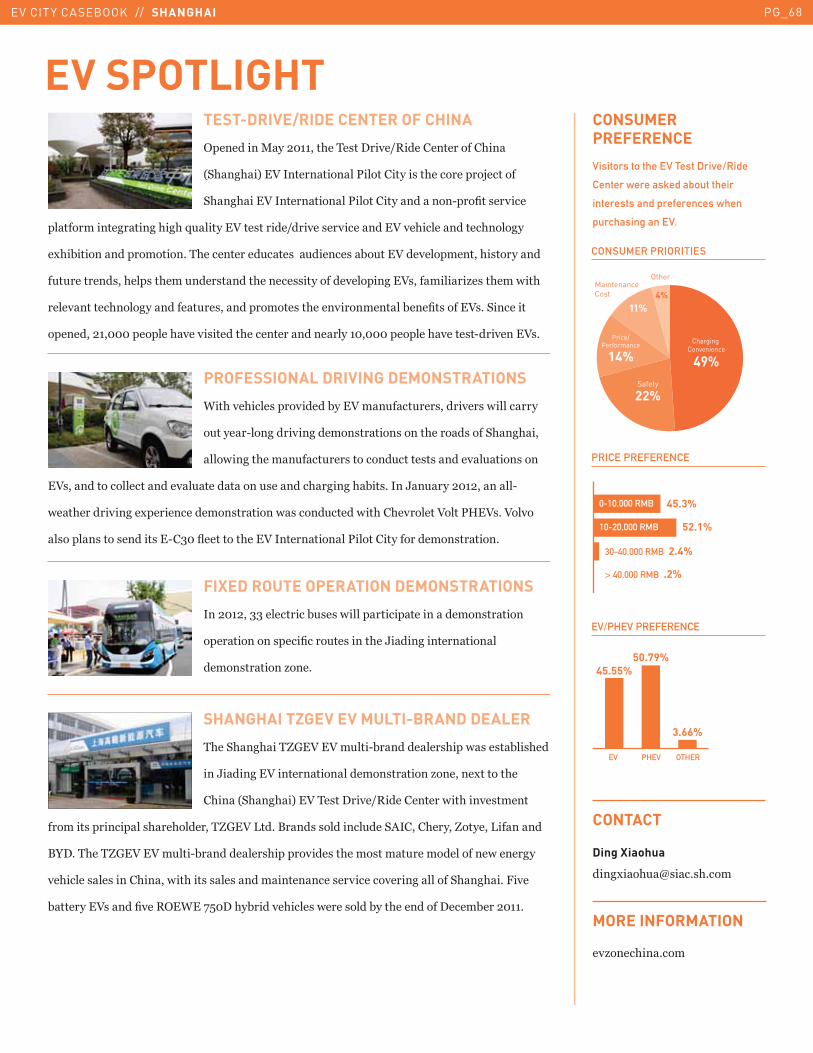
SHANGHAI TZGEV EV MULTI-BRAND DEALER
43��-3�3��4[C�2��2��!���I1��������� 3���7 �� �1�� 3����
���G������2������������������ �������L�������(������3��
�3���9-3�3�<��2�4� ��������)�����������7��3����� ������
������� ���������� 3��3�������4[C�2�E��5�.��� � ��������!���-������3�����[������E�������
.F�5�43��4[C�2��2��!���I1��������� 3���������� ��3���� ����!��������������7�������
��3����� �� �����3����7��3��� � �� �������������� ���������������������-3�3�5�"����
1�������2 ����?���)��B��$%���3�1������3���� �7���� ����1���3��������������1�������5
TEST-DRIVE/RIDE CENTER OF CHINA
����������+���������3��4� ��������)���������������3���
9-3�3�<��2�������������'����������� ��3����������H�������
-3�3���2�������������'�����������������I���?�� �������
�����������������3�3�J!������2��� ������������� �����������2���3�����������3������
�(3�1������������������5�43�����������!��� ��!������ �1�!���2��������������3� ��������
�!�!�������� ��3��� ��3���!���� �����3������ ������������������2 ���������L� ��3���7��3�
�����������3������������!�� ������������ ��3���������������1���?� �����2 5�-��������
����������������������3����� ������3��������������������������������3����� �I��������2 5�
PROFESSIONAL DRIVING DEMONSTRATIONS
B��3���3���� ����������1���2���!���!��� �������� �7���������
�!�����I���������������� ������ �����3����� ����-3�3���
���7����3����!���!��� ��������!����� � �������!���� ����
�2 ����������������������!���������! ������3����31�� 5����G�!�������������I
7��3�����������(�������������� �������7 �����!�����7��3��3��������2����'0�2 5�2�����
� ����� ���� ������ ��I�&��>��������3���2�������������'������������������� ������5�
FIXED ROUTE OPERATION DEMONSTRATIONS
���������&&����������1! � �7����������������������� �������
������������ ����?����!�� �����3��G�����������������
����� �������L���5�
CONSUMER
PREFERENCE
Visitors to the EV Test Drive/Ride
Center were asked about their
interests and preferences when
purchasing an EV.
Ding Xiaohua
���(��3!R ��5 35���
CONTACT
��L����3��5���
MORE INFORMATION
EV SPOTLIGHT
CONSUMER PRIORITIES
PRICE PREFERENCE
EV/PHEV PREFERENCE
50.79%
45.55%
3.66%
EV PHEV OTHER
52.1%
45.3%0-10,000 RMB
10-20,000 RMB
30-40,000 RMB 2.4%
> 40,000 RMB .2%
Safety
22%
Price/Performance
14%
Charging Convenience
49%
11%
4%
MaintenanceCost
Other
EV CITY CASEBOOK // SHANGHAI PG_68
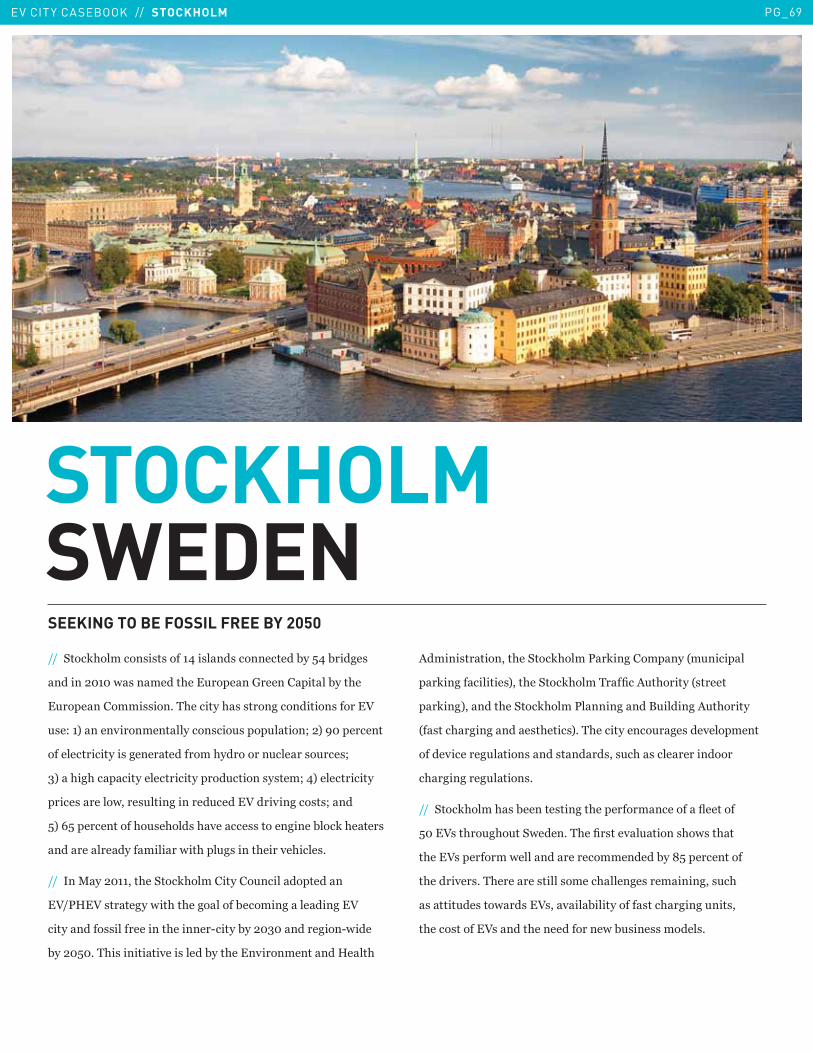
EV CITY CASEBOOK // STOCKHOLM PG_69
STOCKHOLM SWEDENSEEKING TO BE FOSSIL FREE BY 2050
����-���*3������� � � �����=�� ��� �����������1��%=�1���� �
�����������7 �������3���!������C�����������1���3��
�!����������� ���5�43�������3 � �������������� ������2�
! �8��<��������������������� ���! ����!�����K��<� �����������
���������������� ��������������3���������!����� �!��� K��
&<��3�3������������������������!������ � ���K�=<�������������
����� ������7���� !�����������!�����2���������� � K�����
%<�Q%������������3�! �3��� �3������ ����������1���*�3���� �
�������������������7��3���! �����3������3���� 5
�������+���������3��-���*3�����������!��������������
�2�'0�2� ������7��3��3��������1���������������2�
���������� ������������3�������I�����1����&����������I7����
1����%�5�43� ������������ �����1���3�����������������0���3�
������ ���������3��-���*3����'�*����������9�!�������
��*����������� <���3��-���*3����4��?���!�3������9 ������
��*��<������3��-���*3����'���������.!�������!�3������
9� ���3�������� �3���� <5�43�����������!�� �������������
������������!����� ���� ����� �� !�3� ���������������
�3������!����� 5
����-���*3����3 �1������ �����3�����������������>�������
%���2 ��3��!3�!��-7����5�43��?� �����!����� 3�7 ��3���
�3���2 ���������7����������������������1��,%�������������
�3�������� 5�43������� ����� �����3����� ���������� !�3��
�����!�� ���7�� ��2 �����1���������� ���3����!��� ���
�3���� ������2 �����3�������������7�1! ��� ������ 5�
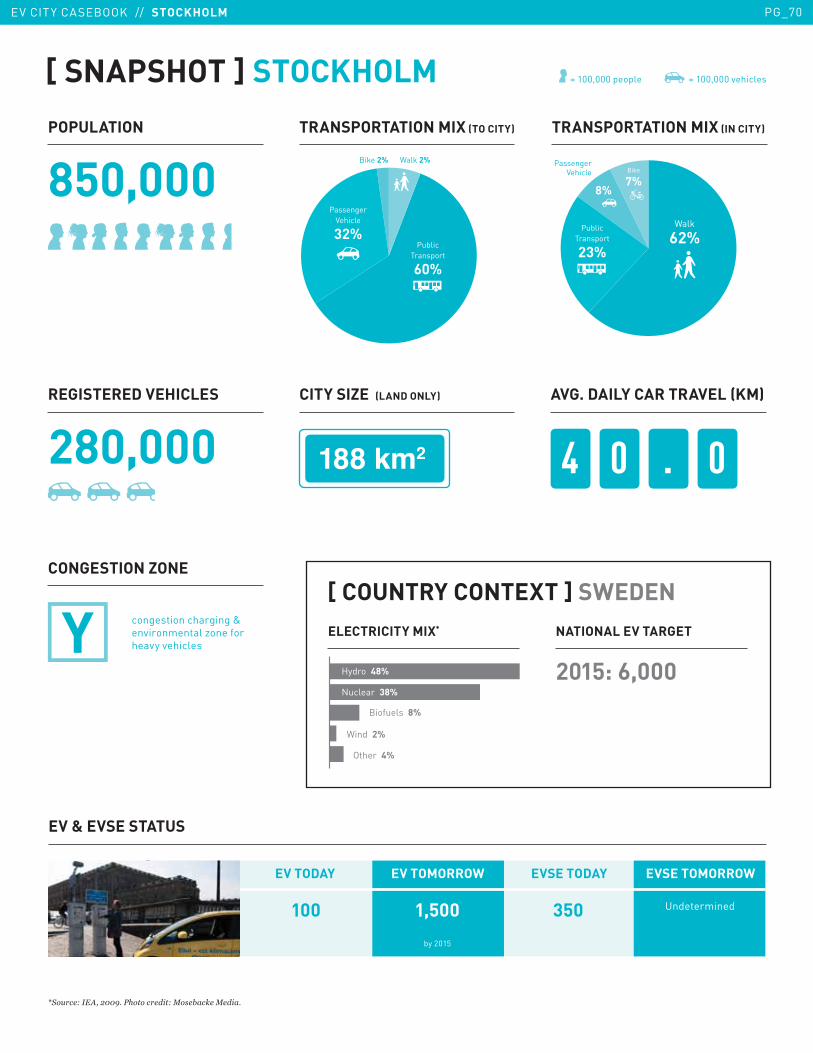
='�8���� �!"�$%%*�� ������������;����:�;���
[ SNAPSHOT ] STOCKHOLM = 100,000 people = 100,000 vehicles
PublicTransport
23%
PassengerVehicle Bike
7%8%
Walk
62%
Bike 2% Walk 2%
PublicTransport
60%
PassengerVehicle
32%
TRANSPORTATION MIX (IN CITY)POPULATION
850,000
REGISTERED VEHICLES
280,000
TRANSPORTATION MIX (TO CITY)
�����
CITY SIZE (LAND ONLY)
4 0 . 0
AVG. DAILY CAR TRAVEL (KM)
congestion charging & environmental zone for heavy vehicles
CONGESTION ZONE
100 1,500 Undetermined350
by 2015
EV & EVSE STATUS
EV TODAY EV TOMORROW EVSE TODAY EVSE TOMORROW
[ COUNTRY CONTEXT ] SWEDEN
NATIONAL EV TARGET
2015: 6,000
ELECTRICITY MIX*
Wind 2%
Other 4%
Nuclear 38%
Hydro 48%
Biofuels 8%
EV CITY CASEBOOK // STOCKHOLM PG_70
NATIONAL INCENTIVES�2��7��� �����(������������3������(������3��?� ��?������ 5������)��!�����(�������������3���� �����3��������������5��
����-!������������'����!�8�1�������G�!����������!��3 �� �����2 ���������=������-�D�9P=����<���� �����!����5�
EV/PHEV PROCUREMENTNATIONAL����� �������1�������������3����������-���*3�������2����������������������������7��3� �(���3����� !������ U7��3�� Q�
��3�������L���� �9�!���������� ����!������!���� ������������������ <�����������5����������P%�����7 ��������1��������
�3��?� ����������3���� ��!��3 ����3��!3��3������!��������������5�,%���� ����=�����!�* ��� �7����1���!��3 ����������5��
����CITY 43����������-���*3����� �����!��������(�����������2 ���3����������� �>�������� �����!������������������������� 5
�����������1P'���:���7U���������� ������8��8�"Q�������������2��'���:���7� �:�����!(4�;����:�;����
STOCKHOLM’S
CHARGING
INFRASTRUCTURE
Opened in September 2011, Stockholm’s
newest parking garage Högalidsgaraget
(near right) features 200 parking places
equipped with EV charging units.
©2012 Google
STOCKHOLM
EV CITY CASEBOOK // STOCKHOLM PG_71
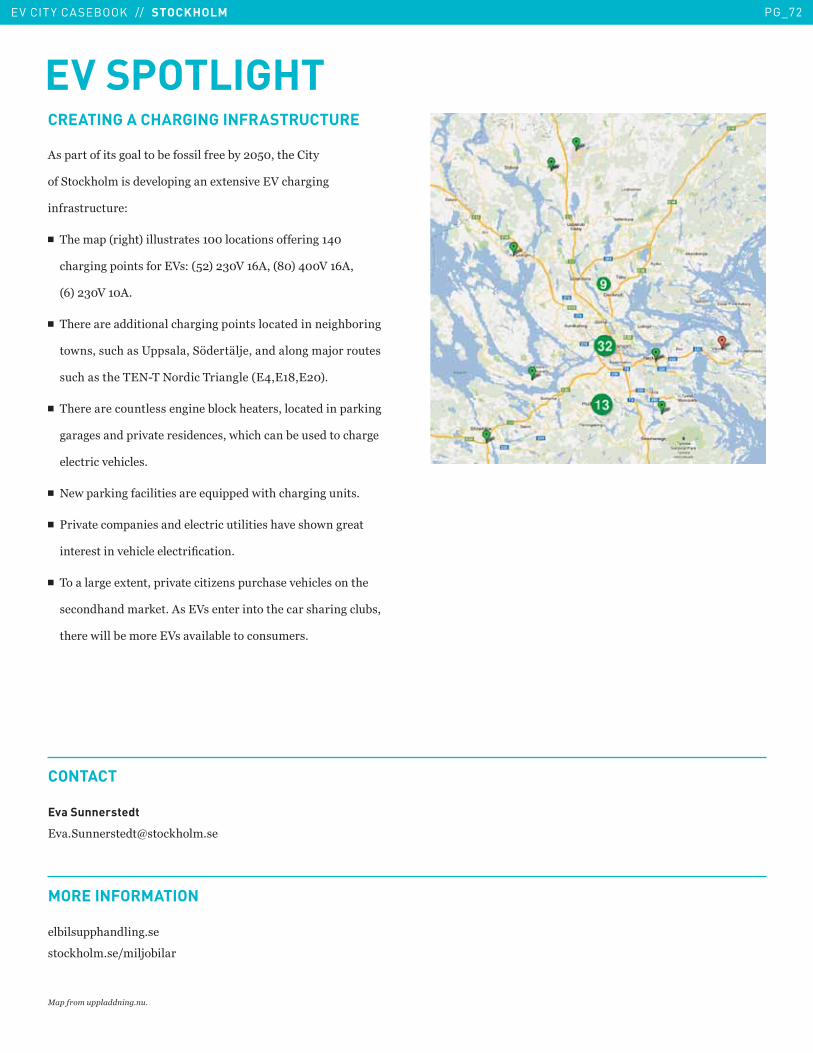
CREATING A CHARGING INFRASTRUCTURE
� ���������� �������1���� ��������1����%����3�������
���-���*3����� ��������������(��� �����2��3����
���� ��!��!��8�
�� 43�����9��3�<����! ���� ������������ ����������=��
�3��������� ������2 8�9%�<��&�2��Q���9,�<�=��2��Q����
9Q<��&�2����5
�� 43�����������������3��������� ��������������31�����
��7� �� !�3� �/�� ���-_����`�H�����������H�����!�� �
!�3� ��3��4�6I4�6������4������9�=���,����<5
�� 43���������!���� �������1���*�3���� ��������������*���
�� ������������� ������ ��73��3����1��! �������3���
�����������3���� 5��
�� 6�7���*����������� �����J!������7��3��3����!��� 5��
�� '������������� �������������!������� �3��� 3�7������
������ �������3������������?�����5
�� 4��������(�����������������L�� ��!��3 ����3���� �����3��
�����3�����*��5�� ��2 �������������3����� 3������!1 ��
�3����7����1��������2 ����1��������� !��� 5��
EV SPOTLIGHT
Eva Sunnerstedt
��5-!���� ����R ���*3���5 �
��1�� !��3�����5 ��
���*3���5 �����H�1���
CONTACT
MORE INFORMATION
;�����7�8�����������8�
EV CITY CASEBOOK // STOCKHOLM PG_72
EV CITY CASEBOOK // CONTRIBUTORS PG_73
)��*��+�!������� ���!���9)+�<�� ��������������������������!�����������?���3��*I��I�����*5��
)+�����3 �L� ������������� ��������������3������ ����������!����*�� �����!�?������� ��� ����
����������3����?����������� ��������! ������� �!��� 5�)+�@ � ����������! �� �����������������3��/5-5�
��� ������������� ����!�� ������?��������������71�� �1����%�5�)+�@ �'��H����C���)����7��* �7��3�
����� �������! ��������� ������������1� ��������� ����������������3�������������������������5��
B��3�����7��*����������%������ ����=�� ������������� ���3� ����H���� ��* ��������������3����� ����������!����� ������3�� ���� �
��� �����������3������������?�����5�#������7��"��������7������
43�����������2�3���� �����������9�2�<�� ������������������������ �����3�������������+��� ��������3�3I
�������!������������!�������������������� ��������� ��3����������������������3������ 5��2��
��* ��������������3����1��������������������������������������3���� �9�2 <������!������!I���3�1�����
�����������3���� �����!����������3���� ��1������5��2��7������1�������� ���7����3� ����1������!����
�3��������������������������������������� K��!��3�������������� �������������2������ ������ ��
���!�1���� ����� 3����(�������� ������ �� �������K� 3�������������������!���������� ������ ���3�����������������
����� ������ !����3���3���� ����!������1��� ������3��������3���������������������1�������� ��K��(�3���������������
����2���������������� �� �7���� �1� ��������� ����������� �������1�������� ���7����3� ������ K���������������� ������
�*�3����� �������! �����3��1���?� �����!1���I����������� ����� �������3��������������������2�����!�����������>��� 5��
#������7��"��������������7�������������
43���$�����������'���� �����3�������������������������@ �������������������������������������
���0�1����������������2�3�����4��3������ ����'������ � 3����3�������7����1H������ 8��<�'�������
��������� �������!�3������ ������! �� �������! ���� �7��3��1H���������������������������������
3�1������3���� ������3���������� ������������?�����������3�������������K��<�����1�����������I�������������� ���3����H��� ����
���� ������3������������!��3����� ���3��������� ����� K�&<�����1�����7��3���3������ ����I��������������������������� �
�����3�������L���� �7��3��������� ������������������ ��������������3���� K����=<�-����� ������������������1��������������
���3�1������������������3���� 5�#������7��"���������������
CONTRIBUTORSCOORDINATED BY
EV CITY CASEBOOK // CONTRIBUTORS PG_74
�=��� �����7��*��������������������� ��������!����3��7������������������������������������!�����
! ���1���������I�������������� ��������� ���������3��7����3�������� ���������3�����1���5��=��7��* �
�������������������� 3���7��3��3���������������������������9���<������ ��������73��3�7 � ������1���3���
B������G5���������"�!������5���������� �1������3����������������������=��������Q5��43����� ����������1��7�����
�3���7������L���� �III����!���������3�� �������������II�1��� � ���?������ �!��� �������� ��!��!����3��7������3��������
����������3����3� �������������� ������ ����� ��3�����1������������ ���������3������������������������������L���� �����3��7����5�
#������7��"��������/%�����
43��������������������������9���<�� ���!������! �����L�����73��3�7��* ������ !�������1�����
�����1����������������������� ��,����1�����!����� ����1�����5�"�!���������� ��� ������3���
� $&�=�������� � ���3�����@ �������������7 ����3������!����� ���I���������������������� ��� ������H���
�� �!����� �������� !������3��!3��3������ ������������������ ���* �����3����*�� 5�B3�����3� �������!� ����1���*��� ���������� �7��*��
�3������3 �������������(�����5����� ����3��3���������1������!���������������������!�3������������!�1� ����� ���3���
��� ��� ����� � ����������������� 5�#������7��"�������������
�3�����������*
G����.�3�!�
C�����.����
�����.�����
����.����3
D�����.�a���
E�������
D��������
C!�[3����
.���0�����
.��3�G���
����D3�
)����D��3�
�������D��I�3�
'�����E����3�
B� �����������E�����
+� !*��+���3�*�
+�**��'�3�����
-�3�'���
G!����'�� ��
)����'�!���
���-!���� ����
'!��4������
2��������4�� ���
+�!��I4���3�
4���4��
+�!����B ���
43���2������� �1��*�7 ������� �1���1���3�������� ��������������1!��� 5�43�������7����������!� ������������ ���3�����������
���!�������3��!3�!���3������!����������3� ��!1�������5�
ACKNOWLEDGEMENTS
WITH SUPPORT FROM
����������'�7����(�8"�(�8���"�����V�� �����1�!�5���
CONTRIBUTORS
EV CITY CASEBOOK // GLOSSARY OF TERMS PG_75
Application Programming Interface (API): �� ������
�������� ��������� �! ��������1�������!��������1��7����
���7������������ �������������� � ���5�B��3�������
��������������3���� ���'� �3���1����� �1�� 3���������� !��� ���
����������������������3���� ������������� 5
Battery Electric Vehicle (BEV): ���!��������������3�����
����������1���������������������7�����1�������� �������
�������I1����1�����5
DC Fast Charging: �� ��*��7�� �:J!��*��3��� �;�����3����
����� ������������������!�������������������������3����3����@ ��
1��������������(�������3���5
Electric Vehicle Supply Equipment (EVSE): "��J!������! ���
�����������������������������3������3������2-������!�� ��
�3����������� ������!���� ��?���� ������3����J!��������
�������7��3�������������7���������3����������3����3����5
Fuel Cell VEHICLE (FCV): ����3������3���!� ������!�������
�3�������� ��������������!������1�������������3���3������
�����������!���� !�3� �3����������������������������5
Hybrid Electric Vehicle (HEV): ����3������3�����1��� �
������������������������1! �����������9���<�����!� �����
� ����7��3����������������!� ���� � ��������3������
����������� �����!����������5
Level 1 Charging: 43���� ��1 ����3����������!����L���
� ������3�! �3������!���������������������������������� ���5�
�3����7��������������*��1��7����,I���3�!� ����I��*���7�� �
9*B<������*������5
Level 2 Charging: ������� ����������������������� �����
��1�����3���!����3�������������������������3�����1�������
���=IQ�3�!� 5�
Internal Combustion Engine (ICE):�������������73��3�
�3�����1! ����������J!����!������������!����3�3��������!���
������ !��5
Kilowatt: ��!���������7����J!����������������7�� ��������
H�!�� ����� ���������1�!���5&=�3�� ���7��5
Kilowatt Hour: ��!���������������?���� ��3����!������
���������� ������7��*�� ������������ �������������*B������
��3�!�5�43��!����� ����������! ���1��������������������� ��
�3��*��������������1�������3�����! ����� 5
Plug-in electric vehicle (PEV):��������������! �������� ���1��
�������3��! � �����3��1���1�����������7��������������
�����5
Plug-in Hybrid Electric Vehicle (PHEV): ��3�1�������������
��3�����7��3��3�3I����������3��1���1�������3��� ��
��1�������! ��������������� ��� ������������!� ���� �!���5��
43�������������1! �������������������� � � �������3�����
�3��1��������� ���� � ��1�*I!��73����3��1������� ���������5�
Powered Two-Wheelers (PTW): 47�I73��������3���� ��
!�3� � ������ �������������� ���3�������7�����1�����J!����
�!�����������������5
Transportation Mix: 43������� 3������������������ ����������
7��3�����!�1�����9�(��� ��� � 3���������� ������ ������
�������������3������<��73��3�� �1 �������3���������1�������
!��������3����������������������������������������3��5�
Vehicle Miles Traveled (VMT): 43���!�1���������� �
��������1��� !1 ��������3���� �����������������������5��
43�������� �������! �������� !���� �������3�����! ���
���� ����?�������� ����������!����5
GLOSSARY OF TERMS