Embed Size (px)
Citation preview

EV market trends and outlookShift Up a Gear
September 6, 2017
Colin McKerracher
Head of Advanced Transport
Bloomberg New Energy Finance
@colinmckerrache

1 September 06, 2017
Analysis to help you understand the future of energy and transport
Solar Wind Power and
Utilities
Electric
Vehicles
Energy Smart
Technologies
Gas Carbon
Markets &
Climate
Frontier
Power
Mobility and
Autonomous
Driving
Emerging
Technologies
Storage
Europe, Middle East
& AfricaAsia PacificAmericas

2 September 06, 2017
Source: Bloomberg New Energy Finance, Marklines, automakers, vehicle registration agencies Note: EV sales include BEV and PHEV sales. China data exclude low-speed
EV sales and commercial vehicles.
Global EV sales by region
36114
283
435
3066
96
182
209
283
5696
116
115
158
218
2729
32
23
21
46
122
206
288
448
695
1,018
2012 2013 2014 2015 2016 2017
Thousand units
China Europe US Japan Canada South Korea RoW
We expect passenger EV
sales to be just over 1m in
2017

3 September 06, 2017
Source: Bloomberg New Energy Finance, Marklines
Countries where EVs were above 1% of total passenger vehicle sales

4 September 06, 2017
Source: China Automotive Information Net, Bloomberg New Energy Finance
China’s vehicle sales according to the recent 2025 plan
19.3 22.0 23.4 24.3
27.5 28 28
0.5 2
7
19.3
22.023.5
24.6
28.030
35
2012 2013 2014 2015 2016 2020e 2025e
Internal Combustion Engine (ICE) New Energy Vehicle (NEV)
Millions ofvehicles sold

5 September 06, 2017
0
50
100
150
200
250
2012 2013 2014 2015 2016 2017 2018 2019 2020 2021
Number of models available
FCV
PHEV
BEV
Source: Bloomberg New Energy Finance
Electric vehicle model availability
Examples of automakers’ stated electrification targets
VW Group 2.5 million annual EV sales by 2025
Daimler 15%-25% of annual sales being EVs by 2025
Honda 15% of annual sales being BEVs by 2030

6 September 06, 2017
Source: Bloomberg New Energy Finance Note: This includes cells plus pack prices and is an average of BEV and PHEV prices. For years where there were two surveys, the
data in this chart is an average for the year.
1000
800
642599
540
350273
2010 2011 2012 2013 2014 2015 2016
-20% -20% -7% -10% -35% -22%
BNEF 2016 battery pack price survey results, 2010-2016($ per kWh)

7 September 06, 2017
Source: BNEF battery manufacturing database.
*Planned = announced or under construction
Global EV lithium-ion battery manufacturing capacity
The supply chain is maturing
2017 capacity:
90 GWh/year
2021 planned* capacity:
290 GWh/year

8 September 06, 2017
Source: Bloomberg New Energy Finance Note: The numbers associated with NMC represent the ratio of Nickel:Manganese:Cobalt in each particular blend.
Metal content of lithium-ion batteries by cathode chemistry, % of total metal content by weight per kWh
11 116 7
12 11 11 11 11
89
14
3027
18 189
7330 36
4554 72
2
94
28 26 2617
8
60
33
LCO NCA LMO LFP NMC(111)
NMC(433)
NMC(532)
NMC(622)
NMC(811)
%Phosphorous
%Iron
%Manganese
%Aluminum
%Nickel
%Cobalt
%Lithium

9 September 06, 2017
Source: Bloomberg New Energy Finance. Note: ICE sales include traditional hybrids.
Annual global light duty vehicle sales
1%
3%
8%
24%
43%
54%
0
20
40
60
80
100
120
140
2015 2020 2025 2030 2035 2040
ICE sales,total
EV sales,total
EV % ofnew sales
million cars per year

10 September 06, 2017
EV forecasts then and now
Source: Bloomberg New Energy Finance, organization websites. Notes: IEA forecasts to 2030 and BP forecasts to 2035. OPEC has not yet published its 2017 Oil Outlook.
Only BNEF and OPEC provide annual data points for EV fleet size. Some data points for BP, ExxonMobil, OPEC and the IEA are estimated based on organization charts,
reports and data. BNEF, BP and OPEC forecasts include just BEVs and PHEVs. ExxonMobil and IEA forecasts include BEVs, PHEVs and fuel cell vehicles. For more on the
changes between BNEF’s 2016 and 2017 long-term EV forecasts, see our July 6, 2017 Research Note “Global EV Sales Outlook to 2040” (web | terminal).
EV fleet size, 2020-40
-
100
200
300
400
500
600
2020 25 30 35 40
Million EVs
BNEF – 2016
BNEF – 2017
BP – 2016
BP – 2017
Exxon – 2016
Exxon – 2017
OPEC – 2015
OPEC – 2016
IEA – 2016
IEA – 2017

11 September 06, 2017
Source: Bloomberg New Energy Finance, Note: NMC chemistry modelled here is NMC (111); NMC battery pack cost is $223/kWh
Impact of raw material price fluctuations on NMC battery pack costs in %
12 September 06, 2017
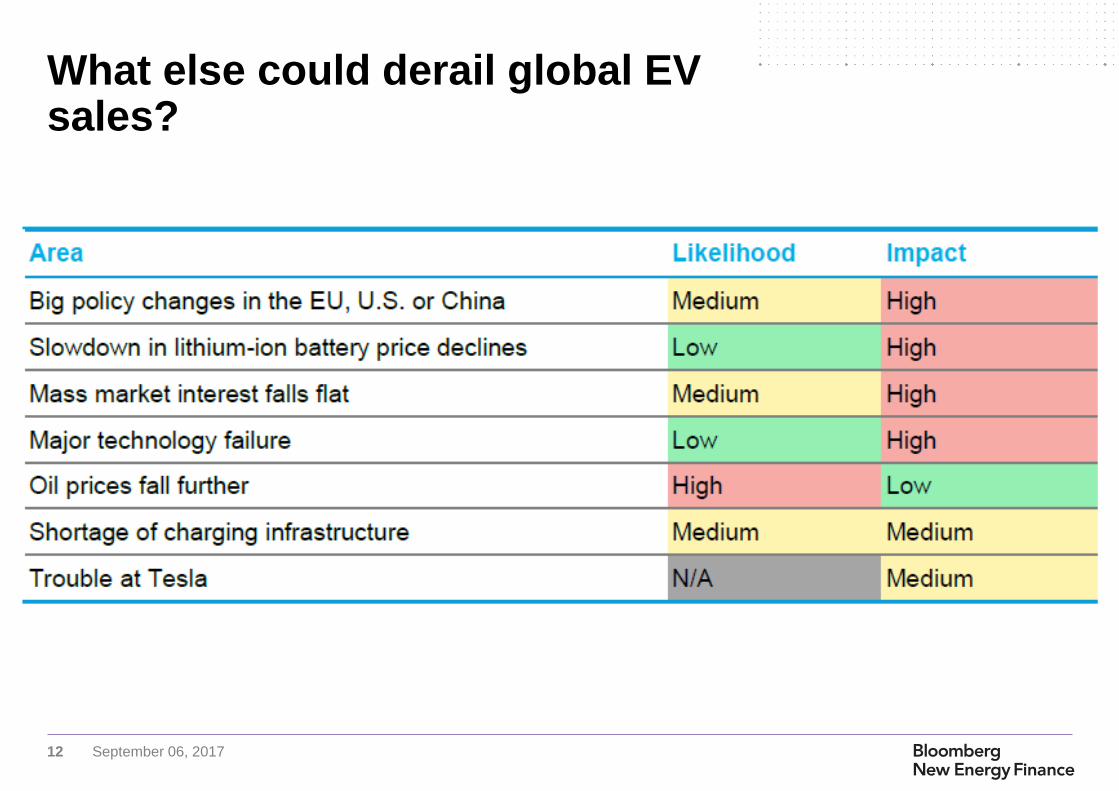
What else could derail global EV sales?

13 September 06, 2017
Thank you!
Colin McKerracher

14 September 06, 2017
This publication is the copyright of Bloomberg New Energy Finance. No portion of this document may be photocopied,
reproduced, scanned into an electronic system or transmitted, forwarded or distributed in any way without prior consent of
Bloomberg New Energy Finance.
The information contained in this publication is derived from carefully selected sources we believe are reasonable. We do not
guarantee its accuracy or completeness and nothing in this document shall be construed to be a representation of such a
guarantee. Any opinions expressed reflect the current judgment of the author of the relevant article or features, and does not
necessarily reflect the opinion of Bloomberg New Energy Finance, Bloomberg Finance L.P., Bloomberg L.P. or any of their
affiliates ("Bloomberg"). The opinions presented are subject to change without notice. Bloomberg accepts no responsibility
for any liability arising from use of this document or its contents. Nothing herein shall constitute or be construed as an
offering of financial instruments, or as investment advice or recommendations by Bloomberg of an investment strategy or
whether or not to "buy," "sell" or "hold" an investment.
Copyright and disclaimer